
China HPC TOP100 Analysis -...
44
Transcript of China HPC TOP100 Analysis -...

2010 China HPC TOP100
China Mainland HPC Trend
Analysis
Place photo here Nvidia GTC 2011, Taibei, 05/19/2011
张云泉(Yunquan Zhang)
中科院软件所并行软件与计算科学实验室
计算机科学国家重点实验室
合作者:孙家昶 袁国兴 张林波
2010中国HPC TOP100排行榜
中国大陆高性能计算机的发展趋势分析与展望
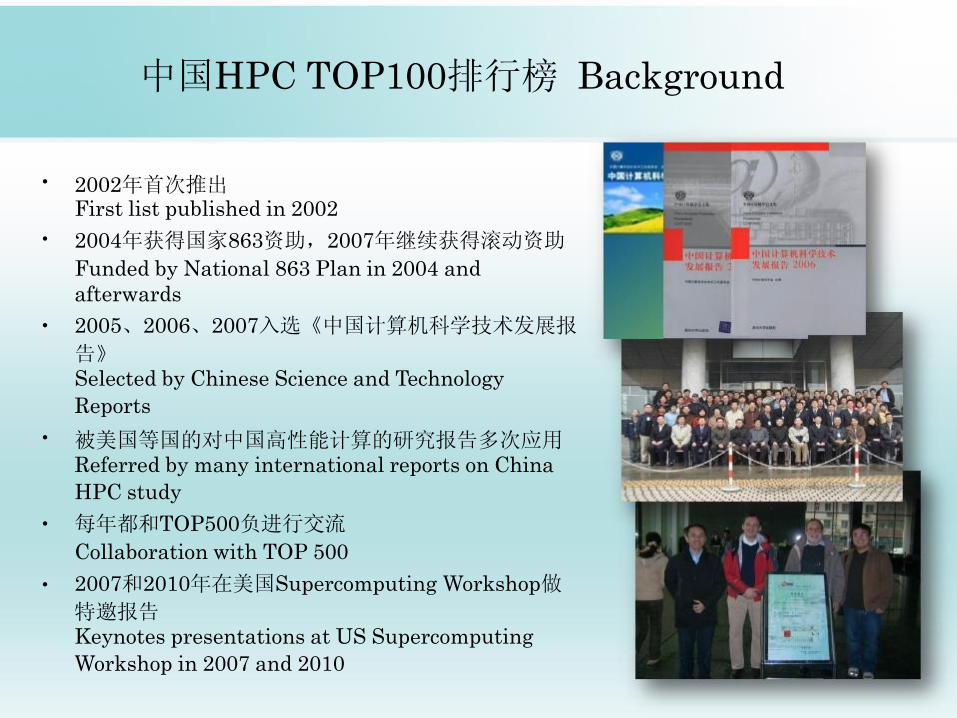
中国HPC TOP100排行榜 Background
• • • • • •
2002年首次推出 First list published in 2002
2004年获得国家863资助,2007年继续获得滚动资助
Funded by National 863 Plan in 2004 and
afterwards
2005、2006、2007入选《中国计算机科学技术发展报
告》 Selected by Chinese Science and Technology
Reports 被美国等国的对中国高性能计算的研究报告多次应用 Referred by many international reports on China
HPC study
每年都和TOP500负进行交流
Collaboration with TOP 500
2007和2010年在美国Supercomputing Workshop做
特邀报告 Keynotes presentations at US Supercomputing
Workshop in 2007 and 2010
2010年中国高性能计算机性能TOP100排行榜 2010 China HPC TOP100 Authors
张云泉 孙家昶 袁国兴 张林波
Yunquan Zhang, Jiachang Sun, Guoxin Yuan, Linbo Zhang
中国软件行业协会数学软件分会
The Specialty Association of Mathematical & Scientific Software (SAMSS)
国家863高性能计算机评测中心
Evaluation Center of High Performance Computer, National 863 Plan
中国计算机学会高性能计算专业委员会
China HPC Technical Committee
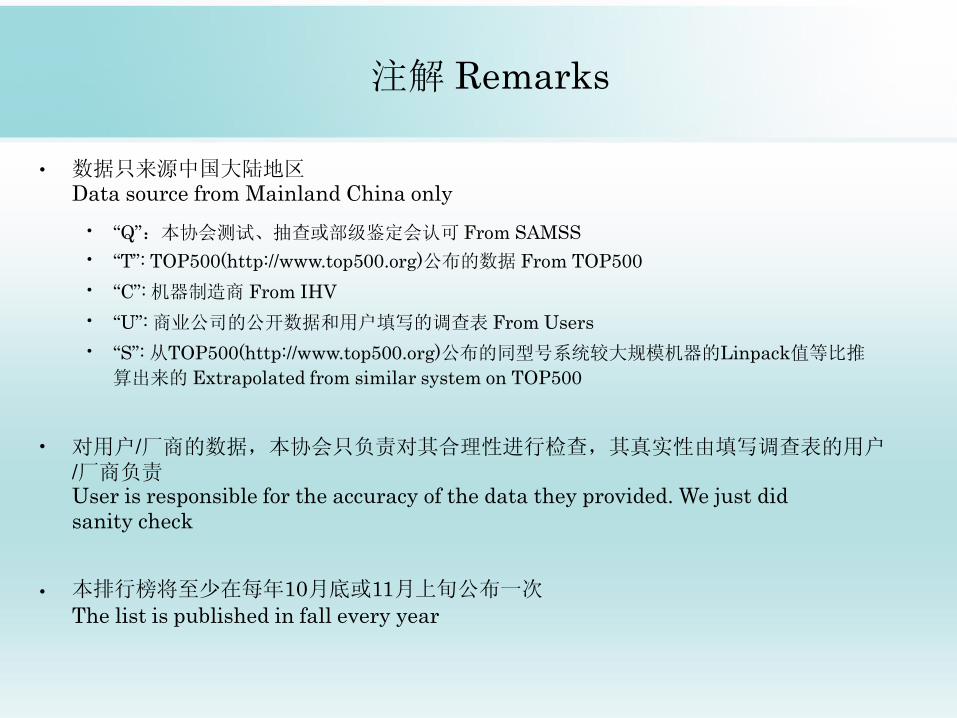
注解 Remarks
• 数据只来源中国大陆地区 Data source from Mainland China only
•
•
•
•
•
“Q”:本协会测试、抽查或部级鉴定会认可 From SAMSS
“T”: TOP500(http://www.top500.org)公布的数据 From TOP500
“C”: 机器制造商 From IHV
“U”: 商业公司的公开数据和用户填写的调查表 From Users
“S”: 从TOP500(http://www.top500.org)公布的同型号系统较大规模机器的Linpack值等比推
算出来的 Extrapolated from similar system on TOP500
• •
对用户/厂商的数据,本协会只负责对其合理性进行检查,其真实性由填写调查表的用户 /厂商负责 User is responsible for the accuracy of the data they provided. We just did
sanity check 本排行榜将至少在每年10月底或11月上旬公布一次
The list is published in fall every year
排 名
厂商 Manufa
cturer 型号Computer
安装地点Installation
Site
安装年份 Year
处理器核 Numof
Proc
Linpack
(Gflops)
Peak
(Gflops)
效率 Efficienc
y
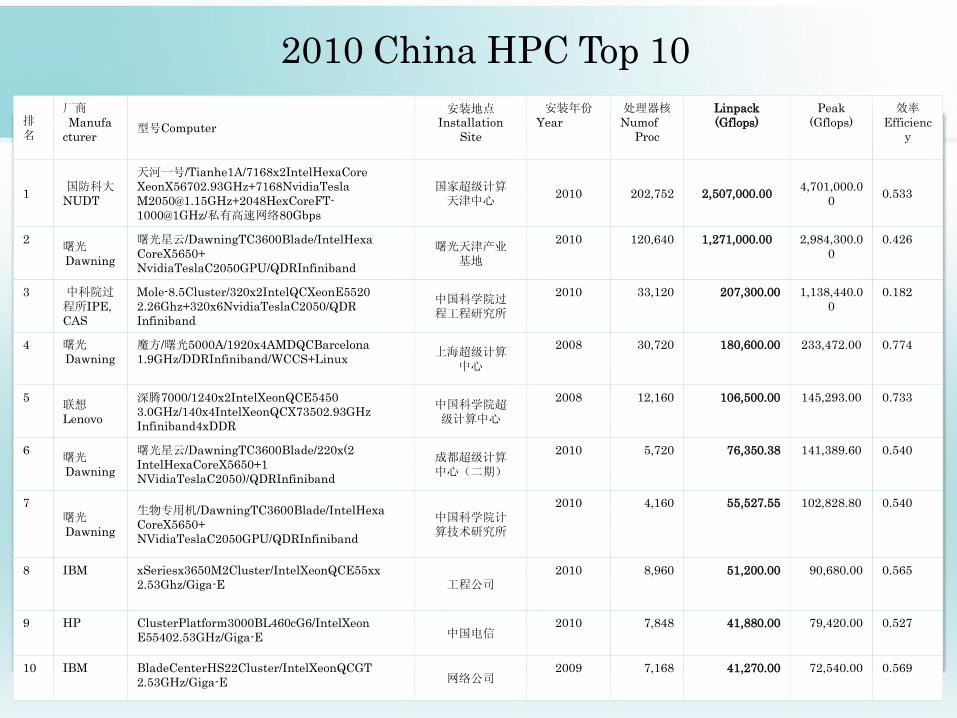
1 国防科大
NUDT
天河一号/Tianhe1A/7168x2IntelHexaCore
XeonX56702.93GHz+7168NvidiaTesla
[email protected]+2048HexCoreFT-
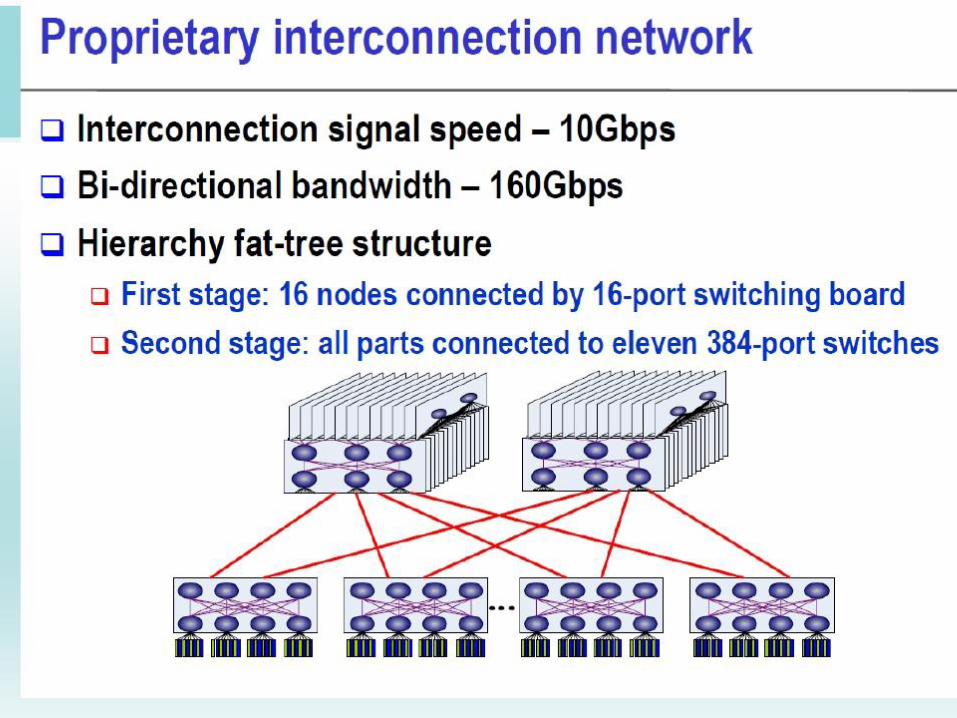
1000@1GHz/私有高速网络80Gbps
国家超级计算 天津中心
2010 202,752 2,507,000.00 4,701,000.0
0 0.533
2 曙光 Dawning
曙光星云/DawningTC3600Blade/IntelHexa
CoreX5650+
NvidiaTeslaC2050GPU/QDRInfiniband
曙光天津产业 基地
2010 120,640 1,271,000.00 2,984,300.0
0
0.426
3 中科院过 程所IPE,
CAS
Mole-8.5Cluster/320x2IntelQCXeonE5520
2.26Ghz+320x6NvidiaTeslaC2050/QDR
Infiniband
中国科学院过 程工程研究所
2010 33,120 207,300.00 1,138,440.0
0
0.182
4 曙光 Dawning
魔方/曙光5000A/1920x4AMDQCBarcelona
1.9GHz/DDRInfiniband/WCCS+Linux 上海超级计算 中心
2008 30,720 180,600.00 233,472.00 0.774
5 联想 Lenovo
深腾7000/1240x2IntelXeonQCE5450
3.0GHz/140x4IntelXeonQCX73502.93GHz
Infiniband4xDDR
中国科学院超 级计算中心
2008 12,160 106,500.00 145,293.00 0.733
6 曙光 Dawning
曙光星云/DawningTC3600Blade/220x(2
IntelHexaCoreX5650+1
NVidiaTeslaC2050)/QDRInfiniband
成都超级计算 中心(二期)
2010 5,720 76,350.38 141,389.60 0.540
7
曙光 Dawning
生物专用机/DawningTC3600Blade/IntelHexa
CoreX5650+
NVidiaTeslaC2050GPU/QDRInfiniband
中国科学院计 算技术研究所
2010 4,160 55,527.55 102,828.80 0.540
8 IBM xSeriesx3650M2Cluster/IntelXeonQCE55xx
2.53Ghz/Giga-E 工程公司 2010 8,960 51,200.00 90,680.00 0.565
9 HP ClusterPlatform3000BL460cG6/IntelXeon
E55402.53GHz/Giga-E 中国电信 2010 7,848 41,880.00 79,420.00 0.527
10 IBM BladeCenterHS22Cluster/IntelXeonQCGT
2.53GHz/Giga-E 网络公司 2009 7,168 41,270.00 72,540.00 0.569
2010 China HPC Top 10
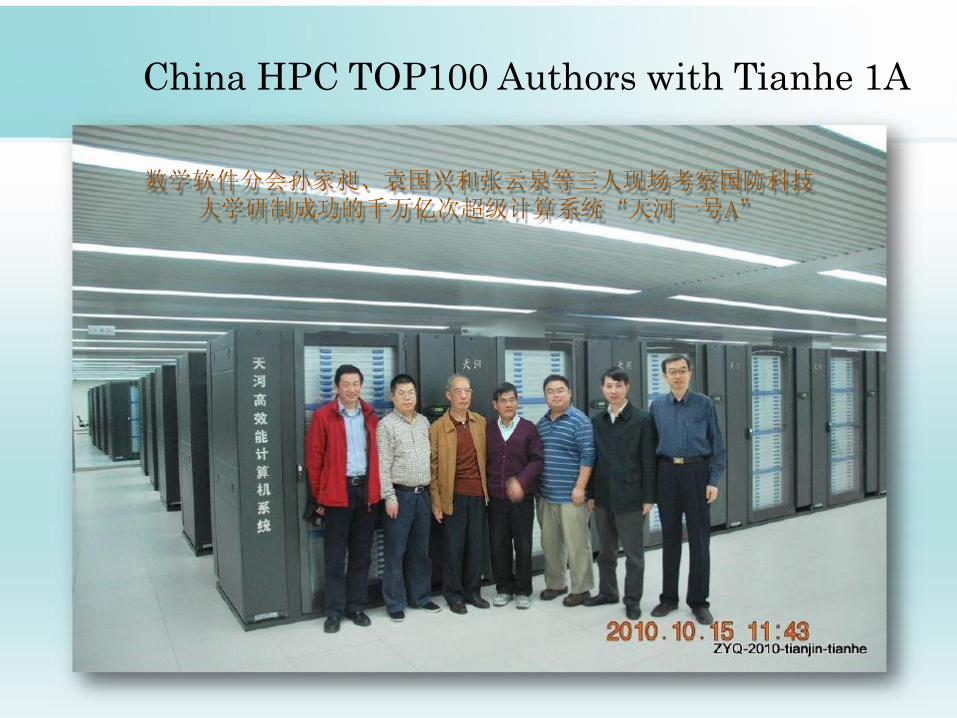
China HPC TOP100 Authors with Tianhe 1A
数学软件分会孙家昶、袁国兴和张云泉等三人现场考察国防科技 大学研制成功的千万亿次超级计算系统“天河一号A”
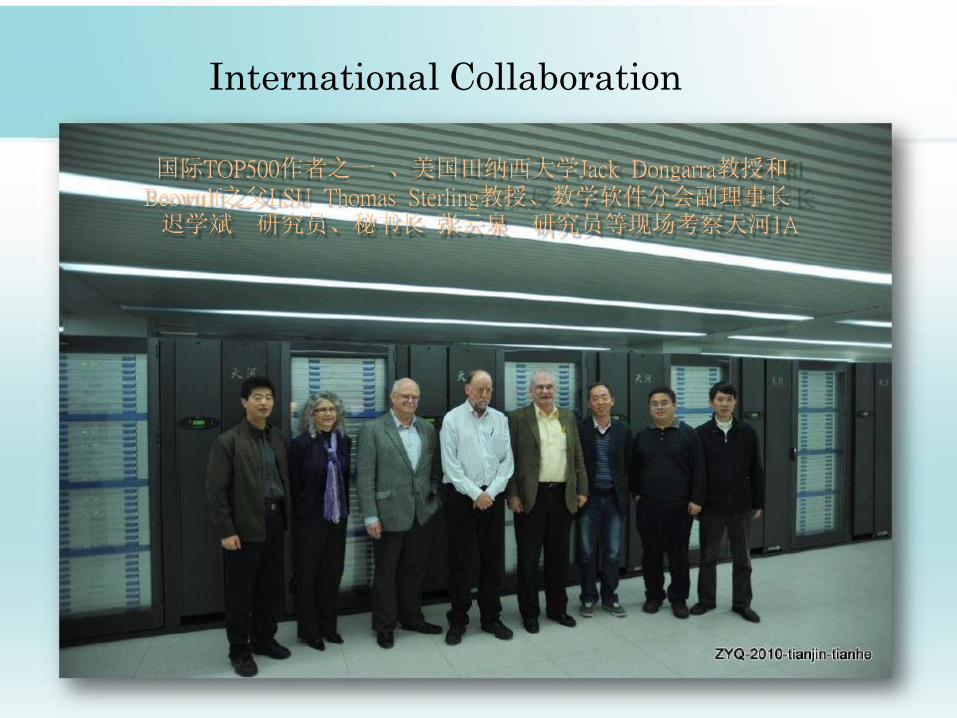
International Collaboration
国际TOP500作者之一 、美国田纳西大学Jack Dongarra教授和 Beowulf之父LSU Thomas Sterling教授、数学软件分会副理事长 迟学斌 研究员、秘书长 张云泉 研究员等现场考察天河1A
China HPC TOP100 Performance
Analysis性能分析
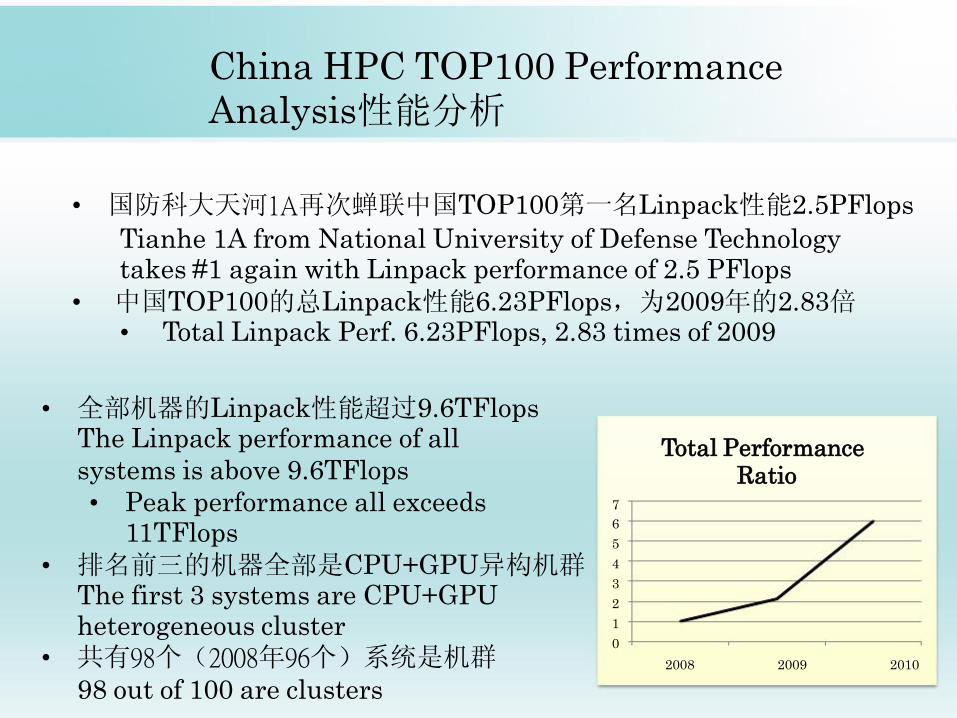
• 国防科大天河1A再次蝉联中国TOP100第一名Linpack性能2.5PFlops
Tianhe 1A from National University of Defense Technology takes #1 again with Linpack performance of 2.5 PFlops
• 中国TOP100的总Linpack性能6.23PFlops,为2009年的2.83倍 • Total Linpack Perf. 6.23PFlops, 2.83 times of 2009
7
6
5
4
3
2
1
0
Total Performance Ratio 2008 2009 2010
• 全部机器的Linpack性能超过9.6TFlops The Linpack performance of all
systems is above 9.6TFlops
• Peak performance all exceeds 11TFlops
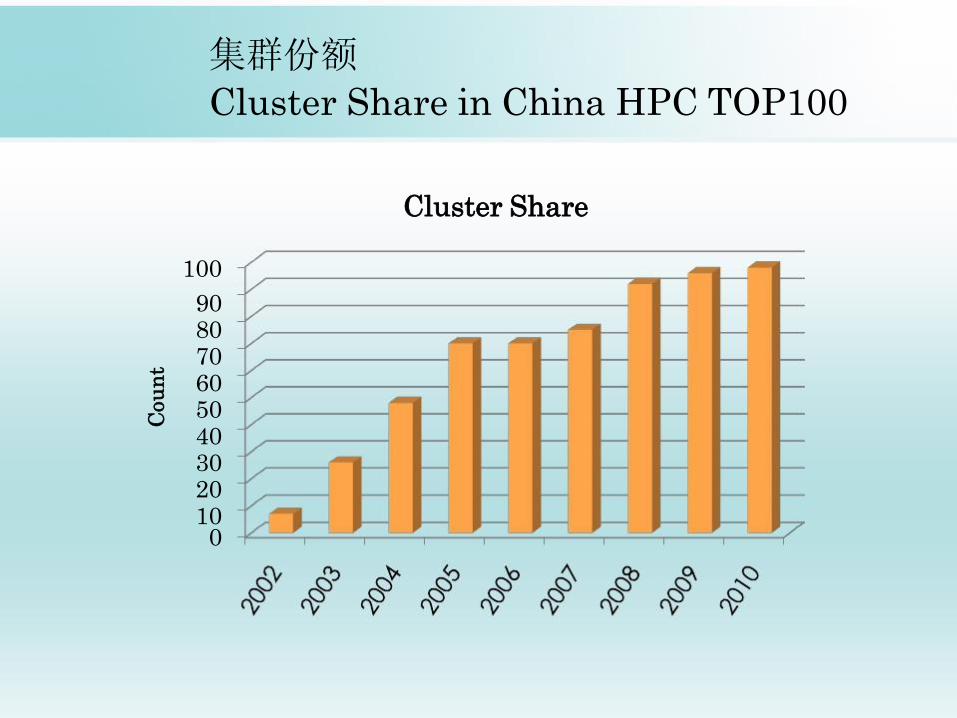
• 排名前三的机器全部是CPU+GPU异构机群 The first 3 systems are CPU+GPU heterogeneous cluster • 共有98个(2008年96个)系统是机群 98 out of 100 are clusters
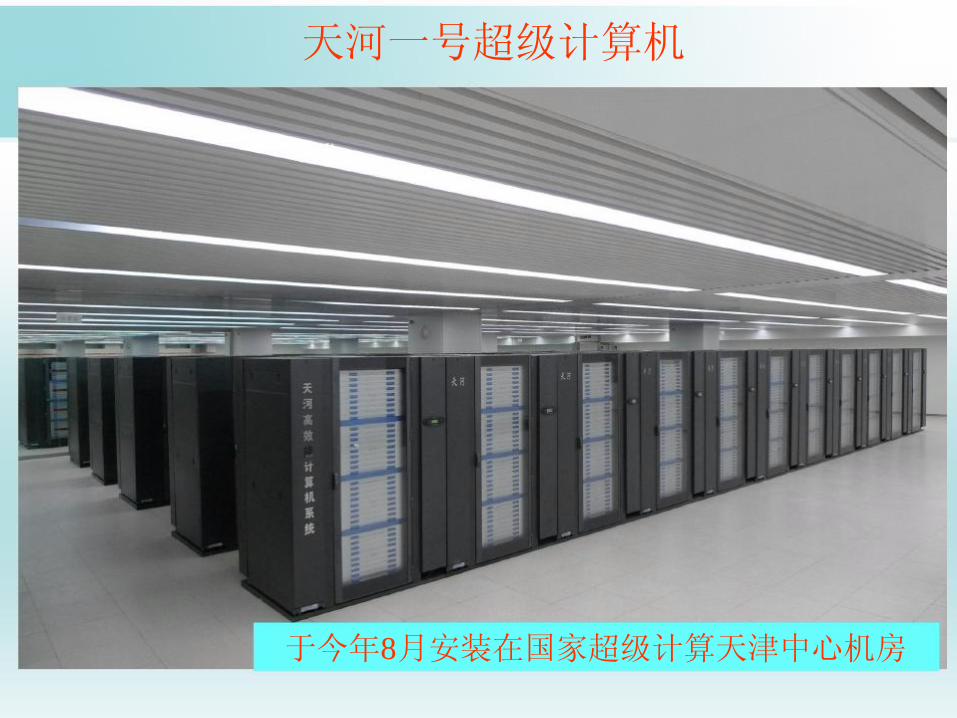
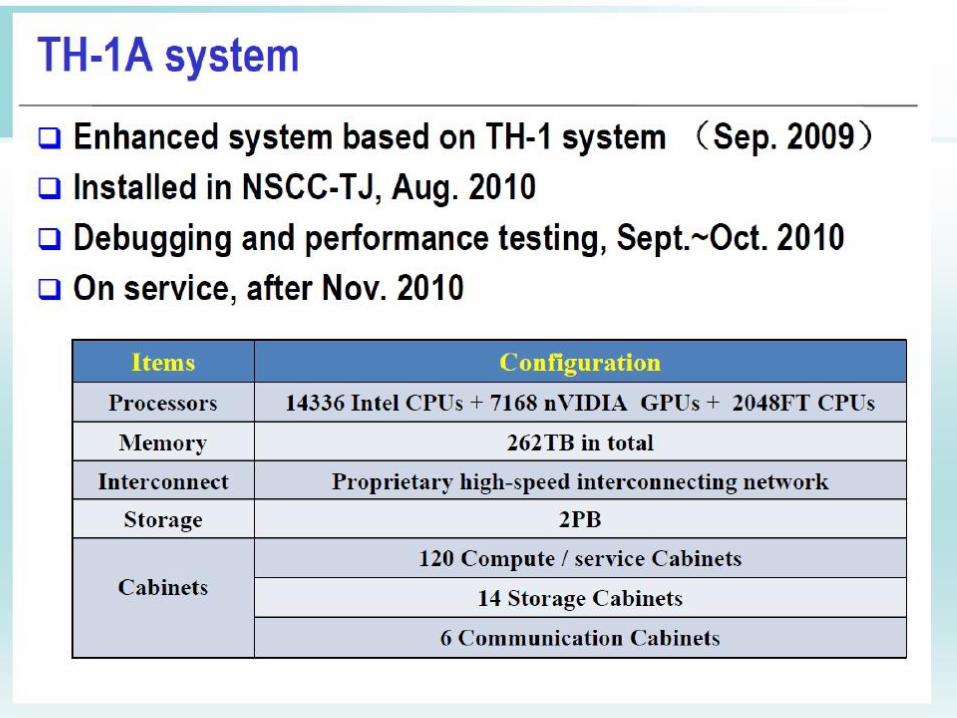
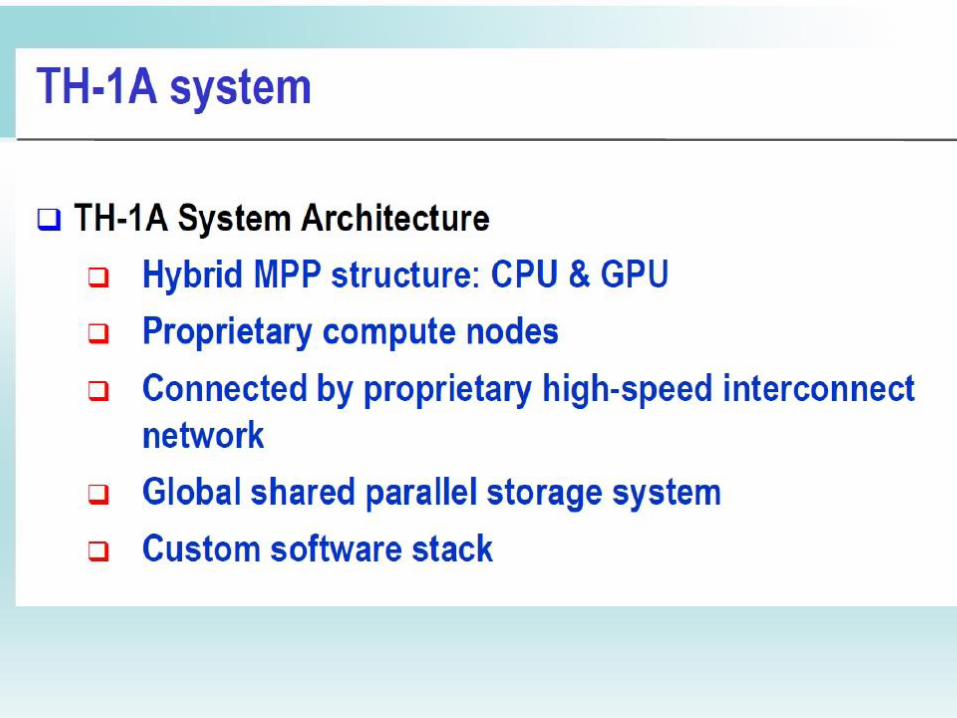
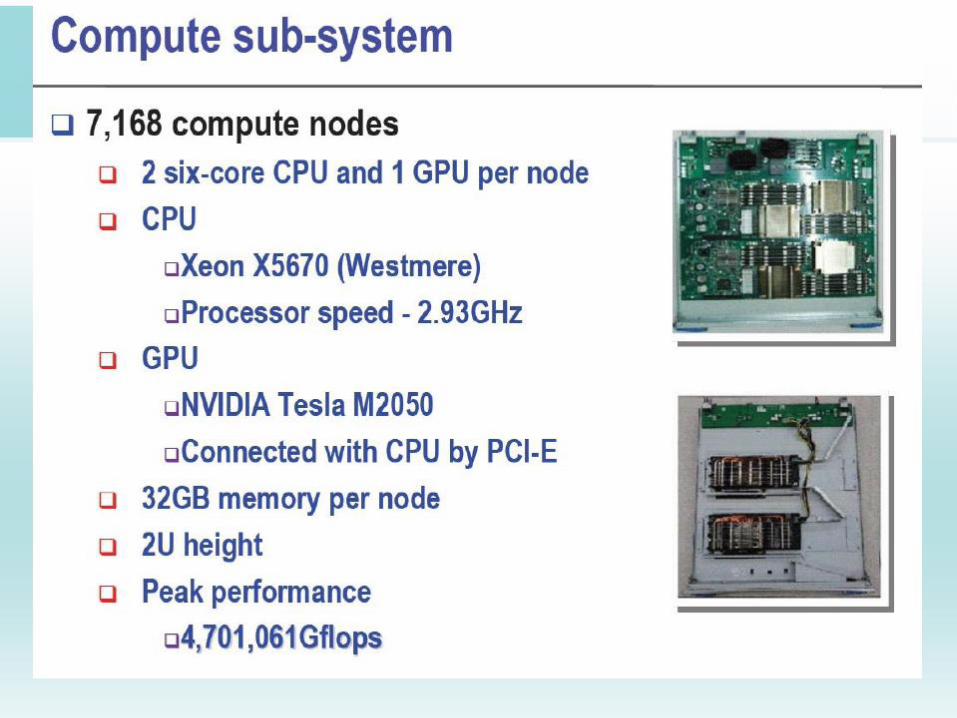
天河一号超级计算机
于今年8月安装在国家超级计算天津中心机房
12
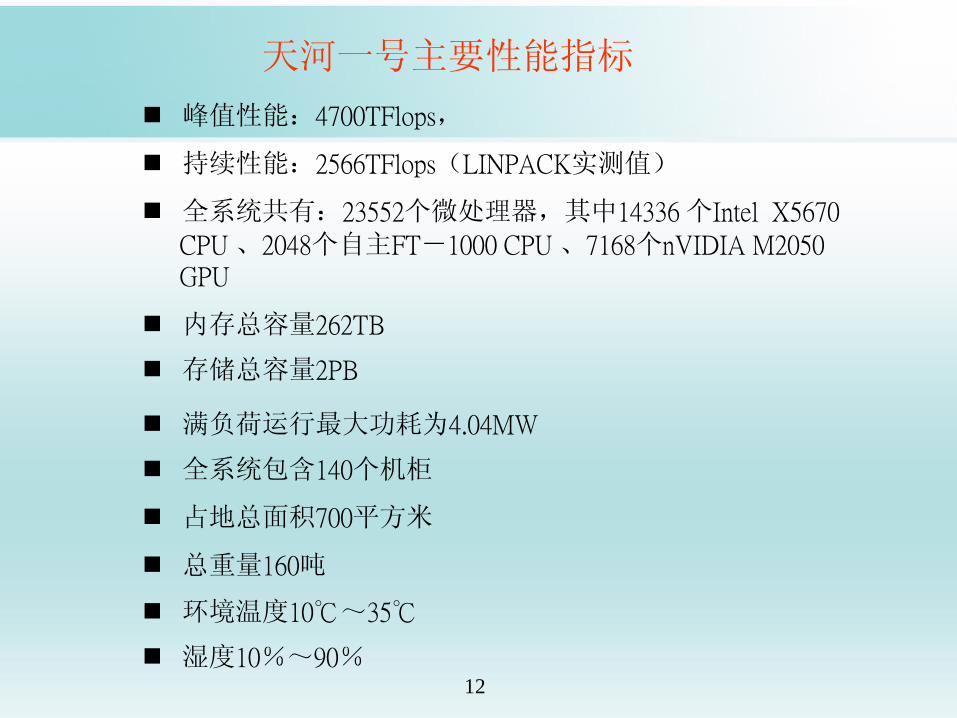
天河一号主要性能指标
峰值性能:4700TFlops,
持续性能:2566TFlops(LINPACK实测值)
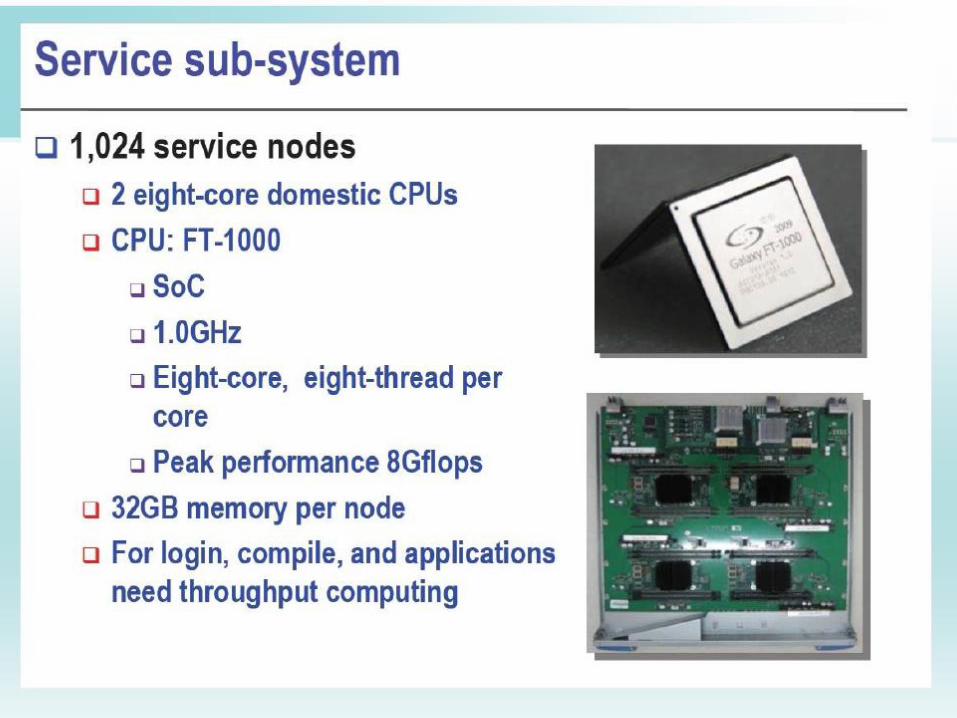
全系统共有:23552个微处理器,其中14336 个Intel X5670 CPU 、2048个自主FT-1000 CPU 、7168个nVIDIA M2050 GPU
内存总容量262TB 存储总容量2PB
满负荷运行最大功耗为4.04MW 全系统包含140个机柜 占地总面积700平方米 总重量160吨
环境温度10℃~35℃ 湿度10%~90%
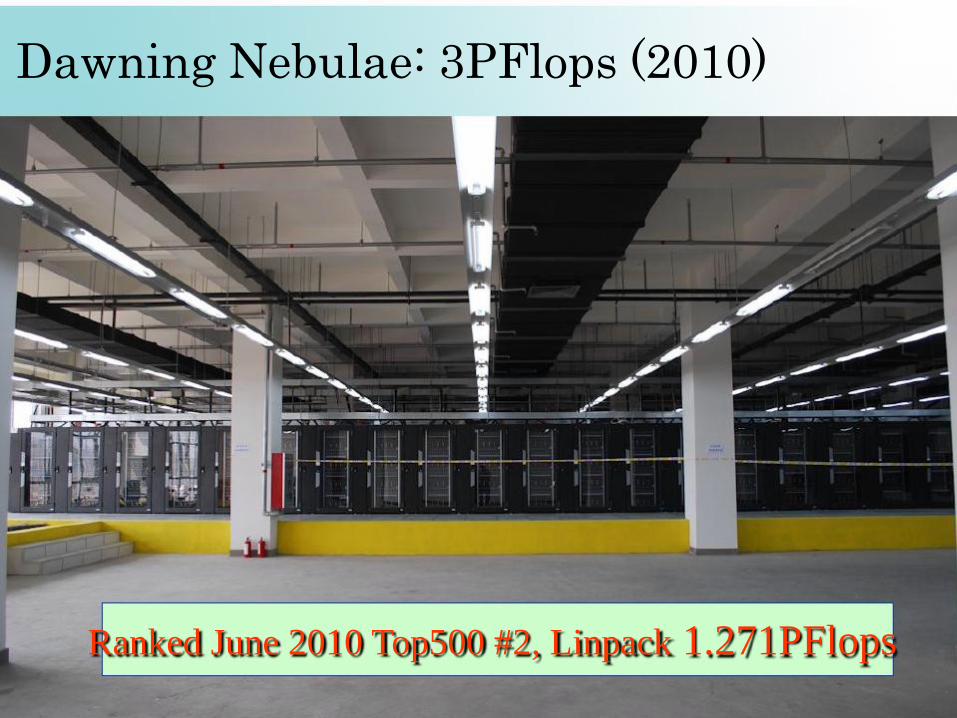
Dawning Nebulae: 3PFlops (2010)
Ranked June 2010 Top500 #2, Linpack 1.271PFlops
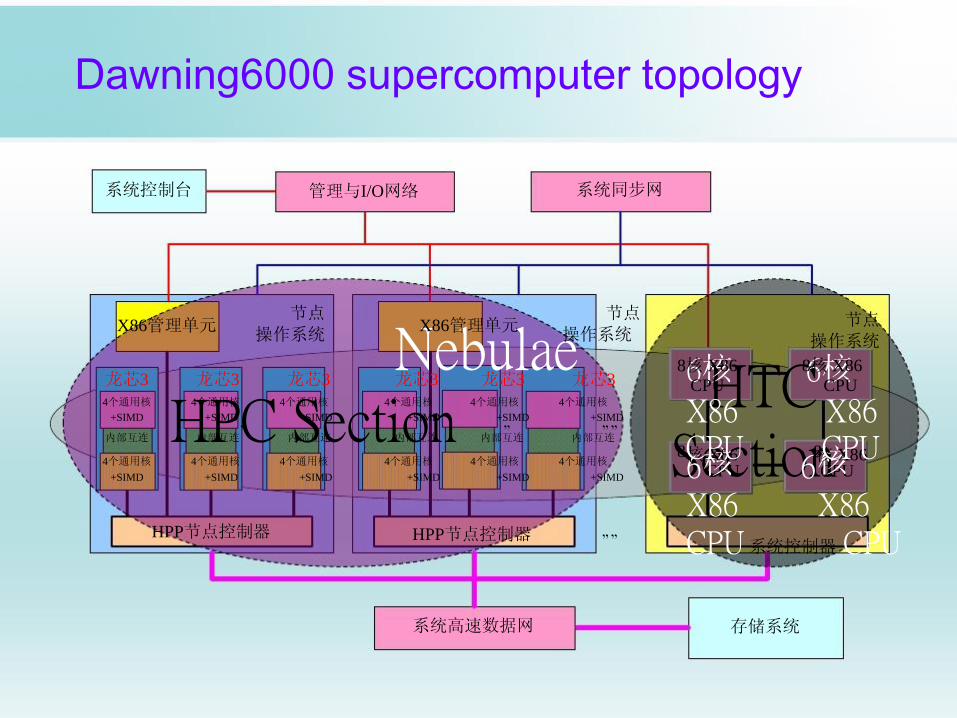
Nebulae HPC Section „ „ „„
HTC 6核 6核
Section 6 CPU 核 6 CPU 核
系统控制台
节点 节点 操作系统 操作系统
HPP节点控制器 HPP节点控制器 系统高速数据网
„„
系统同步网
X86管理单元 X86管理单元
龙芯3 龙芯3 龙芯3 龙芯3 龙芯3 龙芯3
4个通用核 4个通用核 4个通用核 4个通用核 4个通用核 4个通用核
+SIMD +SIMD +SIMD +SIMD +SIMD +SIMD
内部互连 内部互连 内部互连 内部互连 内部互连 内部互连
4个通用核 4个通用核 4个通用核 4个通用核 4个通用核 4个通用核
+SIMD +SIMD +SIMD +SIMD +SIMD +SIMD
核 X86 核 X86
管理与I/O网络
节点 操作系统
X86 X86 CPU 系统控制器 CPU 存储系统
8核 X86 8核 X86 CPU CPU
X86 X86 8CPU 8CPU
Dawning6000 supercomputer topology
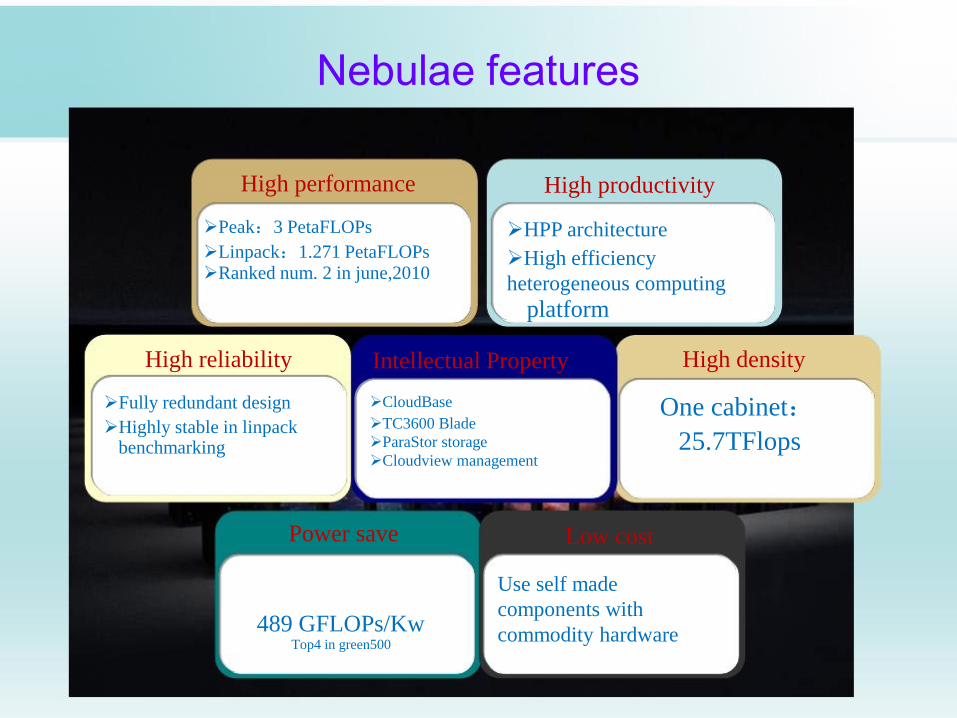
Nebulae features
High reliability Fully redundant design
Highly stable in linpack benchmarking
High performance Peak:3 PetaFLOPs
Linpack:1.271 PetaFLOPs Ranked num. 2 in june,2010
High density
One cabinet:
25.7TFlops
High productivity HPP architecture
High efficiency
heterogeneous computing
platform
Power save 489 GFLOPs/Kw Top4 in green500
Low cost Use self made
components with
commodity hardware
Intellectual Property CloudBase
TC3600 Blade
ParaStor storage
Cloudview management
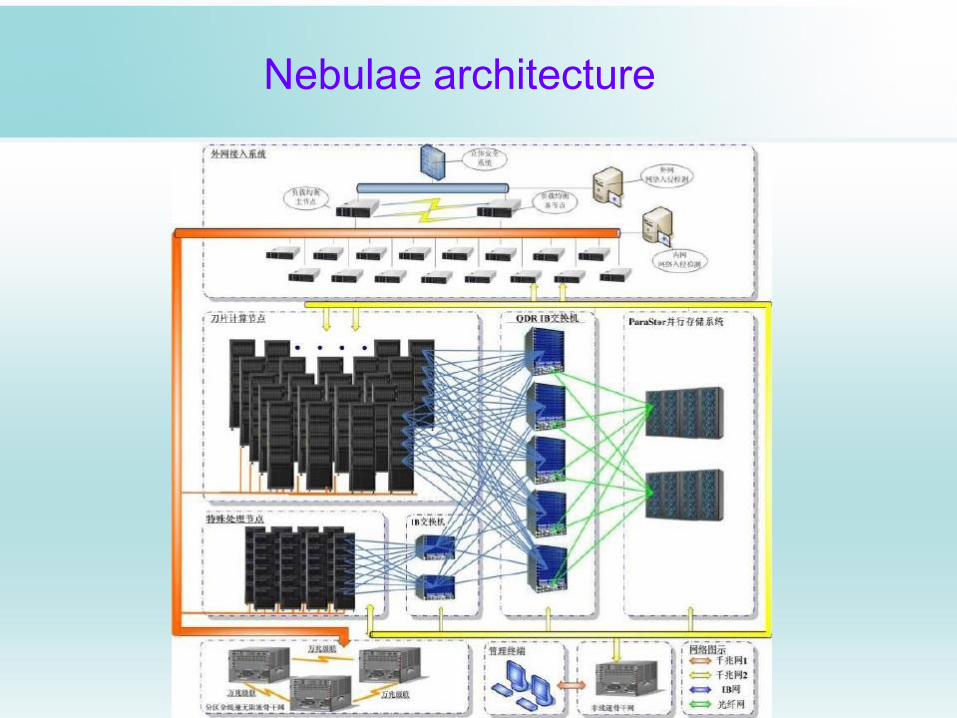
Nebulae architecture
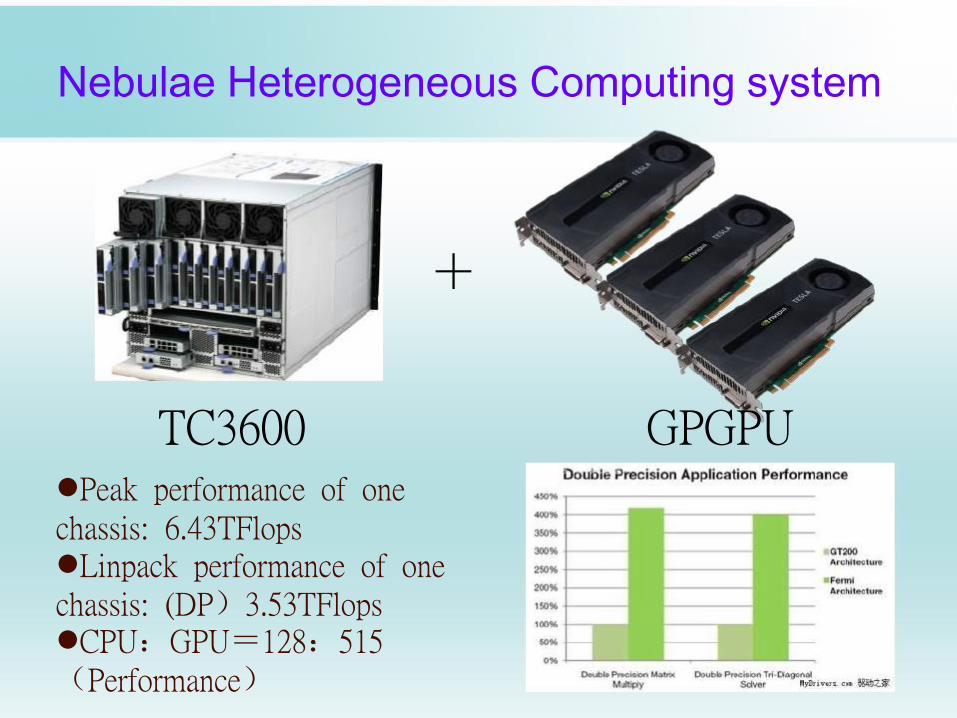
Nebulae Heterogeneous Computing system
+
GPGPU TC3600
Peak performance of one chassis: 6.43TFlops Linpack performance of one chassis: (DP)3.53TFlops CPU:GPU=128:515 (Performance)
Tylersburg 36D
GPU1
PEX8647 PEX8647
GPU2 GPU3 IB
Tylersburg 36D
PEX8647 PEX8647
GPU1
GPU2 GPU3
CPU0 CPU1
DDR3 Mem* 3
DDR3 Mem*3
DDR3 Mem*3
DDR3 Mem*3
DDR3 Mem*3
DDR3 Mem*3
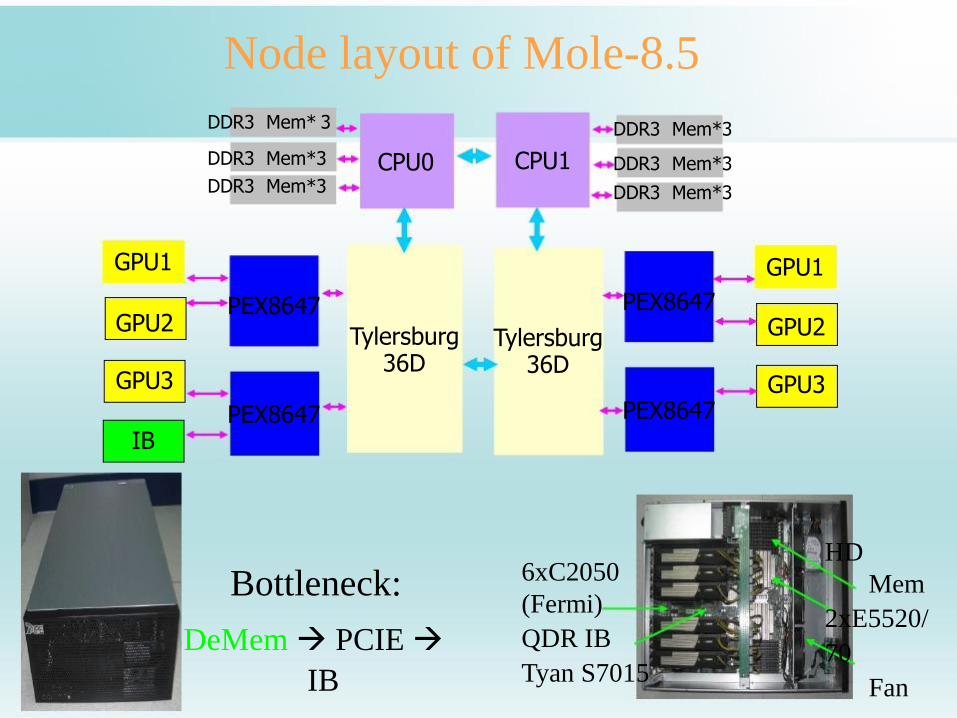
Node layout of Mole-8.5
Bottleneck:
DeMem PCIE
IB
6xC2050
(Fermi)
QDR IB
Tyan S7015
HD
Mem
2xE5520/
70
Fan
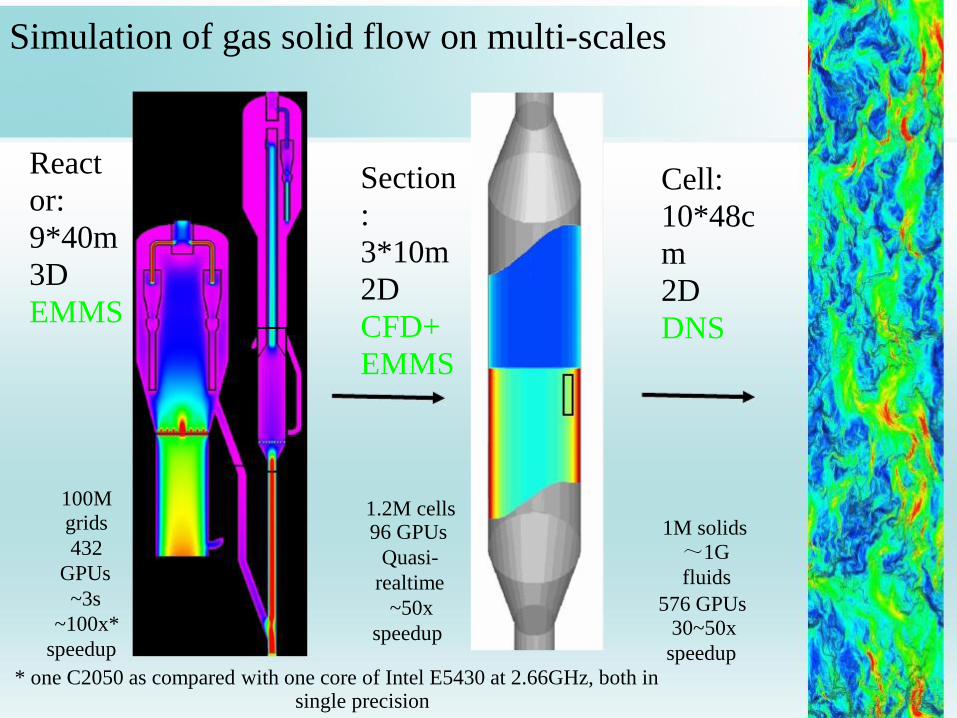
Section
:
3*10m
2D
CFD+
EMMS 1.2M cells 96 GPUs
Quasi-
realtime
~50x
speedup
React
or:
9*40m
3D
EMMS 100M
grids
432
GPUs
~3s
~100x*
speedup
Cell:
10*48c
m
2D
DNS 1M solids
~1G
fluids
576 GPUs 30~50x
speedup
* one C2050 as compared with one core of Intel E5430 at 2.66GHz, both in single precision
Simulation of gas solid flow on multi-scales
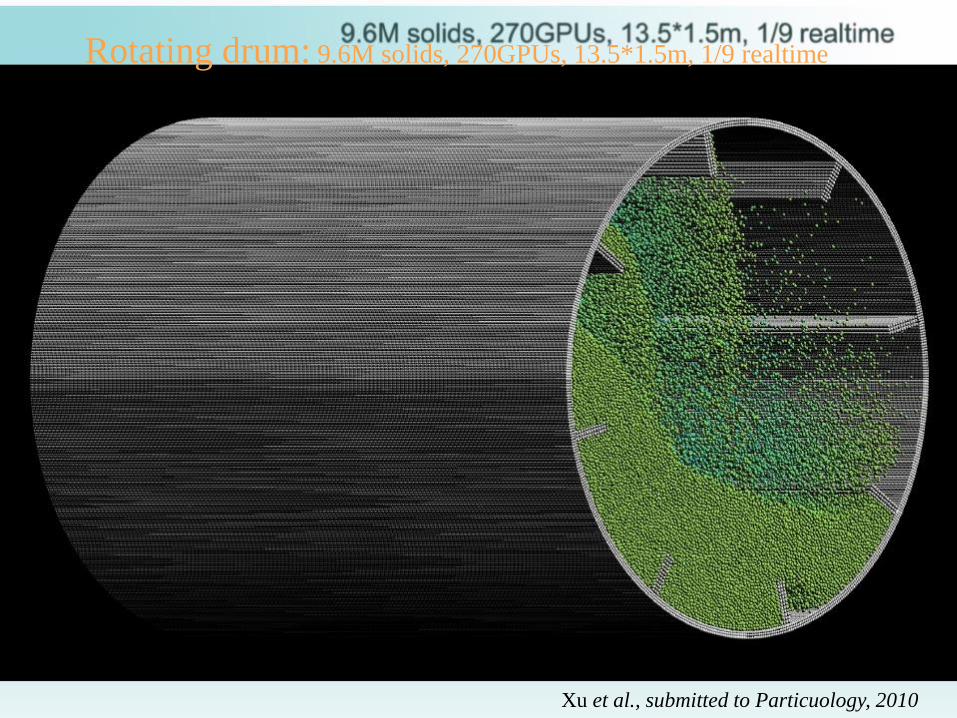
Rotating drum: 9.6M solids, 270GPUs, 13.5*1.5m, 1/9 realtime
Xu et al., submitted to Particuology, 2010
Cou
nt
集群份额
Cluster Share in China HPC TOP100
0
90 80 70 60 50 40 30 20 10
100
Cluster Share
厂商 Manufacturer
系统
Syste
ms
份额 Share
Rmax
[TF/s]
Rpeak
[TF/s]
平均效率 Efficiency
处理器核 Numof
Proc
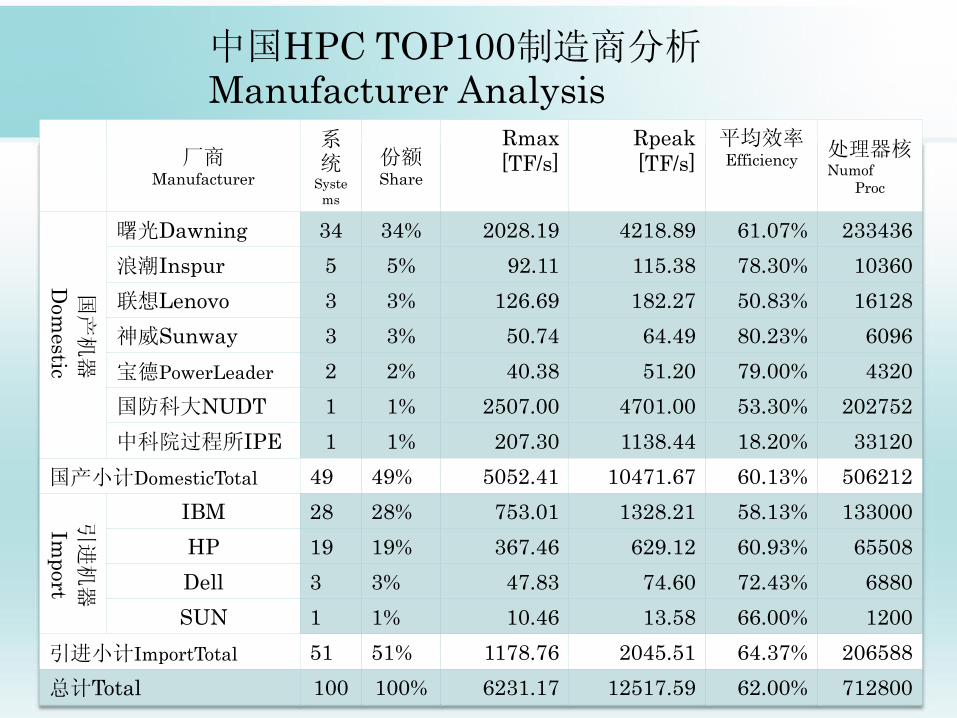
曙光Dawning 34 34% 2028.19 4218.89 61.07% 233436
浪潮Inspur 5 5% 92.11 115.38 78.30% 10360
联想Lenovo 3 3% 126.69 182.27 50.83% 16128
神威Sunway 3 3% 50.74 64.49 80.23% 6096
宝德PowerLeader 2 2% 40.38 51.20 79.00% 4320
国防科大NUDT 1 1% 2507.00 4701.00 53.30% 202752
中科院过程所IPE 1 1% 207.30 1138.44 18.20% 33120
国产小计DomesticTotal 49 49% 5052.41 10471.67 60.13% 506212
IBM 28 28% 753.01 1328.21 58.13% 133000
HP 19 19% 367.46 629.12 60.93% 65508
Dell 3 3% 47.83 74.60 72.43% 6880
SUN 1 1% 10.46 13.58 66.00% 1200
引进小计ImportTotal 51 51% 1178.76 2045.51 64.37% 206588
总计Total 100 100% 6231.17 12517.59 62.00% 712800
国产机器
Dom
estic
引进机器
Imp
ort
中国HPC TOP100制造商分析 Manufacturer Analysis
Dom
estic
Imp
ort
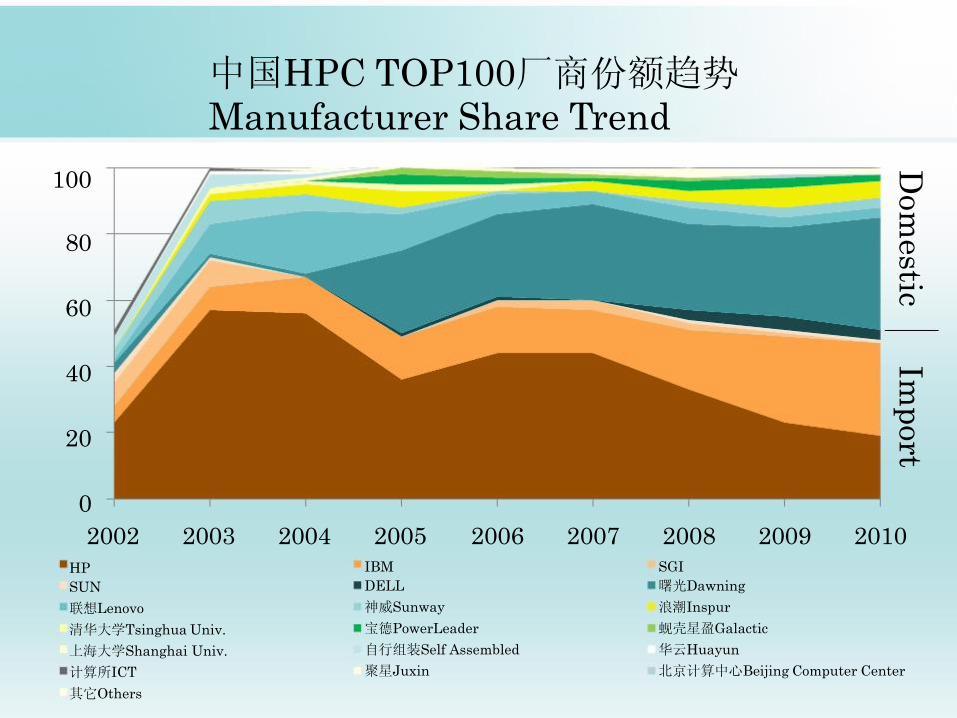
中国HPC TOP100厂商份额趋势 Manufacturer Share Trend 100
80
60
40
20
0
2002 2003 2004 2005 2006 2007 2008 2009 2010 IBM
DELL
神威Sunway
宝德PowerLeader
自行组装Self Assembled
聚星Juxin
SGI
曙光Dawning
浪潮Inspur
蚬壳星盈Galactic
华云Huayun
北京计算中心Beijing Computer Center
HP
SUN
联想Lenovo
清华大学Tsinghua Univ.
上海大学Shanghai Univ.
计算所ICT
其它Others
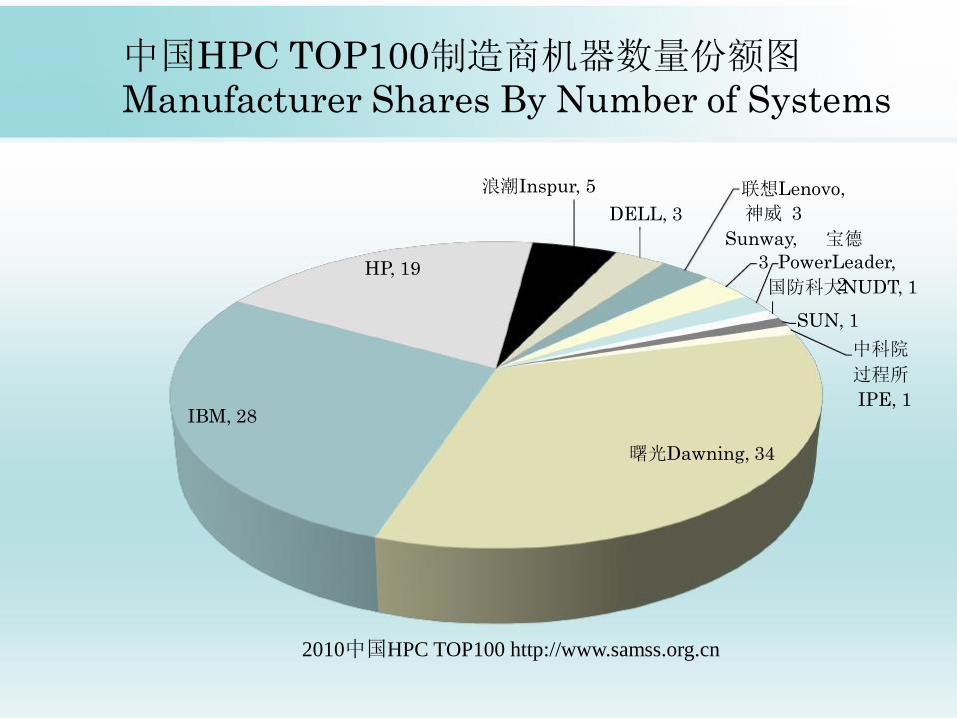
国防科大NUDT, 1
中国HPC TOP100制造商机器数量份额图 Manufacturer Shares By Number of Systems
IBM, 28
HP, 19
浪潮Inspur, 5
DELL, 3
联想Lenovo,
神威 3
Sunway, 宝德 3 PowerLeader,
2 SUN, 1
中科院
过程所
IPE, 1
曙光Dawning, 34 2010中国HPC TOP100 http://www.samss.org.cn
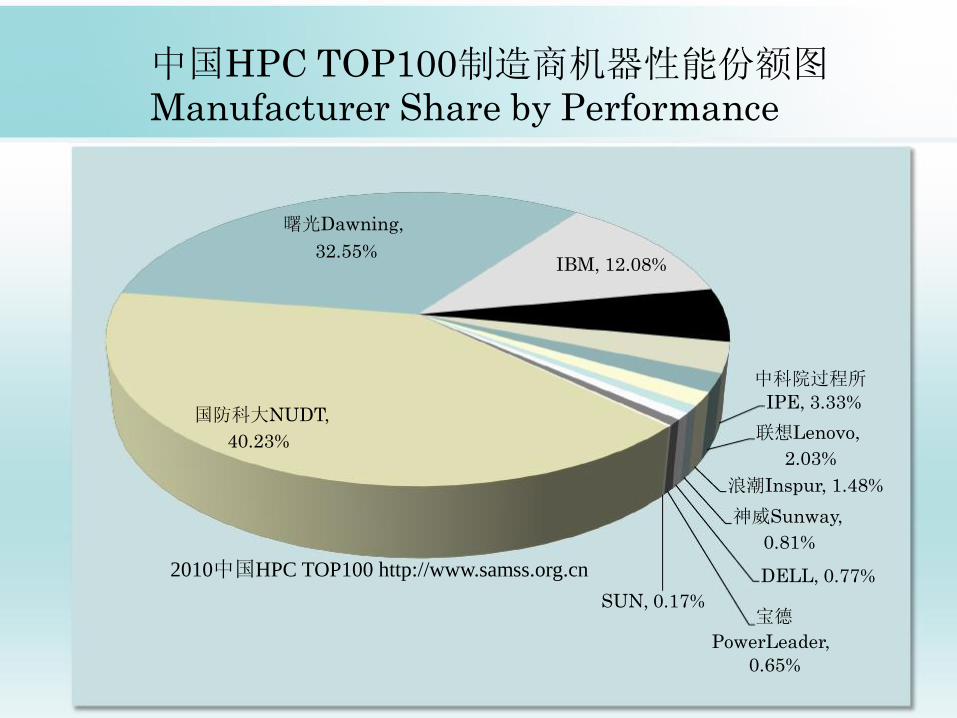
中国HPC TOP100制造商机器性能份额图 Manufacturer Share by Performance 曙光Dawning,
32.55% 国防科大NUDT,
40.23%
IBM, 12.08% HP, 5.90%
中科院过程所
IPE, 3.33%
联想Lenovo,
2.03%
浪潮Inspur, 1.48%
神威Sunway,
0.81%
DELL, 0.77% 宝德
PowerLeader,
0.65%
SUN, 0.17%
2010中国HPC TOP100 http://www.samss.org.cn
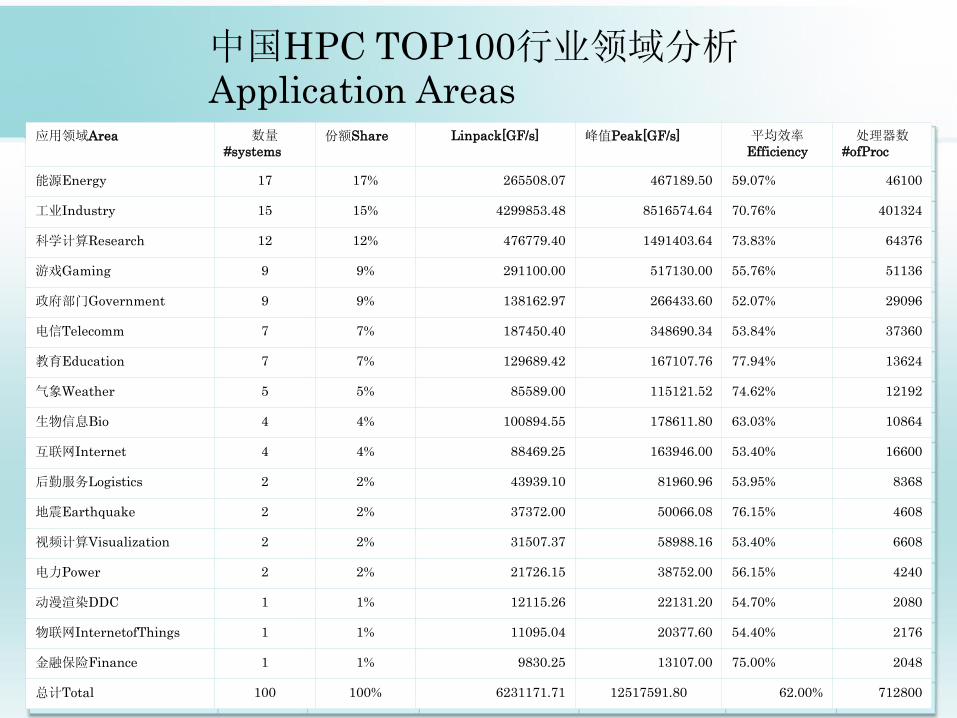
应用领域Area 数量 #systems
份额Share Linpack[GF/s] 峰值Peak[GF/s] 平均效率 Efficiency
处理器数 #ofProc
能源Energy 17 17% 265508.07 467189.50 59.07% 46100
工业Industry 15 15% 4299853.48 8516574.64 70.76% 401324
科学计算Research 12 12% 476779.40 1491403.64 73.83% 64376
游戏Gaming 9 9% 291100.00 517130.00 55.76% 51136
政府部门Government 9 9% 138162.97 266433.60 52.07% 29096
电信Telecomm 7 7% 187450.40 348690.34 53.84% 37360
教育Education 7 7% 129689.42 167107.76 77.94% 13624
气象Weather 5 5% 85589.00 115121.52 74.62% 12192
生物信息Bio 4 4% 100894.55 178611.80 63.03% 10864
互联网Internet 4 4% 88469.25 163946.00 53.40% 16600
后勤服务Logistics 2 2% 43939.10 81960.96 53.95% 8368
地震Earthquake 2 2% 37372.00 50066.08 76.15% 4608
视频计算Visualization 2 2% 31507.37 58988.16 53.40% 6608
电力Power 2 2% 21726.15 38752.00 56.15% 4240
动漫渲染DDC 1 1% 12115.26 22131.20 54.70% 2080
物联网InternetofThings 1 1% 11095.04 20377.60 54.40% 2176
金融保险Finance 1 1% 9830.25 13107.00 75.00% 2048
总计Total 100 100% 6231171.71 12517591.80 62.00% 712800
中国HPC TOP100行业领域分析 Application Areas
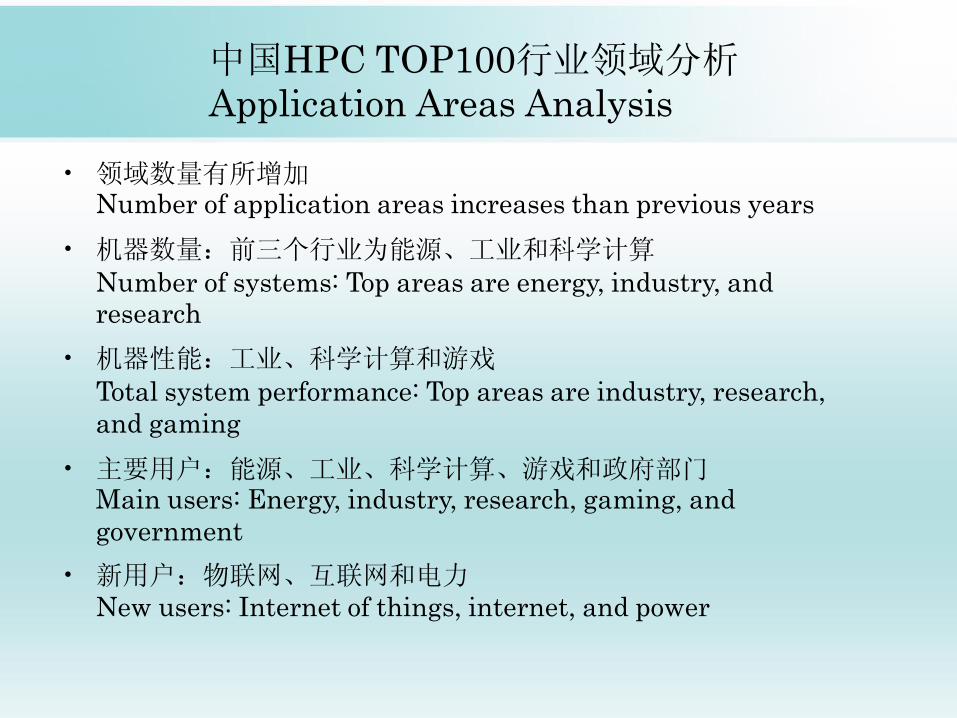
中国HPC TOP100行业领域分析 Application Areas Analysis
• 领域数量有所增加 Number of application areas increases than previous years
• 机器数量:前三个行业为能源、工业和科学计算 Number of systems: Top areas are energy, industry, and research
• 机器性能:工业、科学计算和游戏 Total system performance: Top areas are industry, research,
and gaming
• 主要用户:能源、工业、科学计算、游戏和政府部门 Main users: Energy, industry, research, gaming, and
government
• 新用户:物联网、互联网和电力 New users: Internet of things, internet, and power
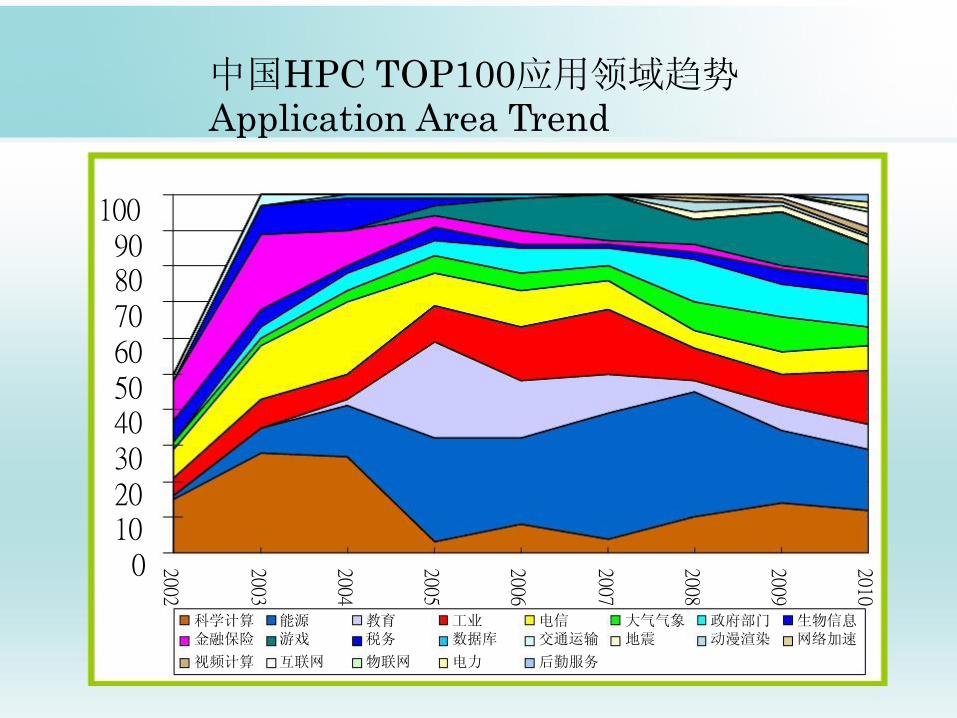
2002
2003
2004
2005
2006
2007
2008
2009
2010 中国HPC TOP100应用领域趋势 Application Area Trend 100 90 80 70 60 50 40 30 20 10 0
科学计算 金融保险
能源 游戏
教育 税务
工业 数据库
电信 交通运输
大气气象 地震
政府部门 动漫渲染
生物信息 网络加速
视频计算 互联网 物联网 电力 后勤服务
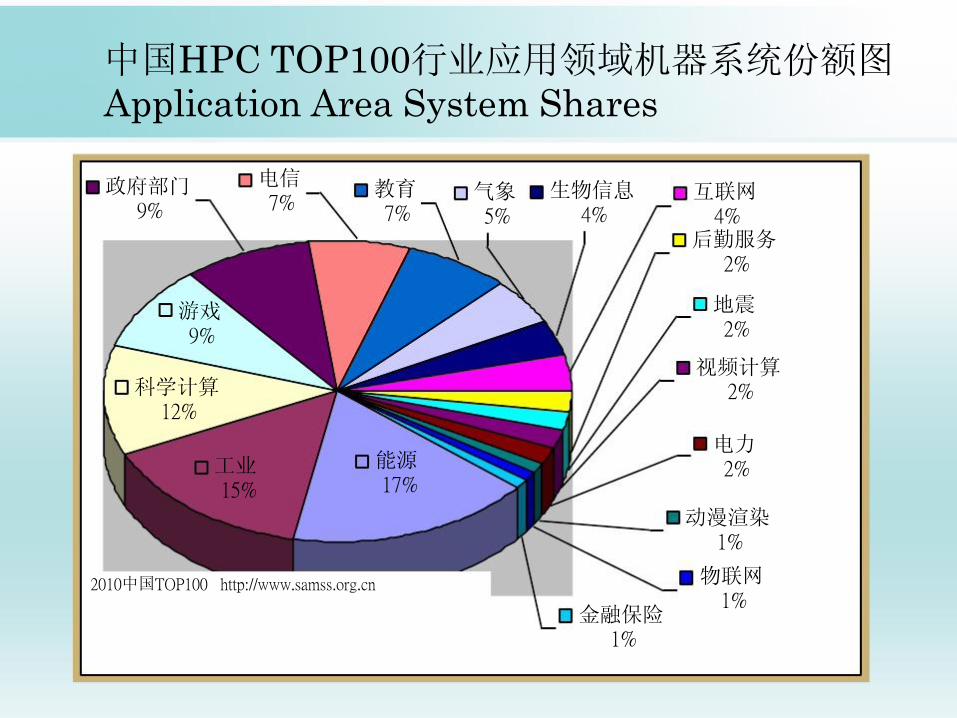
中国HPC TOP100行业应用领域机器系统份额图 Application Area System Shares
2010中国TOP100 http://www.samss.org.cn 物联网 1%
金融保险 1%
电力 2% 动漫渲染 1%
地震 2% 视频计算 2%
互联网 4% 后勤服务 2%
生物信息 4%
气象 5%
教育 7%
电信 7%
能源 17%
政府部门 9%
游戏 9% 科学计算 12%
工业 15%
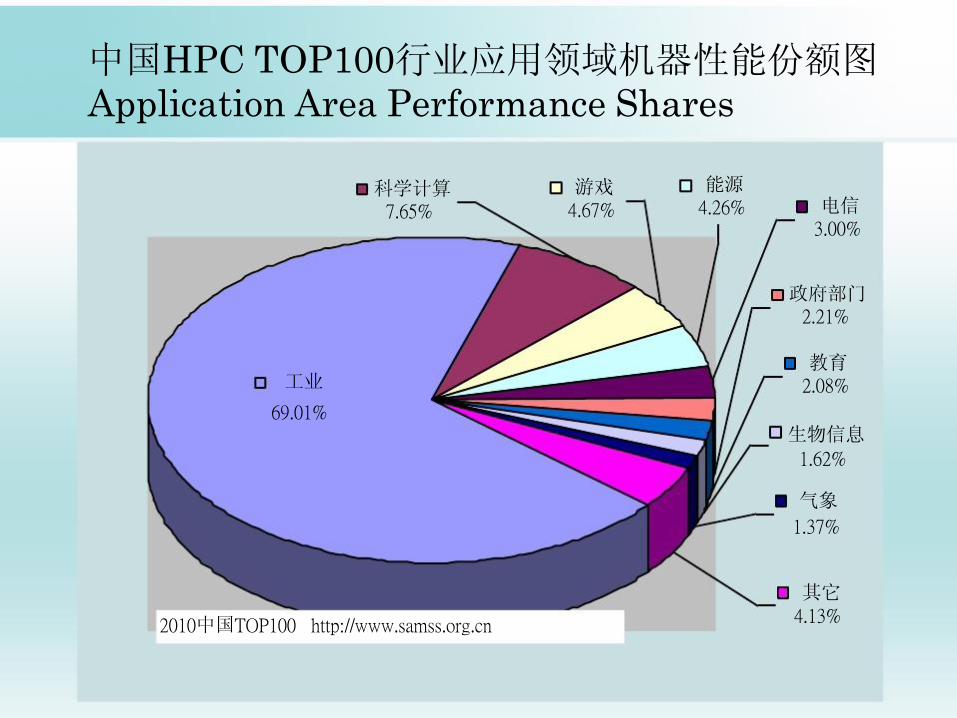
中国HPC TOP100行业应用领域机器性能份额图 Application Area Performance Shares
2010中国TOP100 http://www.samss.org.cn
科学计算 7.65%
4.13%
教育 2.08%
政府部门 2.21%
电信 3.00%
能源 4.26%
工业
69.01% 生物信息 1.62% 气象
1.37% 其它
游戏 4.67%
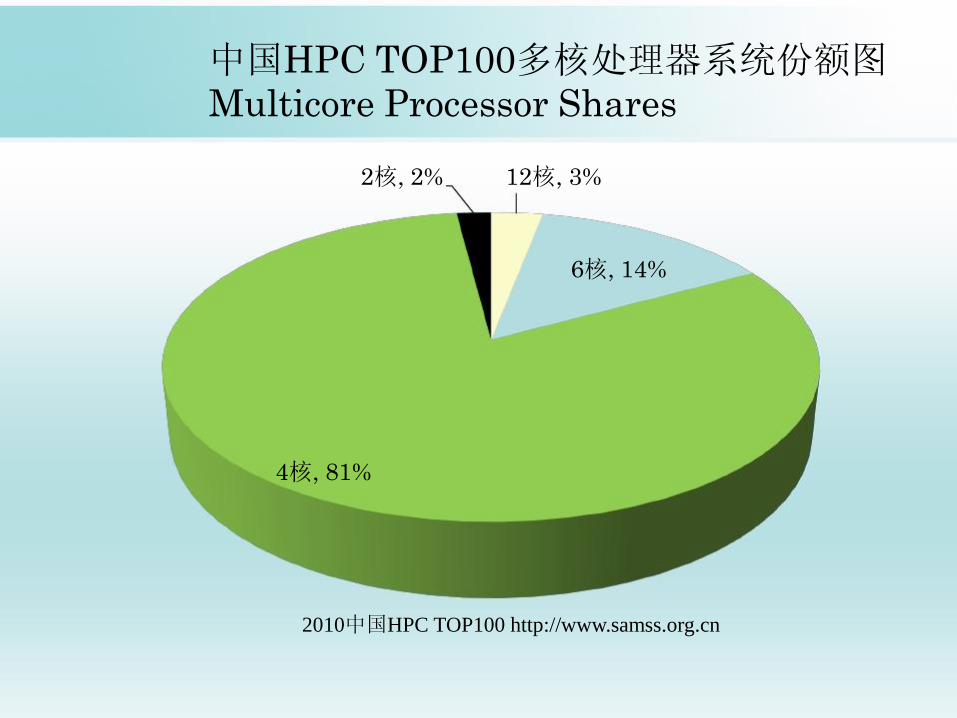
中国HPC TOP100多核处理器系统份额图 Multicore Processor Shares
12核, 3% 2核, 2%
6核, 14% 4核, 81% 2010中国HPC TOP100 http://www.samss.org.cn

中国HPC TOP100处理器制造商系统份额图 Processor Manufacturer Shares
Intel, 80%
AMD, 19%
IBM, 1%
2010中国HPC TOP100 http://www.samss.org.cn
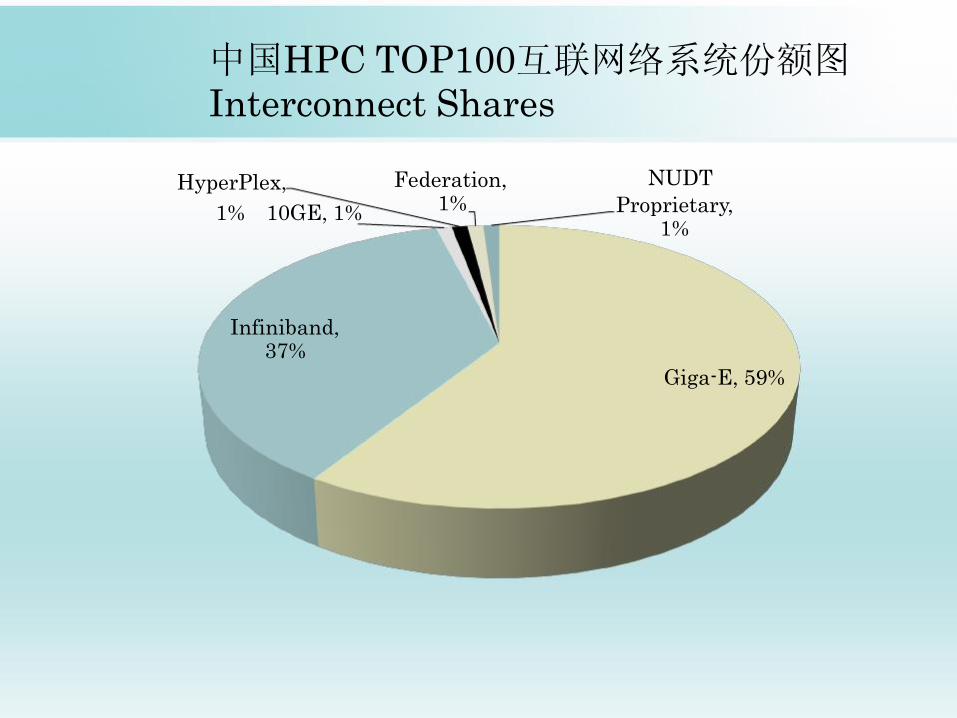
中国HPC TOP100互联网络系统份额图 Interconnect Shares
Infiniband, 37%
Giga-E, 59%
HyperPlex,
1% 10GE, 1%
Federation, 1%
NUDT
Proprietary, 1%
GF
lop
s
19
93
19
95
19
97
19
99
20
01
20
03
20
05
20
07
20
09
20
11
20
13
20
15
20
17
20
19
1E+10 1E+09 1E+08 1E+07
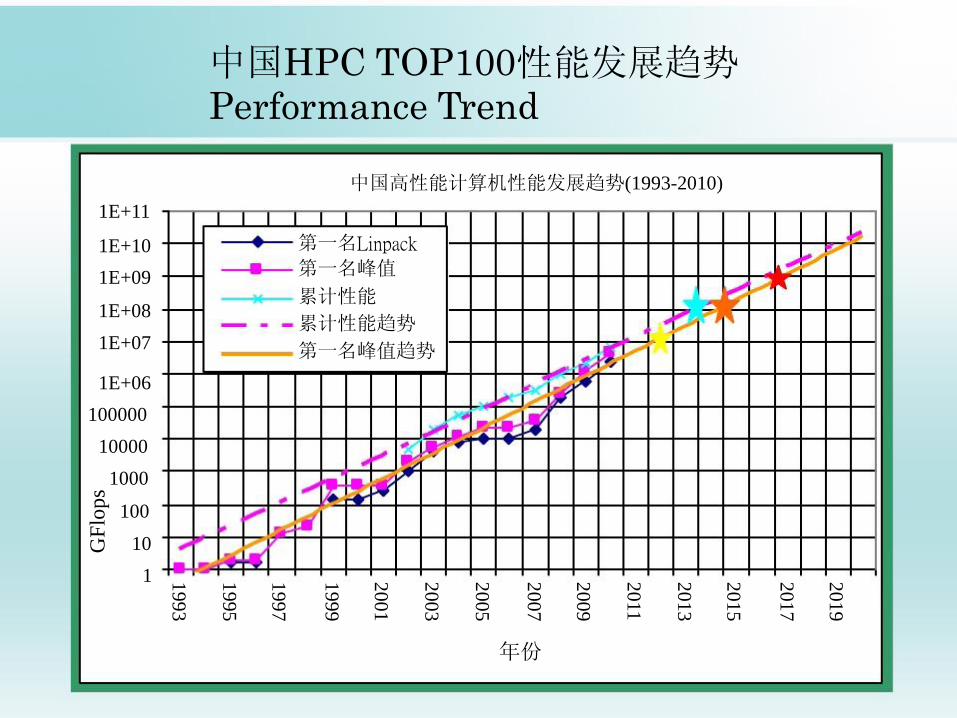
中国HPC TOP100性能发展趋势 Performance Trend 中国高性能计算机性能发展趋势(1993-2010)
1E+11
1E+06 100000 10000 1000 100 10 1 年份
第一名Linpack
第一名峰值
累计性能
累计性能趋势
第一名峰值趋势
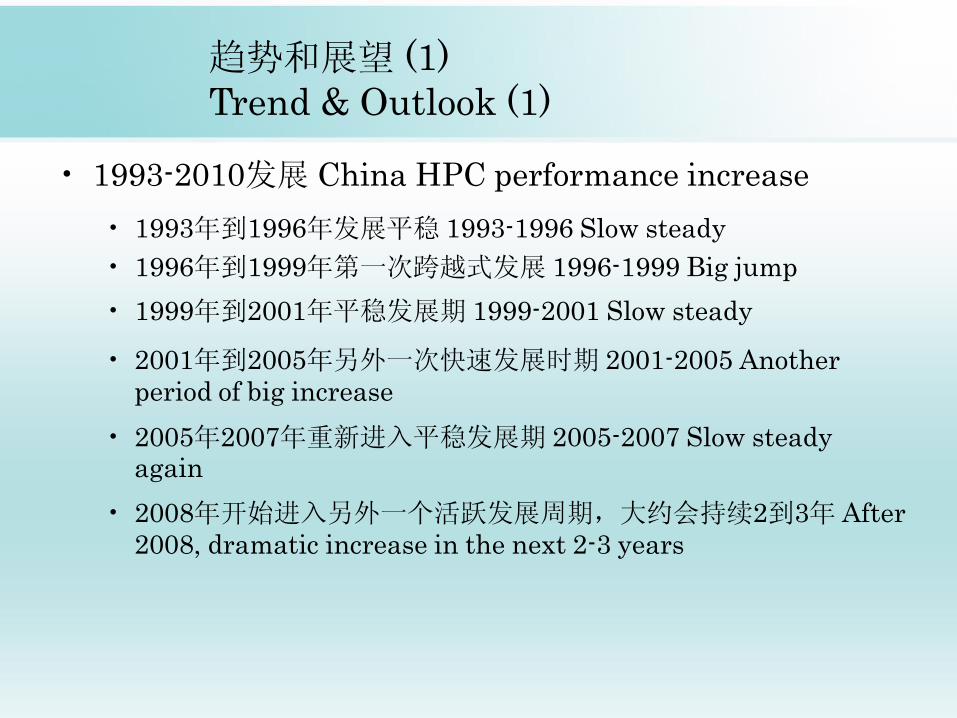
趋势和展望 (1)
Trend & Outlook (1)
• 1993-2010发展 China HPC performance increase
• 1993年到1996年发展平稳 1993-1996 Slow steady
• 1996年到1999年第一次跨越式发展 1996-1999 Big jump
• 1999年到2001年平稳发展期 1999-2001 Slow steady
• 2001年到2005年另外一次快速发展时期 2001-2005 Another
period of big increase
• 2005年2007年重新进入平稳发展期 2005-2007 Slow steady again
• 2008年开始进入另外一个活跃发展周期,大约会持续2到3年 After
2008, dramatic increase in the next 2-3 years
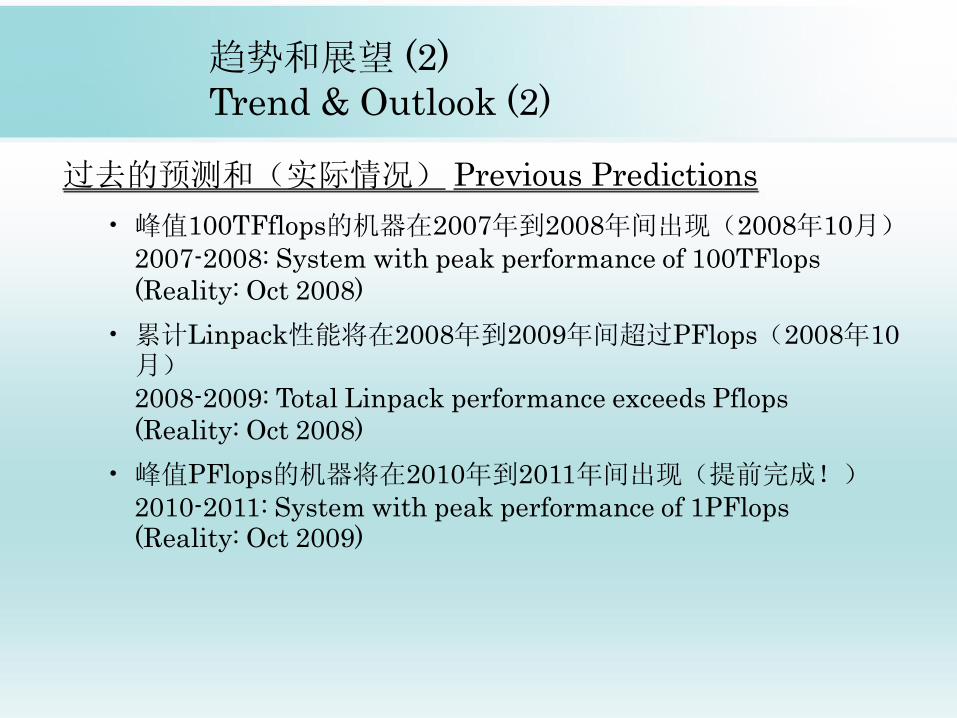
趋势和展望 (2)
Trend & Outlook (2)
过去的预测和(实际情况) Previous Predictions
• 峰值100TFflops的机器在2007年到2008年间出现(2008年10月) 2007-2008: System with peak performance of 100TFlops
(Reality: Oct 2008)
• 累计Linpack性能将在2008年到2009年间超过PFlops(2008年10 月) 2008-2009: Total Linpack performance exceeds Pflops
(Reality: Oct 2008)
• 峰值PFlops的机器将在2010年到2011年间出现(提前完成!) 2010-2011: System with peak performance of 1PFlops (Reality: Oct 2009)
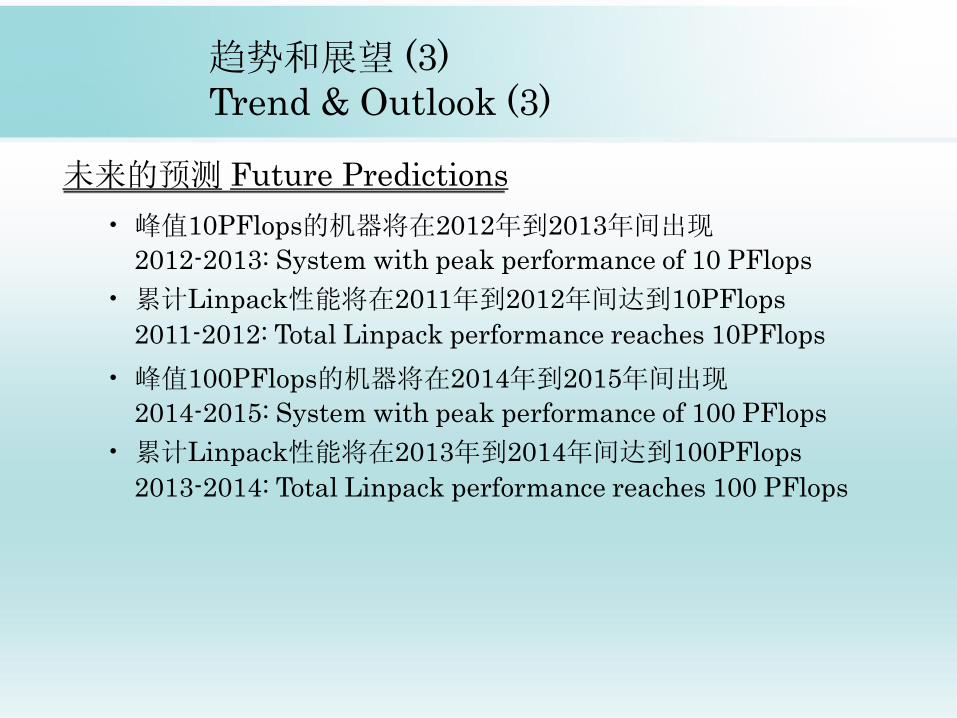
趋势和展望 (3)
Trend & Outlook (3)
未来的预测 Future Predictions
• 峰值10PFlops的机器将在2012年到2013年间出现
2012-2013: System with peak performance of 10 PFlops
• 累计Linpack性能将在2011年到2012年间达到10PFlops
2011-2012: Total Linpack performance reaches 10PFlops
• 峰值100PFlops的机器将在2014年到2015年间出现
2014-2015: System with peak performance of 100 PFlops
• 累计Linpack性能将在2013年到2014年间达到100PFlops
2013-2014: Total Linpack performance reaches 100 PFlops