Sampo Group · Debt Investor Presentation Prepared November 4, 2016 Figures September 30, 2016....
59
Sampo Group Debt Investor Presentation Prepared November 4, 2016 Figures September 30, 2016
Transcript of Sampo Group · Debt Investor Presentation Prepared November 4, 2016 Figures September 30, 2016....
Sampo Group Debt Investor Presentation
Prepared November 4, 2016Figures September 30, 2016
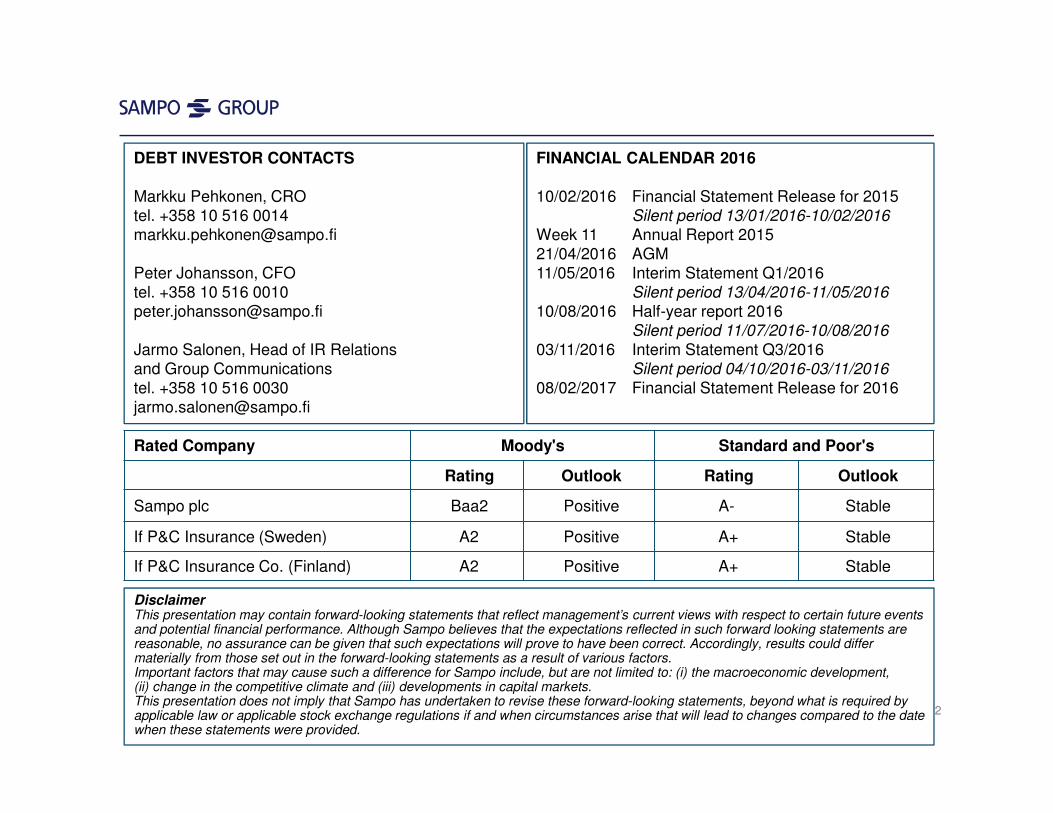
DEBT INVESTOR CONTACTS
Markku Pehkonen, CROtel. +358 10 516 [email protected]
Peter Johansson, CFOtel. +358 10 516 [email protected]
Jarmo Salonen, Head of IR Relations and Group Communicationstel. +358 10 516 [email protected]
FINANCIAL CALENDAR 2016
10/02/2016 Financial Statement Release for 2015Silent period 13/01/2016-10/02/2016
Week 11 Annual Report 201521/04/2016 AGM11/05/2016 Interim Statement Q1/2016
Silent period 13/04/2016-11/05/2016
10/08/2016 Half-year report 2016Silent period 11/07/2016-10/08/2016
03/11/2016 Interim Statement Q3/2016Silent period 04/10/2016-03/11/2016
08/02/2017 Financial Statement Release for 2016
Rated Company Moody's Standard and Poor's
Rating Outlook Rating Outlook
Sampo plc Baa2 Positive A- Stable
If P&C Insurance (Sweden) A2 Positive A+ Stable
If P&C Insurance Co. (Finland) A2 Positive A+ Stable
Disclaimer
This presentation may contain forward-looking statements that reflect management’s current views with respect to certain future events and potential financial performance. Although Sampo believes that the expectations reflected in such forward looking statements are reasonable, no assurance can be given that such expectations will prove to have been correct. Accordingly, results could differ materially from those set out in the forward-looking statements as a result of various factors.Important factors that may cause such a difference for Sampo include, but are not limited to: (i) the macroeconomic development,(ii) change in the competitive climate and (iii) developments in capital markets.This presentation does not imply that Sampo has undertaken to revise these forward-looking statements, beyond what is required by applicable law or applicable stock exchange regulations if and when circumstances arise that will lead to changes compared to the date when these statements were provided.
2
Mission Value Creation in the Nordic Financials 3-10
Sampo Group Current Issues 11-14If P&C The Leading Nordic P&C Insurer 15-22Mandatum Life A Finnish Financial Services Company 23-29Sampo Group A Diversified Business Portfolio with Strong Capitalization 30-40Sampo plc Parent Company with Capacity to Generate Funds 41-47Appendix Separate Supplementary Information 48-59 3
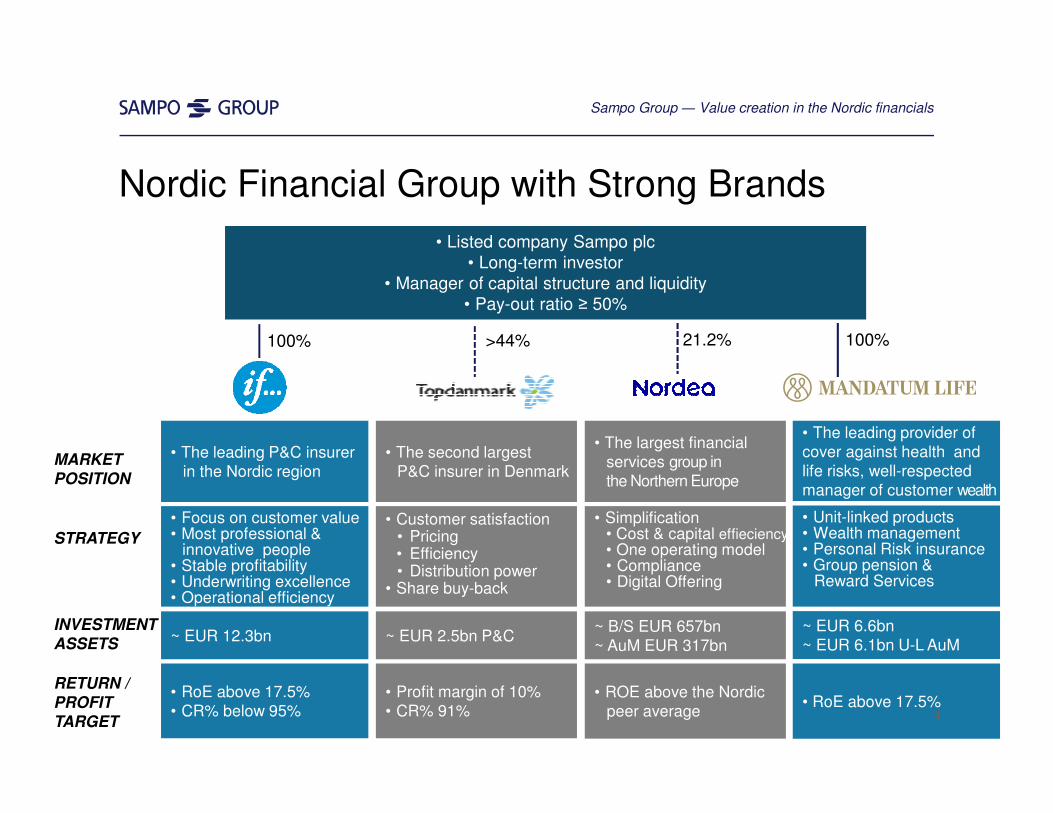
• Listed company Sampo plc• Long-term investor
• Manager of capital structure and liquidity• Pay-out ratio ≥ 50%
Nordic Financial Group with Strong Brands
Sampo Group ― Value creation in the Nordic financials
MARKET
POSITION
STRATEGY
INVESTMENT
ASSETS
RETURN /
PROFIT
TARGET
21.2%
• The leading P&C insurerin the Nordic region
• Focus on customer value• Most professional &
innovative people• Stable profitability• Underwriting excellence• Operational efficiency
~ EUR 12.3bn
• RoE above 17.5%• CR% below 95%
>44% 100%
• The largest financialservices group inthe Northern Europe
• Simplification• Cost & capital effieciency• One operating model• Compliance• Digital Offering
~ B/S EUR 657bn~ AuM EUR 317bn
• ROE above the Nordicpeer average
• The second largest P&C insurer in Denmark
• Customer satisfaction• Pricing• Efficiency• Distribution power
• Share buy-back
~ EUR 2.5bn P&C
• Profit margin of 10%• CR% 91%
• Unit-linked products• Wealth management• Personal Risk insurance • Group pension &
Reward Services
• The leading provider ofcover against health andlife risks, well-respected manager of customer wealth
~ EUR 6.6bn~ EUR 6.1bn U-L AuM
• RoE above 17.5%
100%
4
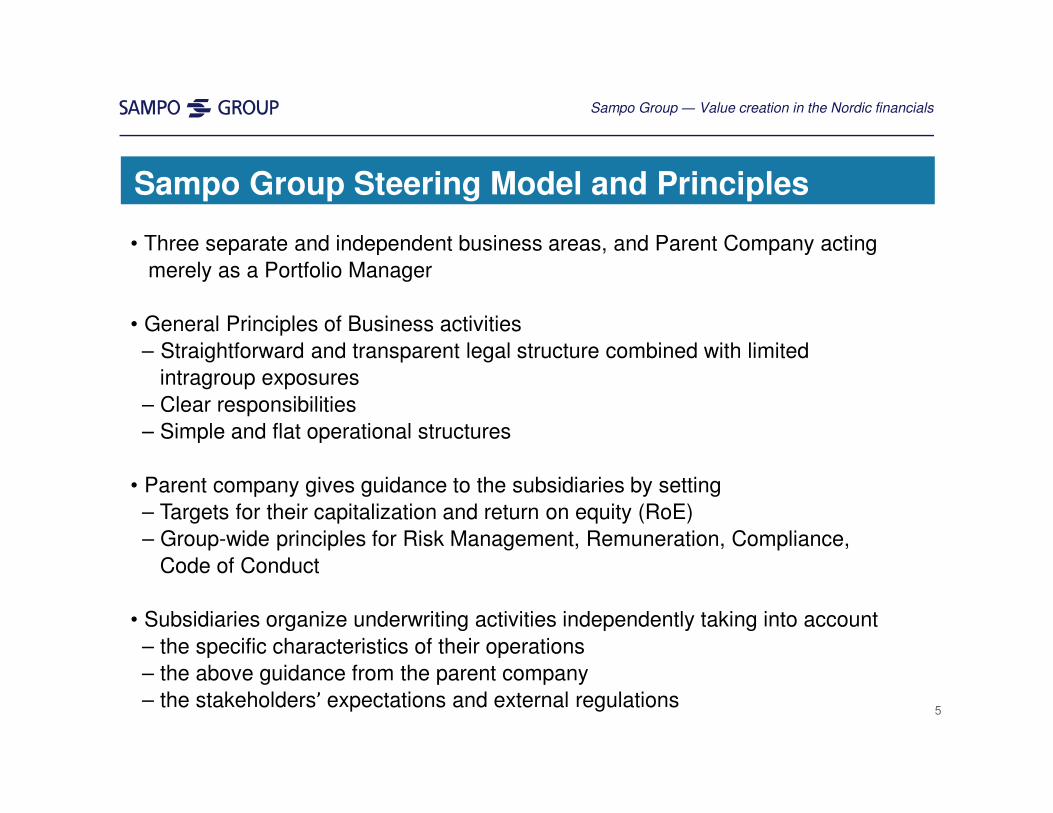
Sampo Group Steering Model and Principles
• Three separate and independent business areas, and Parent Company acting
merely as a Portfolio Manager
• General Principles of Business activities
– Straightforward and transparent legal structure combined with limited
intragroup exposures
– Clear responsibilities
– Simple and flat operational structures
• Parent company gives guidance to the subsidiaries by setting
– Targets for their capitalization and return on equity (RoE)
– Group-wide principles for Risk Management, Remuneration, Compliance,
Code of Conduct
• Subsidiaries organize underwriting activities independently taking into account
– the specific characteristics of their operations
– the above guidance from the parent company
– the stakeholders’ expectations and external regulations5
Sampo Group ― Value creation in the Nordic financials
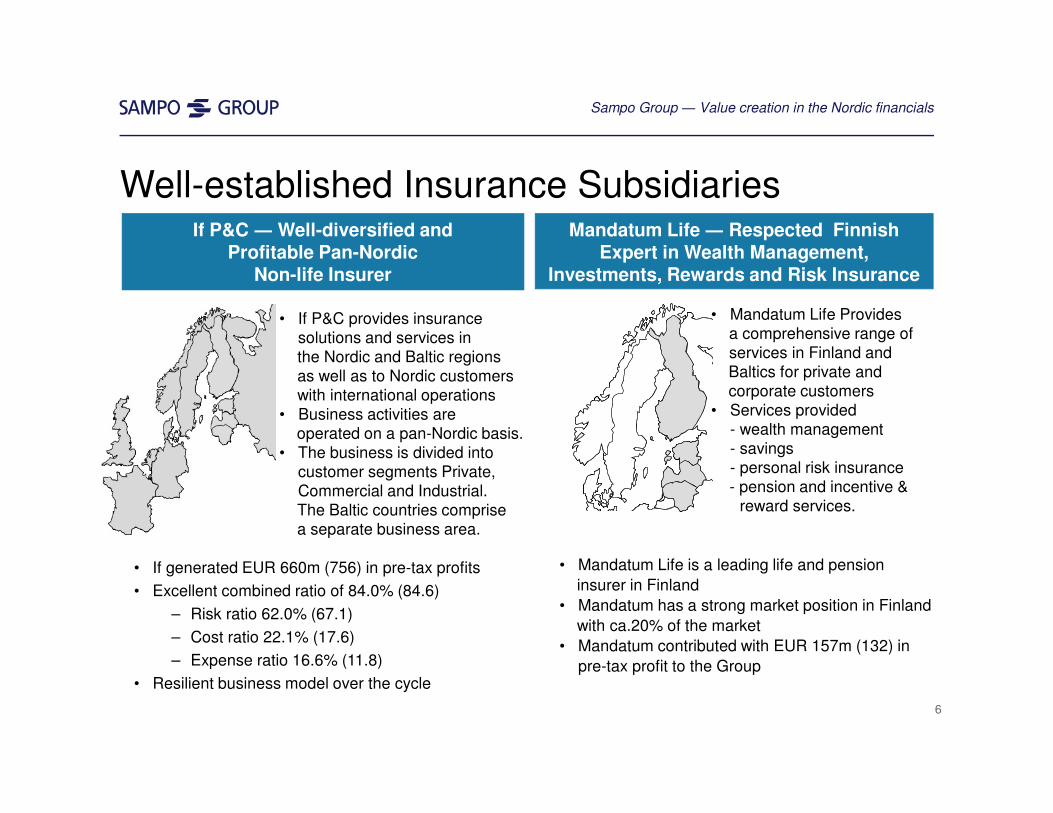
• If generated EUR 660m (756) in pre-tax profits
• Excellent combined ratio of 84.0% (84.6)
– Risk ratio 62.0% (67.1)
– Cost ratio 22.1% (17.6)
– Expense ratio 16.6% (11.8)
• Resilient business model over the cycle
If P&C ― Well-diversified and Profitable Pan-Nordic
Non-life Insurer
Well-established Insurance Subsidiaries
• Mandatum Life is a leading life and pension
insurer in Finland
• Mandatum has a strong market position in Finland
with ca.20% of the market
• Mandatum contributed with EUR 157m (132) in
pre-tax profit to the Group
Mandatum Life ― Respected Finnish Expert in Wealth Management,
Investments, Rewards and Risk Insurance
6
• If P&C provides insurance solutions and services in the Nordic and Baltic regionsas well as to Nordic customers with international operations
• Business activities areoperated on a pan-Nordic basis.
• The business is divided into customer segments Private, Commercial and Industrial.The Baltic countries comprisea separate business area.
• Mandatum Life Provides a comprehensive range of services in Finland and Baltics for private and corporate customers
• Services provided- wealth management- savings- personal risk insurance- pension and incentive &
reward services.
Sampo Group ― Value creation in the Nordic financials
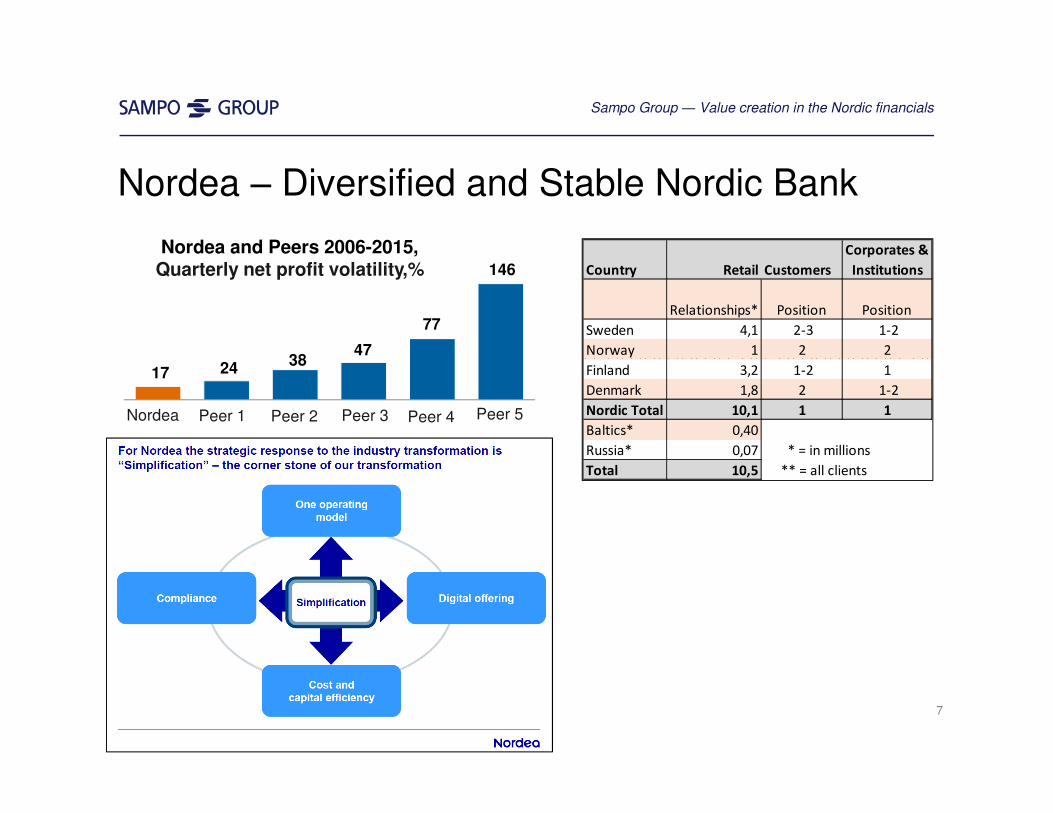
Nordea ‒ Diversified and Stable Nordic Bank
17 24 38
47
77
146
Nordea Peer 4Peer 3Peer 1 Peer 5Peer 2
Nordea and Peers 2006-2015,Quarterly net profit volatility,%
7
Sampo Group ― Value creation in the Nordic financials
Country Retail Customers
Corporates &
Institutions
Relationships* Position Position
Sweden 4,1 2-3 1-2
Norway 1 2 2
Finland 3,2 1-2 1
Denmark 1,8 2 1-2
Nordic Total 10,1 1 1
Baltics* 0,40
Russia* 0,07 * = in millions
Total 10,5 ** = all clients
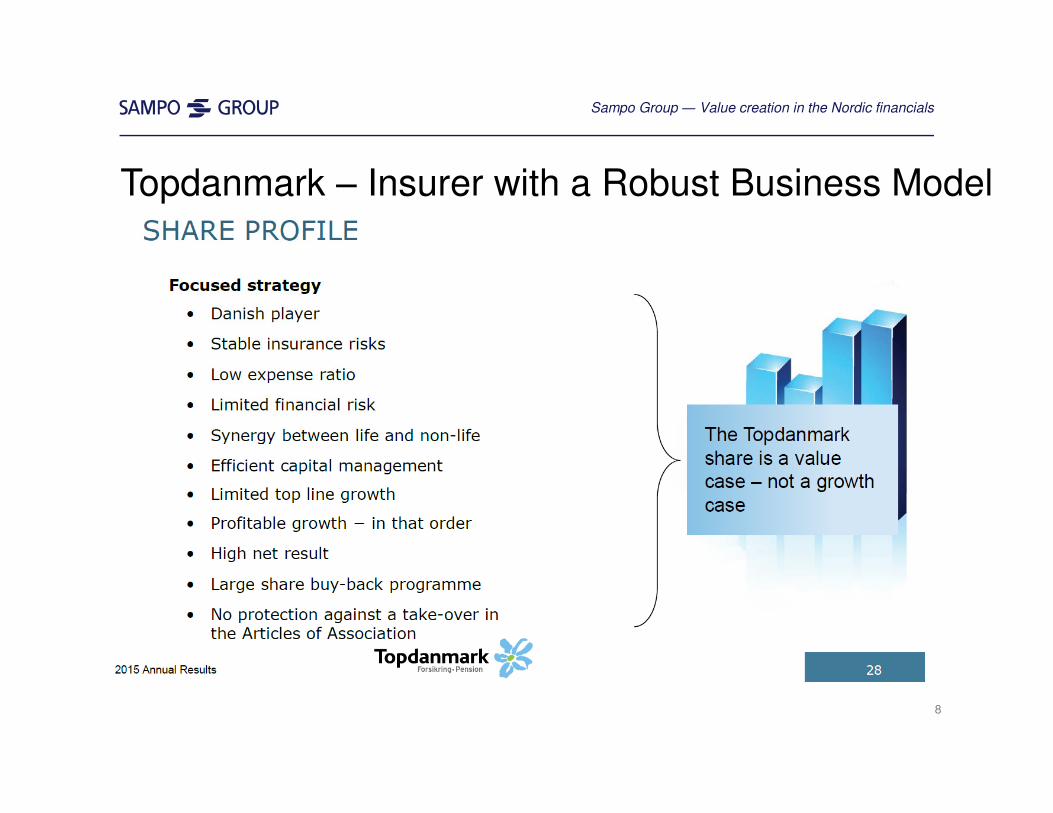
Topdanmark ‒ Insurer with a Robust Business Model
8
Sampo Group ― Value creation in the Nordic financials
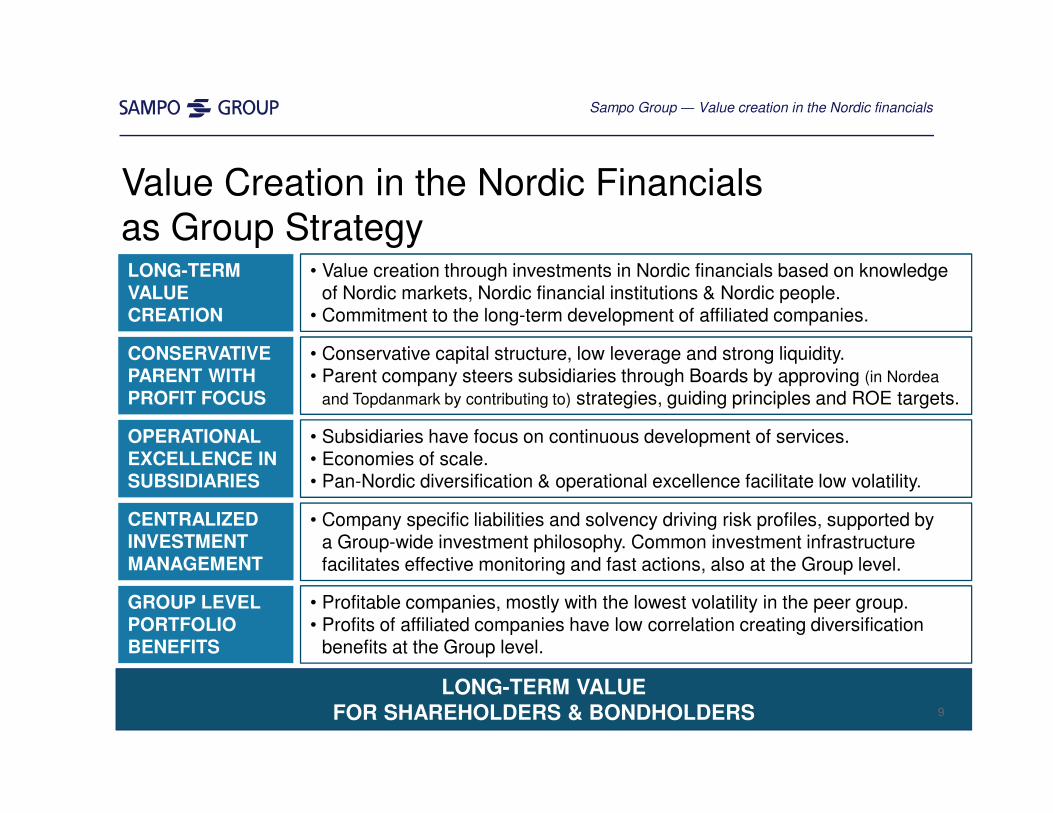
Value Creation in the Nordic Financialsas Group StrategyLONG-TERM VALUE CREATION
• Value creation through investments in Nordic financials based on knowledge of Nordic markets, Nordic financial institutions & Nordic people.
• Commitment to the long-term development of affiliated companies.
OPERATIONAL EXCELLENCE IN SUBSIDIARIES
• Subsidiaries have focus on continuous development of services.• Economies of scale.• Pan-Nordic diversification & operational excellence facilitate low volatility.
CONSERVATIVE PARENT WITH PROFIT FOCUS
• Conservative capital structure, low leverage and strong liquidity.• Parent company steers subsidiaries through Boards by approving (in Nordea
and Topdanmark by contributing to) strategies, guiding principles and ROE targets.
GROUP LEVEL PORTFOLIO BENEFITS
• Profitable companies, mostly with the lowest volatility in the peer group.• Profits of affiliated companies have low correlation creating diversification
benefits at the Group level.
LONG-TERM VALUE
FOR SHAREHOLDERS & BONDHOLDERS
CENTRALIZEDINVESTMENT MANAGEMENT
• Company specific liabilities and solvency driving risk profiles, supported bya Group-wide investment philosophy. Common investment infrastructure facilitates effective monitoring and fast actions, also at the Group level.
9
Sampo Group ― Value creation in the Nordic financials
38.9
27.7
24.2
23.8
23.3
21.5
20.0
14.8
8.2
5.0
4.7
3.9
2.3
2.1
1.2
0.7
0.4
0 10 20 30 40 50
Nordea
Danske
Swedbank
SHB
Sampo
DNB
SEB
Investor
Gjensidige
Tryg
Industrivärden
Jyske
Topdanmark
Storebrand
Alm.Brand
Protector
Aktia
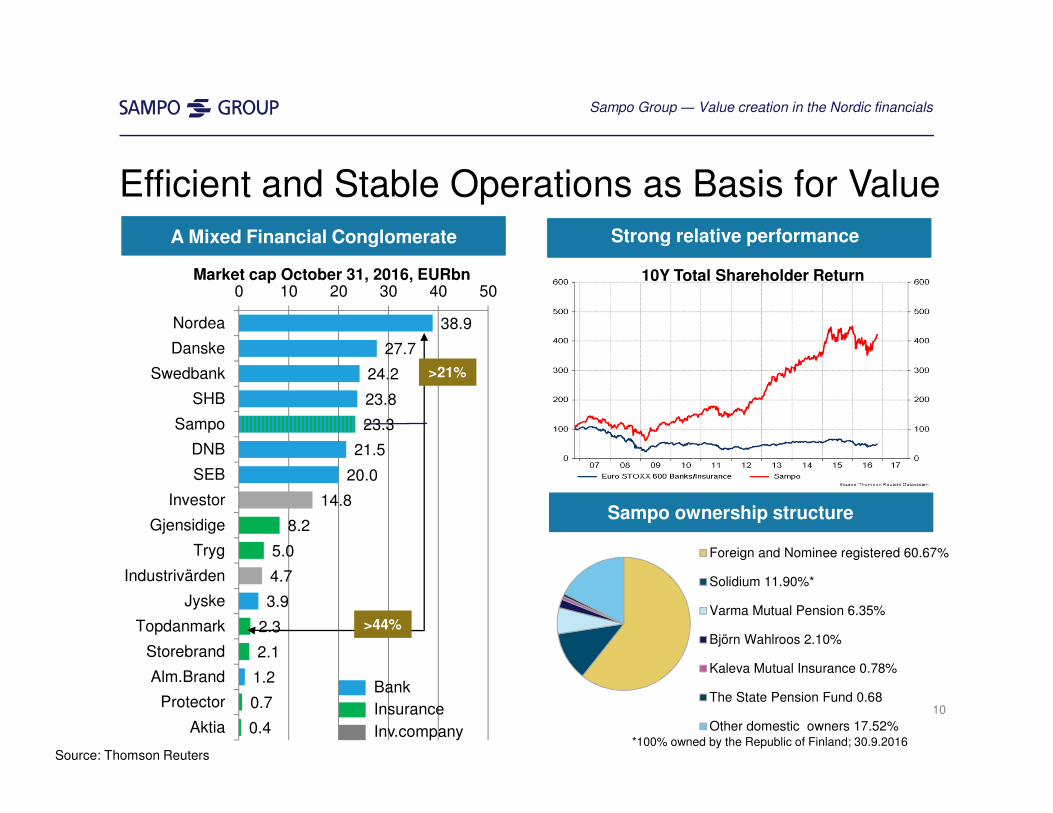
Efficient and Stable Operations as Basis for Value
Source: Thomson Reuters
>44%
Sampo ownership structure
*100% owned by the Republic of Finland; 30.9.2016
Market cap October 31, 2016, EURbn
Strong relative performance
10Y Total Shareholder Return
A Mixed Financial Conglomerate
Bank
Insurance
Inv.company
Foreign and Nominee registered 60.67%
Solidium 11.90%*
Varma Mutual Pension 6.35%
Björn Wahlroos 2.10%
Kaleva Mutual Insurance 0.78%
The State Pension Fund 0.68
Other domestic owners 17.52%
10
>21%
Sampo Group ― Value creation in the Nordic financials

Mission Value Creation in the Nordic Financials 3-10
Sampo Group Current Issues 11-14
If P&C The Leading Nordic P&C Insurer 15-22Mandatum Life A Finnish Financial Services Company 23-29Sampo Group A Diversified Business Portfolio with Strong Capitalization 30-40Sampo plc Parent Company with Capacity to Generate Funds 41-47 Appendix Separate Supplementary Information 48-59 11
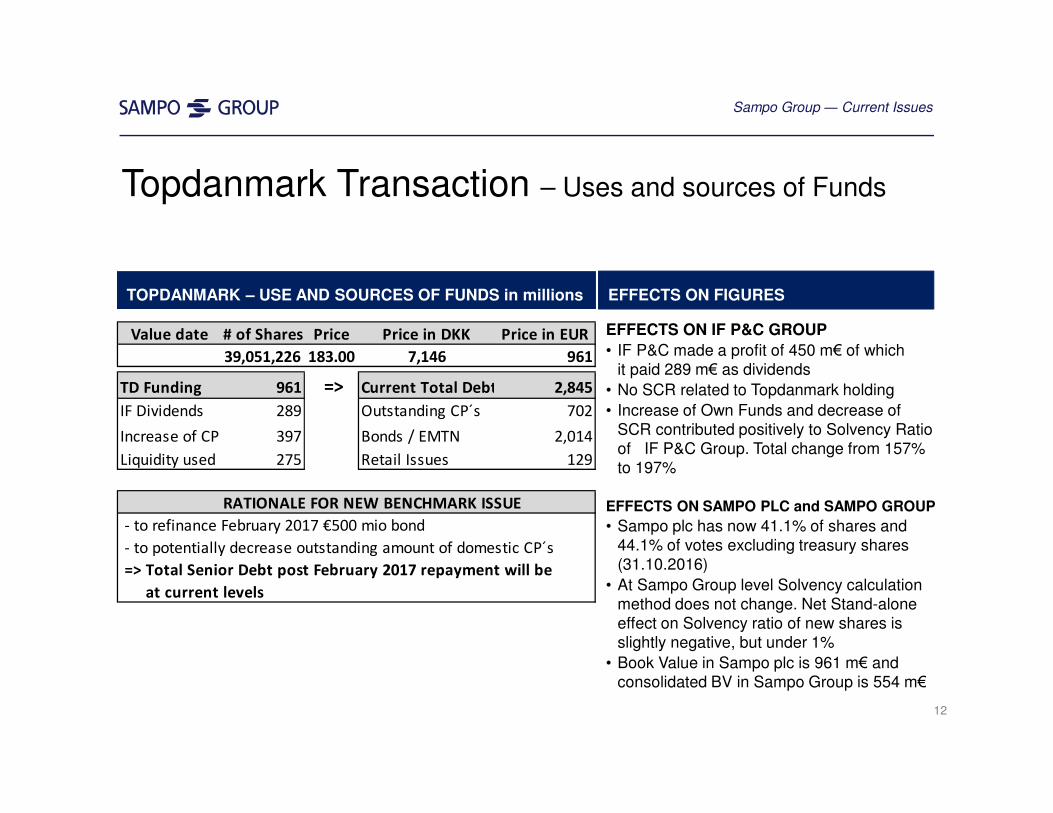
Topdanmark Transaction – Uses and sources of Funds
TOPDANMARK – USE AND SOURCES OF FUNDS in millions EFFECTS ON FIGURES
EFFECTS ON IF P&C GROUP
• IF P&C made a profit of 450 m€ of whichit paid 289 m€ as dividends
• No SCR related to Topdanmark holding
• Increase of Own Funds and decrease of SCR contributed positively to Solvency Ratioof IF P&C Group. Total change from 157% to 197%
EFFECTS ON SAMPO PLC and SAMPO GROUP
• Sampo plc has now 41.1% of shares and 44.1% of votes excluding treasury shares(31.10.2016)
• At Sampo Group level Solvency calculationmethod does not change. Net Stand-aloneeffect on Solvency ratio of new shares is slightly negative, but under 1%
• Book Value in Sampo plc is 961 m€ and consolidated BV in Sampo Group is 554 m€
12
Sampo Group ― Current Issues
Value date # of Shares Price Price in DKK Price in EUR
39,051,226 183.00 7,146 961
TD Funding 961 => Current Total Debt 2,845
IF Dividends 289 Outstanding CP´s 702
Increase of CP´s 397 Bonds / EMTN 2,014
Liquidity used 275 Retail Issues 129
RATIONALE FOR NEW BENCHMARK ISSUE
- to refinance February 2017 €500 mio bond
- to potentially decrease outstanding amount of domestic CP´s
=> Total Senior Debt post February 2017 repayment will be
at current levels
Mandatum Life’s agency agreement with DanskeBackground
• In 2007 Sampo Bank (now Danske Bank) and Sampo Life (now Mandatum Life)agreed that Sampo Life has the exclusive right to sell life and pension insuranceproducts through Sampo Bank’s network in Finland
• Mandatum Life has decided not to prolong the distribution agreement which includedan option to sell the portfolio – sold by Danske Bank – to Danske Bank
• Mandatum Life has now decided to use the option
Portfolio • consists of 151,00 policies, almost exclusively unit-linked and loan insurance products• at the end of 2015 the technical reserves related to the portfolio amounted
to EUR 3,060 million, the amount of with-profit technical reserves being EUR 212 million• the portfolio accrued premiums of EUR 453 million in 2015
Valuation of the portfolio• will be conducted by a third party in accordance with the terms and conditions of
the bank transaction agreement• is estimated to take until summer 2017 • the transfer of the portfolio to take place during fourth quarter in 2017
13
Sampo Group ― Current Issues
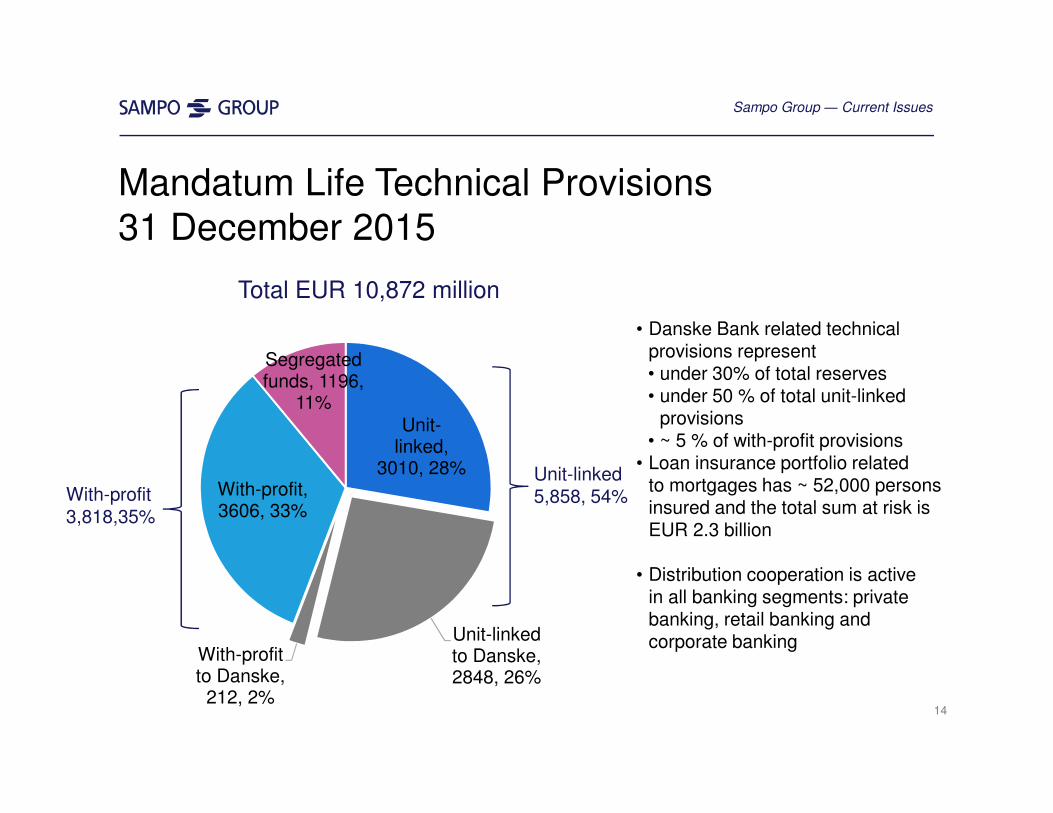
Mandatum Life Technical Provisions31 December 2015
Unit-linked,
3010, 28%
Unit-linked to Danske, 2848, 26%
With-profit to Danske,
212, 2%
With-profit, 3606, 33%
Segregated funds, 1196,
11%
Unit-linked5,858, 54%With-profit
3,818,35%
Total EUR 10,872 million
• Danske Bank related technicalprovisions represent• under 30% of total reserves• under 50 % of total unit-linked
provisions• ~ 5 % of with-profit provisions
• Loan insurance portfolio relatedto mortgages has ~ 52,000 personsinsured and the total sum at risk is EUR 2.3 billion
• Distribution cooperation is activein all banking segments: privatebanking, retail banking and corporate banking
14
Sampo Group ― Current Issues
Mission Value Creation in the Nordic Financials 3-10
Sampo Group Current Issues 11-14If P&C The Leading Nordic P&C Insurer 15-22
Mandatum Life A Finnish Financial Services Company 23-29Sampo Group A Diversified Business Portfolio with Strong Capitalization 30-40Sampo plc Parent Company with Capacity to Generate Funds 41-47 Appendix Separate Supplementary Information 48-59 15
Expense Ratios 2015, %
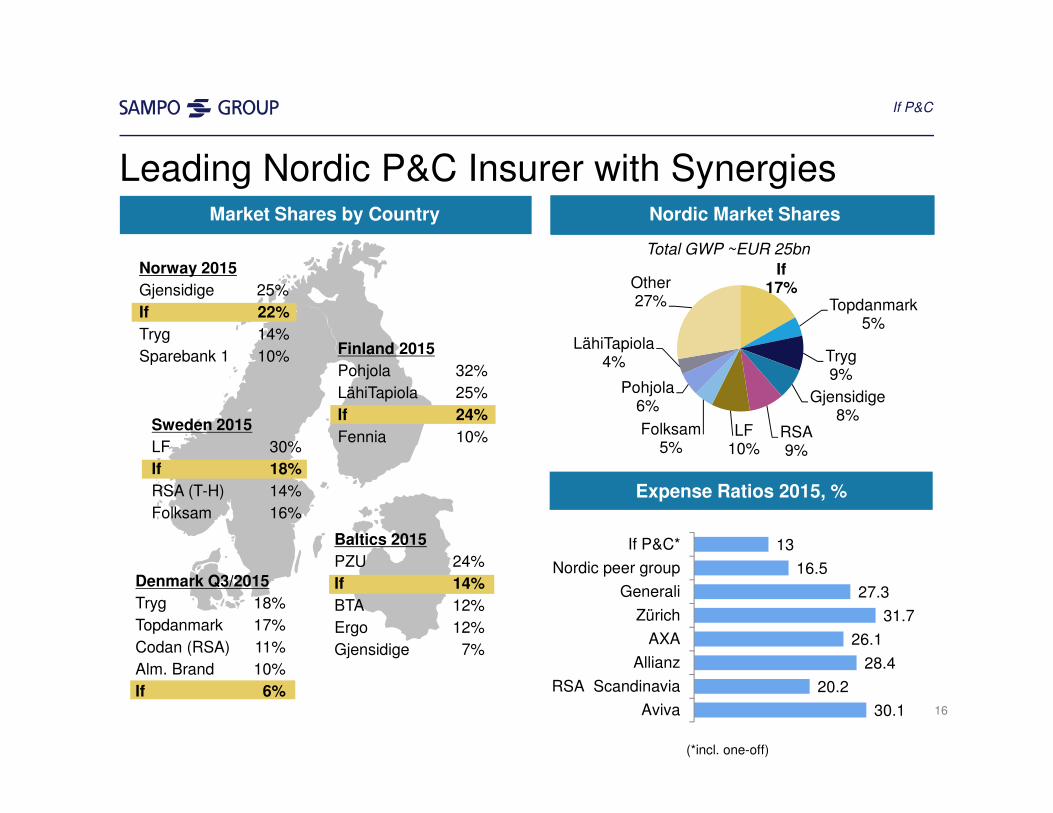
Leading Nordic P&C Insurer with Synergies
Norway 2015
Gjensidige 25%
If 22%
Tryg 14%
Sparebank 1 10%
Denmark Q3/2015
Tryg 18%
Topdanmark 17%
Codan (RSA) 11%
Alm. Brand 10%
If 6%
Finland 2015
Pohjola 32%
LähiTapiola 25%
If 24%
Fennia 10%Sweden 2015
LF 30%
If 18%
RSA (T-H) 14%
Folksam 16%
Baltics 2015
PZU 24%
If 14%
BTA 12%
Ergo 12%
Gjensidige 7%
Market Shares by Country
If17%
Topdanmark5%
Tryg9%
Gjensidige8%
RSA9%
LF10%
Folksam5%
Pohjola6%
LähiTapiola4%
Other27%
13
16.5
27.3
31.7
26.1
28.4
20.2
30.1
If P&C*
Nordic peer group
Generali
Zürich
AXA
Allianz
RSA Scandinavia
Aviva
If P&C
Nordic Market Shares
16
Total GWP ~EUR 25bn
(*incl. one-off)
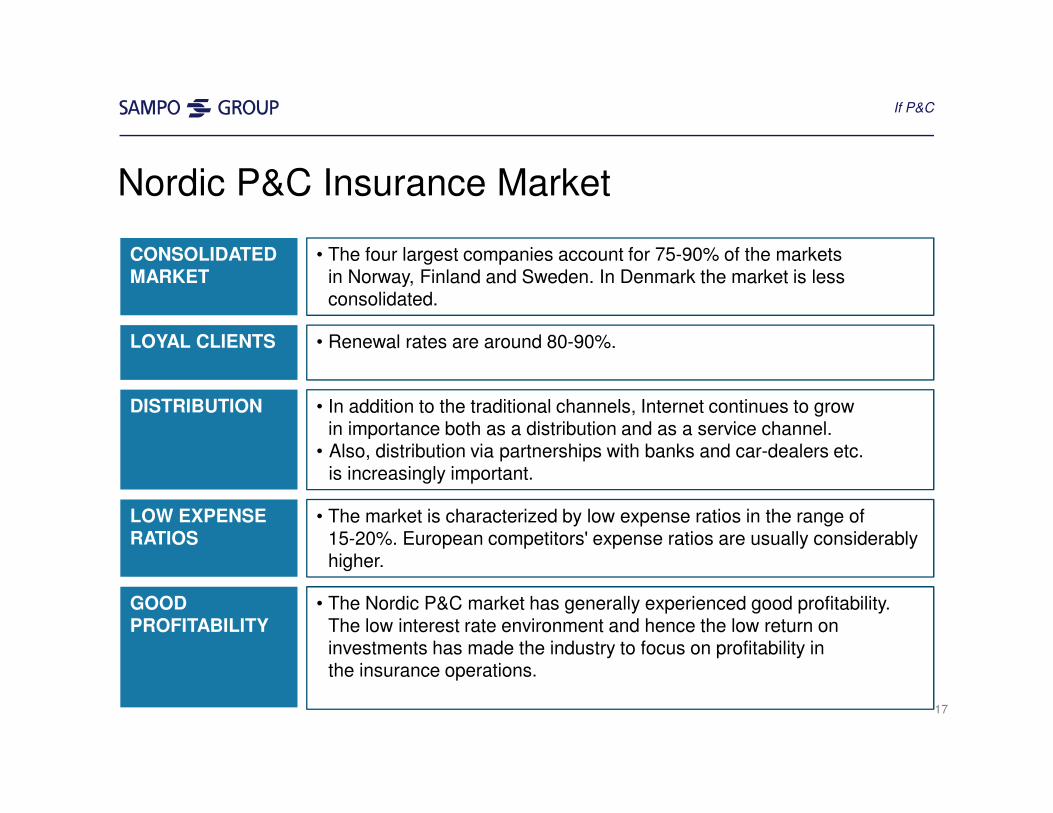
Nordic P&C Insurance Market
CONSOLIDATED MARKET
LOW EXPENSE RATIOS
• In addition to the traditional channels, Internet continues to grow in importance both as a distribution and as a service channel.
• Also, distribution via partnerships with banks and car-dealers etc.is increasingly important.
GOOD PROFITABILITY
• The Nordic P&C market has generally experienced good profitability. The low interest rate environment and hence the low return on investments has made the industry to focus on profitability in the insurance operations.
• Renewal rates are around 80-90%.LOYAL CLIENTS
DISTRIBUTION
• The market is characterized by low expense ratios in the range of 15-20%. European competitors' expense ratios are usually considerably higher.
• The four largest companies account for 75-90% of the markets in Norway, Finland and Sweden. In Denmark the market is less consolidated.
If P&C
17
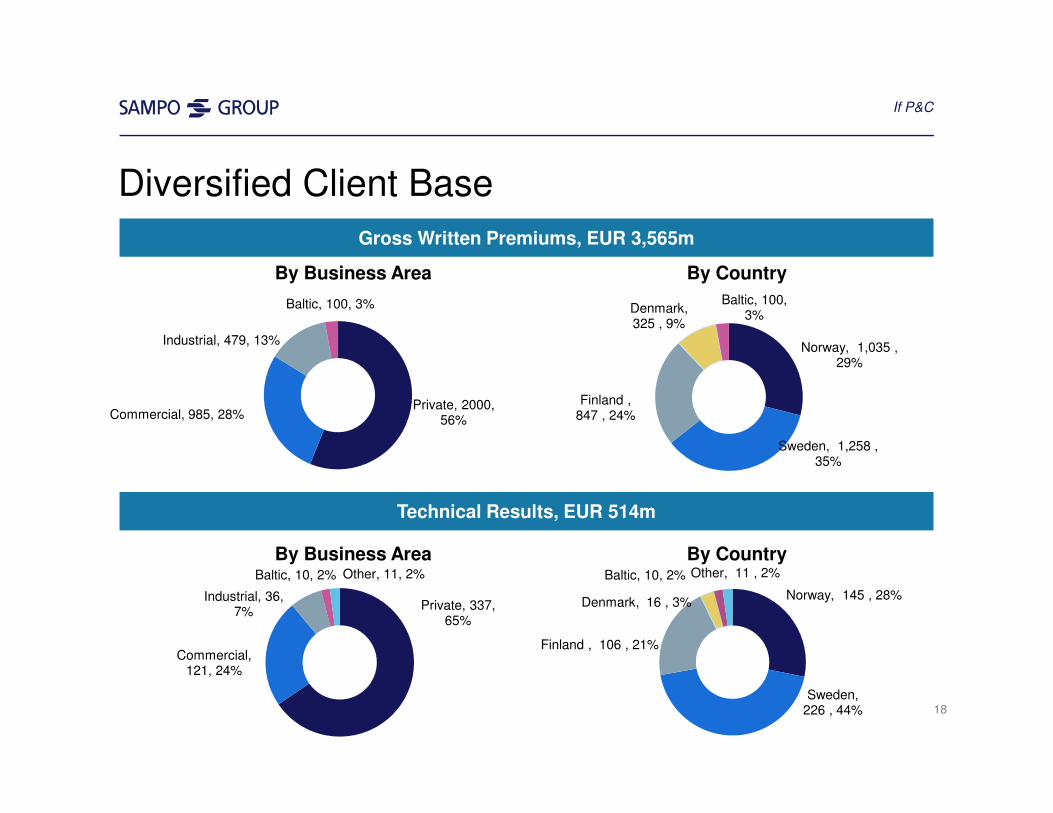
By Business Area By Country
Private, 337, 65%
Commercial, 121, 24%
Industrial, 36, 7%
Baltic, 10, 2% Other, 11, 2%
Technical Results, EUR 514m
Norway, 145 , 28%
Sweden, 226 , 44%
Finland , 106 , 21%
Denmark, 16 , 3%
Baltic, 10, 2% Other, 11 , 2%
Gross Written Premiums, EUR 3,565m
By Business Area By Country
Private, 2000, 56%Commercial, 985, 28%
Industrial, 479, 13%
Baltic, 100, 3%
Norway, 1,035 , 29%
Sweden, 1,258 , 35%
Finland , 847 , 24%
Denmark, 325 , 9%
Baltic, 100, 3%
If P&C
Diversified Client Base
18
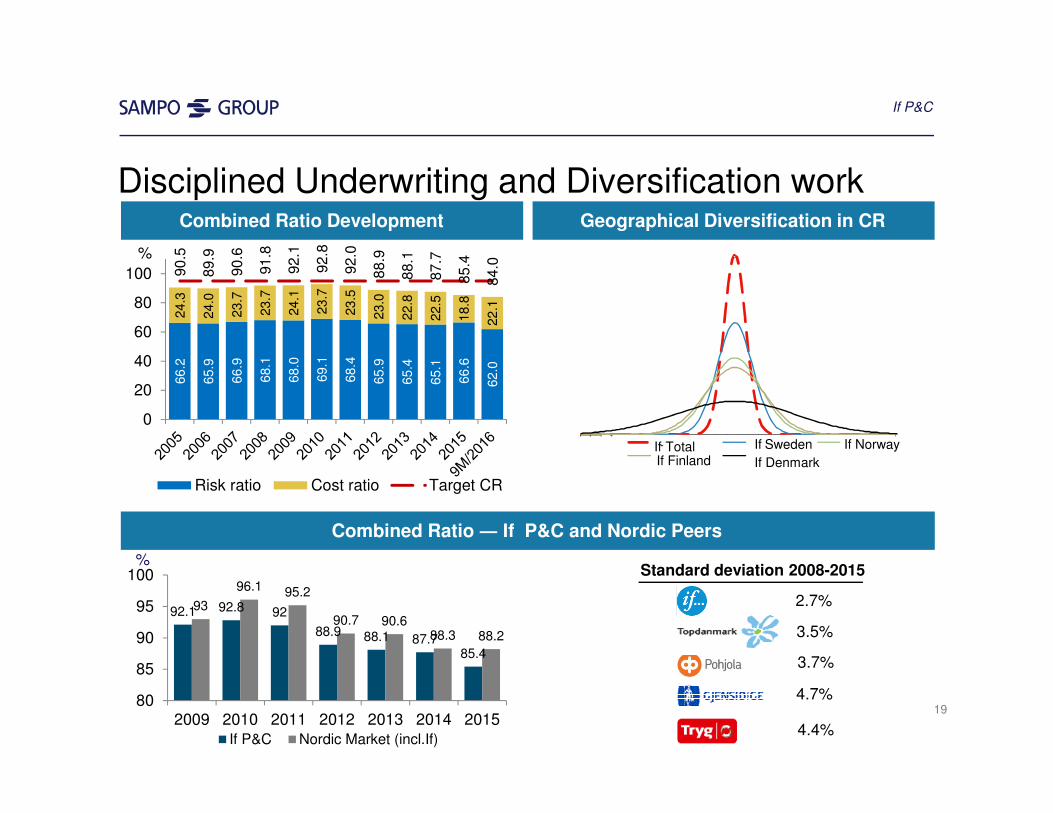
If- Total If Sweden If NorwayIf Finland If Denmark
Geographical Diversification in CR
Combined Ratio ― If P&C and Nordic Peers
Combined Ratio Development
Standard deviation 2008-2015
2.7%
4.4%
4.7%
3.7%
3.5%
66.2
65.9
66.9
68.1
68.0
69.1
68.4
65.9
65.4
65.1
66.6
62.0
24.3
24.0
23.7
23.7
24.1
23.7
23.5
23.0
22.8
22.5
18.8
22.1
90.5
89.9
90.6
91.8
92.1
92.8
92.0
88.9
88.1
87.7
85.4
84.0
0
20
40
60
80
100
%
Risk ratio Cost ratio Target CR
If P&C
92.1 92.8 92
88.9 88.1 87.785.4
93
96.1 95.2
90.7 90.688.3 88.2
80
85
90
95
100
2009 2010 2011 2012 2013 2014 2015If P&C Nordic Market (incl.If)
Disciplined Underwriting and Diversification work
19
%
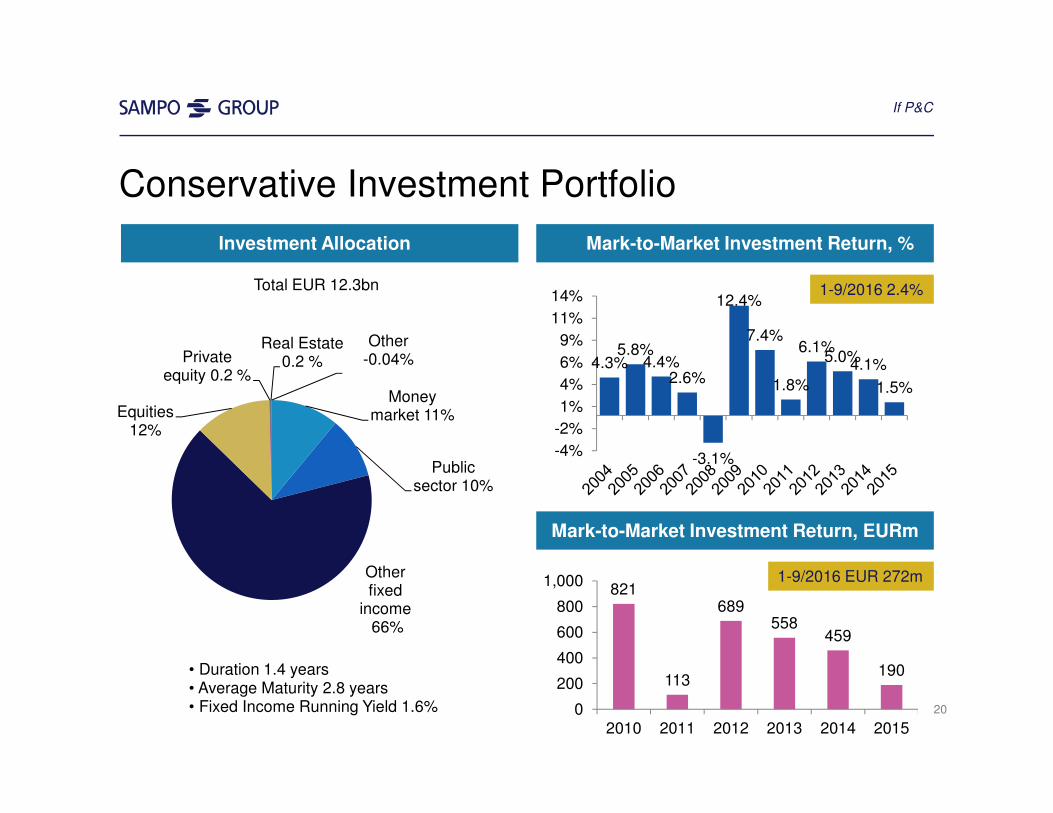
Conservative Investment Portfolio
• Duration 1.4 years• Average Maturity 2.8 years• Fixed Income Running Yield 1.6%
Mark-to-Market Investment Return, %Investment Allocation
4.3%5.8%
4.4%2.6%
-3.1%
12.4%
7.4%
1.8%
6.1%5.0%
4.1%
1.5%
-4%
-2%
1%
4%
6%
9%
11%
14%
Mark-to-Market Investment Return, EURm
821
113
689558
459
190
0
200
400
600
800
1,000
2010 2011 2012 2013 2014 2015
20
Total EUR 12.3bn
If P&C
1-9/2016 EUR 272m
1-9/2016 2.4%
Money market 11%
Public sector 10%
Other fixed
income66%
Equities12%
Private equity 0.2 %
Real Estate0.2 %
Other-0.04%
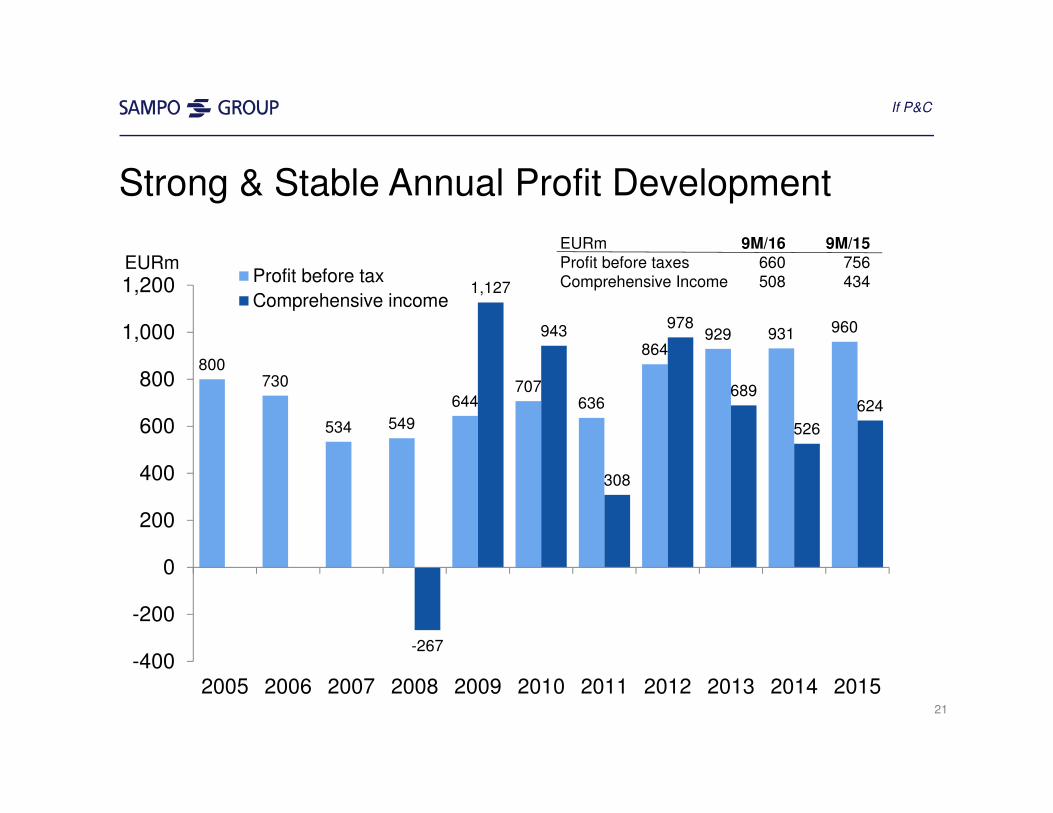
Strong & Stable Annual Profit Development
800730
534 549
644707
636
864929 931 960
-267
1,127
943
308
978
689
526
624
-400
-200
0
200
400
600
800
1,000
1,200
2005 2006 2007 2008 2009 2010 2011 2012 2013 2014 2015
Profit before tax
Comprehensive income
EURm
If P&C
21
EURm 9M/16 9M/15Profit before taxes 660 756Comprehensive Income 508 434
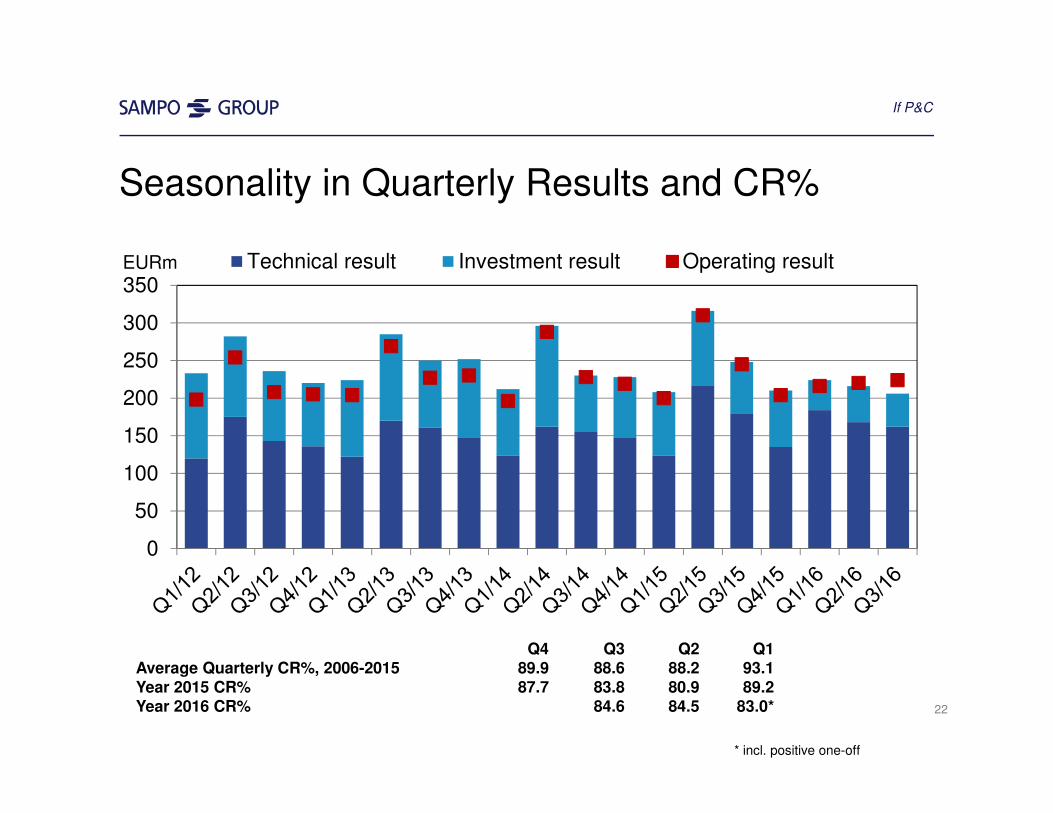
0
50
100
150
200
250
300
350Technical result Investment result Operating result
Seasonality in Quarterly Results and CR%
Q4 Q3 Q2 Q1Average Quarterly CR%, 2006-2015 89.9 88.6 88.2 93.1Year 2015 CR% 87.7 83.8 80.9 89.2
Year 2016 CR% 84.6 84.5 83.0*
If P&C
EURm
22
* incl. positive one-off

Mission Value Creation in the Nordic Financials 3-10
Sampo Group Current Issues 11-14If P&C The Leading Nordic P&C Insurer 15-22Mandatum Life A Finnish Financial Services Company 23-29
Sampo Group A Diversified Business Portfolio with Strong Capitalization 30-40Sampo plc Parent Company with Capacity to Generate Funds 41-47 Appendix Separate Supplementary Information 48-59 23
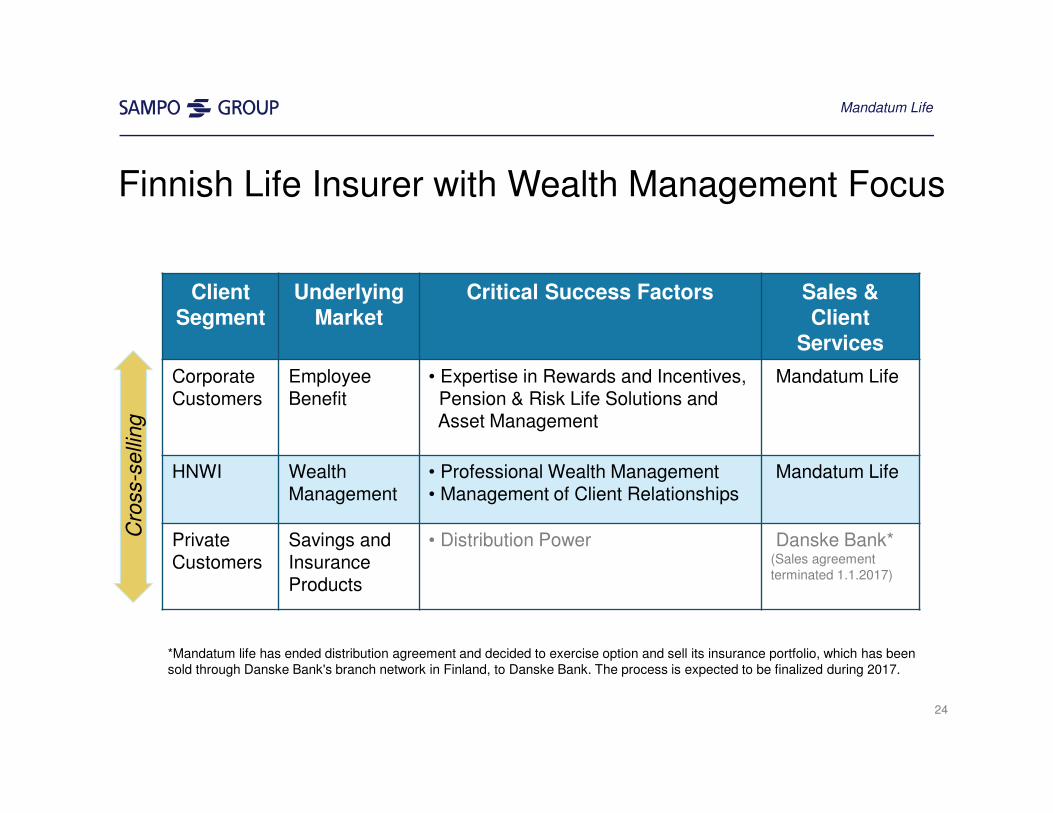
Finnish Life Insurer with Wealth Management Focus
Client
Segment
Underlying
Market
Critical Success Factors Sales &
Client
Services
CorporateCustomers
EmployeeBenefit
• Expertise in Rewards and Incentives, Pension & Risk Life Solutions and Asset Management
Mandatum Life
HNWI WealthManagement
• Professional Wealth Management• Management of Client Relationships
Mandatum Life
PrivateCustomers
Savings and Insurance Products
• Distribution Power Danske Bank*(Sales agreementterminated 1.1.2017)
Mandatum Life
Cro
ss-s
elli
ng
24
*Mandatum life has ended distribution agreement and decided to exercise option and sell its insurance portfolio, which has been sold through Danske Bank's branch network in Finland, to Danske Bank. The process is expected to be finalized during 2017.
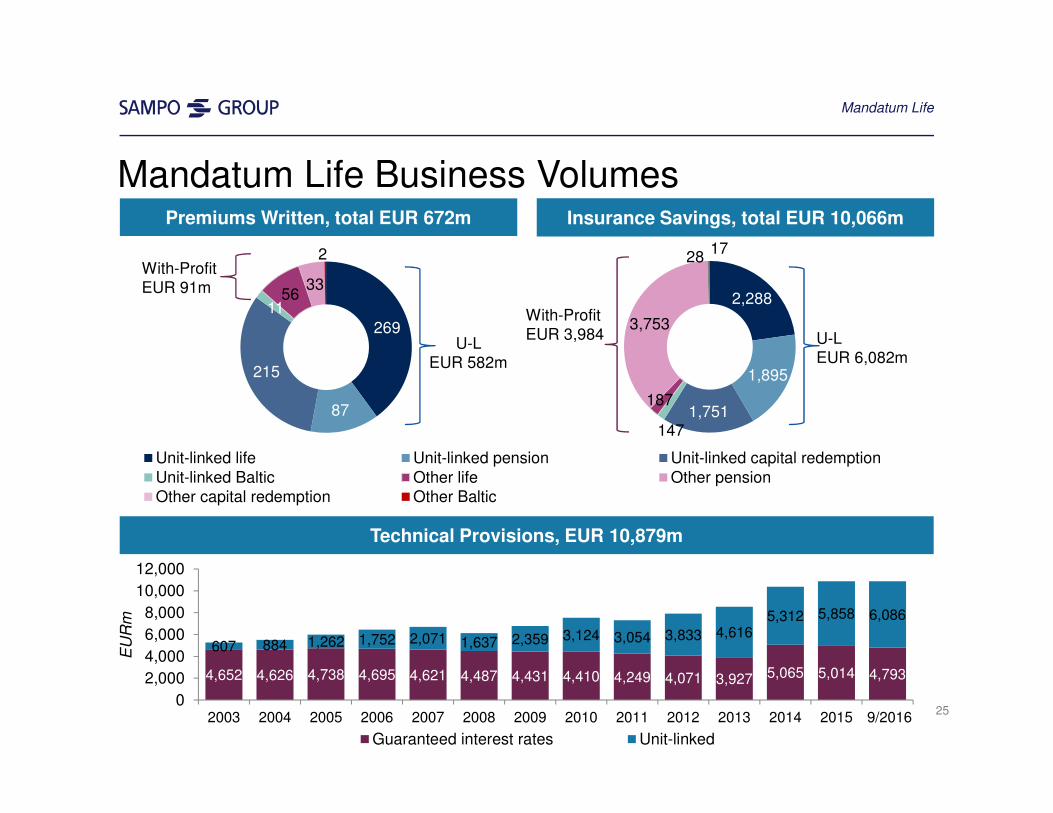
Premiums Written, total EUR 672m Insurance Savings, total EUR 10,066m
269
87
215
1156
33
2
Unit-linked life Unit-linked pension Unit-linked capital redemptionUnit-linked Baltic Other life Other pensionOther capital redemption Other Baltic
2,288
1,895
1,751147
187
3,753
2817
Mandatum Life Business Volumes
U-LEUR 6,082m
With-ProfitEUR 3,984
U-L EUR 582m
With-ProfitEUR 91m
4,652 4,626 4,738 4,695 4,621 4,487 4,431 4,410 4,249 4,071 3,927 5,065 5,014 4,793
607 884 1,262 1,752 2,071 1,637 2,359 3,124 3,054 3,833 4,6165,312 5,858 6,086
0
2,000
4,000
6,000
8,000
10,000
12,000
2003 2004 2005 2006 2007 2008 2009 2010 2011 2012 2013 2014 2015 9/2016
Guaranteed interest rates Unit-linked
Technical Provisions, EUR 10,879m
EU
Rm
Mandatum Life
25
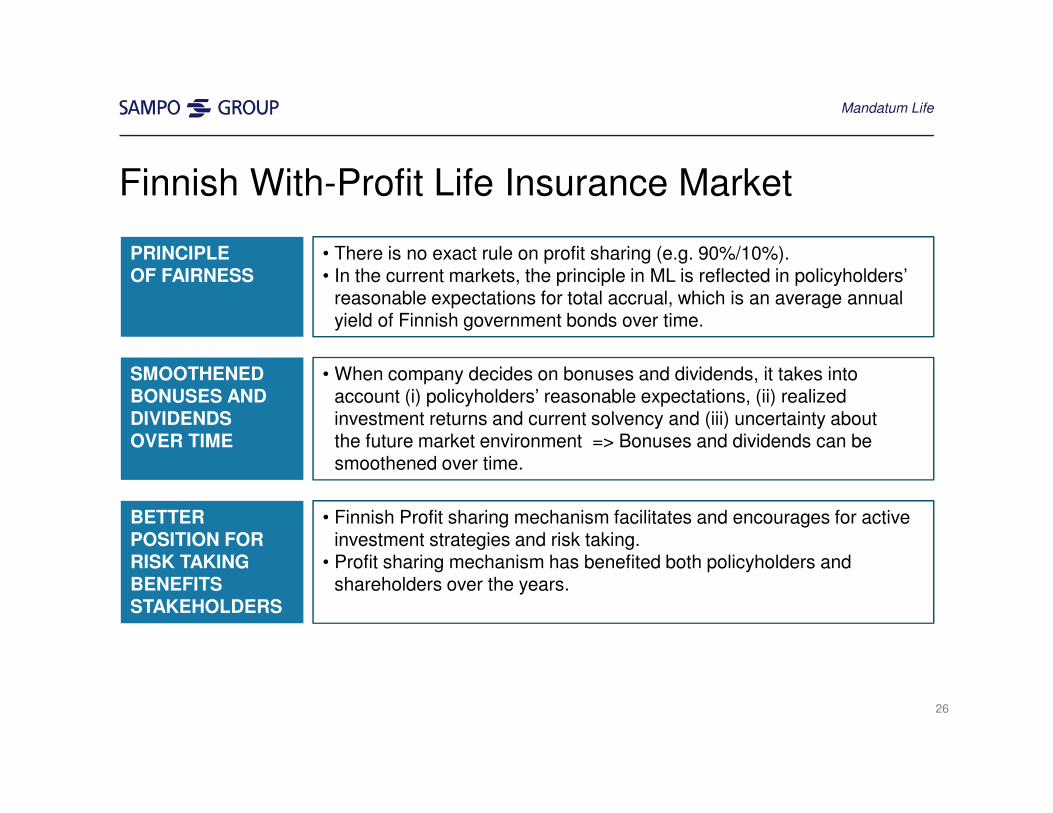
Finnish With-Profit Life Insurance Market
PRINCIPLE OF FAIRNESS
• There is no exact rule on profit sharing (e.g. 90%/10%). • In the current markets, the principle in ML is reflected in policyholdersʼ
reasonable expectations for total accrual, which is an average annual yield of Finnish government bonds over time.
SMOOTHENED BONUSES AND DIVIDENDS OVER TIME
• When company decides on bonuses and dividends, it takes into account (i) policyholdersʼ reasonable expectations, (ii) realized investment returns and current solvency and (iii) uncertainty aboutthe future market environment => Bonuses and dividends can be smoothened over time.
BETTER POSITION FOR RISK TAKING BENEFITS STAKEHOLDERS
• Finnish Profit sharing mechanism facilitates and encourages for active investment strategies and risk taking.
• Profit sharing mechanism has benefited both policyholders and shareholders over the years.
Mandatum Life
26
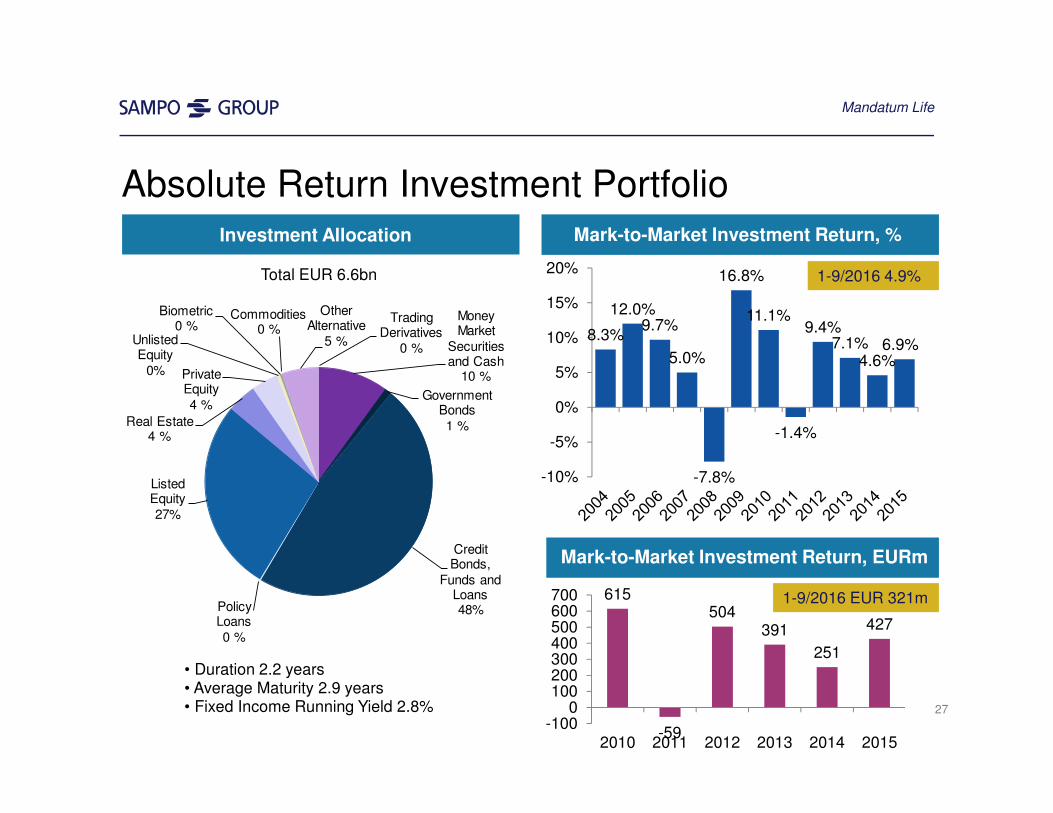
Absolute Return Investment PortfolioMark-to-Market Investment Return, %Investment Allocation
8.3%
12.0%9.7%
5.0%
-7.8%
16.8%
11.1%
-1.4%
9.4%7.1%
4.6%6.9%
-10%
-5%
0%
5%
10%
15%
20%
Mandatum Life
615
-59
504391
251
427
-1000
100200300400500600700
2010 2011 2012 2013 2014 2015
27
Total EUR 6.6bn
• Duration 2.2 years• Average Maturity 2.9 years• Fixed Income Running Yield 2.8%
1-9/2016 EUR 321m
1-9/2016 4.9%
Money Market
Securities and Cash
10 %
Government Bonds1 %
Credit Bonds,
Funds and Loans48%Policy
Loans0 %
Listed Equity27%
Real Estate4 %
Private Equity4 %
Unlisted Equity
0%
Biometric0 %
Commodities0 %
Other Alternative
5 %
Trading Derivatives
0 %
Mark-to-Market Investment Return, EURm
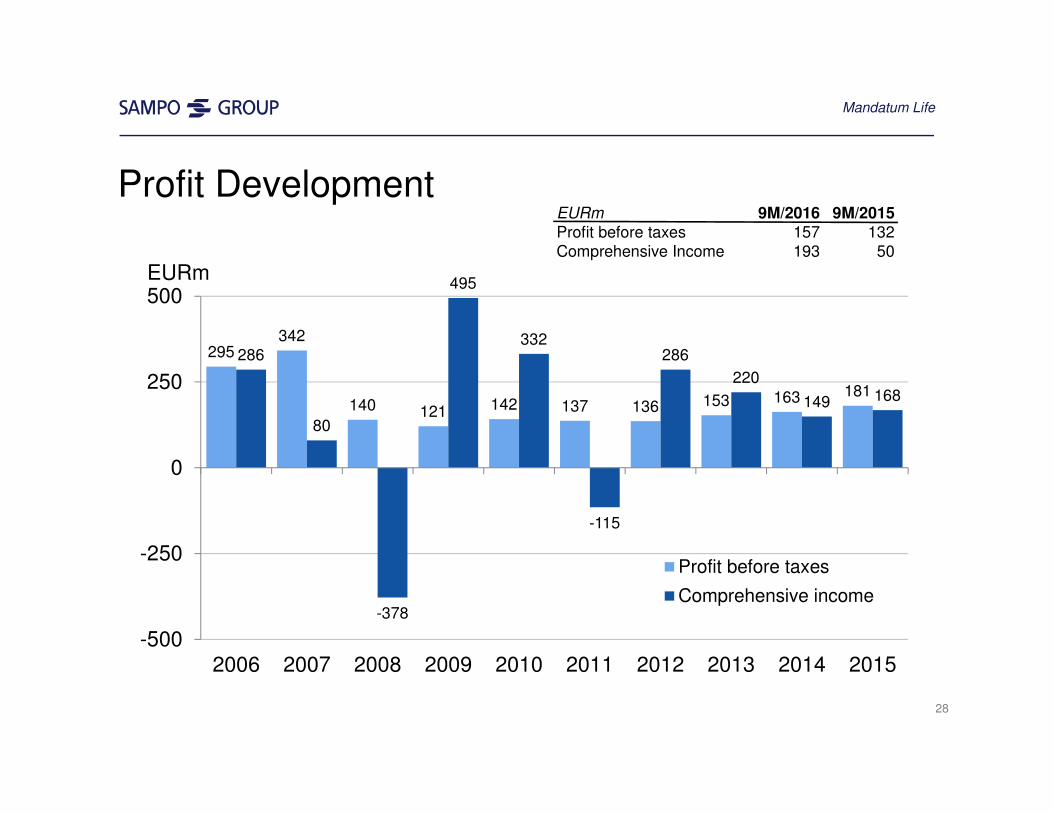
Profit Development
295342
140 121 142 137 136 153 163 181
286
80
-378
495
332
-115
286
220
149 168
-500
-250
0
250
500
2006 2007 2008 2009 2010 2011 2012 2013 2014 2015
EURm
Profit before taxes
Comprehensive income
Mandatum Life
28
EURm 9M/2016 9M/2015Profit before taxes 157 132Comprehensive Income 193 50
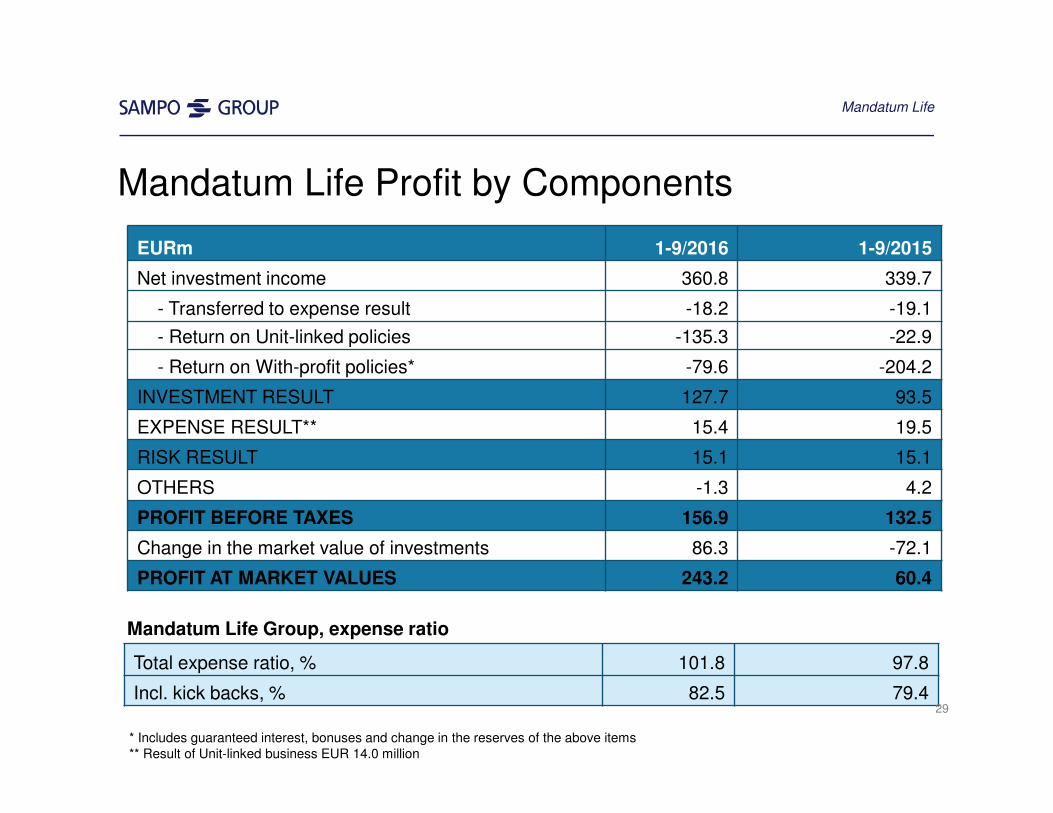
Mandatum Life Profit by Components
Total expense ratio, % 101.8 97.8
Incl. kick backs, % 82.5 79.4
EURm 1-9/2016 1-9/2015
Net investment income 360.8 339.7
- Transferred to expense result -18.2 -19.1
- Return on Unit-linked policies -135.3 -22.9
- Return on With-profit policies* -79.6 -204.2
INVESTMENT RESULT 127.7 93.5
EXPENSE RESULT** 15.4 19.5
RISK RESULT 15.1 15.1
OTHERS -1.3 4.2
PROFIT BEFORE TAXES 156.9 132.5
Change in the market value of investments 86.3 -72.1
PROFIT AT MARKET VALUES 243.2 60.4
Mandatum Life Group, expense ratio
Mandatum Life
* Includes guaranteed interest, bonuses and change in the reserves of the above items** Result of Unit-linked business EUR 14.0 million
29

Mission Value Creation in the Nordic Financials 3-10
Sampo Group Current Issues 11-14If P&C The Leading Nordic P&C Insurer 15-22Mandatum Life A Finnish Financial Services Company 23-29Sampo Group A Diversified Business Portfolio with Strong Capitalization 30-40
Sampo plc Parent Company with Capacity to Generate Funds 41-47Appendix Separate Supplementary Information 48-59 30
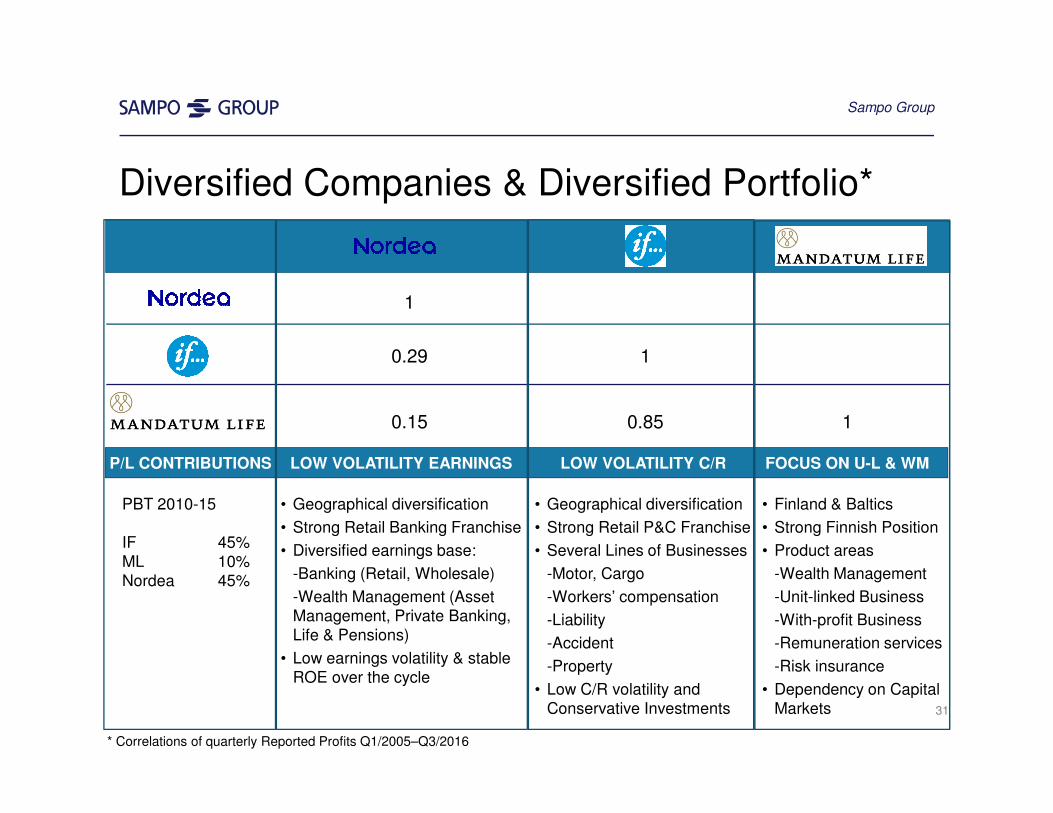
• Geographical diversification
• Strong Retail P&C Franchise
• Several Lines of Businesses
-Motor, Cargo
-Workersʼ compensation
-Liability
-Accident
-Property
• Low C/R volatility and Conservative Investments
Diversified Companies & Diversified Portfolio*
• Geographical diversification
• Strong Retail Banking Franchise
• Diversified earnings base:
-Banking (Retail, Wholesale)
-Wealth Management (AssetManagement, Private Banking, Life & Pensions)
• Low earnings volatility & stableROE over the cycle
• Finland & Baltics
• Strong Finnish Position
• Product areas
-Wealth Management
-Unit-linked Business
-With-profit Business
-Remuneration services
-Risk insurance
• Dependency on Capital Markets
* Correlations of quarterly Reported Profits Q1/2005–Q3/2016
PBT 2010-15
IF 45%ML 10%Nordea 45%
P/L CONTRIBUTIONS
31
LOW VOLATILITY EARNINGS LOW VOLATILITY C/R FOCUS ON U-L & WM
0.29
0.15
1
0.85 1
1
Sampo Group
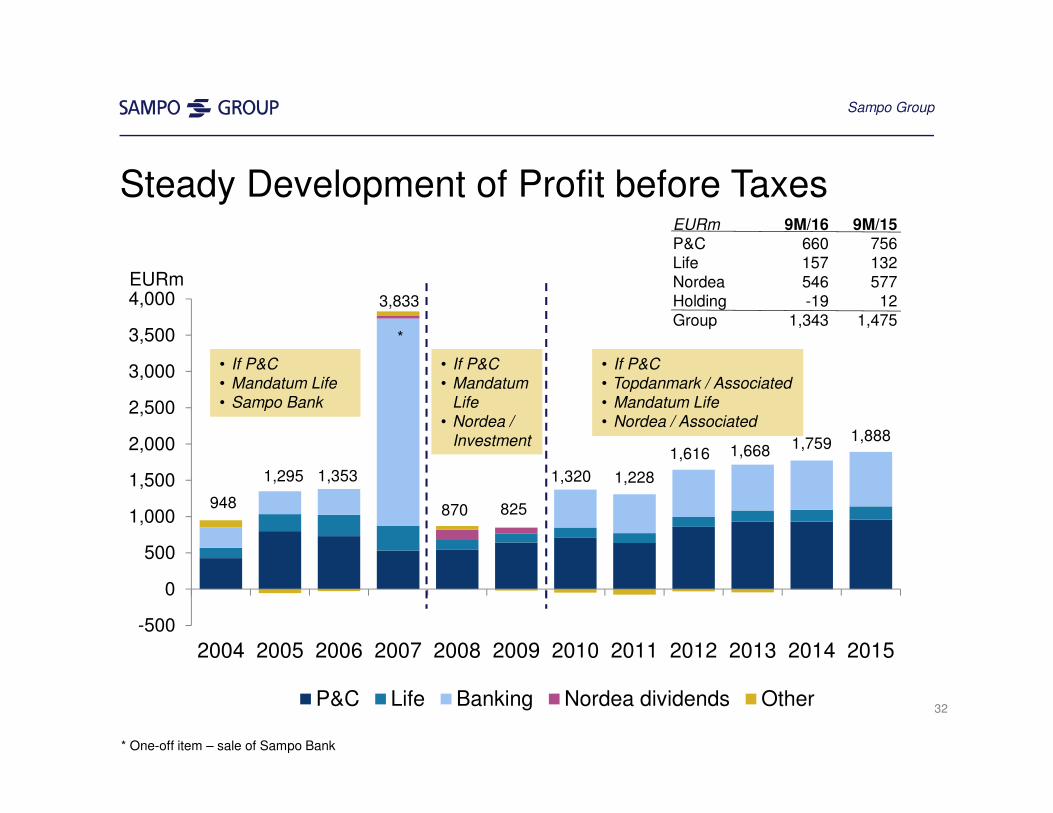
948
1,295 1,353
870 825
1,320 1,228
1,616 1,668 1,759 1,888
-500
0
500
1,000
1,500
2,000
2,500
3,000
3,500
4,000
2004 2005 2006 2007 2008 2009 2010 2011 2012 2013 2014 2015
P&C Life Banking Nordea dividends Other
Steady Development of Profit before Taxes
* One-off item – sale of Sampo Bank
EURm
*
• If P&C
• Mandatum Life
• Sampo Bank
• If P&C
• Mandatum
Life
• Nordea /
Investment
• If P&C
• Topdanmark / Associated
• Mandatum Life
• Nordea / Associated
Sampo Group
3,833
32
EURm 9M/16 9M/15P&C 660 756Life 157 132 Nordea 546 577Holding -19 12Group 1,343 1,475
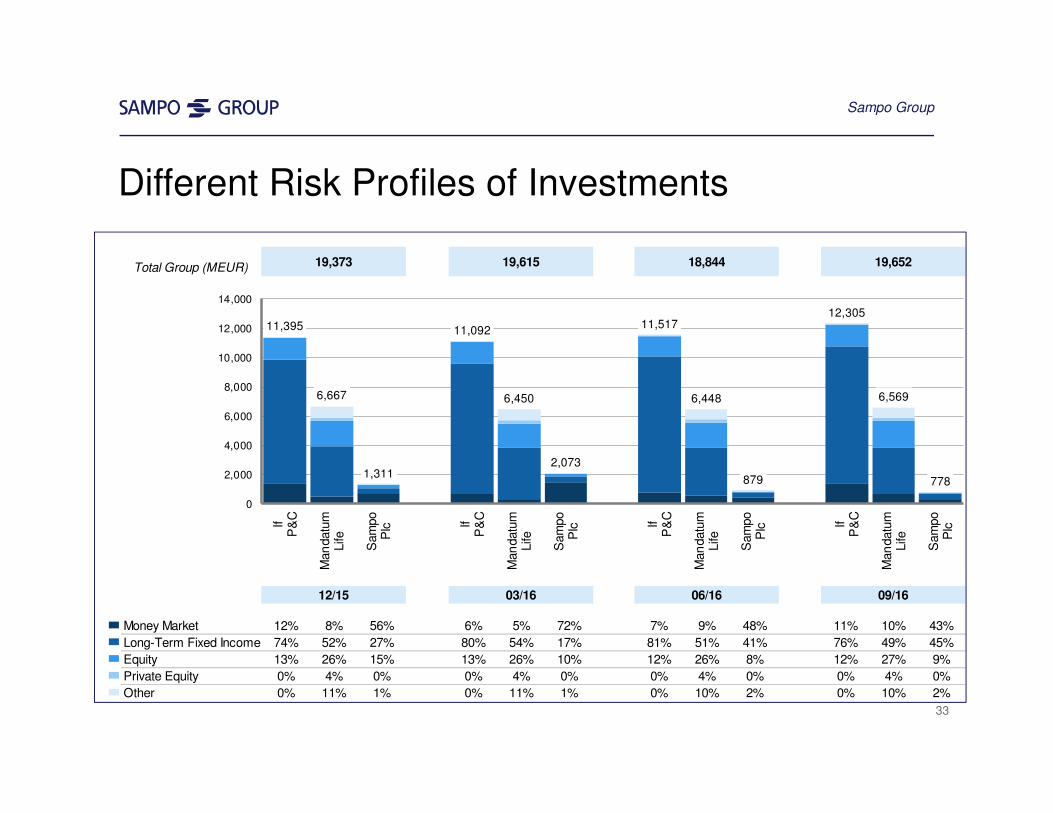
Different Risk Profiles of Investments
Sampo Group
33
Total Group (MEUR) 19,373 19,615 18,844 19,652
12/15 03/16 06/16 09/16
Money Market 12% 8% 56% 6% 5% 72% 7% 9% 48% 11% 10% 43%
Long-Term Fixed Income 74% 52% 27% 80% 54% 17% 81% 51% 41% 76% 49% 45%
Equity 13% 26% 15% 13% 26% 10% 12% 26% 8% 12% 27% 9%
Private Equity 0% 4% 0% 0% 4% 0% 0% 4% 0% 0% 4% 0%
Other 0% 11% 1% 0% 11% 1% 0% 10% 2% 0% 10% 2%
11,395
6,667
1,311
11,092
6,450
2,073
11,517
6,448
879
12,305
6,569
778
0
2,000
4,000
6,000
8,000
10,000
12,000
14,000
IfP
&C
Man
datu
mLife
Sam
po
Plc If
P&
C
Man
datu
mLife
Sam
po
Plc If
P&
C
Man
datu
mLife
Sam
po
Plc If
P&
C
Man
datu
mLife
Sam
po
Plc
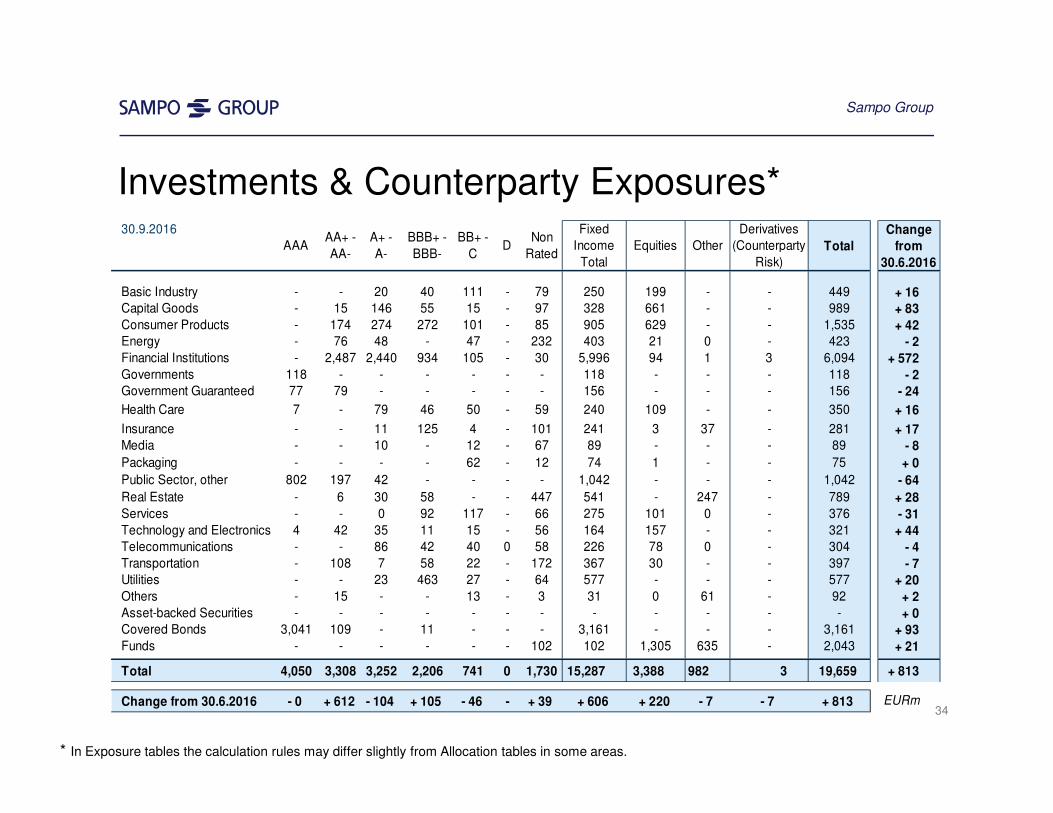
Investments & Counterparty Exposures*
* In Exposure tables the calculation rules may differ slightly from Allocation tables in some areas.
Sampo Group
34
30.9.2016
AAAAA+ -
AA-
A+ -
A-
BBB+ -
BBB-
BB+ -
CD
Non
Rated
Fixed
Income
Total
Equities Other
Derivatives
(Counterparty
Risk)Total
Change
from
30.6.2016
Basic Industry - - 20 40 111 - 79 250 199 - - 449 + 16
Capital Goods - 15 146 55 15 - 97 328 661 - - 989 + 83
Consumer Products - 174 274 272 101 - 85 905 629 - - 1,535 + 42
Energy - 76 48 - 47 - 232 403 21 0 - 423 - 2
Financial Institutions - 2,487 2,440 934 105 - 30 5,996 94 1 3 6,094 + 572
Governments 118 - - - - - - 118 - - - 118 - 2
Government Guaranteed 77 79 - - - - - 156 - - - 156 - 24
Health Care 7 - 79 46 50 - 59 240 109 - - 350 + 16
Insurance - - 11 125 4 - 101 241 3 37 - 281 + 17
Media - - 10 - 12 - 67 89 - - - 89 - 8
Packaging - - - - 62 - 12 74 1 - - 75 + 0
Public Sector, other 802 197 42 - - - - 1,042 - - - 1,042 - 64
Real Estate - 6 30 58 - - 447 541 - 247 - 789 + 28
Services - - 0 92 117 - 66 275 101 0 - 376 - 31
Technology and Electronics 4 42 35 11 15 - 56 164 157 - - 321 + 44
Telecommunications - - 86 42 40 0 58 226 78 0 - 304 - 4
Transportation - 108 7 58 22 - 172 367 30 - - 397 - 7
Utilities - - 23 463 27 - 64 577 - - - 577 + 20
Others - 15 - - 13 - 3 31 0 61 - 92 + 2
Asset-backed Securities - - - - - - - - - - - - + 0
Covered Bonds 3,041 109 - 11 - - - 3,161 - - - 3,161 + 93
Funds - - - - - - 102 102 1,305 635 - 2,043 + 21
Total 4,050 3,308 3,252 2,206 741 0 1,730 15,287 3,388 982 3 19,659 + 813
Change from 30.6.2016 - 0 + 612 - 104 + 105 - 46 - + 39 + 606 + 220 - 7 - 7 + 813 EURm
Principles of Capital Management
1. Sub-Groups are adequately capitalized to ensure normal business
operations
2. At Group level the following issues are managed/monitored
– direct risk concentrations
– correlations of the sub-groupsʼ profits
– sub-groups do not cross-capitalize each other, parent is the source of capital
– the funds generating capacity of the parent company is maintained by having low leverage and adequate liquidity buffers in normal situations
1 +2 => Sampo Group is well-capitalized
35
Sampo Group
EURm
743
1,4
41
278
875
182 205
1,5
63
3,9
98
0
500
1,000
1,500
2,000
2,500
3,000
3,500
4,000
1,4
33
1,0
14
99
477
182 3101,9
40
3,8
18
0
500
1,000
1,500
2,000
2,500
3,000
3,500
4,000
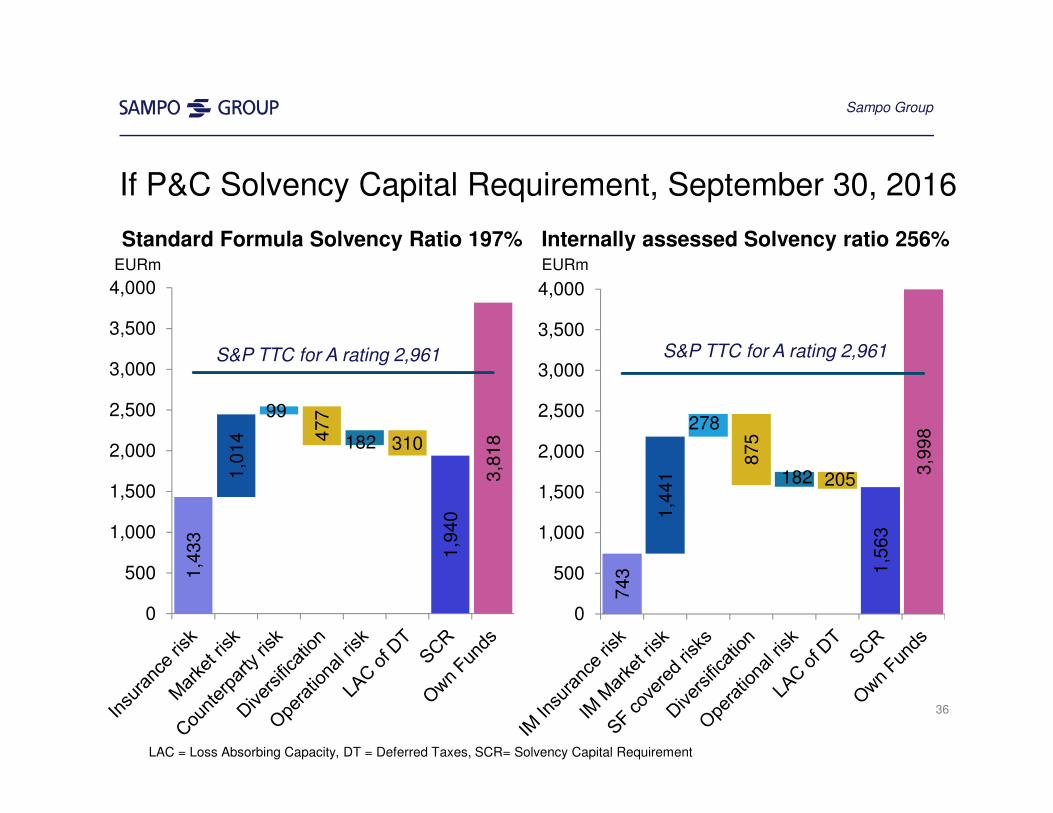
Internally assessed Solvency ratio 256%Standard Formula Solvency Ratio 197%
LAC = Loss Absorbing Capacity, DT = Deferred Taxes, SCR= Solvency Capital Requirement
EURm
36
S&P TTC for A rating 2,961 S&P TTC for A rating 2,961
If P&C Solvency Capital Requirement, September 30, 2016
Sampo Group
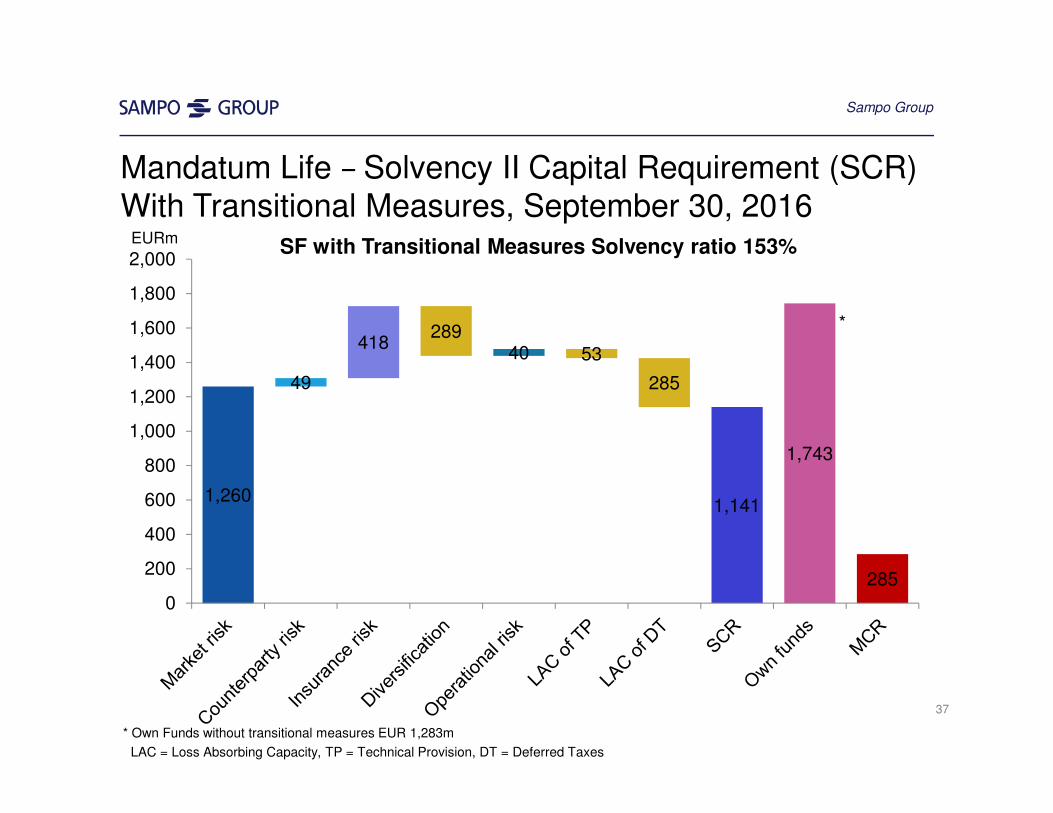
1,260
49
418289
40 53
285
1,141
285
1,743
0
200
400
600
800
1,000
1,200
1,400
1,600
1,800
2,000
Mandatum Life – Solvency II Capital Requirement (SCR)With Transitional Measures, September 30, 2016
LAC = Loss Absorbing Capacity, TP = Technical Provision, DT = Deferred Taxes
*
* Own Funds without transitional measures EUR 1,283m
EURmSF with Transitional Measures Solvency ratio 153%
37
Sampo Group
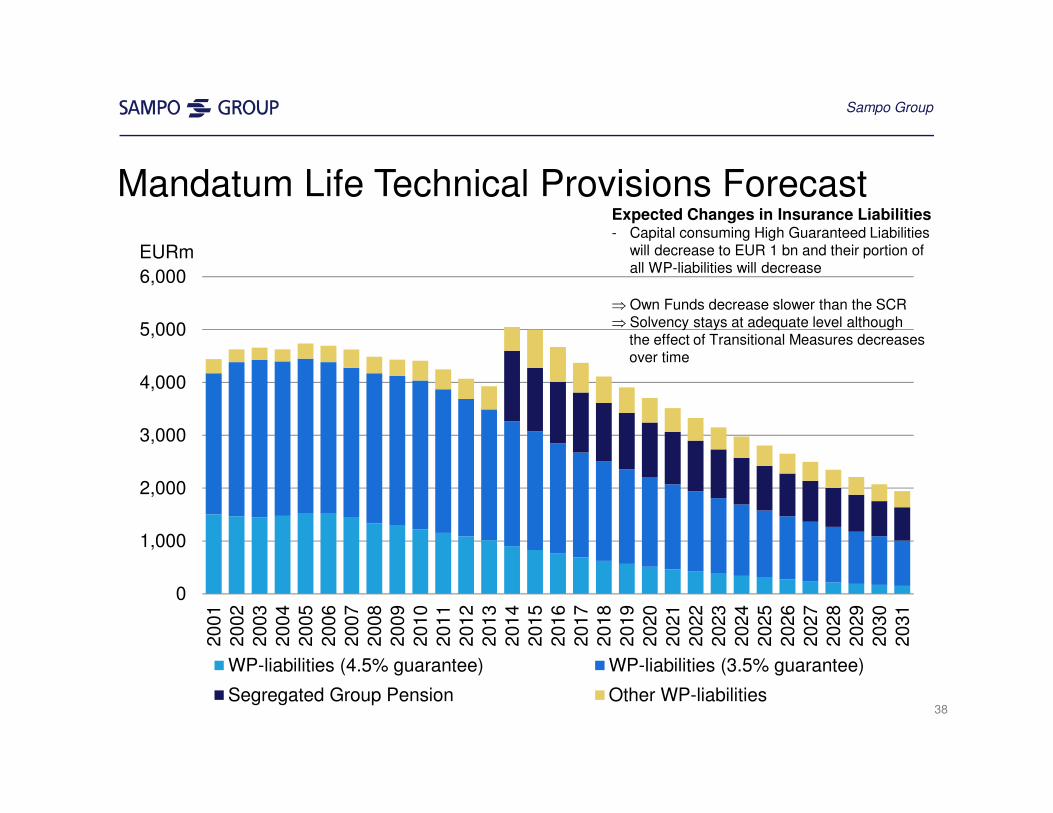
Mandatum Life Technical Provisions Forecast
38
EURm
0
1,000
2,000
3,000
4,000
5,000
6,000
2001
2002
2003
2004
2005
2006
2007
2008
2009
2010
2011
2012
2013
2014
2015
2016
2017
2018
2019
2020
2021
2022
2023
2024
2025
2026
2027
2028
2029
2030
2031
WP-liabilities (4.5% guarantee) WP-liabilities (3.5% guarantee)
Segregated Group Pension Other WP-liabilities
Expected Changes in Insurance Liabilities- Capital consuming High Guaranteed Liabilities
will decrease to EUR 1 bn and their portion of all WP-liabilities will decrease
⇒ Own Funds decrease slower than the SCR ⇒ Solvency stays at adequate level although
the effect of Transitional Measures decreasesover time
Sampo Group
Calculation of Sampo Group Solvency
Group Solvency Capital:
– Under FICOD rules, capital is Group equity with some additional items added or deducted (subordinated loans, deferred tax assets, planned dividends…)
– Under SII rules capital – referred to as Own funds (OF) – consists mainly of excess of assets
over liabilities
– Under normal circumstances Group OF by Solvency II and FICOD rules are close to each other.
SCR by Financial Conglomerate Rules:
– The Group’s SCR is the sum of the separate sub-group’s requirements (sectoral rules)
– Banking rules are applied for parent company
– No diversification effect between the companies
SCR by Solvency II rules:
– One capital requirement is calculated for the insurance group including the parent company Sampo plc, If P&C and Mandatum Life. This includes diversification effects and also capital requirement for the translation risk related to SEK denominated equity of If P&C
– Nordea’s and Topdanmark’s capital requirements are added to the requirement
– The SII SCR takes into account diversification only within the insurance group
=> Sampo Group Solvency Ratios are not comparable with most Insurance Groupsʼ solvency ratios39
Sampo Group
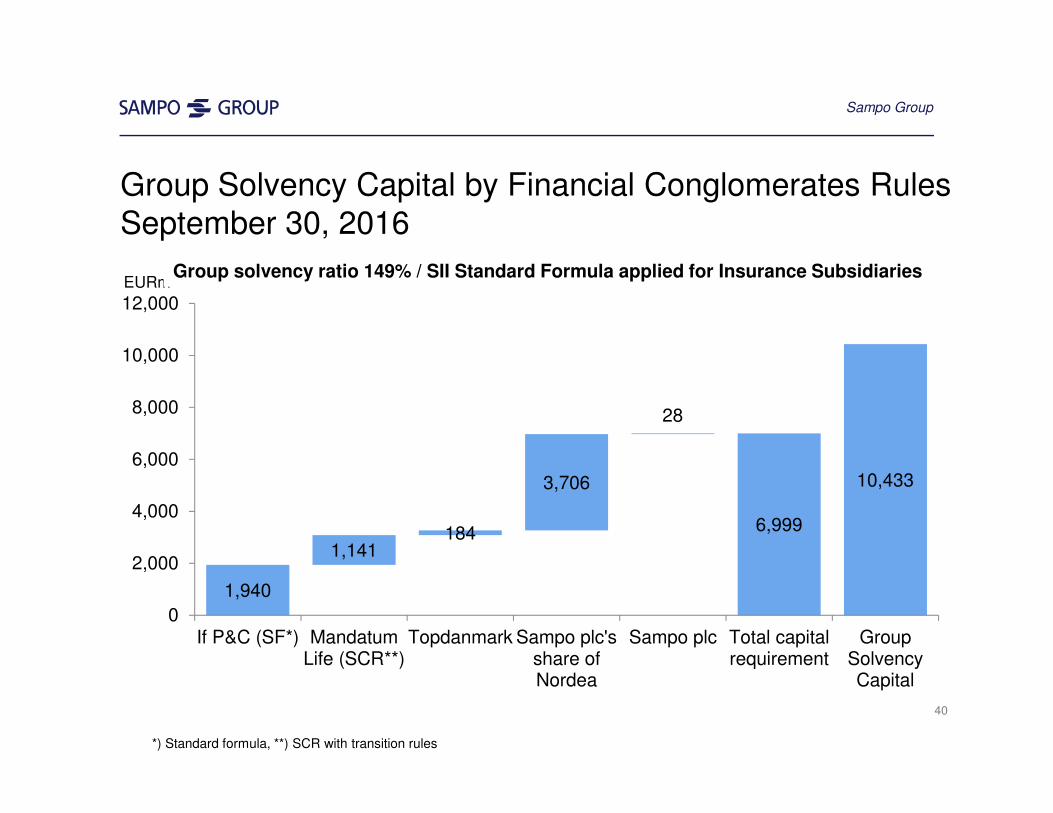
1,940
1,141184
3,706
28
6,999
10,433
0
2,000
4,000
6,000
8,000
10,000
12,000
If P&C (SF*) MandatumLife (SCR**)
Topdanmark Sampo plc'sshare ofNordea
Sampo plc Total capitalrequirement
GroupSolvencyCapital
Group Solvency Capital by Financial Conglomerates Rules September 30, 2016
EURmGroup solvency ratio 149% / SII Standard Formula applied for Insurance Subsidiaries
40
*) Standard formula, **) SCR with transition rules
Sampo Group

Mission Value Creation in the Nordic Financials 3-10
Sampo Group Current Issues 11-14If P&C The Leading Nordic P&C Insurer 15-22Mandatum Life A Finnish Financial Services Company 23-29Sampo Group A Diversified Business Portfolio with Strong Capitalization 30-40Sampo plc Parent Company with Capacity to Generate Funds 41-47
Appendix Separate Supplementary Information 48-59 41
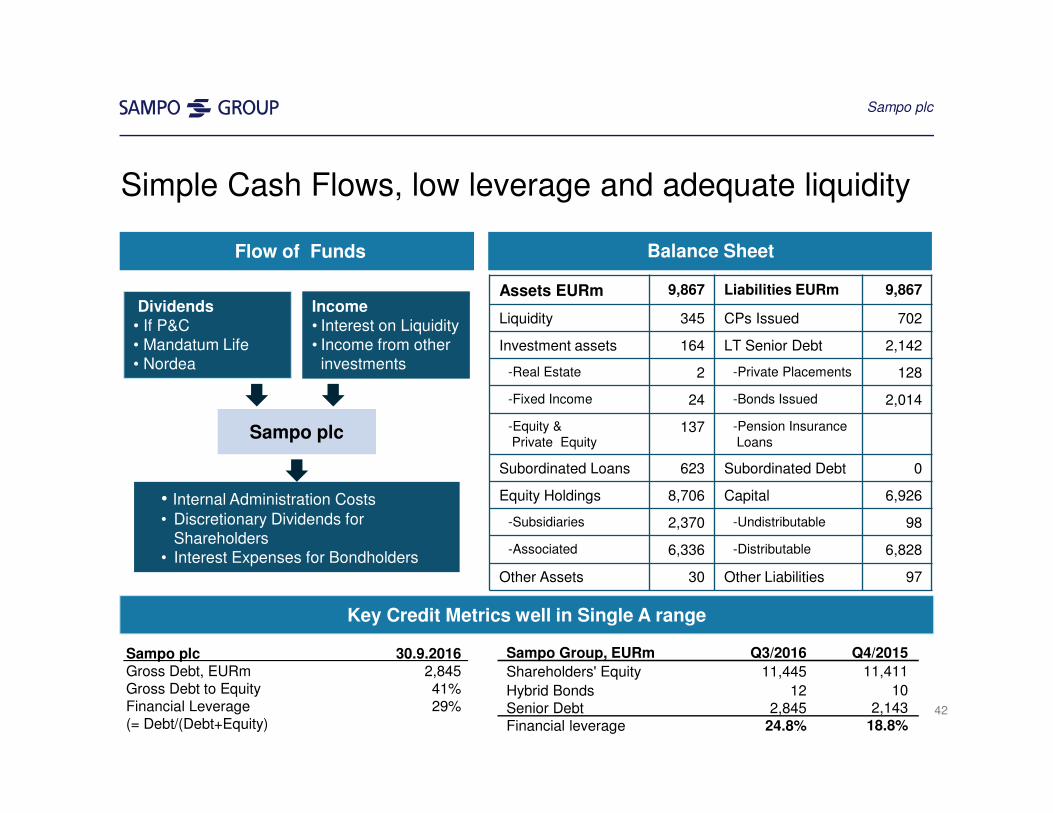
Simple Cash Flows, low leverage and adequate liquidity
Dividends • If P&C• Mandatum Life• Nordea
• Internal Administration Costs
• Discretionary Dividends for Shareholders
• Interest Expenses for Bondholders
Income• Interest on Liquidity • Income from other
investments
Sampo plc
Assets EURm 9,867 Liabilities EURm 9,867
Liquidity 345 CPs Issued 702
Investment assets 164 LT Senior Debt 2,142
-Real Estate 2 -Private Placements 128
-Fixed Income 24 -Bonds Issued 2,014
-Equity & Private Equity
137 -Pension Insurance Loans
Subordinated Loans 623 Subordinated Debt 0
Equity Holdings 8,706 Capital 6,926
-Subsidiaries 2,370 -Undistributable 98
-Associated 6,336 -Distributable 6,828
Other Assets 30 Other Liabilities 97
Flow of Funds Balance Sheet
Key Credit Metrics well in Single A range
Sampo plc 30.9.2016Gross Debt, EURm 2,845Gross Debt to Equity 41%Financial Leverage 29% (= Debt/(Debt+Equity)
Sampo Group, EURm Q3/2016 Q4/2015
Shareholders' Equity 11,445 11,411
Hybrid Bonds 12 10 Senior Debt 2,845 2,143Financial leverage 24.8% 18.8%
42
Sampo plc
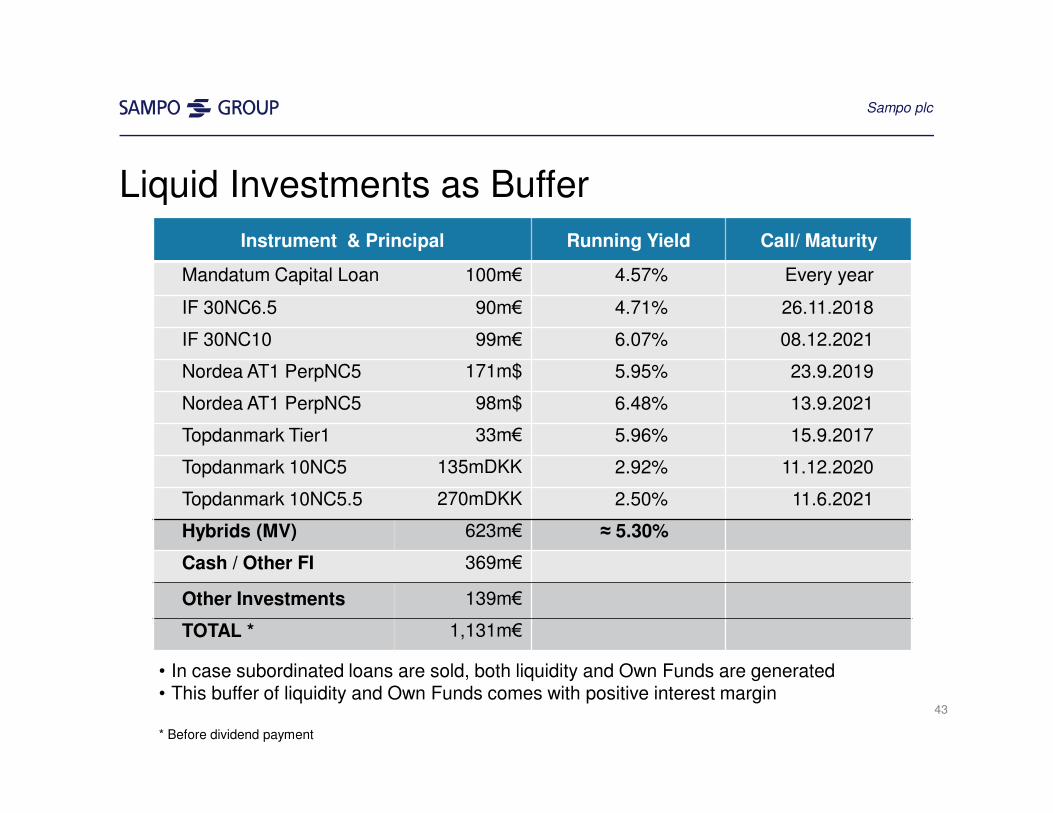
Liquid Investments as Buffer
43
Sampo plc
Instrument & Principal Running Yield Call/ Maturity
Mandatum Capital Loan 100m€ 4.57% Every year
IF 30NC6.5 90m€ 4.71% 26.11.2018
IF 30NC10 99m€ 6.07% 08.12.2021
Nordea AT1 PerpNC5 171m$ 5.95% 23.9.2019
Nordea AT1 PerpNC5 98m$ 6.48% 13.9.2021
Topdanmark Tier1 33m€ 5.96% 15.9.2017
Topdanmark 10NC5 135mDKK 2.92% 11.12.2020
Topdanmark 10NC5.5 270mDKK 2.50% 11.6.2021
Hybrids (MV) 623m€ ≈ 5.30%
Cash / Other FI 369m€
Other Investments 139m€
TOTAL * 1,131m€
• In case subordinated loans are sold, both liquidity and Own Funds are generated• This buffer of liquidity and Own Funds comes with positive interest margin
* Before dividend payment
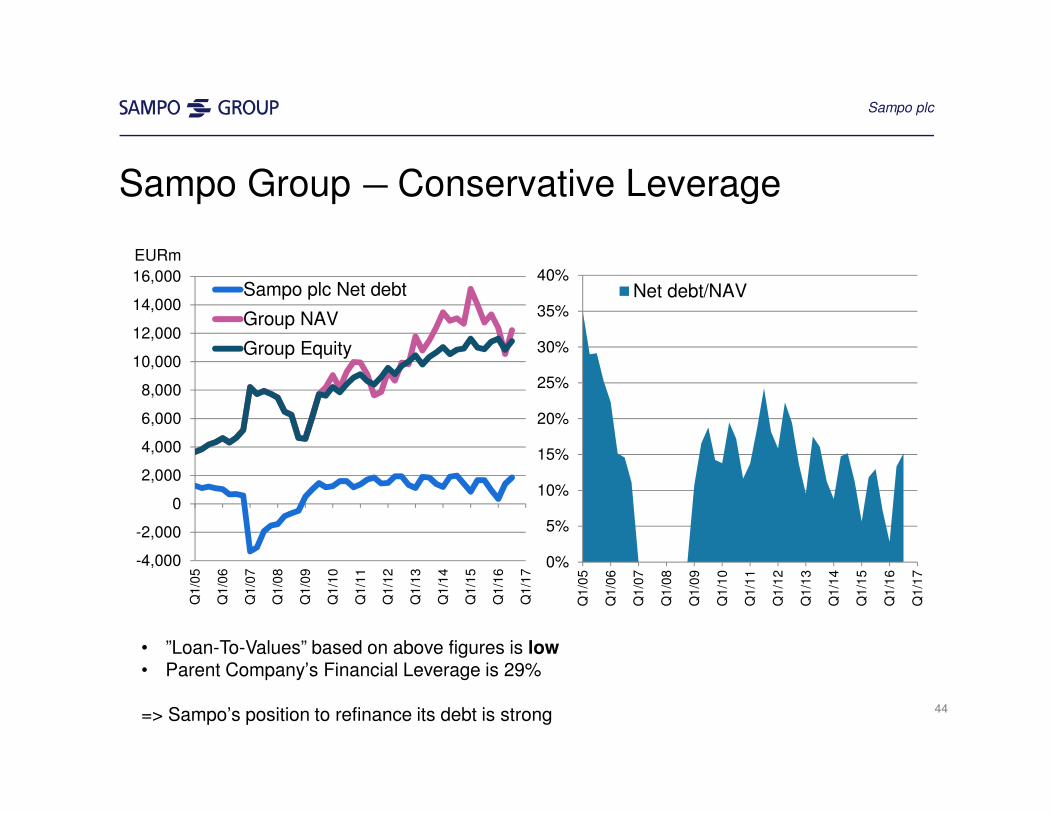
Sampo Group ―Conservative Leverage
-4,000
-2,000
0
2,000
4,000
6,000
8,000
10,000
12,000
14,000
16,000
Q1/0
5
Q1/0
6
Q1/0
7
Q1/0
8
Q1/0
9
Q1/1
0
Q1/1
1
Q1/1
2
Q1/1
3
Q1/1
4
Q1/1
5
Q1/1
6
Q1/1
7
Sampo plc Net debt
Group NAV
Group Equity
EURm
0%
5%
10%
15%
20%
25%
30%
35%
40%
Q1/0
5
Q1/0
6
Q1/0
7
Q1/0
8
Q1/0
9
Q1/1
0
Q1/1
1
Q1/1
2
Q1/1
3
Q1/1
4
Q1/1
5
Q1/1
6
Q1/1
7
Net debt/NAV
44
• ”Loan-To-Values” based on above figures is low• Parent Companyʼs Financial Leverage is 29%
=> Sampoʼs position to refinance its debt is strong
Sampo plc
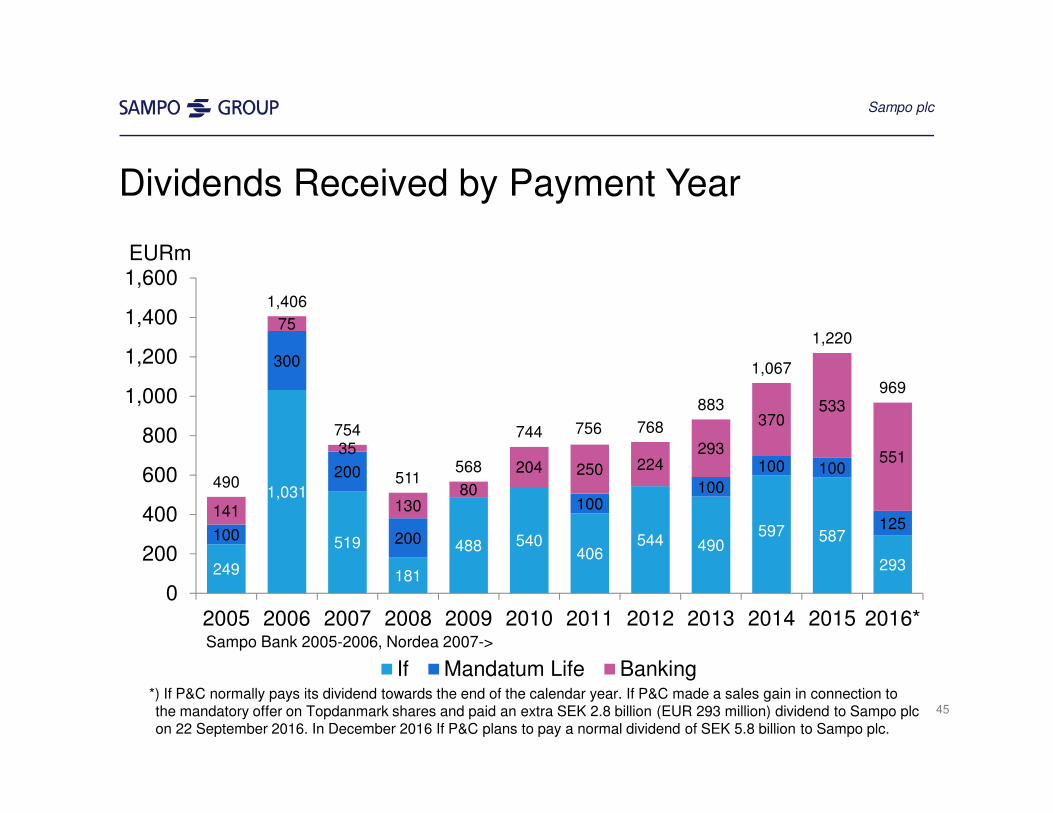
Dividends Received by Payment Year
EURm
249
1,031
519
181
488 540406
544 490597 587
293
100
300
200
200
100100
100 100
125141
75
35
13080
204 250 224293
370533
551
490
1,406
754
511568
744 756 768
883
1,067
1,220
969
0
200
400
600
800
1,000
1,200
1,400
1,600
2005 2006 2007 2008 2009 2010 2011 2012 2013 2014 2015 2016*
If Mandatum Life Banking
Sampo plc
Sampo Bank 2005-2006, Nordea 2007->
45
*) If P&C normally pays its dividend towards the end of the calendar year. If P&C made a sales gain in connection to the mandatory offer on Topdanmark shares and paid an extra SEK 2.8 billion (EUR 293 million) dividend to Sampo plc on 22 September 2016. In December 2016 If P&C plans to pay a normal dividend of SEK 5.8 billion to Sampo plc.
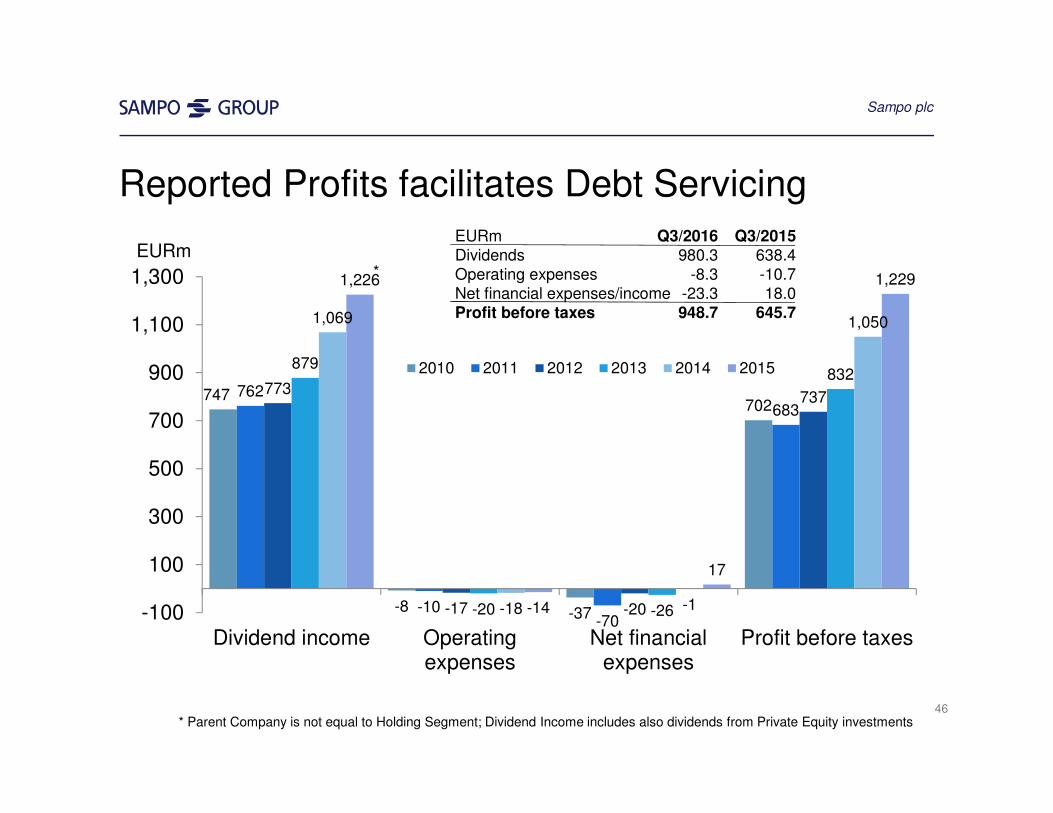
Reported Profits facilitates Debt Servicing
* Parent Company is not equal to Holding Segment; Dividend Income includes also dividends from Private Equity investments
747
-8 -37
702762
-10-70
683
773
-17 -20
737
879
-20 -26
832
1,069
-18 -1
1,050
1,226
-14
17
1,229
-100
100
300
500
700
900
1,100
1,300
Dividend income Operatingexpenses
Net financialexpenses
Profit before taxes
2010 2011 2012 2013 2014 2015
*
EURm
Sampo plc
46
EURm Q3/2016 Q3/2015Dividends 980.3 638.4Operating expenses -8.3 -10.7Net financial expenses/income -23.3 18.0Profit before taxes 948.7 645.7
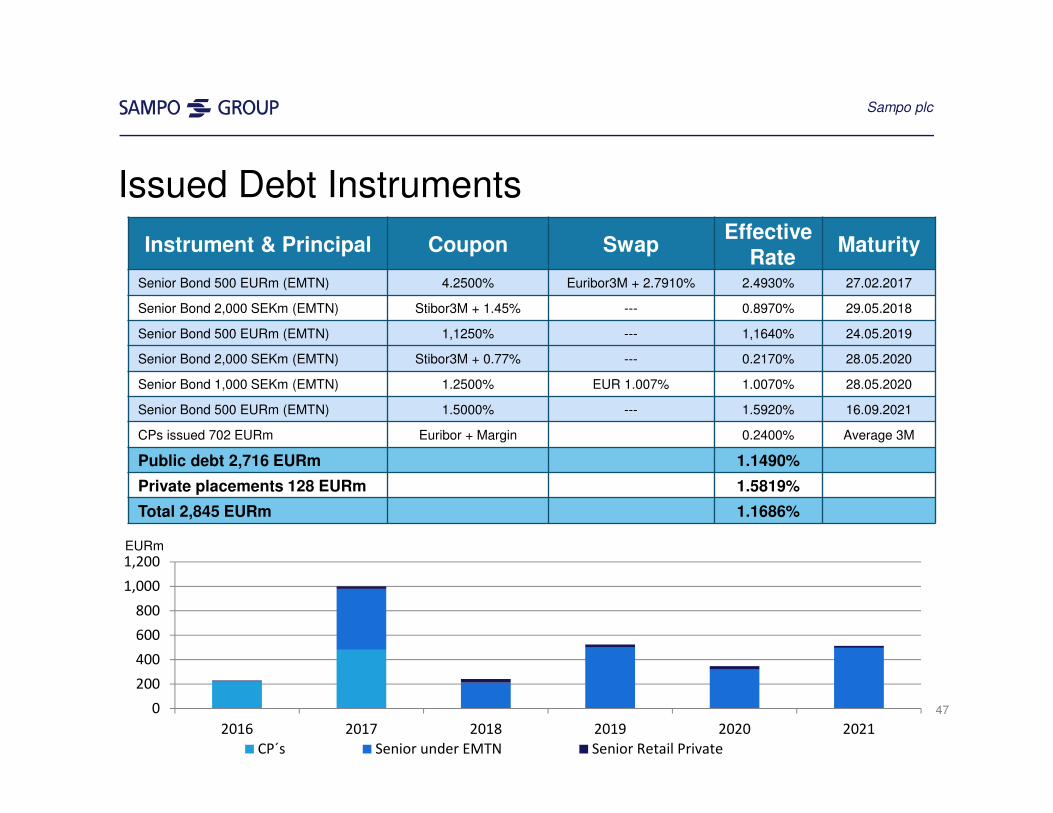
Issued Debt Instruments
Sampo plc
EURm
Instrument & Principal Coupon SwapEffective
RateMaturity
Senior Bond 500 EURm (EMTN) 4.2500% Euribor3M + 2.7910% 2.4930% 27.02.2017
Senior Bond 2,000 SEKm (EMTN) Stibor3M + 1.45% --- 0.8970% 29.05.2018
Senior Bond 500 EURm (EMTN) 1,1250% --- 1,1640% 24.05.2019
Senior Bond 2,000 SEKm (EMTN) Stibor3M + 0.77% --- 0.2170% 28.05.2020
Senior Bond 1,000 SEKm (EMTN) 1.2500% EUR 1.007% 1.0070% 28.05.2020
Senior Bond 500 EURm (EMTN) 1.5000% --- 1.5920% 16.09.2021
CPs issued 702 EURm Euribor + Margin 0.2400% Average 3M
Public debt 2,716 EURm 1.1490%
Private placements 128 EURm 1.5819%
Total 2,845 EURm 1.1686%
470
200
400
600
800
1,000
1,200
2016 2017 2018 2019 2020 2021
CP´s Senior under EMTN Senior Retail Private
48
Appendix Separate Supplementary Information 48-59
Sampo Group’s Outlook for 2016
Appendix
49
• Sampo Group’s business areas are expected to report good operating results for 2016.
• However, the mark-to-market results are, particularly in life insurance, highly dependent on capital market developments. The continuing low interest rate level also creates a challenging environment for reinvestment in fixed income instruments.
• The P&C insurance operations are expected to reach a combined ratio
of 86-88 per cent excluding the release from the Swedish MTPL reserves.
• Nordea’s contribution to the Group’s profit is expected to be significant.
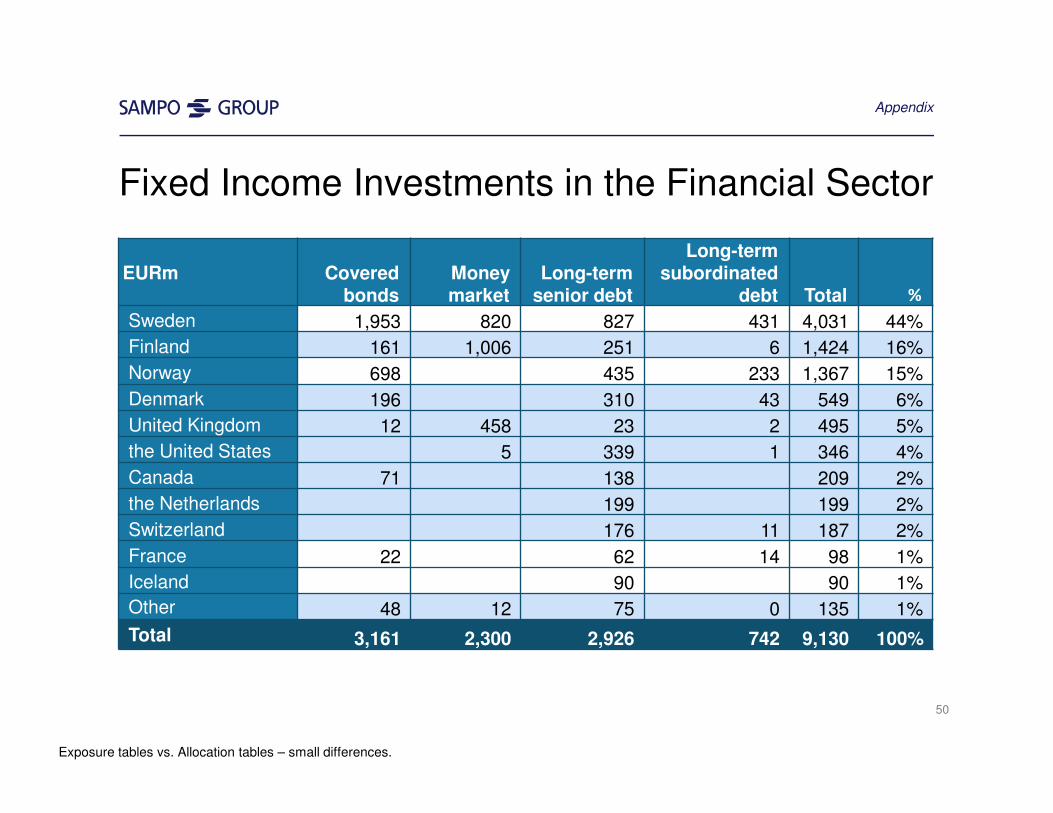
Fixed Income Investments in the Financial Sector
Exposure tables vs. Allocation tables – small differences.
EURm Covered bonds
Money market
Long-term senior debt
Long-term subordinated
debt Total %
Sweden 1,953 820 827 431 4,031 44%
Finland 161 1,006 251 6 1,424 16%
Norway 698 435 233 1,367 15%
Denmark 196 310 43 549 6%
United Kingdom 12 458 23 2 495 5%
the United States 5 339 1 346 4%
Canada 71 138 209 2%
the Netherlands 199 199 2%
Switzerland 176 11 187 2%
France 22 62 14 98 1%
Iceland 90 90 1%
Other 48 12 75 0 135 1%
Total 3,161 2,300 2,926 742 9,130 100%
50
Appendix
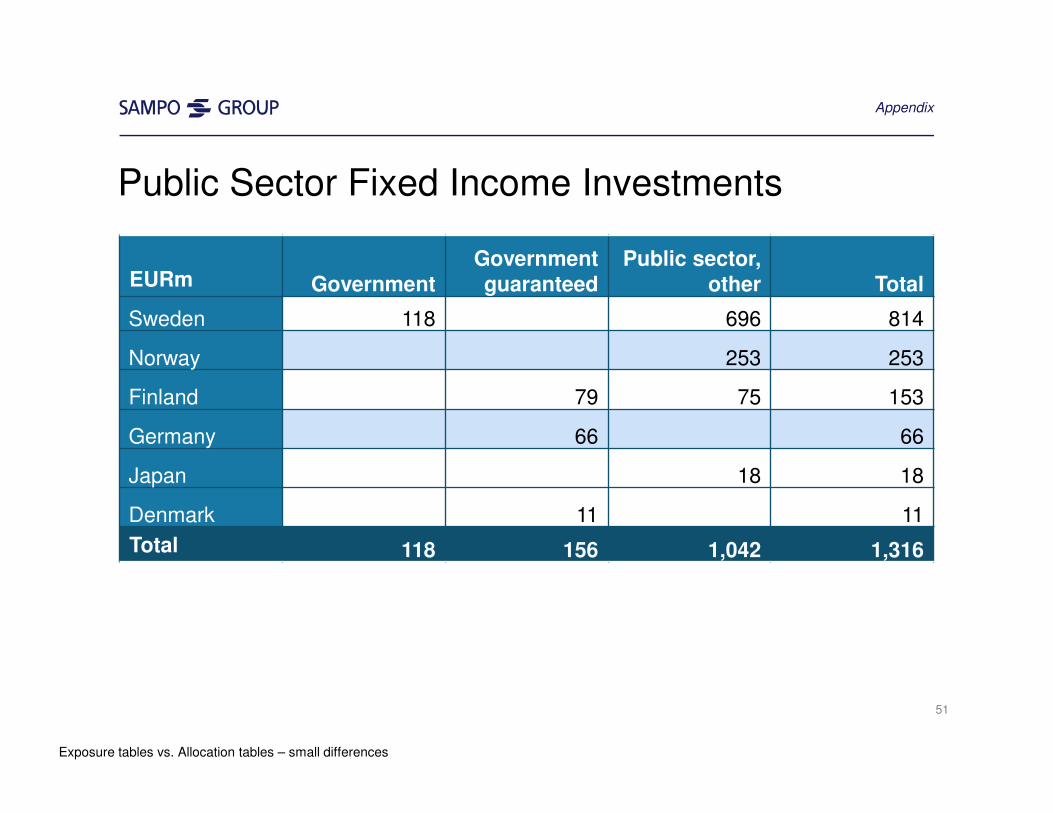
Public Sector Fixed Income Investments
EURm Government
Government
guaranteed
Public sector,
other Total
Sweden 118 696 814
Norway 253 253
Finland 79 75 153
Germany 66 66
Japan 18 18
Denmark 11 11
Total 118 156 1,042 1,316
Exposure tables vs. Allocation tables – small differences
51
Appendix
Principles of Investment Management
• Company specific needs form the basis for all investments
– Liabilities intensively analysed and modelled.
– Regulatory requirements.
• Strategy
– Absolute Return targets taking into account the liabilities and general
business targets.
– Direct Investments into Nordic countries mainly, outside Nordics mainly Funds.
– No diversification for the sake of diversification.
• Centrally Managed
– Sampo plc Chief Investment Officer is responsible for all investments, all portfolio managers have a direct reporting line to him.
– Common infrastructure for investment administration and reporting.
– Investment strategies coordinated and streamlined, no overlapping activities
to prevent Group-wide concentrations.
Appendix
52
Risk Management Principles
• Scope
– Sampo’s Board of Directors requires that all activities involving the exposure
of any Sampo Group company to risks, as well as activities controlling those
risks, are arranged to comply with these general guidelines and related
instructions as well as with applicable legislation and regulations.
– The Board of Directors will supervise the risk taking and risk control activities.
– The Principles apply to all Sampo Group companies.
• The Key Objectives
– Balance between risks, capital and earnings
– Cost efficiency and high quality processes
– Strategic and operational flexibility
• The Central Tasks
– Identification of risks
– Assessment of required capital
– Pricing of risks
– Managing risk exposures, capital positions and operative processes
– Measuring and reporting risks
Appendix
For more detailed description of Sampo Group´s Risk Management Principles, see http://www.sampo.com/governance/internal-control/risk-management/
53
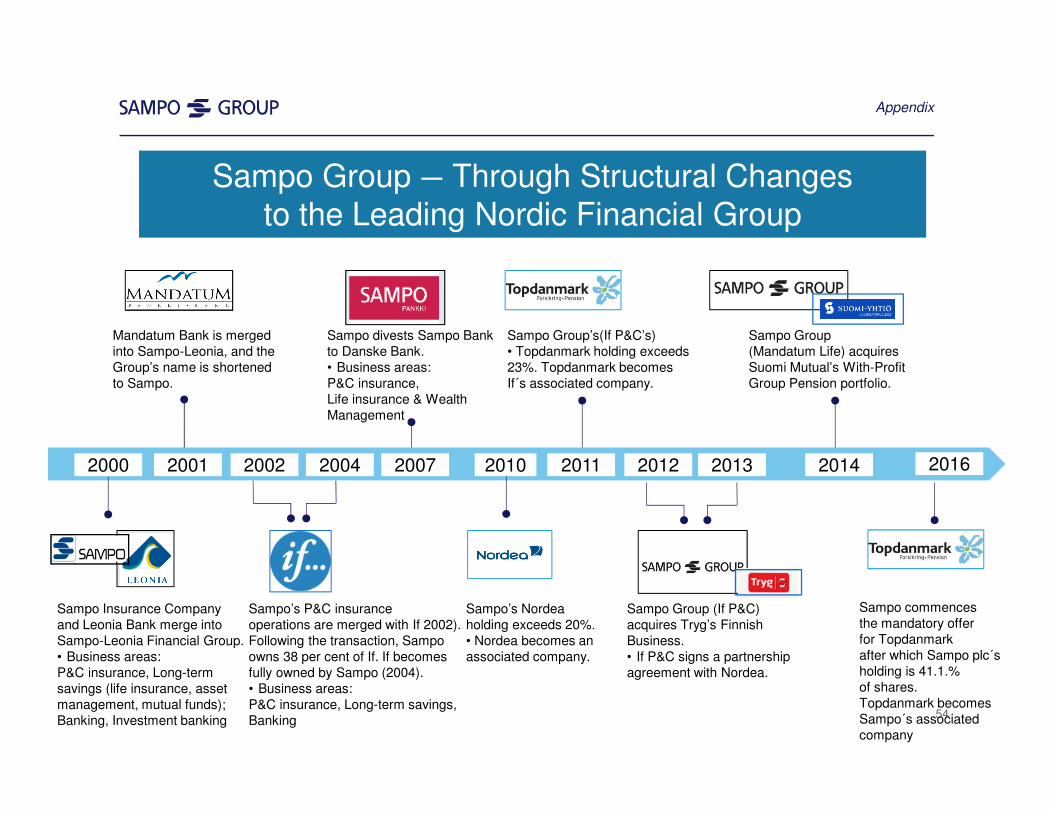
Sampo’s P&C insurance operations are merged with If 2002). Following the transaction, Sampoowns 38 per cent of If. If becomes fully owned by Sampo (2004).• Business areas:P&C insurance, Long-term savings,Banking
Sampo Insurance Companyand Leonia Bank merge into Sampo-Leonia Financial Group. • Business areas: P&C insurance, Long-term savings (life insurance, asset management, mutual funds); Banking, Investment banking
Mandatum Bank is merged into Sampo-Leonia, and the Group’s name is shortenedto Sampo.
Sampo divests Sampo Bank to Danske Bank.• Business areas: P&C insurance, Life insurance & Wealth Management
Sampo’s Nordea holding exceeds 20%. • Nordea becomes an associated company.
20072004200220012000 2010 2011
Sampo Group’s(If P&Cʼs) • Topdanmark holding exceeds 23%. Topdanmark becomes If´s associated company.
2012
Sampo Group (If P&C)acquires Tryg’s FinnishBusiness.• If P&C signs a partnership agreement with Nordea.
Sampo Group ― Through Structural Changes to the Leading Nordic Financial Group
2013 2014
Sampo Group(Mandatum Life) acquires Suomi Mutualʼs With-ProfitGroup Pension portfolio.
Appendix
2016
54
Sampo commencesthe mandatory offerfor Topdanmarkafter which Sampo plc´sholding is 41.1.% of shares.Topdanmark becomesSampo´s associatedcompany
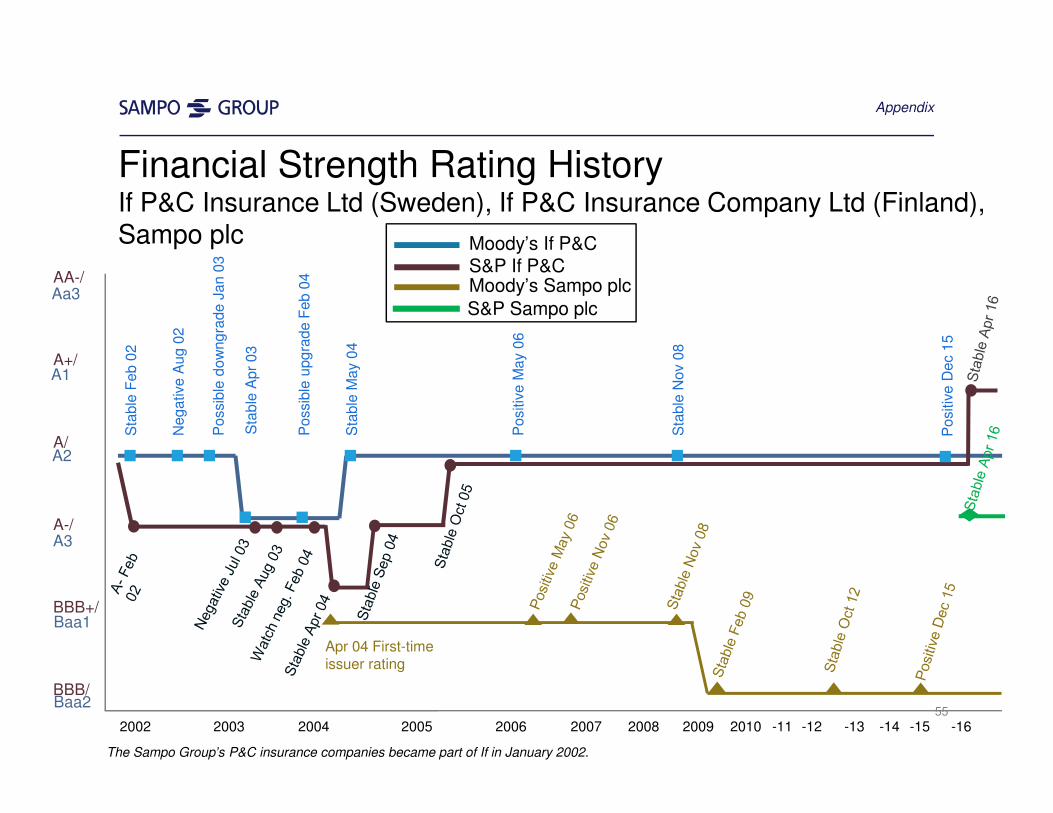
Financial Strength Rating HistoryIf P&C Insurance Ltd (Sweden), If P&C Insurance Company Ltd (Finland),Sampo plc
The Sampo Groupʼs P&C insurance companies became part of If in January 2002.
AA-/
A+/
A/
A-/
BBB+/
BBB/
2002 2003 2004 2005 2006 2007 2008 2009 2010 -11 -12 -13 -14 -15 -16
Possib
le d
ow
ng
rade J
an 0
3
Sta
ble
Feb 0
2
Neg
ative
Aug
02
Sta
ble
Apr
03
Possib
le u
pg
rade F
eb 0
4
Sta
ble
May
04
Positiv
e M
ay
06
Sta
ble
Nov
08
Apr 04 First-time issuer rating
Appendix
Aa3
A1
A2
A3
Baa1
Baa255
Positiv
e D
ec 1
5
Moodyʼs If P&CS&P If P&CMoodyʼs Sampo plc
S&P Sampo plc
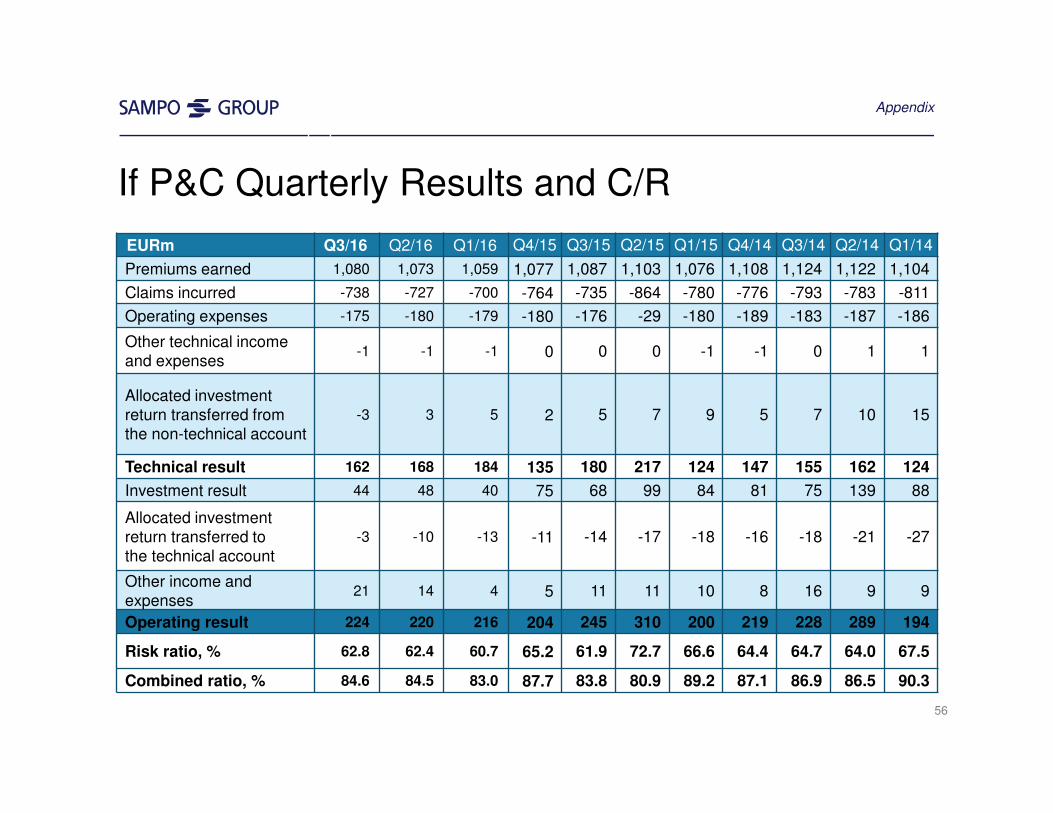
If P&C Quarterly Results and C/R
EURm Q3/16 Q2/16 Q1/16 Q4/15 Q3/15 Q2/15 Q1/15 Q4/14 Q3/14 Q2/14 Q1/14
Premiums earned 1,080 1,073 1,059 1,077 1,087 1,103 1,076 1,108 1,124 1,122 1,104
Claims incurred -738 -727 -700 -764 -735 -864 -780 -776 -793 -783 -811
Operating expenses -175 -180 -179 -180 -176 -29 -180 -189 -183 -187 -186
Other technical income and expenses
-1 -1 -1 0 0 0 -1 -1 0 1 1
Allocated investment return transferred from the non-technical account
-3 3 5 2 5 7 9 5 7 10 15
Technical result 162 168 184 135 180 217 124 147 155 162 124
Investment result 44 48 40 75 68 99 84 81 75 139 88
Allocated investment return transferred tothe technical account
-3 -10 -13 -11 -14 -17 -18 -16 -18 -21 -27
Other income and expenses
21 14 4 5 11 11 10 8 16 9 9
Operating result 224 220 216 204 245 310 200 219 228 289 194
Risk ratio, % 62.8 62.4 60.7 65.2 61.9 72.7 66.6 64.4 64.7 64.0 67.5
Combined ratio, % 84.6 84.5 83.0 87.7 83.8 80.9 89.2 87.1 86.9 86.5 90.3
Appendix
56
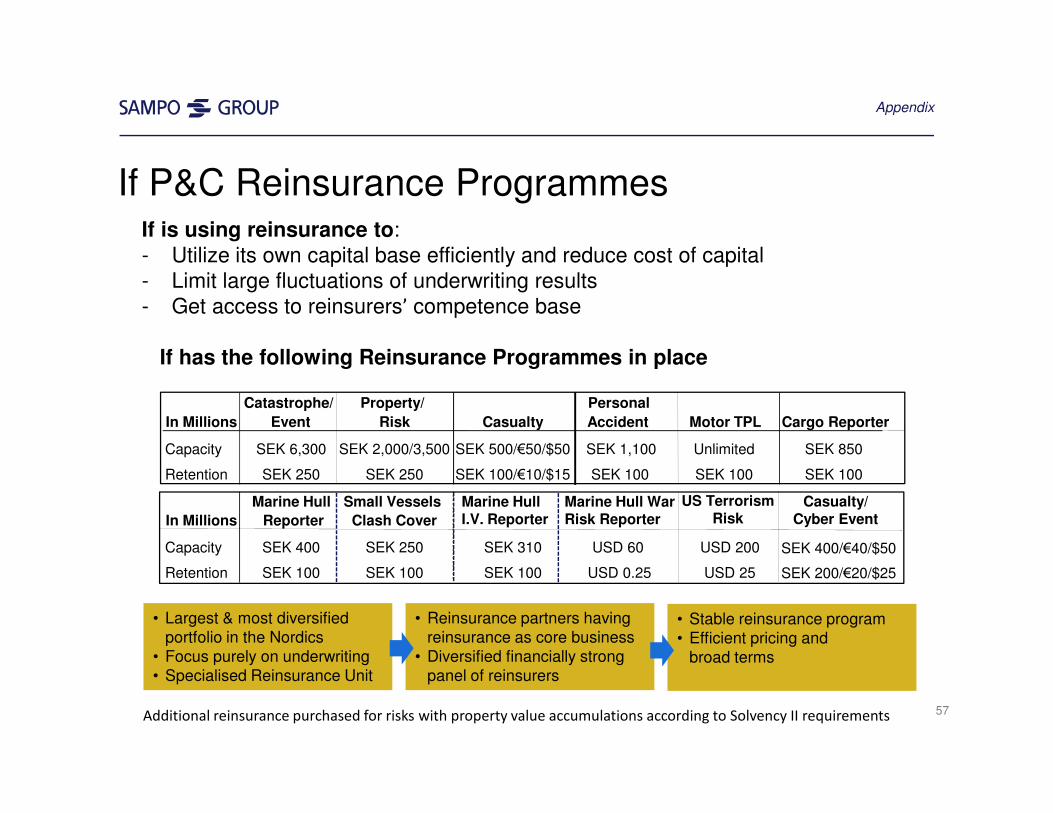
If P&C Reinsurance ProgrammesIf is using reinsurance to:- Utilize its own capital base efficiently and reduce cost of capital- Limit large fluctuations of underwriting results- Get access to reinsurers’ competence base
If has the following Reinsurance Programmes in place
• Largest & most diversifiedportfolio in the Nordics
• Focus purely on underwriting• Specialised Reinsurance Unit
• Reinsurance partners having reinsurance as core business
• Diversified financially strong panel of reinsurers
• Stable reinsurance program • Efficient pricing and
broad terms
In Millions
Catastrophe/
Event
Property/
Risk Casualty
Personal
Accident Motor TPL Cargo Reporter
Capacity SEK 6,300 SEK 2,000/3,500 SEK 500/€50/$50 SEK 1,100 Unlimited SEK 850
Retention SEK 250 SEK 250 SEK 100/€10/$15 SEK 100 SEK 100 SEK 100
57
In Millions
Marine Hull
Reporter
Small Vessels
Clash Cover
Marine Hull I.V. Reporter
Marine Hull WarRisk Reporter
US TerrorismRisk
Capacity SEK 400 SEK 250 SEK 310 USD 60 USD 200
Retention SEK 100 SEK 100 SEK 100 USD 0.25 USD 25
Casualty/Cyber Event
SEK 400/€40/$50
SEK 200/€20/$25
Additional reinsurance purchased for risks with property value accumulations according to Solvency II requirements
Appendix
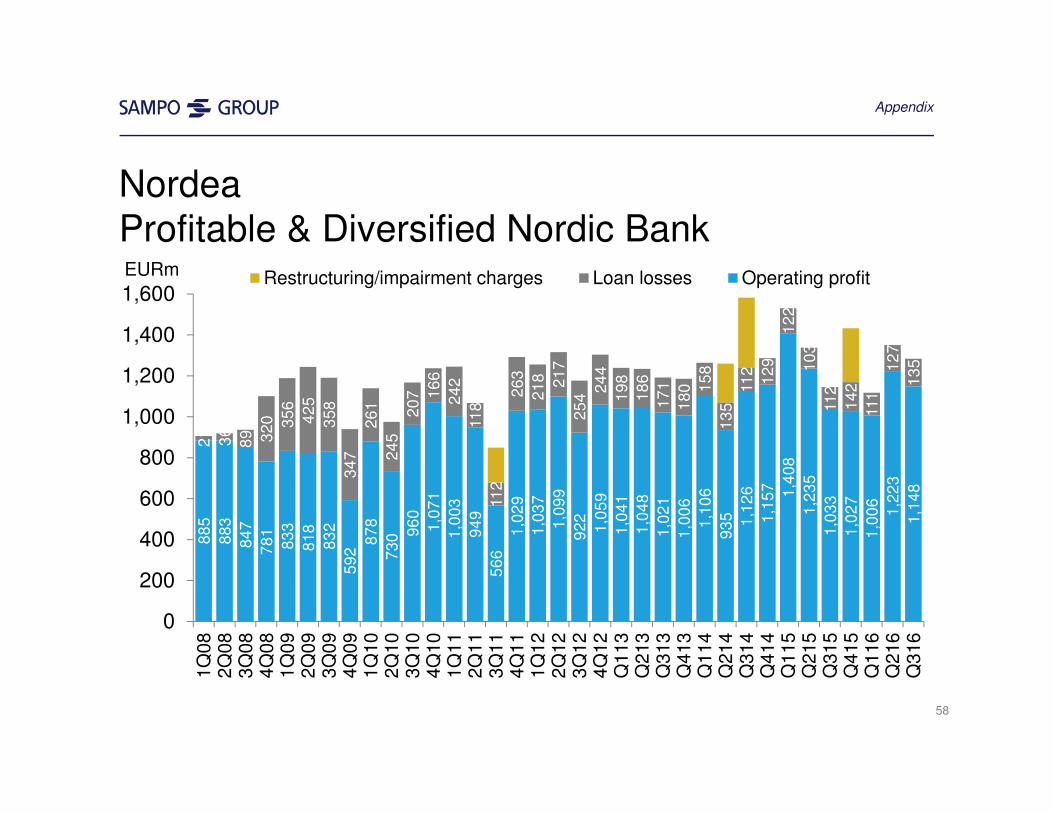
NordeaProfitable & Diversified Nordic Bank
88
5
88
3
84
7
78
1
83
3
81
8
83
2
59
2
87
8
73
0 96
0
1,0
71
1,0
03
94
9
56
6
1,0
29
1,0
37
1,0
99
92
2
1,0
59
1,0
41
1,0
48
1,0
21
1,0
06
1,1
06
93
5 1,1
26
1,1
57 1,4
08
1,2
35
1,0
33
1,0
27
1,0
06
1,2
23
1,1
48
21 36
89 32
0 35
6
42
5
35
8
34
7
26
1
24
5
20
7 16
6
24
2
118
112
26
3
21
8 21
7
25
4
24
4
19
8
18
6
17
1
18
0 15
8
13
5
112
12
9
12
2
10
3
112
14
2
111
12
7
13
5
0
200
400
600
800
1,000
1,200
1,400
1,600
1Q
08
2Q
08
3Q
08
4Q
08
1Q
09
2Q
09
3Q
09
4Q
09
1Q
10
2Q
10
3Q
10
4Q
10
1Q
11
2Q
11
3Q
11
4Q
11
1Q
12
2Q
12
3Q
12
4Q
12
Q113
Q213
Q313
Q413
Q114
Q214
Q314
Q414
Q115
Q215
Q315
Q415
Q116
Q216
Q316
EURm Restructuring/impairment charges Loan losses Operating profit
Appendix
58
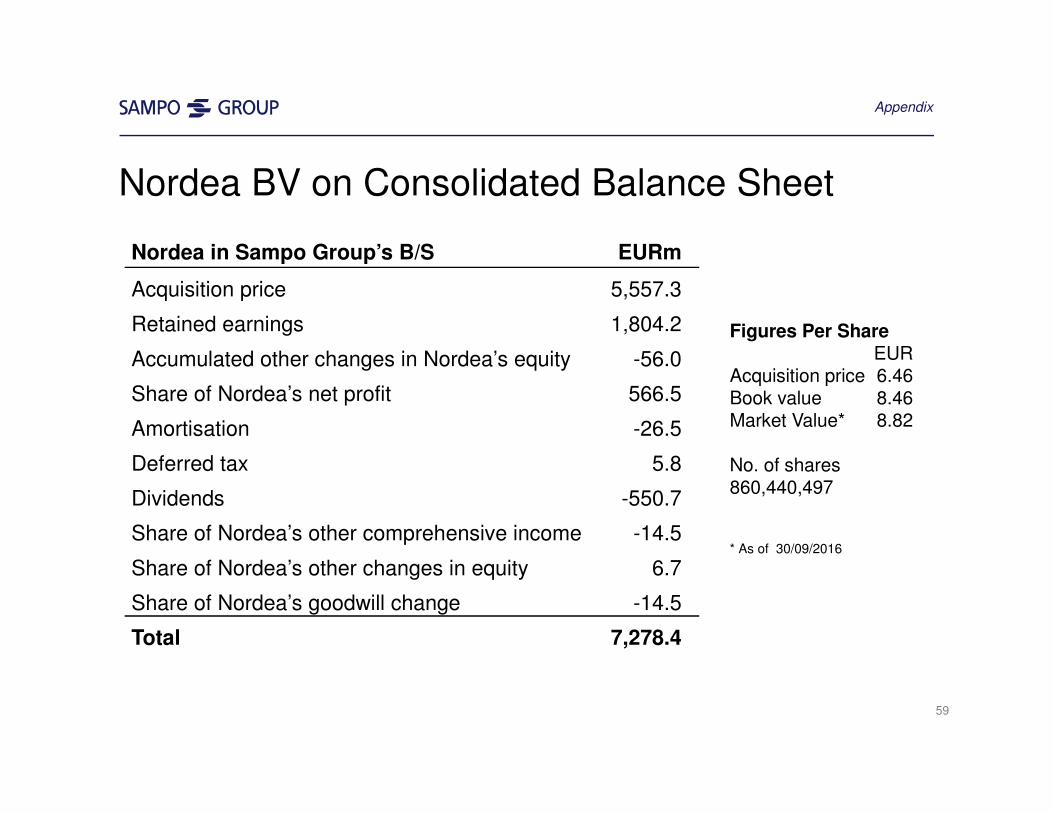
Nordea BV on Consolidated Balance Sheet
Nordea in Sampo Group’s B/S EURm
Acquisition price 5,557.3
Retained earnings 1,804.2
Accumulated other changes in Nordea’s equity -56.0
Share of Nordea’s net profit 566.5
Amortisation -26.5
Deferred tax 5.8
Dividends -550.7
Share of Nordea’s other comprehensive income -14.5
Share of Nordea’s other changes in equity 6.7
Share of Nordea’s goodwill change -14.5
Total 7,278.4
Figures Per ShareEUR
Acquisition price 6.46Book value 8.46Market Value* 8.82
No. of shares860,440,497
* As of 30/09/2016
Appendix
59