PSY 307 – Statistics for the Behavioral Sciences Chapter 20 – Tests for Ranked Data, Choosing...
21
PSY 307 – Statistics for the Behavioral Sciences Chapter 20 – Tests for Ranked Data, Choosing Statistical Tests
-
Upload
chester-mccormick -
Category
Documents
-
view
221 -
download
0
Transcript of PSY 307 – Statistics for the Behavioral Sciences Chapter 20 – Tests for Ranked Data, Choosing...

PSY 307 – Statistics for the Behavioral Sciences
Chapter 20 – Tests for Ranked Data, Choosing Statistical Tests
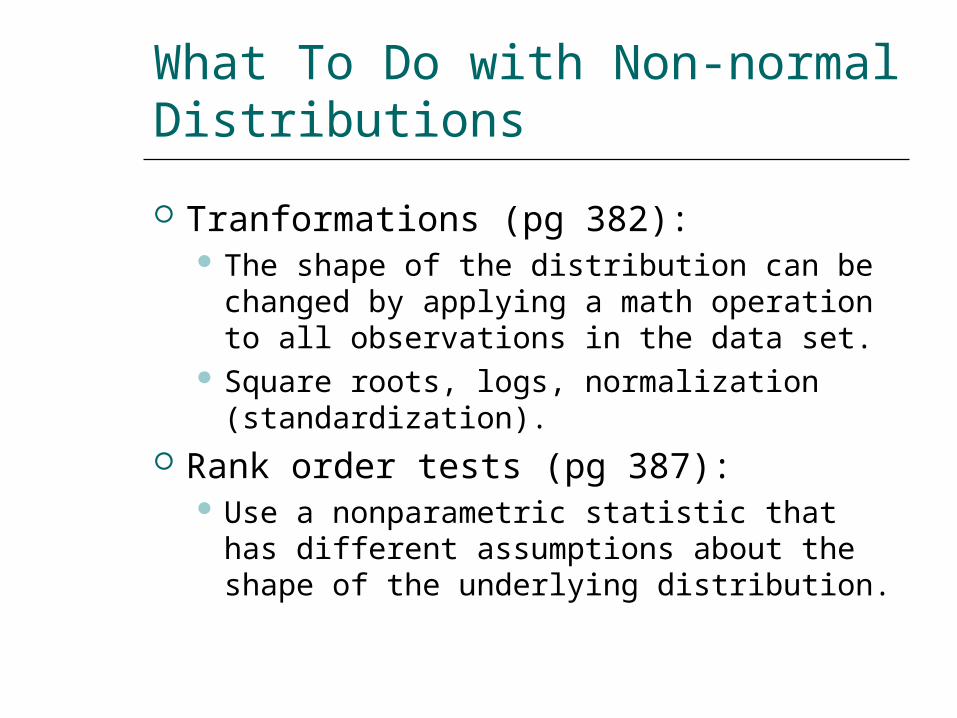
What To Do with Non-normal Distributions
Tranformations (pg 382): The shape of the distribution can be
changed by applying a math operation to all observations in the data set.
Square roots, logs, normalization (standardization).
Rank order tests (pg 387): Use a nonparametric statistic that has
different assumptions about the shape of the underlying distribution.

Pros and Cons
Tranformations must be described in the Results section of your manuscript.
Effects of transformations on the validity of your t or F statistical tests is unclear.
Nonparametric tests may be preferable but make probability of Type II error greater.
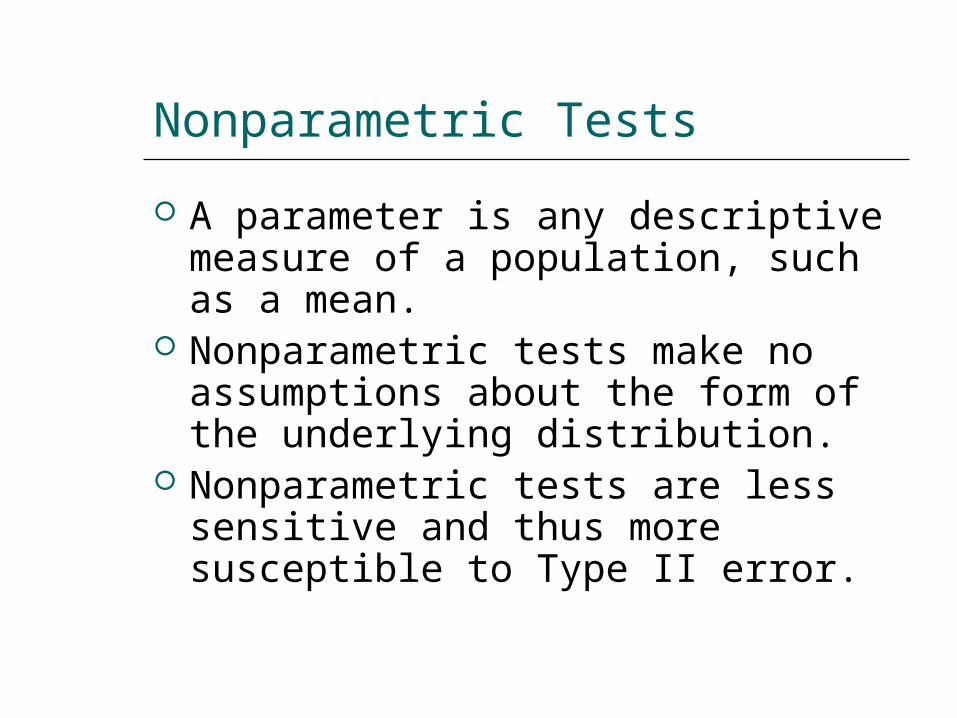
Nonparametric Tests
A parameter is any descriptive measure of a population, such as a mean.
Nonparametric tests make no assumptions about the form of the underlying distribution.
Nonparametric tests are less sensitive and thus more susceptible to Type II error.

When to Use Nonparametric Tests
When the distribution is known to be non-normal. When a small sample (n < 10) contains
extreme values. When two or more small samples have
unequal variances. When the original data consists of
ranks instead of values.

Mann-Whitney Test (U Test)
The nonparametric equivalent of the independent group t-test.
Hypotheses: H0: Pop. Dist. 1 = Pop. Dist. 2
H1: Pop. Dist. 1 ≠ Pop. Dist. 2
The nature of the inequality is unspecified (e.g., central tendency, variability, shape).
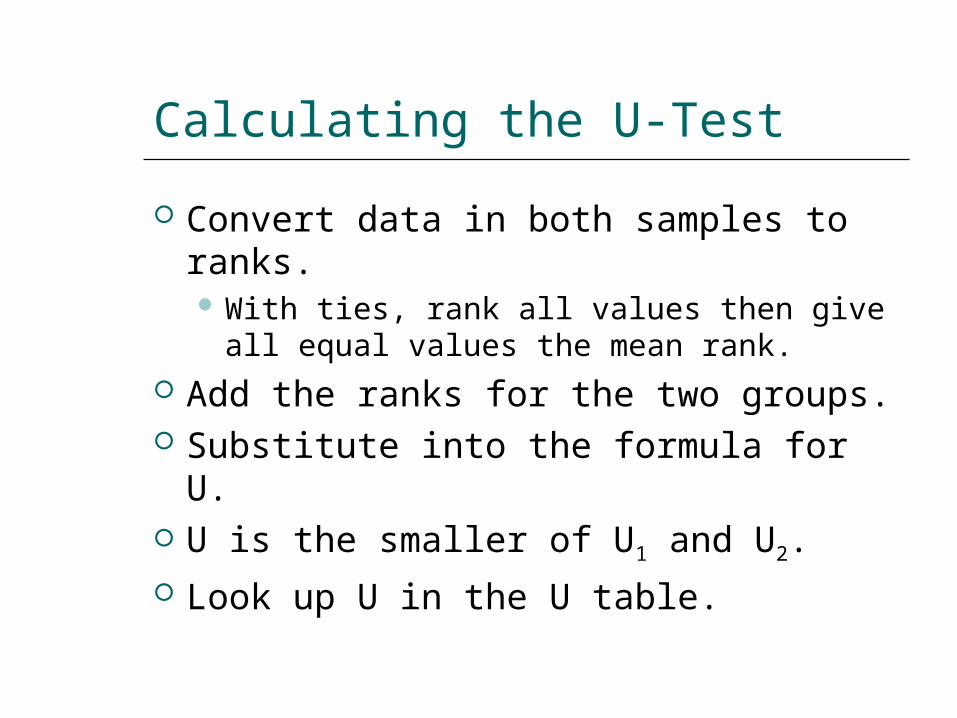
Calculating the U-Test
Convert data in both samples to ranks. With ties, rank all values then give all
equal values the mean rank. Add the ranks for the two groups. Substitute into the formula for U. U is the smaller of U1 and U2. Look up U in the U table.

Observations Ranks
TV Favorable TV Unfavorable TV Favorable TV Unfavorable
0 1.5
0 1.5
1 3
2 4
4 5
5 7
5 7
5 7
10 9
12 10
14 11
20 12
42 13
43 14
49 15
R1 = 72 R2 = 48

Calculating U
20
723656
722
)18(8)7)(8(
2
)1(1
11211
Rnn
nnU
36
482856
482
)17(7)7)(8(
2
)1(2
22212
Rnn
nnU
U = whichever is smaller – U1 or U2
= 20

Testing U
H0: Population distribution 1 = population distribution 2
H1: Population distribution 1 ≠ population distribution 2
Look up critical values in U Table. Instead of degrees of freedom, use n’s
for the two groups to find the cutoff. Since 20 is larger than 10, retain the
null (not reject).

Interpretation of U
U represents the number of times individual ranks in the lower group exceed those in the higher group.
When all values in one group exceed those in the other, U will be 0. Reject the null (equal groups) when U is
less than the critical U in the table.

Directional U-Test
Similar variance is required in order to do a directional U-test.
The directional hypothesis states which group will exceed which: H0: Pop Dist 1 ≥ Pop Dist 2 H1: Pop Dist 1 < Pop Dist 2
In addition to calculating U, verify that the differences in mean ranks are in the predicted direction.
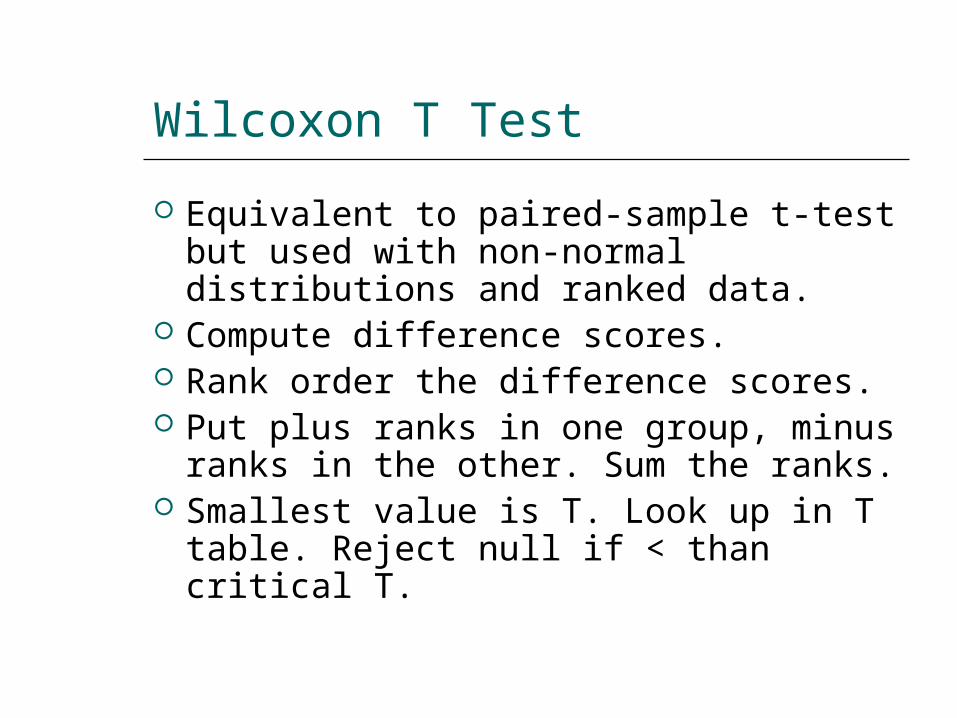
Wilcoxon T Test
Equivalent to paired-sample t-test but used with non-normal distributions and ranked data.
Compute difference scores. Rank order the difference scores. Put plus ranks in one group, minus
ranks in the other. Sum the ranks. Smallest value is T. Look up in T
table. Reject null if < than critical T.
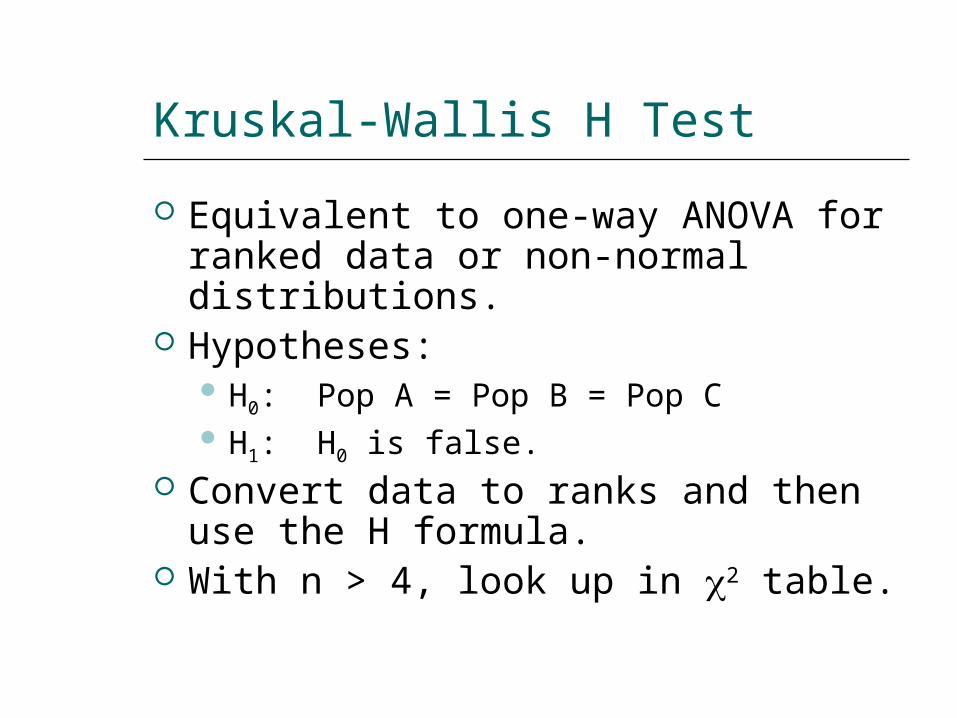
Kruskal-Wallis H Test
Equivalent to one-way ANOVA for ranked data or non-normal distributions.
Hypotheses: H0: Pop A = Pop B = Pop C H1: H0 is false.
Convert data to ranks and then use the H formula.
With n > 4, look up in 2 table.

A Repertoire of Hypothesis Tests
z-test – for use with normal distributions when σ is known.
t-test – for use with one or two groups, when σ is unknown.
F-test (ANOVA) – for comparing means for multiple groups.
Chi-square test – for use with qualitative data.
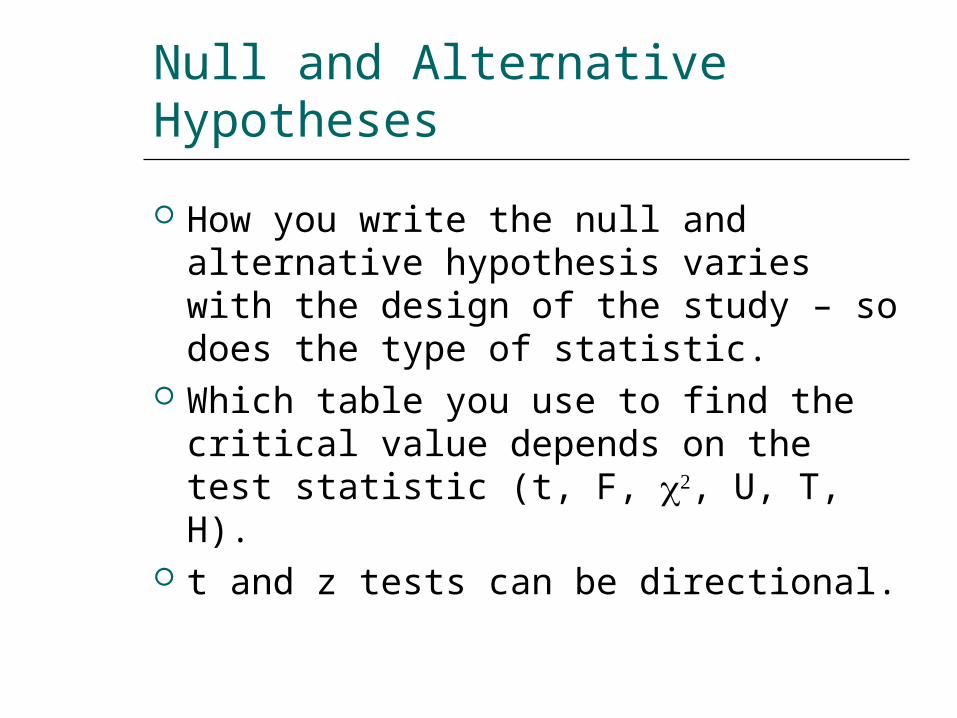
Null and Alternative Hypotheses
How you write the null and alternative hypothesis varies with the design of the study – so does the type of statistic.
Which table you use to find the critical value depends on the test statistic (t, F, , U, T, H).
t and z tests can be directional.

Deciding Which Test to Use
Is data qualitative or quantitative? If qualitative use Chi-square.
How many groups are there? If two, use t-tests, if more use ANOVA
Is the design within or between subjects?
How many independent variables (IVs or factors) are there?

Summary of t-tests
Single group t-test for one sample compared to a population mean.
Independent sample t-test – for comparing two groups in a between-subject design.
Paired (matched) sample t-test – for comparing two groups in a within-subject design.

Summary of ANOVA Tests
One-way ANOVA – for one IV, independent samples
Repeated Measures ANOVA – for one or more IVs where samples are repeated, matched or paired.
Two-way (factorial) ANOVA – for two or more IVs, independent samples.
Mixed ANOVA – for two or more IVs, between and within subjects.
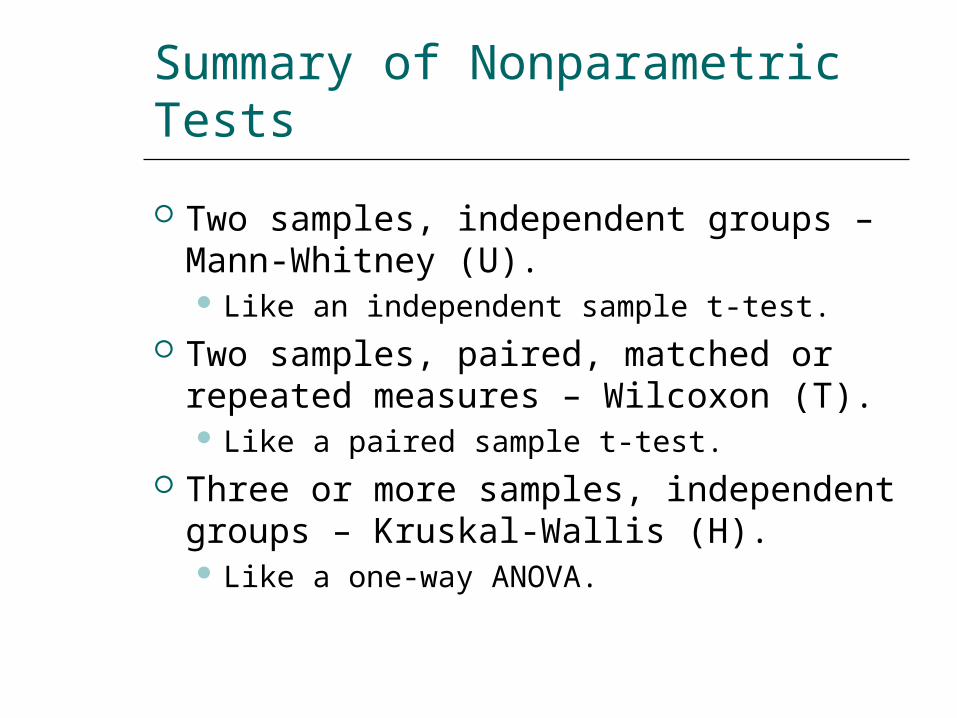
Summary of Nonparametric Tests
Two samples, independent groups – Mann-Whitney (U). Like an independent sample t-test.
Two samples, paired, matched or repeated measures – Wilcoxon (T). Like a paired sample t-test.
Three or more samples, independent groups – Kruskal-Wallis (H). Like a one-way ANOVA.

Summary of Qualitative Tests
Chi Square (2) – one variable. Tests whether frequencies are equally
distributed across the possible categories. Two-way Chi Square – two variables.
Tests whether there is an interaction (relationship) between the two variables.