
Presentation to Shareholders - Bank South Pacific sales and service program integrated with our ......
36
Presentation to Shareholders 23 May 2014 Robin Fleming - Group CEO
Transcript of Presentation to Shareholders - Bank South Pacific sales and service program integrated with our ......

Presentation to Shareholders 23 May 2014 Robin Fleming - Group CEO
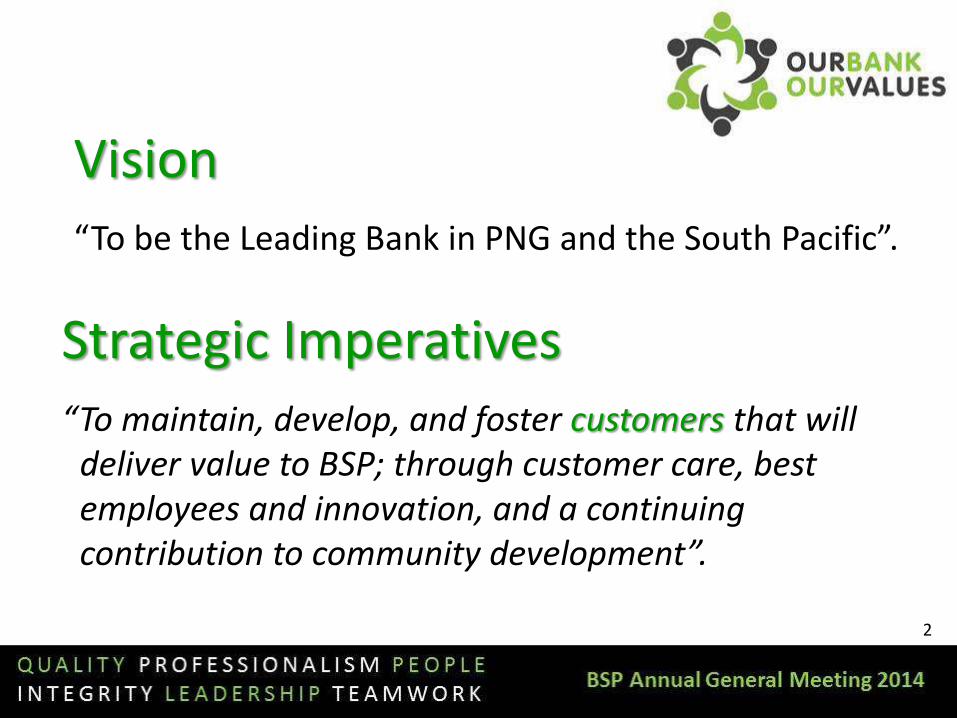
2
Vision “To be the Leading Bank in PNG and the South Pacific”.
Strategic Imperatives “To maintain, develop, and foster customers that will
deliver value to BSP; through customer care, best employees and innovation, and a continuing contribution to community development”.
3
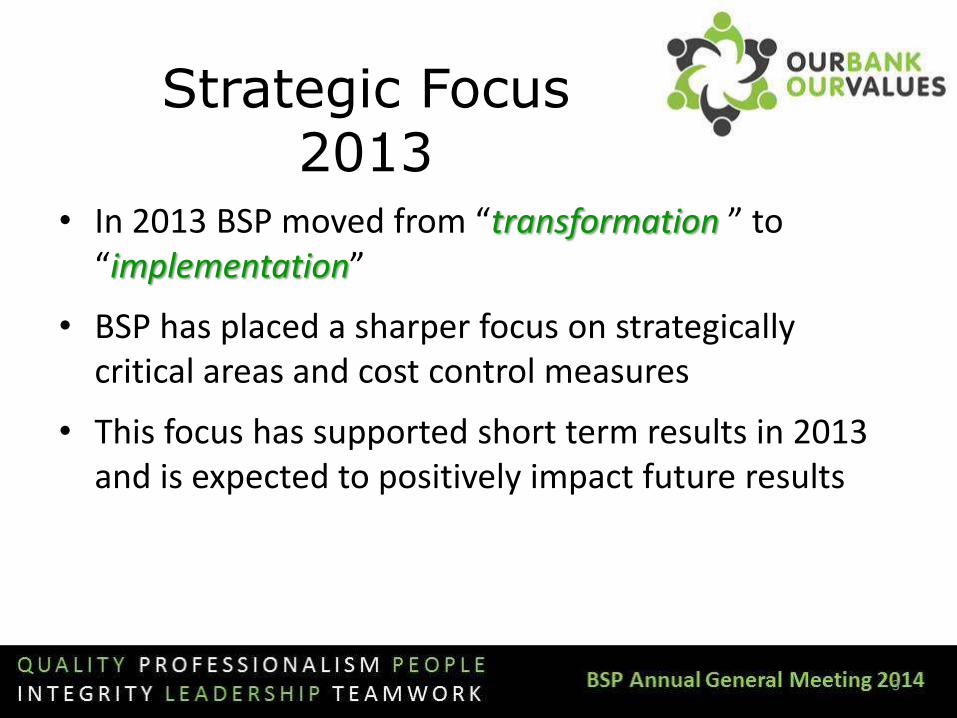
Strategic Focus 2013
• In 2013 BSP moved from “transformation ” to “implementation”
• BSP has placed a sharper focus on strategically critical areas and cost control measures
• This focus has supported short term results in 2013 and is expected to positively impact future results
4
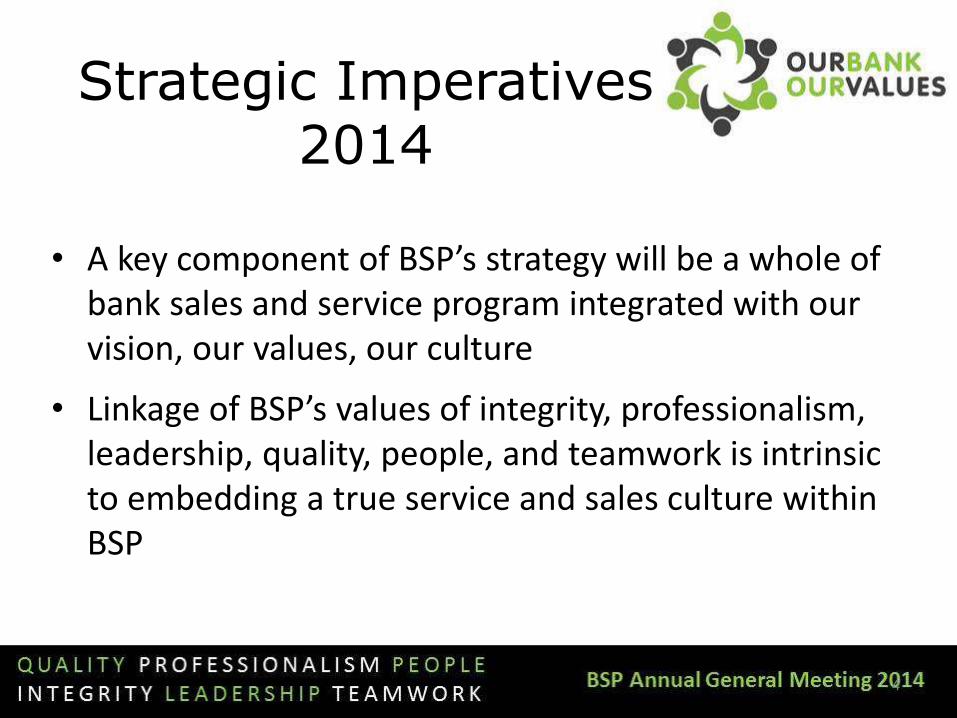
Strategic Imperatives 2014
• A key component of BSP’s strategy will be a whole of bank sales and service program integrated with our vision, our values, our culture
• Linkage of BSP’s values of integrity, professionalism, leadership, quality, people, and teamwork is intrinsic to embedding a true service and sales culture within BSP

5
Strategic Imperatives 2014
• BSP’s optimal sales and service culture is to place customer satisfaction at the forefront of planning processes and operational activities
• Customer satisfaction should then translate to improved returns for shareholders
• BSP is placing a renewed emphasis on training and career development of staff
• Financial inclusion remains a key objective of Retail bank’s strategy
6
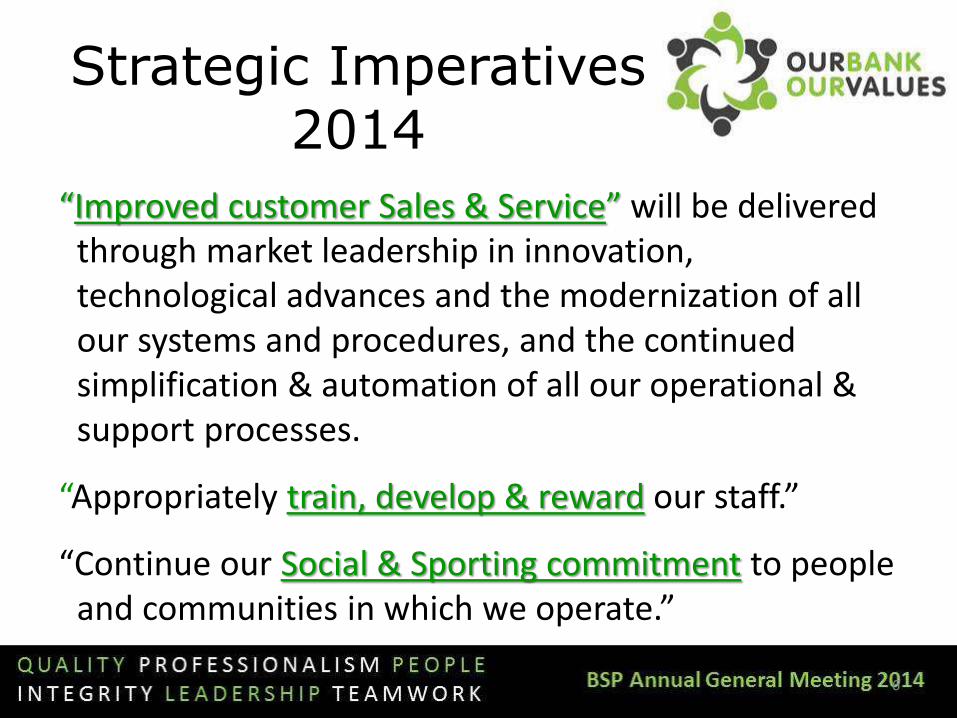
Strategic Imperatives 2014
“Improved customer Sales & Service” will be delivered through market leadership in innovation, technological advances and the modernization of all our systems and procedures, and the continued simplification & automation of all our operational & support processes.
“Appropriately train, develop & reward our staff.”
“Continue our Social & Sporting commitment to people and communities in which we operate.”
7
Financial Performance 2013
8
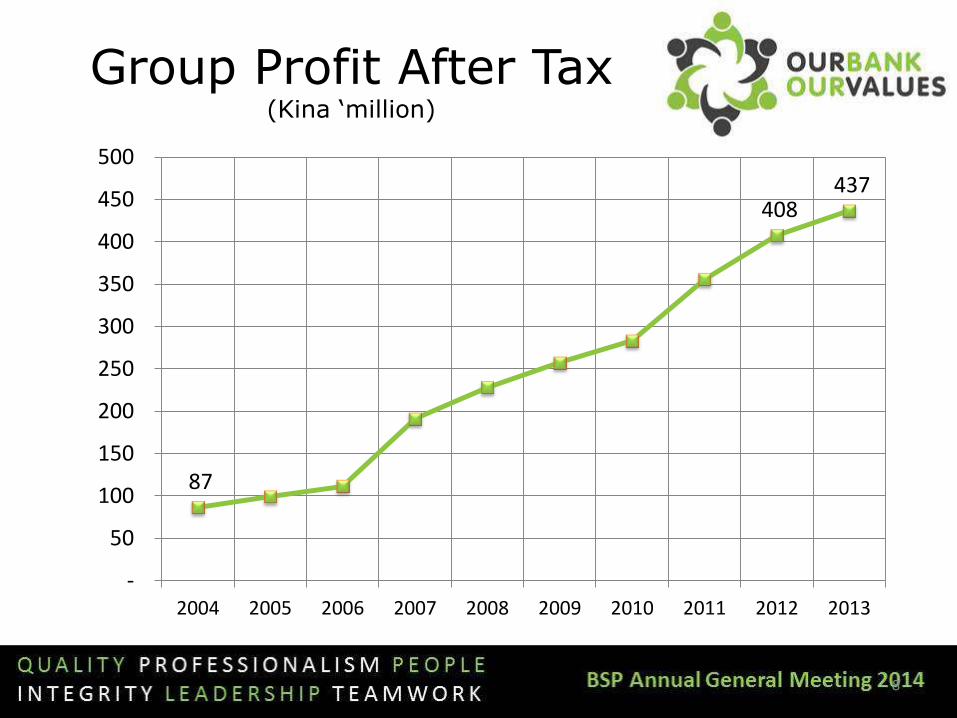
87
408 437
-
50
100
150
200
250
300
350
400
450
500
2004 2005 2006 2007 2008 2009 2010 2011 2012 2013
Group Profit After Tax (Kina ‘million)
9
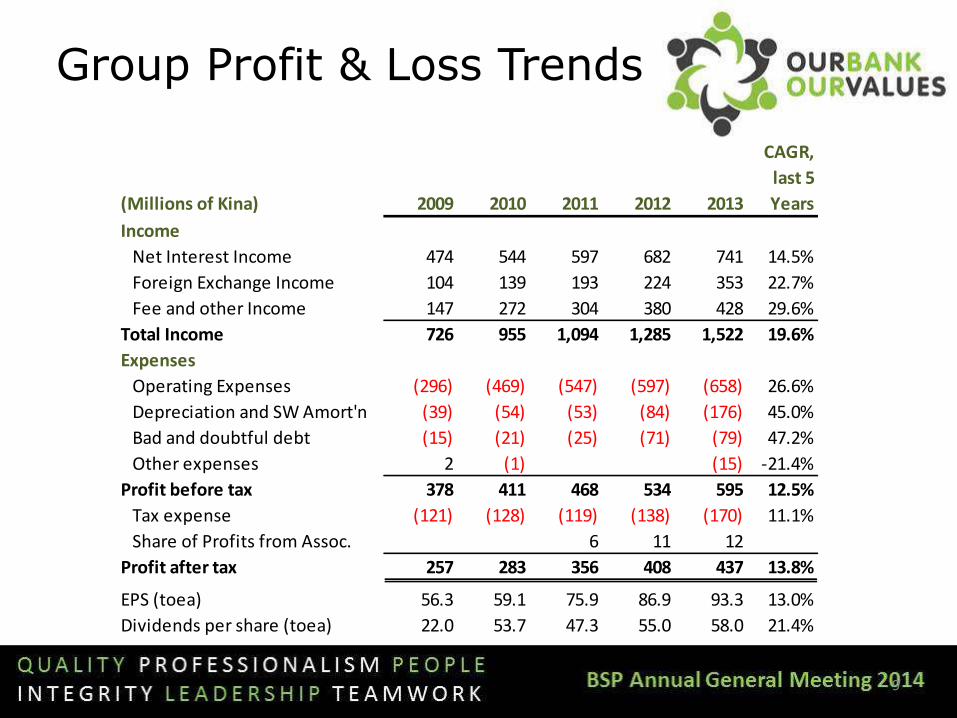
Group Profit & Loss Trends
(Millions of Kina) 2009 2010 2011 2012 2013
CAGR,
last 5
Years
Income
Net Interest Income 474 544 597 682 741 14.5%
Foreign Exchange Income 104 139 193 224 353 22.7%
Fee and other Income 147 272 304 380 428 29.6%
Total Income 726 955 1,094 1,285 1,522 19.6%
Expenses
Operating Expenses (296) (469) (547) (597) (658) 26.6%
Depreciation and SW Amort'n (39) (54) (53) (84) (176) 45.0%
Bad and doubtful debt (15) (21) (25) (71) (79) 47.2%
Other expenses 2 (1) (15) -21.4%
Profit before tax 378 411 468 534 595 12.5%
Tax expense (121) (128) (119) (138) (170) 11.1%
Share of Profits from Assoc. 6 11 12
Profit after tax 257 283 356 408 437 13.8%
EPS (toea) 56.3 59.1 75.9 86.9 93.3 13.0%
Dividends per share (toea) 22.0 53.7 47.3 55.0 58.0 21.4%

10
Group Balance Sheet Trends
(Millions of Kina) 2009 2010 2011 2012 2013
CAGR,
last 5
Years
Assets
Cash & Short Term Deposits 1,188 1,344 1,501 2,134 3,476 37.1%
Loans & Advances 3,639 4,091 4,301 4,805 5,306 17.8%
Investments 3,886 3,857 4,724 4,861 5,571 10.6%
Fixed Assets + Other Assets 685 735 1,155 1,533 1,455 30.8%
Total Assets 9,398 10,027 11,681 13,333 15,809 18.4%
Liabilities
Customer Deposits 7,494 7,985 9,366 10,861 12,201 16.1%
Non-Lending Provisions 165 95 170 109 143 -0.6%
Other Liabilities 805 813 801 898 1,845 68.9%
Total Liabilities 8,464 8,893 10,337 11,867 14,190 18.5%
Shareholder Equity 934 1,134 1,344 1,466 1,619 16.8%
11
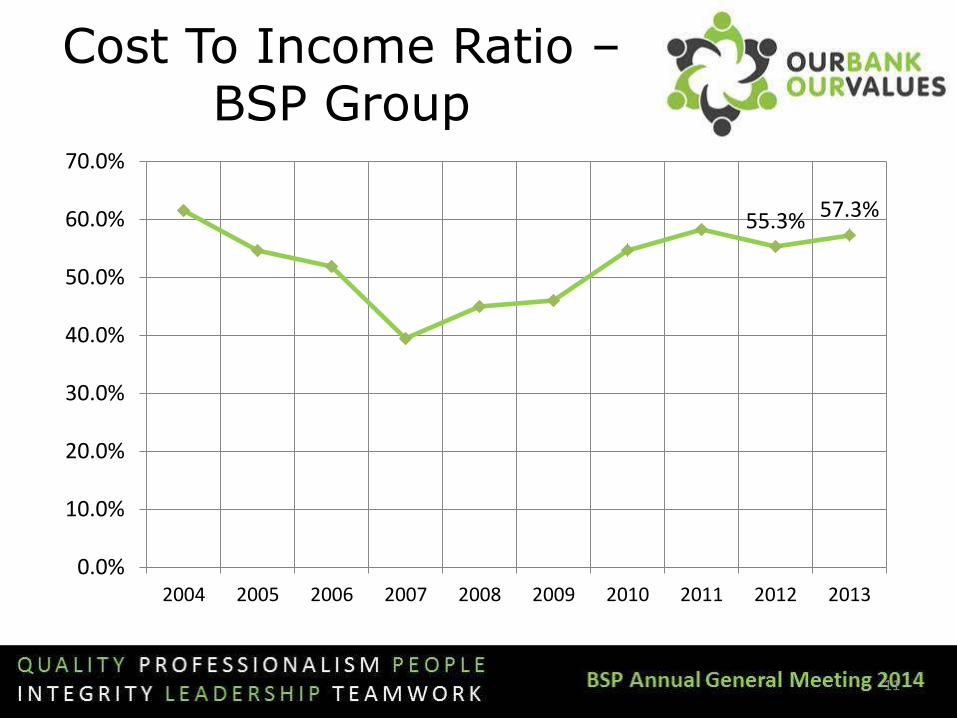
Cost To Income Ratio – BSP Group
55.3% 57.3%
0.0%
10.0%
20.0%
30.0%
40.0%
50.0%
60.0%
70.0%
2004 2005 2006 2007 2008 2009 2010 2011 2012 2013
12
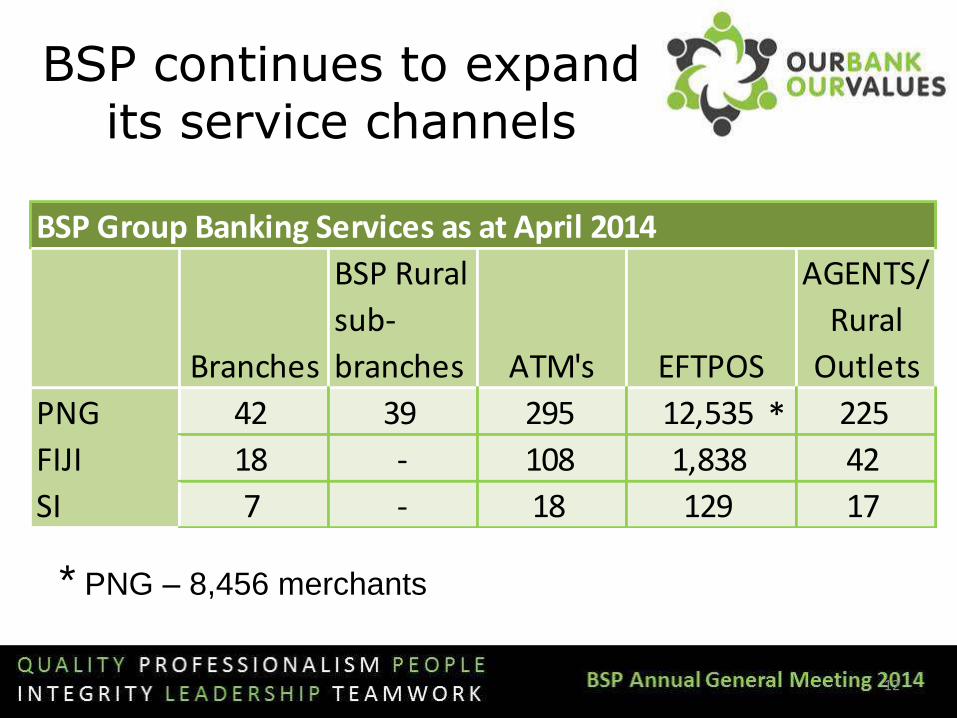
* PNG – 8,456 merchants
BSP continues to expand its service channels
BSP Group Banking Services as at April 2014
Branches
BSP Rural
sub-
branches ATM's EFTPOS
AGENTS/
Rural
Outlets
PNG 42 39 295 12,535 225
FIJI 18 - 108 1,838 42
SI 7 - 18 129 17
*
13
0
200
400
600
800
1,000
1,200
1,400
1,600
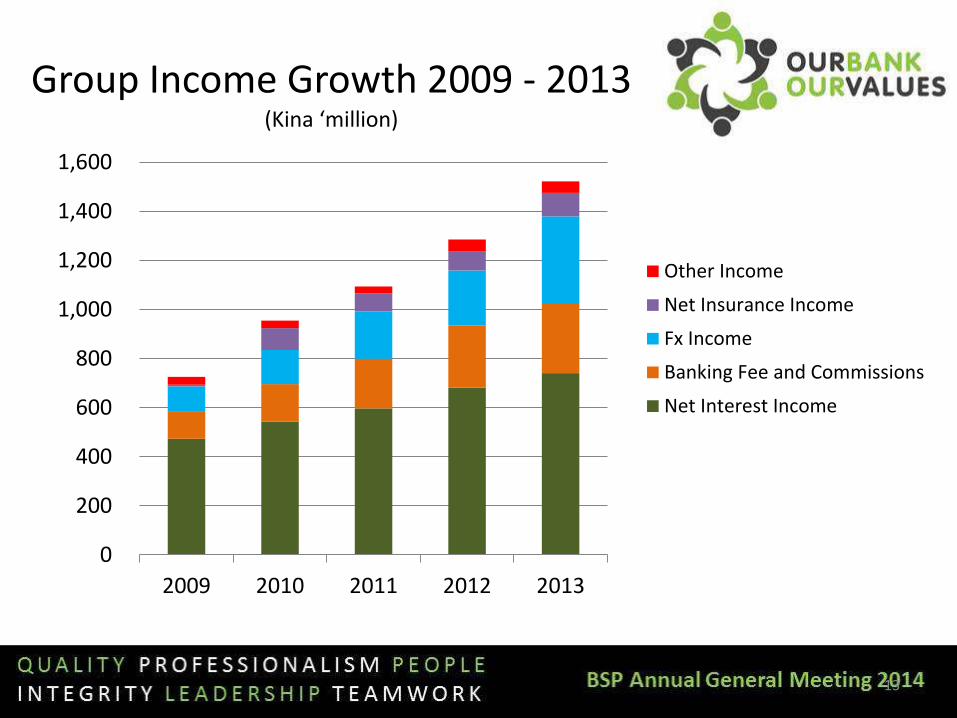
2009 2010 2011 2012 2013
Group Income Growth 2009 - 2013 (Kina ‘million)
Other Income
Net Insurance Income
Fx Income
Banking Fee and Commissions
Net Interest Income
14
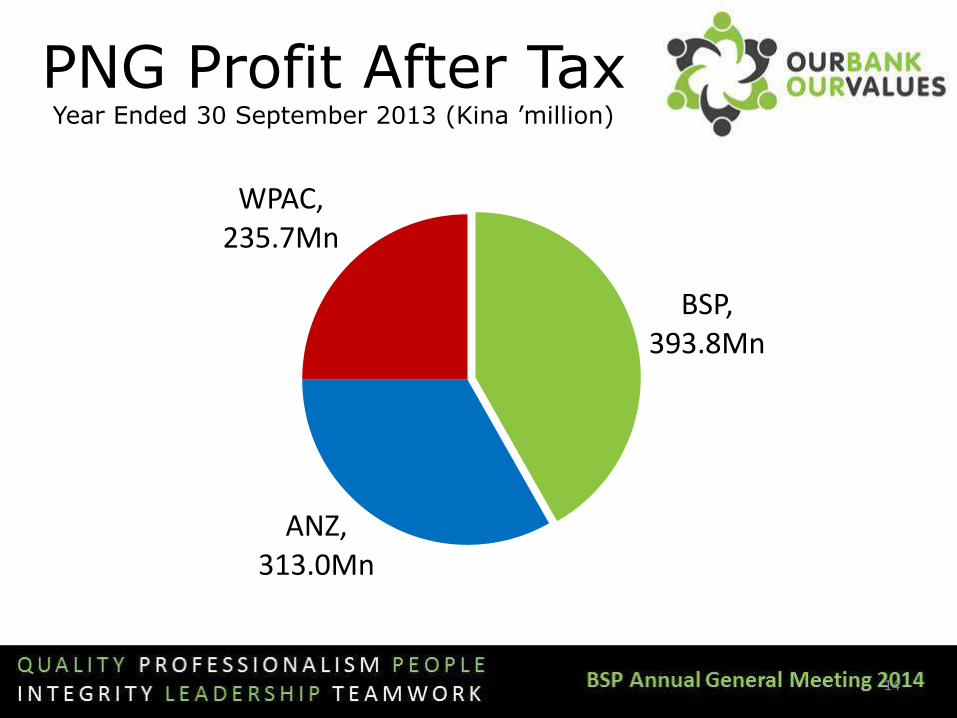
PNG Profit After Tax Year Ended 30 September 2013 (Kina ’million)
BSP, 393.8Mn
ANZ, 313.0Mn
WPAC, 235.7Mn
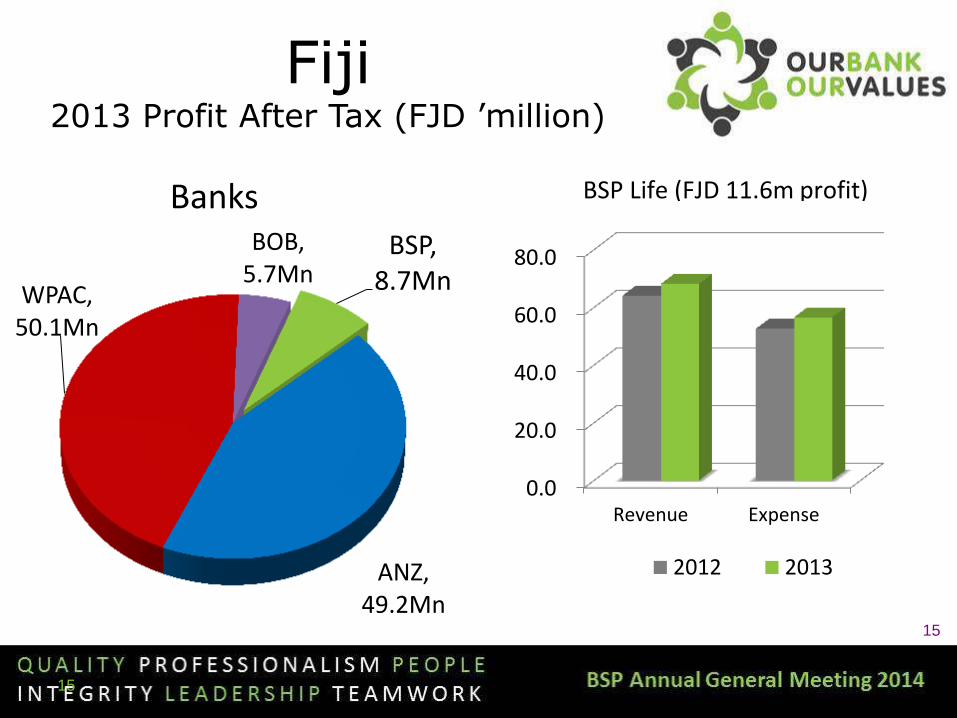
Fiji 2013 Profit After Tax (FJD ’million)
15
15
Banks BSP,
8.7Mn
ANZ, 49.2Mn
WPAC, 50.1Mn
BOB, 5.7Mn
0.0
20.0
40.0
60.0
80.0
Revenue Expense
2012 2013
BSP Life (FJD 11.6m profit)
16
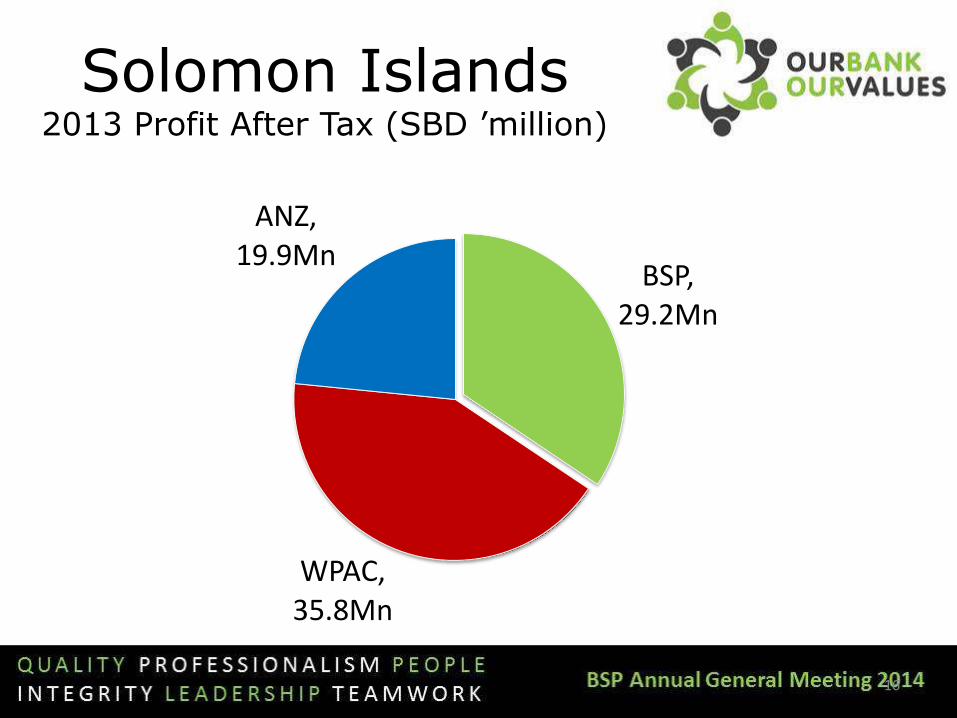
Solomon Islands 2013 Profit After Tax (SBD ’million)
BSP, 29.2Mn
WPAC, 35.8Mn
ANZ, 19.9Mn
17
Group Objectives – Four Themes 1. Financial:
Income growth through serving all segments (whole of
bank proposition) across all market segments, higher
yielding products; revenue leakage mitigation through
diversification of BSP’s customer base
2. Customer:
Brand preservation, effectively servicing the “unbanked”,
and ensuring retention. Intensifying the Group wide effort
to develop profitable products and channels that our
current and future customers need and want.

18
Group Objectives – Four Themes (cont’d)
3. Operational Excellence:
Continually challenge and improve internal
processes, and realise efficiencies through
technology and other significant investments to
materially reduce cost
4. People:
Foster a culture committed to teamwork and
accountability. Focus on basic skills proficiency,
professionalism, sales culture, outstanding
employment practices
19
BSP’s Core Values Theme of 2014 Managers Conference
BSP’s Core Values are shared by and serve to underpin, guide,
and shape everything we do as we work toward realising the
vision of being the leading bank of the South Pacific
1. Integrity
2. Professionalism
3. Leadership
4. Quality
5. People
6. Teamwork

20
Capital Management
The Capital Base of the
BSP Group exceeds
regulatory standards for an
adequately capitalised bank
• The decrease in the
overall ratio is reflected
in the build up of
capitalised fixed assets,
and in larger holdings of
FC deposits
0.0%
5.0%
10.0%
15.0%
20.0%
25.0%
30.0%
2010 2011 2012 2013
Tier 2 Tier 1 Bank PNG requirement
Capital Adequacy
21
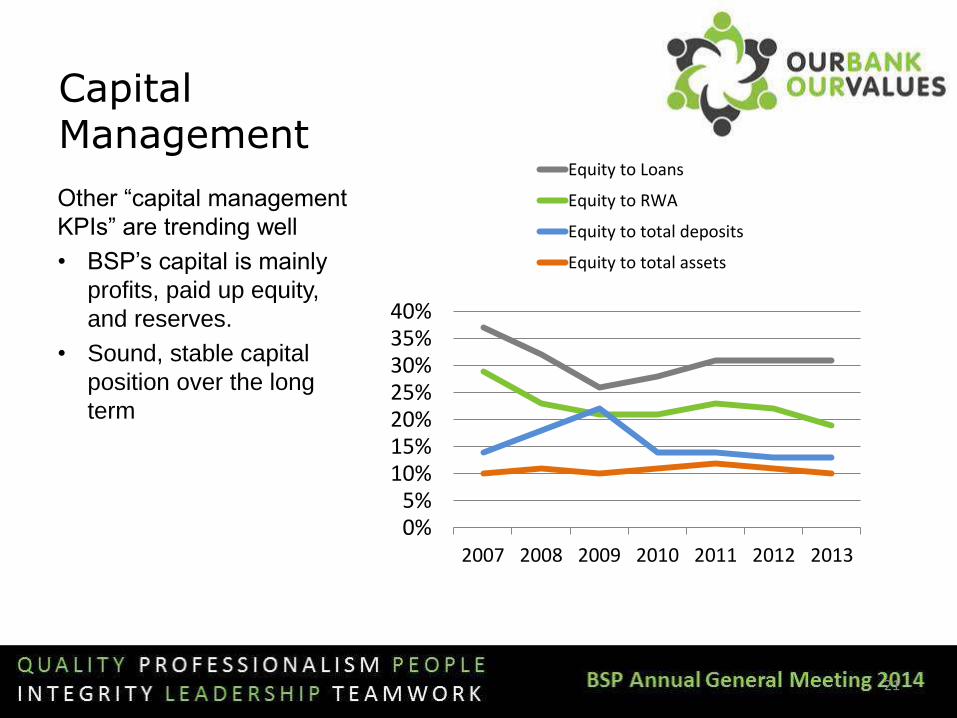
Capital Management
Other “capital management
KPIs” are trending well
• BSP’s capital is mainly
profits, paid up equity,
and reserves.
• Sound, stable capital
position over the long
term
0%5%
10%15%20%25%30%35%40%
2007 2008 2009 2010 2011 2012 2013
Equity to Loans
Equity to RWA
Equity to total deposits
Equity to total assets

22
Return on Equity • ROE is stable, very
strong
• Earnings per share
continues to increase:
• 20.6% CAGR from 2006
to 2013
31.7% 39.5%
34.7%
30.6% 27.4%
28.7%
29.0%
28.3%
0.25
0.42
0.50 0.56 0.59
0.75
0.86
0.93
0.0%
10.0%
20.0%
30.0%
40.0%
50.0%
60.0%
70.0%
80.0%
90.0%
100.0%
2006 2007 2008 2009 2010 2011 2012 2013
ROE EPS (toea)

23
Share Price
0.0
0.1
0.2
0.3
0.4
0.5
0.6
0.7
7.00
7.20
7.40
7.60
7.80
8.00
8.20
Dec-11 Apr-12 Aug-12 Dec-12 Apr-13 Aug-13 Dec-13 Apr-14
Share b’back
ceased March
2013
Dec’2011
K7.53
Volume
Traded
in
millions
K3.6bn market
Cap
Share Price K7.78
30th Apr
Share Price
in Kina
24
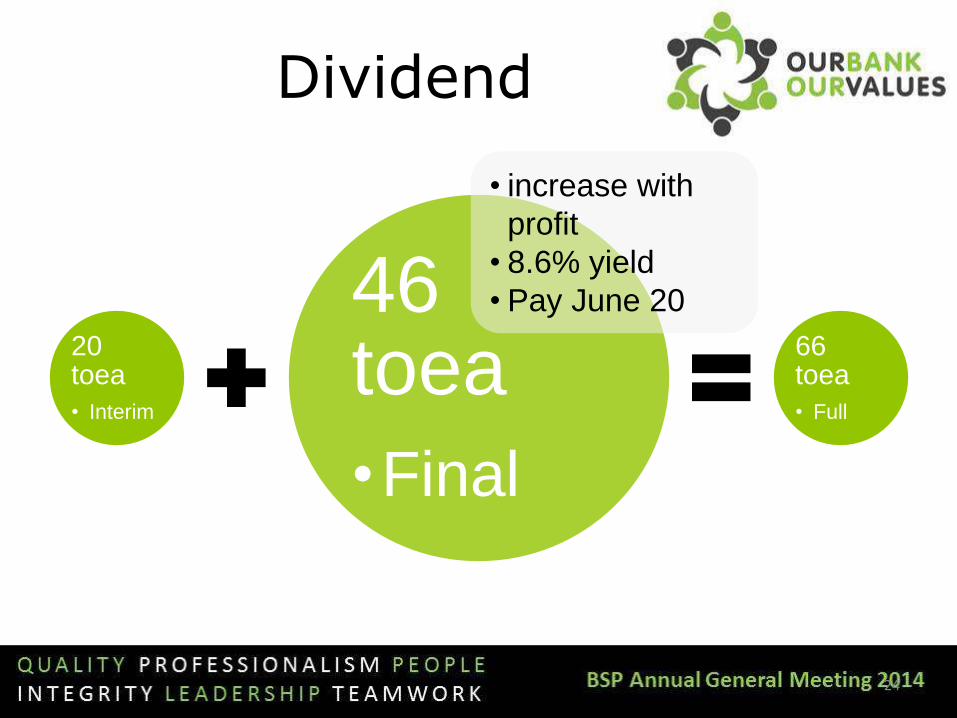
Dividend
20 toea
• Interim
46 toea
•Final
66 toea
• Full
• increase with
profit
• 8.6% yield
• Pay June 20
25
BSP Qtr.1/2014 Results Summary
Johnson Kalo, Group Deputy CEO / Group CFO
Annual General Meeting, May 2014
26
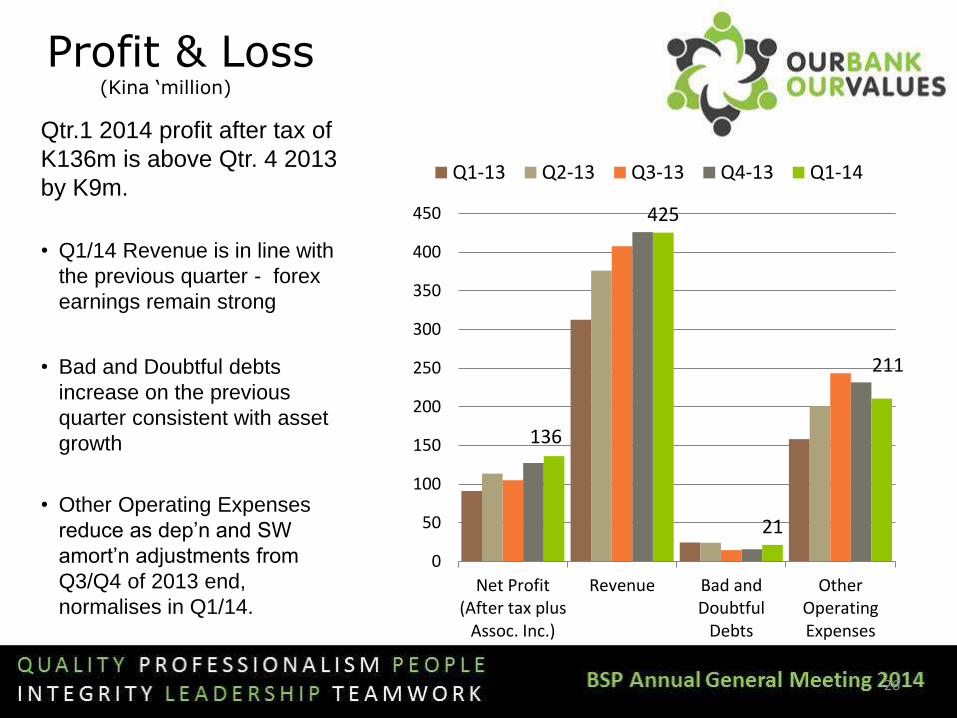
Profit & Loss (Kina ‘million)
Qtr.1 2014 profit after tax of
K136m is above Qtr. 4 2013
by K9m.
• Q1/14 Revenue is in line with
the previous quarter - forex
earnings remain strong
• Bad and Doubtful debts
increase on the previous
quarter consistent with asset
growth
• Other Operating Expenses
reduce as dep’n and SW
amort’n adjustments from
Q3/Q4 of 2013 end,
normalises in Q1/14.
136
425
21
211
0
50
100
150
200
250
300
350
400
450
Net Profit(After tax plus
Assoc. Inc.)
Revenue Bad andDoubtful
Debts
OtherOperatingExpenses
Q1-13 Q2-13 Q3-13 Q4-13 Q1-14
27
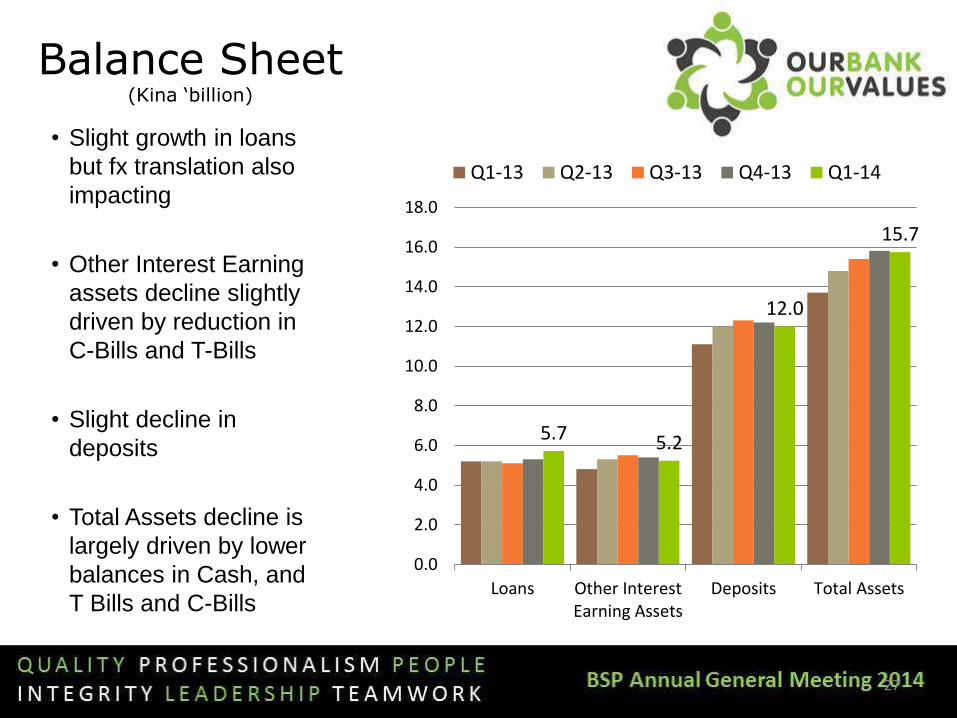
Balance Sheet (Kina ‘billion)
• Slight growth in loans
but fx translation also
impacting
• Other Interest Earning
assets decline slightly
driven by reduction in
C-Bills and T-Bills
• Slight decline in
deposits
• Total Assets decline is
largely driven by lower
balances in Cash, and
T Bills and C-Bills
5.7 5.2
12.0
15.7
0.0
2.0
4.0
6.0
8.0
10.0
12.0
14.0
16.0
18.0
Loans Other InterestEarning Assets
Deposits Total Assets
Q1-13 Q2-13 Q3-13 Q4-13 Q1-14
28
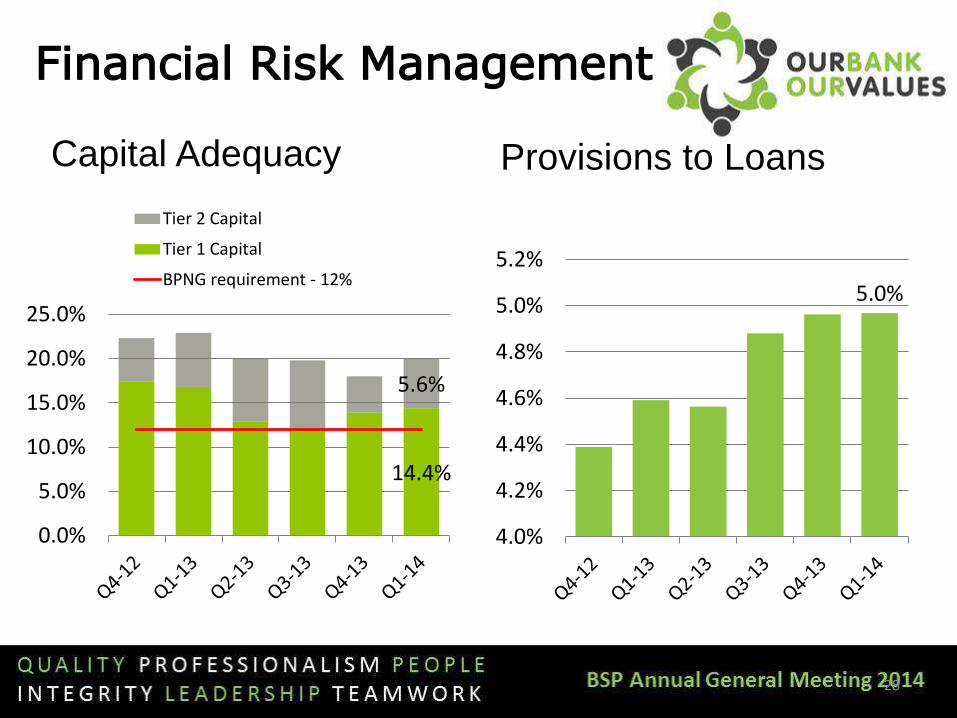
Financial Risk Management
Capital Adequacy Provisions to Loans
5.0%
4.0%
4.2%
4.4%
4.6%
4.8%
5.0%
5.2%
14.4%
5.6%
0.0%
5.0%
10.0%
15.0%
20.0%
25.0%
Tier 2 Capital
Tier 1 Capital
BPNG requirement - 12%
29
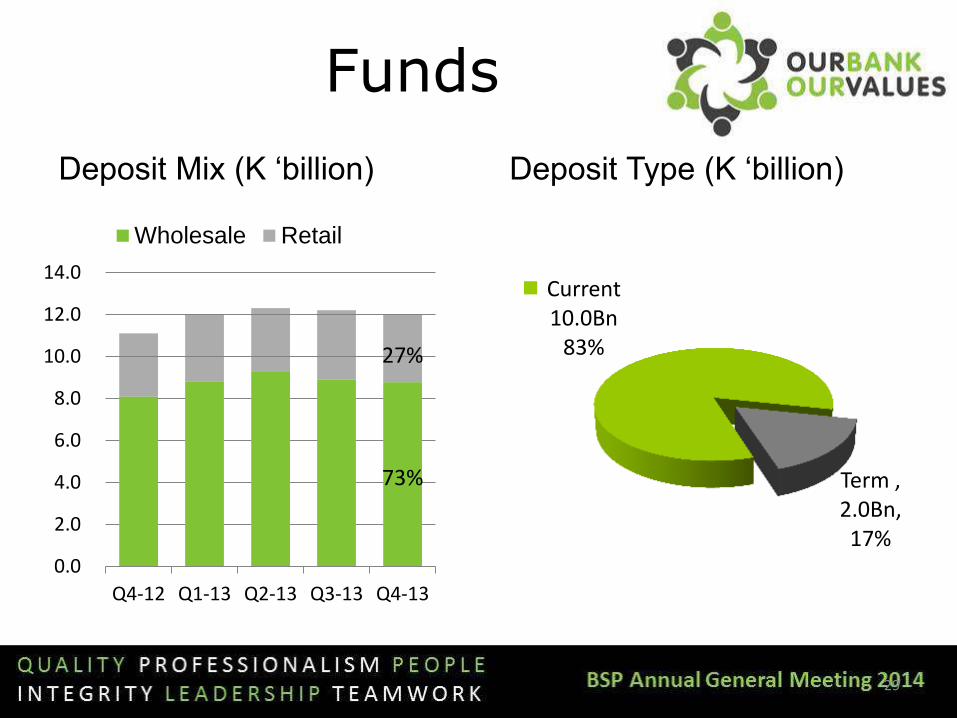
Funds
73%
27%
0%
20%
40%
60%
80%
100%
120%
0.0
2.0
4.0
6.0
8.0
10.0
12.0
14.0
Q4-12 Q1-13 Q2-13 Q3-13 Q4-13
Wholesale Retail
Current 10.0Bn
83%
Term , 2.0Bn, 17%
Deposit Type (K ‘billion) Deposit Mix (K ‘billion)
30
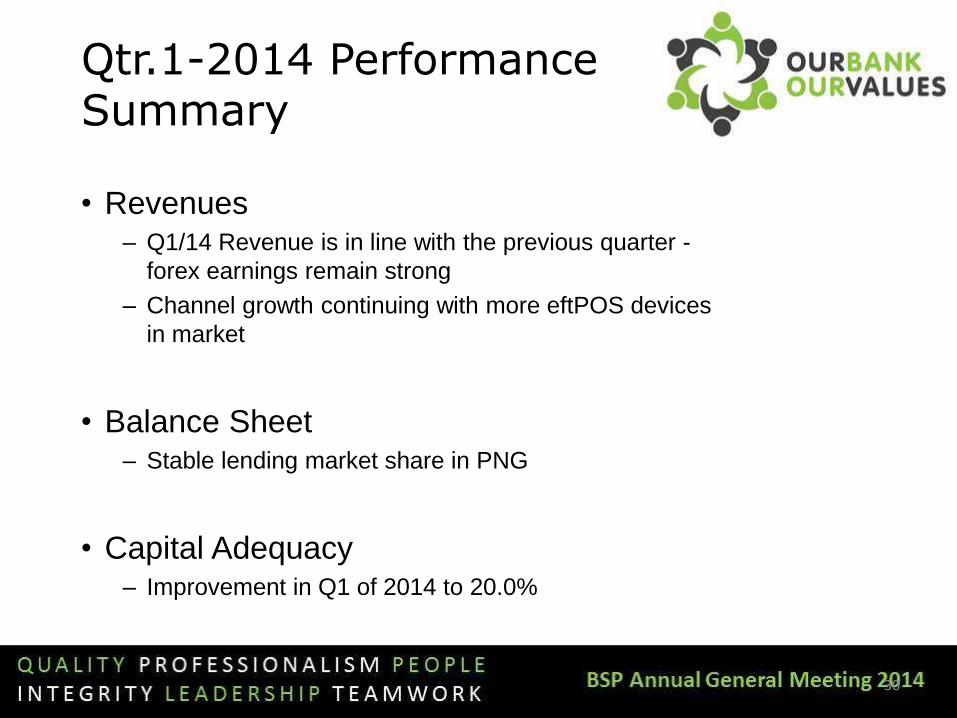
Qtr.1-2014 Performance Summary
• Revenues – Q1/14 Revenue is in line with the previous quarter -
forex earnings remain strong
– Channel growth continuing with more eftPOS devices
in market
• Balance Sheet – Stable lending market share in PNG
• Capital Adequacy – Improvement in Q1 of 2014 to 20.0%

31
Summary
32
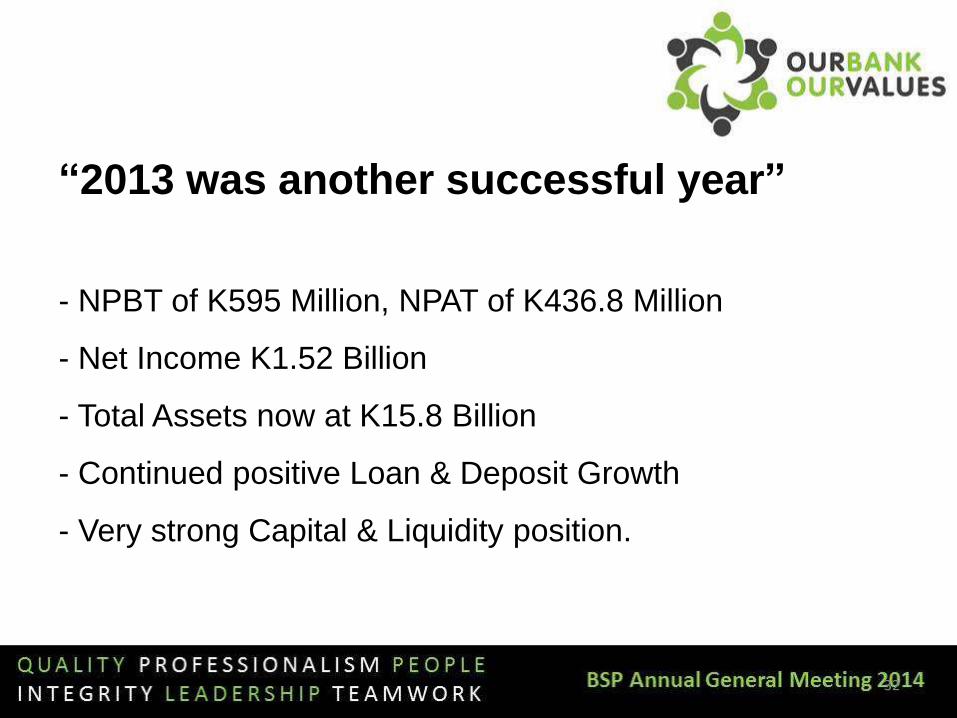
“2013 was another successful year”
- NPBT of K595 Million, NPAT of K436.8 Million
- Net Income K1.52 Billion
- Total Assets now at K15.8 Billion
- Continued positive Loan & Deposit Growth
- Very strong Capital & Liquidity position.

33
• Papua New Guinea continues to be the predominant driver of BSP’s performance
• Strong growth in international services product lines
• Continued growth in net interest income from increased loan assets off-setting margin compression in a more competitive lending market
• Income contribution emerging from BSP’s Mobile Banking suite of products
34
• Substantial investment in critical IT infrastructure all but complete in 2013, bar the relocation of core systems to new Pacific Operations Center in Q1/2015
• Full depreciation associated with IT investments now captured in expense base
• Higher depreciation expense expected to normalise in 2016
• Having completed investment in (mainly IT) transformative projects, focus now realigned from project delivery to benefit realisation
35
• Investments seen as enablers to increase productivity and increased sales capability
• There is a recognition of the largely untapped sales potential of the BSP branch network
• BSP remains the only major Financial Institution in PNG truly committed to taking “cost effective” banking services to all Papua New Guineans including rural areas.
• All underpinned by BSP’s strategy of a whole of bank sales and service program integrated with our vision, our values, our culture

36
Thank You