

PHP Profiling/performance
20
PHP Profiling/performance
-
Upload
nicolas-degardin -
Category
Internet
-
view
33 -
download
3
Transcript of PHP Profiling/performance

PHP Profiling/performance
PHP profiling/perfomance
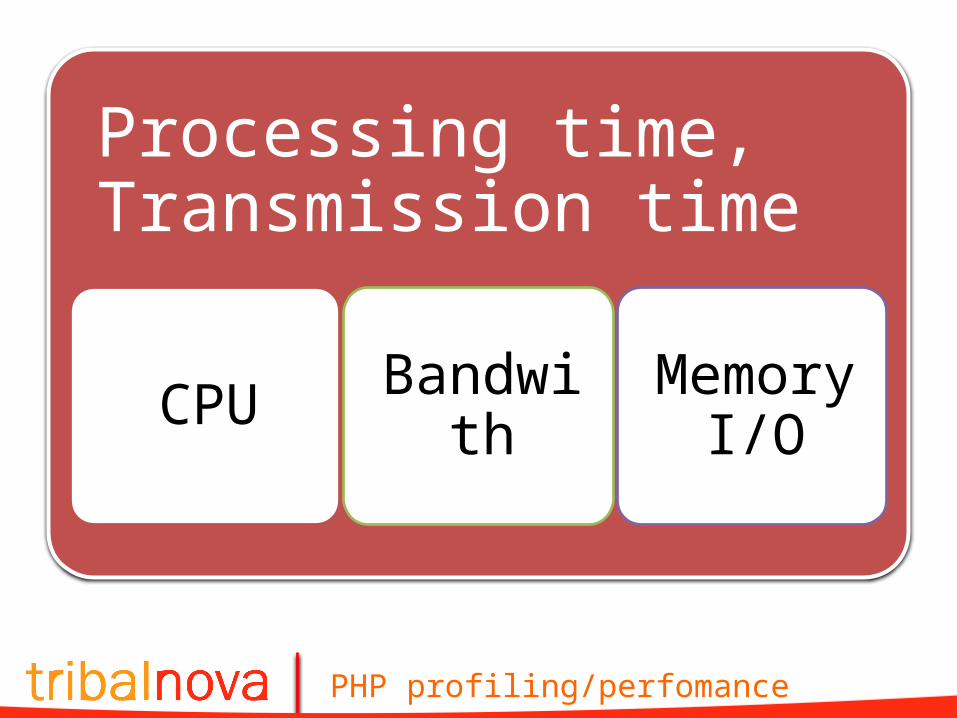
Processing time,Transmission time
CPU Bandwith MemoryI/O
PHP profiling/perfomance
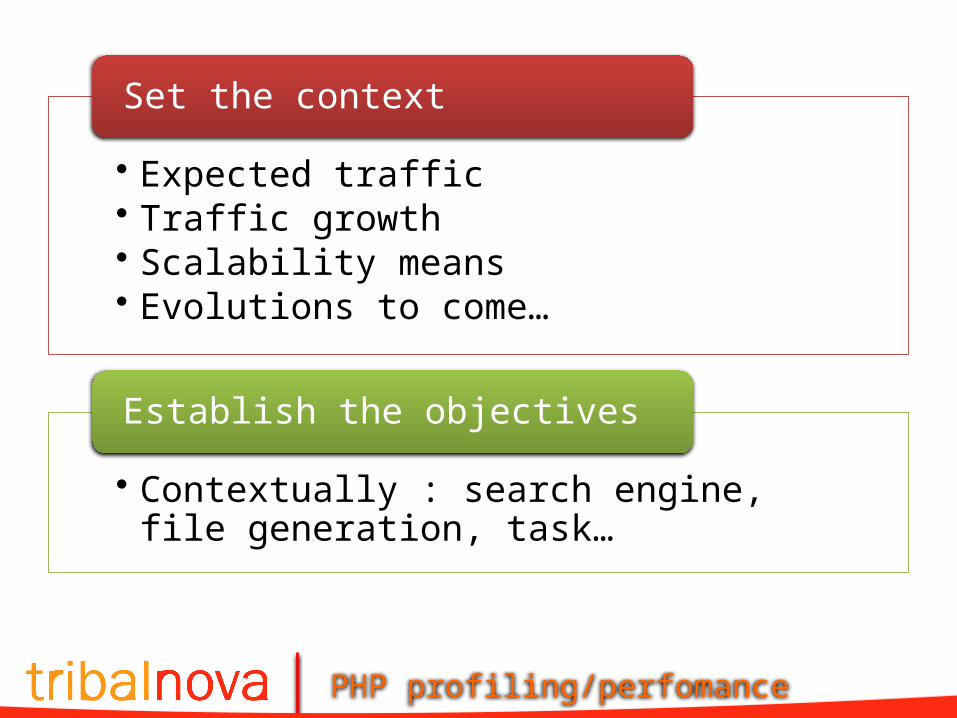
• Expected traffic• Traffic growth• Scalability means• Evolutions to come…
Set the context
• Contextually : search engine, file generation, task…
Establish the objectives
PHP profiling/perfomance
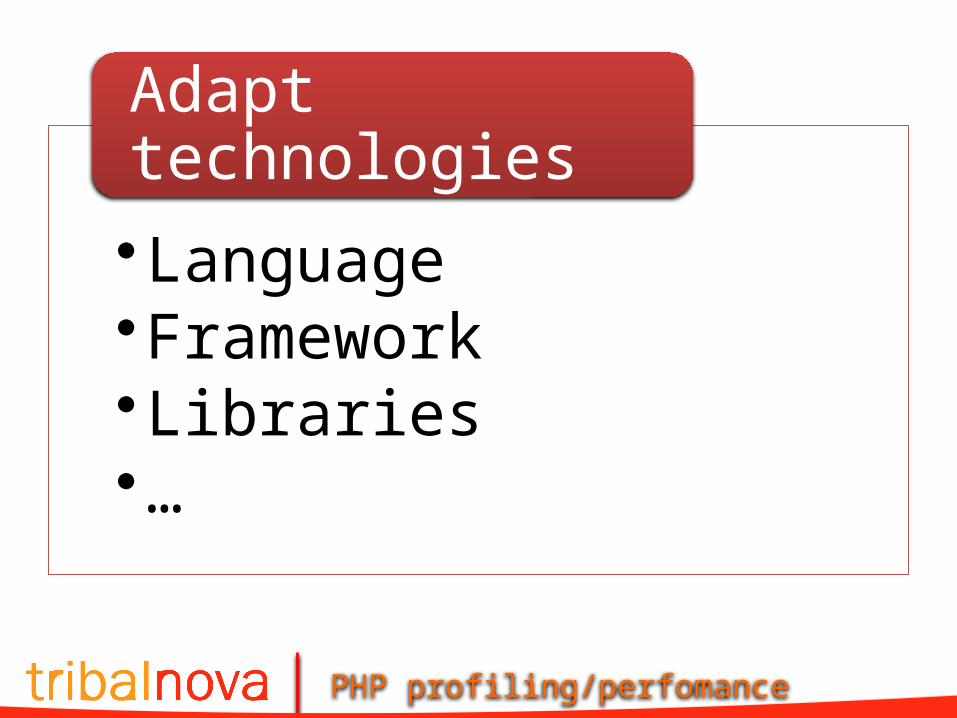
•Language•Framework•Libraries•…
Adapt technologies
PHP profiling/perfomance
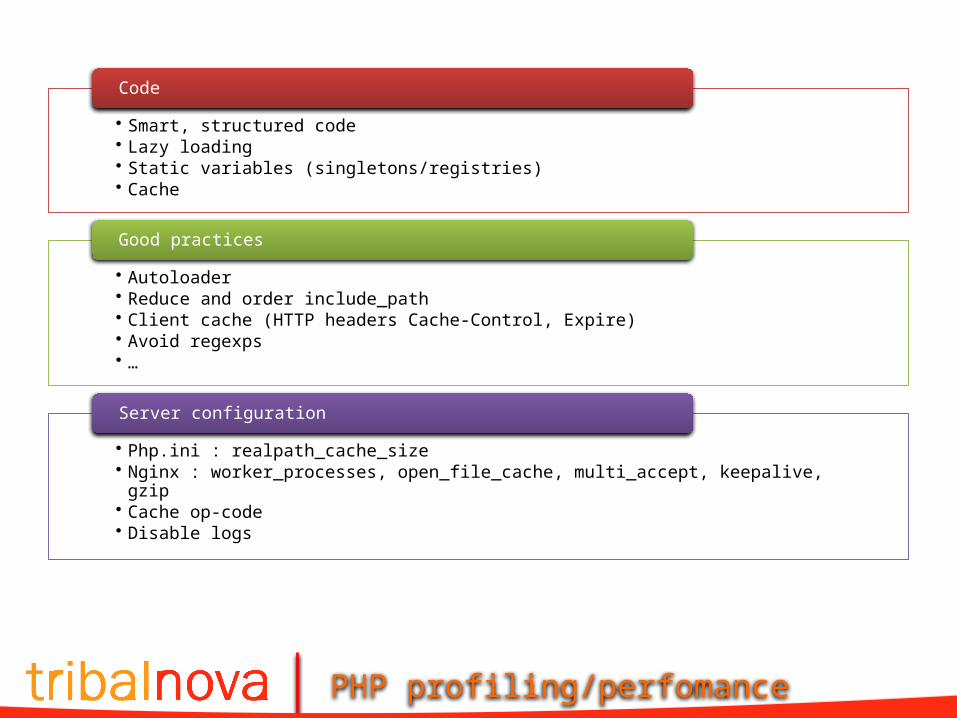
• Smart, structured code• Lazy loading• Static variables (singletons/registries)• Cache
Code
• Autoloader• Reduce and order include_path• Client cache (HTTP headers Cache-Control, Expire)• Avoid regexps• …
Good practices
• Php.ini : realpath_cache_size• Nginx : worker_processes, open_file_cache, multi_accept, keepalive, gzip• Cache op-code• Disable logs
Server configuration
PHP profiling/perfomance
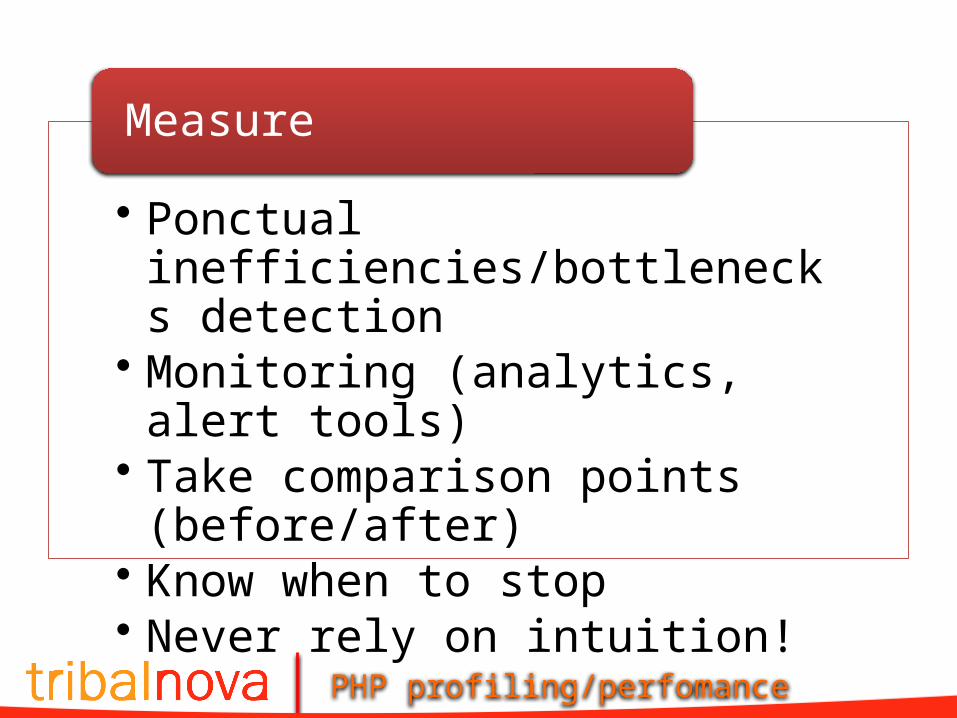
• Ponctual inefficiencies/bottlenecks detection
• Monitoring (analytics, alert tools)• Take comparison points (before/after)• Know when to stop• Never rely on intuition!
Measure
PHP profiling/perfomance
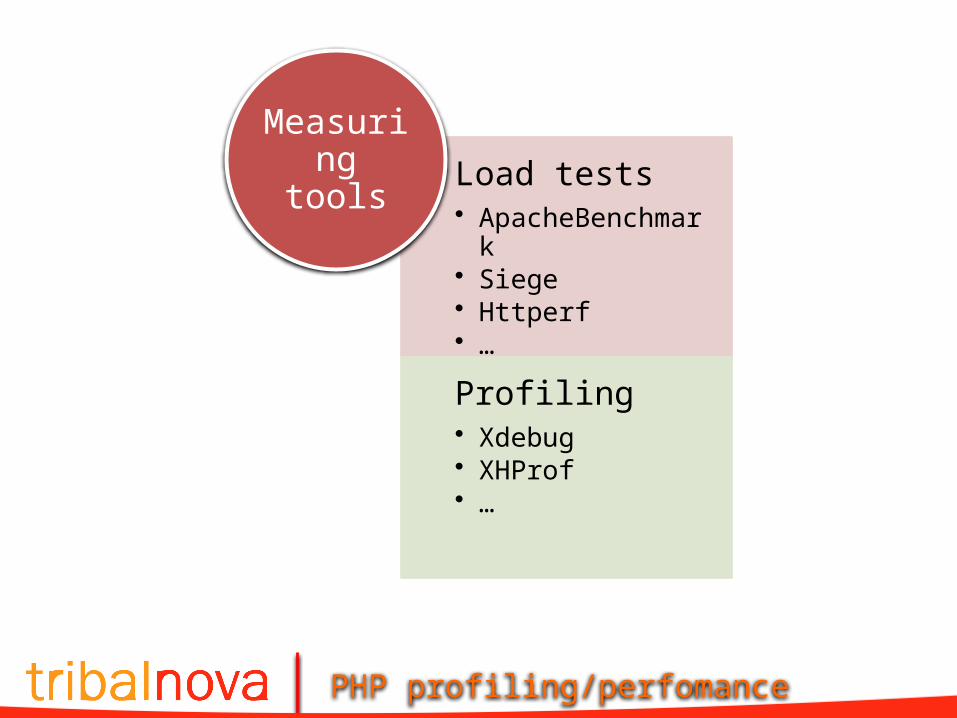
Load tests• ApacheBenchmark• Siege• Httperf• …
Profiling• Xdebug• XHProf• …
Measuring tools
PHP profiling/perfomance
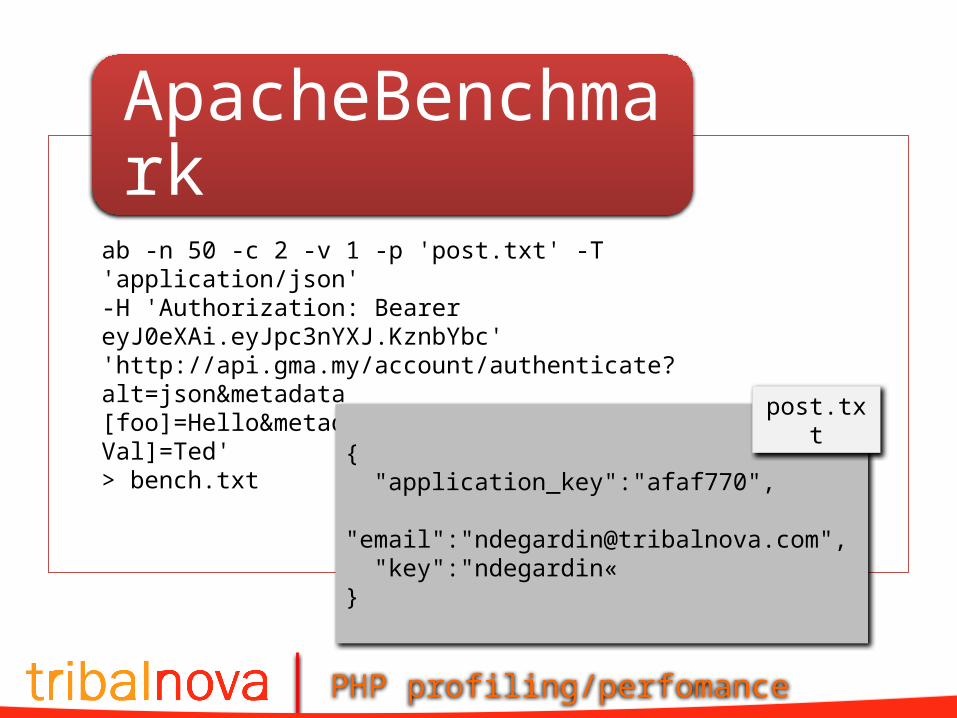
ApacheBenchmarkab -n 50 -c 2 -v 1 -p 'post.txt' -T 'application/json'-H 'Authorization: Bearer eyJ0eXAi.eyJpc3nYXJ.KznbYbc' 'http://api.gma.my/account/authenticate?alt=json&metadata[foo]=Hello&metadata[bar]=World&metadata[random Val]=Ted'> bench.txt
{ "application_key":"afaf770", "email":"[email protected]", "key":"ndegardin« }
post.txt
PHP profiling/perfomance
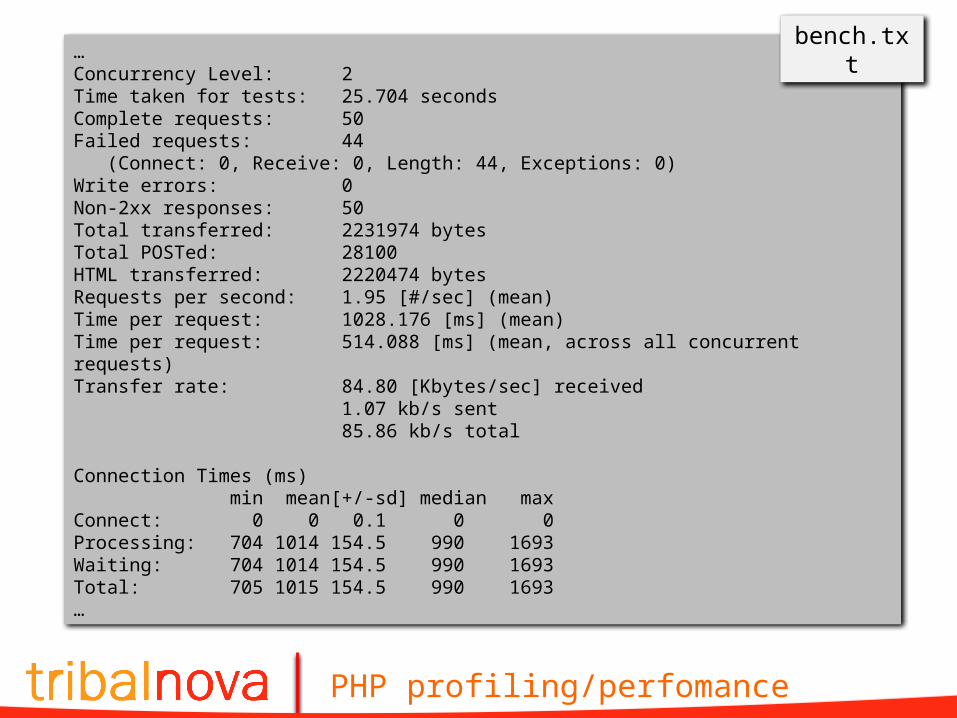
…Concurrency Level: 2Time taken for tests: 25.704 secondsComplete requests: 50Failed requests: 44 (Connect: 0, Receive: 0, Length: 44, Exceptions: 0)Write errors: 0Non-2xx responses: 50Total transferred: 2231974 bytesTotal POSTed: 28100HTML transferred: 2220474 bytesRequests per second: 1.95 [#/sec] (mean)Time per request: 1028.176 [ms] (mean)Time per request: 514.088 [ms] (mean, across all concurrent requests)Transfer rate: 84.80 [Kbytes/sec] received 1.07 kb/s sent 85.86 kb/s total
Connection Times (ms) min mean[+/-sd] median maxConnect: 0 0 0.1 0 0Processing: 704 1014 154.5 990 1693Waiting: 704 1014 154.5 990 1693Total: 705 1015 154.5 990 1693…
bench.txt
PHP profiling/perfomance
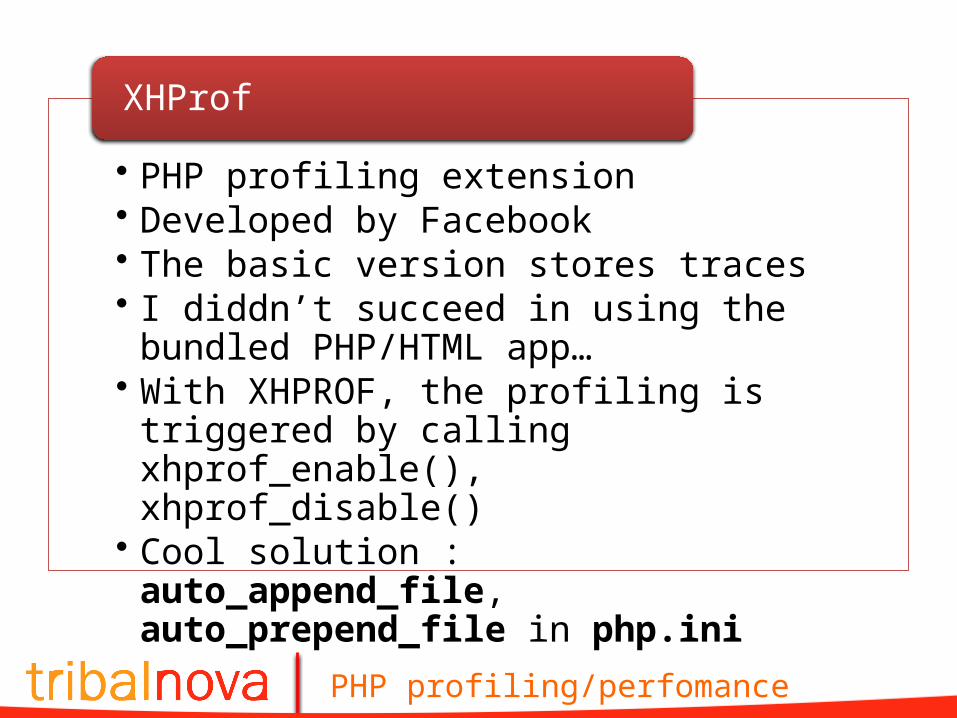
• PHP profiling extension• Developed by Facebook• The basic version stores traces • I diddn’t succeed in using the bundled
PHP/HTML app…• With XHPROF, the profiling is triggered by
calling xhprof_enable(), xhprof_disable()• Cool solution : auto_append_file,
auto_prepend_file in php.ini
XHProf
PHP profiling/perfomance
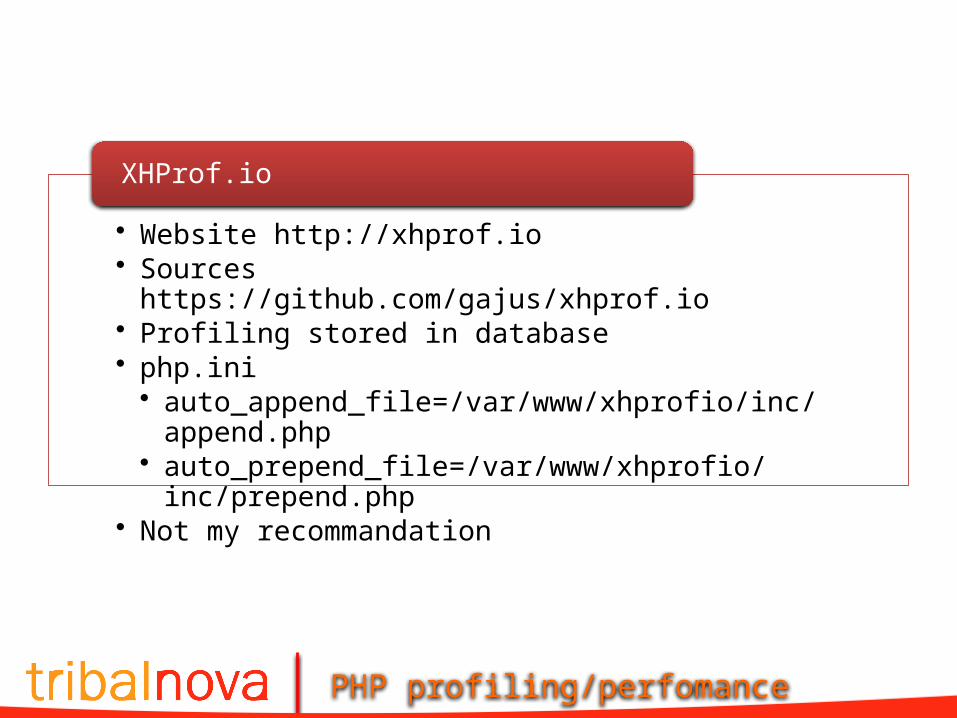
• Website http://xhprof.io• Sources https://github.com/gajus/xhprof.io• Profiling stored in database• php.ini
• auto_append_file=/var/www/xhprofio/inc/append.php• auto_prepend_file=/var/www/xhprofio/inc/prepend.php
• Not my recommandation
XHProf.io
PHP profiling/perfomance
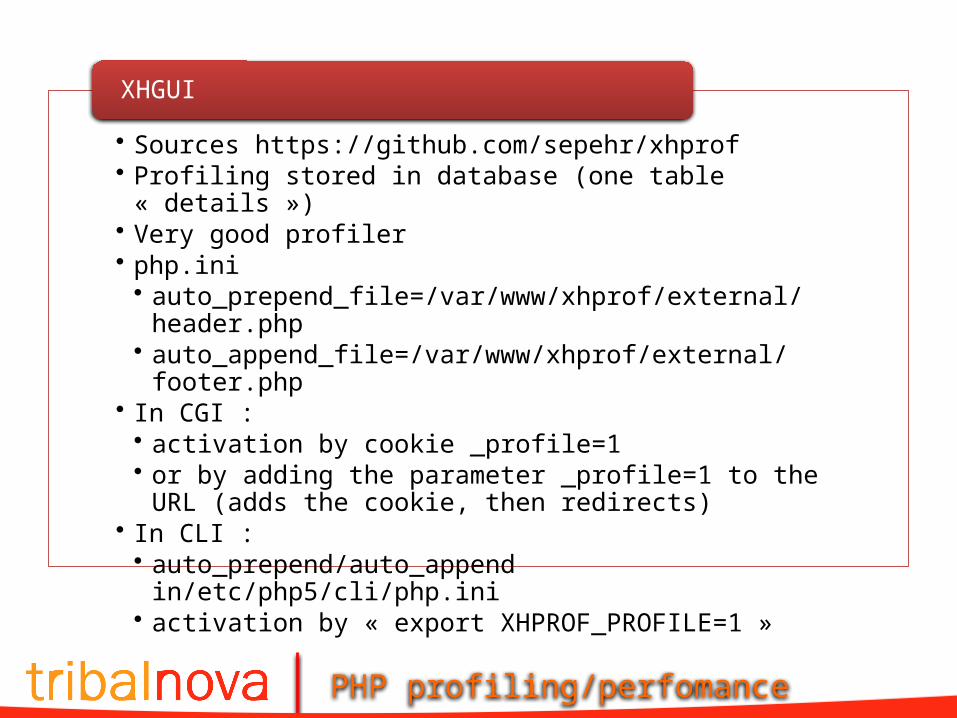
• Sources https://github.com/sepehr/xhprof• Profiling stored in database (one table « details »)• Very good profiler• php.ini• auto_prepend_file=/var/www/xhprof/external/header.php• auto_append_file=/var/www/xhprof/external/footer.php
• In CGI :• activation by cookie _profile=1 • or by adding the parameter _profile=1 to the URL (adds the cookie,
then redirects)• In CLI :• auto_prepend/auto_append in/etc/php5/cli/php.ini• activation by « export XHPROF_PROFILE=1 »
XHGUI
PHP profiling/perfomance
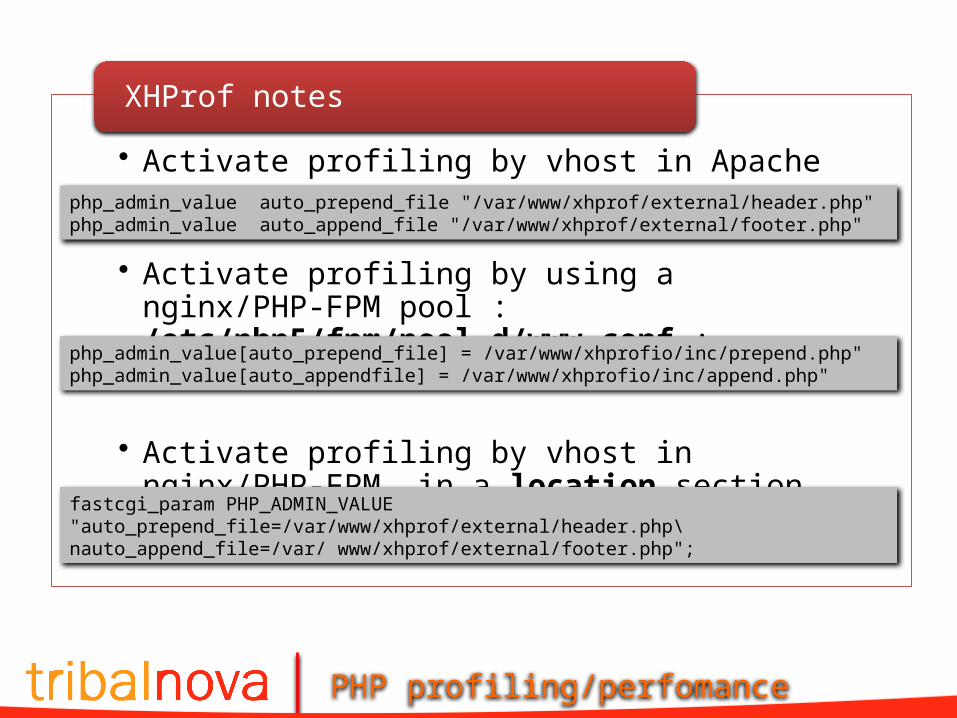
• Activate profiling by vhost in Apache
• Activate profiling by using a nginx/PHP-FPM pool :/etc/php5/fpm/pool.d/www.conf :
• Activate profiling by vhost in nginx/PHP-FPM, in a location section
XHProf notes
fastcgi_param PHP_ADMIN_VALUE "auto_prepend_file=/var/www/xhprof/external/header.php\nauto_append_file=/var/ www/xhprof/external/footer.php";
php_admin_value auto_prepend_file "/var/www/xhprof/external/header.php"php_admin_value auto_append_file "/var/www/xhprof/external/footer.php"
php_admin_value[auto_prepend_file] = /var/www/xhprofio/inc/prepend.php"php_admin_value[auto_appendfile] = /var/www/xhprofio/inc/append.php"
PHP profiling/perfomance
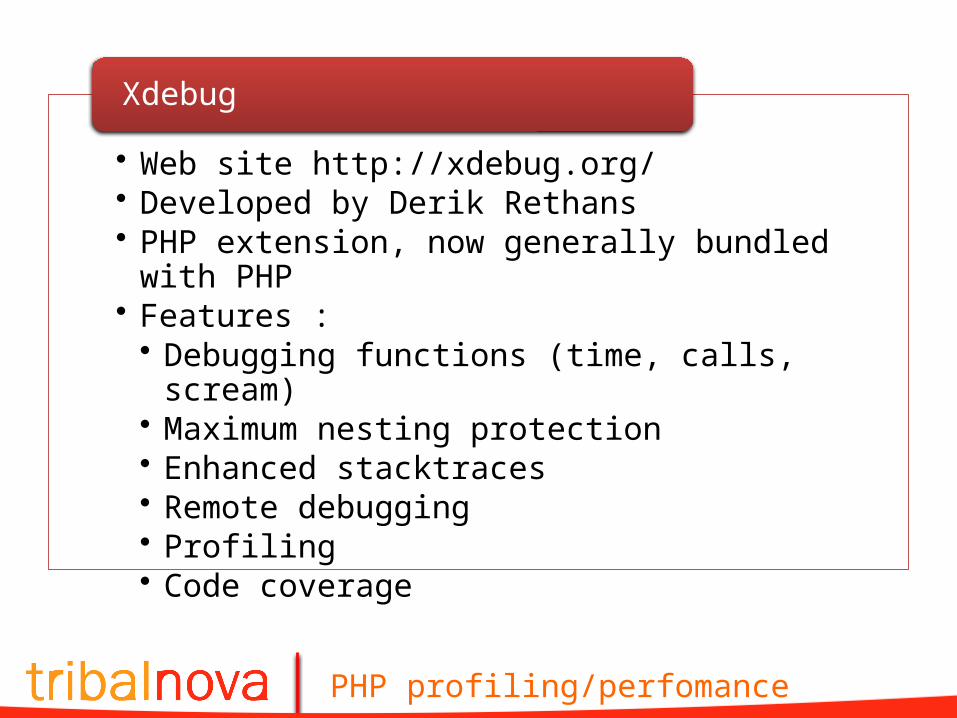
• Web site http://xdebug.org/• Developed by Derik Rethans• PHP extension, now generally bundled with PHP• Features :
• Debugging functions (time, calls, scream) • Maximum nesting protection• Enhanced stacktraces• Remote debugging• Profiling• Code coverage
Xdebug
PHP profiling/perfomance
Xdebug notes about debugging
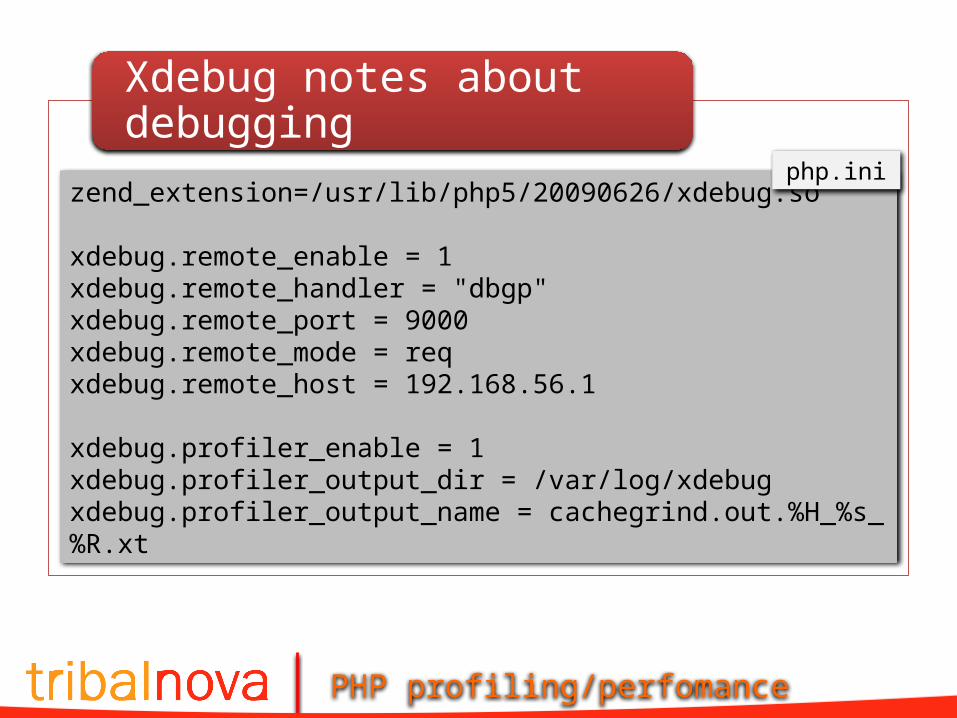
zend_extension=/usr/lib/php5/20090626/xdebug.so
xdebug.remote_enable = 1xdebug.remote_handler = "dbgp"xdebug.remote_port = 9000xdebug.remote_mode = reqxdebug.remote_host = 192.168.56.1
xdebug.profiler_enable = 1xdebug.profiler_output_dir = /var/log/xdebugxdebug.profiler_output_name = cachegrind.out.%H_%s_%R.xt
php.ini
PHP profiling/perfomance
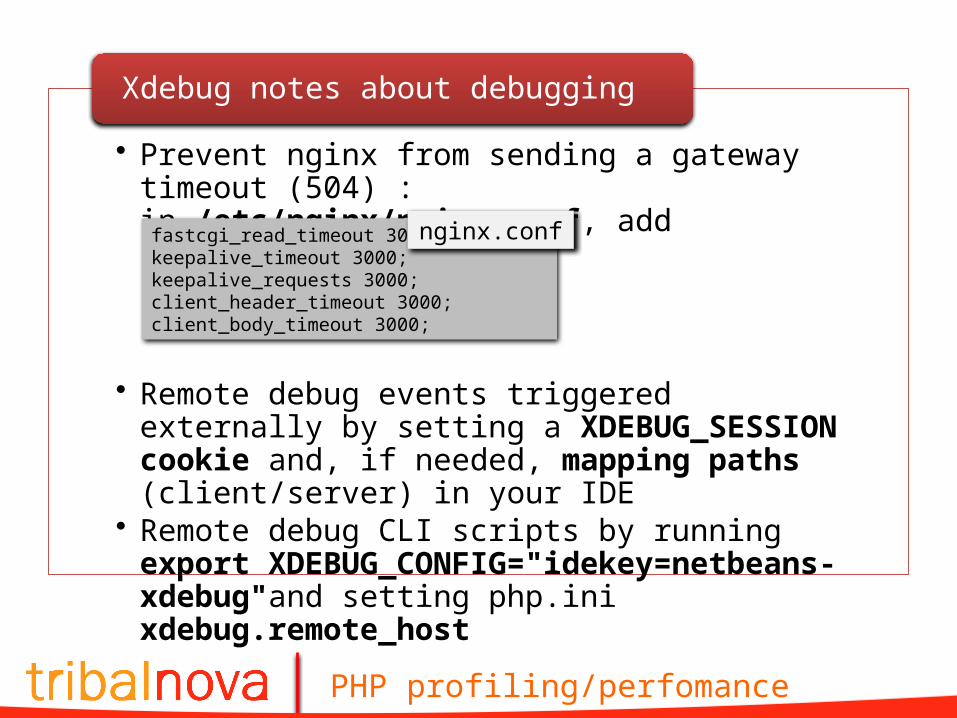
• Prevent nginx from sending a gateway timeout (504) :in /etc/nginx/nginx.conf, add
• Remote debug events triggered externally by setting a XDEBUG_SESSION cookie and, if needed, mapping paths (client/server) in your IDE
• Remote debug CLI scripts by running export XDEBUG_CONFIG="idekey=netbeans-xdebug"and setting php.ini xdebug.remote_host
Xdebug notes about debugging
fastcgi_read_timeout 3000; keepalive_timeout 3000; keepalive_requests 3000; client_header_timeout 3000; client_body_timeout 3000;
nginx.conf
PHP profiling/perfomance
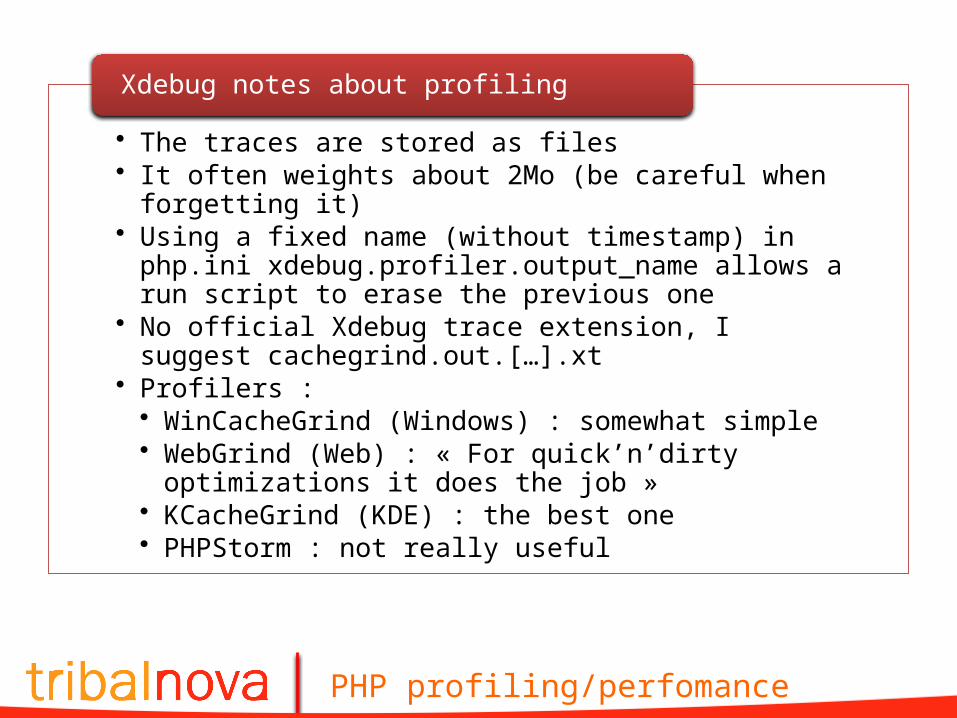
• The traces are stored as files• It often weights about 2Mo (be careful when forgetting it)• Using a fixed name (without timestamp) in php.ini
xdebug.profiler.output_name allows a run script to erase the previous one
• No official Xdebug trace extension, I suggest cachegrind.out.[…].xt
• Profilers :• WinCacheGrind (Windows) : somewhat simple• WebGrind (Web) : « For quick’n’dirty optimizations it does the
job »• KCacheGrind (KDE) : the best one• PHPStorm : not really useful
Xdebug notes about profiling
PHP profiling/perfomance
• To run it under Windows, use KDE4Win (package system similar to Cygwin’s one), it should be in the « kdesdk » package. Not available on all mirrors.
• Install GraphViz to enable drawing some charts (and add its /bin directory the the PATH)
• Check the Call Graph view!
kCacheGrind
PHP profiling/perfomance
• About different times :• The wall time includes I/O (network latency, database
accesses, waiting for an user input…)• The including time includes the children call• The CPU exclusion time (self time in KCacheGrind) is the
more relevant value• Switch between display formats :
• Percentage is better for comparing values• Time is better for assessing values
• Tweaking script parameters (input configuration, number of entries processed in database, number of iterations…) may allow to observe different phenomena
Notes about profiling
![Blackfire.io - Fire up your php app performance [Jan Kopp] (7. sraz, Praha)](https://static.fdocument.pub/doc/165x107/58728ac91a28ab36118b5087/blackfireio-fire-up-your-php-app-performance-jan-kopp-7-sraz-praha.jpg)


![[deprecated]Dicas para aumentar a performance de um software PHP](https://static.fdocument.pub/doc/165x107/5598f99a1a28ab73278b4844/deprecateddicas-para-aumentar-a-performance-de-um-software-php.jpg)