Highway Spending - Minnesota Legislature€¦ · · 2009-07-14Highway Spending Report #97-06...
129
Highway Spending Report #97-06 March 1997 A Program Evaluation Report Photo courtesy of the Minnesota Department of Transportation Office of the Legislative Auditor State of Minnesota Centennial Office Building, 658 Cedar Street, St. Paul, MN 55155 • 612/296-4708
Transcript of Highway Spending - Minnesota Legislature€¦ · · 2009-07-14Highway Spending Report #97-06...

Highway SpendingReport #97-06
March 1997
A P r o g r a m E v a l u a t i o n R e p o r t
Photo courtesy of the Minnesota Department of Transportation
Office of the Legislative AuditorState of Minnesota
Centennial Office Building, 658 Cedar Street, St. Paul, MN 55155 • 612/296-4708

STATE OF MINNESOTA
OFFICE OF THE LEGISLATIVE AUDITORCENTENNIAL BUILDING, 658 CEDAR STREET • ST. PAUL, MN 55155 • 612/296-4708 • TDD RELAY 612/297-553
JAMES R. NOBLES, LEGISLATIVE AUDITOR
March 31, 1997
MembersLegislative Audit Commission
For the past several years, policy makers have debated the need for additional highway fundi ng. InMay 1996, the Legislative Audit Commission asked us to evaluate the condition of and fundin g forthe State Trunk Highway System.
We found that the Minnesota Department of Transportation (Mn/DOT) has generally been able t okeep trunk highway roads and bridges in good condition. Relatively stable highway construct ionprices in the 1980s and 1990s have helped maintain the purchasing power of the Trunk HighwayFund.
However, some trunk highway needs have not been fully addressed and will be difficult to addre ssin the future under current funding projections. The system faces a backlog of bridges with struc-tural deficiencies and is likely to experience further growth in traffic congestion. In a ddition, with atight budget and many pressing problems, Mn/DOT probably does not perform enough preventivemaintenance on some highways and bridges.
We think that public policy debates would benefit from more systematic information than has beenpresented in the past. We recommend that Mn/DOT should periodically prepare a report on thefunding needs of the trunk highway system. Unlike previous efforts, the report should defin e needsin terms of what funding is necessary to achieve specific performance targets and should inc orpo-rate benefit-cost criteria where appropriate.
Our report was researched and written by John Yunker (project manager) and Carrie Meyerhoff ,with the assistance of Amy Zimmer. We received the full cooperation of the Minnesota Depa rtmentof Transportation and all of its division and district offices.
Sincerely,
James Nobles Roger BrooksLegislative Auditor Deputy Legislative Auditor

Table of Contents
Page
SUMMARY xi
INTRODUCTION 1
1. BACKGROUND 5System SizeFunding SourcesSpendingMn/DOTSummary
2. TRUNK HIGHWAY TRENDS 23ResourcesPavementsBridgesCongestionSafetySummary
3. PROJECTIONS 49RevenuesSpendingImplicationsAdequacy of FundingSummary
4. PREVENTIVE MAINTENANCE 69DefinitionResearchMn/DOT PracticesRecommendations

Page
5. LANE AND SHOULDER WIDTH STANDARDS 91Rural HighwaysCurrent and Proposed StandardsComparison with Other StatesDiscussion of Task Force’s RecommendationsSummary
AGENCY RESPONSE 109
RECENT PROGRAM EVALUATIONS Back Cover
vi HIGHWAY SPENDING

List of Tables and Figures
Page
Table 1.1 Miles of Roads and Traffic by Type of Road, Minnesota, 1994 6Table 1.2 Miles of State Trunk Highways, 1984 and 1996 8Table 1.3 Miles of Roads and Traffic by Jurisdiction, Minnesota, 1993 8Table 1.4 Share of Highway and Street Expenditures by Revenue
Source, 1993 9Table 1.5 Spending on State and Local Roads, Minnesota and the
United States, 1993 14Table 1.6 Trends in State and Local Highway Spending, Minnesota and
the United States, 1977-93 16Table 1.7 Trends in Trunk Highway Spending by the Minnesota
Department of Transportation, 1977-93 16Table 1.8 Full-Time Mn/DOT Employees, June 1996 22Table 2.1 Percentage Change in Trunk Highway Fund Revenues by
Source, 1974-96 24Table 2.2 Percentage Change in Trunk Highway Fund Expenditures
by Type, 1974-96 26Table 2.3 Percentage Change in Trunk Highway Fund Expenditures
on Highway Construction, 1974-96 26Table 2.4 Number of Full-Time and Part-Time Employees of the
Minnesota Department of Transportation, 1985-96 28Table 2.5 Percentage of State Trunk Highway Miles and Traffic, 1995 29Table 2.6 State Trunk Highway Miles by Type of Pavement and
Surface, 1996 30Table 2.7 Pavement Quality Index for State Trunk Highways by Type
of Highway, 1996 32Table 2.8 Average Surface and Pavement Ages, 1985 and 1995 35Table 2.9 Change in Pavement and Surface Composition of State Trunk
Highways, 1985-95 36Table 2.10 Average Condition Ratings for Trunk Highway Bridges and
Culverts, 1995 39Table 2.11 Deficient Trunk Highway Bridges, 1990 and 1995 40Table 2.12 Type of Deficiency for Trunk Highway Bridges, 1995 41Table 2.13 Average Age of Trunk Highway Bridges 43Table 2.14 Percentage of Streets and Highways with Significant
Congestion, 1984 and 1994 44

Page
Table 3.1 Comparison of Projected 1997-2001 Trunk Highway Fund Revenues with the 10-Year Average for 1987-96 50
Table 3.2 Comparison of Projected 1997-2001 Trunk Highway Expenditures with the 10-Year Average for 1987-96 52
Table 3.3 Expected Impact of Funding on the State Trunk Highway System 56
Table 4.1 States’ Reported Increase in Pavement Life Attributed to Preventive Maintenance Activities 73
Table 4.2 Miles of Selected Activities on the State Trunk Highway System, 1986-95 76
Table 4.3 Questionnaire Responses on Adequacy of Pavement Preventive Maintenance 79
Table 4.4 Questionnaire Responses on Adequacy of Bridge Preventive Maintenance 82
Table 4.5 Bridge Expansion Joint Condition 83Table 4.6 Flushing Activity on State Trunk Highway Bridges, Calendar
Years 1994-95 84Table 4.7 Bridge Flushing Inside the Twin Cities Interstate 494-694
Loop, Calendar Years 1994-95 85Table 4.8 Mn/DOT Managers’ Opinions on Cost-Effectiveness of
Preventive Maintenance 86Table 5.1 Miles of Rural State Trunk Highways by Lane Width and
Average Daily Traffic, 1996 92Table 5.2 Miles of Rural Paved County State-Aid Highways by Lane
Width and Projected Average Daily Traffic, 1996 93Table 5.3 Current and Proposed Construction/Reconstruction
Standards for Low Volume Rural State Trunk Highways and County State-Aid Highways, 1996 94
Table 5.4 Impact of Proposed Construction/Reconstruction Standards for Rural State Trunk Highways and County State-Aid Highways With Average Daily Traffic Less Than 2,000 Vehicles 95
Table 5.5 Current and Proposed Reconditioning Standards for Low Volume Rural State Trunk Highways and County State- Aid Highways, 1996 96
Table 5.6 Impact of Proposed Reconditioning Standards for Rural State Trunk Highways and County State-Aid Highways 98
Table 5.7 Proposed Minnesota and Nationally Recommended Construction/Reconstruction Standards for Low Volume Rural Highways, 1996 99
Table 5.8 Impact of Nationally Recommended Construction/ Reconstruction Standards for Paved Low Volume Rural Highways on Minnesota’s Trunk Highways and County State-Aid Highways 100
Table 5.9 Lane Width of Existing Rural Roads, Minnesota and Other States, 1994 102
viii HIGHWAY SPENDING

Page
Table 5.10 Lane Width of Existing Rural Roads by Functional Class, Minnesota and the United States, 1994 102
Table 5.11 Costs Per Mile for Reconstruction of a Rural Two-Lane Highway 105
Figure 1 State Trunk Highway Revenues and Expenditures, 1996 xiFigure 2 Trunk Highway Fund Revenues, Actual and Projected,
1974-2001 xiFigure 3 Trunk Highway Fund Expenditures, Actual and Projected,
1974-2001 xiiiFigure 4 Pavement Quality for State Trunk Highways, 1996 xiiiFigure 5 Pavement Quality Ratings for State Trunk Highways,
1985-96 xivFigure 6 Age of Bridges and Culverts, 1995 xviFigure 7 Benefit-Cost Ratio for Constructing 12-Foot Lanes Instead
of 11-Foot Lanes by Average Daily Traffic xxiiFigure 1.1 Functional Classifications of Highways 7Figure 1.2 Distribution of Minnesota Highway User Taxes (in Millions
of Dollars), 1996 11Figure 1.3 Sources of Revenues for State-Administered Highways, 1994 12Figure 1.4 Sources of Revenues for Locally-Administered Highways,
1993 13Figure 1.5 State Trunk Highway Expenditures, FY 1996 17Figure 1.6 Expenditures in the State Road Construction Program, 1996 18Figure 1.7 Minnesota Department of Transportation Organization
Chart, September 1996 20Figure 1.8 Minnesota Department of Transportation Districts 21Figure 2.1 Trunk Highway Fund Revenues by Source, 1974-96 24Figure 2.2 Trunk Highway Fund Expenditures by Type, 1974-96 27Figure 2.3 Pavement Quality Ratings for State Trunk Highways, 1985-96 31Figure 2.4 Distribution of Overall Pavement Quality for State Trunk
Highways, 1996 32Figure 2.5 Average Sufficiency Rating for Trunk Highway Bridges,
1986-95 38Figure 2.6 Average Condition Ratings for Trunk Highway Bridges,
1986-95 39Figure 2.7 Age of Bridges and Culverts by Year Built, 1995 43Figure 2.8 Fatality Rate per 100 Million Vehicle Miles Traveled,
Minnesota and the US, 1975-94 45Figure 3.1 Trunk Highway Fund Revenues, Actual and Projected,
1987-2001 51Figure 3.2 Trunk Highway Construction Expenditures, Actual and
Projected, 1987-2001 53Figure 3.3 Other Trunk Highway Expenditures by Mn/DOT, Actual
and Projected, 1987-2001 54
LIST OF TABLES AND FIGURES ix

Page
Figure 3.4 Year-End Balances in the Trunk Highway Fund, Actual and Projected, 1987-2001 55
Figure 3.5 Average Annual Miles of Resurfacing, Reconditioning, and Reconstruction Work on Trunk Highways, Actual and Projected 58
Figure 4.1 Preventive Maintenance Activities for Bituminous and Bituminous-over-concrete Pavement 70
Figure 4.2 Preventive Maintenance Activities for Concrete Pavement 71Figure 4.3 Preventive Maintenance Activities for Bridges 72Figure 4.4 Responses to the Preventive Maintenance Questionnaires 78Figure 5.1 Benefit-Cost Ratio for Constructing 12-Foot Lanes Instead
of 11-Foot Lanes by Average Daily Traffic 105
x HIGHWAY SPENDING

MINNESOTA OFFICE OF THE LEGISLATIVE AUDITOR
Highway SpendingSUMMARY
By some accounts, highway infrastructure in Minnesota is in tough shape.Transportation spending has been the slowest growing category of stateand local government spending over the last 20 or so years. Since 1972,
transportation spending in Minnesota has shrunk from 13 to 8 percent of state andlocal government spending. Meanwhile, traffic on Minnesota’s roads hasincreased about 80 percent. Some concerned groups also point to national datashowing Minnesota’s trunk highways to be in much worse condition than thenational average. However, data also indicate that state and local governments inMinnesota generally spend about 40 to 60 percent more per capita on highwaysthan the national average.
In this report, we attempt to resolve some of these apparently conflicting facts.We focus primarily on the State Trunk Highway (STH) system in Minnesota.While trunk highways account for only 9 percent of the miles of roads inMinnesota, they are the ‘‘backbone’’ of the state’s road system and carry nearly 60percent of the state’s traffic. The Minnesota Department of Transportation(Mn/DOT) is responsible for the construction, repair, and maintenance of trunkhighways and, over the last 10 years, has spent an average of about $775 millionannually (in 1996 dollars) on the trunk highway system. In particular, we addressthe following issues:
• How does Minnesota’s road system and level of road spendingcompare with those in other states, and how does our trunk highwaysystem compare with other state-administered systems?
• How have trunk highway revenues and expenditures changed overtime?
• In what condition are state trunk highway pavements and bridges?
• How has the condition of trunk highway pavements and bridgeschanged since the mid-1980s?
• Given funding projections, how well will Mn/DOT be able to respondin the future to pavement and bridge deterioration, growing traffic,and other needs?

• To what extent does Mn/DOT perform adequate preventivemaintenance on trunk highway pavements and bridges?
• Is Mn/DOT appropriately reassessing its lane and shoulder widthstandards for low volume rural trunk highways and state-aid roads?
In carrying out this study, we interviewed Mn/DOT employees, as well astransportation planning officials at the Metropolitan Council. In addition tonumerous contacts with staff in Mn/DOT’s central office, we visited withemployees at each Mn/DOT district office and the Metropolitan Division. Weanalyzed a variety of data from Mn/DOT data systems, particularly the pavementand bridge management systems and, in evaluating preventive maintenancepractices, collected data from each district through several questionnaires andfollow-up interviews. Our research also included a review of relevant literatureon a variety of transportation topics.
TRUNK HIGHWAY SYSTEM
Minnesota has about 130,000 miles of roads--the fifth largest system in thenation--and in 1993 spent 52 percent more per capita on roads than the nationalaverage. Two factors contribute to Minnesota’s higher than average spending.First, the state has a large rural road system due to its low population density andlarge number of smaller than average sized farms. Second, Minnesota hasgenerally spent more per mile of road than the national averages for roads underthe jurisdiction of state and municipal governments.
Minnesota’s trunk highway system consists of about 12,000 miles of highways.Unlike Minnesota’s overall road network, the trunk highway system is not largeby national standards. While Minnesota’s spending per mile forstate-administered roads has generally been above the national average, it appearsto be lower than spending per mile for a comparison group of midwestern states.The national average for state-level spending per mile may be biased downwardbecause several eastern states have unusually large state systems including manylow-cost local roads.
TRUNK HIGHWAY REVENUES
The Trunk Highway Fund is the principal source of support for the trunk highwaysystem. There are three major sources of revenues for the fund: the state gasolinetax, motor vehicle registration taxes, and federal aid. Figure 1 shows the share offund revenues from each of these sources in 1996. The Trunk Highway Fundreceives about 60 percent of the proceeds of these two state-imposed taxes, whilecounties, cities, and townships receive the rest by virtue of the state constitutionand other laws.
Minnesota hasa large systemof local roadsbut an averagesized system ofstate roads.
xii HIGHWAY SPENDING

Inflation-adjusted revenues for the Trunk Highway Fund increased 16 percentbetween 1974 and 1996. However, as Figure 2 shows, revenues have variedsignificantly in the past largely due to fluctuations in the amount of federal aidreceived. Revenues in 1996 were about 14 percent lower than the peak reached in1985.
In the 1990s, overall revenues have been relatively stable even though thegasoline tax was last increased in 1988. Growth in gasoline consumption hasprevented gas tax revenues from losing significant ground due to inflation asoccurred during the 1980s. Over the next 5 years (1997-2001), we estimate
Figure 1: State Trunk Highway Revenues and Expenditures, 1996
Source: Minnesota Department of Transportation.
Gas Tax(35%)
Other(8%)Federal Aid
(26%)
VehicleRegistrationTax (31%)
Revenues
Road Operations(23%)
Other Depart-ments (9%)
Administration(4%)
Engineering &Research (13%)
Miscellaneous(3%)
RoadConstruction(48%)
Expenditures
$0
$300
$600
$900
$1,200
1974 1979 1984 1989 1994 1999
Millions of1996 Dollars
Year
Total
State
Federal
Figure 2: Trunk Highway Fund Revenues, Actualand Projected, 1974-2001
Source: Program Evaluation Division analysis of Mn/DOT data.
Revenues overthe next 5 yearsare expected tobe close to theaverage for thelast 10 years.
SUMMARY xiii
average annual revenues (in 1996 dollars) to be within 1 percent of the annualaverage for the last 10 years.
TRUNK HIGHWAY EXPENDITURES
In 1996, expenditures from the Trunk Highway Fund totaled $808 million. About91 percent of the spending was done by Mn/DOT, while other agencies--primarilythe Department of Public Safety--made about 9 percent of the expenditures. AsFigure 1 shows, nearly half of the spending out of the Trunk Highway Fund in1996 was for Mn/DOT’s road construction projects. Close to one-fourth was forMn/DOT’s road operations, including snow and ice control and routinemaintenance.
Although Trunk Highway Fund revenues have only increased 16 percent since1974, Mn/DOT’s road construction budget has benefited tremendously fromrelatively stable highway construction prices during the 1980s and 1990s. Since1974, the average annual inflation rate for highway construction in Minnesota hasbeen almost 2 percentage points less than the rate experienced by state and localgovernments. As a result, we estimate that:
• Inflation-adjusted spending on highway and bridge constructionincreased 52 percent from 1974 to 1996.
Other trunk highway spending increased 11 percent. Much of the growth in otherspending was due to spending on Mn/DOT’s road operations, which increased 24percent. Spending by Mn/DOT on general support and administration more thandoubled but accounts for less than 4 percent of total spending. Mn/DOT’sengineering and research spending declined 6 percent.
As Figure 3 indicates, trunk highway expenditures have fluctuated from year toyear. Construction spending, which is more dependent on federal aid, has variedthe most. In 1996, construction spending was about 20 percent below the peakreached in 1988. Total spending in 1996 was about 12 percent below its 1988peak.
Based on the Governor’s 1998-99 budget proposal and Mn/DOT’s projections forthe 2000-01 biennium:
• Average annual trunk highway construction spending (in 1996dollars) over the next 5 years is expected to be about 1 percent lessthan the annual average over the last 10 years.
Other categories of Trunk Highway Fund expenditures would increase morerelative to the 10-year average (1987-96). Other Mn/DOT spending is expected tobe about 6 percent higher than the historical average. Spending by otherdepartments is estimated to be about 10 percent higher under the Governor’sproposal, which includes funding to hire more state patrol officers.
The TrunkHighway Fundhas benefitedfrom relativelystableconstructionprices duringthe 1980s and1990s.
xiv HIGHWAY SPENDING
Beyond 2001, spending might not compare so favorably with historical averages.Under the Governor’s proposal, the amount of spending for construction and otherpurposes is expected to receive a boost during the 1997-99 period by the use ofthe available fund balance, which totaled $147 million at the end of 1996.However, by the end of 1999, the fund balance is estimated to be only $3 million.As a result, the Trunk Highway Fund may not be able to sustain the spendinglevels anticipated during the 1997-99 period.
PAVEMENTS
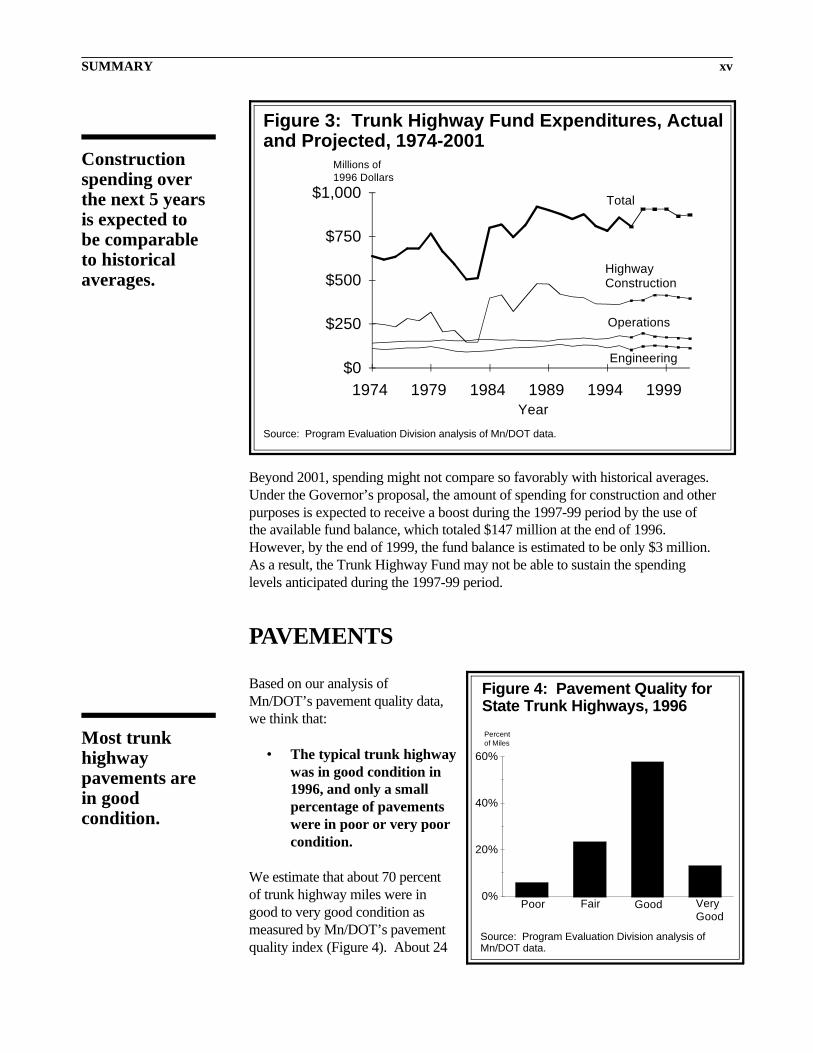
Based on our analysis ofMn/DOT’s pavement quality data,we think that:
• The typical trunk highwaywas in good condition in1996, and only a smallpercentage of pavementswere in poor or very poorcondition.
We estimate that about 70 percentof trunk highway miles were ingood to very good condition asmeasured by Mn/DOT’s pavementquality index (Figure 4). About 24
$0
$250
$500
$750
$1,000
1974 1979 1984 1989 1994 1999
Millions of1996 Dollars
Year
Total
HighwayConstruction
Operations
Engineering
Figure 3: Trunk Highway Fund Expenditures, Actualand Projected, 1974-2001
Source: Program Evaluation Division analysis of Mn/DOT data.
0%
20%
40%
60%
Poor Fair Good VeryGood
Percentof Miles
Figure 4: Pavement Quality forState Trunk Highways, 1996
Source: Program Evaluation Division analysis ofMn/DOT data.
Constructionspending overthe next 5 yearsis expected tobe comparableto historicalaverages.
Most trunkhighwaypavements arein goodcondition.
SUMMARY xv

percent were in fair condition in 1996, while only about 6 percent were in poor orvery poor condition. These measurements came prior to the winter of 1996-97which may have taken an unusually harsh toll on Minnesota’s roads, including itstrunk highways.
Our conclusions conflict with characterizations of Minnesota highway conditionsmade by Mn/DOT and the Federal Highway Administration. As Mn/DOT agrees,the federal data are invalid for comparison purposes across states because the datado not take into account the differences in equipment used to measure pavementsmoothness. But, we also disagree with the labels Mn/DOT has used tocharacterize pavement quality index numbers. The labels (such as ‘‘poor’’ or‘‘good’’) Mn/DOT has attached to various numbers are inconsistent with howMn/DOT’s Pavement Management Unit has calibrated the smoothness componentof the index. It is possible for a pavement to have a ‘‘fair’’ rating on smoothnessand the best possible rating on surface defects and yet be labeled as being in‘‘poor’’ condition by Mn/DOT.
Mn/DOT has been able to maintain relatively constant pavement quality on thetrunk highway system since at least the mid-1980s (Figure 5). Between 1985 and1996, the pavement quality index has increased about 2 percent. The average istoward the lower end of what we consider the ‘‘good’’ range for pavement quality.The pavement quality index consists of both a smoothness rating and a rating forsurface defects. Since 1985, the surface rating improved by about 6 percent,while the smoothness rating declined by about 3 percent.
Based on our assessment of the data on pavement quality, we do not thinkMn/DOT has a backlog of pavements in poor condition. However, a backlogwould develop if Mn/DOT reduced the average amount of resurfacing work itdoes annually. In fact, we think that:
2.2
2.6
3
3.4
3.8
1985 1990 1995
SurfaceRating
OverallQualitySmoothness
Year
Figure 5: Pavement Quality Ratings for State TrunkHighways, 1985-96
Source: Minnesota Department of Transportation.
Pavementquality hasincreasedslightly since1985.
xvi HIGHWAY SPENDING

• Mn/DOT may have to increase the rate at which it resurfaceshighways.
We used Mn/DOT’s Pavement Management System (PMS) to estimate thenumber of miles of resurfacing (including concrete pavement repair) necessaryover the 10-year period from 1996 through 2005 to maintain a constantsystemwide average pavement quality. The PMS predicts that between 13 and 28percent more miles of resurfacing activity annually will be necessary than wereactually done from 1986 to 1995.
This increased need may be the result of the aging of Minnesota’s trunk highways.The average pavement age on trunk highways increased from 32 to 40 years from1985 to 1995. Mn/DOT has been able to maintain its highways in relatively goodcondition by resurfacing them. In fact, the average age of trunk highway surfacesdeclined from 11.5 years in 1985 to 10.9 years in 1995. However, thecomposition of trunk highway pavements and surfaces has changed, and someengineers think that each successive resurfacing may not last as long as theprevious surface or the original surface. From 1985 to 1995, the percentage oftrunk highway miles with their original surfaces declined from 38 percent to 27percent.
It is also possible that the PMS is overstating the rate at which surface quality isdeteriorating. Mn/DOT needs to examine the PMS to see if it is accuratelypredicting the deterioration rate. In addition, Mn/DOT needs to consider whethergreater use of preventive maintenance might affect the need for resurfacing in thefuture and might reduce the estimated future costs of maintaining a constantpavement quality index.
BRIDGES
Trends show very slight changes in the condition of trunk highway bridges sincethe mid-1980s. The systemwide average bridge sufficiency rating improved lessthan 1 percent between 1986 and 1995. A sufficiency rating is an all-purposeindicator that measures structural adequacy, functional obsolescence, andessentiality for public use. Bridge condition ratings, which focus on structuralcondition, have declined slightly. The average systemwide condition ratings forbridge decks, superstructures, and substructures all decreased between 1 and 3percent. The percentage of bridges which are deficient by federal standards foreither structural or functional reasons has declined from 12.8 percent in 1990 to11.7 percent in 1995. The estimated costs of improving deficient bridges alsodeclined between 1990 and 1995. Longer trends are difficult to interpret becausethe federal criteria for identifying deficient bridges were changed several times inthe late 1980s.
Overall, we found that:
The aging ofthe trunkhighwaysystem mayrequireMn/DOT toresurfacehighways morefrequently inthe future.
SUMMARY xvii
• The typical trunk highway bridge is in good to fair condition, butthere is a backlog of bridges that are classified as having structuraldeficiencies.
Mn/DOT data indicate that 240 of the 4,614 trunk highway bridges had structuraldeficiencies which would cost an estimated $100 million to correct. This figure ismore than twice the average annual amount Mn/DOT spent on bridgereplacement, preservation, and safety improvements between 1991 and 1995.Mn/DOT also estimates that there are an additional 116 bridges for which bothcondition and functional problems exist. The functional problems includeinadequate width or clearance, as well as load restrictions. It would cost anestimated $95 million to correct deficiencies on these bridges, but Mn/DOT doesnot itemize the costs of correcting condition problems from width or otherfunctional deficiencies. Finally, another 185 bridges have functional deficiencieswhich would cost $127 million to correct. Clearly, there is a significant cost torepairing the trunk highway bridges identified as being structurally deficient. Weare less convinced of the need to improve or replace bridges simply because offunctional deficiencies. Such a project, generally designed to reduce accidents orcongestion, should only be undertaken if the benefits to highway users exceed thecosts of the project.
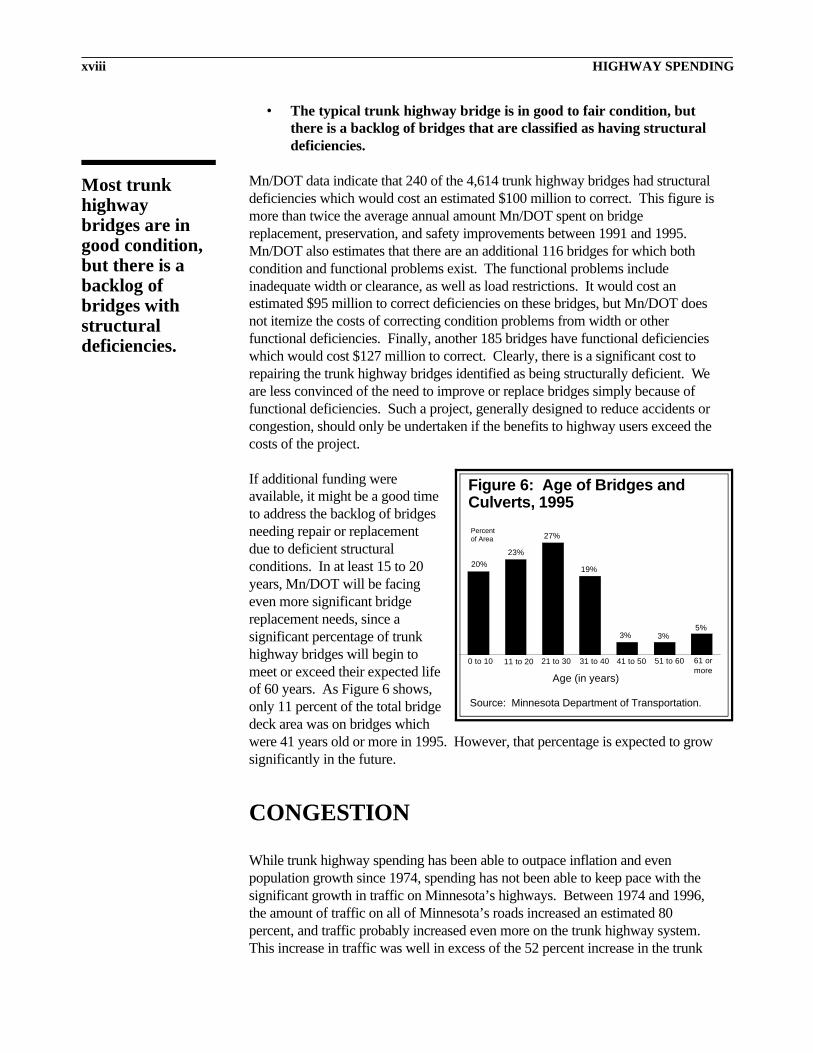
If additional funding wereavailable, it might be a good timeto address the backlog of bridgesneeding repair or replacementdue to deficient structuralconditions. In at least 15 to 20years, Mn/DOT will be facingeven more significant bridgereplacement needs, since asignificant percentage of trunkhighway bridges will begin tomeet or exceed their expected lifeof 60 years. As Figure 6 shows,only 11 percent of the total bridgedeck area was on bridges whichwere 41 years old or more in 1995. However, that percentage is expected to growsignificantly in the future.
CONGESTION
While trunk highway spending has been able to outpace inflation and evenpopulation growth since 1974, spending has not been able to keep pace with thesignificant growth in traffic on Minnesota’s highways. Between 1974 and 1996,the amount of traffic on all of Minnesota’s roads increased an estimated 80percent, and traffic probably increased even more on the trunk highway system.This increase in traffic was well in excess of the 52 percent increase in the trunk
Percentof Area
Age (in years)
0 to 10 11 to 20 21 to 30 31 to 40 41 to 50 51 to 60 61 ormore
20%23%
27%
19%
3% 3%5%
Figure 6: Age of Bridges andCulverts, 1995
Source: Minnesota Department of Transportation.
Most trunkhighwaybridges are ingood condition,but there is abacklog ofbridges withstructuraldeficiencies.
xviii HIGHWAY SPENDING
highway construction budget and the 11 percent increase in other spending out ofthe Trunk Highway Fund.
Highway spending does not necessarily need to grow as fast as the growth intraffic, particularly when there is excess capacity in the highway system.However, at some point, the capacity is exceeded on some highways and theamount of resources needed to manage or reduce congestion needs to beincreased. Also, as traffic has grown, so have the loads borne by trunk highwayslargely from truck traffic. This increase in pavement stress may cause problemsfor some highways not built to handle the loads they now carry.
The increase in travel has caused a significant increase in congestion on someinterstate highways, other freeways, and some principal arterials. The worstcongestion is in the 7-county Twin Cities metropolitan area, but there are trunkhighways in other parts of the state that are also congested. There is congestion attimes on some interstate highways outside the Twin Cities area, as well as othertrunk highways such as those in major tourism centers. The Metropolitan Councilis projecting that the number of congested miles on major highways in themetropolitan area will more than double between 1995 and 2020, even though theCouncil’s long-range plan for the area includes a number of important highwaycapacity improvements.
PREVENTIVE MAINTENANCE
Many studies have found preventive maintenance to be effective in extendingpavement life or improving pavement quality over what it would have been in theabsence of preventive maintenance. Preventive maintenance is generally done onpavements to keep moisture out of the pavement subbase or to maintain the abilityof the pavement to move due to temperature changes. Some of the benefits ofpreventive maintenance on pavements include less cracking and fewer potholesand pavement blowups. Bridge preventive maintenance can reduce the exposureof bridge components to corrosive de-icing chemicals and maintain the ability ofbridge components to expand and contract in response to temperature changes.
We asked key Mn/DOT managers around the state whether they felt that theirdistrict or maintenance area was doing the right amount of certain types ofpreventive maintenance. We also examined records indicating the amount ofpreventive maintenance which has been done in the past and used the recentlyrevised Pavement Management System to estimate how much of the trunkhighway system might benefit from preventive maintenance. In general, wefound that:
• Mn/DOT is probably not doing enough preventive maintenance.
The vast majority of Mn/DOT managers generally felt that the preventivemaintenance activities we asked about are cost-effective or would be if they wereused. For some activities, particularly newer technologies, a majority was not
Mn/DOTprobablyshould be doingmorepreventivemaintenance.
SUMMARY xix

sure. Roughly half of the Mn/DOT managers felt that their district ormaintenance area did not do enough of the preventive maintenance activities weidentified, although the answers varied depending on activity.
For bituminous pavements, managers were more concerned about the amount ofcrack filling, thin asphalt overlays, crack sealing, slurry sealing, andmicro-surfacing and somewhat less concerned about the amount of chip sealingthat is currently done. For concrete pavements, managers were more concernedabout joint sealing and repair and less concerned about retrofit load transfer whichis a new technique in the experimental phase. Some managers were particularlyconcerned that Mn/DOT does not address concrete joint problems in a timely wayand, as a result, more costly repairs are ultimately necessary.
For bridges, most Mn/DOT managers said not enough of the following types ofpreventive maintenance were being done: spot painting, cleaning and resealing ofdeck joints, lubrication of expansion bearings, and correction of approach panelsettlement. Sealing of cracks in concrete decks and reinstallation of stripneoprene glands in expansion joints were also a concern of some managers. Mostmanagers were satisfied with the amount of bridge flushing their districts ormaintenance areas performed. However, using the Bridge Management System,we found that bridge flushing is inadequate in several areas of state. While bridgeexperts recommend an annual bridge flushing to prevent concrete from crackingand scaling and steel components from corroding, the 1994-95 statewide averagewas about once every 3 years. The frequency was once every 6 years in the TwinCities metropolitan area and once every 10 years in District 1 (Duluth).
Based on responses from managers as well as our own assessment of Mn/DOT’sfinances, we think that:
• The principal reason Mn/DOT does not do more preventivemaintenance is that it has more pressing needs.
Mn/DOT managers find it hard to justify allocating more money to preventivemaintenance when they have other significant needs such as roads in bad shape,deficient bridges, and safety and congestion concerns. For example, a number ofMn/DOT managers told us that they find it difficult to justify doing preventivemaintenance on highways in fairly good condition when other highways are inworse condition. Even in those instances when Mn/DOT managers said theythought their district was doing enough of a certain preventive maintenanceactivity, half of them said they would spend more on the activity if additionalfunds were available. They felt they were doing the best they could given fundingconstraints.
Unfortunately, however, the effect of these funding constraints may be to increasethe long-run costs of maintaining the trunk highway system in good condition. IfMn/DOT were able to fund more preventive maintenance, it would likely incursome additional initial costs but would hopefully be able to reduce the number ofhighway miles and bridges needing more significant work in the long run and may
Preventivemaintenance isimportant incontrollinglong-run costsbut is hard tofund givenmore pressingproblems.
xx HIGHWAY SPENDING

be able to reduce the amount of necessary maintenance work such as potholepatching.
We think that:
• Mn/DOT is moving in the right direction but needs to take a morestrategic approach to preventive maintenance on the state’s trunkhighways.
In recent years, Mn/DOT has shown more interest in preventive maintenance. Adepartment team wrote a report on the advantages of preventive maintenance forpavements. The team recognized the possibility of using the PavementManagement System to suggest and evaluate preventive maintenance activities.Prior to that time the system had been only used to suggest more costlyrehabilitation options for pavements in relatively poor condition. Mn/DOT hasnow developed decision criteria which will help districts select preventivemaintenance activities for pavements in better condition. Also, the department, incooperation with local governments, is conducting research on preventivemaintenance for pavements. We are concerned that current practices will notchange, however, unless Mn/DOT establishes a separate category of preventivemaintenance funding which cannot be used for other activities.
ADEQUACY OF FUNDING
In recent years, policy makers have been deadlocked over the issue of providingadditional revenues for highways in Minnesota. Funding for transit has also beena key issue. Our study was limited to an examination of the trunk highway systemand did not include an assessment of highway funding adequacy for counties andcities, which would also benefit from an increase in highway user taxes. Inaddition, we were not able to study Minnesota’s transit needs.
In general, we found that:
• Mn/DOT does not have adequate estimates of the funding needed tomaintain current pavement quality and bridge condition ratings onthe trunk highway system.
Mn/DOT has not developed an estimate of the funding needed for highwaypreservation and replacement in order to maintain a constant systemwide averagepavement quality. In addition, the estimate developed by Mn/DOT for bridgepreservation and replacement needs should be revised because it overstates bridgereplacement needs in some respects but also does not fully account for theemerging problems Mn/DOT is likely to face with steel fatigue on some bridges.The revised estimate should also be linked to a performance target such as aconstant systemwide average for bridge condition ratings. Furthermore:
Mn/DOT needsto developbetterestimates of itspavement andbridgepreservationandreplacementneeds.
SUMMARY xxi

• Because the use of benefit-cost analysis in Mn/DOT is still in adevelopmental stage, there is little systematic information on whetherexpansion and improvement projects planned for future years areworthwhile from a benefit-cost standpoint.
The adequacy of funding should not be measured by simply comparing availablefunds to a list of potential projects. Such comparisons invariably have shown thatinfrastructure needs exceed available funding. Expansion or improvementprojects that cost more than their estimated benefits, such as those measured byreduced highway user costs or the value of reduced accidents, should not beconsidered a system need.
We recommend that:
• Mn/DOT should periodically prepare a report on the funding needs ofthe trunk highway system. Needs should be defined in terms of whatfunding is necessary to achieve specific performance targets andshould incorporate benefit-cost criteria where appropriate andfeasible.
Despite the difficulties we had in arriving at any precise estimate of trunkhighway funding needs, we think that:
• Projected funding is probably not adequate to address all ofMinnesota’s trunk highway needs.
Mn/DOT’s funding has not been sufficient for it to fully fund mega-projects onTwin Cities area freeways. These projects have had to be delayed. Parts of theprojects are scheduled to be implemented in piecemeal fashion over a period ofmany years. In addition, funding is not sufficient to fully address the backlog ofstructurally deficient bridges, perform adequate preventive maintenance on trunkhighways and bridges, and reconstruct those heavily used highways which may bemore cost-effective to reconstruct than to overlay frequently.
We think the executive and legislative branches need to cooperate to ensure thatMinnesota is not ‘‘penny wise and pound foolish. ’’ It may take an increase intaxes in order for Mn/DOT to implement practices and projects which more thanpay for themselves by generating benefits in excess of their costs. In order forthat cooperation to occur, Mn/DOT needs to thoroughly assess its trunk highwayneeds. Needs should be linked to performance targets and tied to benefit-costanalysis as much as possible so that the assessment of needs is not simply thecompilation of a ‘‘wish list.’’
Mn/DOTshould betterdefine itsfunding needsandperiodicallyreport on them.
Projectedfunding isprobablyinsufficient tomeet trunkhighway needs.
xxii HIGHWAY SPENDING

LANE AND SHOULDER WIDTHSTANDARDS
In its 1995 report entitled Within Our Means: Tough Choices for GovernmentSpending, Minnesota Planning recommended a variety of ways in which state andlocal governments could make more effective use of their resources. Onerecommendation was to reduce right-of-way, lane width, and other standards forhighways, particularly low volume rural roads. In response, Mn/DOT establisheda Geometric Design Standards Task Force to review lane and shoulder widthstandards for rural trunk highways and state-aid highways which serve fewer than2,000 vehicles per day. In December 1996, the Task Force finalized itsrecommendations and passed them on to the Commissioner of Mn/DOT and theCounty Highway Engineers Association. As part of our study, we examined thework of the Task Force. We found that:
• While the Task Force has made a number of useful recommendations,particularly new lane and shoulder width standards for reconditioning(or resurfacing) projects, the Task Force’s recommended constructionor reconstruction standards are inconsistent with Mn/DOT’s ownbenefit-cost analysis and reputable national studies.
The Task Force’s recommended reconditioning standards seem practical and mayhelp to reduce the number of highways which are required to be reconstructedbecause of their current lane or shoulder width. For many low volume ruralhighways, it makes more sense to permit Mn/DOT districts and counties topreserve their existing roads with a less costly resurfacing project than to requiretotal reconstruction.
However, the Task Force’s recommended construction and reconstructionstandards are relatively unchanged from existing standards for both trunkhighways and county state-aid highways. In particular, the Task Force retainedthe requirement that all paved roads have at least 12-foot lanes and 4-footshoulders regardless of traffic volumes. Like reputable national studies,Mn/DOT’s own benefit-cost analysis shows that the costs of constructing 12-footlanes outweigh the potential accident reduction benefits for lesser-traveled ruralhighways. For example, using Mn/DOT’s data and assumptions, Figure 7 showsthat the costs of constructing a highway with 12-foot lanes and 4-foot shoulders(rather than 11-foot lanes and 4-foot shoulders) exceed the benefits for highwayswith traffic volumes below about 1,100 to 1,200 vehicles per day. Judging frombetter cost data on county state-aid highways, we think that 11-foot lanes mightbe cost-effective at traffic volumes up to 1,500 or possibly 2,000 vehicles per day.
The Task Force cited a number of reasons for recommending standards notsupported by Mn/DOT’s benefit-cost analysis. However, we do not think that theTask Force thoroughly evaluated these additional factors. For example, the TaskForce report cited some shoulder maintenance concerns for highways with 11-footlanes but did not mention the additional pavement maintenance and rehabilitationcosts which would be incurred with 12-foot lanes.
Mn/DOT’sTask Force hasmade usefulrecommenda-tions forresurfacingprojects.
SUMMARY xxiii

Minnesota already has more rural roads with 12-foot lanes than the nationalaverage. In addition, the Task Force’s recommendation maintains a lane widthstandard in excess of nationally recommended standards such as thoserecommended in a 1994 report prepared for the National Highway CooperativeResearch Program (NCHRP) by the Transportation Research Board and NationalResearch Council. The adoption of the NCHRP recommendations instead of theTask Force’s recommendation could potentially affect about 600 miles of trunkhighways and more than 8,500 miles of county state-aid highways, which wouldno longer be considered substandard. It would also mean that more of the stateaid for county state-aid highways could be directed toward preservation ofexisting highways or other important needs.
We urge Mn/DOT and the Task Force to reconsider the recommendation forconstruction and reconstruction projects. Given the fiscal realities facing state andlocal governments in Minnesota, it is important that every reasonable effort bemade to maximize the cost-effectiveness of government spending. Mn/DOT andlocal governments need to focus on preserving existing infrastructure and shouldimprove or expand infrastructure only when it makes sense from a benefit-coststandpoint. Governments cannot afford to focus on building the best possibletransportation system.
Costs exceedbenefits
Benefitsexceed costs
20001500500 1000
Average Daily Traffic
2.0
1.0
0
Benefit-CostRatio
Figure 7: Benefit-Cost Ratio for Constructing12-Foot Lanes Instead of 11-Foot Lanes by AverageDaily Traffic
Source: Minnesota Department of Transportation.
Therecommendedconstructionandreconstructionstandards forlane width arenot supportedby nationalstudies orMn/DOT’s ownbenefit-costanalysis.
xxiv HIGHWAY SPENDING

Introduction
The maintenance and construction of highways and bridges are essentialgovernment functions. In today’s increasingly mobile society, highwayscarry over 90 percent of personal travel. Per capita highway travel in the
United States exceeds that in other major countries and is growing. In Minnesota,highway travel increased 35 percent from 1985 to 1995, while population in -creased only about 10 percent.
Concerns have been raised, however, about whether highway funding has keptpace with infrastructure needs. In 1995, the United States Department of Trans -portation estimated that the annual capital cost to maintain current highway andbridge conditions and performance over the 20-year period from 1994 through2013 would significantly exceed current annual capital expenditures. While an es -timated $55 billion would be required annually to maintain the current conditionand performance of the nation’s highways and bridges, only $39 billion per yearwas spent in 1993. The department estimated that an additional $15 billion in an -nual spending would be desirable from an economic perspective, considering thebenefits and costs of highway improvements, and another $4 billion per yearwould be required to eliminate all current bridge deficiencies. 1
In Minnesota, highway spending has generally kept pace with inflation and popu -lation growth but not with the growth in traffic. Highway spending has also notkept pace with the growth in personal income or other government spending. Min -nesota’s state and local government spending on transportation declined fromabout 3.0 to 2.2 percent of personal income from 1972 to 1992. The share of stateand local government spending devoted to highway spending has fallen from 13to 8 percent.
It remains to be seen whether highway spending in Minnesota has been sufficientto maintain the current highway system in good condition and respond adequatelyto increased traffic levels. Highway spending does not necessarily have to growas fast as other government spending or personal income in order to be adequate.Furthermore, highway spending has not always needed to grow as fast as traffic,especially when there was excess capacity in the highway system.
1 United States Department of Transportation, 1995 Status of the Nation’s Surface TransportationSystem: Conditions and Performance, Report to Congress (October 27, 1995), 190. The depart-ment’s estimates of future needs are in 1994 dollars.

In this report, we focus on the State Trunk Highway (STH) System, which is theresponsibility of the Minnesota Department of Transportation (Mn/DOT). Thetrunk highway system carries about 59 percent of Minnesota’s traffic and accountsfor roughly 40 percent of all highway spending but includes only about 9 percentof the street and highway miles in Minnesota.
The report addresses the following questions:
• How does Minnesota’s road system and level of road spendingcompare with those in other states, and how does our trunk highwaysystem compare with other state-administered systems?
• How have trunk highway revenues and expenditures changed overtime?
• In what condition are state trunk highway pavements and bridges?
• How has the condition of trunk highway pavements and bridgeschanged since the mid-1980s?
• Given funding projections, how well will Mn/DOT be able to respondin the future to pavement and bridge deterioration, growing traffic,and other needs?
• To what extent does Mn/DOT perform adequate preventivemaintenance on trunk highway pavements and bridges?
• Is Mn/DOT appropriately reassessing its lane and shoulder widthstandards for low volume rural trunk highways and state-aid roads?
During our research, we interviewed numerous Mn/DOT employees throughoutthe organization. In addition to contacts with various central office staff, we vis -ited each of the seven outstate Mn/DOT districts, as well as the Metropolitan Divi -sion. We discussed the challenges faced by and the resources available to eachorganization with the district (or division) management teams. We also inter -viewed transportation planning officials at the Metropolitan Council.
We analyzed a variety of data from Mn/DOT information systems, particularly thepavement and bridge management systems, and collected data from district per -sonnel about preventive maintenance practices. Our research also included a re -view of relevant literature on a variety of transportation topics.
Chapter 1 of this report provides background information on Minnesota’s high -ways and the Minnesota Department of Transportation and compares Minnesota’shighways, and the trunk highway system, with those in other states. Chapter 2 re -views the condition of Minnesota’s trunk highways and bridges and analyzes thetrends affecting the trunk highway system. In Chapter 3, we examine Mn/DOT’sability to address pavement and bridge needs, given revenue projections based oncurrent law. Chapter 4 evaluates Mn/DOT’s preventive maintenance practices in
2 HIGHWAY SPENDING

light of studies of preventive maintenance and comments from Mn/DOT manag -ers located throughout the state. Finally, Chapter 5 reviews Mn/DOT’s recent ef -forts to reexamine highway standards for rural trunk highways and state-aidhighways. We evaluate the work of the Mn/DOT-sponsored task force, which re -viewed existing lane and shoulder width standards for rural highways with lowtraffic volumes.
INTRODUCTION 3

BackgroundCHAPTER 1
Minnesota has an extensive system of streets and highways. TheMinnesota Department of Transportation (Mn/DOT) is responsible formaintenance and construction work on the State Trunk Highway
System, which includes many of the most heavily traveled highways in the state.Most of the other roads are under the jurisdiction of counties, cities, or townships.
In this chapter, we provide general information on Minnesota’s highways andcompare Minnesota with other states. In particular, we address the followingquestions:
• How does Minnesota’s overall highway spending and network ofroads compare with other states?
• What portions of Minnesota’s highway system and spending are onthe State Trunk Highway System?
• How does Minnesota’s State Trunk Highway System compare withstate-administered systems elsewhere?
• How are highway construction and maintenance funded in Minnesota?
• How is the Minnesota Department of Transportation organized andhow does the department make decisions about highway projects?
SYSTEM SIZE
All Streets and HighwaysMinnesota has about 130,000 miles of streets and highways--the fifth largestsystem in the nation after Texas, California, Illinois, and Kansas. Minnesota’slarge network of roads is largely due to the size of its rural road system.Minnesota has the third largest system of rural roads but ranks only 21st in thenumber of urban miles of road.
As Table 1.1 shows:
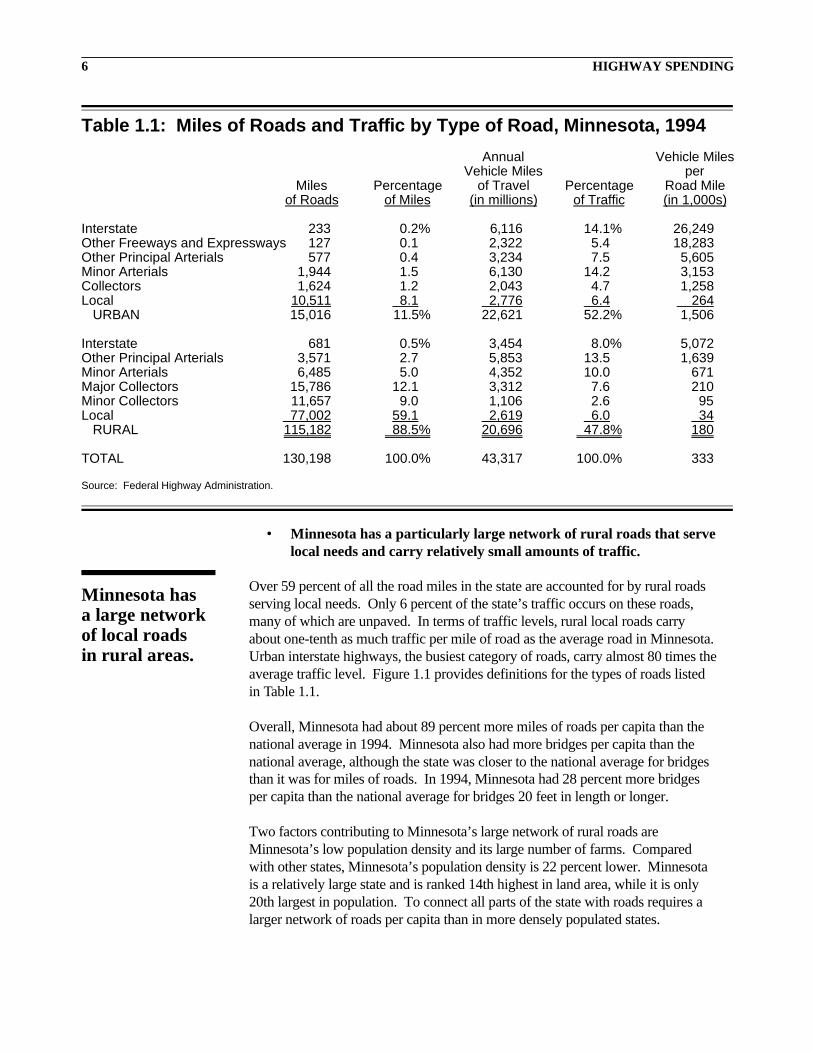
• Minnesota has a particularly large network of rural roads that servelocal needs and carry relatively small amounts of traffic.
Over 59 percent of all the road miles in the state are accounted for by rural roadsserving local needs. Only 6 percent of the state’s traffic occurs on these roads,many of which are unpaved. In terms of traffic levels, rural local roads carryabout one-tenth as much traffic per mile of road as the average road in Minnesota.Urban interstate highways, the busiest category of roads, carry almost 80 times theaverage traffic level. Figure 1.1 provides definitions for the types of roads listedin Table 1.1.
Overall, Minnesota had about 89 percent more miles of roads per capita than thenational average in 1994. Minnesota also had more bridges per capita than thenational average, although the state was closer to the national average for bridgesthan it was for miles of roads. In 1994, Minnesota had 28 percent more bridgesper capita than the national average for bridges 20 feet in length or longer.
Two factors contributing to Minnesota’s large network of rural roads areMinnesota’s low population density and its large number of farms. Comparedwith other states, Minnesota’s population density is 22 percent lower. Minnesotais a relatively large state and is ranked 14th highest in land area, while it is only20th largest in population. To connect all parts of the state with roads requires alarger network of roads per capita than in more densely populated states.
Table 1.1: Miles of Roads and Traffic by Type of Road, Minnesota, 1994
Annual Vehicle MilesVehicle Miles per
Miles Percentage of Travel Percentage Road Mileof Roads of Miles (in millions) of Traffic (in 1,000s)
Interstate 233 0.2% 6,116 14.1% 26,249Other Freeways and Expressways 127 0.1 2,322 5.4 18,283Other Principal Arterials 577 0.4 3,234 7.5 5,605Minor Arterials 1,944 1.5 6,130 14.2 3,153Collectors 1,624 1.2 2,043 4.7 1,258Local 10,511 8.1 2,776 6.4 264 URBAN 15,016 11.5% 22,621 52.2% 1,506
Interstate 681 0.5% 3,454 8.0% 5,072Other Principal Arterials 3,571 2.7 5,853 13.5 1,639Minor Arterials 6,485 5.0 4,352 10.0 671Major Collectors 15,786 12.1 3,312 7.6 210Minor Collectors 11,657 9.0 1,106 2.6 95Local 77,002 59.1 2,619 6.0 34 RURAL 115,182 88.5% 20,696 47.8% 180
TOTAL 130,198 100.0% 43,317 100.0% 333
Source: Federal Highway Administration.
Minnesota hasa large networkof local roadsin rural areas.
6 HIGHWAY SPENDING

Minnesota also has an above average number of farms and smaller than averagefarms. Minnesota has about 88,000 farms, or about 138 percent more farms percapita than the national average. Minnesota’s farms are also 27 percent below thenational average in acreage. Connecting a larger number of smaller farms mayrequire more roads per square mile of land in rural areas. Overall, Minnesota has53 percent more miles of road per square mile of land than the national average.
State Trunk Highway SystemThe State Trunk Highway (STH) System includes approximately 12,000 miles ofhighways, designated in part by the Minnesota Constitution and in part bylegislative act. The system includes all interstate highways and urban freeways,as well as the vast majority of principal arterials and rural minor arterials in thestate. The size of the system has not changed much since the mid-1980s. AsTable 1.2 shows, the STH system is slightly smaller today than in 1984. The STHsystem has fewer miles of collectors, minor arterials, and local roads and moremiles of interstate highways and principal arterials. These changes have comeabout as a result of some interstate and other construction, turnbacks of lessertraveled roads to counties, and some reclassification of roads.
Minnesota’s trunk highway system includes many of the most heavily traveledroads in the state. Table 1.3 shows that:
Figure 1.1: Functional Classifications of Highways
Interstate highways are divided expressways for through traffic, which are part of the federally desig-nated interstate system. Interstates generally have full control of access.
Other freeways and expressways are divided highways for through traffic with full or partial control of ac-cess. They generally have grade separation at intersections with other highways.
Principal arterials include interstate highways and freeways, as well as other major roadways servinghigh-speed, long distance travel. They serve virtually all urban areas with a population of 25,000 ormore and a majority of those with a population of 5,000 or more. They provide little or no access toadjacent property.
Minor arterials are intermediate roadways which emphasize mobility but provide more property accessthan principal arterials. They handle medium length trips and, when combined with the principal ar-terial system, connect most cities, larger towns, and other traffic generators with one another.
Collectors have an equal emphasis on mobility and land access and provide for trips within neighbor-hoods and between small cities. Collectors provide the intermediate connection between localstreets and the arterial system. In rural areas, minor collectors collect traffic from local roads andsmall communities and link them with more heavily traveled roads. Major collectors provide serv-ice to moderately sized communities within a county and link those communities with larger popula-tion centers nearby.
Local streets and roads facilitate travel over relatively short distances and primarily provide access toproperty.
Source: Various publications of the Minnesota Department of Transportation and the Trans portation Study Board.
BACKGROUND 7
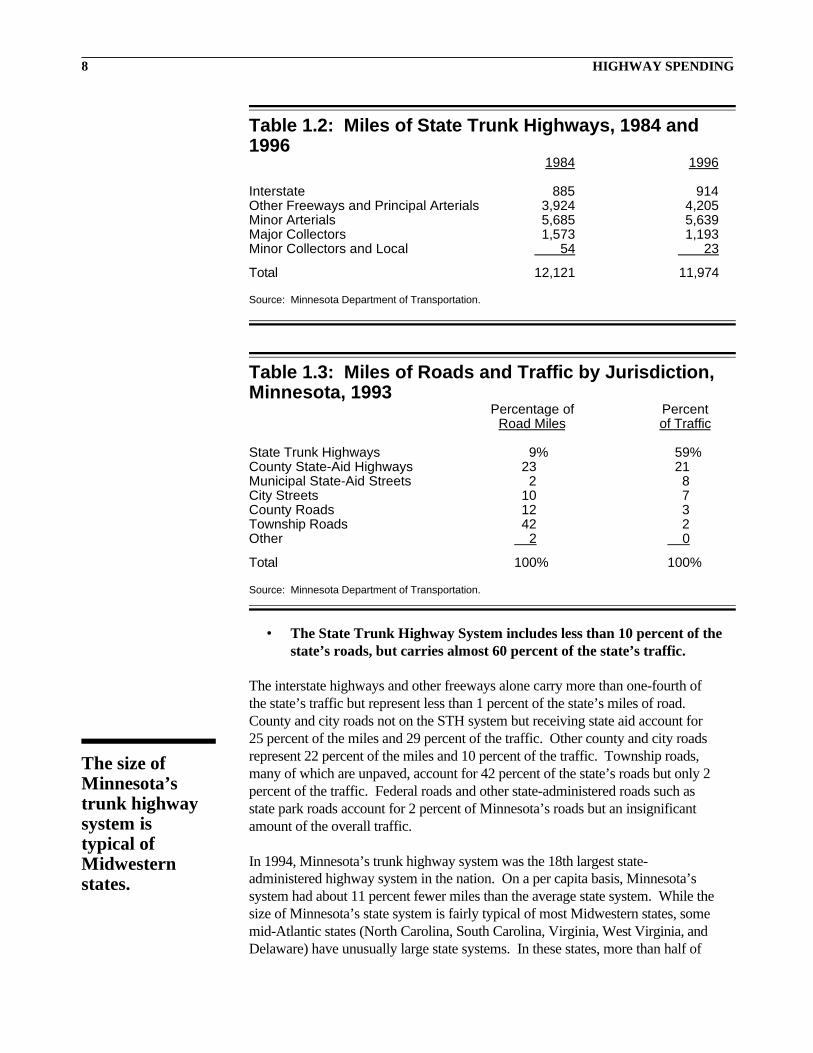
• The State Trunk Highway System includes less than 10 percent of thestate’s roads, but carries almost 60 percent of the state’s traffic.
The interstate highways and other freeways alone carry more than one-fourth ofthe state’s traffic but represent less than 1 percent of the state’s miles of road.County and city roads not on the STH system but receiving state aid account for25 percent of the miles and 29 percent of the traffic. Other county and city roadsrepresent 22 percent of the miles and 10 percent of the traffic. Township roads,many of which are unpaved, account for 42 percent of the state’s roads but only 2percent of the traffic. Federal roads and other state-administered roads such asstate park roads account for 2 percent of Minnesota’s roads but an insignificantamount of the overall traffic.
In 1994, Minnesota’s trunk highway system was the 18th largest state-administered highway system in the nation. On a per capita basis, Minnesota’ssystem had about 11 percent fewer miles than the average state system. While thesize of Minnesota’s state system is fairly typical of most Midwestern states, somemid-Atlantic states (North Carolina, South Carolina, Virginia, West Virginia, andDelaware) have unusually large state systems. In these states, more than half of
Table 1.2: Miles of State Trunk Highways, 1984 and1996
1984 1996
Interstate 885 914Other Freeways and Principal Arterials 3,924 4,205Minor Arterials 5,685 5,639Major Collectors 1,573 1,193Minor Collectors and Local 54 23
Total 12,121 11,974
Source: Minnesota Department of Transportation.
Table 1.3: Miles of Roads and Traffic by Jurisdiction,Minnesota, 1993
Percentage of PercentRoad Miles of Traffic
State Trunk Highways 9% 59%County State-Aid Highways 23 21Municipal State-Aid Streets 2 8City Streets 10 7County Roads 12 3Township Roads 42 2Other 2 0
Total 100% 100%
Source: Minnesota Department of Transportation.
The size ofMinnesota’strunk highwaysystem istypical ofMidwesternstates.
8 HIGHWAY SPENDING

the total miles of road are under the control of state highway agencies. UnlikeMinnesota, state agencies in these five states are responsible for many roadsserving only local needs.
FUNDING SOURCES
All JurisdictionsThe two largest sources of funds for highway and street expenditures inMinnesota are state highway user taxes and property taxes and assessments. Table1.4 shows that almost 40 percent of highway and street spending is financed byhighway user taxes, including state taxes on motor fuel and motor vehicleregistrations. These state taxes are a major source of revenues for state andcounty governments. About two-thirds of the funding for state trunk highwaysand close to half of county highway funding comes from these state taxes.
Some cities and townships also receive revenue from highway user taxes, butspending in these jurisdictions is more dependent on local property taxes andassessments. More than half of city and township spending on roads is financedby local taxes and assessments. About 30 percent of funding for county roads alsocomes from these local sources. Overall, local property taxes and assessmentsaccount for roughly 30 percent of highway and street funding.
Other sources of funding each provide 10 percent or less of total highway andstreet funding statewide. They include federal aid, the state’s General Fund,
Table 1.4: Share of Highway and Street Expenditures by RevenueSource, 1993
Source of Each Jurisdiction’s Expendituresa
AllRevenue Source State Counties Cities Townships Jurisdictions
State Highway User Taxes 68% 46% 13% 8% 39%Property Taxes and Assessments 0 31 53 63 31State General Fund 0 5 12 17 6Federal Aid 24 9 0 0 10Bonds and Notes 0 2 15 6 7Other 8 7 8 6 7
Total 100% 100% 100% 100% 100%
Total Expenditures (in millions) $735 $562 $868 $78 $2,243
Share of Total 33% 25% 39% 3% 100%
Source: Office of the State Auditor and Minnesota Department of Transportation.
aData for state government are for fiscal year 1993. Other data are for calendar year 1993.
BACKGROUND 9

bonds, and other sources such as investment income and various fees. Federal aidis particularly significant at the state level, accounting for about one-fourth of thefunding for the state Trunk Highway Fund. General purpose aid from the state isalso used by cities, counties, and townships to support highways as well as otherlocal government functions.
Highway User TaxesThe distribution of highway user taxes is, in large part, governed by provisions inMinnesota’s State Constitution. Taxes on motor fuel and motor vehicleregistrations must be deposited into the Highway User Tax Distribution Fund. 1
The Constitution requires that 95 percent of the net proceeds of the fund beallocated in the following proportions: 62 percent to the state Trunk HighwayFund, 29 percent to the County State-Aid Highway Fund, and 9 percent to theMunicipal State-Aid Street Fund. The remaining 5 percent may be distributed bylaw to the three funds, but the apportionment of these funds may not be changedmore frequently than every 6 years.
Figure 1.2 shows how the $974 million in highway user taxes were distributed in1996.2 The Trunk Highway Fund received $572 million, or a little more than 60percent of the net proceeds of the Highway User Tax Distribution Fund. TheCounty State-Aid Highway Fund received $262 million for distribution tocounties according to statutory formulas and needs studies and another $8 millionto repair or restore roads being turned back to counties by the state. TheMunicipal State-Aid Street Fund received $81 million to be distributed accordingto law to cities with populations of 5,000 or more, as well as $4 million toreconstruct or improve highways turned back to cities by the state. In addition,$22 million was distributed through the County State-Aid Highway Fund for townroads and bridges.
National ComparisonsIn general:
• Mn/DOT is more reliant than other state highway agencies on motorvehicle registration taxes and less reliant on federal aid, state bonding,and tolls.
Figure 1.3 shows that 34 percent of revenues for state-administered highways inMinnesota came from motor vehicle registration taxes in 1994, compared withonly 15 percent for all such highways in the United States. On either a per capitaor per mile basis, vehicle taxes used for state highways in Minnesota were 80 to
The StateConstitutionmandates how95 percent ofthe highwayuser taxes aredistributed.
10 HIGHWAY SPENDING
1 Taxes on the sale of motor vehicles do not need to be deposited in the Highway User TaxDistribution Fund.
2 About $13 million of the $974 million total went for tax collection costs. About $11 millionwas transferred to the Department of Natural Resources (DNR) for recreational programs servingusers of vehicles such as watercraft and snowmobiles. These vehicle owners pay the gasoline tax,but their vehicles do not use highways. Consequently, a portion of gasoline tax receipts istransferred to pay for DNR programs serving their needs.

BACKGROUND 11

90 percent above the national average. A larger share of Minnesota’s revenues(35 percent) were also derived from motor fuel taxes than nationwide (28percent). However, when measured on a per capita or per mile basis, Minnesota’srevenues from fuel taxes are fairly close to the national average.
The share of Minnesota’s revenues from federal aid was lower than the nationalaverage in 1994. Only 21 percent of funds used for Minnesota’s state highwayscame from the federal government, compared with 31 percent for all states. Inaddition, Minnesota made less use of bonds than other states and no use of tolls tofinance state highways.
Some have suggested that Minnesota’s constitutional requirements for sharingstate highway user taxes with local government are somewhat unique among the50 states. While a constitutional requirement may not be typical among states,Figure 1.4 shows that state highway user taxes accounted for approximately thesame share of revenues for local government highways in Minnesota during 1993as throughout the nation. The main difference between Minnesota and other stateswas that:
• Local governments in Minnesota were more reliant on generalpurpose state aid and less reliant on local user taxes and tolls tofinance local highway spending than the national average.
About 11 percent of local government revenues in Minnesota were from state aidother than state levied user taxes compared with only 3 percent nationwide. Incontrast, local governments in Minnesota received no revenues from locallyimposed highway user taxes or tolls, while 5 percent of nationwide revenues camefrom these sources. Minnesota’s local governments were also slightly less reliantthan their counterparts in other states on bonds to finance highway spending.
Figure 1.3: Sources of Revenues for State-Administered Highways,1994
Minnesota
VehicleTaxes (34%)
Bonds (2%)
Fuel Taxes(35%)
Other (8%)Federal Aid (21%)
United States
Fuel Taxes(28%)
Tolls (6%)
Other (11%)
Federal Aid(31%)
Bonds (9%)
Vehicle Taxes(15%)
Source: Federal Highway Administration.
Minnesota’strunk highwaysystem reliesmore onhighway usertaxes and lesson federal aidthan mostother statesystems.
12 HIGHWAY SPENDING

SPENDING
State and local governments in Minnesota spend more than $2 billion per year onhighways. In this section, we examine how Minnesota’s overall spending, as wellas expenditures on state-administered highways, compare with the nationalaverages. We also review the growth in Minnesota’s highway spending andexamine the components of Trunk Highway Fund spending in greater detail.
National ComparisonsMinnesota has consistently spent more per capita on highways than the nationalaverage. From 1977 to 1993, state and local governments in Minnesota spentbetween 43 and 57 percent more per capita than the national average. In 1993,highway spending per capita was 52 percent higher in Minnesota.
There are two factors responsible for Minnesota’s higher than average spending:
1. Minnesota’s large rural road system, and
2. Higher than average spending per mile on both state and local roads.
Table 1.5 shows that Minnesota spent about 10 percent more per mile onstate-administered roads and about 2 percent more per mile on locally-
Figure 1.4: Sources of Revenues for Locally-Administered Highways,1993
Source: Federal Highway Administration.
Minnesota
State UserTaxes (25%) Bonds (10%)
Local/Other (54%)
State Aid (11%)
United States
Local UserTaxes (5%)
State UserTaxes (26%)
Bonds (12%)State Aid (3%)
Local/Other (54%)
BACKGROUND 13

administered roads than the respective national averages for 1993. 3 This table,based on data from the United States Census Bureau, is roughly consistent withdata from the Federal Highway Administration (FHWA). From 1990 to 1994,FHWA data show that Minnesota’s spending on state-administered roads hasaveraged about 9 percent more per mile than the national average. 4
As we discussed earlier in this chapter, the size of Minnesota’s rural road systemhas much to do with the state’s population density and agricultural geography. Itis less clear what factors account for Minnesota’s higher than average spendingper mile. It has been suggested that differences in snow and ice controlexpenditures and higher road standards in Minnesota, including generally widerlanes and shoulders, may account for part of the difference between Minnesota’sspending and the national average.
We think that Minnesota’s higher than average spending per mile at the state levelmay simply be a statistical aberration and may be misleading. In 1993, FHWAdata show that Minnesota spent 5 percent more per mile than the 50 statescombined. However, as we pointed out earlier, several states are unusual in thattheir state highway agencies operate more than half of their states’ roads,including many rural roads serving local needs and requiring less costlymaintenance and construction on a per mile basis than urban roads. When these
Table 1.5: Spending on State and Local Roads, Minnesota and the UnitedStates, 1993
Expenditures per Capita Expenditures per Mile
National Percentage United PercentageMinnesota Average Difference Minnesota States Difference
State Roads $170 $163 4% $57,749 $52,657 10%Local Roads 232 101 129 9,129 8,918 2
Total $402 $264 52% $14,187 $18,302 (-22)%
Source: United States Census Bureau.
14 HIGHWAY SPENDING
3 Overall, Minnesota’s spending per mile has been less than the national average becauseMinnesota has substantially more miles per capita of relatively low cost rural roads. Despite havin gmore unpaved roads per capita, Minnesota still spends more per mile on its locally administeredroads. Available data from 1990 suggest that Minnesota spends substantially more per mile on itsmunicipal roads than the national average. See Office of the Legislative Auditor, Trends in Stateand Local Government Spending (St. Paul, February 1996), 125.
4 Minnesota’s relative position has varied considerably during this period. In 4 of the 5 yearsMinnesota spent more than the national average. The difference ranged from 5 percent to 20 percentabove average. In 1994, however, Minnesota spent 16 percent less per mile than the nationalaverage. Data from Mn/DOT suggest that Minnesota’s spending from the Trunk Highway Fund wasunusually low that year.
states were excluded, we found that Minnesota’s 1993 spending per mile on stateroads was 13 percent less than the average for the remaining states. 5
We also constructed a comparison group of 9 states similar to Minnesota,including Illinois, Indiana, Iowa, Kansas, Michigan, Nebraska, North Dakota,South Dakota, and Wisconsin. Together, these states have approximately the samepercentage of their roads under state control as Minnesota, and the distribution oftheir state-controlled roads by functional class is also similar to that in Minnesota.When compared to this group of 9 midwestern states, Minnesota’s spending permile on state roads was about 10 percent below the average. This result suggeststhat one should not draw any substantive conclusions about the level ofMinnesota’s spending on state roads from a comparison to spending in all 50states.
Spending TrendsGenerally, Minnesota’s overall trends in highway spending have been similar tonational trends. Both in Minnesota and nationally, highway spending between1977 and 1993 kept pace with population growth and inflation, but not with thegrowth in traffic.
From 1977 to 1993, highway spending by state and local governments inMinnesota tripled. After adjusting for inflation, spending growth was 33 percent,which was greater than the 13 percent growth in population but less than the 50percent increase in traffic volumes statewide. Spending per capita grew 17percent.6 As Table 1.6 shows, the growth in Minnesota’s highway spending wasslightly larger than that in other states.
Over this same period of time (1977-93), spending by Mn/DOT from the TrunkHighway Fund grew slower than highway spending at all government levels inMinnesota. Spending out of the Trunk Highway Fund increased almost 150percent over this period but inflation-adjusted spending per capita declined 3percent.
However, the results depend on which inflation index is used. In Table 1.6 weused the deflator for all government purchases of goods and services (also knownas the PGSL), which increased 127 percent from 1977 to 1993. In contrast, theconstruction cost indices computed by Mn/DOT and the FHWA show an increasein highway construction costs of 79 percent and 84 percent respectively. In otherwords, highway construction prices have not increased as fast over this period asthe prices of other goods and services purchased by state and local governments.
Minnesota’sspending pertrunk highwaymile appearslower than thatin similar states.
BACKGROUND 15
5 We excluded North Carolina, South Carolina, Virginia, West Virginia, and Delaware becausetheir state highway systems included more than half of their states’ roads, including a significantnumber of roads serving only local needs. We also excluded Alaska and Hawaii because of theunusual geography of those two states.
6 It should also be noted that spending on highways has grown slower than spending on mostother state and local government functions. Driven largely by increased health and welfareexpenditures, spending per capita on non-highway functions grew 48 percent in Minnesota between1977 and 1993. As a result, the share of state and local government spending going to highwaysdeclined from 10.4 percent to 8.4 percent.

Consequently, in Table 1.7, we present data on the Trunk Highway Fund byapplying the Minnesota Construction Cost Index to construction spending fromthe fund and the PGSL to other spending from the fund. The data show that:
• Expenditures by Mn/DOT out of the Trunk Highway Fund kept pacewith inflation and population growth but not with traffic growth.
Trunk highway spending grew 23 percent in constant dollars from 1977 to 1993.This growth exceeded the 13 percent population growth experienced in Minnesotabut not the 50 percent growth in traffic volumes. The trunk highway system wasable to accommodate some of the growth in traffic volumes over this period sincethere was excess capacity in the system. As we will see in Chapter 2, however,the growth in spending has not been sufficient to prevent growing congestion inMinnesota, particularly on the freeways of the Twin Cities metropolitan area.
Table 1.6: Trends in State and Local HighwaySpending, Minnesota and the United States, 1977-93
Percentage Change
Minnesota United States
Highway Spending 201% 195%Highway Spending (inflation-adjusted)a 33 30Population 13 17Vehicle Miles of Travel 50 56Spending per Capita (inflation-adjusted) 17 11Spending per Vehicle Mile (inflation-adjusted) (11) (17)
Source: United States Census Bureau and Federal Highway Administration.
aSpending was adjusted for inflation using the deflator for state and local government con sumption ex-penditures and gross investment.
Table 1.7: Trends in Trunk Highway Spending by theMinnesota Department of Transportation, 1977-93
Percentage Change
Spending 149%Spending (inflation-adjusted)a 23Spending per Capita (inflation-adjusted) 9
Source: Minnesota Department of Transportation and analysis by the Office of the Legisla tive Auditor.
aThe Minnesota Construction Cost Index was used to adjust construction spending for inflat ion. The de-flator for state and local government consumption expenditures and gross investment was u sed to ad-just other types of spending.
Trunk highwayspending hasoutpacedinflation butnot the growthin traffic.
16 HIGHWAY SPENDING

Trunk Highway SpendingDuring 1996, approximately $808 million in expenditures were made from theState Trunk Highway Fund. Figure 1.5 shows that in 1996 about 48 percent of theexpenditures out of the fund were for road construction projects, including theacquisition of right-of-way. Road construction expenditures include roadconstruction, reconstruction, resurfacing, and reconditioning projects, as well asbridge replacement, repair, and improvement projects. All of the items in the stateroad construction program are generally done by private contractors hired byMn/DOT. Close to one-fourth of the spending went for state road operations, suchas snowplowing and minor road repairs. Road operations are generally conductedby Mn/DOT personnel stationed around the state. Engineering and researchaccounted for 13 percent of trunk highway spending. This category primarilyincludes expenditures on engineering during both the design and constructionphases of projects. It also includes Mn/DOT’s research and investmentmanagement functions. Mn/DOT’s administrative functions accounted for 4percent of trunk highway spending, while other miscellaneous Mn/DOT costs,including building projects and debt service, were responsible for 3 percent ofspending. Approximately 9 percent of spending out of the Trunk Highway Fundwas done by departments other than Mn/DOT. The vast majority of spending inthis category was done by the Minnesota Department of Public Safety, whichprimarily uses trunk highway monies for highway law enforcement and driverlicensing.
Road Opera-tions (23%)
Other Depart-ments (9%)
Administration(4%)
Engineering &Research (13%)Miscellaneous
(3%)
Road Construc-tion (48%)
Figure 1.5: State Trunk Highway Expenditures, FY1996
Source: Minnesota Department of Transportation.
Nearly half ofthe spendingout of theTrunkHighway Fundis for the roadconstructionprogram.
BACKGROUND 17

Figure 1.6 provides greater detail on the $385 million of expenditures in the stateroad construction budget. Roughly equal shares were spent in 1996 on expansion(28 percent), preservation (26 percent), management and operations (25 percent),and replacement (21 percent). 7 Expansion projects generally attempt to reducetravel times and improve mobility over projected conditions. The goal ofpreservation projects is to maintain existing roads and bridges in acceptablecondition. Preservation activities include road repair, resurfacing, andreconditioning, as well as bridge repair. Timely attention to preservation activitieshelps to maximize the life of roads and bridges.
The purpose of management and operation activities is to operate the existinghighway system in a safe and efficient manner. This category includes theacquisition of right-of-way, safety improvements, traffic management, intelligenttransportation systems, cooperative agreements, and miscellaneous improvementsand enhancements.
The purposes of replacement projects are two-fold. Reconstruction of a road orreplacement of a bridge may be done simply to replace a deteriorated piece of thesystem for which repair is no longer a cost-effective option. Alternatively,reconstruction or replacement may occur primarily to improve a part of thehighway system for economic development reasons. In that case, the project mayaddress safety, congestion, or weight restriction problems. Some replacementprojects may serve both purposes.
Preservation(26%)
Management &Operations(25%)
Replacement(21%)
Expansion(28%)
Figure 1.6: Expenditures in the State RoadConstruction Program, 1996
Source: Minnesota Department of Transportation.
The roadconstructionbudget fundsexpansion,preservation,replacement,and systemmanagementprojects.
18 HIGHWAY SPENDING
7 These Mn/DOT estimates are based on the assumption that the $53.4 million spent on interstatepreservation was divided among the four categories according to actual project histories studied in1991. They may understate the amount of preservation activity and overstate the amount ofexpansion activity.

Mn/DOTThe Minnesota Department of Transportation is the principal state agencyresponsible for the ‘‘development, implementation, administration, consolidation,and coordination of state transportation policies, plans, and programs. ’’ Mn/DOTwas established to create a ‘‘balanced transportation system, includingaeronautics, highways, motor carriers, ports, public transit, railroads, andpipelines.’’8
The Commissioner of Mn/DOT is responsible for managing a department whichhad over 5,000 employees and spent or distributed funds totaling about $1.4billion per year in 1996. As the organization chart in Figure 1.7 shows, thedepartment has two deputy commissioners. One deputy commissioner overseesengineering and operations and serves as the chief engineer. Threedivisions--Engineering Services, Operations (outstate), and Metropolitan--reportto the chief engineer. The other deputy commissioner serves as chief financialofficer and oversees the work of Mn/DOT’s other three divisions: Finance andAdministration, Transportation Research and Investment Management, and StateAid for Local Transportation.
In terms of spending and staff, the State Trunk Highway System is Mn/DOT’slargest responsibility. State and local roads together account for about 90 percentof the department’s spending. Because Mn/DOT’s role with local roads is mainlyin setting standards and distributing state aid, local roads account for 40 percent ofspending but only 1 percent of staff. About half of Mn/DOT’s spending and 90percent of its staff are involved with the maintenance and construction of the StateTrunk Highway System. In addition, as Table 1.8 shows, 71 percent ofMn/DOT’s full-time employees are involved in trunk highway operations and arelocated in Mn/DOT district offices or Metropolitan Division offices, maintenancearea offices, and truck stations throughout the state. Another 5 percent of staffprovide operations centrally or support the operations in the field. Centrallyprovided engineering services account for about 12 percent of Mn/DOT’s totalstaff. Other centrally provided functions account for another 12 percent.
Since about 1992, decision-making within Mn/DOT about highway constructionand maintenance has been significantly decentralized. Mn/DOT’s seven outstatedistrict offices and the Metropolitan Division (see Figure 1.8) have the primaryresponsibility for delivering maintenance services and planning and overseeingconstruction work by contractors. District offices and the Metropolitan Divisionmake maintenance and construction decisions with input from the central office atMn/DOT and in coordination with Area Transportation Partnerships (ATPs).These ATPs are principally responsible for making decisions about how to spendfederal funds allocated under the 1991 Intermodal Surface TransportationEfficiency Act (ISTEA). In the seven-county Twin Cities metropolitan area, theMetropolitan Council is the federally designated Metropolitan PlanningOrganization and is responsible for developing, in cooperation with Mn/DOT and
Decision-makingwithinMn/DOT wassignificantlydecentralizedin 1992.
BACKGROUND 19
8 Minn. Stat. §174.01, Subd. 1.

20 HIGHWAY SPENDING

Figure 1.8: Minnesota Department of Transportation Districts
BACKGROUND 21

affected transit operators, a long-range transportation plan and a transportationimprovement program for the area.
SUMMARY
Minnesota’s state and local governments spend significantly more than thenational average on highways. This is due in part to Minnesota’s large network ofrural roads, which are largely under the jurisdiction of local governments.Minnesota also spends more per mile than the national average for bothstate-administered roads and locally-administered roads. However, it is difficultto conclude much from this about Minnesota’s State Trunk Highway System,because the national average is distorted by a handful of state highway agencieswhich have responsibility for more than half of the roads in their states.
Minnesota’s trunk highways account for less than 10 percent of the roads in thestate, but almost 60 percent of the traffic and about one-third of the highwayspending. Trunk highway spending by Mn/DOT has generally kept up withinflation and population growth but not with increases in traffic volumes.
Table 1.8: Full-Time Mn/DOT Employees, June 1996
Number Percentage
Outstate Operations 2,182 43.7%Metropolitan Operations 1,381 27.7Central Operations 243 4.9 Subtotal: Operations 3,806 76.3%
Engineering Services 597 12.0%General and Administration 288 5.8Transportation Research and 276 5.5 Investment ManagementState Aid 24 0.5 Subtotal: Non-Operations 1,185 23.7%
Total 4,991 100.0%
Source: Minnesota Department of Transportation.
22 HIGHWAY SPENDING

Trunk Highway TrendsCHAPTER 2
In Chapter 1, we reviewed how the size of and spending on Minnesota’s roadsystem, including both the State Trunk Highway (STH) System and locallyadministered streets and highways, compare with other systems across the
nation. This chapter focuses on the condition of Minnesota’s state trunk highwaysand bridges, as well as the resources the Minnesota Department of Transportation(Mn/DOT) has had available to construct, preserve, and maintain them. Inparticular, this chapter addresses the following questions:
• How have trunk highway revenues and expenditures, as well asMn/DOT staffing levels, changed over time?
• In what condition are Minnesota’s trunk highway pavements andbridges and how has this changed over the last 10 years?
• How have Minnesota’s trunk highways been affected by growinglevels of traffic?
• How safe are Minnesota’s roads and how has this changed over time?
RESOURCES
In this section, we examine the trends in trunk highway resources since themid-1970s. Detailed data on revenues and expenditures are available going backto 1974. Information on Mn/DOT staffing is available back to 1970 but is onlyadequate for trend analysis from 1985 to the present.
RevenuesFrom 1974 to 1996, revenues of the Trunk Highway Fund increased from $240million to $864 million--a growth of 260 percent. However, as Table 2.1 shows,revenue growth in inflation-adjusted dollars was only 16 percent. Revenues percapita, when adjusted for inflation, declined 3 percent.
Vehicle registration taxes, which accounted for 31 percent of Trunk HighwayFund revenues in 1996, grew the fastest. In inflation-adjusted dollars, revenues

from vehicle registrations increased 65 percent. Even revenues per capita fromvehicle registrations rose 39 percent. Gas tax revenues, which accounted for 35percent of revenues, grew 11 percent between 1974 and 1996 but declined 7percent in per capita terms. The other large source of revenues is federal aid,which accounted for 26 percent of revenues in 1996. Federal aid declined 2percent in inflation-adjusted dollars and 18 percent relative to population.
Figure 2.1 shows that:
• Trunk highway revenues, though relatively stable in the 1990s, havevaried significantly in the past.
Table 2.1: Percentage Change in Trunk Highway FundRevenues by Source, 1974-96
RevenuesRevenuesa per Capitaa
Gas Taxes 11% (7)%Vehicle Registration Taxes 65 39Federal Aid (2) (18)Other (18) (31)
Total Revenues 16% (3)%
Source: Minnesota Department of Transportation.
aAdjusted for inflation using the deflator for state and local government consumption exp enditures andgross investment.
$0
$200
$400
$600
$800
$1,000
$1,200
Year1975 1980 1985 1990 1995
Total
Federal
State
Millions of1996 Dollars
Figure 2.1: Trunk Highway Fund Revenues bySource, 1974-96
Source: Program Evaluation Division analysis of Mn/DOT data.
Trunk highwayrevenues havegenerally keptpace withinflation butare below thepeak reachedin 1985.
24 HIGHWAY SPENDING

Inflation-adjusted revenues grew 23 percent from 1974 to 1979 but plunged 40percent between 1979 and 1982. By 1985, however, trunk highway revenuesgrew 83 percent from their 1982 low point. Revenues in 1996 were about 14percent lower than the peak reached in 1985.
Much of the variation in revenues was due to changes in federal aid, whichdeclined 76 percent between 1979 and 1982 and then rose 258 percent by 1985.Fluctuations in state revenue sources played a lesser role. To some extent,revenue peaks were accentuated by state revenues from bonds or motor vehicleexcise taxes. The Trunk Highway Fund received revenues from these sourcesduring only a few years, but some of those years also happened to be peak yearsfor the receipt of federal aid. By comparison, the major state revenuesources--gas taxes and motor vehicle registration taxes--have not fluctuated much.
SpendingLike Trunk Highway Fund revenues, expenditures from the fund have increasedsince 1974. Just how much expenditures have increased since 1974 depends,however, on the index one uses to measure inflation. In analyzing revenue trends,we used an index--the national price deflator for state and local governmentconsumption expenditures and gross investment (PGSL)--which reflects thegeneral rate of inflation faced by state and local governments. This index showsthat prices faced by state and local governments increased 209 percent between1974 and 1996. Over the same period, according to Mn/DOT, prices for highwayconstruction increased only 109 percent. This latter figure is based on theMinnesota Construction Cost Index, which reflects changes in highway andbridge construction prices faced by Mn/DOT.
We analyzed the trends in trunk highway expenditures in two ways. First, weused the PGSL to convert all expenditures to 1996 dollars. Table 2.2 shows thatinflation-adjusted expenditures increased 6 percent from 1974 to 1996. Thefastest growth was for general support and administration within Mn/DOT, whichhas doubled since 1974. Spending on equipment and buildings also increasedsignificantly but, like general support and administration, accounts for a smallportion of trunk highway expenditures. Also increasing faster than average werehighway maintenance operations and spending by other state agencies.Expenditures on engineering services provided during the design and constructionphases of projects declined 6 percent, while highway and bridge constructionspending grew only 2 percent.
The second method we used to analyze spending trends was different in onerespect. We used the Minnesota Construction Cost Index to convert highwayconstruction spending to 1996 dollars. For all other types of spending, wecontinued to use the PGSL to make this conversion. Table 2.3 shows the impactof using this method. Instead of increasing 2 percent:
• Inflation-adjusted spending on highway and bridge constructionincreased 52 percent between 1974 and 1996.
Highwayconstructionprices haveincreased lessthan thegeneral rate ofinflation.
TRUNK HIGHWAY TRENDS 25

Combined with an average increase of 11 percent for other trunk highwayexpenditures, this substantial increase in construction spending resulted in anincrease of 27 percent in overall trunk highway expenditures.
On balance, we think that this second method provides a better indication of trunkhighway spending trends than the first method. It is more appropriate to apply theMinnesota Construction Cost Index to highway construction expenditures, since
Table 2.2: Percentage Change in Trunk Highway FundExpenditures by Type, 1974-96
Expendituresa
(in Millions of1996 Dollars)
Percentage1974 1996 Change
Highway Construction $378 $385 2%Operationsb 141 176 24Engineering, Research, and Investment Management 112 105 (6)General Support and Administrationb 13 27 110Highway Bonds and Debt Service 39 19 (52)Equipment and Buildings 17 18 7Otherc 60 78 30
Total $761 $808 6%
Source: Minnesota Department of Transportation.
aAdjusted for inflation using the deflator for state and local government consumption exp enditures andgross investment.
bExcludes equipment.
cPrimarily includes spending by other state agencies.
Table 2.3: Percentage Change in Trunk Highway FundExpenditures on Highway Construction, 1974-96
Expenditures(in Millions of 1996
Dollars)Percentage
1974 1996 Change
Highway Constructiona $254 $385 52%All Otherb 383 423 11
Total $637 $808 27%
Source: Minnesota Department of Transportation.
aAdjusted for inflation using the Minnesota Construction Cost Index.
bAdjusted for inflation using the deflator for state and local government consumption exp enditures andgross investment.
In 1996 dollars,trunk highwayspending hasincreased 27percent since1974.
26 HIGHWAY SPENDING

this cost index directly measures the changes in construction prices affectingMn/DOT.1
Figure 2.2 shows the trends in Trunk Highway Fund expenditures based on thesecond method. As we saw earlier with revenue trends, expenditures have grownsince 1974 but have fluctuated from year to year. Spending in 1996 is 27 percentgreater than 1974 spending but about 12 percent below the spending peak reachedin 1988. The principal source of revenue fluctuations was federal aid. Becausefederal aid is primarily used for highway construction, it makes sense thathighway construction spending has also fluctuated over this time period.
It is important to place the increase in trunk highway spending into perspective.The 27 percent increase in trunk highway spending exceeds the growth in the sizeof the trunk highway system. The number of centerline miles on the system hasdeclined about 1 percent since 1974, while the number of lane miles has increasedabout 1 percent. The increase in spending is also greater than the 19 percentincrease in Minnesota’s population, but less than the increase in vehicle milestraveled in Minnesota, which exceeded 75 percent.
StaffingAvailable data indicate that the number of staff in Mn/DOT declined significantlyfrom 1970 until 1982. Staffing then rose until about 1990 and has declined
$0
$250
$500
$750
$1,000
Year1975 1980 1985 1990 1995
Total
HighwayConstruction
Operations
Engineering
Millions of1996 Dollars
Figure 2.2: Trunk Highway Fund Expenditures byType, 1974-96
Source: Program Evaluation Division analysis of Mn/DOT data.
Highwayconstructionspending hasfluctuated a lotdue to changesin the level offederal aid.
TRUNK HIGHWAY TRENDS 27
1 One potential drawback to the second method is that the Minnesota Construction Cost Indexdoes not reflect changes in land prices. The highway construction category includes right-of-waypurchases, as well as construction spending.

slightly since then. Due to data problems, it is not exactly clear how currentstaffing levels compare with levels prior to 1985. It appears, however, that thenumber of full-time equivalent employees has decreased since 1970.
The best available data are presented in Table 2.4. They show that the number offull-time employees in Mn/DOT increased about 16 percent between 1985 and1990, but has declined 3 percent since then. The overall increase in full-timeemployees since 1985 was 12 percent. The number of part-time employees hasdeclined during both of these periods and is down 70 percent since 1985.Although data on the number of full-time equivalent employees are not available,we can roughly estimate the number by assuming that part-time employeesworked an average of 20 hours per week. Under that assumption, the number offull-time equivalent employees increased 9 percent between 1985 and 1990 butthen decreased 3 percent by 1996. The overall increase in the estimated numberof full-time equivalent employees between 1985 and 1996 was 6 percent.
The table also shows that the number of full-time employees in the field--namely,working for the outstate district offices or the Metropolitan Division--hasincreased slower than the number of central office employees. Also, the numberof part-time employees in the field has declined more than the number ofpart-time staff assisting in central office functions. A rough estimate suggests thatthe number of full-time equivalent employees in the field increased 3 percent from1985 to 1996, compared with a 15 percent increase for the central office.
This shift in staff resources has come during a period in which the field officeshave been asked to take on greater responsibilities. Since about 1992, Mn/DOThas decentralized some of its decision-making and let the districts and theMetropolitan Division make more decisions on how to spend money allocated tothem.
Table 2.4: Number of Full-Time and Part-TimeEmployees of the Minnesota Department ofTransportation, 1985-96
PercentageJune June June Change1985 1990 1996 (1985-96)
FULL-TIME EMPLOYEESDistricts and Metropolitan Division 3,245 3,765 3,563 10%Other 1,219 1,402 1,428 17
Total 4,464 5,167 4,991 12%
PART-TIME EMPLOYEESDistricts and Metropolitan Division 531 217 117 (78)%Other 123 116 81 (34)
Total 654 333 198 (70)%
Source: Minnesota Department of Transportation.
28 HIGHWAY SPENDING

PAVEMENTS
In this section, we examine changes in the condition and age of Minnesota’s trunkhighways since 1985. We also consider whether Minnesota faces a backlog ofrehabilitation work.
BackgroundThe vast majority of Minnesota’s trunk highways are in rural parts of Minnesota.As Table 2.5 shows, 87 percent of trunk highway miles are outside the 7-countyTwin Cities metropolitan area, and 86 percent are in rural areas. Traffic, however,is more evenly distributed. Trunk highways in the Twin Cities metropolitan areacarry about 48 percent of the traffic on the State Trunk Highway System. Urbanareas throughout the state account for 49 percent of the traffic.
Interstate highways account for a disproportionate share of the traffic. While 13percent of the trunk highways are on the federal interstate system, Minnesota’sinterstate highways carry 37 percent of the trunk highway traffic. Principalarterials account for 38 percent of the miles and 42 percent of the traffic. Otherhighways represent nearly half of the trunk highway miles but only 22 percent ofthe traffic.2
Overall, Minnesota’s trunk highways consist primarily of bituminous materials,but interstate highways are generally concrete. As Table 2.6 shows, about 62percent of all trunk highways are bituminous, while 18 percent are concrete and20 percent have a concrete base overlaid with bituminous. The choice between
Table 2.5: Percentage of State Trunk Highway Milesand Traffic, 1995
Share ofRoadway Miles
Share of VehicleMiles of Travel
Twin Cities Metro Area 13% 48%Outstate 87 52
Urban Areas 14 49Rural Areas 86 51
Interstate Highways 13 37Principal Arterials 38 42Minor Arterials 40 20Collector and Local Highways 9 2
Source: Minnesota Department of Transportation.
About 86percent of thetrunk highwaymileage andhalf of thesystem’s trafficare in ruralareas of thestate.
TRUNK HIGHWAY TRENDS 29
2 In discussing pavements, we are using roadway miles, rather than centerline miles or lane-miles.The State Trunk Highway System currently has about 12,000 centerline miles, 14,200 roadwaymiles, and 28,800 lane-miles of highways. Each mile of highway is counted only once to measurecenterline miles, while each lane is counted separately to obtain lane-miles. In measuring thenumber of roadway miles, each centerline mile is counted twice if the highway has four or morelanes for traffic.

bituminous and concrete generally depends on traffic volumes and soil conditions.Concrete tends to last longer but costs more initially. Concrete is more likely tobe used on roads with high traffic volumes. As a result, two-thirds of Minnesota’sinterstate highways are concrete, while only 15 percent are bituminous. Concretehighways are generally overlaid with bituminous when they get older and can nolonger be effectively repaired with concrete materials. About 20 percent of theinterstate highways and other trunk highways consist of a bituminous surface overa concrete pavement.
ConditionMn/DOT uses the Pavement Quality Index (PQI) to measure the overall quality oftrunk highway surfaces. The PQI is a composite measure of the presentserviceability rating (PSR) and the surface rating (SR). 3 The PSR measures therideability or smoothness of the pavement, while the SR measures the degree ofpavement surface defects or distresses.
In theory, the PQI can range from zero to almost 4.5. The PSR can range betweenzero and 5.0, while the SR ranges from zero to 4.0. Higher numbers on any ofthese indices represent better pavement quality.
Trends
Figure 2.3 shows that:
• Overall pavement quality has increased slightly since 1985.
Between 1985 and 1996, the PQI has varied within a narrow range from 3.18 to3.27. The PQI increased less than 2 percent from 3.21 in 1985 to 3.26 in 1996.The figure also shows that:
• Surface defect ratings have improved since 1985, while the smoothnessof pavements has declined.
Table 2.6: State Trunk Highway Miles by Type ofPavement and Surface, 1996
All TrunkInterstate Non-Interstate Highways
Bituminous 15% 69% 62%Concrete 66 11 18Bituminous over Concrete 20 20 20
Totala 100% 100% 100%
Source: Minnesota Department of Transportation.
aSome totals do not sum due to rounding.
Pavementquality hasincreasedslightly sincethe mid-1980s.
30 HIGHWAY SPENDING
3 Mathematically, the PQI is the square root of the product of the PSR and the SR.

The surface rating or SR has increased 6 percent from 3.28 in 1985 to 3.48 in1996. The PSR increased from 3.20 in 1985 to 3.37 in 1989 but has declinedalmost every year since then. The current PSR of 3.11 is about 3 percent lowerthan it was in 1985.
It is not entirely clear why the rideability or smoothness of pavements hasdeclined since 1989. In part, it may be related to the relatively small amount ofgrinding done on concrete pavements following a concrete pavement repair. Thepurpose of grinding is to improve the smoothness of the ride by leveling off thedifference in height between adjacent concrete sections of the highway. Thisreduces the thumping noise heard by motorists and improves the ride. One of thebiggest drops in the PSR rating is on concrete pavements on interstate highways.
Current Condition
Table 2.7 indicates that:
• The PQI is generally higher on interstate highways and principalarterials than on other trunk highways.
Table 2.7 indicates that the average PQI in 1996 was 3.37 on interstate highwaysand 3.28 on principal arterials. Minor arterials had an average rating of 3.23,while collector and local highways had a rating of 3.15. There is also a smallershare of interstate highway miles with lower PQI ratings. Only 11 percent ofinterstate highway miles are rated at 2.8 or lower, while 20 percent or more ofother types of trunk highways are similarly rated.
2.2
2.6
3
3.4
3.8
1985 1990 1995 Year
SurfaceRating
OverallQuality
Smoothness
Rating
Figure 2.3: Pavement Quality Ratings for StateTrunk Highways, 1985-96
Source: Minnesota Department of Transportation.
Pavementquality isgenerallyhigher on moreheavilytraveledhighways.
TRUNK HIGHWAY TRENDS 31
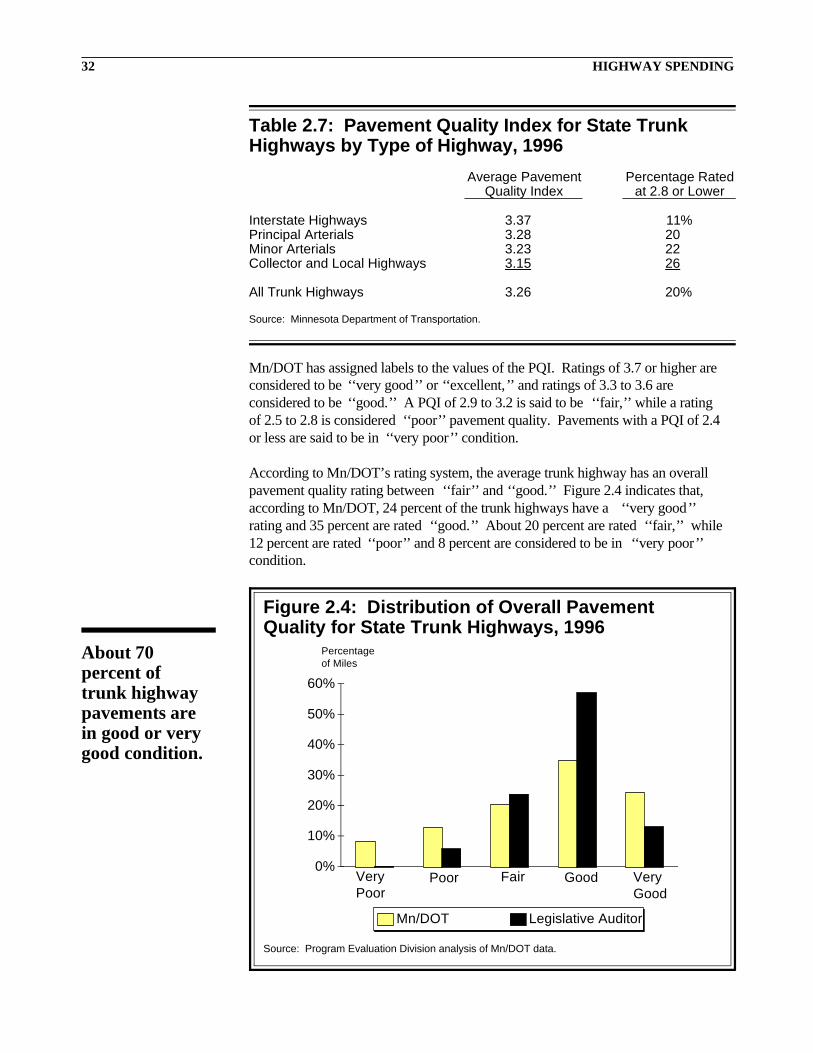
Mn/DOT has assigned labels to the values of the PQI. Ratings of 3.7 or higher areconsidered to be ‘‘very good’’ or ‘‘excellent,’’ and ratings of 3.3 to 3.6 areconsidered to be ‘‘good.’’ A PQI of 2.9 to 3.2 is said to be ‘‘fair,’’ while a ratingof 2.5 to 2.8 is considered ‘‘poor’’ pavement quality. Pavements with a PQI of 2.4or less are said to be in ‘‘very poor’’ condition.
According to Mn/DOT’s rating system, the average trunk highway has an overallpavement quality rating between ‘‘fair’’ and ‘‘good.’’ Figure 2.4 indicates that,according to Mn/DOT, 24 percent of the trunk highways have a ‘‘very good’’rating and 35 percent are rated ‘‘good.’’ About 20 percent are rated ‘‘fair,’’ while12 percent are rated ‘‘poor’’ and 8 percent are considered to be in ‘‘very poor’’condition.
Table 2.7: Pavement Quality Index for State TrunkHighways by Type of Highway, 1996
Average PavementQuality Index
Percentage Ratedat 2.8 or Lower
Interstate Highways 3.37 11%Principal Arterials 3.28 20Minor Arterials 3.23 22Collector and Local Highways 3.15 26
All Trunk Highways 3.26 20%
Source: Minnesota Department of Transportation.
0%
10%
20%
30%
40%
50%
60%
Mn/DOT Legislative Auditor
VeryPoor
Poor Fair Good VeryGood
Percentageof Miles
Figure 2.4: Distribution of Overall PavementQuality for State Trunk Highways, 1996
Source: Program Evaluation Division analysis of Mn/DOT data.
About 70percent oftrunk highwaypavements arein good or verygood condition.
32 HIGHWAY SPENDING

Although we have no disagreement with Mn/DOT over how ratings arecalculated, we do not believe that the labels Mn/DOT has assigned to PQI ratingsare appropriate. In fact, the labels are inconsistent with how Mn/DOT hascalibrated the PSR portion of the PQI. The Pavement Management Unit inMn/DOT constructed the PSR so that roads with a PSR of 4.0 or more wereconsidered to be in ‘‘very good’’ condition and roads with a PSR of 3.0 to 3.9were in ‘‘good’’ condition. Similarly, roads in ‘‘fair’’ condition from a smoothnessstandpoint were given a PSR of 2.0 to 2.9, while roads in ‘‘poor’’ condition wereassigned PSR values between 1.0 and 1.9. Only roads with a PSR between 0.0and 0.9 were considered to be in ‘‘very poor’’ condition.
An example illustrates how Mn/DOT’s PQI labels are inconsistent with how thePSR was constructed. A road with a PSR of 2.0 and an SR of 4.0 would have aPQI of 2.8 and thus, according to Mn/DOT, would be in ‘‘poor’’ condition.However, a road with a PSR of 2.0 is considered to be ‘‘fair’’ from a smoothnessperspective, and a road with an SR of 4.0 is in ‘‘excellent’’ shape, since 4.0 is themaximum surface rating. It is unclear why a road with an excellent surface ratingand a fair rideability or smoothness rating should be categorized as being in poorcondition.
Working with Mn/DOT’s Pavement Management Unit, we derived morereasonable labels to apply to PQI ratings. 4 We think that Mn/DOT’s labelsunderidentify the number of miles of ‘‘good’’ pavements while overidentifying thenumber of miles of ‘‘poor’’ and ‘‘very poor’’ pavements. Mn/DOT’s labels alsomay overidentify the number of miles of ‘‘very good’’ pavements, although theyunderidentify the combined number of miles which are either in ‘‘good’’ or ‘‘verygood’’ condition. Figure 2.4 shows that, in our view:
• The typical trunk highway was in ‘‘good’’ condition, and only 6percent of all pavements were in ‘‘poor’’ or ‘‘very poor’’ condition in1996.
We think that 13 percent of trunk highway miles were in ‘‘very good’’ condition in1996, and 57 percent were in ‘‘good’’ condition. About 24 percent were in ‘‘fair’’condition, while slightly fewer than 6 percent were in ‘‘poor’’ condition. Only 13miles of the trunk highway system, or about 0.1 percent, were in ‘‘very poor’’condition.5
As a result, we think that:
Only 6 percentof trunkhighwaypavements arein poor or verypoor condition.
TRUNK HIGHWAY TRENDS 33
4 To get more accurate PQI labels, we had to make assumptions about how to label varioussurface ratings. For the purposes of this report, we called surface ratings of 3.6 to 4.0 very good , 3.2to 3.5 good, 2.8 to 3.1 fair, 2.4 to 2.7 poor, and 2.3 or less very poor. Although different cutoff scould be used, they would probably not change the basic conclusion that Mn/DOT’s current PQIlabels overidentify the number of miles in poor or very poor condition and understate the combinednumber in good or very good condition.
5 Based on Mn/DOT’s calibration of the PSR and the assumptions we used for the SR, weassigned the following labels to PQI ratings: 3.8 to 4.5 (very good), 3.1 to 3.7 (good), 2.4 to 3.0(fair), 1.5 to 2.3 (poor), and 0.0 to 1.4 (very poor).

• Mn/DOT does not have a backlog of pavements in ‘‘poor’’ conditionbut would have a backlog if it reduced the average amount of surfacerehabilitation work done each year.
From 1986 to 1995, Mn/DOT did about 938 miles of resurfacing, concretepavement repair, and reconstruction work annually. This annual amount of workrepresented about 6.7 percent of the roadway miles on the trunk highway systemduring this 10-year period. Based on information from Mn/DOT engineers, weestimate that the average expected life of surfaces on trunk highways has beenabout 15 years. 6 On average, Mn/DOT would have to resurface about 6.7 percentof its highways annually in order to maintain a constant average surface age andprobably a constant PQI. Over the last 10 years, Mn/DOT has been able tomaintain that pace of activity. In fact, the PQI has increased slightly and, as wewill see, the average surface age has declined a bit. However, if Mn/DOT wasunable to maintain this amount of activity, we would expect to see a decline inPQI and an increase in average surface age. While Mn/DOT has very few roadsin poor condition now, the number of roads in poor condition would grow and abacklog of needed work would develop if Mn/DOT did not continue torehabilitate at least an average of about 6.7 percent of the roads annually.
In Chapters 3 and 4, we will see that the above conclusion may need to bemodified in two ways. First, we think that the amount of rehabilitation work doneannually may need to be increased over time in order for Mn/DOT to maintain aconstant PQI. This is due to increasing traffic loads and the declining percentageof trunk highways which consist only of their original surfaces. Second, we thinkthat, if Mn/DOT did more preventive maintenance, it might reduce the number ofmiles of resurfacing work needed over the long run. Mn/DOT, however, finds itdifficult to spend more on preventive maintenance because each spring it hasplenty of roads which need resurfacing, and Mn/DOT does not want to develop abacklog of roads in poor condition.
Comments
By assigning more appropriate labels to the PQI, we have been able to more fairlyassess the current condition of pavements on the trunk highway system. However,we have not been able to address certain issues due to a lack of adequate data.
First, it is not possible at this time to compare the condition of Minnesota’s trunkhighway pavements with other states. Although the Federal HighwayAdministration (FHWA) publishes state-by-state comparisons of pavementroughness, these comparisons are not valid. States use different equipment tomeasure pavement roughness. Without proper calibration of equipment, validcomparisons cannot be made. The existing FHWA data should not be used todraw any conclusions about the relative condition of Minnesota’s highways.
Mn/DOT doesnot have abacklog ofpavements inpoor condition.
34 HIGHWAY SPENDING
6 This figure is the average expected time between surface rehabilitations. Underlying pavementsare expected to last considerably longer. The systemwide average of 15 years is based on anaverage of 15 years for bituminous surfaces, 17.5 years for concrete surfaces, and 12 years forbituminous surfaces over concrete pavements. In Chapter 3, we discuss why the average expectedsurface life of trunk highways may decrease in the future.

Second, the PQI does not measure the adequacy of the underlying pavementrelative to the traffic and loads it carries. The PQI measures smoothness andsurface defects but does not directly indicate a pavement’s structural adequacy. Apavement can have a shorter life if the loads it carries exceed its design capacityor are too high during the crucial thawing period in spring. Mn/DOT does nothave a statewide system of collecting data on the structural condition of all trunkhighways. Some districts, however, collect these data on all or a portion of theirhighways. District 2 in Bemidji reported to us that the number of miles at risk dueto loads has increased from 218 miles in 1989 to 362 miles in 1995. This increaseis due in part to increasing truck traffic. In addition, Minnesota increased thegeneral weight limit on trunk highways in 1986 and reduced the load restrictionson principal arterials and key market routes during spring. The lessening of loadrestrictions may have placed more roads at risk of premature failure.
Finally, the pavement quality trends we examined do not include any possibleworsening of pavement conditions during recent winter months. PQI data reflectconditions during 1996 prior to the winter of 1996-97. 7 According to someaccounts, this winter has taken an unusually harsh toll on Minnesota’s roads,including its trunk highways. Not only have state and local governments incurredlarger than average snow removal costs, but roads have also experienced morepotholes than usual. Any effect of the 1996-97 winter on the pavement quality ofMinnesota’s trunk highways will not begin to show up in PQI measurements untildata are collected later this year. In addition, the magnitude of the effect isunclear at this point because Mn/DOT will probably repair most of the potholesbefore PQI measurements are taken.
AgeAn examination of pavement and surface ages provides both encouraging anddiscouraging signs for Minnesota’s trunk highways. On the one hand, as Table2.8 indicates:
• The average age of the surfaces on Minnesota’s trunk highwaysdeclined from 11.5 years in 1985 to 10.9 years in 1995.
Table 2.8: Average Surface and Pavement Ages, 1985and 1995
Average Age in Years
Surface Pavement
1985 11.5 32.51995 10.9 39.8
Source: Minnesota Department of Transportation.
The averageage of trunkhighwaysurfaces hasdeclined,althoughpavement agehas continuedto increase.
TRUNK HIGHWAY TRENDS 35
7 More precisely, the 1996 PQI data reflect conditions in both 1995 and 1996. Data needed tocalculate the PQI are collected on about half of the trunk highways each year. As a result, the 199 6PQI data consist of 1996 measurements for half of the trunk highways and 1995 measurements forthe other half.
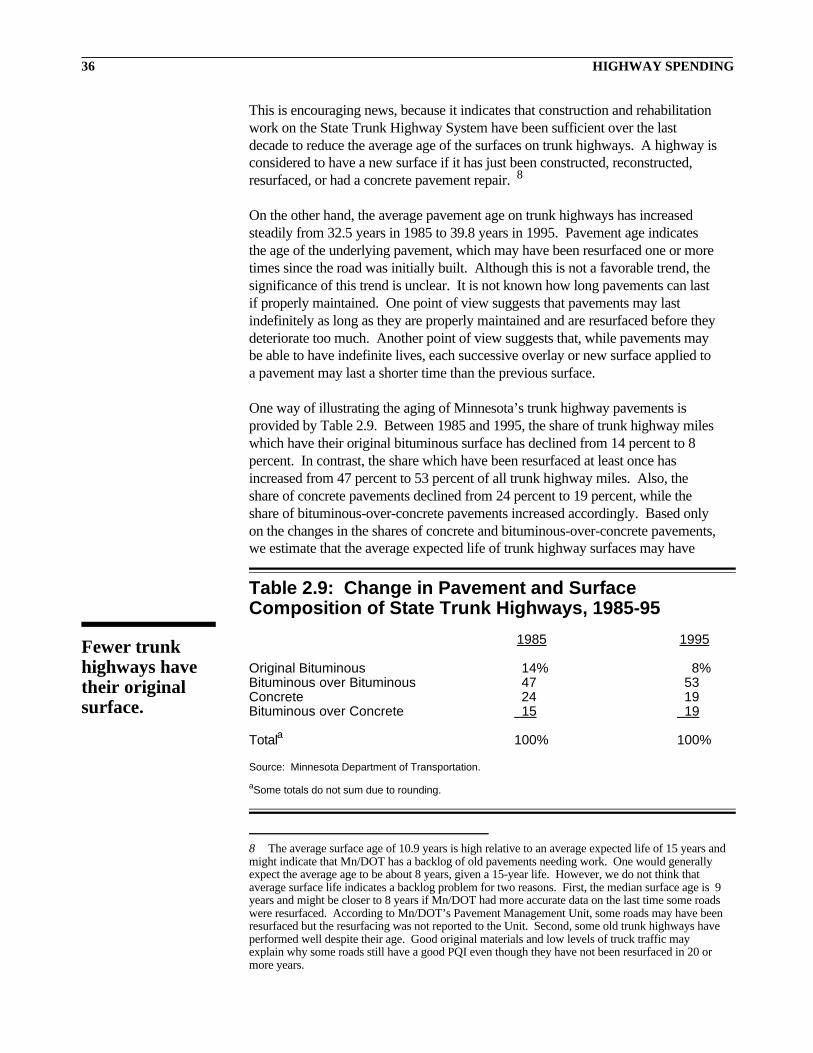
This is encouraging news, because it indicates that construction and rehabilitationwork on the State Trunk Highway System have been sufficient over the lastdecade to reduce the average age of the surfaces on trunk highways. A highway isconsidered to have a new surface if it has just been constructed, reconstructed,resurfaced, or had a concrete pavement repair. 8
On the other hand, the average pavement age on trunk highways has increasedsteadily from 32.5 years in 1985 to 39.8 years in 1995. Pavement age indicatesthe age of the underlying pavement, which may have been resurfaced one or moretimes since the road was initially built. Although this is not a favorable trend, thesignificance of this trend is unclear. It is not known how long pavements can lastif properly maintained. One point of view suggests that pavements may lastindefinitely as long as they are properly maintained and are resurfaced before theydeteriorate too much. Another point of view suggests that, while pavements maybe able to have indefinite lives, each successive overlay or new surface applied toa pavement may last a shorter time than the previous surface.
One way of illustrating the aging of Minnesota’s trunk highway pavements isprovided by Table 2.9. Between 1985 and 1995, the share of trunk highway mileswhich have their original bituminous surface has declined from 14 percent to 8percent. In contrast, the share which have been resurfaced at least once hasincreased from 47 percent to 53 percent of all trunk highway miles. Also, theshare of concrete pavements declined from 24 percent to 19 percent, while theshare of bituminous-over-concrete pavements increased accordingly. Based onlyon the changes in the shares of concrete and bituminous-over-concrete pavements,we estimate that the average expected life of trunk highway surfaces may have
Table 2.9: Change in Pavement and SurfaceComposition of State Trunk Highways, 1985-95
1985 1995
Original Bituminous 14% 8%Bituminous over Bituminous 47 53Concrete 24 19Bituminous over Concrete 15 19
Totala 100% 100%
Source: Minnesota Department of Transportation.
aSome totals do not sum due to rounding.
Fewer trunkhighways havetheir originalsurface.
36 HIGHWAY SPENDING
8 The average surface age of 10.9 years is high relative to an average expected life of 15 years andmight indicate that Mn/DOT has a backlog of old pavements needing work. One would generallyexpect the average age to be about 8 years, given a 15-year life. However, we do not think thataverage surface life indicates a backlog problem for two reasons. First, the median surface age is 9years and might be closer to 8 years if Mn/DOT had more accurate data on the last time some roadswere resurfaced. According to Mn/DOT’s Pavement Management Unit, some roads may have beenresurfaced but the resurfacing was not reported to the Unit. Second, some old trunk highways haveperformed well despite their age. Good original materials and low levels of truck traffic mayexplain why some roads still have a good PQI even though they have not been resurfaced in 20 ormore years.

declined by as much as 0.25 years between 1985 and 1995. This estimate doesnot reflect any deterioration in the average expected surface life due to the shiftfrom original bituminous to bituminous-over-bituminous highways.
BRIDGES
In this section, we review the condition and age of trunk highway bridges. Trenddata are available for at least the last 8 years and, in some cases, for the last 10years. We also consider whether Mn/DOT has a backlog of bridges needing work.
BackgroundIn 1995, there were 2,911 bridges and 1,703 culverts on Minnesota’s trunkhighway system. 9 The total number of trunk highway structures has increased 2percent from 4,530 in 1988 to 4,614 in 1995. The total area of these structures, asmeasured by the sum of the total deck area of bridges and the roadway area ofculverts, is perhaps a better indicator of the size of the system and its fundingneeds over the long run. The total area of trunk highway structures has increased9 percent since 1988, growing from 40.5 million square feet to 44.1 million squarefeet. In 1995, bridges accounted for 92 percent of the total area. Culvertsaccounted for only 8 percent of the area, while accounting for 37 percent of thetotal number of trunk highway structures.
The State Trunk Highway System has a majority of the structure area in the state,although it only has about one-fourth of the bridges and culverts in the state. In1995, the trunk highway system accounted for 23 percent of Minnesota’s bridgesand culverts and 60 percent of the total structure area. Most of the long bridges inthe state are on the trunk highway system.
ConditionThere are several indicators which can be used to assess the current condition oftrunk highway bridges and culverts and track changes in condition over time.Below, we examine sufficiency ratings, condition ratings, and various measures ofthe extent of bridge deficiencies.
Sufficiency Ratings
Sufficiency ratings are used for federal funding purposes and are calculated usinga complicated formula. In general, the sufficiency rating considers three factors:structural adequacy and safety, serviceability and functional obsolescence, and
About 60percent of thedeck area onMinnesota’sbridges is onthe trunkhighwaysystem.
TRUNK HIGHWAY TRENDS 37
9 A culvert is a drainage opening beneath an embankment.

essentiality for public use. 10 These three factors account for 55 percent, 30percent, and 15 percent respectively of the sufficiency rating. The maximumsufficiency rating is 100. A sufficiency rating less than 80 is used by the federalgovernment to indicate that a bridge qualifies for rehabilitation funding. Asufficiency rating less than 50 qualifies a bridge for replacement funding.
Figure 2.5 shows that:
• The average sufficiency rating on trunk highway bridges has beenrelatively constant between 1986 and 1995.
During this period, the averagerating has varied within a narrowrange from 85.3 to 86.9.Between 1986 and 1995, theaverage rating has increased lessthan 1 percent.
Condition Ratings
Condition ratings focusexclusively on the structuraladequacy of bridges. Unlikesufficiency ratings, conditionratings do not consider theserviceability of bridges andwhether they meet various widthand other geometric criteria. Condition ratings also do not explicitly measure therelative importance of bridges like sufficiency ratings do, but condition ratings canbe compared for bridges on different types of trunk highways.
A condition rating can range from zero to 9, with a 9 indicating a new bridge anda zero indicating a bridge that is unusable. Generally, bridges with ratings of 7 to9 are considered to be in good to excellent condition. Ratings of 5 or 6 indicatethat a bridge has some deficiencies but is in fair or satisfactory condition. Ratingsof 4 or less indicate that a bridge is in poor to critical condition. 11
Table 2.10 shows that:
• The typical trunk highway bridge is in good to fair condition.
50
60
70
80
90
1986 1989 1992 1995 Year
Sufficiency Rating
Figure 2.5: Average SufficiencyRating for Trunk Highway Bridges,1986-95
Source: Minnesota Department of Transportation.
The typicaltrunk highwaybridge is ingood to faircondition.
38 HIGHWAY SPENDING
10 Serviceability primarily measures the extent to which a bridge meets various geometric criteriaincluding such factors as the bridge’s roadway width and alignment, vertical and horizontalclearances, and underclearances. Essentiality for public use refers to the importance of the bridge interms of the type of highway it serves, the traffic it carries, and the length of the detour which w ouldbe necessary if the bridge could not be used.
11 United States Department of Transportation , The Status of the Nation’s Highways, Bridges, andTransit: Conditions and Performance (Washington, D.C., 1993), 123.

The table provides average condition ratings for bridge superstructures, decks, andsubstructures, as well as for culverts. 12 In 1995, the typical bridge had ratings inthe low 7s or high 6s, indicating that the average bridge was in good to faircondition. Culverts had a slightly lower rating but still a satisfactory one.
Condition ratings are generally somewhat higher for bridges on interstate andother federal aid highways than for bridges on other trunk highways. Forexample, the average condition rating for superstructures was 7.25 on interstatehighway bridges in 1995 and 7.11 on other federal aid highway bridges. Incontrast, bridge superstructures on other trunk highways had an average rating of6.89.
Figure 2.6 displays the trends incondition ratings from 1986 to1995. Condition ratings of allcomponents increased between1986 and 1989 and havedeclined since 1989. In general:
• Bridge and culvertcondition ratings in1995 were slightly lowerthan ratings in 1986.
The average superstructurerating decreased 2 percent, whilethe average substructure ratingdecreased 3 percent and theaverage culvert rating declined 6percent. The average deck condition rating decreased less than 1 percent.
Table 2.10: Average Condition Ratings for TrunkHighway Bridges and Culverts, 1995
Superstructure Deck Substructure Culverts
Interstate Highways 7.25 6.99 7.05 6.87Other Federal Aid Highways 7.11 6.93 7.01 6.75Other Trunk Highways 6.89 6.64 6.74 6.59
All Trunk Highways 7.09 6.84 6.92 6.64
Source: Minnesota Department of Transportation.
3.0
4.0
5.0
6.0
7.0
8.0
Year1986 1989 1992 1995
SuperstructureSubstructureDeck
Rating
Figure 2.6: Average ConditionRatings for Trunk HighwayBridges, 1986-95
Source: Minnesota Department of Transportation.
Bridgesufficiencyratings haveincreasedslightly sincethe mid-1980s,while conditionratings havedeclined a bit.
TRUNK HIGHWAY TRENDS 39
12 The superstructure of a bridge includes the entire portion of a bridge structure which receivesand supports traffic loads and in turn transfers the resulting reactions to the bridge substructure. Thesuperstructure includes the deck, which comes in direct contact with vehicle loads, as well as thefloor system, supporting members, and bracing. The substructure includes the abutments, piers,grillage, or other construction built to support the superstructure and transfer loads from thesuperstructure to the ground. Culverts do not have a definite distinction between superstructure an dsubstructure and have no deck.

Slight declines in condition ratings were generally experienced on each of thethree types of trunk highways we discussed above. For example, averagesuperstructure condition ratings declined from 7.44 to 7.25 on interstate bridgesfrom 1986 to 1995. On other federal aid highways, the average bridgesuperstructure rating decreased from 7.26 to 7.11. Bridges on other trunkhighways experienced a decrease from 7.13 to 6.89.
Deficient Structures
Mn/DOT routinely tracks the number of structures that are deficient. There aretwo types of deficient bridges and culverts--structurally deficient and functionallyobsolete. A structurally deficient bridge or culvert generally has one or more ofits major components in poor structural condition. A functionally obsolete bridgedoes not meet the criteria established for width, clearance, roadway alignment, orload carrying capacity. 13 Any structure classified as structurally deficient isexcluded from the functionally obsolete category so that it is not double counted.
There are three different categories that Mn/DOT uses to track deficient bridges.One category includes only those deficient bridges which have a sufficiency ratingbelow 50. These bridges are eligible for federal replacement or rehabilitationfunding. A second category includes deficient bridges with a sufficiency ratingbelow 80. Bridges with sufficiency ratings between 50 and 80 are eligible forfederal rehabilitation funding. The third category includes all deficient bridgesincluding those with sufficiency ratings of 80 or more.
Data on deficient bridges are presented in Table 2.11. The extent of thedeficiencies can be measured in three ways: 1) the number and percentage ofbridges which are deficient, 2) the deck area on deficient bridges and thepercentage of all deck area which is on deficient bridges, and 3) the estimated costto eliminate bridge deficiencies through replacement or remodeling.
Table 2.11: Deficient Trunk Highway Bridges, 1990 and 1995Number of Deck Area EstimatedDeficient Percentage (in Millions of Percentage Improvement
Year Bridges of Bridges Square Feet) of Area Cost (in Millions)
Sufficiency Ratings 1990 269 5.8% 2.01 4.8% $285.1Less than 50 1995 234 5.1 1.65 3.7 184.7
Sufficiency Ratings 1990 592 12.8 4.07 9.8 463.5Less than 80 1995 541 11.7 4.15 9.2 321.8
All Sufficiency Ratings 1990 699 15.1 4.91 11.8 529.81995 626 13.6 5.32 11.8 386.3
Source: Minnesota Department of Transportation.
40 HIGHWAY SPENDING
13 Technically speaking, a bridge or culvert is structurally deficient if it has a condition rating of 4or less for deck condition, superstructure, substructure, or culverts, or an appraisal rating of 2 o r lessfor structure evaluation or waterway adequacy. A structure is functionally obsolete if it has anappraisal rating of 3 or less for deck geometry, underclearance, or approach roadway, or an appraisa lrating of 3 for structure evaluation or waterway adequacy.

The share of trunk highway bridges which are deficient depends on whichsufficiency rating categories we examine. In 1995, about 5 percent of trunkhighway bridges had sufficiency ratings below 50. These bridges represented lessthan 4 percent of the total area on trunk highway bridges and culverts. Mn/DOTestimates that it would take about $185 million to correct the deficiencies on thesebridges.
The estimates of deficient bridges, areas, and improvement costs are greater ifbridges with higher sufficiency ratings are included. For example, about 541 or12 percent of trunk highway bridges and culverts had sufficiency ratings less than80 in 1995. These bridges represented 9 percent of the total area and would costan estimated $322 million to improve.
Table 2.12 shows that most of these 541 bridges had a deficiency related to theircondition or structural adequacy. 14 Deficient bridge conditions accounted for 356of these bridges, and it would require $195 million to correct the deficientconditions. Structural conditions are the only deficient factor for 240 bridges andwould require an estimated $100 million in improvement projects. This latterfigure is more than twice the average annual amount Mn/DOT spent on bridgereplacement, preservation, and safety between 1991 and 1995. 15 These datasuggest that:
• There is a backlog of bridges which are structurally deficient and needto be improved or replaced.
We are less convinced of the need to improve or replace those bridges which arelabeled deficient only because of their failure to meet width, clearance, or other
Table 2.12: Type of Deficiency for Trunk HighwayBridges, 1995
Deck Area of EstimatedNumber of Deficient Bridges ImprovementDeficient (in Millions of CostBridgesa Square Feet) (in Millions)
Condition Only 240 1.71 $100.2Condition and Other Factors 116 0.87 95.3Load But Not Condition 2 0.03 24.2Other Factors 183 1.54 102.1
Total 541 4.15 $321.8
Source: Minnesota Department of Transportation.
aBased on sufficiency ratings less than 80.
The trunkhighwaysystem has abacklog ofstructurallydeficientbridges.
TRUNK HIGHWAY TRENDS 41
14 Of the 541 bridges, Mn/DOT considers 333 to be structurally deficient. Another 147 bridges areconsidered to be functionally obsolete based on substandard width, clearance, or other geometricfactors. The remaining 61 bridges are deficient railroad bridges over trunk highways.
15 In the 5-year period (1991-95), Mn/DOT spent an annual average of $45.8 million for bridgereplacement, preservation, and safety work. Mn/DOT also spent an annual average of $16.9 millionfor expansion purposes--namely, new bridges which did not previously exist.

geometric criteria. The decision on whether to improve those bridges should bebased primarily on an assessment of the benefits and costs. Widening or replacinga bridge may or may not make sense depending on the cost of the improvementand the extent to which the project is expected to reduce accidents and congestion.
It is somewhat difficult to interpret the long run trends in the number of deficientbridges and the estimated cost to improve them. On several occasions, the criteriaused to determine whether a bridge is deficient have changed and caused morebridges to be labeled deficient. In particular, there were some major changes in1988 and 1990 as new federal criteria were implemented. As a result, it isprobably best to examine the trends which have occurred since the last significantchange in 1990. 16
Even the trends since 1990 are not easy to interpret. Some of the data in Table2.11 show that Mn/DOT has been able to reduce the backlog of deficient bridgessince 1990. The number of deficient bridges has declined 9 to 13 percent,depending on what sufficiency ratings are included. In addition, the estimatedcost to improve bridges declined roughly 30 to 35 percent. However, while thedeck surface area of deficient bridges declined 18 percent for deficient bridgeswith sufficiency ratings less than 50, it increased for the other categories.Mn/DOT also believes that its data may understate estimated improvement costs,particularly for bridge deck rehabilitations. This would affect 1995 more than1990, since there is a higher percentage of deck rehabilitations in the 1995 data,and would suggest that estimated improvement costs for deficient bridges did notdecline as much as shown in Table 2.11.
We estimate, however, that the cost of improving deficient bridges decreasedbetween 1990 and 1995 even allowing for the potential understatement of deckrehabilitation costs. 17 As a result, we think that:
• Spending over the 1990-95 period was sufficient to modestly reduce,but not eliminate, the magnitude of the deficient bridge backlog.
Although Mn/DOT has a backlog of deficient bridges, other states may facebigger backlogs. Available data suggest that a substantially smaller percentage ofMinnesota’s bridges are deficient than the national average. Minnesota has asmaller percentage of structurally deficient bridges and a much lower percentageof functionally obsolete bridges than the national average. 18
Mn/DOT hasreduced thebacklog ofdeficientbridges since1990 but asignificantbacklogremains.
42 HIGHWAY SPENDING
16 Effective in 1990, states were required to apply a uniform set of federal criteria for determiningwhether a bridge’s width was adequate. As a result, more bridges in Minnesota were identified ashaving deficient widths.
17 Even if the understatement of deck rehabilitation costs would have applied only to 1995 and toall deficient bridges, which it does not, it would not account for the entire decrease in estimatedimprovement costs between 1990 and 1995.
18 Minnesota has a smaller than average percentage of deficient bridges on both its state and localhighway systems.

AgeData presented in Table 2.13 andFigure 2.7 show that:
• Trunk highway bridgesare aging, butMinnesota will benefitfrom a favorable agedistribution for the next15 to 20 years.
The average age of trunkhighway bridges and culvertshas increased modestly over thelast 10 years. From 1986 to1995, the average age of trunkhighway structures increasedfrom 31 to 34 years. In 1995, it had been about 28 years since the averagestructure had been either built or remodeled.
Despite the aging of trunk highway bridges and culverts, Minnesota is currentlybenefiting from the fact that most of its structures are relatively new and are notexpected to need replacement for some time. Figure 2.7 shows that 70 percent ofthe structures were 30 years old or less in 1995 and almost 89 percent were 40years old or less. 19
Given an average expected life of 60 years, this age distribution suggests thatMinnesota may benefit for the next 15 to 20 years by being able to replace arelatively small share of its bridges. However, starting in about the year 2015,Mn/DOT will likely face an increasing need to replace bridges.
Age
20%
23%
27%
19%
3% 3%5%
0 to 10 11 to 20 21 to 30 31 to 40 41 to 50 51 to 60 61 or more
Percent ofTotal Area
Figure 2.7: Age of Bridges andCulverts by Year Built, 1995
Source: Minnesota Department of Transportation.
Table 2.13: Average Age of Trunk Highway Bridges
Based on Based on YearYear Built Last Remodeled
1986 31.3 NA1988 NA 26.81995 34.2 28.4
NA = Not available.
Source: Minnesota Department of Transportation.
While trunkhighwaybridges areaging, only asmall share ofthem arenearing the endof theirexpected lives.
TRUNK HIGHWAY TRENDS 43
19 The data in Figure 2.7 are based on the year that a structure was built. Based on year lastremodeled, 83 percent of Minnesota’s structures are 30 years old or less and 94 percent are 40 yearsold or less.

This expected trend is somewhat complicated by the recent discovery by Mn/DOTthat some of its bridges may not last as long as previously expected. Mn/DOT hasfound problems with some of the steel bridges built between 1950 and 1980.Steel bridges that are subject to high volumes of heavy truck traffic are thought tohave fatigue-prone steel elements and may need major rehabilitation orreplacement earlier than would otherwise be expected. Mn/DOT has estimatedthat 87 bridges carry traffic loads which may put them at risk. The costs ofrepairing or replacing these bridges may be as high as $270 million, with about 85percent of the estimated costs applying to bridges in the Twin Cities metropolitanarea.
CONGESTION
The total amount of travel on Minnesota’s streets and highways increased 76percent between 1974 and 1994, including a 36 percent increase over the last 10years. Travel on the State Trunk Highway System increased more, because mostof the largest increases have occurred on interstate highways and principalarterials which are part of the system. For example, from 1985 to 1995, travel ontrunk highways increased 46 percent. The largest increase was on urban interstatehighways (87 percent) and rural interstate highways (62 percent). Travel alsoincreased 55 percent on other urban principal arterials. Travel on collector andlocal highways on the system actually declined 24 percent.
This increase in travel has resulted in a significant increase in congestion on someinterstate highways and principal arterials. One way to measure congestion is tocompare the traffic volume on a highway to its capacity or peak service flow. InTable 2.14, we examine how the percentage of Minnesota highways which hadsignificant congestion changed over a recent 10-year period. A highway is
Table 2.14: Percentage of Streets and Highways withSignificant Congestion, 1984 and 1994
Percentage of Mileswith Volume-to-Service
Flow Ratios Exceeding 0.95
1984 1994URBAN
Interstate 36.3% 45.5%Other Freeways 13.3 39.4Other Principal Arterials 19.1 18.4Minor Arterials 13.6 8.4Collectors 0.6 1.5
RURALInterstate 0.0% 11.7%Other Principal Arterials 0.6 2.9Minor Arterials 0.7 0.9Major Collectors 0.1 0.0
Source: Federal Highway Administration.
Congestion hasgrown onMinnesota’shighways.
44 HIGHWAY SPENDING

considered to be congested if its traffic volume exceeds 95 percent of its capacity.According to this definition:
• The miles of congested highways in Minnesota increased from 449miles in 1984 to 694 miles in 1994, with urban interstate highways andfreeways being the most congested.
Nearly 46 percent of urban interstate highways and 39 percent of other urbanfreeways were congested in 1994. In addition, 18 percent of other urban principalarterials and 12 percent of rural interstate highways experienced congestion.
Most, but not all, of the congestion is in the Twin Cities metropolitan area. In thelast several years, Mn/DOT has addressed congestion in the metropolitan area byfocusing on installing meters on freeway ramps, building some high-occupancyvehicle lanes, and permitting buses to use highway shoulders. Data fromMn/DOT indicate that the percentage of metropolitan area freeway miles whichare congested has declined slightly in recent years. Mn/DOT, however, believesthat the biggest gains from the ramp metering system have already been realizedand that freeway congestion will probably grow in the future. 20
SAFETY
The fatality rate on all of Minnesota’s roads has declined by nearly 50 percentsince the mid-1970s. In 1994, there were 644 fatalities on Minnesota’s roads, or1.5 fatalities for each 100 million vehicle miles driven. This rate was significantlylower than the rate of 2.9 experienced in 1975, when there were 754 fatalities onMinnesota’s roads.
As Figure 2.8 shows, much ofthe decrease came during the1980s. In addition, the trend inMinnesota reflected the nationaltrend. The fatality rate on roadsthroughout the nation alsodeclined by about 50 percentbetween 1975 and 1994. Thereasons for this trend are notentirely clear. The aging of thebaby boom generation, greaterseat belt usage, and more severepenalties for driving whileintoxicated each may haveplayed a role in reducing fatalityrates.
0.0
1.0
2.0
3.0
4.0
1975 1980 1985 1990 1994 Year
Minnesota United States
Rate
Figure 2.8: Fatality Rate per 100Million Vehicle Miles Traveled,Minnesota and the US, 1975-94
Source: National Highway Traffic Safety Administration.
Highwayfatality rateshave beendeclining inMinnesota andmany otherstates.
TRUNK HIGHWAY TRENDS 45
20 Minnesota Department of Transportation, Performance Report (St. Paul, 1996), 88-90.

Minnesota’s fatality rate per 100 million vehicle miles of travel has generally beenbelow the national average. In 1994, Minnesota’s rate was about 14 percent lowerthan the national rate. In addition, data from the Federal Highway Administrationsuggest the injury rate in Minnesota is also lower than the national average.While Minnesota’s road standards may play a role in our lower fatality and injuryrates, it is unclear how significant road standards are in reducing fatality andaccident rates. It is possible that the driving habits of Minnesotans relative todrivers elsewhere may explain a significant portion of the difference in rates. 21
Minnesota’s trunk highways are generally safer than other roads in the state.Trunk highways carry about 60 percent of the state’s traffic but account for alower share of the state’s crashes. In 1995, 47 percent of the fatalities and 40percent of the injuries on Minnesota’s roads occurred on trunk highways. Inaddition, 40 percent of the property damage crashes were on trunk highways.
SUMMARY
Funding for the State Trunk Highway System is higher today than it was duringthe mid-1970s. However, funding has declined from the peaks reached during themid- to late 1980s. The decline is mostly due to lower levels of federal aid. Statefunding has also declined since the late 1980s, when the state gasoline tax was lastincreased and vehicle excise taxes were last transferred to the Trunk HighwayFund.
The purchasing power of the Trunk Highway Fund has been helped, however, bystable construction prices. Prices for highway construction in Minnesota haveincreased significantly less than the general rate of inflation. As a result, overallspending from the Trunk Highway Fund in 1996 was only 12 percent below thepeak reached in 1988.
There is a backlog of trunk highway bridges needing repairs or replacement,although some modest improvement appears to have been made in recent years inreducing the backlog. There does not appear to be a similar backlog for trunkhighway pavements, although Mn/DOT would develop a backlog if it reduced theamount of pavement rehabilitation work done each year.
Trunk highway pavement and bridge conditions have been relatively unchangedover the last decade. Pavement conditions have improved slightly, while bridgeconditions have declined slightly. Both pavements and bridges on the State TrunkHighway System are aging. However, Mn/DOT has been able to keep pavementsin good condition by resurfacing them. Over the last decade, the average age ofthe surfaces covering trunk highway pavements has declined modestly. Based onage alone, a relatively small percentage of the bridges may need replacement overthe next 15 years. About 89 percent of bridges and culverts are 40 years old orless, and they are generally expected to last 60 years. Problems with steel fatigue
Stableconstructionprices havehelpedmaintain thepurchasingpower of theTrunkHighway Fund.
46 HIGHWAY SPENDING
21 Minnesota also has a lower fatality rate on interstate highways, where differences in roadstandards are less likely to be a factor.

on certain bridges subject to high volumes of heavy truck traffic may require thereplacement of some bridges earlier than would otherwise be expected.
Congestion has been growing on trunk highways over the last several decades.Mn/DOT has been able to constrain the growth in congestion somewhat throughthe installation of freeway ramps and other projects. However, future growth incongestion is expected.
TRUNK HIGHWAY TRENDS 47

ProjectionsCHAPTER 3
In the previous chapter, we saw that the general trend in trunk highwayspending has been upward since the mid-1970s, although spending hasdeclined from the peak reached in 1988. Spending has also not kept up with
the growth in traffic on Minnesota’s trunk highways since the mid-1970s.
In this chapter, we examine the projected revenues for the Trunk Highway Fundand Mn/DOT’s spending plans through fiscal year 2001. We consider theimplications of financial projections and spending plans for the condition of trunkhighway pavements and bridges. In particular, we address the following questions:
• How does projected revenue growth for the Trunk Highway Fundcompare with expected inflation?
• How does Mn/DOT propose to spend trunk highway revenues over thenext two to four years?
• What are the implications of these financial projections for thecondition of trunk highway pavements and bridges?
• Does Mn/DOT have adequate methods for projecting trunk highwayneeds?
To analyze Trunk Highway Fund revenues and expenditures, we used projectionsrecently prepared by Mn/DOT. Mn/DOT estimated revenues and expenditures forfiscal year 1997, as well as for the next four years. Revenue projections werebased on current law. Expenditure projections incorporated the Governor’srecommendations for the 1998-99 Biennial Budget.
We compared estimated revenues and expenditures for the 5-year period1997-2001 with actual revenues and expenditures for the last 10 years, 1987-96.All revenues and expenditures were converted to 1996 dollars using estimates ofpast and future inflation rates obtained from the Department of Finance and

prepared by Data Resources, Inc. 1 The comparison period includes a period(1988-90) of historically high revenues and expenditures, as well as a period(1991-94) of generally declining revenues and expenditures.
These projections of revenues and expenditures are reasonable estimates.However, future economic conditions, the public’s desire to travel on highways,and Congressional decisions about federal aid are all difficult to forecast and willplay a key role in determining the actual level of future revenues and, indirectly,expenditures.
REVENUES
Projections indicate that:
• Average annual revenues for the Trunk Highway Fund over the next 5years will probably be close to the average experienced over the last 10years.
Table 3.1 shows that average annual revenues for 1997-2001 are estimated to be$871 million in 1996 dollars. This estimate is within 1 percent of the 1987-96average of $879 million. Despite no increase in the tax rate, state gasoline taxesare expected to keep up with inflation, as measured by the deflator for state and
Table 3.1: Comparison of Projected 1997-2001 Trunk Highway FundRevenues with the 10-Year Average for 1987-96
Average AnnualRevenue
(in millionsof 1996 dollars)
Average AnnualRevenue per Capita
(in 1996 dollars)Percentage Percentage
1997-2001 1987-96 Difference from 1997-2001 1987-96 Difference from(Projected) (Actual) 10-Year Average (Projected) (Actual) 10-Year Average
REVENUESGas Tax $311 $298 4% $65 $67 (3)%Vehicle Registration Tax 267 225 18 56 50 10Other State Sources 76 94 (19) 16 21 (25)Federal Aid 217 262 (17) 45 59 (23)Total Revenues $871 $879 (1)% $182 $198 (8)%
Source: Legislative Auditor’s analysis of data from Mn/DOT, the Department of Finance, and Minnesota Planning.
50 HIGHWAY SPENDING
1 We used the state and local government deflator for consumption expenditures and grossinvestment to convert historical and projected revenues and non-construction expenditures to 1996dollars. As in Chapter 2, we used the Minnesota Highway Construction Cost Index to converthighway construction expenditures to 1996 dollars. Because projected values of the index are notavailable, we constructed a proxy from indices for which forecasts are available. The proxy consist sof 60 percent of the state and local government deflator for expenditures on structures and 40percent of the deflator for residual fuels in the oil refining process. The 60 percent weight refle ctsthe significance of concrete and steel in highway construction work, while the 40 percent weightreflects the importance of bituminous products, which are a by-product of the oil refining process.Our results would not have been significantly different if we had used the same deflator for futurehighway construction spending as we used for future revenues and other expenditures.

local government purchases. 2 Average annual revenues from vehicle registrationtaxes are projected to be 18 percent higher during the next 5 years than during thelast 10 years. The growth in vehicle registration taxes is primarily due to theprojected increase in vehicle prices. Registration taxes are based on the value ofvehicles sold and are thus more responsive to general inflation in the economythan the current fixed-rate gasoline tax. Other state sources of revenues andfederal aid are, however, expected to be lower over the 1997-2001 period.
On a per capita basis, average annual revenues are projected to be 8 percent lowerover the next 5 years than the last 10 years. Only revenues from vehicleregistration taxes are expected to exceed the level experienced from 1987 to 1996.If traffic levels continue to increase faster than population, then revenues pervehicle mile traveled over the period 1997-2001 will be more than 8 percent lowerthan they were over the last 10 years.
Figure 3.1 shows that:
• Trunk Highway Fund revenues are expected to increase through fiscalyear 1999 and then decline slightly.
Overall, the estimated decline in revenues is about 5 percent from 1999 to 2001.Most of this decline is due to lower levels of expected federal aid in the years2000 and 2001. Mn/DOT expects the levels in 1998 and 1999 to be higher due to
$200
$400
$600
$800
$1,000
Year
1987-96 Average
Actual Projected
1988 1991 1994 1997 2000
Millions of1996 Dollars
Figure 3.1: Trunk Highway Fund Revenues, Actualand Projected, 1987-2001
Source: Program Evaluation Division analysis of Mn/DOT data.
Trunk highwayrevenues areexpected to beclose to the10-yearhistoricalaverage.
PROJECTIONS 51
2 By the year 2000, the growth in gasoline tax revenues is projected to slow down and be slightlyless than the inflation rate. This modest slowdown in the expected rate of revenue growth is becaus ethe phase-out of the blender’s credit for ethanol will have been completed by 1999.

demonstration grants from the federal government. However, projections offederal aid are subject to some uncertainty, particularly at this time. 3 Congresswill be considering the reauthorization of the Intermodal Surface TransportationEfficiency Act later this year. Better information on future levels of federal aidwill be available after Congress acts on this legislation.
SPENDING
Table 3.2 indicates that:
• Average annual trunk highway expenditures from 1997 through 2001are expected to be about 5 percent above the average for the last 10years.
In 1996 dollars, average annual spending on trunk highway construction projectsover the next 5 years is estimated to be about one percent less than the averageexperienced over the last 10 years. Expenditures by Mn/DOT for operations,engineering, general support, administration, equipment, and debt service areexpected to be about 6 percent higher on average over the next 5 years than theywere over the last 10 years. 4 Average annual spending by the Department ofPublic Safety and other departments out of the Trunk Highway Fund is estimatedto increase by 10 percent. Spending on other miscellaneous activities is expectedto more than double. About two-thirds of the increase in this relatively small
Table 3.2: Comparison of Projected 1997-2001 TrunkHighway Expenditures with the 10-Year Average for1987-96
Annual Averages(in millions of 1996 dollars)
Percentage1997-2001 1987-96 Difference from(Projected) (Actual) 10-Year Average
Trunk Highway Construction $405 $407 (1)%Other Mn/DOT 376 355 6Other Departments 82 75 10Miscellaneousa 30 12 139
Total $892 $849 5%
Source: Legislative Auditor’s analysis of data from Mn/DOT and the Department of Finance.
aIncludes buildings, shared construction, and Mn/DOT spending in non-trunk highway program are as.
Spending isalso expected tobe close to thehistoricalaverage.
52 HIGHWAY SPENDING
3 Due to uncertainty about federal aid, Mn/DOT included a $20 million reserve in its budget planfor the Trunk Highway Fund. This reserve would be needed in case expected federal aid during1998 and 1999 falls short of projections.
4 We amended Mn/DOT’s projections to reflect its recent request to add $16 million in 1997 to itsoperations budget for the additional costs of snow and ice control this winter. That change alsoreduced projected highway construction expenditures in 1997 by $16 million.

category is due to the new shared construction program. 5 The remainder is due toincreased spending on capital building projects.
Figure 3.2 shows how trunk highway construction spending has varied over thelast 10 years and how it is projected to change over the next 5 years. Similar tothe trend we saw in overall revenues:
• Highway construction spending is expected to increase through 1998and then decline by about 5 percent by 2001.
Projections for other trunk highway expenditures by Mn/DOT are shown inFigure 3.3. These projections also show spending declining in 2000 and 2001.Other trunk highway spending by Mn/DOT is expected to increase in 1997 andthen decline by 9 percent by the year 2001. The decline is a little larger than forconstruction spending because Mn/DOT carried over part of its non-constructionappropriations for 1996 to 1997. As a result, spending in 1996 was lower thanpreviously anticipated and spending in 1997 will be higher than it otherwisewould have been.
Overall spending and revenue trends for the Trunk Highway Fund seem somewhatinconsistent. We saw in Table 3.1 that revenues over the next 5 years are expectedto average about 1 percent less than the annual average over the last 10 years.
$0
$100
$200
$300
$400
$500
Year
1987-96 Average
ActualProjected
1988 1991 1994 1997 2000
Millions of1996 Dollars
Figure 3.2: Trunk Highway ConstructionExpenditures, Actual and Projected, 1987-2001
Source: Program Evaluation Division analysis of Mn/DOT data.
Constructionspending isexpected toincrease duringthe 1998-99biennium butdecreaseduring thefollowingbiennium.
PROJECTIONS 53
5 Under the shared construction program, Mn/DOT does construction work at the request ofvarious political subdivisions, and the Trunk Highway Fund is ultimately reimbursed for theseexpenditures. As a result, the cost of the shared construction program to the Trunk Highway Fund isa relatively minor reduction in investment earnings. The increase reflected in Table 3.2 greatlyoverstates the ultimate net cost to the fund.

However, average expenditures from 1997 through 2001 are estimated to be 5percent higher than the 10-year historical average.
There are two reasons for this apparent inconsistency. First, we used a differentinflation index to deflate construction expenditures than we used for otherexpenditures and for revenues. As we explained in Chapter 2, prices paid byMn/DOT for highway construction have been relatively stable over the last 10years. While prices faced by state and local governments rose 30 percent between1987 and 1996, construction prices paid by Mn/DOT increased less than 10percent. Our use of the Minnesota Highway Construction Cost Index to deflatepast construction spending is responsible for about half of the overall differencebetween revenue and expenditure trends.
Second, most of the remaining difference results from the spending down ofTrunk Highway Fund balances. As Figure 3.4 shows, the fund balance was about$147 million at the end of 1996 and will be less than $3 million by the end of1999 if the Governor’s proposed budget is adopted. Mn/DOT has forecast smallyear-end deficits for 2000 and 2001. 6 Mn/DOT’s spending plans essentiallyanticipate the spending down of fund balances during the 1997-99 period. As aresult:
• Trunk highway spending during the 2000-01 biennium is expected tobe about 4 percent lower than during the 1998-99 biennium.
$0
$100
$200
$300
$400
Year
Projected
Actual 1987-96Average
1988 2000
Millions of1996 Dollars
Figure 3.3: Other Trunk Highway Expenditures byMn/DOT, Actual and Projected, 1987-2001
Source: Program Evaluation Division analysis of Mn/DOT data.
54 HIGHWAY SPENDING
6 Mn/DOT’s projections include some contingency funds for 1997-99, which, if not needed, maypreclude the fund from running a deficit after 1999. The projection for 1997 includes a $6.75million contingency, while the projections for 1998 and 1999 each include a $10 millioncontingency.
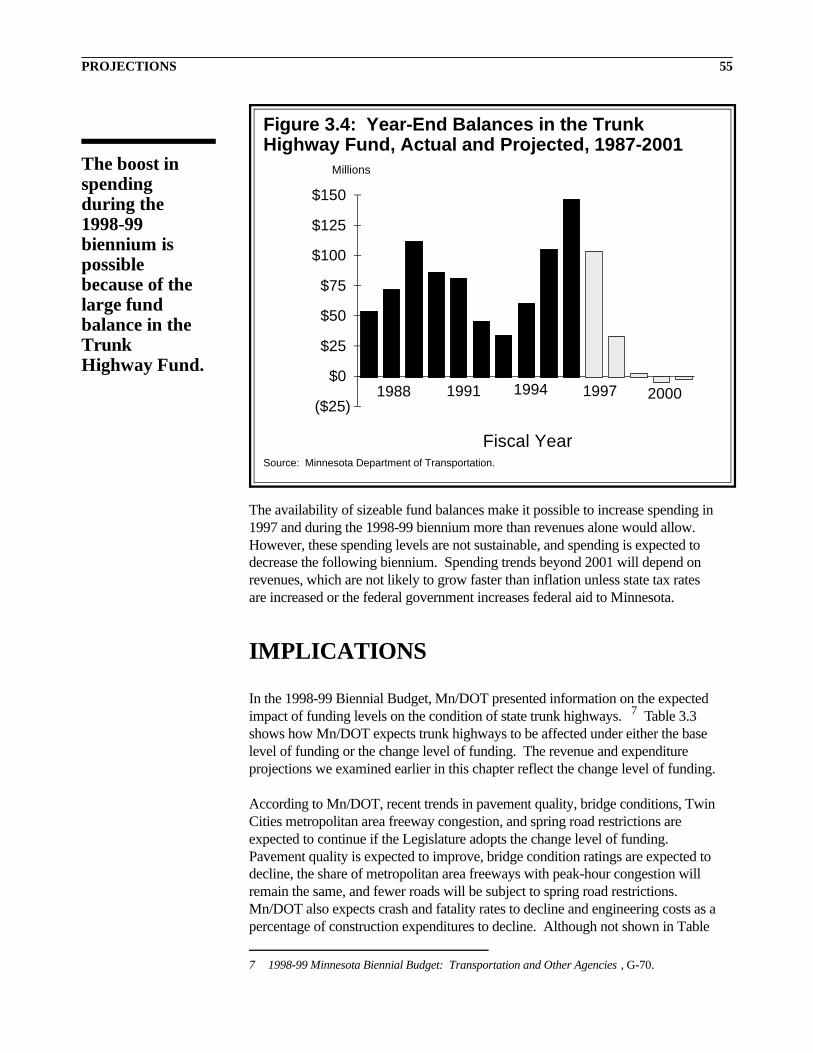
The availability of sizeable fund balances make it possible to increase spending in1997 and during the 1998-99 biennium more than revenues alone would allow.However, these spending levels are not sustainable, and spending is expected todecrease the following biennium. Spending trends beyond 2001 will depend onrevenues, which are not likely to grow faster than inflation unless state tax ratesare increased or the federal government increases federal aid to Minnesota.
IMPLICATIONS
In the 1998-99 Biennial Budget, Mn/DOT presented information on the expectedimpact of funding levels on the condition of state trunk highways. 7 Table 3.3shows how Mn/DOT expects trunk highways to be affected under either the baselevel of funding or the change level of funding. The revenue and expenditureprojections we examined earlier in this chapter reflect the change level of funding.
According to Mn/DOT, recent trends in pavement quality, bridge conditions, TwinCities metropolitan area freeway congestion, and spring road restrictions areexpected to continue if the Legislature adopts the change level of funding.Pavement quality is expected to improve, bridge condition ratings are expected todecline, the share of metropolitan area freeways with peak-hour congestion willremain the same, and fewer roads will be subject to spring road restrictions.Mn/DOT also expects crash and fatality rates to decline and engineering costs as apercentage of construction expenditures to decline. Although not shown in Table
($25)
$0
$25
$50
$75
$100
$125
$150
Fiscal Year
1988 1991 1994 1997 2000
Millions
Figure 3.4: Year-End Balances in the TrunkHighway Fund, Actual and Projected, 1987-2001
Source: Minnesota Department of Transportation.
The boost inspendingduring the1998-99biennium ispossiblebecause of thelarge fundbalance in theTrunkHighway Fund.
PROJECTIONS 55
7 1998-99 Minnesota Biennial Budget: Transportation and Other Agencies , G-70.

3.3, Mn/DOT also expects highway user satisfaction with travel time, safety, andwinter road condition information to increase.
While Mn/DOT is to be commended for attempting to link funding withperformance, we do not think Mn/DOT has sufficiently analyzed its constructionprogram or budget in preparing these forecasts of highway and bridge conditionsover the 1998-99 biennium. Mn/DOT’s forecasts are rough estimates at best andare not based on an analysis of the construction work programmed for this yearand the 1998-99 biennium. In addition, Mn/DOT has not used its pavement andbridge management systems to analyze the implications of the constructionprogram.
We estimate that Mn/DOT’s proposed highway construction budget for the1998-99 biennium will be about 8 percent higher in inflation-adjusted dollars thanit was during the previous two years. This suggests that there is room for a smallamount of improvement in trunk highway conditions during the next biennium. 8
However, it is unclear what implications the overall increase would have forparticular performance measures.
For the most part, Mn/DOT’s forecasts of highway conditions in the nextbiennium are based on this overall increase planned for the construction budget(or other budgets when relevant) without any detailed information on how muchcertain programs within the construction budget would receive. So, for example,the effect on bridge condition ratings was forecast without knowing how muchadditional money, if any, would be allocated to the bridge replacement program orthe bridge improvement and repair program. Similarly, trends in pavement qualitywould be difficult to project without knowing how much of the construction
Table 3.3: Expected Impact of Funding on the StateTrunk Highway System
Level of Funding
Base Level Change Levela
Pavement Quality Index No Change Increase
Bridge Condition Ratings Decrease Decrease
Percentage of Metro Area Freeway MilesCongested During Peak Hours
Increase Same
Percentage of Miles with Spring RoadRestrictions
Minor Decrease Decrease
Crash and Fatality Rates Increase Decrease
Ratio of Program Delivery Costs toConstruction Expenditures
No Change Decrease
Source: Minnesota Department of Transportation.
aThe revenue and expenditure projections in this chapter are based on the change level of fund ing.
56 HIGHWAY SPENDING
8 We estimate that inflation-adjusted construction expenditures in the 2000-01 biennium would beabout 3 percent lower than in the 1998-99 biennium.

budget would be allocated to resurfacing, reconditioning, road repair, andreconstruction.
More important, these forecasts cover a short period of time. Changes in highwayor bridge conditions over a two-year period are likely to be relatively small. Evenas funding changed over the last 10 years, any changes in highway and bridgeconditions were small and slow to occur. It is more essential to know whatperformance Mn/DOT can sustain over a longer period of time given projectedfunding levels based on current state tax rates. In the remainder of this chapter,we consider what long run changes might be expected and how Mn/DOT couldbetter forecast these and provide policy makers and the public with clearer andmore accurate information on the implications of funding levels for trunkhighways. In addition, we will assess the adequacy of funding for trunk highways.
PavementsIn the past, Mn/DOT has attempted to forecast future pavement needs. Onemethod Mn/DOT has used involves making assumptions about how frequentlytrunk highways need to be resurfaced and reconstructed. This method issomewhat unsatisfactory because it is not clear that a highway needs to bereconstructed unless it was poorly built in the first place or has not beenadequately maintained and resurfaced over time. 9 In fact, many of the highwayreconstructions done by Mn/DOT are done for reasons other than pavementcondition.10 Mn/DOT is much more likely to reconstruct a road as part of anexpansion or safety project. As a result, it is difficult to project the reconstructioncosts that will be necessary due to pavement conditions.
We used a different method to estimate the amount of resurfacing andreconstruction work necessary to maintain a constant pavement quality index onMinnesota’s trunk highways in the future. We asked staff in Mn/DOT’s PavementManagement Unit to use the Pavement Management System (PMS) to estimatethe number of miles of resurfacing and other work necessary to maintain aconstant PQI from 1995 through 2005. In addition, we requested that Mn/DOTstaff use the PMS to estimate the cost of the work over the 10-year period runningfrom 1996 through 2005. 11 The results were as follows:
• Maintaining a constant systemwide average pavement quality indexon Minnesota’s trunk highways would require an estimated $160
We estimatethat Mn/DOT’sannualpavementrehabilitationneeds are $160million.
PROJECTIONS 57
9 In addition, a road might not have been built to handle the heavy truck loads it is carrying.
10 Erland O. Lukanen and Chunhua Han, Braun Intertec Corporation, ‘‘Performance History andPrediction Modeling for Minnesota Pavements,’’ Conference Proceedings: Third InternationalConference on Managing Pavements, Volume 1 (Washington, D.C.: National Academy Press,1994), 68.
11 At the time Mn/DOT made these estimates, actual data on the PQI was available through 1995.As a result, the estimates were made for 1996 through 2005. The optimization procedure used byMn/DOT selects resurfacing and other projects which have the greatest cost-effectiveness given theconstraint of a fixed annual budget. We had Mn/DOT staff run several optimizations at differentannual budget levels until we could estimate the annual expenditure level necessary to maintain arelatively constant PQI over the 10-year period.

million per year (in 1996 dollars) to be spent on resurfacing and otherpavement rehabilitation projects.
• An estimated 1,200 miles of resurfacing and other pavementrehabilitation work would need to be done annually on the StateTrunk Highway System in order to maintain a constant pavementquality index.
We also compared the annual amount of work necessary to maintain a constantPQI through 2005 with the actual amount of work done from 1986 through 1995.That comparison indicates that:
• In the future, Mn/DOT may need to increase the average annualnumber of miles of pavement rehabilitation work in order to maintainthe pavement quality index at its current level.
As Figure 3.5 shows, Mn/DOTaveraged 938 miles ofresurfacing, concrete pavementrepair, and reconstruction workper year on trunk highways from1986 through 1995. ThePavement Management Systempredicts that 1,199 miles ofannual work, or 28 percent morethan the historical average, willneed to be done from 1996through 2005 in order for thepavement quality index toremain constant. If chip andsand seals are included alongwith these other types of work,then the total projected annualneeds are 1,200 miles, which is13 percent higher than thehistorical average of 1,066. 12
The estimates generated by the Pavement Management System may indicate thatthe expected life of a trunk highway surface is changing due to changes inpavement and surface composition, as well as increasing traffic levels and loads.Fewer highways are composed of only their original bituminous or concretepavements. More highways consist of bituminous surfaces over the originalbituminous or concrete pavements, and these overlays may not last as long as theoriginal pavement did before it needed to be resurfaced. In addition, the loadscarried by trunk highways have increased along with traffic levels, which havebeen growing 2 to 3 percent annually.
938
1,199
Actual Work1986-95
Projected Needs1996-2005 (1)
Figure 3.5: Average Annual Milesof Resurfacing, Reconditioning,and Reconstruction Work onTrunk Highways, Actual andProjected
Source: Program Evaluation Division analysis ofMn/DOT data.
1Amount necessary to maintain a constant pavementquality index.
Mn/DOT mayneed toresurfacehighways morefrequently inthe future.
58 HIGHWAY SPENDING
12 It should be noted that the volume of activity from 1986 to 1995 was sufficient to raise thepavement quality index slightly. This forecast suggests that even more miles of work will need to b edone over the next 10 years just to keep the PQI constant.

The above estimate of future pavement needs is not definitive but raises asignificant issue which Mn/DOT needs to investigate more thoroughly. Werecommend that:
• Mn/DOT should examine the Pavement Management System to see ifit is accurately predicting the rate at which roads deteriorate. If thesystem is found to be accurate, then Mn/DOT should reexamine howmuch money it is planning to spend on the preservation of trunkhighway surfaces and pavements.
Mn/DOT is in the process of modifying its Pavement Management System toinclude more systematic consideration of preventive maintenance activities. Afterthis revision, Mn/DOT should reexamine the optimization procedure we used toestimate the average annual amount of work and expenditures necessary tomaintain a constant pavement quality index. It is possible that includingpreventive maintenance may alter these work and expenditure requirements. Aswe will discuss in Chapter 4, advocates of preventive maintenance say thatpreventive maintenance is cost-effective and can reduce the frequency with whichpavements need resurfacing.
BridgesIn 1995, Mn/DOT’s Office of Bridges and Structures developed an estimate ofannual bridge funding needs for the next 10 years. Mn/DOT has used thisestimate internally and has presented it to legislative committees. The estimate,including $24 million for bridge preservation and $47 million for bridgereplacement, totals $71 million per year in 1996 dollars.
The amount of money Mn/DOT spends annually on bridge preservation andreplacement has been and is expected to be substantially less than the estimated$71 million in annual needs. From 1988 through 1995, Mn/DOT spent an annualaverage of $48 million on bridge preservation and replacement. The Office ofBridges and Structures projected that an average of about $41 million would bespent annually from 1996 through 1998. 13
For several reasons, however, we think that:
• Mn/DOT should reexamine its estimate of annual bridge preservationand replacement needs.
We have several concerns about the estimate. First, the estimate includes bridgeswhich have width or other geometric problems but do not have structuralproblems. We think that the cost of replacing those bridges should be categorizedseparately. Mn/DOT generally will not replace a bridge only because it does notmeet geometric standards. In part, Mn/DOT’s practices probably reflect acost-effective use of resources. Bridges with only geometric deficiencies should
Mn/DOT needsto reestimateits bridgepreservationandreplacementneeds.
PROJECTIONS 59
13 Expenditure data are based on the bridge projects let or programmed during each year. Theseexpenditures do not include new bridges built under the expansion program.

only be replaced if the benefits in terms of reduced accidents, travel time, andvehicle operating costs outweigh the cost of replacement. Many geometricproblems, particularly on lesser traveled or non-congested bridges, may not justifybridge replacement on a benefit-cost basis.
Second, Mn/DOT’s estimate may count some bridges twice: once forpreservation work and a second time for replacement. It is not possible to tellhow much double counting occurs in the estimate, if any. Mn/DOT shouldattempt to eliminate any double counting in the estimate.
Third, the replacement cost estimate may include some bridges for which repairwork may be more appropriate. One of the criteria used by the Office of Bridgesand Structures to identify bridges needing replacement was to include bridges forwhich any major superstructure or substructure element had more than 5 percentof its area in the least favorable condition or more than 20 percent of its area in thetwo lowest conditions. 14 It is not entirely clear that a limited amount ofstructurally deficient area requires replacement rather than repair work. Thiscriterion should be examined by Mn/DOT.
Fourth, Mn/DOT needs to make sure that the recently discovered problems withfatigue-prone steel bridges are incorporated in its estimate of bridge replacementand repair needs. Some of these bridges are already in its $71 million estimate,but others are not included in the estimate and should be added.
Finally, it is unclear how spending $71 million per year on the bridges identifiedby the Office of Bridges and Structures would affect overall bridge performancemeasures. For example, the office has not attempted to determine how statewideaverage bridge condition ratings would change if the preservation andreplacement work recommended by the office were done. It is not known whetherthe $71 million would be adequate to maintain constant condition ratings or wouldincrease the statewide average ratings for decks, superstructures, substructures,and culverts. Similarly, it is not known how implementing the office’srecommended spending level would affect the backlog of deficient bridges.
We think it is important to link any estimate of needs to some performancemeasure. For example, in considering pavement needs, we estimated the cost ofmaintaining a constant PQI on trunk highway pavements. Similarly, for bridges,we recommend that:
• Mn/DOT should attempt to provide an overall estimate of bridgeneeds based on an easily understood performance criterion such asmaintaining constant systemwide bridge condition ratings.
In addition to this estimate, Mn/DOT could also provide estimates of the cost ofeliminating all geometric deficiencies, although we would prefer that the estimatebe limited to those deficiencies which should be addressed because the societalbenefits of eliminating the deficiency exceed the costs.
The estimate ofbridge needsshould belinked toperformanceandbenefit-costcriteria.
60 HIGHWAY SPENDING
14 Generally, the condition of a major element can be characterized as being in one of four or fivecategories.

CongestionAccording to the Metropolitan Council:
• Congestion in the Twin Cities metropolitan area is expected to growby the year 2020 even though current funding levels will probablypermit some expansion of and significant improvements to themetropolitan area highway system.
In its recently adopted 20-year transportation plan, the Metropolitan Councilprojects that the number of congested miles will increase from 100 miles in 1995to 220 in the year 2020. 15 While it is currently possible to access almost anypoint within the 7-county metropolitan area within 60 minutes during the peakhour of traffic, the Council projects that only 60 to 70 percent of the area will havethe same accessibility by 2020. Unpublished data from the Council also show thatthe average speed during the afternoon peak hour will decrease from 36 miles perhour in 1995 to 28 miles per hour in 2020. These average speeds apply to allroads in the metro area which are principal arterials, minor arterials, or collectorsand thus include roads other than those on the trunk highway system. The averageoff-peak speed is not expected to change much from the 1995 estimate of 41 milesper hour.
According to the Metropolitan Council, the metropolitan area could not possiblybuild enough multi-purpose lanes to significantly reduce congestion--it would costmuch more than is available. In addition, the Council feels that theenvironmental, social, and political impacts would be too severe if the areaattempted to build its way out of congestion.
The Metropolitan Council believes it should focus on the most cost-effectiveimprovements first. As a result, Mn/DOT and the Council have focused first onramp meters, ramp by-passes, and HOV lanes. In the future, they will pursueadditional ramp improvements and HOV lanes, and will also be able to fundsome highway expansion and improvement projects designed to address currentbottlenecks. However, a number of large projects such as those involving LRTand major highway reconstruction cannot be completely funded within the20-year transportation plan. Limited funding, as well as other constraints, meanthat congestion in the metropolitan area will probably grow, but its growth will belessened by the projects Mn/DOT and the Council have placed in the 20-year plan.
Mn/DOT publicly reports only a limited measure of congestion on metropolitanarea freeways and does not routinely report long-term projections for congestion.The measure used by Mn/DOT in its biennial performance report counts thenumber of freeway miles on which average speeds fall below 45 miles per hourfor at least one hour during the morning and afternoon peak periods. We think itwould be useful if Mn/DOT regularly reported additional congestion measures.
Congestion isexpected togrow.
PROJECTIONS 61
15 For this plan, the Metropolitan Council defined a congested highway mile as one for whichtraffic volume exceeds highway capacity during the peak hour of the day. Most of these congestedmiles are on the trunk highway system. See Metropolitan Council, Transportation DevelopmentGuide/Policy Plan (St. Paul, December 1996 Draft).

Elsewhere, we have suggested that Mn/DOT consider some additional congestionmeasures.16 The current measure does not capture the increased amount of timevehicles spend waiting on freeway ramps before entering freeways. In addition, itdoes not reflect any growth in the average number of hours that a highway iscongested during a typical day.
We also think it would be useful if Mn/DOT used the Metropolitan Council’smodels to project how congestion on metro area trunk highways is expected tochange. The council does not publish estimates that focus exclusively on trunkhighways.
Furthermore, we suggest that Mn/DOT publicly report data on congestion outsidethe Twin Cities metropolitan area. A simple measure such as thevolume-to-capacity ratio or the average daily traffic per lane may be appropriatefor this purpose. Such a measure would help to inform policy makers aboutstatewide needs for additional lane capacity.
Engineering ExpendituresMn/DOT forecasts that its spending on design and construction engineering, whileincreasing over the 1998-99 biennium, will decline as a percentage of constructionspending. We agree with Mn/DOT about this trend, although the change is likelyto be slight and occurs only because Mn/DOT uses a 3-year moving average tocalculate spending. On a current year basis, engineering spending as a percentageof construction declined in 1996 and is expected to increase in 1998. Mn/DOTestimates a decrease during the 1998-99 biennium because its 3-year movingaverage in 1998 will include the 1996-97 biennium when the percentage waslower than during the 1994-95 biennium.
We calculated engineering spending as a percentage of construction expendituresover the 23-year period from 1974 to 1996 and projected this percentage for theyears 1997 through 2001 based on Mn/DOT’s spending plans. 17 Whileengineering expenditures as a percentage of construction spending has variedconsiderably from year to year--ranging from 19 percent to 48 percent--we foundthat:
• Engineering spending from 1997 to 2001 as a percentage of eitherconstruction spending or all Trunk Highway Fund spending isexpected to be close to the long-run average.
Using Mn/DOT’s spending projections, we estimate that engineering spending asa percentage of construction spending will be about 30.1 percent of highwayconstruction spending during the 1997-2001 period, which is exactly the same as
Mn/DOTshould reportadditionalcongestionmeasures andmakeprojections.
Engineeringspending isexpected to beclose tolong-runaverages.
62 HIGHWAY SPENDING
16 Office of the Legislative Auditor, Comments on the Department of Transportation’s 1996Biennial Performance Report (St. Paul, January 1997), 2.
17 The percentage was calculated on a current year basis. We included all engineering andresearch spending, as well as spending on investment management.
the 23-year average from 1974 to 1996. 18 We also calculated engineeringspending as a percentage of all Trunk Highway Fund spending. That percentageis expected to be lower (13.7 percent) over the next 5 years than the 23-yearaverage (14.1 percent).
ADEQUACY OF FUNDING
Construction FundingPolicy makers have been deadlocked in recent years over highway and transitfunding. Part of this deadlock involves rural-urban policy differences over therelative merits of highways and transit. In addition, there have been questionsraised about whether highway funding is adequate. Furthermore, some policymakers have been reluctant to support a tax increase.
It is apparent to us that Mn/DOT does not have enough funding to meet allpotential highway needs. We previously estimated pavement preservation andreplacement needs to be about $160 million per year in 1996 dollars. Mn/DOTestimated bridge preservation and replacement needs to be about $71 million peryear in 1996 dollars. Although we think this bridge estimate needs to be revised,we will use it below for purposes of illustration.
Over the 5-year period 1997-2001, Mn/DOT’s construction budget will averageabout $405 million in 1996 dollars. Bridge and pavement preservation andreplacement needs account for an estimated 57 percent of the constructionbudget.19 About $174 million per year (in 1996 dollars) would be left forexpansion projects and management and operations projects. The latter categoryincludes safety projects, right-of-way costs, traffic management, cooperativeagreements, and miscellaneous types of projects such as enhancements, junkyardscreening, planning, rest areas and beautification, and rail safety.
As we saw above, funding is not adequate to address all of Minnesota’s highwaycongestion problems or even to prevent congestion from growing in the TwinCities metropolitan area. Mn/DOT’s funding is also insufficient to fully fundmega-projects such as those on Interstate 35W south of Minneapolis and onInterstate 94 between St. Paul and Minneapolis, which include multiple objectivessuch as construction of light rail transit, safety improvements, and reconstructionof aging pavements. Funding is sufficient to fund parts of those mega-projects ina piecemeal fashion. In addition, funding is not sufficient to fully address thebacklog of structurally deficient bridges, perform adequate preventivemaintenance on trunk highways and bridges, and reconstruct those heavily used
Mn/DOT’sfunding is notlikely to beadequate toaddress alltrunk highwayneeds.
PROJECTIONS 63
18 Spending was calculated in 1996 dollars.
19 When comparing pavement needs with the construction budget, the $160 million figure could bereduced somewhat since Mn/DOT crews, not contractors, do a small share of the total bituminousoverlays.

highways which may be more cost-effective to reconstruct than to overlayfrequently.20
Despite years of discussion about whether trunk highway funding is adequate:
• Mn/DOT does not have some of the basic information and has notdone some of the analysis necessary to draw precise conclusions aboutthe adequacy of funding for Minnesota’s trunk highways.
The adequacy of funding should not be measured by simply comparing availablefunds to a list of potential projects. 21 Comparisons such as this invariably resultin a conclusion that infrastructure needs exceed available funding. Instead, it isbetter to link the amount of funding to performance objectives, such asmaintaining a constant PQI, and to know how different levels of funding wouldaffect performance. Furthermore, highway projects involving expansion or safetyneed to be evaluated on a benefit-cost basis. Projects which cannot be justified onthat basis should not be considered to be part of highway needs. While it might benice to improve safety or relieve congestion on a highway, it should not beconsidered a need if the costs of doing so exceed the benefits to highway users.
There have been several previous studies of transportation funding adequacy inMinnesota. In 1991 the Transportation Study Board issued its final report andfound substantial needs in all areas of Minnesota’s transportation system over thenext 20 years.22 The report compared existing funding levels to inflation-adjustedestimates of ‘‘full-service’’ needs and needs under ‘‘acceptable levels of service. ’’Also, a 1992 Mn/DOT study looked at transportation needs through the year 2000and identified the funding necessary to achieve various scenarios labeled as thedeteriorating infrastructure, investment preservation plus transit, economicdevelopment, and competitive advantage scenarios.
While these studies were helpful in understanding transportation needs, neitherstudy considered specific performance targets and the funding needed to achievethem. The studies also did not consider how the benefits of projects included invarious scenarios compared with their costs.
Mn/DOT does not currently have the information which would have enabled us toreach a more specific conclusion about the adequacy of funding for trunkhighways. Mn/DOT has not developed an estimate of the funding needed forhighway preservation and replacement in order to achieve certain pavementquality targets. Its estimate of bridge preservation and replacement needs is
But Mn/DOTshould developthe capabilityto providebetterinformation onits fundingneeds.
64 HIGHWAY SPENDING
20 Chapter 4 discusses the reasons for performing more preventive maintenance. We think thatperforming more preventive maintenance may lower the long term costs of pavement preservationand replacement. However, Mn/DOT finds it difficult to allocate more funds to preventivemaintenance because the immediate pavement, bridge, and expansion needs of the trunk highwaysystem would have to be compromised.
21 For example, see Peggy L. Cuciti and E. Sam Overman , The Assessment of Investment Needs: AReview of Current Estimates and Approaches, prepared for the National Council on Public WorksImprovement (Denver, 1986).
22 Transportation Study Board, Study of Minnesota’s Surface Transportation Needs (St. Paul,January 1991).

flawed in some respects and needs to be developed with specific performancetargets. Furthermore, Mn/DOT is in the early stages of using benefit-cost analysisto assess the pros and cons of major transportation investments, including thosewhich reduce projected congestion or improve safety. Mn/DOT expects to haveanalyzed 10 percent of the major investments made in the year 2000, but will haveanalyzed all major investments made in 2004. 23
However, we think it would be useful for policy makers to get a regular reportfrom Mn/DOT regarding the adequacy of funding for trunk highways. Such areport might be helpful in resolving the debate about highway and transit andcertainly could provide better information for policy makers about the amount offunding necessary for the trunk highway system to maintain current conditions.We recommend that:
• Mn/DOT should periodically prepare a report on the funding needs ofthe trunk highway system. Needs should be defined in terms of whatfunding is necessary to obtain specific performance targets and shouldattempt to use benefit-cost criteria where appropriate.
It would be useful for policy makers to receive a report from Mn/DOT on itsfunding needs every two years to coincide with consideration of the biennialbudget. Mn/DOT believes, however, that it would be more valuable to preparesuch a report on a four-year cycle as it is currently proposing for its statewidetransportation plan. Mn/DOT does not think that the needs would changesignificantly in two years time but would change more over a longer time period.We would support the concept of a four-year cycle but would like to see Mn/DOTprepare a needs report by 1999. Mn/DOT is proposing that the next statewidetransportation plan should be published in the year 2000.
This type of report would not be unique. The United States Department ofTransportation reports to Congress every two years on the status of the nation’ssurface transportation system, including highways, bridges, transit, andwaterborne transportation. 24 The department’s report includes estimates of thefunding needed over the next 20 years to maintain current conditions on thenation’s highways and bridges, as well as additional funding for congestion reliefor safety which can be justified on a benefit-cost basis. Mn/DOT should notnecessarily use the national report as a model, but it serves to show that suchestimates can be made and that funding can be linked with performance targetsand benefit-cost analysis.
In addition, Mn/DOT has some recent experience in preparing a needs studywhich is somewhat linked to performance criteria. In November 1996, Mn/DOT’sMetropolitan Division prepared a draft transportation system plan covering the
Mn/DOTshouldperiodicallyreport on itsfunding needs.
Needs shouldbe definedrelative toperformanceandbenefit-costcriteria.
PROJECTIONS 65
23 Mn/DOT believes that benefit-cost analysis is best conducted early in the planning stage of aproject. Because major transportation investments take 6 or more years to develop, benefit-costresults will not be provided on a regular basis until about 2004. Mn/DOT’s Economic Analysis andSpecial Studies Unit is currently conducting analyses on a number of projects on a demonstrationbasis.
24 United States Department of Transportation, 1995 Status of the Nation’s Surface TransportationSystem: Conditions and Performance, Report to Congress (Washington, D.C., October 1995).

years 2001 through 2020. The report is very useful and provides a great deal ofinformation on the division’s planning efforts and attempts to estimate trunkhighway needs in the metropolitan Twin Cities area. We think the draft report is agood starting point for Mn/DOT in preparing a statewide needs estimate.However, the draft report was not completely explicit about the impact of its planor its unconstrained needs estimate on pavement quality, bridge conditions, andcongestion. In addition, there was limited use of benefit-cost analysis indeveloping estimates of need for the metropolitan area.
Maintenance FundingFor the most part, this chapter has focused on Mn/DOT’s construction budget,which accounts for nearly half of all Trunk Highway Fund expenditures. Thischoice was appropriate since much of Mn/DOT’s impact on the physical conditionand capacity of trunk highways comes through construction funding. However,almost one-fourth of Trunk Highway Fund spending is for highway operations,including snow and ice control and various types of routine maintenance. Here,too, Mn/DOT lacks good information on the unit costs, results, and perhaps theadequacy of its current spending level.
Overall, we think Mn/DOT has been pursuing some important issues regarding itsoperations budget. Mn/DOT has a pilot project operating in District 8 in Willmarto assess how it can better utilize existing staff through the use of a‘‘transportation worker ’’ job classification. The more generic classification mighthelp Mn/DOT improve its performance or control costs by enabling districts touse workers for a greater variety of functions.
In addition, Mn/DOT has had several pilot efforts underway to assess theusefulness of activity-based cost accounting. Previous efforts to developstatewide maintenance management systems have not been successful inproducing useful information on the costs of various maintenance activities. As aresult, Mn/DOT has encouraged district participation in pilot projects to try tobuild a useful system from the ground up rather than from the top down.
We think that activity-based costing would be useful for both Mn/DOT and policymakers. We first cited the need for good maintenance activity cost information ina 1985 report on highway maintenance. 25 Mn/DOT and its districts need suchinformation in order to make cost-effective decisions about maintenanceoperations. Activity-based cost accounting provides information on the unit costof performing various maintenance activities and can help districts better managetheir resources. Oversight from policy makers would also benefit from goodinformation on the cost of various maintenance activities. We encourageMn/DOT’s development of a statewide activity cost system.
We encourageMn/DOT todevelop astatewideactivity costsystem.
66 HIGHWAY SPENDING
25 Office of the Legislative Auditor, Highway Maintenance (St. Paul, January 1985).

SUMMARY
In the short term, trunk highway spending is projected to increase under theGovernor’s proposed budget. In inflation-adjusted dollars, Mn/DOT’sconstruction spending is expected to be 8 percent higher during the 1998-99biennium than during the 1996-97 biennium. Because part of the increase inspending would occur due to a spending down of the balance in the TrunkHighway Fund, construction spending is expected to drop about 3 percent duringthe 2000-01 biennium. Overall, we estimate that average annual constructionspending from 1997 through 2001 would be almost equal to the 10-year averageexperienced from 1987 through 1996. Other spending by Mn/DOT out of theTrunk Highway Fund is expected to be about 5 percent above the average for thelast 10 years.
Mn/DOT has not prepared any long-range estimates of the implications of currentfunding levels for highway and bridge conditions. Its short-range estimates forthe 1998-99 biennium are questionable, since they were based on incompletefunding information and did not make use of Mn/DOT’s pavement and bridgemanagement systems.
In general, we think that projected funding for trunk highways will not besufficient to address a number of problems. However, Mn/DOT’s data were notadequate for us to develop a more precise conclusion. We recommend thatMn/DOT should periodically prepare a report which analyzes trunk highwayfunding needs. Unlike previous reports, this report should show what fundinglevels are needed to achieve certain targets such as maintaining a constantsystemwide average pavement quality. The report should also attempt todistinguish between expansion and safety projects which have benefits in excessof costs and those which do not. The latter projects should not generally beconsidered highway needs, since they would cost more to implement than they arevalued by highway users.
PROJECTIONS 67
Preventive MaintenanceCHAPTER 4
The word ‘‘maintenance, ’’ when used in relation to highways and bridges,refers to a wide assortment of activities that range from routine potholefilling to fairly substantial overlays. Our emphasis in this chapter is on
maintenance activities that are preventive in nature, that is, activities that areperformed to prevent or delay the occurrence of urgent and/or extensivemaintenance problems. In this chapter, we asked:
• What does research show about the effectiveness andcost-effectiveness of preventive maintenance?
• To what extent does the Minnesota Department of Transportation(Mn/DOT) perform adequate preventive maintenance on state trunkhighways and trunk highway bridges?
To answer these questions, we reviewed studies on preventive maintenance;surveyed individuals in the seven outstate Mn/DOT district offices and theMetropolitan Division who are familiar with the maintenance of Minnesota’s statetrunk highway system; spoke to managers at the district offices, MetropolitanDivision, and central office; and obtained data from Mn/DOT’s bridge andpavement management systems on preventive maintenance activities performedon the trunk highway system.
DEFINITION
Preventive maintenance of highways and bridges includes activities that areperformed while a structure is still in fairly good condition. For our study, weadopted a definition of ‘‘preventive maintenance ’’ from a study by theTransportation Research Board and used by a Mn/DOT ‘‘pathbuilding team ’’ thatlooked at the issues of preventive maintenance and preservation in 1994. 1
Preventive maintenance is:
1 Mn/DOT created three pathbuilding teams to further the department’s understanding of how‘‘business practices could be applied to the public sector to further its strategic managementprocess.’’ Minnesota Department of Transportation, Pathbuilding Projects: Final Report (St. Paul,December 1994), 6. The three team topics were: finance, preventive maintenance/preservation, andmarketing.

a program strategy intended to arrest light deterioration, retard progressive fail -ures, and reduce the need for routine maintenance and service activities. Preven -tive maintenance is generally cyclic in nature. It is planned maintenance.Preventive maintenance activities do not significantly improve the load-carryingcapacity of pavements, shoulders, or structures but extend the useful life and im -prove the level of service. 2
Much pavement preventive maintenance is performed to keep moisture out of thepavement subbase. Moisture in the subbase can weaken the support the subbaseprovides to the pavement, leading to cracking and, during freeze-thaw cycles,potholes. Water under concrete slabs can contribute to faulting at the jointsbetween the slabs. 3 Pavement preventive maintenance can also reduce thequantity of incompressible objects in pavement joints and cracks, which canobstruct the natural movement of the pavement in response to temperaturechanges. We describe the pavement preventive maintenance activities on whichwe focused in Figures 4.1 and 4.2. Some of the bituminous and bituminous-over-concrete activities, and all of the concrete activities, on which we focused areusually performed by contractors, as opposed to Mn/DOT maintenance crews.
Figure 4.1: Preventive Maintenance Activities for Bituminous andBituminous-over-concrete Pavement
crack fill--Crack filling consists of placing a material such as an asphalt emulsion1 into a crack. The material reduces water infiltration and reinforces the adjacent pavement. This procedure isgenerally used to maintain older cracks.
crack seal--Crack sealing (or rout and seal) involves routing a crack into a special configuration andfilling it with a material such as rubberized asphalt. The material prevents incompressible objectsand moisture from entering the crack.
fog seal--Fog sealing is the application of an asphalt emulsion. Fog seals coat the road surface andmay fill small cracks. These seals are more commonly used on low-volume roads and shouldersbecause surface friction might be reduced after application.
sand seal--Sand sealing involves applying asphalt emulsion to a road surface, followed by a sandcover. The sand provides some friction and the seal may provide some protection from moisture.
slurry seal--Slurry sealing consists of applying a mixture of fine aggregate,2 emulsion, water, andmineral filler to the road surface. A slurry seal may be applied to the full width of the road, or usedto repair cracks and other minor defects. When applied full-width, slurry seals seal the pavementsurface and may improve minor defects and friction.
micro-surface--Micro-surfacing is basically a special type of slurry seal that uses higher qualitymaterials and a special binder. Micro-surfacing has been used to fill wheel ruts and improve friction,among other things. This treatment can be used on high-volume roads.
70 HIGHWAY SPENDING
2 Louis G. O’Brien for the Transportation Research Board, National Cooperative Highway Re -search Program, Synthesis of Highway Practice Report 153: Evolution and Benefits of PreventiveMaintenance Strategies (Washington, D.C.: National Research Council, December 1989), 7.
3 Two adjacent concrete slabs form a joint. Ideally, the slabs are level. A fault occurs when oneof the slabs of concrete is elevated so that the adjacent slabs are no longer level.

On bridges, most of the preventive maintenance activities on which we focusedare designed to reduce the exposure of bridge components to water and corrosiveagents, such as de-icing chemicals, or to reduce the effects of stress on the bridge,such as that caused by the expansion and contraction of components in response totemperature changes. We describe the bridge preventive maintenance activities onwhich we focused in Figure 4.3. Most of the bridge preventive maintenanceactivities on which we focused are usually performed by Mn/DOT bridgemaintenance crews.
Figure 4.1: Preventive Maintenance Activities for Bituminous andBituminous-over-concrete Pavement, continued
single- and multiple-application chip seal --Chip sealing involves applying an asphalt emulsionfollowed by an aggregate cover. Chip seals may waterproof the road surface, seal low-severitycracks, and improve surface friction. Use of chip seals is usually restricted to low-volume roads.
asphalt overlay (2.0’’ or less)--Asphalt overlaying consists of applying a surface of hot-mix asphalt. Asphalt overlays improve the smoothness of a road and the friction of the pavement surface. Thinoverlays typically do not add to the load carrying capacity of the pavement.
1An asphalt emulsion is a mixture of asphalt cement, water, and an emulsifying agent.
2Aggregate is a mixture of mineral particles such as sand, gravel, or rocks.
Figure 4.2: Preventive Maintenance Activities for Concrete Pavement
reseal joints--Joints in concrete pavements are resealed to prevent moisture and incompressibleobjects such as sand from entering the joint. Water penetrating the cracks may cause fine materialbelow the concrete slab to wash out, reducing the pavement support, and incompressibles mayincrease the likelihood of pavement blowups during freeze-thaw cycles.
repair spalled1 joints--Repairing spalled joints before the spalling becomes too severe improves thesmoothness of the ride of the road and may prevent further deterioration, which would require moreextensive and expensive repairs.
install edge drains--Edge drains provide a system for water that reaches a pavement’s base layer todrain out of the base materials. Edge drains are important when the pavement has a poorlydraining subgrade, such as clay or silt.
retrofit load transfer--Retrofit load transfer involves doweling (or fastening) concrete slabs togetherwith a metal bar to help reduce the impact of traffic on the concrete slabs. Retrofit load transfer mayhelp reduce faulting2 and the ejecting of fine materials under the concrete slabs up through jointsand cracks. The latter weakens the pavement support.
grind concrete--Grinding improves the smoothness of the ride on concrete pavements that haveexperienced faulting at cracks or joints. It may also slow down or prevent the ride from becomingrough again and reduce the impact of traffic.
1Ideally, the edge of a concrete panel is a relatively sharp 90-degree angle. Two adjacent pan els form a joint. A spalled joint is onein which the sharp edges of the concrete panels forming the joint have worn away, leaving a roug her and wider opening to the joint.
2Two adjacent concrete panels form a joint. Ideally, the panels are level and traveling from one to the other is barely noticeable. Afault occurs when one of the panels of concrete is elevated due to water problems and traffic, so that the adjacent panels are nolonger level.
PREVENTIVE MAINTENANCE 71

RESEARCH
Most of the studies we reviewed found pavement preventive maintenanceactivities to be effective if they were applied to pavements at the right time usingproper materials and application procedures. Preventive maintenance cannot beexpected to extend the life or improve the service of a pavement or bridge thatwas poorly constructed or that has already deteriorated. The appropriateness of anactivity for a specific highway or bridge may depend on traffic volume andclimate, among other things.
An Indiana study looked at the trade off between two maintenance activities:sealing cracks and joints (preventive maintenance) and patching (demand
Figure 4.3: Preventive Maintenance Activities for Bridges
crack seal on concrete decks --Crack sealing of bridge decks prevents water and corrosive materialsfrom reaching the reinforcing steel in the deck.
lubricate expansion bearings --Expansion bearings are lubricated to maintain their ability to move.Bearings that cannot move in response to expansion of bridge components may cause stress onother components of the bridge.
flush winter residue--Salt, sand, debris, and corrosive materials are flushed from bridge decks andother surfaces (such as bridge seats) to prevent the concrete from cracking and scaling and steelcomponents from corroding.
reinstall strip neoprene glands --A strip neoprene gland is a flexible material placed in expansion jointsto prevent water and debris from reaching components below the bridge deck. The glands can pullout of the joints or tear.
clean and reseal joints--Joints that are not sealed with neoprene glands are filled with some othermaterial, such as cork or felt, that is covered with a sealer. These joints are hard to maintain, andthe seal does not last long. The joints need to be cleaned and resealed to prevent corrosivematerials from leaking onto components below the deck.
spot paint--A protective coat of paint prevents corrosion of steel elements. Spot painting may extendthe life of the paint coat.
install relief joints in concrete approaches --Relief joints in concrete approaches to bridges relieve thepressure on bridge components caused by expanding concrete. The pressure may cause damageto bridge components.
correct approach panel settlement 1--Correcting approach panel settlement improves the smoothnessof the ride and safety and reduces the impact of traffic on the bridge.
place drain extensions on floor drains --Drain extensions carry water away from the supportingstructures below the bridge deck.
Note: These activities were taken from the list of preventive maintenance activities in Mn/ DOT’s Bridge Maintenance Manual. Themanual includes activities not included above.
1Approach panel settlement occurs when the approach panel to the bridge settles so that it is o n a lower level than the bridge.
72 HIGHWAY SPENDING

maintenance). The authors found that ‘‘if more cracks are sealed before winter,less patching is required after winter, primarily because of fewer potholes. ’’4
In 1994, the Transportation Research Board surveyed state, local, and Canadiantransportation agencies about their experiences with pavement preventivemaintenance.5 Table 4.1 shows that state transportation agencies generallyobserved increases in pavement life that they attributed to preventive maintenanceactivities.6 Some of the variation in experience may be due to differences indesign, materials, or work quality, and it is possible that some of the roads werenot good candidates for preventive maintenance.
The Federal Highway Administration (FHWA) is studying the effectiveness ofpavement preventive maintenance on ‘‘test sections’’ of highways. The testsections are located throughout the United States and Canada and wereconstructed using the same crew, materials, and design to control some of thevariables that can affect preventive maintenance performance. In the early 1990s,the FHWA completed subjective visual field evaluations of 87 sections. Theevaluators concluded that the sections that received preventive maintenance weregenerally performing better than those that had not, and the preventive
Table 4.1: States’ Reported Increase in Pavement Life Attributed toPreventive Maintenance Activities
Surface and ActivityMost Common
Response Range of ResponsesStates
Responding1
BITUMINOUSCrack filling2 2-4 years Less than 2 to 7-8 years 29Single-application chip seal 5-6 years 2-4 to 7-8 years 26Multiple-application chip seal 5-6 years 2-4 to 9-10 years 12Slurry seal 2-4 years 2-4 to 5-6 years 7Micro-surface 5-6 years 2-4 to 7-8 years 11Thin hot-mix asphalt overlay 7-8 years 2-4 to 9-10 years 23 (1.25 inches or less)
CONCRETEJoint spall repair 5-6 years 2-4 to 15 years 21Joint sealer replacement 5-6 years 2-4 to 9-10 years 18
Source: Donald N. Geoffroy, for the Transportation Research Board, National Cooperative Highway Research Program Synthesis of High-way Practice 223: Cost-Effective Preventive Pavement Maintenance (Washington, D.C.: National Academy Press, 1996), 54-60.
1This is the number of states responding for each activity. It does not include states that re sponded ‘‘unknown’’ or N/A.
2The survey asked about crack filling with or without routing.
PREVENTIVE MAINTENANCE 73
4 Essam A. Sharaf and Kumares C. Sinha, ‘‘Energy Savings from Increased PreventiveMaintenance on Indiana Highways,’’ Transportation Research Record 1102: Highway MaintenancePlanning (Washington, D.C.: National Research Council, 1986), 28.
5 Donald N. Geoffroy, for the Transportation Research Board, National Cooperative HighwayResearch Program Synthesis of Highway Practice 223: Cost-Effective Preventive PavementMaintenance (Washington, D.C.: National Academy Press, 1996). Forty-five states, four Canadianprovinces, and eleven local agencies responded.
6 The increases in pavement life were primarily estimates based on observational experience ofagency staff.

maintenance was more effective when performed on pavements that were in bettercondition.7
The American Association of State Highway and Transportation Officials, in its1987 Manual for Bridge Maintenance, states, ‘‘Most problems can be prevented orminimized by timely preventive maintenance for bridges. ’’8 Some activitiesmentioned in this manual include cleaning the deck, joints, substructure caps, andbearings; spot painting; and maintaining joint seals. In the mid-1980s, severalresearchers interviewed bridge maintenance engineers who identified thefollowing effective practices: flushing bridge seats; cleaning, painting, andlubricating bearings; and flushing and providing good drainage for the deck. 9
Neither of these publications evaluated the activities.
Several studies have concluded that the benefits of pavement preventivemaintenance exceed the costs. 10 However, the measures of costs and benefitshave varied across studies. Benefits may include lower repair and rehabilitationcosts over the life of the pavement or structure and improved ride quality andsafety. Costs generally include the cost of labor and materials and may includeuser delay costs.
A study on sand sealing and chip sealing in Indiana estimated that agency andvehicle operating costs would be lower over the life of a pavement if sealing wereperformed at the appropriate times. 11 Researchers from the Ministry ofTransportation in Ontario concluded that crack sealing in bituminous pavements,when done at the right time, was cost-effective when total agency and some usercosts were considered. 12 A third study concluded that ‘‘undertaking [maintenanceand rehabilitation] actions on pavement in ‘good’ condition may cost only $1.00for every $4.00 that would be necessary for appropriate [maintenance andrehabilitation] if the pavement were left to deteriorate into poor condition. ’’13
Many studieshave foundpreventivemaintenance tobe effective.
74 HIGHWAY SPENDING
7 Raza Hassan, Summary Report: 1993 Field Evaluations of SPS-3 and SPS-4 Test Sites ,Publication No. FHWA-SA-94-078 (Washington, D.C.: Federal Highway Administration, October1994). Additional studies supporting the effectiveness of pavement preventive maintenance arecited below because they also support the cost-effectiveness of these treatments.
8 American Association of State Highway and Transportation Officials , AASHTO Manual forBridge Maintenance (Washington, D.C., 1987), 3.
9 J.M. Kruegler, G.M. Briggs, C.C. McMullen, and G.A. Earnhart, Cost-Effective BridgeMaintenance Strategies, Volume II: Guidelines and Recommendations , Report No. FHWA/RD-86/110 (McLean, Virginia: Federal Highway Administration, June 1986).
10 The distinction between effectiveness and cost-effectiveness is important. The effectiveness of atreatment refers to its ability to achieve a desired result. Cost-effectiveness also considers whet herthe benefits of a treatment exceed the cost. It is possible that a treatment could be effective inextending pavement life (i.e., be effective), but cost more than the additional years of life are wo rth.
11 Abdullah I. Al-Mansour and Kumares C. Sinha, ‘‘Economic Analysis of Effectiveness ofPavement Preventive Maintenance,’’ Transportation Research Record 1442: Maintenance of theHighway Infrastructure (Washington, D.C.: National Academy Press, 1994), 31-37.
12 Joseph Ponniah and Gerhard Kennepohl, ‘‘Crack Sealing in Flexible Pavements: A Life-CycleCost Analysis,’’ Transportation Research Board 74th Annual Meeting, Paper #950763 (January 22-28, 1995).
13 Essam A. Sharaf, Mohamed Y. Shahin, and Kumares C. Sinha, ‘‘Analysis of the Effect ofDeferring Pavement Maintenance,’’ Transportation Research Record 1205: Pavement Maintenance1988 (Washington, D.C.: National Research Council, 1988), 29-35.
However, not all studies support the effectiveness (and therefore thecost-effectiveness) of preventive maintenance of pavements. For example,researchers at the Wisconsin Department of Transportation are studying sealingjoints in concrete pavements and have questioned its effectiveness. 14 Somestudies showed mixed results on the effectiveness of micro-surfacing. With fouryears of data, one study showed micro-surfacing to be more resistant to re-ruttingthan a 1.5 inch asphalt overlay, but less resistant to cracking. 15 In another study,poorly performing test sections were usually attributable to problems duringapplication of the micro-surfacing materials or inadequate treatment design. Theresearcher concluded that the experience of the contractors and quality controlthroughout the micro-surfacing process were very important to successful use ofmicro-surfacing. 16
Mn/DOT is currently participating in a study of the cost-effectiveness ofpavement preventive maintenance. A description of the study says the study willlook at existing data on maintenance obtained from state and local agencies andsupplement it with new data obtained from test sections constructed primarily onthe state trunk highway system. The study will focus on preventive maintenancetreatments for bituminous pavements, such as slurry sealing, crack filling, andmicro-surfacing. Both agency and user costs will be considered in the calculationof cost-effectiveness.
Mn/DOT PRACTICES
Mn/DOT performs preventive maintenance on state trunk highways and bridges,or arranges for the preventive maintenance to be performed by contractors. Thedecisions about which activities to use on which highways and bridges, and howmuch money to spend on preventive maintenance versus other activities, are madeby the Mn/DOT districts and the Metropolitan Division.
Mn/DOT provided us with data on the amount of preventive maintenanceperformed on bituminous, bituminous-over-concrete, and concrete pavementsbetween 1986 and 1995, as recorded in its pavement management system. 17 AsTable 4.2 shows, contractors sealed cracks on about 1,700 miles of bituminous
Mn/DOT isresponsible forpreventivemaintenanceon the StateTrunkHighwaySystem.
PREVENTIVE MAINTENANCE 75
14 Stephen F. Shober, ‘‘The Great Unsealing: A Perspective on PCC Joint Sealing, ’’ WisconsinDepartment of Transportation, (unpublished). We discussed this study with an engineer at Mn/DOTwho suggested the current findings of the study are applicable to pavements on certain types ofbases for which drainage is not much of a problem. Other test sections were too new to draw aconclusion.
15 C.M. ‘‘Swede’’ Pederson and William J. Schuller, ‘‘Micro Surfacing with Natural LatexModified Asphalt Emulsion: A Field Evaluation’’ (Oklahoma Department of Transportation, August1987).
16 Dean A. Maurer, ‘‘Ralumac Latex-Modified Bituminous Emulsion Mixtures: A Summary ofExperience in Pennsylvania,’’ Research Project 82-22 (Pennsylvania Department of Transportation,April 1987).
17 According to Mn/DOT, the pavement management system records all contract work and someasphalt overlays performed by Mn/DOT crews. Overlays that are at least a half-mile long and areperformed by Mn/DOT crews are included. Other work performed by Mn/DOT crews is notreflected in these figures.

and bituminous-over-concrete highways and chip sealed just over 1,200 miles inthis ten-year period. Contractors or Mn/DOT crews also applied thin asphaltoverlays (less than or equal to two inches) on almost 2,700 miles of bituminousand bituminous-over-concrete highways. According to Mn/DOT records, about22 percent more miles were chip sealed and 3 percent more miles were overlaidwith a thin asphalt layer in the second five-year period (1991-95) than in the firstfive years. The records also showed that cracks were sealed in five times as manymiles in 1991-95 than in 1986-90.
On concrete pavement, contractors resealed joints in over 450 miles of highwayand repaired spalled joints in over 1,100 miles of highway. Mn/DOT recordsshow that spalled joints were repaired on about 20 percent fewer miles in thesecond five-year period (1991-95) than in the previous five-year period. Recordsalso showed that joints were resealed on about 92 percent fewer miles in thesecond five-year period, relative to the period 1986-90. Over the ten-year period,the number of concrete roadway miles on the state trunk highway system declinedabout 16 percent.
We asked Mn/DOT to use its pavement management system to see if there werepavements that were in a condition such that preventive maintenance might beappropriate. The pavement management system analyzes information oncondition ratings, levels of surface defects, age, and average daily traffic on thestate trunk highways. The pavement management system recommends one ormore possible actions based on the pavement information. The recommendations
Table 4.2: Miles of Selected Activities on the StateTrunk Highway System, 1986-95
Miles of Activity1
AnnualActivity 1986-90 1991-95 Total Average
BITUMINOUS/BITUMINOUS-OVER-CONCRETE
Crack Seal 273 1,392 1,665 167Chip Seal 547 668 1,215 122Asphalt Overlay (2’’ or less) 1,320 1,383 2,703 270
CONCRETEReseal Joints 441 33 474 47Repair Spalled Joints2 651 527 1,178 118
Source: Minnesota Department of Transportation.
1Miles of work include all contract work and some asphalt overlays performed by Mn/DOT mainten ancecrews. Overlays that are at least a half-mile long and performed by Mn/DOT crews are included.
2Includes partial-depth repair and more extensive full-depth repair.
76 HIGHWAY SPENDING

range from ‘‘do nothing’’ to ‘‘reconstruct.’’18 The results of the analysis show thatabout 65 percent of state trunk highway miles might benefit from preventivemaintenance. This does not mean that two-thirds of the highway miles needimmediate preventive maintenance. However, these miles are in good enoughcondition for preventive maintenance to be considered.
Though the pavement management system can supply information on the level ofactivity taking place and the number of miles that might benefit from preventivemaintenance, it does not give an indication of whether this level of activity isappropriate. To help us evaluate whether Mn/DOT is doing enough preventivemaintenance, we sent questionnaires to the District Engineers and theMetropolitan Division Engineer. One questionnaire asked about preventivemaintenance of bituminous and bituminous-over-concrete pavement, one askedabout preventive maintenance of concrete pavement, and one asked aboutpreventive maintenance of bridges. The specific activities we asked about aredescribed in Figures 4.1, 4.2, and 4.3.
We asked the engineers to distribute the surveys to those individuals who couldbest respond for the districts’ maintenance areas. 19 For each questionnaire, wereceived 12 responses from individuals in supervisory and management positionsrepresenting all parts of the state. In most cases, we also spoke with the peoplewho returned the questionnaires for clarification and further explanation ofanswers.
Some responses we received represent an entire district, while others represent amaintenance area within a district. Figure 4.4 shows the organizational units thatresponded. Maintenance areas and districts do not represent equal miles ofbituminous pavement or concrete pavement, or equal numbers of bridges, so wedid not weight responses in any way. 20 We think the responses we receivedconvey what the people familiar with preventive maintenance think about its usein the areas where they work.
We askedMn/DOTmanagersaround thestate abouttheir use ofpreventivemaintenance.
PREVENTIVE MAINTENANCE 77
18 At our request, the decision criteria used by the pavement management system to assess thepavements that might benefit from preventive maintenance are different from the criteria used in thecurrent system. The criteria used were developed by a Mn/DOT pathbuilding team on preventivemaintenance based on the members’ years of experience and engineering expertise. These criteria,which will be incorporated into the pavement management system, contain more options forpavements in relatively good condition, for which preventive maintenance might be appropriate.The current criteria focus more on pavements in relatively worse condition.
19 Four of the outstate Mn/DOT districts (Districts 1, 3, 6, and 7) are divided into two maintenanceareas. Districts 2 and 4 formerly had separate maintenance areas, but no longer do. District 8 has amaintenance sub-area, but not separate maintenance areas. We asked for responses for the separatemaintenance areas because we thought practices might differ among them. However, for each of thethree questionnaires, three districts responded with only one questionnaire for the whole district.The Metropolitan Division Engineer was asked to forward the questionnaires to the people whocould respond for the entire metropolitan area.
20 In analysis not reflected in this report, we counted each single district response and theMetropolitan Division response twice, as if each maintenance area or sub-area had responded. Theresults did not change the general conclusions we draw in this chapter, though specific relationship ssometimes changed.

Bituminous and Bituminous-over-concretePavementBituminous and bituminous-over-concrete pavements together comprise about 80percent of Minnesota’s state trunk highway roadway miles. Bituminouspavements include both originally constructed bituminous highways andbituminous highways that have been overlaid with a bituminous layer.Bituminous-over-concrete highways, as their label would suggest, are highwaysthat were originally constructed as concrete but have since been overlaid with abituminous layer. The preventive maintenance activities on which we focused forthese two types of pavements are the same and, in the remainder of this section,we use ‘‘bituminous’’ to refer to both.
The questionnaire we sent the district offices and the Metropolitan Divisionasking about preventive maintenance activities for bituminous pavement focusedon the nine activities described in Figure 4.1. Of the nine activities we askedabout, five had been used in most respondents’ areas since January 1990. Thefive activities that had been performed in most areas include crack filling, cracksealing, fog sealing, single-application chip sealing, and asphalt overlaying. 21
Managers gave various reasons for why sand sealing, slurry sealing, multiple-application chip sealing, and micro-surfacing had not been used. For example,lack of pavements requiring the treatment, ineffectiveness of the treatment, andlack of cost-effectiveness in the respondent’s area were cited as reasons why sandsealing and multiple-application chip sealing were not used. For slurry sealing,managers cited the newness of the procedure and either a lack of opportunity totry it or a desire to see performance in other areas before using it. A lack ofMn/DOT equipment or private contractors who perform micro-surfacing and the
Figure 4.4: Responses to the PreventiveMaintenance Questionnaires
Pavement Questionnaires Bridge Questionnaire
District 1 District 1District 2 Maintenance Area 2AMaintenance Area 3A Maintenance Area 2BMaintenance Area 3B Maintenance Area 3AMaintenance Area 4A Maintenance Area 3BMaintenance Area 4B District 4Maintenance Area 6A Maintenance Area 6AMaintenance Area 6B Maintenance Area 6BMaintenance Area 7A Maintenance Area 7AMaintenance Area 7B Maintenance Area 7BDistrict 8 District 8Metropolitan Division Metropolitan Division
Managers fromall regions ofthe stateresponded to ourquestionnaire.
78 HIGHWAY SPENDING
21 The question read: ‘‘Since January 1990, have Mn/DOT crews or contractors performed thisactivity on any of your maintenance area’s bituminous or BOC pavements? 1.) Yes 2.) No 3.)Don’t know.’’

newness of the procedure were cited by respondents as reasons why more of thisactivity does not occur. 22
Table 4.3 shows that:
• Mn/DOT managers responding to our questionnaire said their areasperformed the right amount of some preventive maintenanceactivities, but too little of other activities.
For example, almost all managers said that too little crack filling was performedin their areas, and half thought too little crack sealing was performed. Somepeople thought the right amount of almost all activities was performed in theirareas, while others thought they did not perform the right amount of any
Table 4.3: Questionnaire Responses on Adequacy ofPavement Preventive Maintenance
We do We do the NoActivity "too little" "right amount" Response
BITUMINOUS/BITUMINOUS-OVER-CONCRETE PAVEMENT
Crack fill 11 1 0Asphalt overlay (2" or less) 7 5 0Crack seal 6 5 1Fog seal 6 6 0Slurry seal 6 3 3Micro-surface 6 1 5Sand seal 4 6 2Single-application chip seal 4 7 1Multiple-application chip seal 4 6 2
CONCRETE PAVEMENTRepair spalled joints 6 5 1Reseal joints 5 7 0Grind concrete 4 8 0Install edge drains 2 10 0Retrofit load transfer 1 4 7
Note: The question read: "In your professional opinion, how adequate is your maintenance are a’s useof this treatment? (Please consider only the need for the activity, not budget or other contra ints.)"
Source: Program Evaluation Division questionnaire sent to Minnesota Department of Transpo rtation dis-trict offices and the Metropolitan Division, 1996.
Mn/DOTmanagersthought theydid the rightamount ofsome activities,but too little ofothers.
PREVENTIVE MAINTENANCE 79
22 The question read: ‘‘For each activity that has not been performed in your maintenance areasince January 1990, which reason best explains why? 1.) It is not effective in our maintenance area .2.) It is not cost-effective in our maintenance area. 3.) We have not had any pavements in thecondition for which this treatment should be used. 4.) Other 5.) Don’t know. ’’

activity.23 However, most managers’ responses were somewhere between thesetwo extremes. The wide range of opinion may in part be explained by differentlevels of preventive maintenance that respondents feel are ‘‘adequate’’ and bydifferent interpretations of what ‘‘adequate’’ means.
About half the time, Mn/DOT managers indicated that resource constraints, eitherfinancial or personnel, at least partly explained why some preventive maintenanceactivities are used too little. However, for some individual activities, otherreasons were cited more frequently. For example, traffic volumes were cited mostoften as the reason more chip sealing is not done. 24
Concrete PavementWe also asked the Mn/DOT district offices and the Metropolitan Division abouttheir use of and experience with preventive maintenance activities for concretepavement. The activities are described in Figure 4.2. Resealing joints, repairingspalled joints, installing edge drains, and grinding concrete had been performed inmost of the respondents’ areas since January 1990. Retrofit load transfer had beenused in five areas. 25
Table 4.3 shows how managers felt about the adequacy of their use of concretepreventive maintenance activities. 26 Compared to their use of bituminouspreventive maintenance,
• Mn/DOT managers generally were more satisfied with their use ofconcrete pavement preventive maintenance, but some were concernedthat Mn/DOT may not be attending to concrete joints early enough toprevent more costly problems from developing.
Resourceconstraintslimit theamount ofpreventivemaintenanceperformed.
80 HIGHWAY SPENDING
23 The number of activities respondents thought were being performed too little in their areasranged from one to nine. The question read: ‘‘In your professional opinion, how adequate is yourmaintenance area’s use of this treatment? (Please consider only the need for the activity, not budg etor other constraints.) 1.) We perform too little of this. 2.) We perform the right amount of this. 3.)We perform too much of this.’’ Some respondents did not provide an opinion on the adequacy ofuse for all activities. In these cases, the individuals indicated the activity had not been used in theirarea since January 1990 and they felt they did not have enough experience with the activity to forman opinion. Originally, 25 items were unanswered. Based on follow-up calls we recoded twelve ofthe missing responses. Two were recoded as ‘‘too little.’’ Ten were recoded as ‘‘the right amount.’’
24 The question read: ‘‘For each activity for which you indicated your maintenance area ‘‘performstoo little,’’ why doesn’t your maintenance area use this treatment more? (Indicate all that apply.) 1.)We do not have adequate funds to perform this activity on all applicable roads. 2.) It is hard tojustify performing this activity on roads in relatively good condition when other roads are in worsecondition. 3.) Maintenance workers are performing other maintenance activities. 4.) Maintenanceworkers are working in other areas (e.g., performing constructions inspections). 5.) This activity isnot a maintenance area, district, and/or agency priority. 6.) Traffic volumes prevent more use of t histreatment. 7.) Other 8.) Don’t know.’’
25 The question read: ‘‘Since January 1990, have Mn/DOT crews or contractors performed thisactivity on any of your maintenance area’s concrete pavements? 1.) Yes 2.) No 3.) Don’t know. ’’
26 The question read: ‘‘In your professional opinion, how adequate is your maintenance area’s useof this treatment? (Please consider only the need for the activity, not budget or other constraints .)1.) We perform too little of this. 2.) We perform the right amount of this. 3.) We perform too muc hof this.’’

Five managers said they performed too little joint resealing and six said theyperformed too little repairing of spalled joints. According to activity datamaintained in Mn/DOT’s pavement management system, contractors repairedspalled joints on about 80 percent as many miles and resealed joints on about 8percent as many miles in the five years 1991-95 as in the previous five-yearperiod.27 In a national study, most of the states that provided information reportedfirst replacing joint sealer and first repairing spalled joints in the first ten years ofpavement life, while Minnesota reported a pavement age of 12 years at firsttreatment.28 Responses to our questionnaire suggest the pavement might even beolder than 12 years, on average, when this work is first done. This is notnecessarily evidence that too little of these activities is being performed; otherfactors can affect the use of these treatments. For example, one respondent told usthat his area has a large quantity of failed concrete pavements because of thequality of aggregate used during construction, and resealing joints would not help.Another told us, ‘‘Our concrete roads are getting old enough that we have donerepairs once or twice already. The next fix would be bigger. ’’
We asked why too little of some preventive maintenance activities is performed.The most common reason given by Mn/DOT managers was inadequate funds.The second most frequently cited reason for too little work being performed wasthe difficulty in justifying work on roads in relatively good condition when otherroads are in worse condition. 29
BridgesIn the bridge questionnaire, we asked Mn/DOT about the preventive maintenanceactivities described in Figure 4.3. It is not surprising that all but one of theactivities (extending floor drains) had been performed in most respondents’ areassince January 1990 because all of the activities we asked about are recommendedin Mn/DOT’s Bridge Maintenance Manual. 30
Trunkhighwaysmight benefitfrom earlierand morefrequentconcrete jointwork.
PREVENTIVE MAINTENANCE 81
27 According to Mn/DOT, its pavement management system records work done under contract andsome asphalt overlays performed by Mn/DOT’s maintenance crews. If any joint spall repair orresealing of joints was performed by Mn/DOT crews, it would not be captured in these figures.According to questionnaire respondents, both types of activities are usually performed undercontract, though one respondent indicated joint resealing is performed by Mn/DOT crews and undercontract.
28 Geoffroy, Cost-Effective Preventive Pavement Maintenance , 54-55 (Appendix D). Fifteen of 21states repaired spalled joints in the first ten years and 17 of 22 states replaced joint sealer in t he firstten years.
29 The question read: ‘‘For each activity for which you indicated your maintenance area ‘‘performstoo little,’’ why doesn’t your maintenance area use this treatment more? (Indicate all that apply.) 1.)We do not have adequate funds to perform this activity on all applicable roads. 2.) It is hard tojustify performing this activity on roads in relatively good condition when other roads are in worsecondition. 3.) Maintenance workers are performing other maintenance activities. 4.) Maintenanceworkers are working in other areas (e.g., performing constructions inspections). 5.) This activity isnot a maintenance area, district, and/or agency priority. 6.) Traffic volumes prevent more use of t histreatment. 7.) Other 8.) Don’t know.’’
30 Minnesota Department of Transportation, Office of Bridges and Structures, Bridge MaintenanceManual (St. Paul, February 27, 1996), Section 5-399.100. Half of the respondents reported thatnone of their bridges needed floor drain extensions since January 1990.

Table 4.4 shows that:
• Mn/DOT managers responding to our questionnaire said their areasperformed the right amount of some bridge preventive maintenanceactivities, but too little of other activities.
For example, most managers felt their areas were doing too little spot painting ofbridges.31 Bridge maintenance people mentioned the difficulty of doing spotpainting cost-effectively because of the environmental and safety regulationsinvolved with removing lead-based paint.
Nine of the twelve respondents felt their areas were doing too little cleaning andresealing of bridge deck joints. According to one Mn/DOT publication, ‘‘One ofthe most serious bridge maintenance problems is leaky expansion joints. ’’32
Ideally, joints should not leak. If joints with poured joint sealer are leaking, thejoints should be cleaned and resealed. If joints with strip neoprene glands areleaking, the glands should be repaired or replaced. Table 4.5 shows the percent ofbridges with leaking joints recorded in the bridge maintenance managementsystem as of September 1996. 33 About 70 percent of bridges with poured jointsealer had at least one leaking joint. Only 9 percent of bridges with neoprene
Table 4.4: Questionnaire Responses on Adequacy ofBridge Preventive Maintenance
We do We do the NoActivity "too little" "right amount" Response
Spot paint 11 1 0Clean/reseal deck joints 9 3 0Lubricate expansion bearings 8 4 0Correct approach panel settlement 7 5 0Crack seal concrete decks 5 7 0Reinstall strip neoprene glands 5 7 0Install relief joints in concrete approaches 5 7 0Flush winter residue 3 9 0Place drain extensions on floor drains 1 10 1
Note: The question read: "In your professional opinion, how adequate is your maintenance are a’s useof this treatment? (Please consider only the need for the activity, not budget or other contra ints.)"
Source: Program Evaluation Division questionnaire sent to Minnesota Department of Transpo rtaion dis-trict offices and the Metropolitan Division, 1996.
82 HIGHWAY SPENDING
31 The question read: ‘‘In your professional opinion, how adequate is your maintenance area’s useof this treatment? (Please consider only the need for the activity, not budget or other constraints .)1.) We perform too little of this. 2.) We perform the right amount of this. 3.) We perform too mu chof this.’’
32 Minnesota Department of Transportation, Transportation Research 1995 Annual Report (St.Paul), 49.
33 The condition information we received contains the most recent inspection information as ofSeptember 1996. The actual inspection dates for the bridges vary.

glands had leaking joints; most of the state trunk highway bridges have this typeof expansion joint. 34
Most of the managers answering our questionnaire thought they were doing theright amount of bridge flushing. Flushing winter residue from bridges is onepreventive maintenance activity for which Mn/DOT has a recommendedfrequency against which we could compare actual performance. It is important toflush bridges to prevent concrete from cracking and scaling and steel componentsfrom corroding. By analyzing data maintained in Mn/DOT’s bridge maintenancemanagement system, we found that:
• Mn/DOT flushes bridges less frequently than the once-a-yearfrequency recommended in the Mn/DOT Bridge Maintenance Manual.
Table 4.6 shows that, based on two years of data from the bridge maintenancemanagement system, bridges are being flushed, on average, once every threeyears. Some bridges were flushed more than once during the two years, so somebridges probably have a once-a-year cycle, while others are flushed even lessfrequently than the once-every-three-years average we calculated.
We called a few of the managers who responded to our questionnaire for possibleexplanations of why the bridge flushing activity was below recommended levels.We learned that the bridge maintenance management system does not containinformation about all of the bridge flushing activity that occurs. For example,Duluth has the longest cycle between flushing in Table 4.6, but this may partlyreflect the fact that highway maintenance workers do some of that district’s bridgeflushing, and the flushing done by these workers is not recorded in the bridgemaintenance management system. Managers also told us that it is less importantto flush certain bridges each year, such as bridges that are not treated with a lot of
Table 4.5: Bridge Expansion Joint Condition
Percent ofNumber of Bridges with Bridges with
Type of Expansion Joint Bridges Leaking Joints Leaking Joints
Poured joint sealer 258 186 72%Neoprene gland 1,982 176 9Other1 167 142 85Total with joints 2,407 504 21
Note: Only the condition of the expansion joint in the worst condition is noted. Not every j oint in abridge with one leaking joint is necessarily leaking.
Source: Program Evaluation Division analysis of data from the Minnesota Department of Trans porta-tion’s Bridge Maintenance Management System, September 1996.
1Includes three bridges that did not have "type of device" information but did have condition information.
Mn/DOT needsto flush debrisfrom bridgesmorefrequently.
PREVENTIVE MAINTENANCE 83
34 One respondent who initially indicated that his area does the right amount of reinstallation ofstrip neoprene glands said the latest inspections revealed a lot of the glands in his area were pull ingout of the joints and needed to be replaced. Two respondents who said their replacement ofneoprene glands is adequate indicated that they patch the glands a lot and if they had more money,they would do more replacement of the glands.

de-icing chemicals. This may explain why most managers felt their bridgeflushing activity was adequate even though it does not meet the once-a-yearstandard.35
We explored bridge flushing in the metropolitan area more closely because over athird of the bridges for which we had information are in the metropolitan area andthe use of de-icing chemicals might be more intense because of traffic volumes.In the Metropolitan Division, the Metro West bridge maintenance superintendentsaid he emphasizes flushing bridges inside the Interstate 494-694 loop because thehigh volume of traffic leads to more chemicals being used during the winter. TheMetro East superintendent said he thought his crews probably flushed morebridges outside the loop, except for a few structures inside the loop over theMississippi River that have a lot of exposed steel. As Table 4.7 shows, MetroWest does do more flushing of bridges inside the loop, though the frequency stilldoes not meet the recommended standard. Metro East did little bridge flushing,especially inside the loop. The six recorded flushings inside the Interstate494-694 loop on the east side occurred on three bridges, two over the MississippiRiver and one over Interstate 35E.
We asked Mn/DOT managers why some preventive maintenance activities onbridges were not performed enough, and their most common response was thatmaintenance workers were performing other maintenance activities. Since mostbridge preventive maintenance work is performed by Mn/DOT crews, it is notsurprising that this explanation would be more common for bridges than for
Table 4.6: Flushing Activity on State Trunk HighwayBridges, Calendar Years 1994-95
Number of CycleDistrict Bridges1 Flushes2 in Years3
1 - Duluth 333 62 10.72 - Bemidji 129 74 3.53 - Brainerd 221 324 1.44 - Detroit Lakes 147 102 2.96 - Rochester 392 329 2.47 - Mankato 221 200 2.28 - Willmar 137 222 1.2Metropolitan Division 944 318 5.9
Total 2,524 1,631 3.1
Source: Program Evaluation Division analysis of data from the Minnesota Department of Trans porta-tion’s Bridge Maintenance Management System.
1The number of bridges is the number we estimate were open in both 1994 and 1995.
2The number of flushes includes flushing of the entire bridge or any component of the bridge, a s re-corded in the Minnesota Department of Transportation’s Bridge Maintenance Management Syst em.Deck flushing by non-bridge crews is not reflected. Some bridges were flushed more than once in t hetwo-year period.
3The "cycle" refers to the years between flushes based on the activity for the two years 1994-19 95.
Bridges areseldom flushedin the EastMetro area andNortheasternMinnesota.
84 HIGHWAY SPENDING
35 Two people said that, in their opinions, some bridges with strip neoprene glands should beflushed more than once a year.

pavements. This reason was followed by inadequacy of funds and difficulty injustifying work on bridges in relatively good condition when others are in worsecondition.36
Additional AnalysisMn/DOT managers responding to our questionnaire gave a mixed report on theadequacy of preventive maintenance of Minnesota’s state trunk highway system.In our questionnaire, there were 127 instances in which managers indicated theywere doing the right amount of a particular preventive maintenance activity,compared with 126 instances in which they said they did too little. But we weresurprised to find that:
• In about half the cases where Mn/DOT managers reportedperforming the right amount of a preventive maintenance activity,they also indicated they would spend additional money on the activityif funds were available.
Table 4.7: Bridge Flushing Inside the Twin CitiesInterstate 494-694 Loop, Calendar Years 1994-95
Metro Metro TotalWest East Metro
Bridges within the 494-694 loop1 409 267 676Flushes within the 494-694 loop2 250 6 256Cycle within the loop3 3.3 89.0 5.3
Bridges outside the 494-694 loop 125 143 268Flushes outside the 494-694 loop 48 14 62Cycle outside the loop 5.2 20.4 8.6
Total bridges in area 534 410 944Total flushes in area 298 20 318Overall cycle 3.6 41.0 5.9
Source: Program Evaluation Division analysis of data from the Minnesota Department of Tran sporta-tion’s Bridge Maintenance Management System.
1The number of bridges is the number we estimate were open in both 1994 and 1995.
2The number of flushes includes flushing of the entire bridge or any component of the bridge as re-corded in the Minnesota Department of Transportation’s Bridge Maintenance Management Syst em.Deck flushing by non-bridge crews is not reflected. Some bridges were flushed more than once in t hetwo-year period.
3The ‘‘cycle’’ refers to the years between flushes based on the activity for the two years 1994-19 95.
In almost halfthe cases,Mn/DOTmanagersthought theyperformed toolittle preventivemaintenance.
PREVENTIVE MAINTENANCE 85
36 The question read: ‘‘For each activity for which you indicated your maintenance area ‘‘performstoo little,’’ why doesn’t your maintenance area use this treatment more? (Indicate all that apply.) 1.)We do not have adequate funds to perform this activity on all applicable bridges. 2.) It is hard tojustify performing this activity on bridges in relatively good condition when other bridges are inworse condition. 3.) Maintenance workers are performing other maintenance activities. 4.)Maintenance workers are working in other areas (e.g., performing constructions inspections). 5.)This activity is not a maintenance area, district, and/or agency priority. 6.) Traffic volumes prev entmore use of this treatment. 7.) Other 8.) Don’t know.’’

Respondents frequently explained that they were maintaining the system at acertain level and were doing a reasonable amount of preventive maintenancegiven their resource constraints, but they thought there were additionalopportunities to use preventive maintenance if funds were available. 37
Table 4.8 shows that most Mn/DOT managers responding to our questionnairethought that most of the activities we asked about are cost-effective. In addition,Mn/DOT’s 1996 performance report says that not performing preventivemaintenance causes increased costs in later years, which increases the cost of state
Table 4.8: Mn/DOT Managers’ Opinions on Cost-Effectiveness of Preventive Maintenance
In your professional opinion, is thisactivity cost-effective in your
maintenance area, or would it be if itwere used? (n=12)
Activity Yes No Don’t know
BITUMINOUS/BOCCrack fill 83% 0% 17%Crack seal 83 0 17Asphalt overlay (2" or less)1 92 0 0Fog seal 75 0 25Sand seal1 42 0 50Slurry seal 25 8 67Micro-surface 33 0 67Single-application chip seal1 67 0 25Multiple-application chip seal1 17 0 75
CONCRETEReseal joints 100% 0% 0%Retrofit load transfer 25 0 75Repair spalled joints 83 17 0Grind concrete2 67 17 17Install edge drains 92 0 8
BRIDGESCrack seal 92% 0% 8%Lubricate expansion bearings 92 0 8Flush winter residue 100 0 0Reinstall strip neoprene glands 100 0 0Spot paint2 83 8 8Clean/reseal bridge deck joints 100 0 0Install relief joints in concrete approaches 75 0 25Correct approach panel settlement 92 0 8Place drain extensions on floor drains 83 0 17
Source: Program Evaluation Division questionnaire sent to Minnesota Department of Transpo rtation dis-trict offices and the Metropolitan Division, 1996.
1Percents do not total 100 percent because one respondent did not answer.
2Percents do not total 100 percent because of rounding.
Generally,Mn/DOTmanagersbelievepreventivemaintenance iscost-effective.
86 HIGHWAY SPENDING
37 The question read: ‘‘If you had additional funds at your disposal, would you spend any on thisparticular activity? 1.) Yes 2.) No 3.) Don’t know.’’
road operations per lane mile. 38 However, when determining how to use theirbudgets, Mn/DOT districts and the Metropolitan Division try to address safety andcongestion problems, in addition to considering ways to prevent later maintenanceproblems. Also, sometimes work needs to be done on highways and bridges inpoor shape to maintain them until they can be programmed for reconstruction.Finally, the amount of preventive maintenance work performed sometimesdepends on the amount of money districts spend on other maintenance activities.For example, a harsh winter might deplete maintenance budgets because ofMn/DOT’s snow and ice removal responsibilities.
In sum, Mn/DOT managers generally believe that preventive maintenance iscost-effective and would do more of it, but preventive maintenance tends to be alower priority than more pressing problems. Perhaps this reflects the fact that thenegative impacts of deferring preventive maintenance are not noticeable in theshort-term. Managers often feel compelled to respond to more immediate publicconcerns, such as a pothole-filled or bumpy highway, before they invest instrategies that might prevent some of these problems from developing.
RECOMMENDATIONS
Data provided in Chapter 2 show that bridge and pavement quality have stayedrelatively constant over the past 10 years, indicating that Mn/DOT is keepingMinnesota’s state trunk highway system in the shape to which Minnesotans havebecome accustomed. However, we question whether Mn/DOT is maintaininghighways and bridges in the most cost-effective manner.
• In our opinion, Mn/DOT should take a more strategic approach topreventive maintenance on the state’s trunk highway system.
A more strategic approach to preventive maintenance might include:
(1) developing maintenance strategies that suggest when specific activitiesshould be performed in the life of a pavement or structure;
(2) continuously evaluating the cost-effectiveness of preventive maintenancetechniques, treatments, and strategies;
(3) setting aside funds for specific types of preventive maintenance; and
(4) at least initially, making centralized decisions about the most cost-effectivepreventive maintenance projects to pursue.
We think Mn/DOT should consider developing formal preventive maintenancestrategies. A 1994 survey of state, local, and Canadian transportation agenciesasked the agencies about their pavement preventive maintenance strategies. A
Preventivemaintenancetends to be alower prioritythan moreimmediateproblems.
Mn/DOTshould take amore strategicapproach topreventivemaintenance.
PREVENTIVE MAINTENANCE 87
38 Minnesota Department of Transportation, 1996 Performance Report (St. Paul, December 1996),110.

preventive maintenance strategy was defined as, ‘‘A plan for applying a series ofpreventive maintenance treatments over the life of the pavement. It is anorganized, systematic process to select and budget preventive maintenanceactivities over the life of the pavement so as to minimize life cycle costs. ’’39
Twenty-two states (including Minnesota) of 45 states responding to the surveysaid they did not have formal preventive maintenance strategies for pavements.States with strategies generally reported observing an increase in time beforepavement rehabilitation was required, a decrease in time and money spent ondemand maintenance activities, and an improvement in pavement smoothness.
According to a report published by the Federal Highway Administration, ‘‘Asingle preventive maintenance treatment will improve the quality of the pavementsurface and extend the pavement life. However, the true benefits of pavementpreventive maintenance are realized when there is a consistent schedule forperforming the preventive maintenance. ’’40 The report also said that preventivemaintenance is defined less by the activities that are used than by when thoseactivities are employed. ‘‘To be cost-effective, ’’ the authors wrote, ‘‘pavementpreventive maintenance treatments should be applied before most engineers, orproject decision makers would normally consider their use. ’’41 If Mn/DOTdeveloped strategies and made a long-term commitment to evaluate them, it couldconfirm that its strategies are cost-effective, or learn that it needs to modify them.
Mn/DOT already has invested in pavement and bridge management systems thatcould help develop and evaluate preventive maintenance strategies. Mn/DOTdeveloped its pavement management system (PMS) in the 1980s. In 1994, aMn/DOT ‘‘pathbuilding team ’’ on preventive maintenance recognized thepossibility of using the PMS to suggest and evaluate preventive maintenanceactivities.42 Prior to that time, the system had been used to suggest activities forhighways in relatively poor condition. The pathbuilding team developed decisioncriteria that suggest activities for pavements in relatively good condition. Thosecriteria are being included in a new version of the PMS. Mn/DOT’s bridgemanagement system (PONTIS) already has the ability to identify preventivemaintenance activities that would be appropriate at particular times. 43
Mn/DOTshould evaluateany newstrategies itdevelops.
88 HIGHWAY SPENDING
39 Geoffroy, Cost-Effective Preventive Pavement Maintenance , 42 (Appendix B).
40 John P. Zaniewksi and Michael S. Mamlouk, Preventive Maintenance Effectiveness-PreventiveMaintenance Treatments: Participant’s Handbook (Washington, D.C.: Federal HighwayAdministration, February 1996), 39.
41 Zaniewksi and Mamlouk, Preventive Maintenance Effectiveness-Preventive MaintenanceTreatments, 5.
42 Minnesota Department of Transportation, Pathbuilding Projects: Final Report (St. Paul,December 1994), 23-30.
43 Two issues affecting the usefulness of both the bridge and pavement management systems forevaluating preventive maintenance are (1) the thoroughness and reliability of data and (2)calculation of costs and benefits. As mentioned previously, we found some bridge flushing was notrecorded in the bridge maintenance management system, and the pavement management systemincludes only contract work and some asphalt overlays done by Mn/DOT crews. Overlays that areat least a half-mile long and are performed by Mn/DOT crews are included. Regarding calculationof costs and benefits, the benefits of preventive maintenance would probably be reflected by achange in highways’ and bridges’ rates of deterioration. For bridges, the benefits might extendbeyond the component directly being maintained. Also, neither system measures costs beyondagency costs of materials and labor.
We suggest the department consider setting aside funds for preventivemaintenance and, at least initially, exercise some central control over selecting theprojects. We concluded in the previous section that the amount of preventivemaintenance that Mn/DOT performs may depend on how much Mn/DOT spendson more obvious and immediate demands. If Mn/DOT set aside funds forpreventive maintenance, which is currently funded by both the construction andoperations budgets, perhaps the districts and the Metropolitan Division would beless likely to defer preventive maintenance when other transportation concernsarise. As investment in preventive maintenance is increased, over time it wouldbe expected that the amount of rehabilitation work and demand maintenanceactivities, such as patching potholes, would decrease somewhat. Initial centraloffice oversight in selecting projects might make Mn/DOT better able to evaluatethe cost-effectiveness of preventive maintenance treatments and strategies byestablishing and using uniform criteria to determine the types and timing ofpreventive maintenance to be used.
For example, comments from Mn/DOT managers suggest that a more systematicapproach to maintaining concrete joints that are new and/or in good conditionmight be beneficial. If earlier and more frequent attention to concrete joints werepart of a formal maintenance strategy for concrete pavements, and if funds wereset aside to perform the scheduled activities, the result might be a reduction inoverall spending by catching problems before major concrete repairs are required.Using the pavement management system to evaluate the strategy for concretepreventive maintenance would inform the department if the strategy it adoptedwas having the anticipated effects.
If preventive maintenance is as cost-effective as Mn/DOT managers and theresearch literature suggest, it is too important for Mn/DOT to deal withinconsistently. We think Mn/DOT should develop a statewide strategy andcarefully evaluate its results over time.
Preventivemaintenance istoo importantto handleinconsistently.
PREVENTIVE MAINTENANCE 89

Lane and Shoulder WidthStandardsCHAPTER 5
Recent reports have concluded that Minnesota is likely to face tough fiscaldecisions in the future as projected revenues fall short of estimatedspending.1 In its 1994 report, Minnesota Planning recommended a
number of ways in which future state and local government budget gaps could beaddressed. One recommendation was to reduce right-of-way, lane width, andother standards for highways, particularly lower volume roads. MinnesotaPlanning estimated that reducing standards for newly constructed or reconstructedroads could save between $26 million and $265 million on county state-aidhighways alone.
In 1995, the Minnesota Department of Transportation (Mn/DOT) created aGeometric Design Standards Task Force to review department standards for lowvolume rural state trunk highways and state-aid highways in Minnesota. The TaskForce focused on lane and shoulder width standards for rural highways servingfewer than 2,000 vehicles per day. In December 1996, the Task Force finalized itsrecommendations, but its report has not yet been adopted by the Commissioner ofMn/DOT. Changes in administrative rules would be needed in order to adopt therecommendations affecting state-aid highways.
This chapter examines the work of Mn/DOT’s Task Force and, like the TaskForce, focuses primarily on lane and shoulder width standards for low volume,two-lane rural roads on the State Trunk Highway (STH) System and the CountyState-Aid Highway (CSAH) System. In this chapter, we address the followingquestions:
• How do Minnesota’s current and proposed lane and shoulder widthstandards compare with nationally recommended standards, as well asstandards in other midwestern states?
• How does the lane width of Minnesota’s roads compare with lanewidths in other states?
1 Minnesota Planning, Within Our Means: Tough Choices for Government Spending (St. Paul,January 1995); John Brandl and Vin Weber, An Agenda for Reform: Competition, Community,Concentration--A Report to Governor Arne H. Carlson (St. Paul, November 1995); and Office ofthe Legislative Auditor, Trends in State and Local Government Spending (St. Paul, February 1996).

• What impact would the recommendations made by Mn/DOT’sGeometric Design Standards Task Force have on the State TrunkHighway and County State-Aid Highway systems?
• Has the Task Force adequately considered the benefits and costs ofalternative standards, as well as other important factors?
RURAL HIGHWAYS
Minnesota has approximately 10,800 miles of rural trunk highways and about28,800 miles of rural county state-aid highways. Roughly half of the rural trunkhighways and more than 90 percent of the rural county state-aid highways werethe subject of the Task Force’s study. Specifically, 5,600 miles of trunk highwaysand 27,700 miles of county state-aid highways carry fewer than 2,000 vehicles perday.
Most of these low volume rural highways are paved. Only about 25 miles, or lessthan 1 percent, of the rural trunk highways are unpaved, while about 6,200 miles,or 22 percent, of the rural county state-aid highways are gravel roads. Theseunpaved county roads are very lightly traveled. Two-thirds of them carry fewerthan 150 vehicles per day, and less than 3 percent serve 400 or more vehicles perday.
Table 5.1 shows that the vast majority of rural trunk highways have 12-foot lanes.Only about 5 percent have 11-foot lanes and 1 percent have 10-foot lanes. Incontrast, about one-fourth of the paved rural county state-aid highways have laneswhich are less than 12 feet wide. As Table 5.2 shows, most of these have 11-footlanes.
Table 5.1: Miles of Rural State Trunk Highways byLane Width and Average Daily Traffic, 1996
Lane Width PercentageAverage Less ThanDaily Traffic 10 Feet 11 Feet 12 Feet 12 Feet0-749 52a 162 1,599b 12%750-1,499 28 124 2,535 61,500-1,999 6 26 1,100 32,000 or More 50 221 4,928 5Totalsc 137 532 10,162 6%Percentage 1% 5% 94%
Source: Minnesota Department of Transportation.
aIncludes 14 miles of gravel roads.
bIncludes 11 miles of gravel roads.
cSome totals do not add due to rounding.
Most ruraltrunk highwayshave 12-footlanes.
92 HIGHWAY SPENDING

CURRENT AND PROPOSED STANDARDS
Currently, Mn/DOT has separate standards for trunk highways and state-aidhighways. For the State Trunk Highway System, Mn/DOT has one set of designstandards which applies to the construction or reconstruction of roads and anotherwhich applies to reconditioning or resurfacing projects. Similarly, for the CountyState-Aid Highway System, Mn/DOT has two different sets of standards.
Construction and Reconstruction StandardsTable 5.3 shows the current construction and reconstruction standards for lane andshoulder widths on the STH and CSAH systems. 2 Since the Task Force focusedon highways carrying fewer than 2,000 vehicles per day, the table only shows thelane and shoulder width standards for those roads.
Generally, Mn/DOT’s current standards call for newly constructed orreconstructed roads to have paved lane widths of 12 feet. The required width ofeach shoulder varies by average daily traffic and, for trunk highways, by thefunctional classification of roads. On paved roads, the minimum shoulder widthcurrently required is 4 feet. Thus, Mn/DOT’s current standards require that pavedtrunk highways and state-aid highways have at least a 32-foot top--namely, 2 lanes
Table 5.2: Miles of Rural Paved County State-AidHighways by Lane Width and Projected Average DailyTraffic, 1996
Lane Width Percentage
Projected Average 10 Feet Less ThanDaily Traffica or Less 11 Feet 12 Feet 12 Feet0-399 54 1,714 5,731 23%400-749 89 1,793 4,584 29750-999 18 640 1,697 281,000-1,499 23 526 1,719 241,500-1,999 22 220 911 272,000 or More 74 256 2,498 12Totalsb 280 5,148 17,140 24%Percentage 1% 23% 76%
Source: Minnesota Department of Transportation.
aBased on projected traffic levels in 20 years.
bSome totals do not add due to rounding.
Three-fourthsof the ruralcountystate-aidhighways have12-foot lanes.
LANE AND SHOULDER WIDTH STANDARDS 93
2 Mn/DOT has other construction and reconstruction standards besides lane and shoulder widths.Both the Task Force and this report focus on lane and shoulder widths because they are veryimportant and have been studied extensively in the national literature. More information is availab leon the safety implications of lane and shoulder width configurations than is available on theimplications of other types of construction standards.

of at least 12 feet each and 2 shoulders of at least 4 feet each. 3 The only exceptionto this general rule is CSAH roads carrying fewer than 150 vehicles per day. Thislatter group of roads are gravel roads and are only required to have lane widths of11 feet. Shoulders narrower than 4 feet are also permitted on these gravel roads.
Also included in Table 5.3 are the Task Force’s proposed new construction andreconstruction standards. The Task Force has recommended reductions inminimum shoulder widths for some types of roads at certain traffic levels but hasrecommended no changes in minimum lane widths. Except for gravel roads, theproposed standards would still require roads to have at least 12-foot lanes and4-foot shoulders or, in other words, a 32-foot top.
Table 5.4 shows that:
• The proposed changes in construction and reconstruction standardswould ultimately affect 12 percent of rural trunk highways and 5percent of rural county state-aid highways.
Currently, 3,460 miles of trunk highways and about 12,250 miles of paved countystate-aid highways do not meet construction and reconstruction standards for laneand shoulder widths. 4 The proposed standards would reduce the number ofsubstandard miles to 2,215 miles of trunk highways and 10,800 miles of pavedcounty state-aid highways. In other words, 12 percent of the STH system and 5percent of the CSAH system are affected by the proposed change in standards.The impact of the proposal is primarily on roads which have substandard shoulder
Table 5.3: Current and Proposed Construction/ReconstructionStandards for Low Volume Rural State Trunk Highways and CountyState-Aid Highways, 1996
Lane Width (in feet) Shoulder Width (in feet)
State Trunk Highways (Current) County State Trunk Highways (Current) b CountyState-Aid State-Aid
Projected Principal Minor Highways Proposed Principal Minor Highways ProposedDaily Traffic Arterials Arterials Collectors (Current) Standards Arterials Arterials Collectors (Current) Standards
0-49 12 12 12 11a 11a 8 6 4 1a 1a
50-149 12 12 12 11a 11a 8 6 4 3a 3a
150-749 12 12 12 12 12 8 6 4 4 4750-1,499 12 12 12 12 12 8 6 6 6 41,500-2,000 12 12 12 12 12 10 8 6 8 6
Source: Minnesota Department of Transportation.
aUnpaved roads.
bOn trunk highways, Mn/DOT generally requires at least 2 feet of the shoulder width to be paved, except on collector roads with projecteddaily traffic less than 750.
A task force isproposingchanges in laneand shoulderwidthstandards forlow volumerural highways.
94 HIGHWAY SPENDING
3 Current standards for state trunk highways also require that 2 or more feet of each shoulder bepaved, except on collector or local roads carrying fewer than 750 vehicles per day. CSAH standardsdo not require paving of any portion of the shoulders.
4 These estimates are based on combined lane and shoulder widths and use current, rather thanprojected, traffic levels.
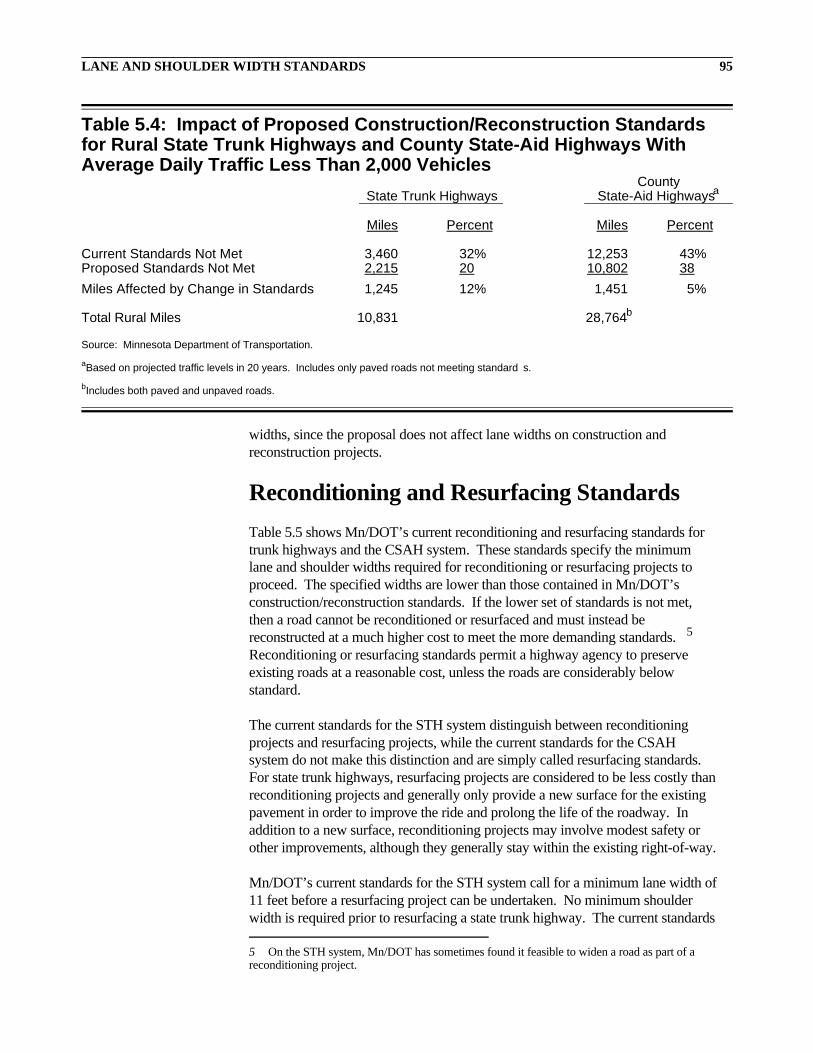
widths, since the proposal does not affect lane widths on construction andreconstruction projects.
Reconditioning and Resurfacing StandardsTable 5.5 shows Mn/DOT’s current reconditioning and resurfacing standards fortrunk highways and the CSAH system. These standards specify the minimumlane and shoulder widths required for reconditioning or resurfacing projects toproceed. The specified widths are lower than those contained in Mn/DOT’sconstruction/reconstruction standards. If the lower set of standards is not met,then a road cannot be reconditioned or resurfaced and must instead bereconstructed at a much higher cost to meet the more demanding standards. 5
Reconditioning or resurfacing standards permit a highway agency to preserveexisting roads at a reasonable cost, unless the roads are considerably belowstandard.
The current standards for the STH system distinguish between reconditioningprojects and resurfacing projects, while the current standards for the CSAHsystem do not make this distinction and are simply called resurfacing standards.For state trunk highways, resurfacing projects are considered to be less costly thanreconditioning projects and generally only provide a new surface for the existingpavement in order to improve the ride and prolong the life of the roadway. Inaddition to a new surface, reconditioning projects may involve modest safety orother improvements, although they generally stay within the existing right-of-way.
Mn/DOT’s current standards for the STH system call for a minimum lane width of11 feet before a resurfacing project can be undertaken. No minimum shoulderwidth is required prior to resurfacing a state trunk highway. The current standards
Table 5.4: Impact of Proposed Construction/Reconstruction Standardsfor Rural State Trunk Highways and County State-Aid Highways WithAverage Daily Traffic Less Than 2,000 Vehicles
State Trunk HighwaysCounty
State-Aid Highwaysa
Miles Percent Miles Percent
Current Standards Not Met 3,460 32% 12,253 43%Proposed Standards Not Met 2,215 20 10,802 38Miles Affected by Change in Standards 1,245 12% 1,451 5%
Total Rural Miles 10,831 28,764b
Source: Minnesota Department of Transportation.
aBased on projected traffic levels in 20 years. Includes only paved roads not meeting standard s.
bIncludes both paved and unpaved roads.
LANE AND SHOULDER WIDTH STANDARDS 95
5 On the STH system, Mn/DOT has sometimes found it feasible to widen a road as part of areconditioning project.

96 HIGHWAY SPENDING

for reconditioning work on the STH system are greater. Reconditioning a trunkhighway can only be done if a road’s lanes already are 12 feet wide or will bewidened to 12 feet during the project. In addition, the combined lane and shoulderwidth of a rural low volume trunk highway must be between 14 and 18 feet,depending on projected daily traffic and the road’s functional class.
The current CSAH resurfacing standards are more similar to STH reconditioningstandards than to STH resurfacing standards. 6 Current CSAH standards forresurfacing projects call for 11-foot lanes for existing traffic volumes below 1,000vehicles per day and 12-foot lanes for higher traffic volumes. Combined lane andshoulder widths must be 13 feet or more at daily traffic volumes under 750 and 15feet or more at higher traffic volumes.
The proposed ‘‘reconditioning’’ standards for both the STH and the CSAHsystems do not distinguish between reconditioning and resurfacing like the oldSTH standards. The proposal lumps both types of work together and definesreconditioning as work which extends the life of the roadway by overlaying theexisting pavement or structure and may include modest safety or operationalimprovements but little or no additional right-of-way.
As Table 5.5 shows, the proposed standards would generally reduce the minimumlane width required for reconditioning or resurfacing work, but may lower or raisethe combined lane and shoulder width required. The proposed standards raise thecombined lane and shoulder width required on most STH resurfacing projects andlower the combined width required on most STH reconditioning projects and allCSAH resurfacing projects.
Table 5.6 shows that the proposed standards will loosen standards for about 1,200miles, or 4 percent of the rural county state-aid highways. For resurfacingprojects, the proposed standards will have virtually no impact on rural trunkhighways.7 For more extensive reconditioning projects, the proposed standardswould be less restrictive for about 1,500 miles of trunk highways, or 14 percent ofall rural trunk highways.
COMPARISON WITH OTHER STATES
In this section, we compare Minnesota’s proposed standards with nationallyrecommended standards and those of other states. In addition, we compare lanewidths in Minnesota with those in other states. In general, we find thatMinnesota’s proposed construction and reconstruction standards are more
LANE AND SHOULDER WIDTH STANDARDS 97
6 Current STH reconditioning and CSAH resurfacing standards for shoulder widths are hard tocompare because the trunk highway reconditioning standards vary by a road’s functional class.However, since 94 percent of the county state-aid highways are collectors or local roads, it isreasonable to compare the CSAH standards to the trunk highway reconditioning standards forcollectors.
7 For resurfacing projects, the proposal would loosen lane width standards for a small number ofrural trunk highways with 10-foot lanes but raise combined lane and shoulder width standards forother trunk highways.

demanding than nationally recommended standards and those of most of themidwestern states which Mn/DOT recently contacted. In addition, data from theFederal Highway Administration show that Minnesota has a higher percentage ofroads with 12-foot lanes than the national average and most midwestern states.
Nationally Recommended StandardsAt the national level, there are two sets of standards which have beenrecommended for construction and reconstruction projects on paved ruralhighways carrying fewer than 2,000 vehicles per day. 8 One set of standards isrecommended by the American Association of State Highway and TransportationOfficials (AASHTO). The other set was recommended in a recent research reportprepared for the National Cooperative Highway Research Program (NCHRP) bythe Transportation Research Board and the National Research Council. 9 Therecommendations in the latter report were based on the results of extensiveresearch which had previously been conducted on rural low volume highwaysacross the United States. Accident data from a number of states includingMinnesota were examined in this report.
As shown in Table 5.7:
• Minnesota’s proposed construction and reconstruction standardsgenerally require wider lanes than nationally recommended standards.
Both the current and proposed Mn/DOT standards for construction andreconstruction projects require that paved roads have lanes at least 12 feet wide.The NCHRP report recommends 11-foot lanes for paved roads carrying fewer
Table 5.6: Impact of Proposed Reconditioning Standards for Rural StateTrunk Highways and County State-Aid Highways
State Trunk HighwaysaCounty State-Aid
Highways
Reconditioning Resurfacing
Miles Percentage Miles Percentage Miles Percentage
Current Standards Not Met 1,653 15% 137 1% 1,713 6%Proposed Standards Not Met 105 to 146 1 105 to 146 1 502 2
Affected Miles 1,507 to 1,548 14% -9 to 32 0% 1,211 4%
Total Rural Miles 10,831 28,764
Source: Minnesota Department of Transportation and analysis by the Office of the Legisla tive Auditor.
aIncludes all rural trunk highways, including those with average daily traffic of 2,000 or mo re vehicles per day.
The proposedstandardsgenerallyrequire widerlanes thannationallyrecommendedstandards.
98 HIGHWAY SPENDING
8 We are not aware of any nationally recommended standards for reconditioning or resurfacingprojects.
9 Zegeer C., Stewart R., Council F., and Neumann T. for the Transportation Research Board andthe National Research Council, National Cooperative Highway Research Program Report 362(Washington, D.C., 1994).

than 2,000 vehicles per day. AASHTO standards call for lanes at least 11 feetwide for traffic levels under 1,500 vehicles per day and at least 12 feet wide fortraffic levels between 1,500 and 2,000 vehicles per day.
Minnesota’s proposed standards for shoulder widths on construction andreconstruction projects are slightly more demanding than the AASHTO andNCHRP standards. For the most part, the proposed standards for paved roads arethe same as the nationally recommended standards. For traffic levels between 150and 399 vehicles per day, however, the proposed Minnesota standards wouldrequire 4-foot shoulders, while the nationally recommended standards call for2-foot shoulders.
Table 5.8 shows that:
• Implementing the NCHRP standards, particularly for county state-aidhighways, could potentially lower future construction andreconstruction costs much more than the Task Force’s proposedstandards.
The NCHRP standards would generally require 11-foot lanes to be built, while theproposed standards would require 12-foot lanes. The Task Force’s proposedstandards would affect only 5 percent of the CSAH system. In contrast,implementing the NCHRP standards would bring 28 percent of the CSAH systeminto compliance with standards. In addition, the NCHRP standards would reducethe costs needed to reconstruct and pave the more than 2,000 miles of gravel roadswhich have projected traffic volumes of 150 or more vehicles per day and thusrequire paving according to Mn/DOT standards. 10 The difference between the
Table 5.7: Proposed Minnesota and Nationally RecommendedConstruction/Reconstruction Standards for Low Volume Rural Highways,1996
Lane Width (in Feet) Shoulder Width (in Feet)
Projected Minnesota MinnesotaDaily Traffic (Proposed) AASHTOa NCHRPb (Proposed) AASHTO NCHRP0-49 11c 11 11 1c 2 250-149 11c 11 11 3c 2 2150-399 12 11 11 4 2 2400-1,499 12 11 11 4 4 41,500-2,000 12 12 11 6 6 6
Source: Minnesota Department of Transportation.
aAmerican Association of State Highway and Transportation Officials.
bNational Cooperative Highway Research Program.
cUnpaved Roads.
LANE AND SHOULDER WIDTH STANDARDS 99
10 A county may elect to reconstruct a road projected to carry 150 or more vehicles per day as agravel road. However, the road must be built wide enough to meet the width standards applicable toits projected traffic level.

proposed standards and NCHRP standards potentially affects more than 8,500miles on the CSAH system.
Under the current formula for allocating state aid to counties, half of the state aidpaid to counties is for construction needs. If a road has not been reconstructed inthe last 25 years, it is eligible for construction needs aid. The amount of aid aroad receives depends on the estimated reconstruction costs, which in turn dependon the standards set for the CSAH system. Implementing the NCHRP standardswould redirect a portion of the funds away from certain low volume rural roadsand permit counties to use state aid to more frequently reconstruct or resurfaceCSAH highways. 11 The state aid formula could also be modified to permit morefunds to be used for maintenance purposes.
The impact on trunk highways would be less significant. The proposed standardswould reduce the miles of state trunk highways below lane and shoulder widthstandards from 3,460 to 2,215 miles. In contrast, implementing the NCHRPstandards would reduce the miles of substandard trunk highways to 1,628 miles.The difference in miles affected by the proposed standards and the NCHRPstandards is less than 600 miles of trunk highways. It is not known how many ofthese miles of trunk highways, if any, are likely to be reconstructed or widened infuture years.
Table 5.8: Impact of Nationally Recommended Construction/Reconstruction Standards for Paved Low Volume Rural Highways onMinnesota’s Trunk Highways and County State-Aid Highways
State Trunk HighwaysCounty
State-Aid Highwaysa
Miles Percent Miles Percent
Current Minnesota Standards Not Met 3,460 32% 11,814 41%Nationally Recommended (NCHRP) Standards Not Met
1,628 15 3,645 13
Difference Between NCHRP Recommended Standards and Current Minnesota Standards
1,832 17% 8,169 28%
Total Rural Miles 10,831 28,764b
Source: Minnesota Department of Transportation.
aBased on current traffic levels. Includes only paved roads not meeting standards.
bIncludes both paved and unpaved roads.
Nationallyrecommendedstandardswould imposeless stringentstandards on8,500 miles ofcountystate-aidhighways.
100 HIGHWAY SPENDING
11 We estimate that it takes about 60 to 70 years from the time of the last reconstruction forcounties to receive sufficient funds to reconstruct a road again. This estimate does not include anallowance for the resurfacing needs between reconstructions.

Standards of Other Midwestern StatesAt our request, Mn/DOT gathered information on lane and shoulder widthstandards for several midwestern states, including Iowa, Michigan, South Dakota,and Wisconsin. Three of these four states permit certain low volume rural roadsto have 11-foot lanes. Wisconsin permits 11-foot lanes on state and county trunkhighways which are collector or local roads and have a projected traffic volumeunder 1,500 vehicles per day. Iowa’s standards call for 11-foot lanes on rural localroads, collector highways, and some minor arterials. The cutoff point between11-foot lanes and 12-foot lanes varies from a projected traffic level of 1,000vehicles per day for certain minor arterials and major collectors to 3,000 for localroads. Michigan’s standards say that 12-foot lanes are desirable but that 11-footlanes are acceptable for 2-lane rural highways with projected traffic volumesunder 750 vehicles per day. Only the South Dakota Department of Transportationreported to Mn/DOT that its standards call for a minimum lane width of 12 feet onall state highways. South Dakota’s standards were, however, ‘‘very preliminary ’’and had not yet been adopted by the department.
Comparison of Lane WidthsHaving higher standards than other states or than nationally recommendedstandards might make sense if Minnesota’s roads were narrower than other statesand the higher standards served to help Minnesota catch up with other states. 12
According to data from the Federal Highway Administration, however:
• Minnesota already has a higher percentage of highways with 12-footlanes than the national average and surrounding states.
Table 5.9 shows that about 74 percent of the rural roads in Minnesota have lanewidths of 12 feet or more. 13 This compares with a national average of 43 percentand figures ranging from 31 percent to 64 percent for other midwestern states.South Dakota and North Dakota are the only other midwestern states which havelane widths of 12 feet or greater on more than 50 percent of their rural roads.However, many of the rural roads with 12-foot lanes in these two states may begravel roads. While only 17 percent of Minnesota’s rural roads (excluding localroads) are gravel, the share of unpaved roads is 42 percent in South Dakota and 47percent in North Dakota. 14
Table 5.10 shows that:
• The difference in lane widths between Minnesota and other states ismost significant for rural collector roads.
Minnesota’srural roadshave widerlanes than theaverage formanymidwesternstates and thenation as awhole.
LANE AND SHOULDER WIDTH STANDARDS 101
12 Having higher standards might also make sense if those standards were based on factors uniqueto Minnesota. However, under any of these circumstances having higher standards only makessense if they are justified based on an analysis of benefits and costs.
13 Available data include roads of all functional classes except local roads. It is not possible tocompare lane widths across states for just state or county roads.
14 Excluding local roads, 16 percent of rural roads across the nation are gravel.

In Minnesota, 69 percent of rural collector roads have lane widths of 12 feet ormore. Nationally, only 36 percent of rural major collectors and 20 percent ofminor collectors have lane widths of 12 feet or more. There are also somedifferences in lane widths on minor arterials. About 89 percent of Minnesota’srural minor arterials have lane widths of 12 feet or more compared with 68percent nationally. There is very little difference between Minnesota and otherstates, however, in lane widths on rural interstates or principal arterials.
Table 5.10: Lane Width of Existing Rural Roads by Functional Class,Minnesota and the United States, 1994
Percentage of Roads with Various Lane Widthsa
Less than Over9 Feet 9 Feet 10 Feet 11 Feet 12 Feet 12 Feet
Interstate MN 0% 0% 0% 0% 100% 0%US 0 0 0 0 97 3
Other Principal MN 0 0 4 7 84 5Arterials US 0 0 2 10 83 4
Minor Arterials MN 0 0 2 8 86 3US 0 2 12 19 63 5
Major Collector MN 0 1 5 26 68 1US 3 9 29 24 33 3
Minor Collector MN 1 2 5 23 62 7US 12 21 31 16 17 3
Source: Federal Highway Administration.
aData on minor collectors are from 1992.
Table 5.9: Lane Width of Existing Rural Roads, Minnesota and OtherStates, 1994
Percentage of Roads with Various Lane Widthsa
Less Than Over9 Feet 9 Feet 10 Feet 11 Feet 12 Feet 12 Feet
Minnesota 0% 1% 4% 20% 71% 3%Wisconsin 0 0 17 49 34 0Michigan 0 5 29 35 31 0Iowa 1 1 5 43 35 14Illinois 5 11 21 26 34 4North Dakota 4 5 12 15 63 1South Dakota 5 8 10 15 60 2
National Average 5% 10% 24% 19% 40% 3%
Source: Federal Highway Administration.aExcludes local roads.
102 HIGHWAY SPENDING

DISCUSSION OF TASK FORCE’SRECOMMENDATIONS
The Geometric Design Standards Task Force has recommended new lane andshoulder width standards for both construction and reconstruction projects andreconditioning or resurfacing work on trunk highways and state-aid highways.These standards would apply to rural two-lane highways serving fewer than 2,000vehicles per day. In addition, the Task Force has recommended the state-aidvariance process be improved by increasing the use of administrative variancesfor exceptions to standards and reducing the time required to process variancerequests.
StrengthsWe think that:
• The Task Force has made reasonable recommendations for changingthe current reconditioning and resurfacing standards and hascorrectly recognized the need for greater flexibility and timeliness inthe state-aid variance process.
The proposed reconditioning standards provide needed flexibility for highwayauthorities at a time when fiscal realities place a greater emphasis on preservingexisting roads than on expanding existing roads. The proposed standardsparticularly provide additional flexibility for county state-aid highways. Theseroads have been subject to a much more stringent standard than trunk highwaysfor resurfacing projects. 15
Changes in the variance process are also needed since standards cannot fullyanticipate all possible circumstances. Ideally, decisions about a particular projectshould take into account the project’s unique circumstances and involve a carefulanalysis of advantages and disadvantages of various options. Standards which arewell suited for one set of circumstances may be ill suited for another. A speedybut fair process is needed so that variances can be granted in a timely manner inthose circumstances in which they are warranted. It remains to be seen exactlywhat specific changes in the variance process Mn/DOT will choose to implement.
In addition, we feel that the Task Force has suggested some reasonableimprovements to the existing construction and reconstruction standards forshoulder width. The proposal sets the cutoff point between 4-foot shoulders and6-foot shoulders at 1,500 vehicles per day and thus reduces minimum shoulderwidths for certain highways. This cutoff point was established using benefit-costanalysis with actual cost data from county state-aid highways. The proposal,however, still deviates from nationally recommended standards. For roadscarrying 150 to 399 vehicles per day, the proposal calls for shoulders to be at least
Some of theTask Force’srecommenda-tions deservesupport.
LANE AND SHOULDER WIDTH STANDARDS 103
15 Current state-aid practices, however, partially penalize counties for resurfacing highways withstate-aid funds received because of construction needs.

4 feet wide, while AASHTO and NCHRP standards call for shoulders to be 2 feetwide. The Task Force and Mn/DOT need to examine more carefully the rationalefor this difference, including whether the accident reduction benefits of 4-footshoulders outweigh the additional costs.
WeaknessesWe do not believe, however, that the Task Force has adequately considered theneed for 12-foot lanes, rather than 11-foot lanes, on low-volume rural roads. Theproposed standards still call for wider lanes than recommended by nationalorganizations or studies. In particular, we note that:
• The proposed construction and reconstruction standards for lanewidth are not justified by Mn/DOT’s own benefit-cost analysis.
As part of the Task Force’s study, Mn/DOT staff from the Office of InvestmentManagement prepared an analysis which examined the benefits and costs of fivedifferent lane and shoulder width options at various traffic levels. 16 The analysismeasured the benefits of wider lanes or shoulders in terms of the value of reducedfatality, injury, and property-damage-only accidents. It used cost estimates forvarious lane and shoulder width options, which had been prepared by Mn/DOT’sEngineering Cost Data and Estimating Unit. Estimates, rather than actual costdata, were used, because actual data were not available for several of the options.The only paved trunk highways or county state-aid highways which have beenbuilt in recent years have 12-foot lanes and at least 4-foot shoulders.
Mn/DOT’s analysis showed that:
• The 11-foot lane, 2-foot shoulder option was the most cost-effectiveoption at traffic volumes less than about 950 vehicles per day.17
For some of the options examined, the 11-foot lane, 2-foot shoulder option wascost-effective at traffic volumes up to 1,300 vehicles per day. In addition, if a 7percent discount rate was used instead of 4.5 percent, the 11-foot lane, 2-footshoulder option was judged to be more cost-effective than all the other options attraffic volumes less than 1,200 and than some of the options at traffic volumes upto 1,600 vehicles per day. 18
Figure 5.1 illustrates the relationship between traffic volumes and benefit-costratios for two of the options: 11-foot lanes, 4-foot shoulders and 12-foot lanes,
But therecommendedlane widths forconstructionprojects are notsupported bynational studiesor Mn/DOT’sownbenefit-costanalysis.
104 HIGHWAY SPENDING
16 Five options were included in the analysis: 11-foot lanes and 2-foot shoulders, 11-foot lanes and4-foot shoulders, 12-foot lanes and 3-foot shoulders, 12-foot lanes and 4-foot shoulders, and 12-foo tlanes and 6-foot shoulders.
17 By ‘‘cost-effective’’ we mean that the additional costs of any other option relative to the costs ofthe 11-foot lane, 2-foot shoulder option exceeded the difference in benefits, as measured by theestimated reduction in accidents.
18 The discount rate is the interest rate which is used to convert future benefits or costs to a presen tvalue. A discount rate is used because it is generally assumed that people value $1 in benefitsreceived today more than $1 in benefits received at some future date. Mn/DOT generally uses a 4.5percent discount rate, while the Federal Highway Administration uses a 7 percent discount rate.

4-foot shoulders. At 100 vehicles per day, the benefit-cost ratio is 0.12. In otherwords, the costs of building 12-foot lanes instead of 11-foot lanes are about 8 or 9times the benefits. At 500 vehicles per day, the benefit-cost ratio is 0.49, and thecosts of 12-foot lanes are about twice the benefits. At traffic levels between 1,100and 1,200 vehicles per day, the benefits of 12-foot lanes begin to equal the costs,and they exceed the costs at higher traffic levels.
There is reason to believe, however, that the cost estimates used in Mn/DOT’sanalysis understate the real difference in costs per mile between the variousoptions. Table 5.11 shows the costs per mile of reconstructing a highway tovarious lane and shoulder width combinations, as estimated by Mn/DOT in the
Costs exceedbenefits
Benefitsexceed costs
20001500500 1000
Average Daily Traffic
2.0
1.0
0
Benefit-CostRatio
Figure 5.1: Benefit-Cost Ratio for Constructing12-Foot Lanes Instead of 11-Foot Lanes by AverageDaily Traffic
Source: Minnesota Department of Transportation.
Table 5.11: Costs Per Mile for Reconstruction of aRural Two-Lane Highway
Options Cost Per Milea
Lane WidthShoulder
WidthMn/DOT
Estimates
Actual Costs forCounty State-Aid
Highways
11 2 $86,606 NA 11 4 101,323 NA 12 3 103,924 NA 12 4 109,601 $192,77512 6 112,998 204,731
NA = Not available.
Source: Minnesota Department of Transportation.
aMn/DOT’s estimates include the paving of at least two feet of each shoulder, while the actual costs forcounty state-aid highways do not include paved shoulders.
LANE AND SHOULDER WIDTH STANDARDS 105
analysis mentioned above as well as in another analysis. In the second analysis,Mn/DOT used actual construction cost data for county state-aid highwaysconstructed with 12-foot lanes and either 4-foot or 6-foot shoulders. The actualcost per mile for county state-aid highways was significantly higher than theestimates per mile prepared by Mn/DOT’s estimators. In addition, the differencein actual cost per mile between the 12-foot lane, 4-foot shoulder option and the12-foot lane, 6-foot shoulder option was much higher ($11,956) than thedifference when the cost estimates are used ($3,397).
Assuming Mn/DOT’s cost estimates understated the cost differences among thevarious options, then 11-foot lanes would be cost-effective at average daily trafficlevels higher than Mn/DOT staff originally concluded. In fact:
• Judging from the actual cost data for county state-aid highways,11-foot lanes would probably be cost-effective at traffic volumes up to1,500 or possibly 2,000 vehicles per day.
This result is not surprising, since nationally recommended standards call for11-foot lanes at traffic volumes in that range and for 12-foot lanes at trafficvolumes exceeding 1,500 or 2,000 vehicles per day.
The Task Force indicated that there may be situations in which 11-foot lanes areacceptable but recommended standards calling for 12-foot lanes on all pavedroads. As support for its recommendation, the Task Force cited Minnesota’s pastsafety record, past road construction practices, public expectations, climate, thesize of trucks and other large vehicles, and shoulder drop-off problems. However,there are no data which support the Task Force’s conclusion that the publicexpects 12-foot lanes and certainly no data which suggest that the public is willingto pay the additional costs of wider lanes on lightly traveled roads. 19 Climate, thesize of vehicles, and shoulder drop-off problems are potential problems which arefaced by other states besides Minnesota. 20 Most other states find 11-foot lanesadequate in certain situations, and three of the four nearby states which sent theirstandards to Mn/DOT permit 11-foot lanes for low volume roads.
Minnesota’s accident and fatality rates have generally been below the nationalaverage, but it is unlikely that Minnesota’s wider lanes explain much of thedifference between state and national rates. Driving under the influence ofalcohol or drugs, speeding, and inattentive or reckless driving are among the mostsignificant factors causing accidents. The failure to use selt belts also increasesthe severity of injuries in accidents. The benefit-cost analysis done by Mn/DOTwas based on nationally respected research which estimated the relationship
The Task Forcecited factorsfor deviatingfrom thebenefit-costanalysis but didnot fairlyevaluate thosefactors.
106 HIGHWAY SPENDING
19 The Task Force cited a national survey in which highway users rated their satisfaction with lanewidths higher than their satisfaction with other safety items. As we have seen, the share of laneswhich are less than 12-feet wide is much larger nationally (57 percent) than in Minnesota (26percent). Perhaps the Task Force should have concluded that national highway users are satisfiedwith having more than half of their roads narrower than 12 feet and that higher standards,particularly for low volume roads, are an unnecessary cost.
20 Mn/DOT needs to do a more comprehensive analysis of future maintenance and rehabilitationcosts under various lane and shoulder width options. The Task Force cited the shoulder drop-offproblem for 11-foot lanes but did not mention the additional pavement maintenance costs whichwould be incurred with 12-foot lanes.

between the number of accidents and lane and shoulder width. At a traffic level of500 vehicles per day, research indicates that a highway with 12-foot lanes and4-foot shoulders would have only one fewer accident per year than a highwaywith 11-foot lanes and 4-foot shoulders for every 78 miles of road. 21
Considering Mn/DOT’s own benefit-cost analysis, national standards andresearch, data showing the share of roads which are less than 12 feet widenationally, and the Task Force’s rationale, we recommend that:
• Mn/DOT should reject the Task Force’s lane width recommendations,and
• Mn/DOT should permit 11-foot lanes on certain low volume ruralhighways and determine the projected traffic level at which thestandard should be 12 feet.
The CSAH system would be more affected by a change in the status quoregarding lane width standards. Only 6 percent of trunk highway miles have lanewidths below 12 feet, and Mn/DOT is unlikely to reconstruct these roads in thenear future. It makes sense to lower the lane width standard on certain lowvolume roads, but some counties may resist this change because it reduces theamount of state aid they receive. Counties should be permitted to build a roadwider than 11 feet if they want, but they should pay the extra costs. State aid doesnot need to be provided at a level which permits the highest construction standardsto be met. State aid should be sufficient to build or rebuild roads to a reasonablestandard, which is supported by an analysis of benefits and costs. The TaskForce’s recommendations on lane width are not supported by national research orthe benefit-cost analysis conducted by Mn/DOT staff.
We also think the Task Force’s recommendation on lane width for constructionand reconstruction projects fails to consider the fiscal realities faced by state andlocal highway agencies in Minnesota. Given the current level of funding,highway agencies must emphasize preservation of the existing infrastructure overimprovements, particularly improvements which do not deliver benefits in excessof their costs. State government, including Mn/DOT, should not set standards forlocal governments which are excessive and not cost-effective. Just as Mn/DOTfinds it beneficial to have increased flexibility from the federal government indecisions about federally-funded projects, Mn/DOT should permit localgovernments greater flexibility in designing state-funded projects at the local leveland in meeting local needs.
SUMMARY
The Geometric Design Standards Task Force sponsored by Mn/DOT hasdeveloped some reasonable recommendations for new highway standards. In
Mn/DOTshouldreexamine theTask Force’srecommenda-tions forconstructionandreconstructionprojects.
LANE AND SHOULDER WIDTH STANDARDS 107
21 Data on crashes on rural county state-aid highways in Minnesota indicate that only 1 percent ofcrashes involve fatalities, while 36 percent involve injuries, and 63 percent are property-damage-only incidents.

particular, its recommended reconditioning standards seem practical and may helpto reduce unnecessary highway expenditures on a limited number of highwaymiles.
The Task Force’s recommended standards for lane widths on construction andreconstruction projects are somewhat arbitrary and deviate from the results ofMn/DOT’s own benefit-cost analysis. That analysis suggests, like reputablenational studies, that the costs of constructing 12-foot lanes outweigh accidentreduction benefits for lesser-traveled rural highways. Minnesota has significantlymore rural roads with 12-foot lanes than the national average, and the TaskForce’s proposal maintains a lane width standard in excess of nationallyrecommended standards.
We urge Mn/DOT and the Task Force to reconsider the Task Force’srecommendations for construction and reconstruction projects. Given the fiscalrealities facing state and local governments in Minnesota, it is important thatevery reasonable effort be made to maximize the cost-effectiveness of governmentspending. Mn/DOT and local governments need to focus on building atransportation system that is affordable and practical from a benefit-coststandpoint, not on building the best possible system. Adopting lane and shoulderwidth standards more like nationally recommended standards could free up fundswhich are needed to preserve the existing infrastructure and to respond tocongestion, economic development, and other safety needs.
108 HIGHWAY SPENDING


Pollution Control Agency, January 1991 91-01Nursing Homes: A Financial Review,
January 1991 91-02Teacher Compensation, January 1991 91-03Game and Fish Fund, March 1991 91-04Greater Minnesota Corporation: Organiza-
tional Structure and Accountability, March 1991 91-05
State Investment Performance, April 1991 91-06Sentencing and Correctional Policy, June 1991 91-07Minnesota State High School League Update,
June 1991 91-08University of Minnesota Physical Plant
Operations: A Follow-Up Review, July 1991 91-09
Truck Safety Regulation, January 1992 92-01State Contracting for Professional/Technical
Services, February 1992 92-02Public Defender System, February 1992 92-03Higher Education Administrative and Student
Services Spending: Technical Colleges, Community Colleges, and State Universities,March 1992 92-04
Regional Transit Planning, March 1992 92-05University of Minnesota Supercomputing
Services, October 1992 92-06Petrofund Reimbursement for Leaking
Storage Tanks, January 1993 93-01Airport Planning, February 1993 93-02Higher Education Programs, February 1993 93-03Administrative Rulemaking, March 1993 93-04Truck Safety Regulation, Update, June 1993 93-05School District Financial Reporting,
Update, June 1993 93-06Public Defender System, Update,
December 1993 93-07Game and Fish Fund Special Stamps and
Surcharges, Update, January 1994 94-01
Performance Budgeting, February 1994 94-02Psychopathic Personality Commitment Law,
February 1994 94-03Higher Education Tuition and State Grants,
February 1994 94-04Motor Vehicle Deputy Registrars, March 1994 94-05Minnesota Supercomputer Center, June 1994 94-06Sex Offender Treatment Programs, July 1994 94-07Residential Facilities for Juvenile Offenders, February 1995 95-01Health Care Administrative Costs, February 1995 95-02Guardians Ad Litem, February 1995 95-03Early Retirement Incentives, March 1995 95-04State Employee Training: A Best Practices
Review, April 1995 95-05Snow and Ice Control: A Best Practices Review,
May 1995 95-06Funding for Probation Services, January 1996 96-01Department of Human Rights, January 1996 96-02Trends in State and Local Government Spending,
February 1996 96-03State Grant and Loan Programs for Businesses,
February 1996 96-04Post-Secondary Enrollment Options Program,
March 1996 96-05Tax Increment Financing, March 1996 96-06Property Assessments: Structure and Appeals,
A Best Practices Review, May 1996 96-07Recidivism of Adult Felons, January 1997 97-01Nursing Home Rates in the Upper Midwest,
January 1997 97-02Special Education, January 1997 97-03Ethanol Programs, 97-04Statewide Systems Project, February 1997 97-05Highway Spending, March 1997 97-06Prosecution of Misdemeanors, A Best Practices
Review, forthcoming
Recent Program Evaluations
Recent Performance Report Reviews
Copies of performance report reviews, which comment on agency performance reports, are avai lable for the followingagencies: Administration, Agriculture, Commerce, Corrections, Economic Security, Educ ation, Employee Relations, Finance, Health, Human Rights, Human Services, Labor and Industry, Military Affairs, Natur al Resources, Pollution Control, Public Safety, Public Service, Revenue, Trade and Economic Development, Transport ation, and Veterans Affairs.
Additional reports relevant to performance reporting:
PR95-22 Development and Use of the 1994 Agency Performance Reports, July 1995PR95-23 State Agency Use of Customer Satisfaction Surveys, October 1995
Evaluation reports and reviews of agency performance reports can be obtained free of charge from the ProgramEvaluation Division, Centennial Office Building, First Floor South, Saint Paul, Minnesota 55155, 61 2/296-4708. Acomplete list of reports issued is available upon request. Full text versions of recent reports are also available at the OLAweb site: http://www.auditor.leg.state.mn.us/ped2.htm.