
Dr. Frances Mortimer, Medical Director Centre for Sustainable Healthcare National Workshop - Carbon...
29
Dr. Frances Mortimer, Medical Director Centre for Sustainable Healthcare National Workshop - Carbon Modelling within Dentistry 17 th February 2015 Measuring carbon in healthcare
-
Upload
kristin-bradley -
Category
Documents
-
view
213 -
download
0
Transcript of Dr. Frances Mortimer, Medical Director Centre for Sustainable Healthcare National Workshop - Carbon...

Dr. Frances Mortimer, Medical DirectorCentre for Sustainable Healthcare
National Workshop - Carbon Modelling within Dentistry17th February 2015
Measuring carbon in healthcare
CENTRE forSUSTAINABLEHEALTHCARE
Measuring carbon in healthcare
1. Why measure carbon?2. How do we do it? 3. Carbon measurement examples:• The whole NHS• Dorset renal service – a clinical service• Antipsychotic depot injection – an intervention• Respiratory inhalers – a product
4. Overview

CENTRE forSUSTAINABLEHEALTHCARE
Why measure carbon – how does it help?
Carbon will be as important as money – you can’t commission if you can’t cost…
1.Policy development: setting targets, tracking progress2.Service redesign: identifying carbon hotspots, evaluating innovations3.Comparing higher and lower carbon interventions and products4.Engaging public, staff, suppliers /providers
carbon cost per QALY
CENTRE forSUSTAINABLEHEALTHCARE
Carbon footprint - The sum of greenhouse gas emissions released in relation to an organisation, product or service, expressed as carbon dioxide equivalents (CO2e).

Carbon footprint: what is included?(operational boundaries)
Can be expressed in carbon dioxide equivalents (CO2e)

CENTRE forSUSTAINABLEHEALTHCARE
Steps involved
1. Define the goal and scope of the study2. Identify the resources used
(set boundaries, create inventory)3. Measure the resource utilisation
(collect data)4. Attribute a carbon cost or footprint to
the resources used (x carbon intensity)
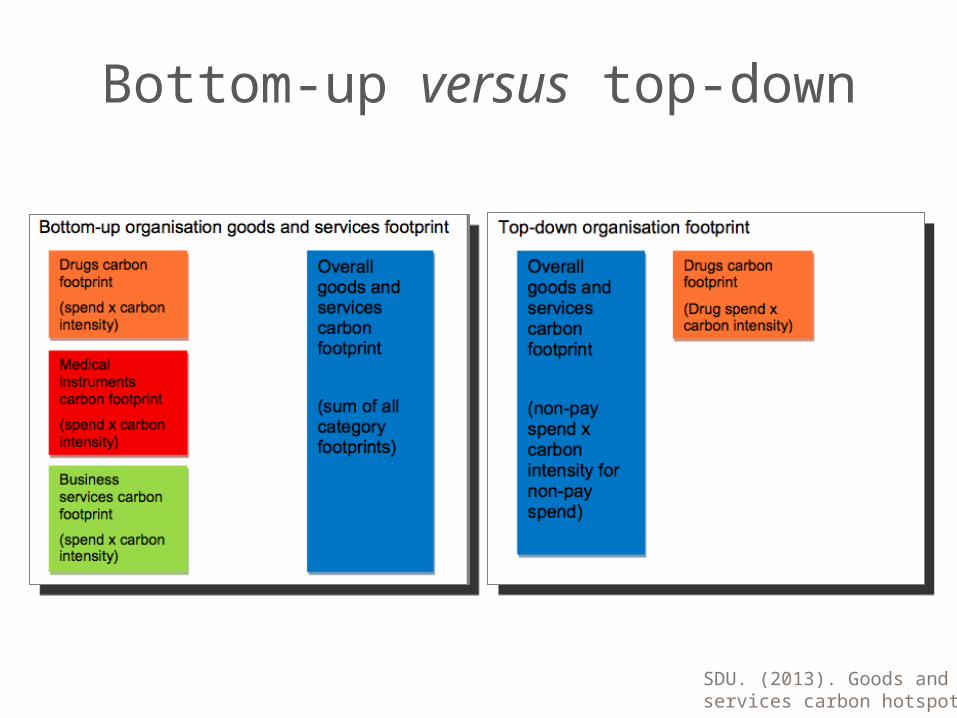
Bottom-up versus top-down
SDU. (2013). Goods and services carbon hotspots

CENTRE forSUSTAINABLEHEALTHCARE
Example 1
Carbon footprint of NHS England
Motive: policy development, engagement
Method: Scope 3 (consumption-based), mixed top-down / bottom up

CENTRE forSUSTAINABLEHEALTHCARE
NHS England activity data
Category Data source
Direct energy use of coal, oil, gas and renewables
ERIC returns
Direct release of anaesthetic gases & nitrous oxide
Suppliers’ figures
Electricity use ERIC returns
Procurement spend National accounts expenditure for government expenditure on health, HM Treasury PESA, NHS Shared Business Services (Trust level data)
Staff, patient and visitor travel National Travel Survey
SDU. (2013) Carbon footprint update for NHS in England 2012

CENTRE forSUSTAINABLEHEALTHCARESDU. (2013). Goods and services
carbon hotspots,
Climate Change Act 2008 targets

SDU. (2013). Goods and services carbon hotspots

CENTRE forSUSTAINABLEHEALTHCARE
Example 2
Carbon footprint of Dorset Renal Service
Motive: identify carbon hotspots, policy development/ engaging staff and others
Method: Scope 3 (consumption-based), mostly bottom-up

CENTRE forSUSTAINABLEHEALTHCARE
Steps involved
1. Define the goal and scope of the study2. Identify the resources used
(set boundaries, create inventory)3. Measure the resource utilisation
(collect data)4. Attribute a carbon cost or footprint to
the resources used (x carbon intensity)
Renal procurement data not available at national level
CENTRE forSUSTAINABLEHEALTHCARE
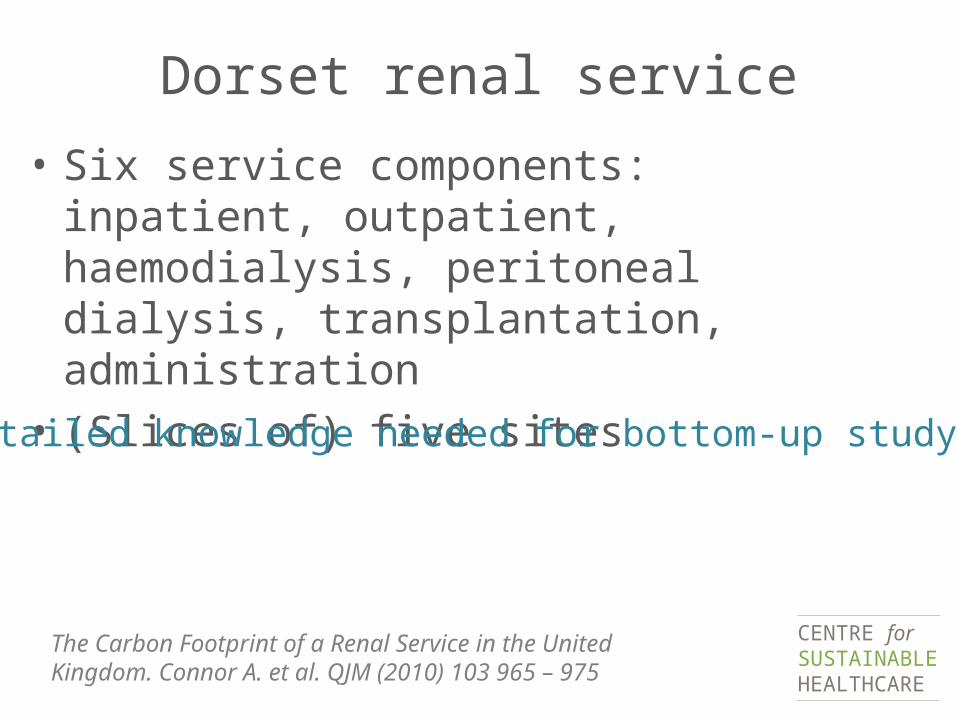
Dorset renal service
• Six service components: inpatient, outpatient, haemodialysis, peritoneal dialysis, transplantation, administration
• (Slices of) five sites
The Carbon Footprint of a Renal Service in the United Kingdom. Connor A. et al. QJM (2010) 103 965 – 975
Detailed knowledge needed for bottom-up study

CENTRE forSUSTAINABLEHEALTHCARE
Dorset renal service activity dataCategory Data source
Buildings energy use Calculated from ERIC returns for each site, based on the proportion of the floor space occupied by the Dorset renal service
Staff and patient travel Travel surveys
Visitor travel Estimated from National Travel Survey 2006
Procurement data Expenditure data for pharmaceuticals, medical equipment, paper, food, sanitation products and IT were collected from relevant departments
Numbers of radiological and laboratory investigations were taken from IT records
Water consumption taken from meter readings
Linen usage determined per patient
Waste amounts and disposal route were estimated from published reports
The Carbon Footprint of a Renal Service in the United Kingdom. Connor A. et al. QJM (2010) 103 965 – 975
CENTRE forSUSTAINABLEHEALTHCARE
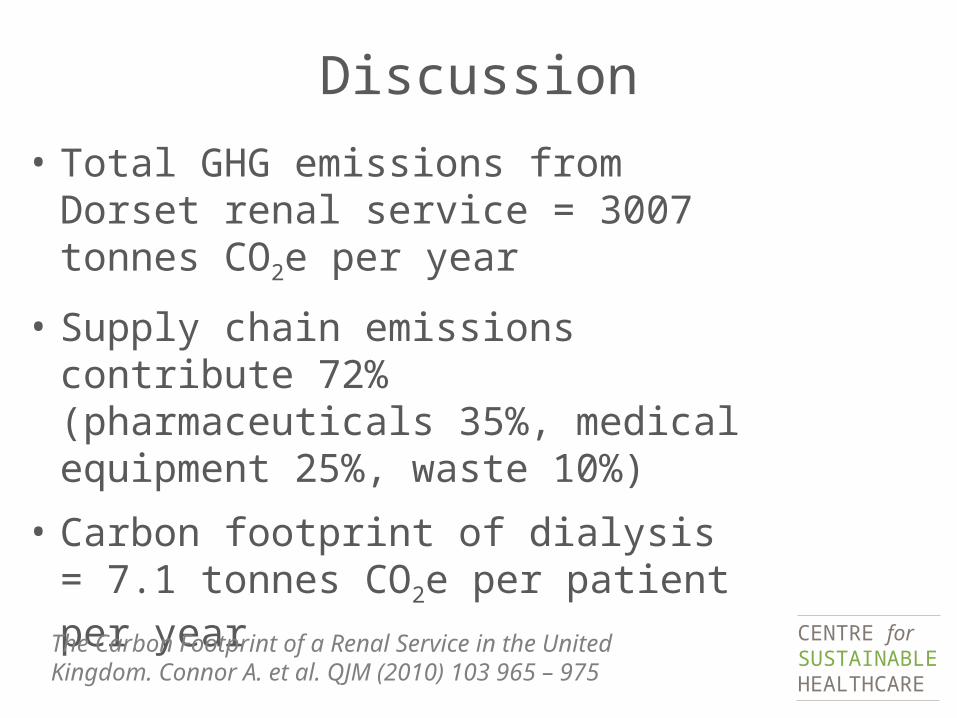
Discussion
• Total GHG emissions from Dorset renal service = 3007 tonnes CO2e per year
• Supply chain emissions contribute 72% (pharmaceuticals 35%, medical equipment 25%, waste 10%)
• Carbon footprint of dialysis = 7.1 tonnes CO2e per patient per year
The Carbon Footprint of a Renal Service in the United Kingdom. Connor A. et al. QJM (2010) 103 965 – 975

CENTRE forSUSTAINABLEHEALTHCARE
Example 3
Carbon footprint of antipsychotic depot injection
Motive: service redesign: carbon modelling a service change
Method: Scope 3 (consumption-based), mixed bottom-up / top-down
CENTRE forSUSTAINABLEHEALTHCARE
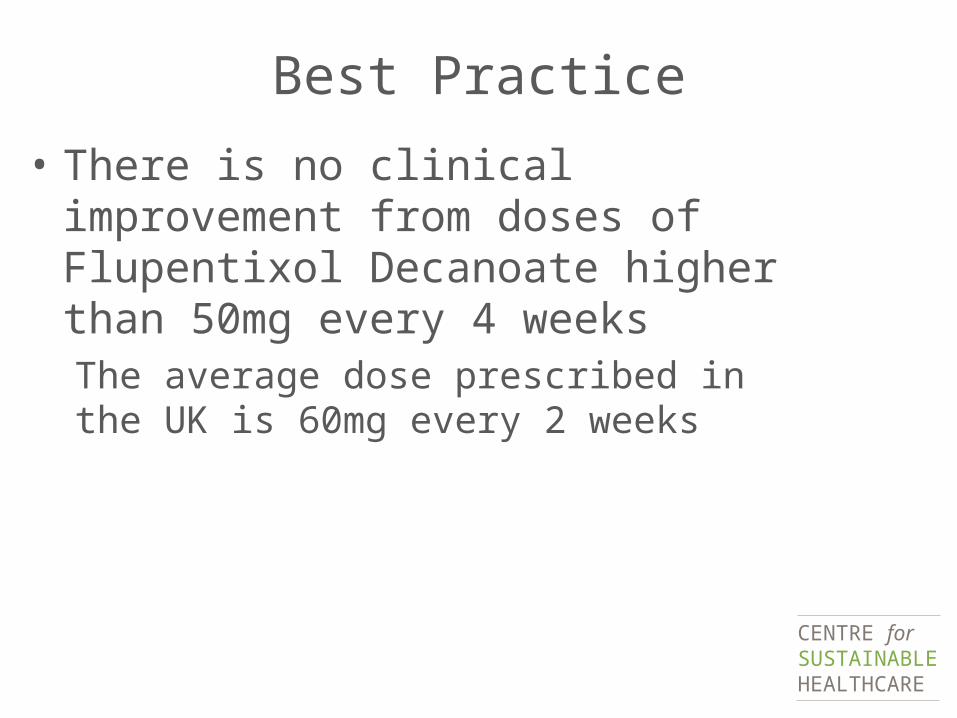
Best Practice
• There is no clinical improvement from doses of Flupentixol Decanoate higher than 50mg every 4 weeksThe average dose prescribed in the UK is 60mg every 2 weeks
CENTRE forSUSTAINABLEHEALTHCARE
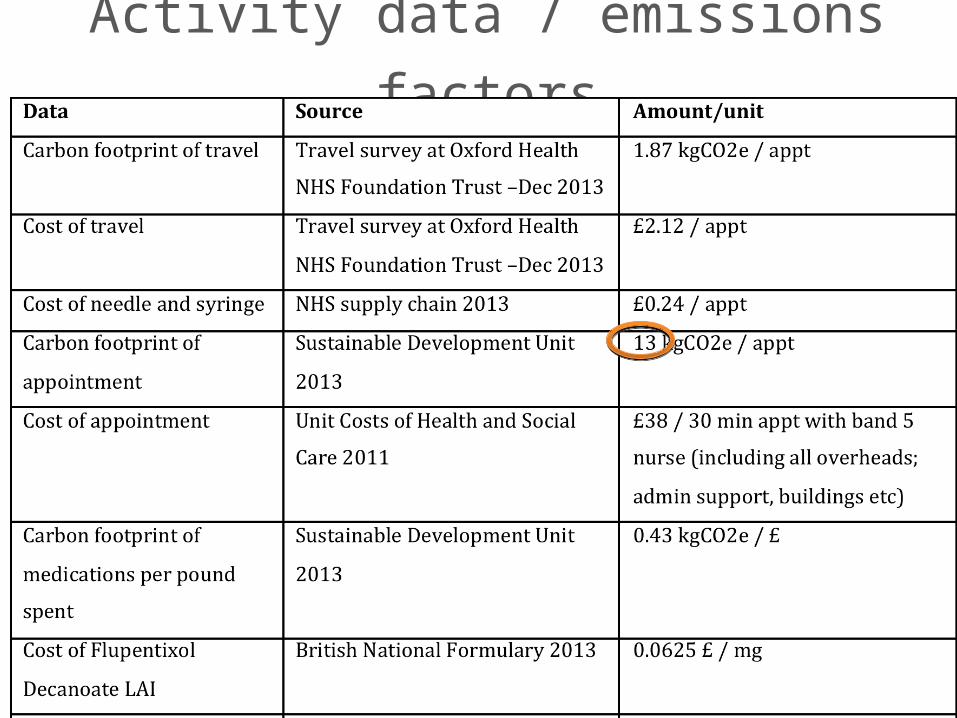
Activity data / emissions factors

CENTRE forSUSTAINABLEHEALTHCARE
Goods and services carbon hotspots, NHS Sustainable Development Unit (2013)
= building blocks for carbon modelling

CENTRE forSUSTAINABLEHEALTHCARE
Top down methods of carbon footprinting clinical activity
• Method 1. Total NHS carbon emissions per pound total expenditure apportioned on the basis of unit costs of each activity
• Method 2. Total NHS carbon emissions for secondary care (based on share of secondary care spend out of total spend) apportioned on the basis of shares of total activity for each service area
• Method 3. Total NHS carbon use for inpatient and outpatient care (based on share of inpatient and outpatient spend out of total spend) apportioned on the basis of shares of total activity
• Method 4. NHS Building energy use carbon emissions apportioned on the basis of inpatient activity (not applicable for outpatients)

CENTRE forSUSTAINABLEHEALTHCARE
Discussion
Currently, being on depot causes a significant increase in a person’s total carbon footprint of 6% per year, from 7.9 tonnes CO2 to 8.4 tons per year. This could be reduced by over 50%
Maughan, D., Lillywhite, R., Cooke, M. The economic cost and carbon burden of long acting injections. (submitted for publication)
CENTRE forSUSTAINABLEHEALTHCARE
Example 4
Carbon footprint of inhalers
Motive: internal product appraisal; public reporting on carbon impact of alternative devices
Method: product life-cycle, bottom up


Source: GHG Protocol Product Life Cycle Accounting Reporting Standard
The relationship between the Corporate, Scope 3, and Product Standards for a company manufacturing product A

Setting boundaries

• Per actuation, MDI emissions are 11x DPI emissions• The propellant HFA134a contributes >99% of the carbon footprint
of the Evohaler (MDI)• For a 200 dose Ventolin Evohaler, 88% GHG are released on
inhaler use, the rest in manufacture
Ventolin (200mcg) 60 Dose Accuhaler 0.8kg CO2e per pack
13g CO2e per actuation
Discussion
Ventolin (100mcg) 200 dose Evohaler 29kg CO2e per pack
144g CO2e per actuation
Source: GSK, by personal communication
Inhalers contribute 5% of NHS carbon footprint

CENTRE forSUSTAINABLEHEALTHCARE
Overview
• Carbon footprinting is easy: just multiply activity data x carbon intensity factors…
• Understand the goals of the study when setting scope & method – will you want to compare findings or monitor impact of changes?
• Data quality / access may limiting• Methodology is increasingly standardised• Be transparent about (look carefully at)
boundaries and assumptions