Torsten Hemme. Разработки доходов фермеров во всем мире....
23
18/10/2016 © IFCN 2016 | 1 Developments of farmers income all over the world Torsten Hemme, [email protected] IFCN Dairy Research Network, Germany
-
Upload
dairynews -
Category
Presentations & Public Speaking
-
view
269 -
download
0
Transcript of Torsten Hemme. Разработки доходов фермеров во всем мире....
18/10/2016 © IFCN 2016 | 1
Developments of farmers income all
over the world
Torsten Hemme,
IFCN Dairy Research Network, Germany
18/10/2016 © IFCN 2016 | 2
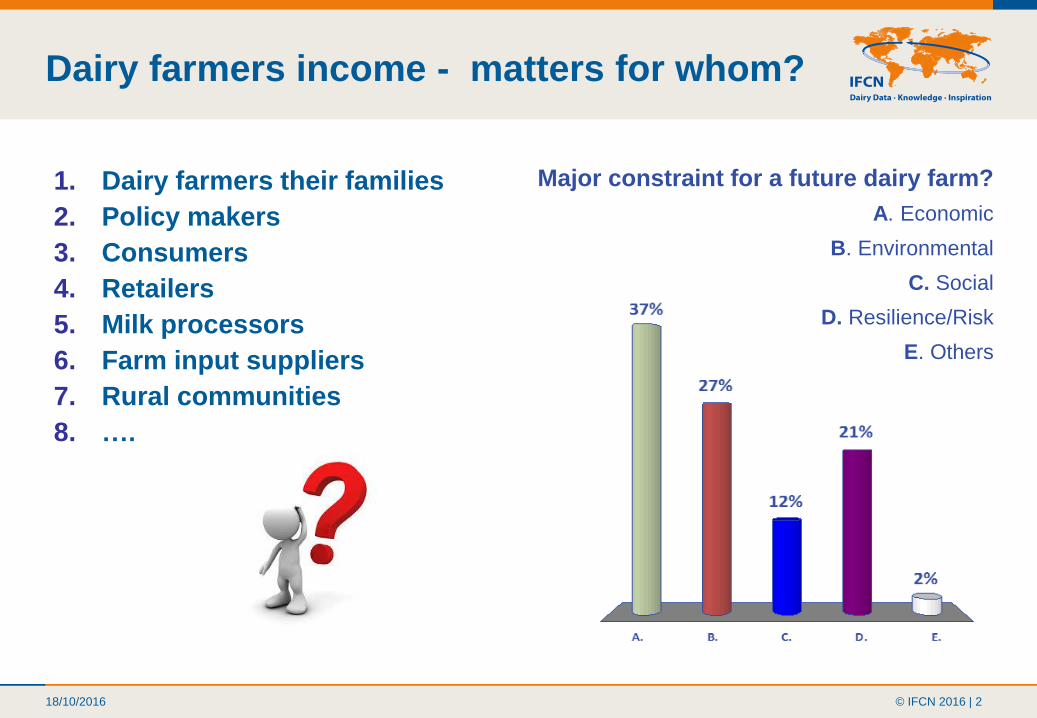
Dairy farmers income - matters for whom?
1. Dairy farmers their families
2. Policy makers
3. Consumers
4. Retailers
5. Milk processors
6. Farm input suppliers
7. Rural communities
8. ….
Major constraint for a future dairy farm?
A. Economic
B. Environmental
C. Social
D. Resilience/Risk
E. Others
18/10/2016 © IFCN 2016 | 3
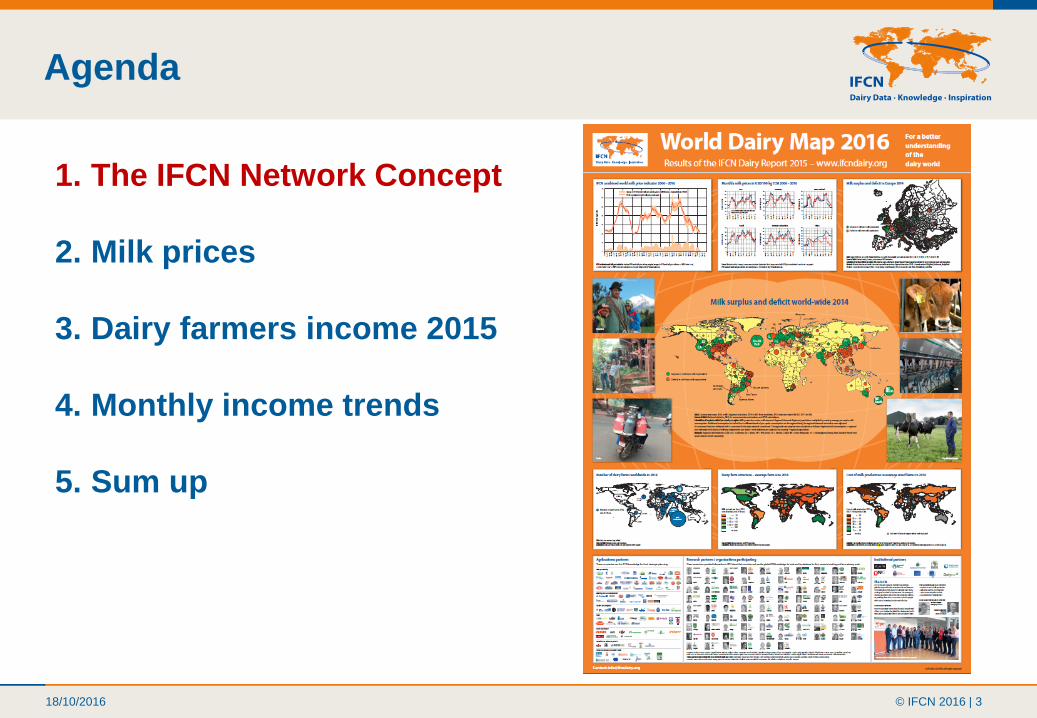
Agenda
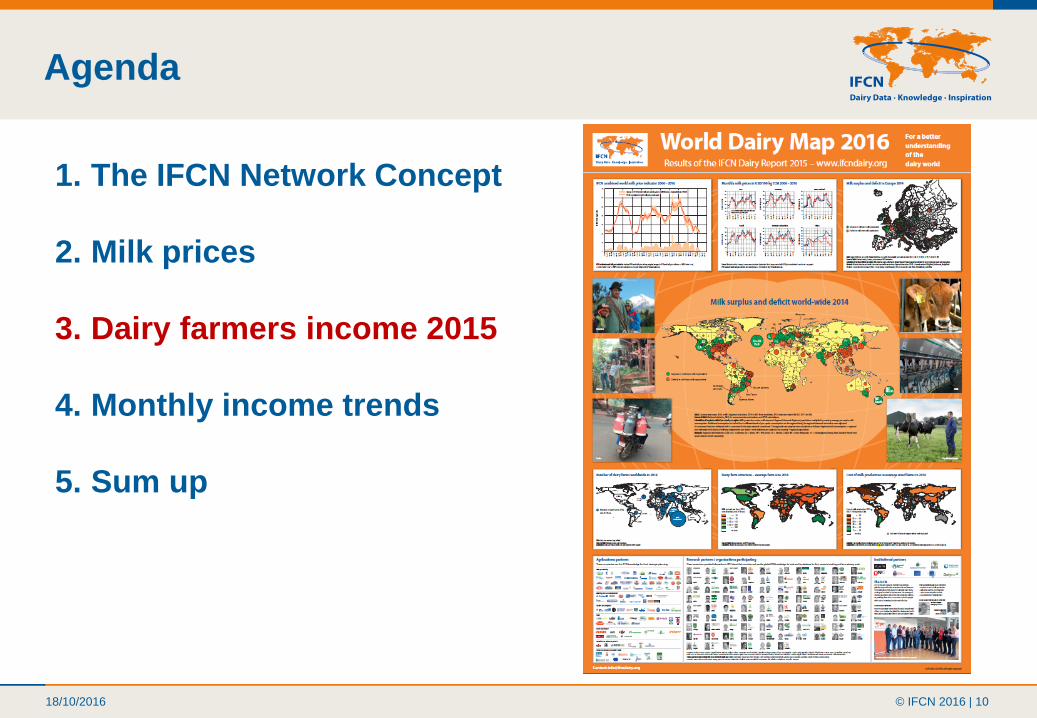
1. The IFCN Network Concept
2. Milk prices
3. Dairy farmers income 2015
4. Monthly income trends
5. Sum up
18/10/2016 © IFCN 2016 | 4
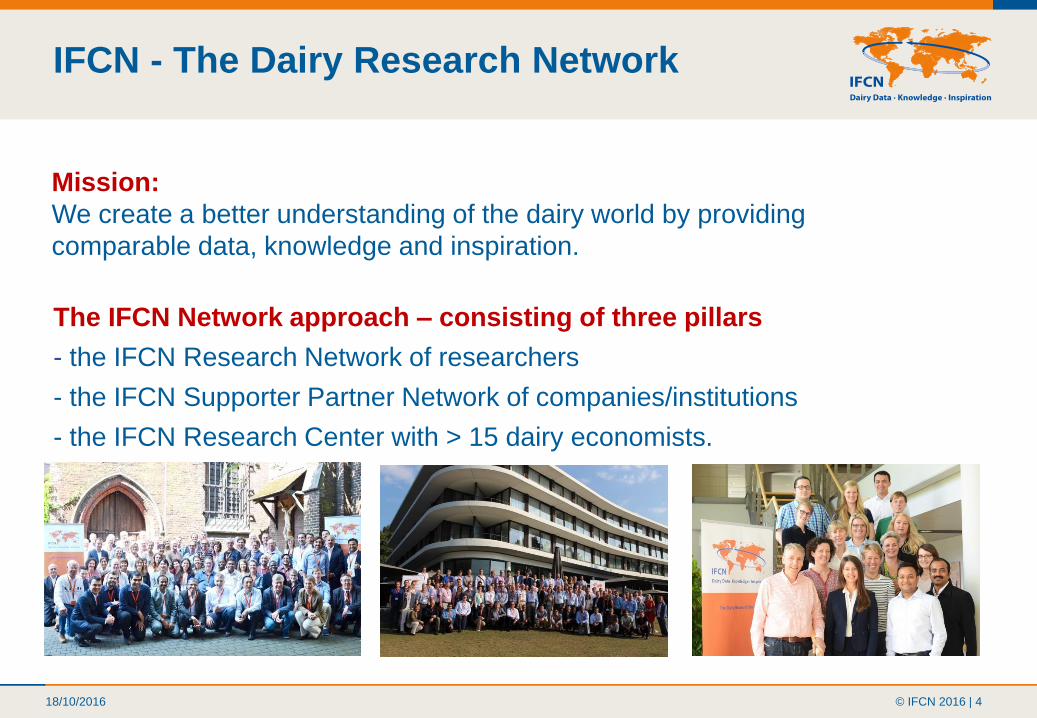
Mission:
We create a better understanding of the dairy world by providing
comparable data, knowledge and inspiration.
IFCN - The Dairy Research Network
The IFCN Network approach – consisting of three pillars
- the IFCN Research Network of researchers
- the IFCN Supporter Partner Network of companies/institutions
- the IFCN Research Center with > 15 dairy economists.
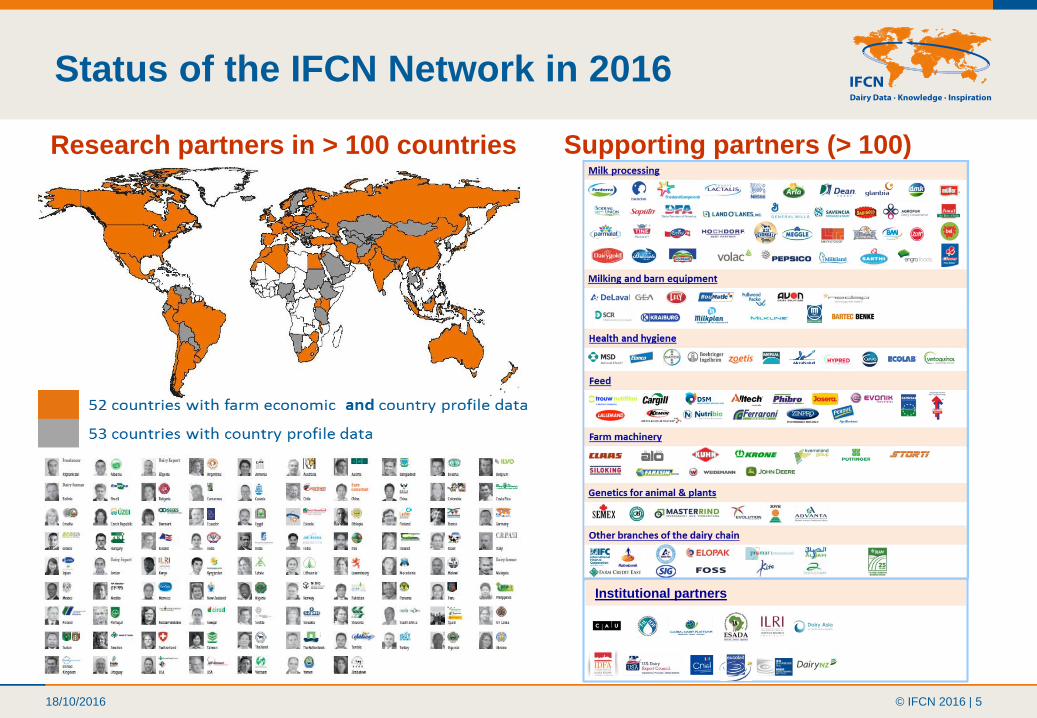
18/10/2016 © IFCN 2016 | 5
Research partners in > 100 countries
Status of the IFCN Network in 2016
Supporting partners (> 100)
Institutional partners

18/10/2016 © IFCN 2016 | 6
Agenda
1. The IFCN Network Concept
2. Milk prices
3. Dairy farmers income 2015
4. Monthly income trends
5. Sum up
18/10/2016 © IFCN 2016 | 7
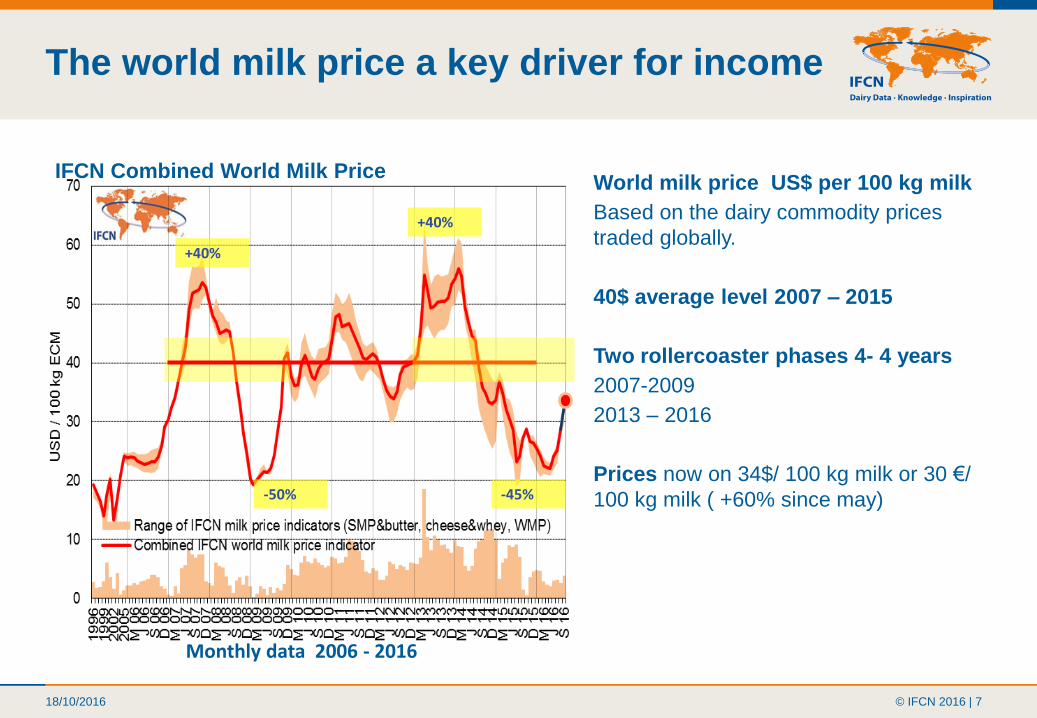
The world milk price a key driver for income
Monthly data 2006 - 2016
World milk price US$ per 100 kg milk
Based on the dairy commodity prices
traded globally.
40$ average level 2007 – 2015
Two rollercoaster phases 4- 4 years
2007-2009
2013 – 2016
Prices now on 34$/ 100 kg milk or 30 €/
100 kg milk ( +60% since may)
IFCN Combined World Milk Price
+40%
-50%
+40%
-45%
18/10/2016 © IFCN 2016 | 8Source: IFCN Monthly Real Time Data
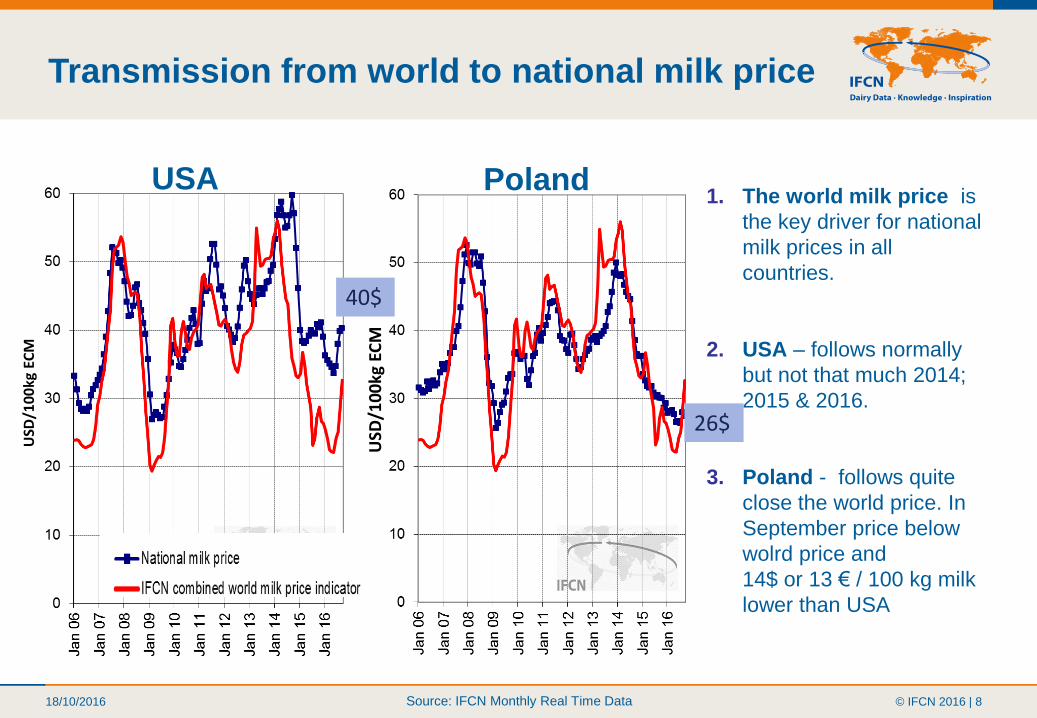
USA Poland1. The world milk price is
the key driver for national
milk prices in all
countries.
2. USA – follows normally
but not that much 2014;
2015 & 2016.
3. Poland - follows quite
close the world price. In
September price below
wolrd price and
14$ or 13 € / 100 kg milk
lower than USA
40$
26$
USD
/10
0kg
EC
M
USD
/10
0kg
EC
M
Transmission from world to national milk price
18/10/2016 © IFCN 2016 | 9
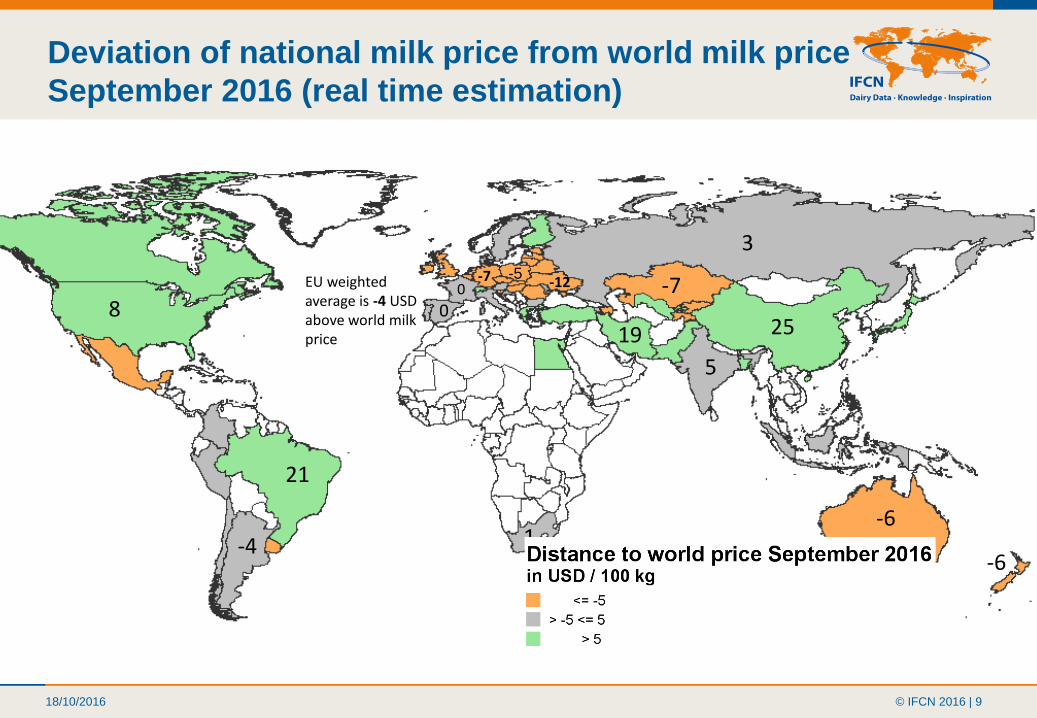
Deviation of national milk price from world milk price
September 2016 (real time estimation)
21
8
3
-6
0
0
-5
25
-7
-6-4
-12 -7EU weighted average is -4 USDabove world milk price
1
5
19
18/10/2016 © IFCN 2016 | 10
Agenda
1. The IFCN Network Concept
2. Milk prices
3. Dairy farmers income 2015
4. Monthly income trends
5. Sum up
18/10/2016 © IFCN 2016 | 11
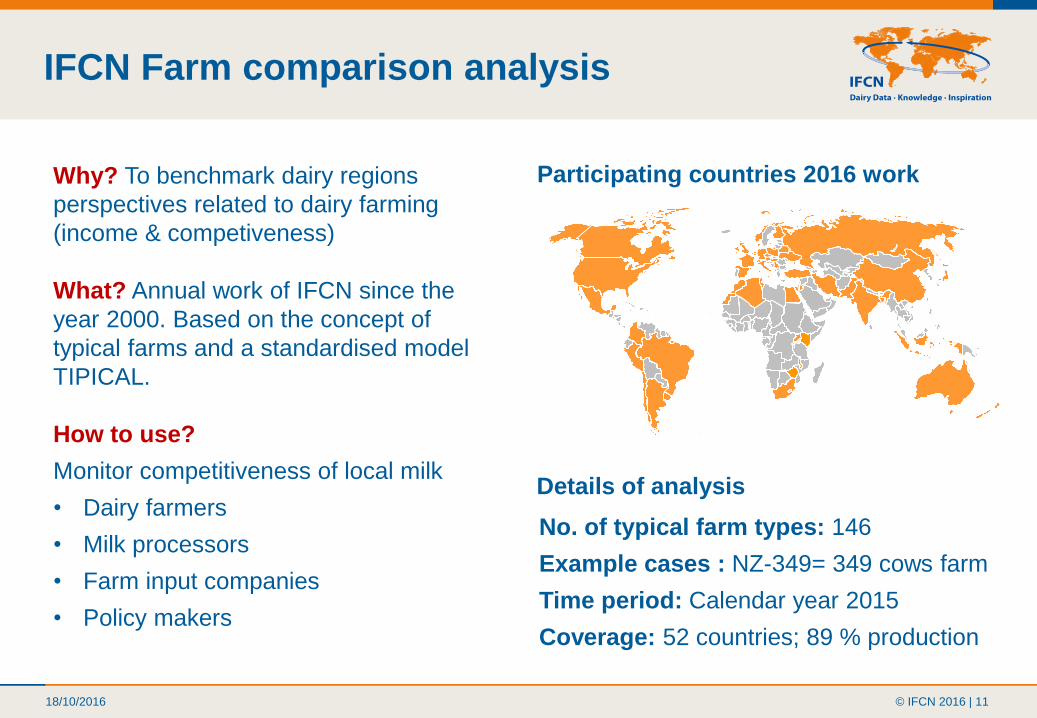
IFCN Farm comparison analysis
Participating countries 2016 work
No. of typical farm types: 146
Example cases : NZ-349= 349 cows farm
Time period: Calendar year 2015
Coverage: 52 countries; 89 % production
ID
Why? To benchmark dairy regions
perspectives related to dairy farming
(income & competiveness)
What? Annual work of IFCN since the
year 2000. Based on the concept of
typical farms and a standardised model
TIPICAL.
How to use?
Monitor competitiveness of local milk
• Dairy farmers
• Milk processors
• Farm input companies
• Policy makers
Details of analysis
18/10/2016 © IFCN 2016 | 12
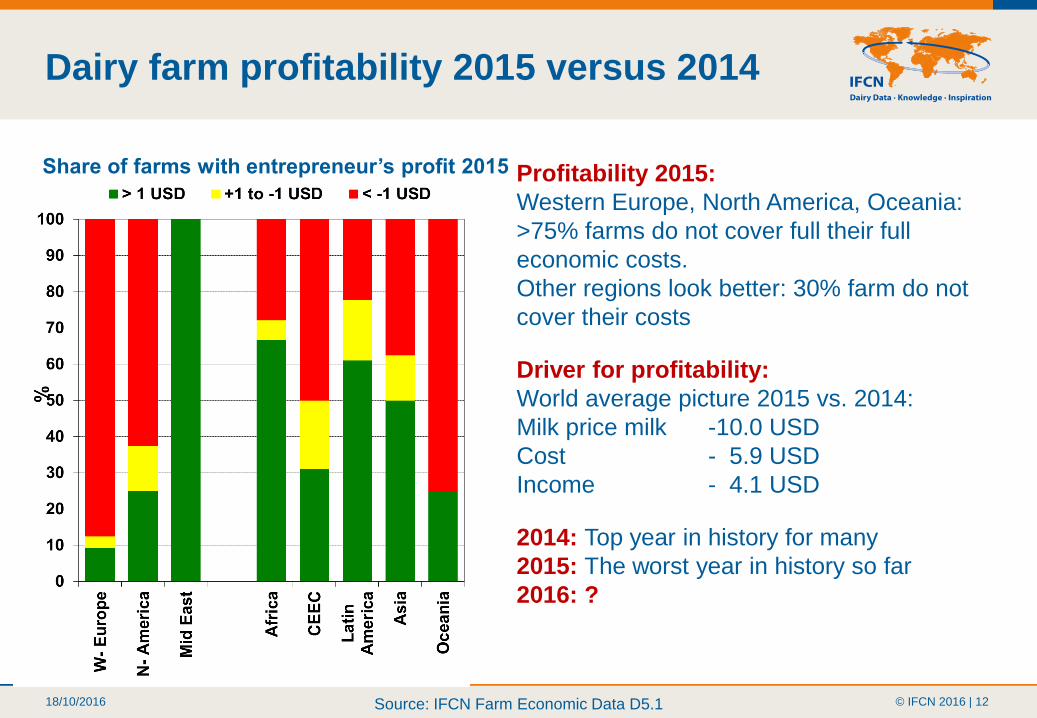
Dairy farm profitability 2015 versus 2014
Share of farms with entrepreneur’s profit 2015
Source: IFCN Farm Economic Data D5.1
Profitability 2015:
Western Europe, North America, Oceania:
>75% farms do not cover full their full
economic costs.
Other regions look better: 30% farm do not
cover their costs
Driver for profitability:
World average picture 2015 vs. 2014:
Milk price milk -10.0 USD
Cost - 5.9 USD
Income - 4.1 USD
2014: Top year in history for many
2015: The worst year in history so far
2016: ?
18/10/2016 © IFCN 2016 | 13
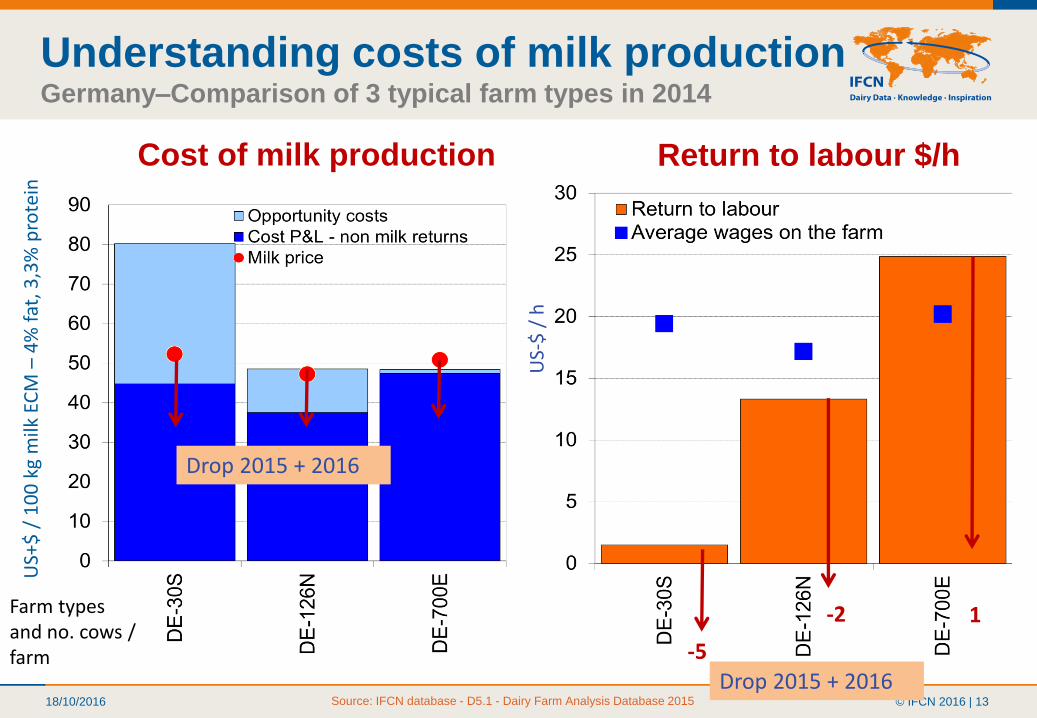
Understanding costs of milk production Germany–Comparison of 3 typical farm types in 2014
Cost of milk production Return to labour $/h
Farm typesand no. cows / farm
Source: IFCN database - D5.1 - Dairy Farm Analysis Database 2015
US+
$ /
10
0 k
g m
ilk E
CM
–4
% f
at, 3
,3%
pro
tein
US-
$ /
h
-5
-2 1
Drop 2015 + 2016
Drop 2015 + 2016
18/10/2016 © IFCN 2016 | 14
Agenda
1. The IFCN Network Concept
2. Milk prices
3. Dairy farmers income 2015
4. Monthly income trends
5. Sum up
18/10/2016 © IFCN 2016 | 15
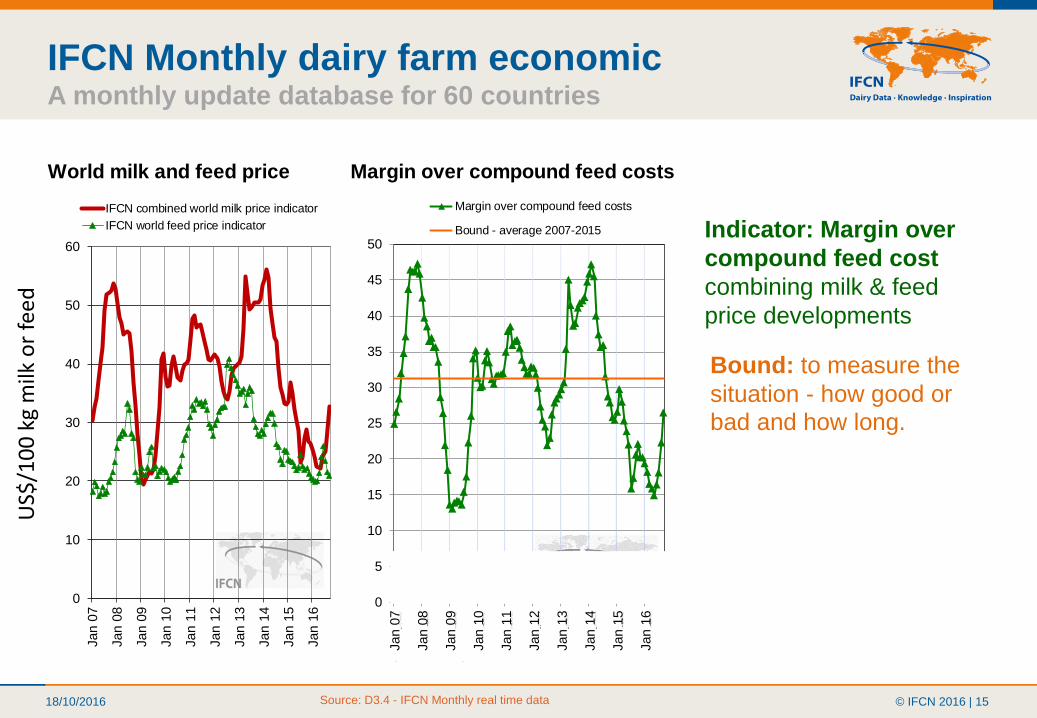
World milk and feed price Margin over compound feed costs
farm economics:
very good good poor very poor
0
5
10
15
20
25
30
35
40
45
50
Jan 0
7
Jan 0
8
Jan 0
9
Jan 1
0
Jan 1
1
Jan 1
2
Jan 1
3
Jan 1
4
Jan 1
5
Jan 1
6
Margin over compound feed costs
Bound - average 2007-2015
0
10
20
30
40
50
60
Jan 0
7
Jan 0
8
Jan 0
9
Jan 1
0
Jan 1
1
Jan 1
2
Jan 1
3
Jan 1
4
Jan 1
5
Jan 1
6
IFCN combined world milk price indicator
IFCN world feed price indicator
Source: D3.4 - IFCN Monthly real time data
IFCN Monthly dairy farm economicA monthly update database for 60 countries
Indicator: Margin over
compound feed cost
combining milk & feed
price developments
Bound: to measure the
situation - how good or
bad and how long.
US$
/10
0 k
g m
ilk o
rfe
ed

18/10/2016 © IFCN 2016 | 16
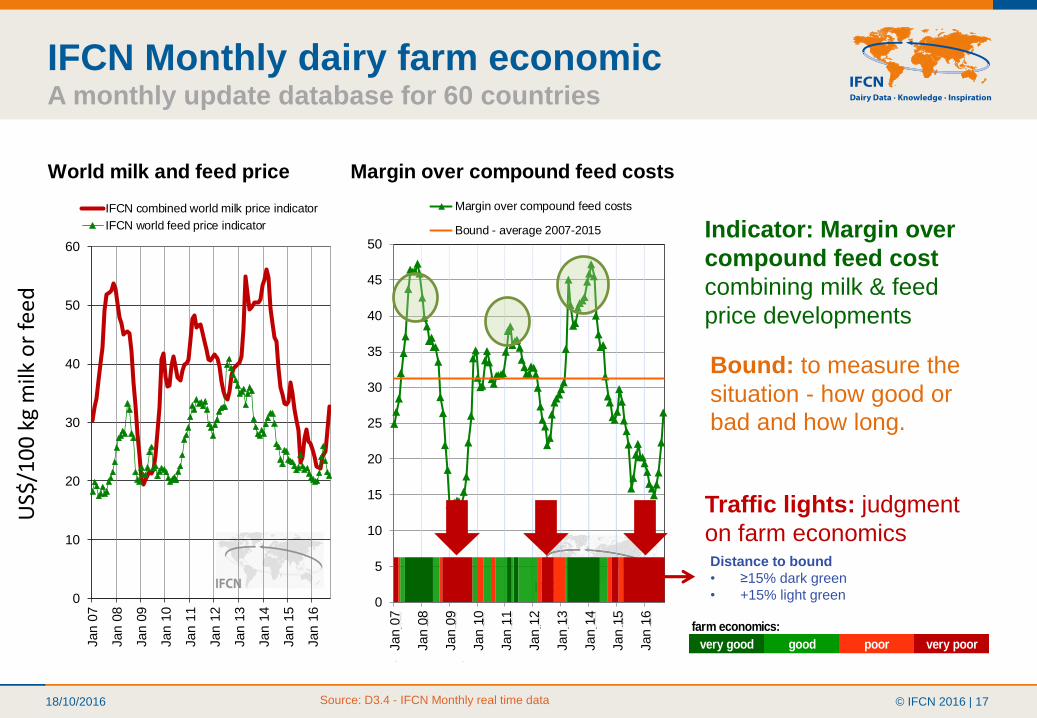
World milk and feed price Margin over compound feed costs
farm economics:
very good good poor very poor
0
5
10
15
20
25
30
35
40
45
50
Jan 0
7
Jan 0
8
Jan 0
9
Jan 1
0
Jan 1
1
Jan 1
2
Jan 1
3
Jan 1
4
Jan 1
5
Jan 1
6
Margin over compound feed costs
Bound - average 2007-2015
0
10
20
30
40
50
60
Jan 0
7
Jan 0
8
Jan 0
9
Jan 1
0
Jan 1
1
Jan 1
2
Jan 1
3
Jan 1
4
Jan 1
5
Jan 1
6
IFCN combined world milk price indicator
IFCN world feed price indicator
Source: D3.4 - IFCN Monthly real time data
IFCN Monthly dairy farm economicA monthly update database for 60 countries
Indicator: Margin over
compound feed cost
combining milk & feed
price developments
Bound: to measure the
situation - how good or
bad and how long.
US$
/10
0 k
g m
ilk o
rfe
ed
18/10/2016 © IFCN 2016 | 17
World milk and feed price Margin over compound feed costs
farm economics:
very good good poor very poor
0
5
10
15
20
25
30
35
40
45
50
Jan 0
7
Jan 0
8
Jan 0
9
Jan 1
0
Jan 1
1
Jan 1
2
Jan 1
3
Jan 1
4
Jan 1
5
Jan 1
6
Margin over compound feed costs
Bound - average 2007-2015
0
10
20
30
40
50
60
Jan 0
7
Jan 0
8
Jan 0
9
Jan 1
0
Jan 1
1
Jan 1
2
Jan 1
3
Jan 1
4
Jan 1
5
Jan 1
6
IFCN combined world milk price indicator
IFCN world feed price indicator
Source: D3.4 - IFCN Monthly real time data
IFCN Monthly dairy farm economicA monthly update database for 60 countries
Indicator: Margin over
compound feed cost
combining milk & feed
price developments
Bound: to measure the
situation - how good or
bad and how long.
Traffic lights: judgment
on farm economics
US$
/10
0 k
g m
ilk o
rfe
ed
Distance to bound
• ≥15% dark green
• +15% light green
farm economics:
very good good poor very poor

18/10/2016 © IFCN 2016 | 18
“Farmers income”- 5 countries since 2006
• -15% light red
• ≤-15% dark red
Distance to bound
• ≥15% dark green
• +15% light greenfarm economics:
very good good poor very poor
Source: D3.4 - IFCN Monthly real time data
Dairy farm economics based on margin over compound feed in national currency Country comparison
J F # A # J J A S O N D J F # A # J J A S O N D J F # A # J J A S O N D J F # A # J J A S O N D J F # A # J J A S O N D J F # A # J J A S O N D J F # A # J J A S O N D J F # A # J J A S O N D J F M A M J J A S O N D J F # A # J J A S
World market 0 0 1 3 3 2 2 2 2 2 2 2 2 2 2 2 2 3 3 3 1 0 0 0 0 0 0 0 0 0 0 0 0 0 3 3 1 1 1 3 3 3 1 1 3 3 3 3 3 2 2 3 2 2 3 3 3 3 3 3 3 3 1 1 0 0 0 0 0 1 1 1 1 1 3 2 2 2 2 2 2 2 2 2 2 2 2 2 2 3 3 3 1 1 0 0 0 1 1 0 0 0 0 0 0 0 0 0 0 0 0 0 0 0 0 0 0
Poland 1 1 1 1 3 3 3 3 3 2 2 2 2 3 3 3 3 1 1 1 1 1 1 0 0 0 0 0 0 0 0 1 1 1 1 1 1 1 1 1 1 1 1 3 1 1 3 1 3 3 3 3 3 3 3 3 3 3 3 3 3 3 3 1 1 1 1 1 1 1 1 1 1 1 1 1 1 1 3 3 3 2 2 2 2 2 2 3 3 3 3 3 3 1 1 1 1 1 1 1 1 1 1 1 1 1 1 1 1 1 1 0 0 0 0 0 0
United States of
America 0 0 1 1 3 2 2 2 2 2 2 2 3 3 1 1 3 3 3 3 1 1 1 1 0 0 0 0 0 0 0 0 0 0 0 1 1 1 0 0 0 1 1 1 1 1 1 0 0 1 3 3 3 2 2 2 2 3 3 3 1 1 1 1 0 0 0 1 1 3 3 3 1 1 1 1 3 1 1 3 3 3 3 2 2 2 2 2 2 2 2 2 2 2 2 3 1 1 1 1 1 1 1 1 1 1 1 1 1 0 0 0 0 0 1 1 1
2007 2008 2009 2010 2011 2012 2013 2014 2015 2016
farm economics:
very good good poor very poor
J F # A # J J A S O N D J F # A # J J A S O N D J F # A # J J A S O N D J F # A # J J A S O N D J F # A # J J A S O N D J F # A # J J A S O N D J F # A # J J A S O N D J F # A # J J A S O N D J F M A M J J A S O N D J F # A # J J A S
Brazil 0 0 1 1 1 3 2 2 2 2 2 3 3 3 3 3 3 3 3 3 1 1 1 0 0 0 0 0 0 1 3 3 3 3 1 0 0 0 1 3 3 3 1 1 1 1 1 1 1 1 1 1 1 3 3 3 3 3 3 3 1 3 3 1 1 1 1 1 1 1 1 1 1 1 1 3 1 3 3 2 2 2 2 3 1 1 3 3 3 3 3 3 3 3 3 1 1 1 1 1 1 1 1 3 1 1 1 1 1 1 3 3 3 3 2 2 2
South Africa 0 0 0 1 1 3 3 3 2 2 2 2 2 2 2 2 2 2 2 3 3 3 3 3 3 3 3 3 3 3 2 2 2 3 3 3 3 3 2 2 3 3 3 3 1 1 1 1 1 0 1 0 0 1 1 1 0 1 1 1 1 1 3 3 3 3 1 1 1 1 1 1 1 1 1 1 1 0 1 1 1 1 1 1 3 3 3 3 3 3 3 3 3 3 3 3 3 3 3 3 3 3 3 1 1 0 1 1 1 1 1 3 1 1 3 3 3
China 0 0 0 0 0 0 0 0 1 2 2 2 2 2 2 2 2 3 3 3 3 2 2 2 3 3 1 1 0 0 0 0 0 1 1 1 1 1 3 3 3 3 3 3 3 1 3 3 3 3 3 3 3 3 3 3 3 3 3 3 3 3 3 3 1 1 1 1 1 1 1 1 1 1 1 1 1 1 1 3 3 3 2 2 2 2 2 2 3 3 3 3 3 3 3 3 1 1 1 1 1 1 1 1 1 1 1 1 1 1 1 1 0 0 0 0 0
2007 2008 2009 2010 2011 2012 2013 2014 2015 2016
18/10/2016 © IFCN 2016 | 19
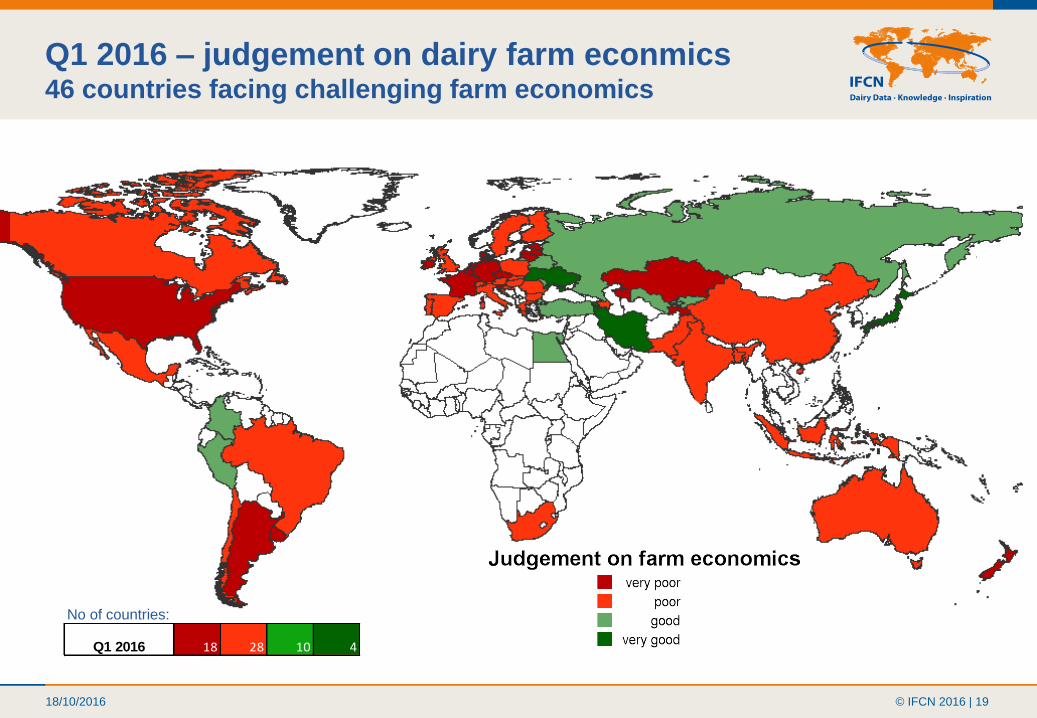
Q1 2016 – judgement on dairy farm econmics46 countries facing challenging farm economics
Q1 2016 18 28 10 4
No of countries:
18/10/2016 © IFCN 2016 | 20
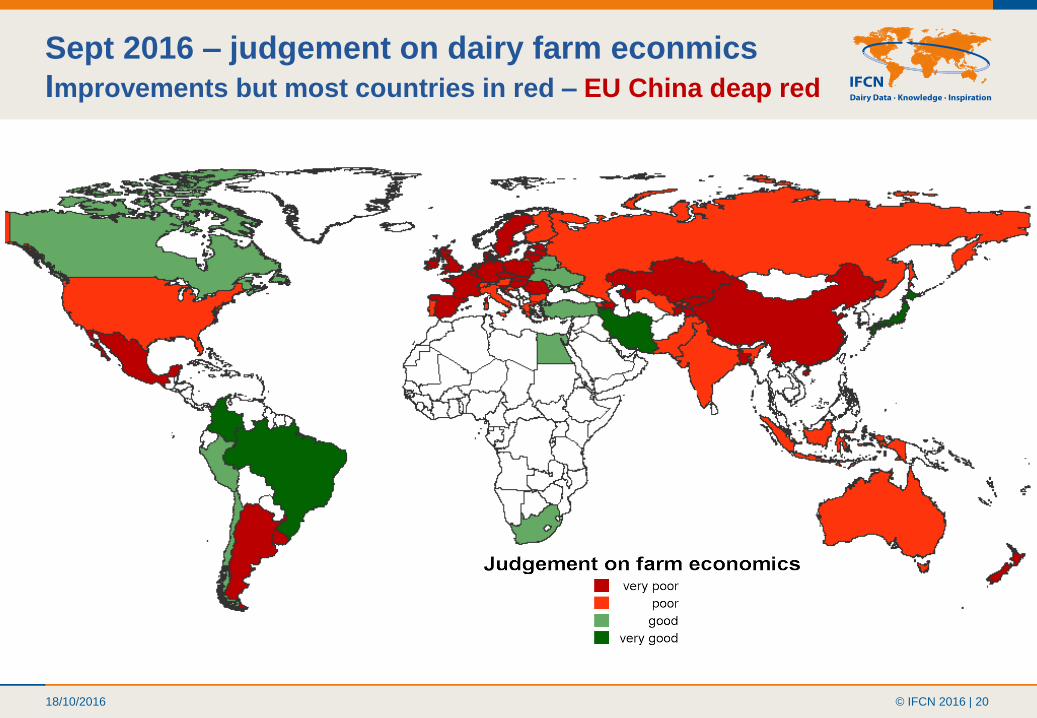
Sept 2016 – judgement on dairy farm econmics
Improvements but most countries in red – EU China deap red
18/10/2016 © IFCN 2016 | 21
farm economics:
very good good poor very poor Production: Leap year adjustment. February adjusted to 28 days
How to use this sheet:
For selecting countries for the charts, please type in the
numbers (country codes) into the yellow boxes below.
0
5
10
15
20
25
30
35
40
45
50
Jan 0
7
Jan 0
8
Jan 0
9
Jan 1
0
Jan 1
1
Jan 1
2
Jan 1
3
Jan 1
4
Jan 1
5
Jan 1
6
Margin over compound feed costs
Bound - average 2007-2015
0
10
20
30
40
50
60
Jan 0
7
Jan 0
8
Jan 0
9
Jan 1
0
Jan 1
1
Jan 1
2
Jan 1
3
Jan 1
4
Jan 1
5
Jan 1
6
IFCN combined world milk price indicator
IFCN world feed price indicator
-2%
-1%
0%
1%
2%
3%
4%
5%
Jan 0
7
Jan 0
8
Jan 0
9
Jan 1
0
Jan 1
1
Jan 1
2
Jan 1
3
Jan 1
4
Jan 1
5
Jan 1
6
% change to previous year
Average annual % change
Source: D3.4 - IFCN Monthly real time data
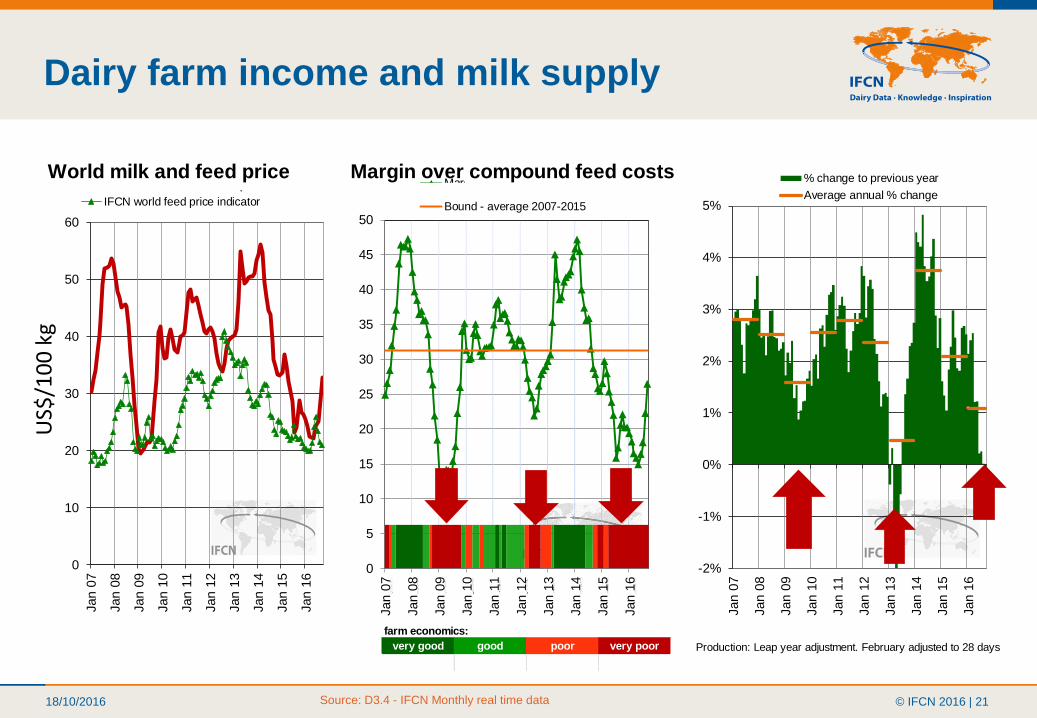
Dairy farm income and milk supplyU
S$/1
00
kg
World milk and feed price Margin over compound feed costs
farm economics:
very good good poor very poor
0
5
10
15
20
25
30
35
40
45
50
Jan 0
7
Jan 0
8
Jan 0
9
Jan 1
0
Jan 1
1
Jan 1
2
Jan 1
3
Jan 1
4
Jan 1
5
Jan 1
6
Margin over compound feed costs
Bound - average 2007-2015
0
10
20
30
40
50
60
Jan 0
7
Jan 0
8
Jan 0
9
Jan 1
0
Jan 1
1
Jan 1
2
Jan 1
3
Jan 1
4
Jan 1
5
Jan 1
6
IFCN combined world milk price indicator
IFCN world feed price indicator

18/10/2016 © IFCN 2016 | 22
Summing up
1. We are in the third world dairy farm crisis since 2007: World milk price is
in a rollercoaster mode which means +/- 40% around the mean level
2. Monthly milk price transmission
World milk price drives farmers milk prices in countries with a delay
3. Farm income 2015; 2016
two years with really bad / partly no incomes especially in EU
4. Monthly farm income developments
Despite world milk price recovery most countries income in red
5. Milk supply is responding to dairy farm economics but with delay!!!
Milk production decline globally this now drives prices up
18/10/2016 © IFCN 2016 | 23
Thank you for your attention
IFCN Dairy Research CenterNetwork of IFCN Researchers Network of IFCN Supporters
This presentation is the result of a large number of people
working together since 2000.