
M.4s PCL dynamic - dnu49mkepl158.cloudfront.net · dynamic Die M.4s PCL dynamic ist eine funktio-

May16-18, 2017
Warsaw, Poland
8TH CONFERENCE
ON SEVERE ACCIDENT
RESEARCH
ERMSAR 2017
Thermofluid Dynamic Analysis for THAI
Tests with Passive Hydrogen Recombiner
Masatoshi Sato, Toshinori Matsumoto,
Tomoyuki Sugiyama and Yu Maruyama
Japan Atomic Energy Agency
ERMSAR 2017, Warsaw, May 16-18, 2017
Background and Objectives
• Hydrogen production by the steam-zirconium chemical reaction is a significant concern in a severe accident.
• The passive autocatalytic recombiner (PAR) is one of the countermeasures to prevent the occurrence of
hydrogen deflagration/detonation in the containment vessel or reactor building.
• JAEA has developed the evaluation technique of severe accident countermeasures. In order to develop PAR
evaluation technique, thermofluid dynamic analyses were performed on the HR tests conducted in the
OECD/NEA THAI project.
• In the previous study, we carried out a simulation on the test HR5 as a first step to develop PAR evaluation
techniques. In this study, we performed simulations on the HR3 and HR12 to evaluate the validity of models
for extended conditions in terms of temperature, pressure, and steam concentration.
2

ERMSAR 2017, Warsaw, May 16-18, 2017
HR Tests
3
Height : 9.2m
Inner diameter : 3.2m
Volume : 60m3
THAI test vessel (OEDE/NEA, 2010)
PAR
Ring feed line for hydrogen
Initial conditions
HR3
Air
Pressure : 1.485 bar
Temperature : 29.9°C
HR12
Air + 61% steam
Pressure : 2.924 bar
Temperature : 115.0°C
HR5
Air
Pressure : 2.934 bar
Temperature : 32.0℃

ERMSAR 2017, Warsaw, May 16-18, 2017
Hydrogen Injection and Experimental Results
4
HR5
• In the all cases, the hydrogen was
injected twice with interval time.
• Recombination rate and pressure
increase during the hydrogen
injection.

ERMSAR 2017, Warsaw, May 16-18, 2017
Simulation Code and Computational Grid
5
PAR
Ring feed line
Thermal fluid dynamic code
Computational Grid
[J/kg]101.2OHO2
1H 8
222
Total number of cells : 1,052,789
Model of the PAR
OpenFOAM 3.0.1
Modified ‘reactingFoam’ solver to simulate PAR functions
H2 recombination rate
• AREVA correlation
• Function of
- H2 concentration
- O2 concentration
- Total pressure
Cata
lyst
Inlet channel
Outlet
channel

ERMSAR 2017, Warsaw, May 16-18, 2017
Conditions for Simulation
6
Initial Conditions H2 Injection History
HR3 HR12 HR5 (reference)
Pressure (bar) 1.485 2.924 2.934
Temperature (°C) 29.9 115.0 32.0
O2 (vol%) 21.0 8.2 21.0
H2 (vol%) 0.0 0.0 0.0
H2O (vol%) 0.0 61.1 0.0
N2 (vol%) 79.0 30.7 79.0
Turbulent model
・SST k-omega
Boundary Conditions Thermal Constant wall temperature Momentum No slip Turbulence Wall function
ERMSAR 2017, Warsaw, May 16-18, 2017
Simulation Result (HR12)
7
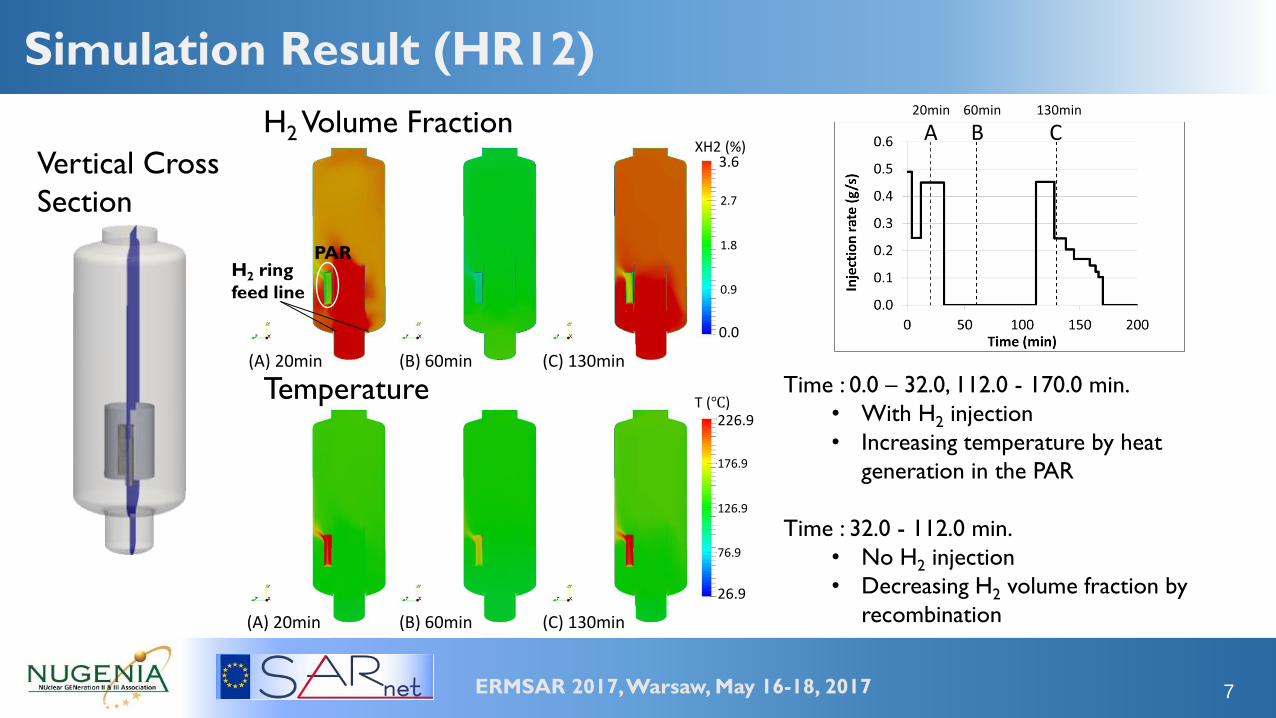
H2 Volume Fraction
Vertical Cross
Section
20min 60min 130min
(A) 20min (B) 60min (C) 130min
(A) 20min (B) 60min (C) 130min
Time : 0.0 – 32.0, 112.0 - 170.0 min.
• With H2 injection
• Increasing temperature by heat
generation in the PAR
Time : 32.0 - 112.0 min.
• No H2 injection
• Decreasing H2 volume fraction by
recombination
Temperature
PAR H2 ring
feed line
A B C
0.0
XH2 (%) 3.6
26.9
T (℃) 226.9
1.8
2.7
0.9
176.9
126.9
76.9

ERMSAR 2017, Warsaw, May 16-18, 2017
Flow Velocity
8
HR12 at 40 minutes
Upward flow is developed in the PAR due to the
natural convection driven by the reaction heat in
the hydrogen recombination.
The gas flow rises along the wall to the vessel roof
and turns into the downward flow at the wall in
the opposite side.
Significant difference was not observed in the flow
velocity field in the all tests. Upward flow
1.5
1.0
0.5
0.0
Velocity (m/s) 2.0
ERMSAR 2017, Warsaw, May 16-18, 2017
Hydrogen Recombination Rate
9
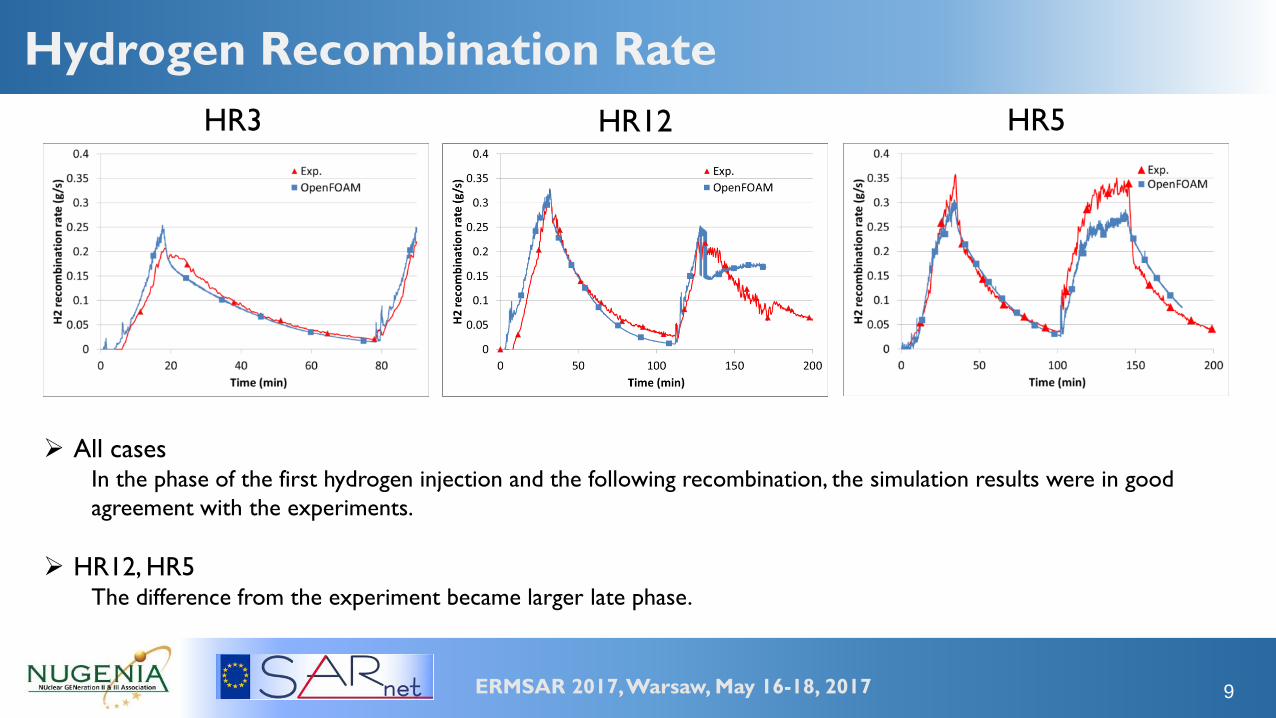
All cases In the phase of the first hydrogen injection and the following recombination, the simulation results were in good
agreement with the experiments.
HR12, HR5 The difference from the experiment became larger late phase.
HR3 HR12 HR5
ERMSAR 2017, Warsaw, May 16-18, 2017
Pressure in the Vessel
10
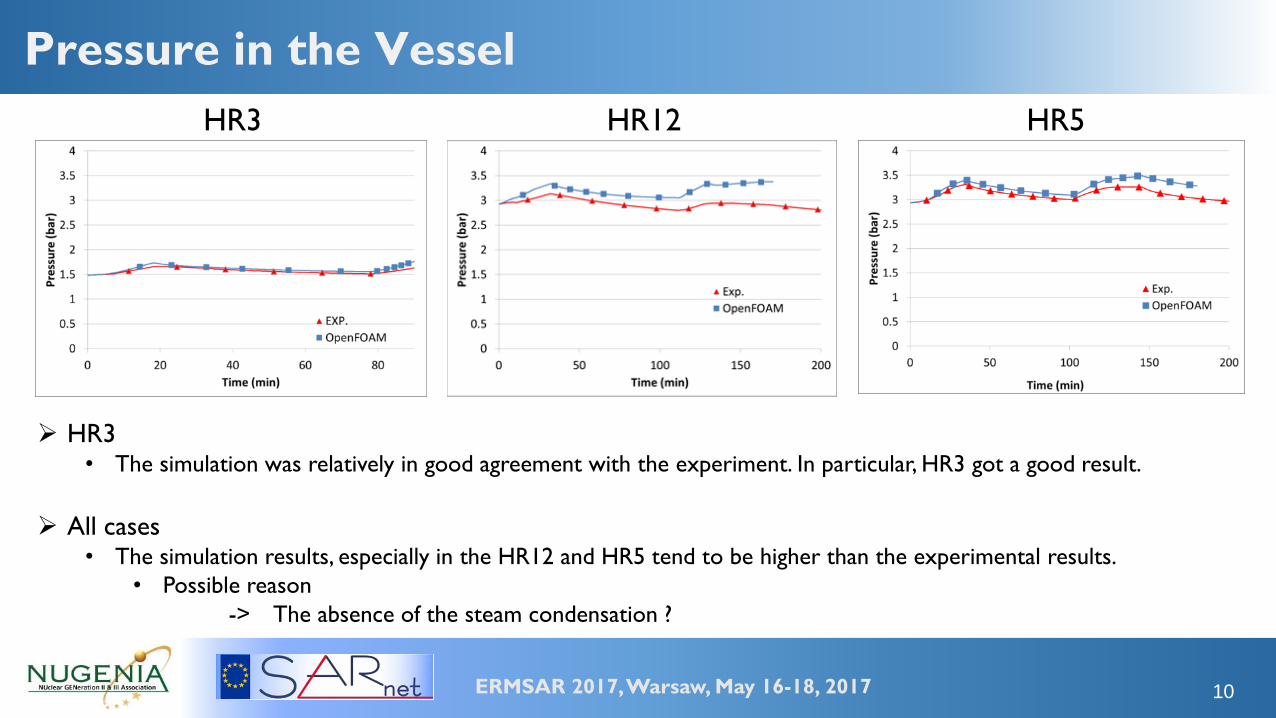
HR3 • The simulation was relatively in good agreement with the experiment. In particular, HR3 got a good result.
All cases • The simulation results, especially in the HR12 and HR5 tend to be higher than the experimental results.
• Possible reason
-> The absence of the steam condensation ?
HR3 HR12 HR5
ERMSAR 2017, Warsaw, May 16-18, 2017
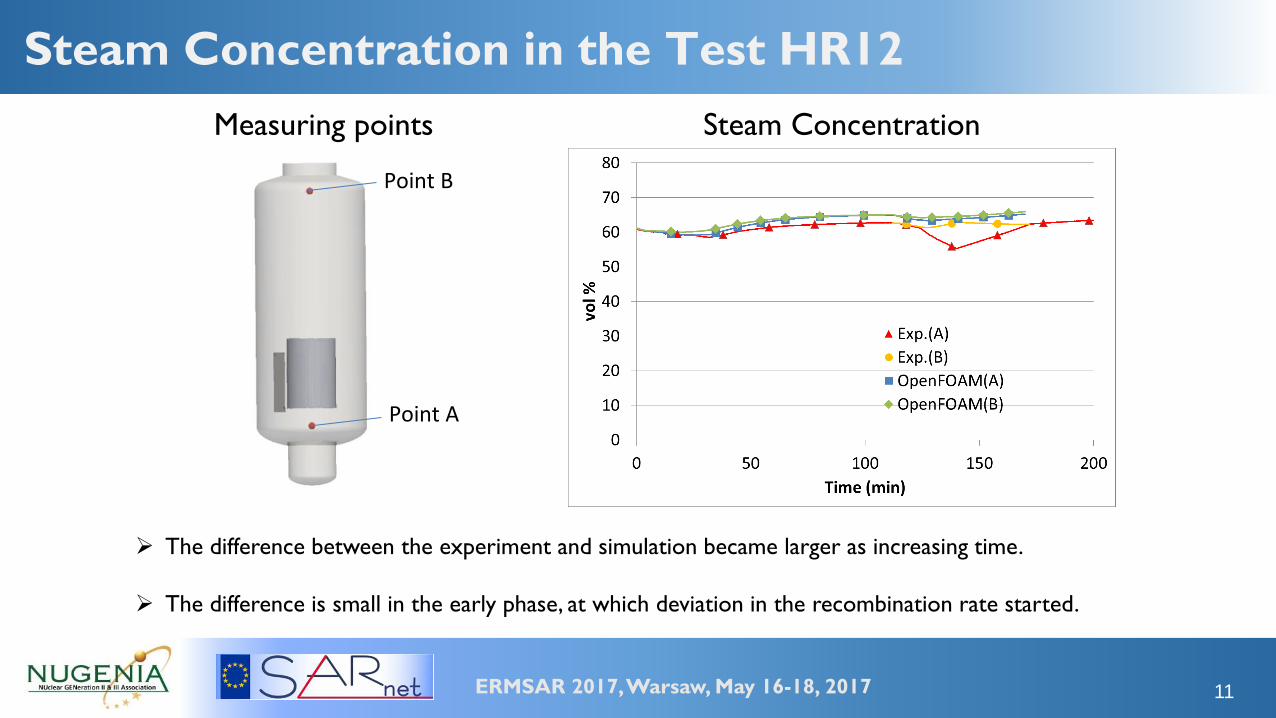
Steam Concentration in the Test HR12
11
Point B
Point A
Measuring points Steam Concentration
The difference between the experiment and simulation became larger as increasing time.
The difference is small in the early phase, at which deviation in the recombination rate started.

ERMSAR 2017, Warsaw, May 16-18, 2017
Possibility of Steam Condensation in the Experiments
12
50 100 150
0
1
2
Average gas temperature (°C)
Estim
ate
d s
team
part
ial
pre
ssure
(bar)
HR3
HR12
HR5
Steamsaturationpressure
The estimated steam partial pressure exceeded the
saturation pressure only in the test HR5.
• Significant steam condensation did not occur in
the tests HR3 and HR12.
->The absence of the steam condensation was
not the primary reason of the
disagreements of the hydrogen
recombination rate in the late phase of the
test HR12.
Relationship Between steam partial pressure and saturation pressure during tests
ERMSAR 2017, Warsaw, May 16-18, 2017
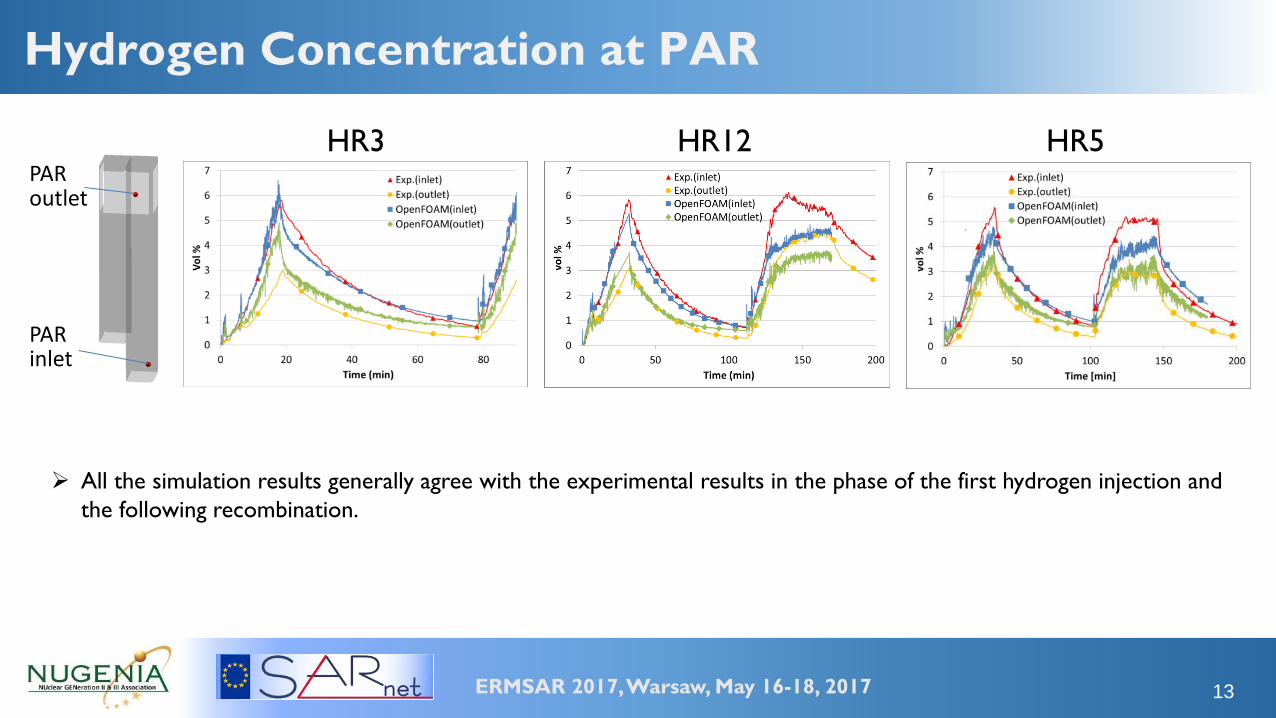
Hydrogen Concentration at PAR
13
All the simulation results generally agree with the experimental results in the phase of the first hydrogen injection and
the following recombination.
HR3 HR12 HR5 PAR outlet
PAR inlet
ERMSAR 2017, Warsaw, May 16-18, 2017
Conclusions
• Thermofluid dynamic simulations were carried out on the hydrogen recombination tests HR3, HR12 and
HR5 of the OECD/NEA THAI project with modified reactingFoam solver to simulate PAR functions.
• Results of the simulations agreed well with the experimental results. Therefore, the analysis showed the
effectiveness of the present simulation technique.
• Further improvement of the simulation technique are needed to achieve high accuracy and reliability of the
PAR performance simulation in the containment vessel and reactor building.
14