Status of Capital Adequacy - mizuho-fg.com · Status of Capital Adequacy Capital Adequacy Ratio...
76
Status of Capital Adequacy 255 Capital Adequacy Ratio Highlights 255 Capital adequacy ratio 257 Risk weighted assets 258 Status of Mizuho Financial Group’s Consolidated Capital Adequacy 258 Scope of consolidation 260 Composition of capital 275 Risk-based capital 278 Credit risk 294 Methods for credit risk mitigation 296 Counterparty risk in derivatives transactions and long-settlement transactions 298 Securitization exposure 314 Market risk 315 Operational risk 315 Equity exposure in banking book 318 Composition of Leverage Ratio 319 Indicators for assessing Global Systemically Important Banks (G-SIBs) 321 Status of Sound Management of Liquidity Risk 321 Liquidity Coverage Ratio 323 Status of Major Liquid Assets 323 Status of Major Funding 324 Compensation of directors, corporate auditors and employees 254
Transcript of Status of Capital Adequacy - mizuho-fg.com · Status of Capital Adequacy Capital Adequacy Ratio...

2017/09/06 9:42:26 / 17322939_株式会社みずほフィナンシャルグループ_総会その他(C)
Status of Capital Adequacy
255 Capital Adequacy Ratio Highlights
255 Capital adequacy ratio
257 Risk weighted assets
258 Status of Mizuho Financial Group’sConsolidated Capital Adequacy
258 Scope of consolidation
260 Composition of capital
275 Risk-based capital
278 Credit risk
294 Methods for credit risk mitigation
296 Counterparty risk in derivatives transactionsand long-settlement transactions
298 Securitization exposure
314 Market risk
315 Operational risk
315 Equity exposure in banking book
318 Composition of Leverage Ratio
319 Indicators for assessing Global SystemicallyImportant Banks (G-SIBs)
321 Status of Sound Management of Liquidity Risk
321 Liquidity Coverage Ratio
323 Status of Major Liquid Assets
323 Status of Major Funding
324 Compensation of directors,corporate auditors and employees
254
Status of Capital Adequacy
Status of Capital AdequacyCapital Adequacy Ratio Highlights
2017/09/06 9:42:26 / 17322939_株式会社みずほフィナンシャルグループ_総会その他(C)
The Basel Framework, based on the "International Convergence of Capital Measurement and Capital Standards: A Revised Framework" issued by the Basel Committee on Banking Supervision, requires the disclosure of capital adequacy information to ensure the enhanced effectiveness of market discipline. Our disclosure is made under the "Matters Separately Prescribed by the Commissioner of the Financial Services Agency Regarding Capital Adequacy Conditions, etc. pursuant to Article 19-2, Paragraph 1, Item 5, Subitem (d), etc. of the Ordinance for Enforcement of the Banking Law (Ministry of Finance Ordinance No. 10 of 1982)" (the FSA Notice No. 7 of 2014, etc.). With respect to the calculation of capital adequacy ratio, we have applied the international standard and adopted (a) the advanced internal ratings-based approach as a method to calculate the amount of credit risk weighted assets and (b) the advanced measurement approach as a method to calculate the amount equivalent to the operational risk.
■ Capital adequacy ratio(1) Summary of capital adequacy ratioMizuho Financial Group (Consolidated) (Billions of yen)
As of March 31, 2017 As of March 31, 2016Total capital ratio 16.28% 15.41%(International standard)
Tier 1 capital ratio 13.30% 12.64%Common equity Tier 1 capital ratio 11.34% 10.50%
Total capital ¥10,050.9 ¥9,638.6Tier 1 capital 8,211.5 7,905.0Common equity Tier 1 capital 7,001.6 6,566.4Risk weighted assets ¥61,717.1 ¥62,531.1Credit risk 56,060.0 57,588.4Market risk 2,282.8 1,696.0Operational risk 3,374.2 3,246.6
Mizuho Bank (Consolidated) (Billions of yen)As of March 31, 2017 As of March 31, 2016
Total capital ratio 16.20% 15.46%(International standard)
Tier 1 capital ratio 13.34% 12.75%Common equity Tier 1 capital ratio 11.16% 10.81%
Total capital ¥9,148.5 ¥8,780.2Tier 1 capital 7,535.7 7,243.6Common equity Tier 1 capital 6,304.0 6,142.2Risk weighted assets ¥56,461.7 ¥56,771.0Credit risk 52,656.4 53,581.0Market risk 1,334.2 1,027.0Operational risk 2,471.0 2,162.9
Mizuho Bank (Non-Consolidated) (Billions of yen)As of March 31, 2017 As of March 31, 2016
Total capital ratio 16.53% 15.50%(International standard)
Tier 1 capital ratio 13.53% 12.66%Common equity Tier 1 capital ratio 11.20% 10.65%
Total capital ¥8,938.2 ¥8,576.3Tier 1 capital 7,316.2 7,004.0Common equity Tier 1 capital 6,057.2 5,892.2Risk weighted assets ¥54,052.6 ¥55,306.1Credit risk 51,130.0 52,392.1Market risk 876.4 1,017.8Operational risk 2,046.2 1,896.1
255
Capital adequacy ratio
2017/09/06 9:42:26 / 17322939_株式会社みずほフィナンシャルグループ_総会その他(C)
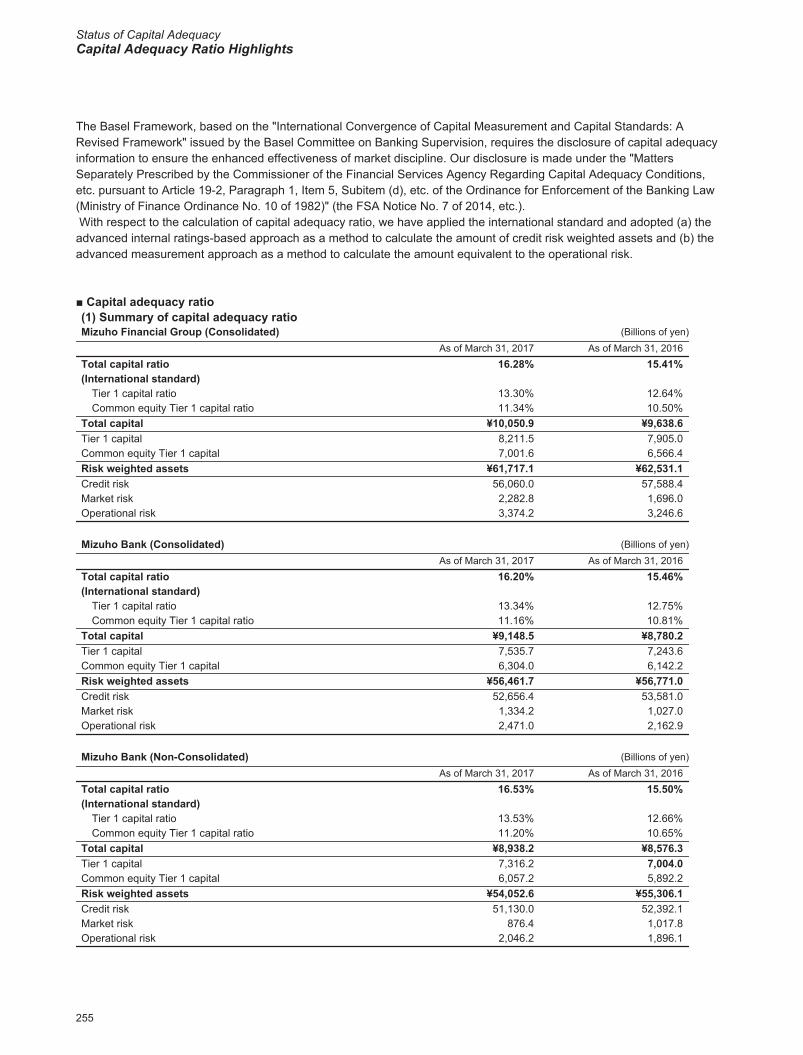
Mizuho Trust & Banking (Consolidated) (Billions of yen)As of March 31, 2017 As of March 31, 2016
Total capital ratio 19.47% 19.52%(International standard)
Tier 1 capital ratio 18.73% 18.21%Common equity Tier 1 capital ratio 18.73% 18.21%
Total capital ¥484.9 ¥472.1Tier 1 capital 466.4 440.4Common equity Tier 1 capital 466.4 440.4Risk weighted assets ¥2,489.5 ¥2,418.1Credit risk 2,211.2 2,141.9Market risk 16.7 15.1Operational risk 261.4 261.0
Mizuho Trust & Banking (Non-consolidated) (Billions of yen)As of March 31, 2017 As of March 31, 2016
Total capital ratio 19.70% 19.80%(International standard)
Tier 1 capital ratio 18.98% 18.52%Common equity Tier 1 capital ratio 18.98% 18.52%
Total capital ¥492.6 ¥479.5Tier 1 capital 474.5 448.4Common equity Tier 1 capital 474.5 448.4Risk weighted assets ¥2,500.1 ¥2,421.0Credit risk 2,261.4 2,192.2Market risk 14.5 12.0Operational risk 224.0 216.7
256
Capital adequacy ratio
Status of Capital AdequacyCapital Adequacy Ratio Highlights
2017/09/06 9:42:26 / 17322939_株式会社みずほフィナンシャルグループ_総会その他(C)
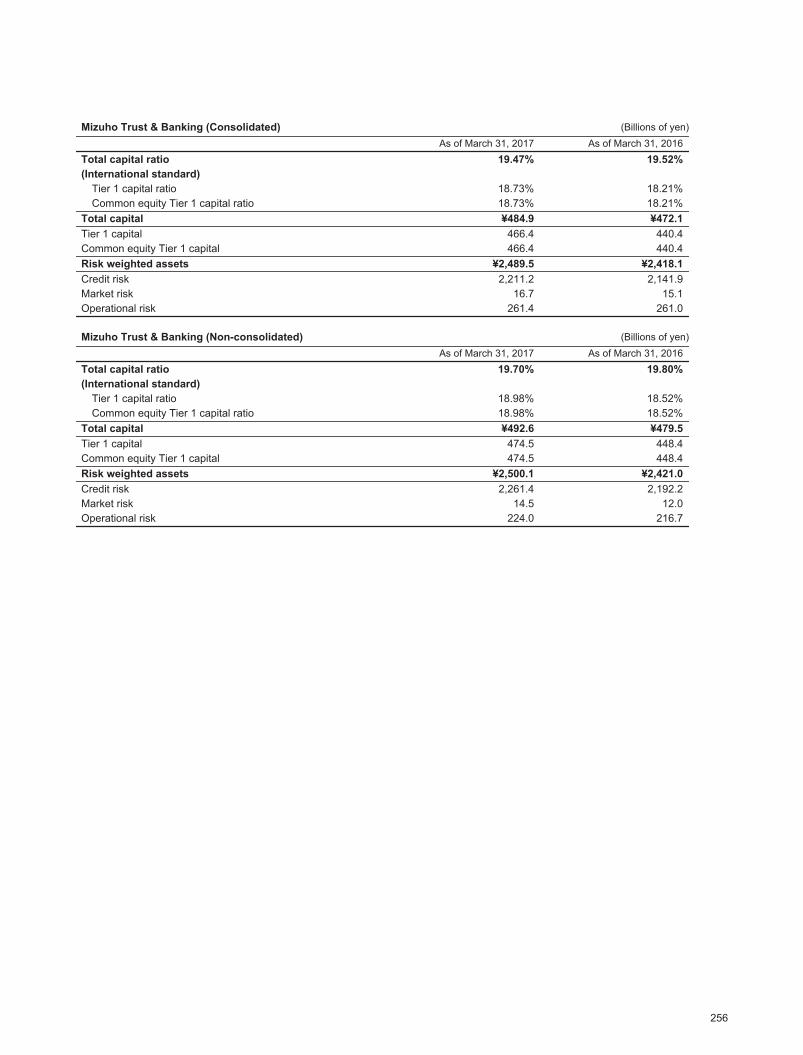
■ Risk weighted assets(1) Credit risk weighted assets by asset class and ratings segmentMizuho Financial Group (Consolidated) (Billions of yen)
As of March 31, 2017 As of March 31, 2016
EAD
Credit riskweighted
assetsRisk
Weight(%) EAD
Credit riskweighted
assetsRisk
Weight(%)Internal ratings-based approach ¥189,852.0 ¥50,084.2 ¥26.38 ¥190,100.2 ¥50,922.7 ¥26.78
Corporate, etc. 164,623.5 31,312.3 19.02 164,945.4 32,874.3 19.93Corporate (except specialized lending) 78,222.1 28,727.3 36.72 77,953.6 29,559.7 37.91
Ratings A1-B2 55,538.0 14,486.4 26.08 54,868.1 14,961.2 27.26Ratings C1-D3 20,306.6 12,002.9 59.10 20,947.9 12,694.1 60.59Ratings E1-E2 1,373.3 1,885.3 137.27 1,179.1 1,575.6 133.62Ratings E2R-H1 1,004.0 352.5 35.11 958.4 328.7 34.29
Sovereign 80,314.2 1,023.3 1.27 79,893.0 1,278.0 1.59Ratings A1-B2 80,165.1 928.3 1.15 79,739.7 1,184.1 1.48Ratings C1-D3 148.6 94.3 63.49 152.6 92.6 60.72Ratings E1-E2 0.3 0.6 164.61 0.6 1.2 186.86Ratings E2R-H1 0.0 0.0 40.50 0.0 0.0 62.73
Bank 5,921.5 1,375.8 23.23 6,923.3 1,817.2 26.24Ratings A1-B2 5,337.6 1,036.1 19.41 6,198.3 1,369.0 22.08Ratings C1-D3 582.4 339.2 58.25 718.6 437.6 60.90Ratings E1-E2 0.0 0.0 184.04 4.4 9.9 225.53Ratings E2R-H1 1.4 0.4 29.54 1.9 0.5 30.21
Specialized lending 165.6 185.8 112.16 175.2 219.2 125.09Retail 12,235.5 4,541.9 37.12 12,942.5 4,767.1 36.83
Residential mortgage 9,388.0 3,096.3 32.98 9,855.1 3,164.6 32.11Qualifying revolving loan 629.2 415.6 66.05 562.9 362.7 64.44Other retail 2,218.2 1,029.9 46.42 2,524.5 1,239.6 49.10
Equities 4,973.3 8,642.9 173.78 4,460.7 7,347.2 164.70PD/LGD approach 4,180.1 6,068.0 145.16 3,901.2 5,524.7 141.61Market-based approach 793.1 2,574.9 324.64 559.4 1,822.4 325.76
Regarded-method exposure 1,744.0 3,341.4 191.58 1,750.8 3,887.1 222.02Securitizations 4,009.5 328.9 8.20 3,803.3 291.1 7.65Others 2,265.9 1,916.6 84.58 2,197.4 1,755.6 79.89
Standardized approach ¥17,523.9 ¥3,508.0 ¥20.01 ¥10,840.7 ¥3,628.0 ¥33.46CVA risk n.a. ¥2,272.3 n.a. n.a. ¥2,823.3 n.a.Central counterparty-related n.a. ¥195.4 n.a. n.a. ¥214.4 n.a.Total ¥207,375.9 ¥56,060.0 ¥27.03 ¥200,940.9 ¥57,588.4 ¥28.65
Notes: 1. "Corporate" does not include specialized lending exposure under supervisory slotting criteria.2. "Specialized lending" is specialized lending exposure under supervisory slotting criteria.
<Analysis>Risk assets decreased due to changes in the EAD calculation method for derivative transactions.
257
Capital adequacy ratio
Status of Capital AdequacyStatus of Mizuho Financial Group’s Consolidated Capital Adequacy
2017/09/06 9:42:26 / 17322939_株式会社みずほフィナンシャルグループ_総会その他(C)
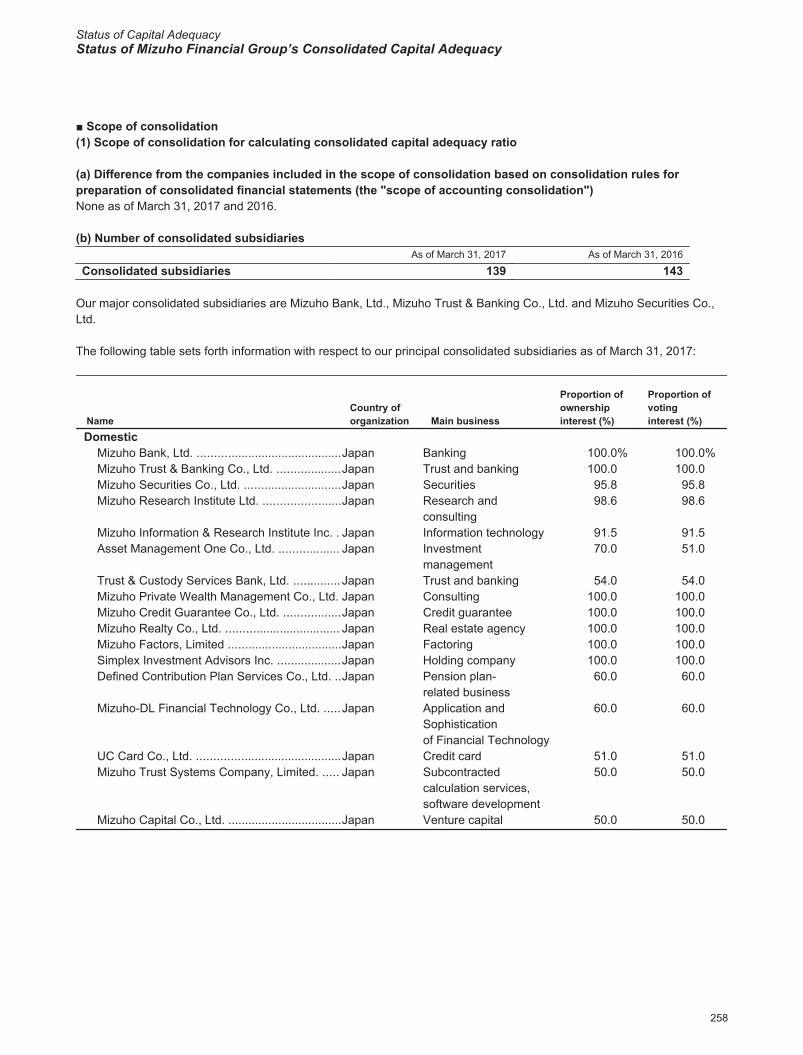
■ Scope of consolidation(1) Scope of consolidation for calculating consolidated capital adequacy ratio
(a) Difference from the companies included in the scope of consolidation based on consolidation rules for preparation of consolidated financial statements (the "scope of accounting consolidation")None as of March 31, 2017 and 2016.
(b) Number of consolidated subsidiariesAs of March 31, 2017 As of March 31, 2016
Consolidated subsidiaries 139 143
Our major consolidated subsidiaries are Mizuho Bank, Ltd., Mizuho Trust & Banking Co., Ltd. and Mizuho Securities Co., Ltd.
The following table sets forth information with respect to our principal consolidated subsidiaries as of March 31, 2017:
NameCountry oforganization Main business
Proportion ofownershipinterest (%)
Proportion ofvotinginterest (%)
DomesticMizuho Bank, Ltd. ...........................................Japan Banking 100.0% 100.0%Mizuho Trust & Banking Co., Ltd. ...................Japan Trust and banking 100.0 100.0Mizuho Securities Co., Ltd. .............................Japan Securities 95.8 95.8Mizuho Research Institute Ltd. .......................Japan Research and
consulting98.6 98.6
Mizuho Information & Research Institute Inc. . Japan Information technology 91.5 91.5Asset Management One Co., Ltd. .................. Japan Investment
management70.0 51.0
Trust & Custody Services Bank, Ltd. .............. Japan Trust and banking 54.0 54.0Mizuho Private Wealth Management Co., Ltd. Japan Consulting 100.0 100.0Mizuho Credit Guarantee Co., Ltd. .................Japan Credit guarantee 100.0 100.0Mizuho Realty Co., Ltd. .................................. Japan Real estate agency 100.0 100.0Mizuho Factors, Limited ..................................Japan Factoring 100.0 100.0Simplex Investment Advisors Inc. ...................Japan Holding company 100.0 100.0Defined Contribution Plan Services Co., Ltd. ..Japan Pension plan-
related business60.0 60.0
Mizuho-DL Financial Technology Co., Ltd. .....Japan Application and Sophisticationof Financial Technology
60.0 60.0
UC Card Co., Ltd. ...........................................Japan Credit card 51.0 51.0Mizuho Trust Systems Company, Limited. ..... Japan Subcontracted
calculation services, software development
50.0 50.0
Mizuho Capital Co., Ltd. ..................................Japan Venture capital 50.0 50.0
258
Scope of consolidation
Status of Capital AdequacyStatus of Mizuho Financial Group’s Consolidated Capital Adequacy
2017/09/06 9:42:26 / 17322939_株式会社みずほフィナンシャルグループ_総会その他(C)
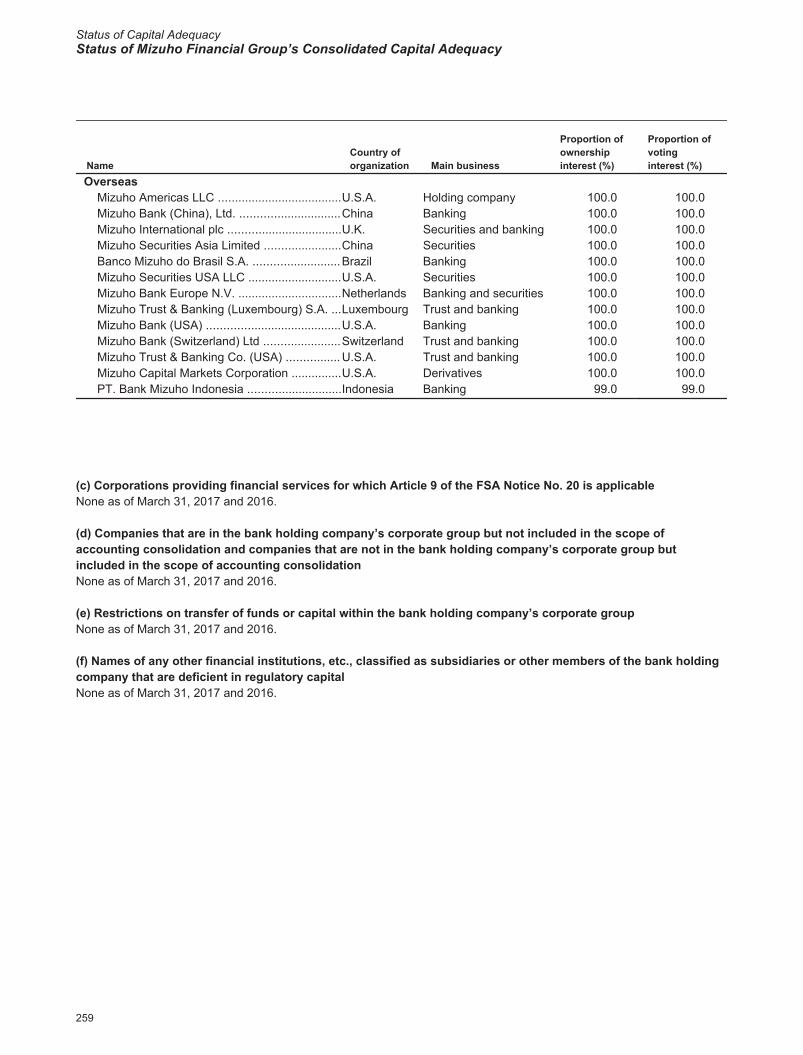
NameCountry oforganization Main business
Proportion ofownershipinterest (%)
Proportion ofvotinginterest (%)
OverseasMizuho Americas LLC .....................................U.S.A. Holding company 100.0 100.0Mizuho Bank (China), Ltd. ..............................China Banking 100.0 100.0Mizuho International plc ..................................U.K. Securities and banking 100.0 100.0Mizuho Securities Asia Limited .......................China Securities 100.0 100.0Banco Mizuho do Brasil S.A. ..........................Brazil Banking 100.0 100.0Mizuho Securities USA LLC ............................U.S.A. Securities 100.0 100.0Mizuho Bank Europe N.V. ...............................Netherlands Banking and securities 100.0 100.0Mizuho Trust & Banking (Luxembourg) S.A. ...Luxembourg Trust and banking 100.0 100.0Mizuho Bank (USA) ........................................U.S.A. Banking 100.0 100.0Mizuho Bank (Switzerland) Ltd .......................Switzerland Trust and banking 100.0 100.0Mizuho Trust & Banking Co. (USA) ................ U.S.A. Trust and banking 100.0 100.0Mizuho Capital Markets Corporation ...............U.S.A. Derivatives 100.0 100.0PT. Bank Mizuho Indonesia ............................Indonesia Banking 99.0 99.0
(c) Corporations providing financial services for which Article 9 of the FSA Notice No. 20 is applicableNone as of March 31, 2017 and 2016.
(d) Companies that are in the bank holding company’s corporate group but not included in the scope of accounting consolidation and companies that are not in the bank holding company’s corporate group but included in the scope of accounting consolidationNone as of March 31, 2017 and 2016.
(e) Restrictions on transfer of funds or capital within the bank holding company’s corporate groupNone as of March 31, 2017 and 2016.
(f) Names of any other financial institutions, etc., classified as subsidiaries or other members of the bank holding company that are deficient in regulatory capitalNone as of March 31, 2017 and 2016.
259
Scope of consolidation
2017/09/06 9:42:26 / 17322939_株式会社みずほフィナンシャルグループ_総会その他(C)
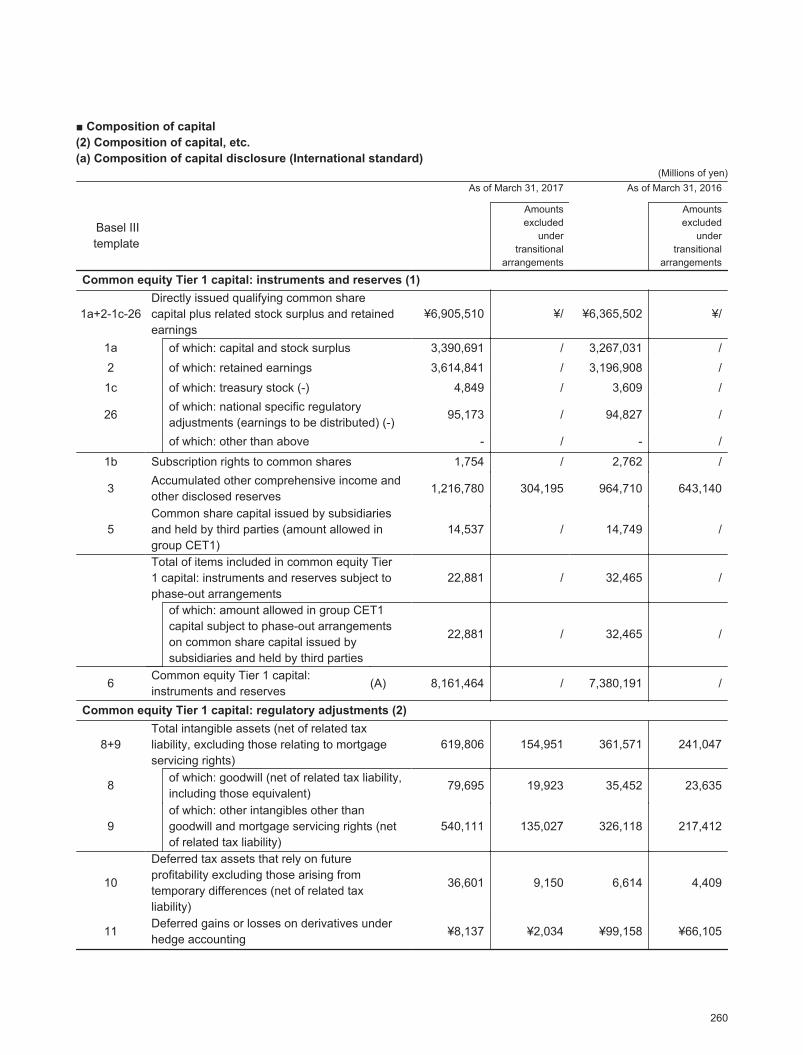
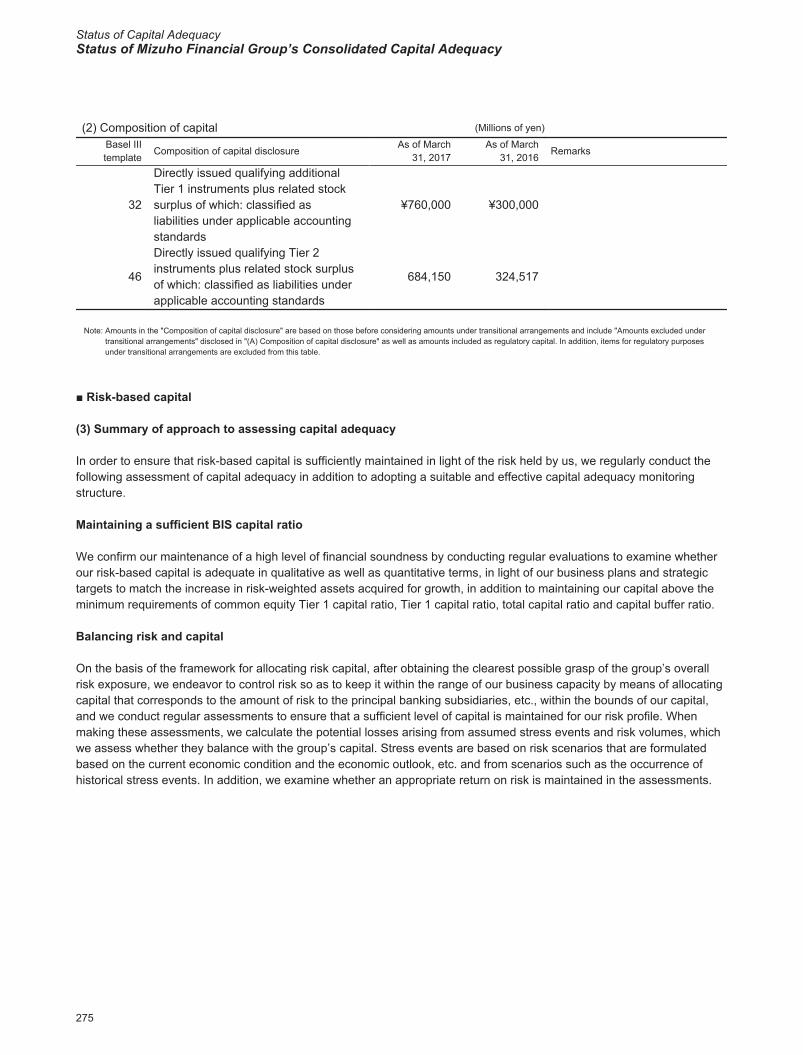
■ Composition of capital (2) Composition of capital, etc.(a) Composition of capital disclosure (International standard)
(Millions of yen)As of March 31, 2017 As of March 31, 2016
Basel IIItemplate
Amountsexcluded
undertransitional
arrangements
Amountsexcluded
undertransitional
arrangements
Common equity Tier 1 capital: instruments and reserves (1)
1a+2-1c-26Directly issued qualifying common share capital plus related stock surplus and retained earnings
¥6,905,510 ¥/ ¥6,365,502 ¥/
1a of which: capital and stock surplus 3,390,691 / 3,267,031 /2 of which: retained earnings 3,614,841 / 3,196,908 /
1c of which: treasury stock (-) 4,849 / 3,609 /
26of which: national specific regulatory adjustments (earnings to be distributed) (-)
95,173 / 94,827 /
of which: other than above - / - /
1b Subscription rights to common shares 1,754 / 2,762 /
3Accumulated other comprehensive income and other disclosed reserves
1,216,780 304,195 964,710 643,140
5Common share capital issued by subsidiaries and held by third parties (amount allowed in group CET1)
14,537 / 14,749 /
Total of items included in common equity Tier 1 capital: instruments and reserves subject to phase-out arrangements
22,881 / 32,465 /
of which: amount allowed in group CET1 capital subject to phase-out arrangements on common share capital issued by subsidiaries and held by third parties
22,881 / 32,465 /
6Common equity Tier 1 capital: instruments and reserves
(A) 8,161,464 / 7,380,191 /
Common equity Tier 1 capital: regulatory adjustments (2)
8+9Total intangible assets (net of related tax liability, excluding those relating to mortgage servicing rights)
619,806 154,951 361,571 241,047
8 of which: goodwill (net of related tax liability, including those equivalent)
79,695 19,923 35,452 23,635
9of which: other intangibles other than goodwill and mortgage servicing rights (net of related tax liability)
540,111 135,027 326,118 217,412
10
Deferred tax assets that rely on future profitability excluding those arising from temporary differences (net of related tax liability)
36,601 9,150 6,614 4,409
11Deferred gains or losses on derivatives under hedge accounting
¥8,137 ¥2,034 ¥99,158 ¥66,105
260
Composition of capital disclosure
Status of Capital AdequacyStatus of Mizuho Financial Group’s Consolidated Capital Adequacy
2017/09/06 9:42:26 / 17322939_株式会社みずほフィナンシャルグループ_総会その他(C)
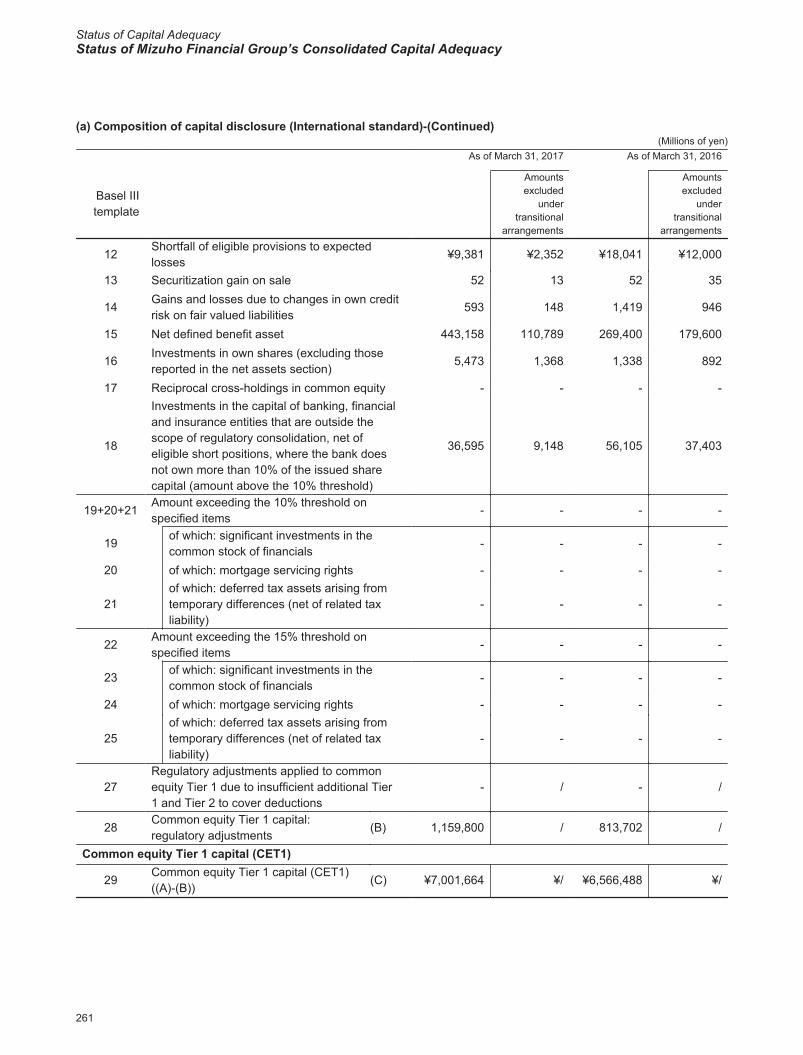
(a) Composition of capital disclosure (International standard)-(Continued)(Millions of yen)
As of March 31, 2017 As of March 31, 2016
Basel IIItemplate
Amountsexcluded
undertransitional
arrangements
Amountsexcluded
undertransitional
arrangements
12Shortfall of eligible provisions to expected losses
¥9,381 ¥2,352 ¥18,041 ¥12,000
13 Securitization gain on sale 52 13 52 35
14Gains and losses due to changes in own credit risk on fair valued liabilities
593 148 1,419 946
15 Net defined benefit asset 443,158 110,789 269,400 179,600
16Investments in own shares (excluding those reported in the net assets section)
5,473 1,368 1,338 892
17 Reciprocal cross-holdings in common equity - - - -
18
Investments in the capital of banking, financial and insurance entities that are outside the scope of regulatory consolidation, net of eligible short positions, where the bank does not own more than 10% of the issued share capital (amount above the 10% threshold)
36,595 9,148 56,105 37,403
19+20+21Amount exceeding the 10% threshold on specified items
- - - -
19 of which: significant investments in the common stock of financials
- - - -
20 of which: mortgage servicing rights - - - -
21of which: deferred tax assets arising from temporary differences (net of related tax liability)
- - - -
22Amount exceeding the 15% threshold on specified items
- - - -
23 of which: significant investments in the common stock of financials
- - - -
24 of which: mortgage servicing rights - - - -
25of which: deferred tax assets arising from temporary differences (net of related tax liability)
- - - -
27Regulatory adjustments applied to common equity Tier 1 due to insufficient additional Tier 1 and Tier 2 to cover deductions
- / - /
28Common equity Tier 1 capital: regulatory adjustments
(B) 1,159,800 / 813,702 /
Common equity Tier 1 capital (CET1)
29Common equity Tier 1 capital (CET1) ((A)-(B))
(C) ¥7,001,664 ¥/ ¥6,566,488 ¥/
261
Composition of capital disclosure
2017/09/06 9:42:26 / 17322939_株式会社みずほフィナンシャルグループ_総会その他(C)
(a) Composition of capital disclosure (International standard)-(Continued)(Millions of yen)
As of March 31, 2017 As of March 31, 2016
Basel IIItemplate
Amountsexcluded
undertransitional
arrangements
Amountsexcluded
undertransitional
arrangements
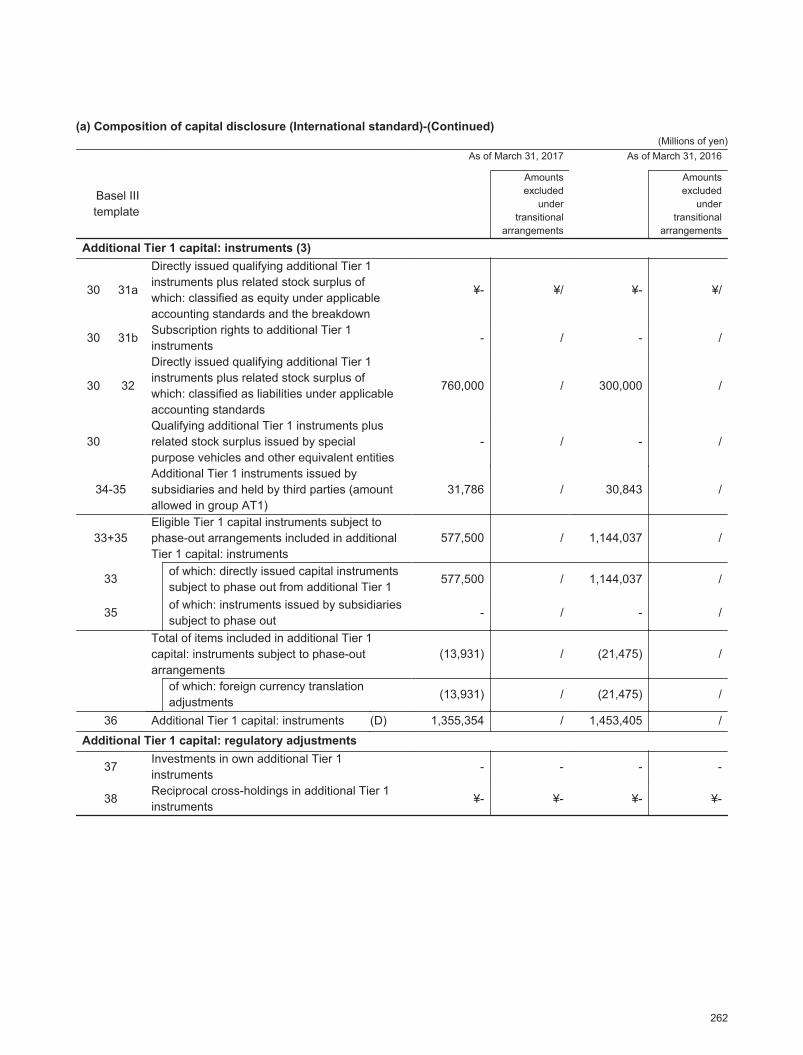
Additional Tier 1 capital: instruments (3)
30 31a
Directly issued qualifying additional Tier 1 instruments plus related stock surplus of which: classified as equity under applicable accounting standards and the breakdown
¥- ¥/ ¥- ¥/
30 31bSubscription rights to additional Tier 1 instruments
- / - /
30 32
Directly issued qualifying additional Tier 1 instruments plus related stock surplus of which: classified as liabilities under applicable accounting standards
760,000 / 300,000 /
30Qualifying additional Tier 1 instruments plus related stock surplus issued by special purpose vehicles and other equivalent entities
- / - /
34-35Additional Tier 1 instruments issued by subsidiaries and held by third parties (amount allowed in group AT1)
31,786 / 30,843 /
33+35Eligible Tier 1 capital instruments subject to phase-out arrangements included in additional Tier 1 capital: instruments
577,500 / 1,144,037 /
33 of which: directly issued capital instruments subject to phase out from additional Tier 1
577,500 / 1,144,037 /
35of which: instruments issued by subsidiaries subject to phase out
- / - /
Total of items included in additional Tier 1 capital: instruments subject to phase-out arrangements
(13,931) / (21,475) /
of which: foreign currency translation adjustments
(13,931) / (21,475) /
36 Additional Tier 1 capital: instruments (D) 1,355,354 / 1,453,405 /
Additional Tier 1 capital: regulatory adjustments
37Investments in own additional Tier 1 instruments
- - - -
38Reciprocal cross-holdings in additional Tier 1 instruments
¥- ¥- ¥- ¥-
262
Composition of capital disclosure
Status of Capital AdequacyStatus of Mizuho Financial Group’s Consolidated Capital Adequacy
2017/09/06 9:42:26 / 17322939_株式会社みずほフィナンシャルグループ_総会その他(C)
(a) Composition of capital disclosure (International standard)-(Continued)(Millions of yen)
As of March 31, 2017 As of March 31, 2016
Basel IIItemplate
Amountsexcluded
undertransitional
arrangements
Amountsexcluded
undertransitional
arrangements
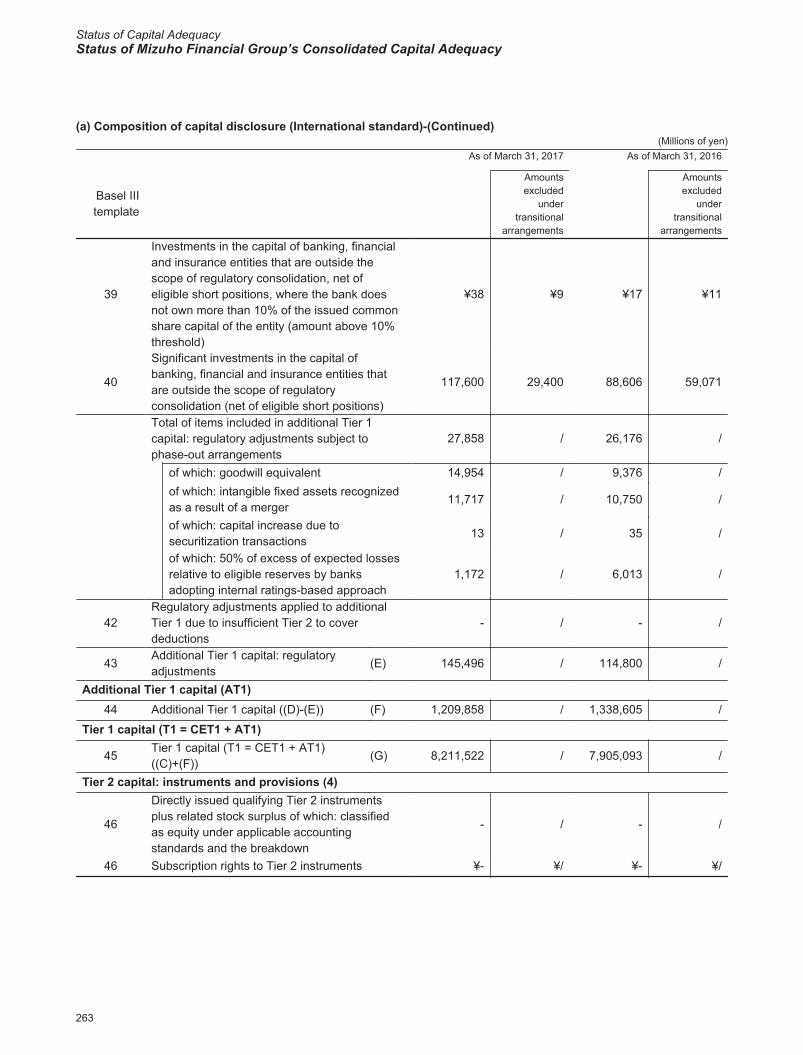
39
Investments in the capital of banking, financial and insurance entities that are outside the scope of regulatory consolidation, net of eligible short positions, where the bank does not own more than 10% of the issued common share capital of the entity (amount above 10% threshold)
¥38 ¥9 ¥17 ¥11
40
Significant investments in the capital of banking, financial and insurance entities that are outside the scope of regulatory consolidation (net of eligible short positions)
117,600 29,400 88,606 59,071
Total of items included in additional Tier 1 capital: regulatory adjustments subject to phase-out arrangements
27,858 / 26,176 /
of which: goodwill equivalent 14,954 / 9,376 /of which: intangible fixed assets recognized as a result of a merger
11,717 / 10,750 /
of which: capital increase due to securitization transactions
13 / 35 /
of which: 50% of excess of expected losses relative to eligible reserves by banks adopting internal ratings-based approach
1,172 / 6,013 /
42Regulatory adjustments applied to additional Tier 1 due to insufficient Tier 2 to cover deductions
- / - /
43Additional Tier 1 capital: regulatory adjustments
(E) 145,496 / 114,800 /
Additional Tier 1 capital (AT1)44 Additional Tier 1 capital ((D)-(E)) (F) 1,209,858 / 1,338,605 /
Tier 1 capital (T1 = CET1 + AT1)
45Tier 1 capital (T1 = CET1 + AT1)((C)+(F))
(G) 8,211,522 / 7,905,093 /
Tier 2 capital: instruments and provisions (4)
46
Directly issued qualifying Tier 2 instruments plus related stock surplus of which: classified as equity under applicable accounting standards and the breakdown
- / - /
46 Subscription rights to Tier 2 instruments ¥- ¥/ ¥- ¥/
263
Composition of capital disclosure
2017/09/06 9:42:26 / 17322939_株式会社みずほフィナンシャルグループ_総会その他(C)
(a) Composition of capital disclosure (International standard)-(Continued)(Millions of yen)
As of March 31, 2017 As of March 31, 2016
Basel IIItemplate
Amountsexcluded
undertransitional
arrangements
Amountsexcluded
undertransitional
arrangements
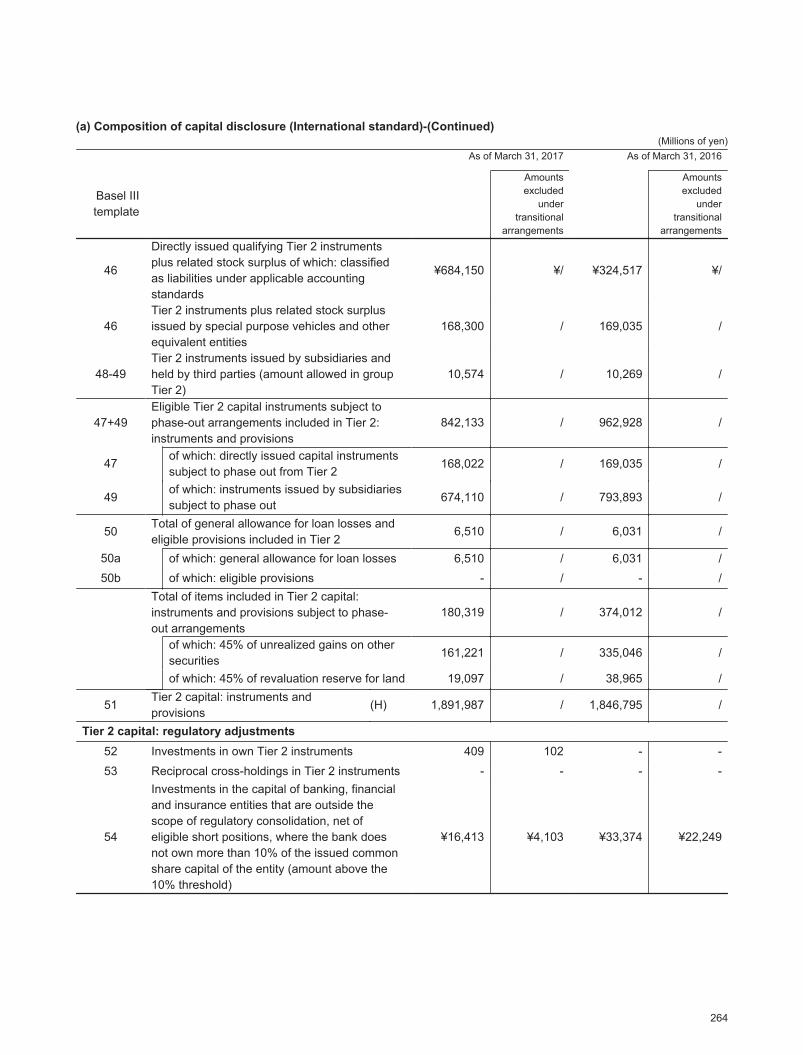
46
Directly issued qualifying Tier 2 instruments plus related stock surplus of which: classified as liabilities under applicable accounting standards
¥684,150 ¥/ ¥324,517 ¥/
46Tier 2 instruments plus related stock surplus issued by special purpose vehicles and other equivalent entities
168,300 / 169,035 /
48-49Tier 2 instruments issued by subsidiaries and held by third parties (amount allowed in group Tier 2)
10,574 / 10,269 /
47+49Eligible Tier 2 capital instruments subject to phase-out arrangements included in Tier 2: instruments and provisions
842,133 / 962,928 /
47 of which: directly issued capital instruments subject to phase out from Tier 2
168,022 / 169,035 /
49of which: instruments issued by subsidiaries subject to phase out
674,110 / 793,893 /
50Total of general allowance for loan losses and eligible provisions included in Tier 2
6,510 / 6,031 /
50a of which: general allowance for loan losses 6,510 / 6,031 /50b of which: eligible provisions - / - /
Total of items included in Tier 2 capital: instruments and provisions subject to phase-out arrangements
180,319 / 374,012 /
of which: 45% of unrealized gains on other securities
161,221 / 335,046 /
of which: 45% of revaluation reserve for land 19,097 / 38,965 /
51Tier 2 capital: instruments and provisions
(H) 1,891,987 / 1,846,795 /
Tier 2 capital: regulatory adjustments52 Investments in own Tier 2 instruments 409 102 - -53 Reciprocal cross-holdings in Tier 2 instruments - - - -
54
Investments in the capital of banking, financial and insurance entities that are outside the scope of regulatory consolidation, net of eligible short positions, where the bank does not own more than 10% of the issued common share capital of the entity (amount above the 10% threshold)
¥16,413 ¥4,103 ¥33,374 ¥22,249
264
Composition of capital disclosure
Status of Capital AdequacyStatus of Mizuho Financial Group’s Consolidated Capital Adequacy
2017/09/06 9:42:26 / 17322939_株式会社みずほフィナンシャルグループ_総会その他(C)
(a) Composition of capital disclosure (International standard)-(Continued)(Millions of yen)
As of March 31, 2017 As of March 31, 2016
Basel IIItemplate
Amountsexcluded
undertransitional
arrangements
Amountsexcluded
undertransitional
arrangements
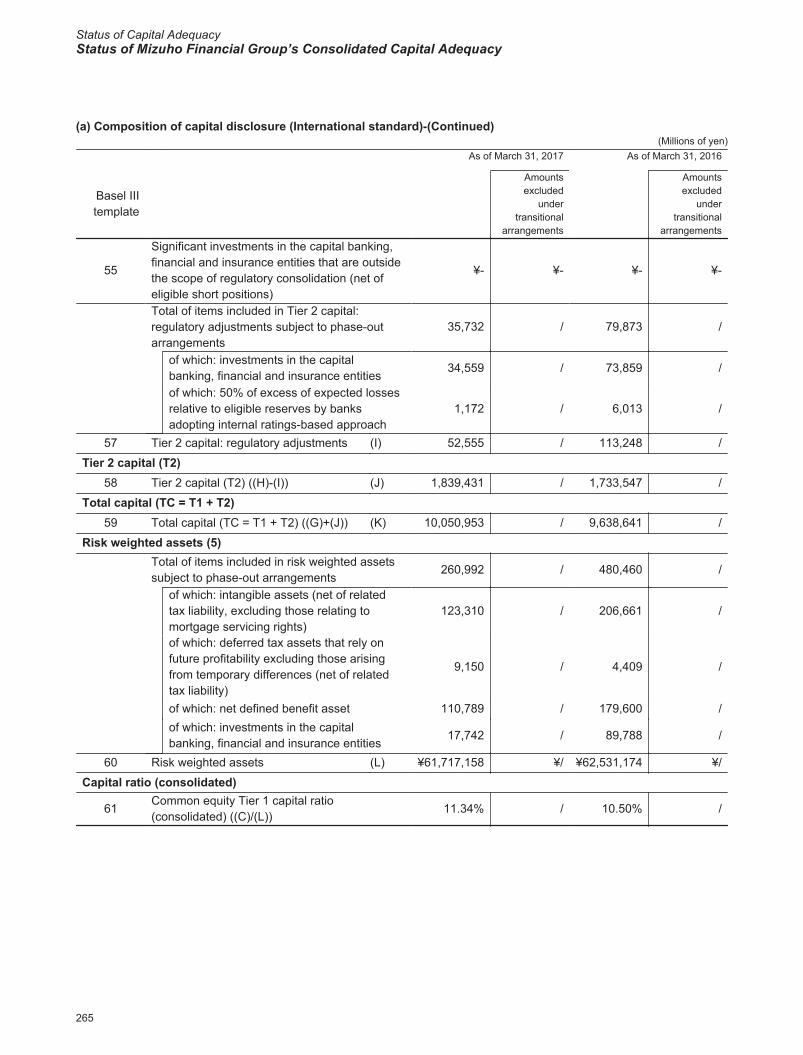
55
Significant investments in the capital banking, financial and insurance entities that are outside the scope of regulatory consolidation (net of eligible short positions)
¥- ¥- ¥- ¥-
Total of items included in Tier 2 capital: regulatory adjustments subject to phase-out arrangements
35,732 / 79,873 /
of which: investments in the capital banking, financial and insurance entities
34,559 / 73,859 /
of which: 50% of excess of expected losses relative to eligible reserves by banks adopting internal ratings-based approach
1,172 / 6,013 /
57 Tier 2 capital: regulatory adjustments (I) 52,555 / 113,248 /
Tier 2 capital (T2)58 Tier 2 capital (T2) ((H)-(I)) (J) 1,839,431 / 1,733,547 /
Total capital (TC = T1 + T2)59 Total capital (TC = T1 + T2) ((G)+(J)) (K) 10,050,953 / 9,638,641 /
Risk weighted assets (5)Total of items included in risk weighted assets subject to phase-out arrangements
260,992 / 480,460 /
of which: intangible assets (net of related tax liability, excluding those relating to mortgage servicing rights)
123,310 / 206,661 /
of which: deferred tax assets that rely on future profitability excluding those arising from temporary differences (net of related tax liability)
9,150 / 4,409 /
of which: net defined benefit asset 110,789 / 179,600 /of which: investments in the capital banking, financial and insurance entities
17,742 / 89,788 /
60 Risk weighted assets (L) ¥61,717,158 ¥/ ¥62,531,174 ¥/
Capital ratio (consolidated)
61Common equity Tier 1 capital ratio (consolidated) ((C)/(L))
11.34% / 10.50% /
265
Composition of capital disclosure
2017/09/06 9:42:26 / 17322939_株式会社みずほフィナンシャルグループ_総会その他(C)
(a) Composition of capital disclosure (International standard)-(Continued)(Millions of yen)
As of March 31, 2017 As of March 31, 2016
Basel IIItemplate
Amountsexcluded
undertransitional
arrangements
Amountsexcluded
undertransitional
arrangements
62 Tier 1 capital ratio (consolidated) ((G)/(L)) 13.30% / 12.64% /63 Total capital ratio (consolidated) ((K)/(L)) 16.28% / 15.41% /
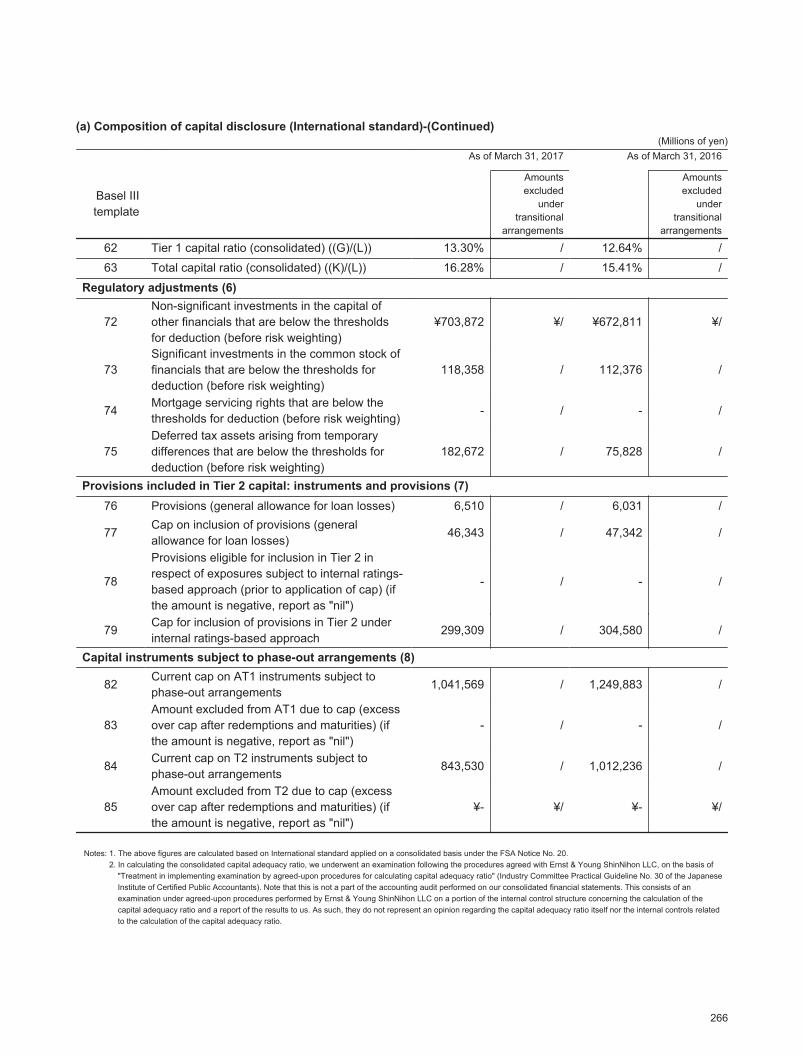
Regulatory adjustments (6)
72Non-significant investments in the capital of other financials that are below the thresholds for deduction (before risk weighting)
¥703,872 ¥/ ¥672,811 ¥/
73Significant investments in the common stock of financials that are below the thresholds for deduction (before risk weighting)
118,358 / 112,376 /
74Mortgage servicing rights that are below the thresholds for deduction (before risk weighting)
- / - /
75Deferred tax assets arising from temporary differences that are below the thresholds for deduction (before risk weighting)
182,672 / 75,828 /
Provisions included in Tier 2 capital: instruments and provisions (7)76 Provisions (general allowance for loan losses) 6,510 / 6,031 /
77Cap on inclusion of provisions (general allowance for loan losses)
46,343 / 47,342 /
78
Provisions eligible for inclusion in Tier 2 in respect of exposures subject to internal ratings-based approach (prior to application of cap) (if the amount is negative, report as "nil")
- / - /
79Cap for inclusion of provisions in Tier 2 under internal ratings-based approach
299,309 / 304,580 /
Capital instruments subject to phase-out arrangements (8)
82Current cap on AT1 instruments subject to phase-out arrangements
1,041,569 / 1,249,883 /
83Amount excluded from AT1 due to cap (excess over cap after redemptions and maturities) (if the amount is negative, report as "nil")
- / - /
84Current cap on T2 instruments subject to phase-out arrangements
843,530 / 1,012,236 /
85Amount excluded from T2 due to cap (excess over cap after redemptions and maturities) (if the amount is negative, report as "nil")
¥- ¥/ ¥- ¥/
Notes: 1. The above figures are calculated based on International standard applied on a consolidated basis under the FSA Notice No. 20.2. In calculating the consolidated capital adequacy ratio, we underwent an examination following the procedures agreed with Ernst & Young ShinNihon LLC, on the basis of
"Treatment in implementing examination by agreed-upon procedures for calculating capital adequacy ratio" (Industry Committee Practical Guideline No. 30 of the Japanese Institute of Certified Public Accountants). Note that this is not a part of the accounting audit performed on our consolidated financial statements. This consists of an examination under agreed-upon procedures performed by Ernst & Young ShinNihon LLC on a portion of the internal control structure concerning the calculation of the capital adequacy ratio and a report of the results to us. As such, they do not represent an opinion regarding the capital adequacy ratio itself nor the internal controls related to the calculation of the capital adequacy ratio.
266
Composition of capital disclosure
Status of Capital AdequacyStatus of Mizuho Financial Group’s Consolidated Capital Adequacy
2017/09/06 9:42:26 / 17322939_株式会社みずほフィナンシャルグループ_総会その他(C)
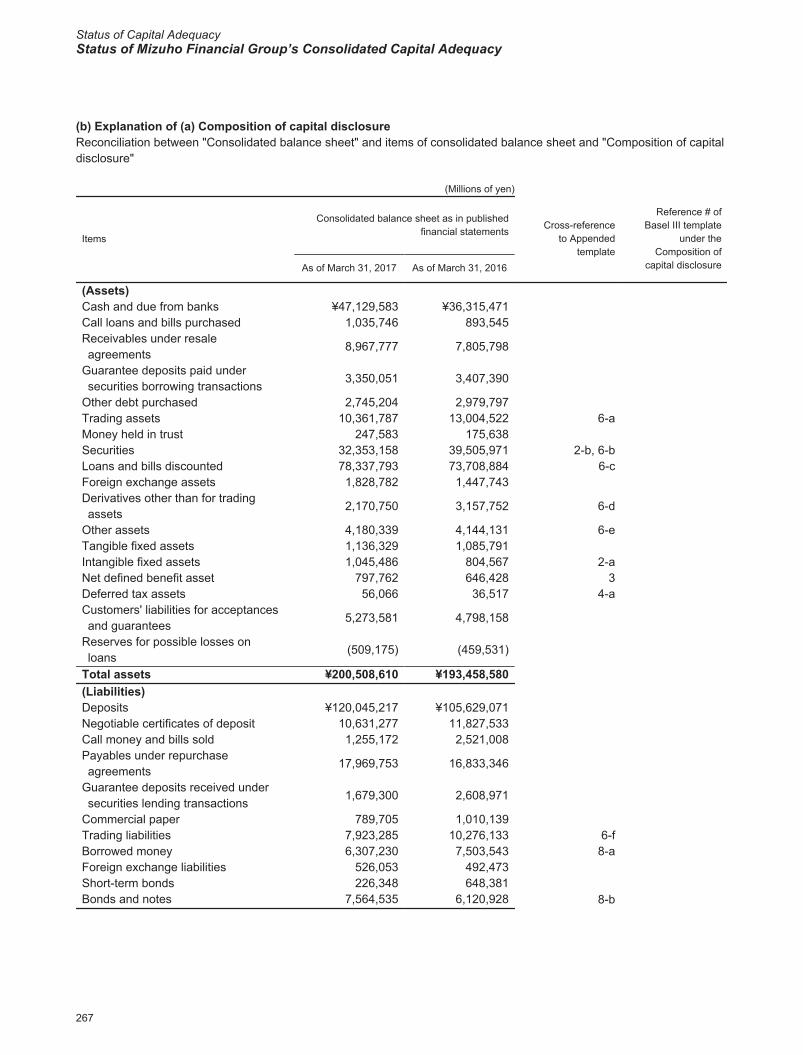
(b) Explanation of (a) Composition of capital disclosureReconciliation between "Consolidated balance sheet" and items of consolidated balance sheet and "Composition of capital disclosure"
(Millions of yen)
Items
Consolidated balance sheet as in publishedfinancial statements Cross-reference
to Appendedtemplate
Reference # ofBasel III template
under theComposition of
capital disclosureAs of March 31, 2017 As of March 31, 2016
(Assets)Cash and due from banks ¥47,129,583 ¥36,315,471Call loans and bills purchased 1,035,746 893,545Receivables under resale agreements
8,967,777 7,805,798
Guarantee deposits paid under securities borrowing transactions
3,350,051 3,407,390
Other debt purchased 2,745,204 2,979,797Trading assets 10,361,787 13,004,522 6-aMoney held in trust 247,583 175,638Securities 32,353,158 39,505,971 2-b, 6-bLoans and bills discounted 78,337,793 73,708,884 6-cForeign exchange assets 1,828,782 1,447,743Derivatives other than for trading assets
2,170,750 3,157,752 6-d
Other assets 4,180,339 4,144,131 6-eTangible fixed assets 1,136,329 1,085,791Intangible fixed assets 1,045,486 804,567 2-aNet defined benefit asset 797,762 646,428 3Deferred tax assets 56,066 36,517 4-aCustomers' liabilities for acceptances and guarantees
5,273,581 4,798,158
Reserves for possible losses on loans
(509,175) (459,531)
Total assets ¥200,508,610 ¥193,458,580(Liabilities)Deposits ¥120,045,217 ¥105,629,071Negotiable certificates of deposit 10,631,277 11,827,533Call money and bills sold 1,255,172 2,521,008Payables under repurchase agreements
17,969,753 16,833,346
Guarantee deposits received under securities lending transactions
1,679,300 2,608,971
Commercial paper 789,705 1,010,139Trading liabilities 7,923,285 10,276,133 6-fBorrowed money 6,307,230 7,503,543 8-aForeign exchange liabilities 526,053 492,473Short-term bonds 226,348 648,381Bonds and notes 7,564,535 6,120,928 8-b
267
Explanation of Composition of capital disclosure
2017/09/06 9:42:26 / 17322939_株式会社みずほフィナンシャルグループ_総会その他(C)
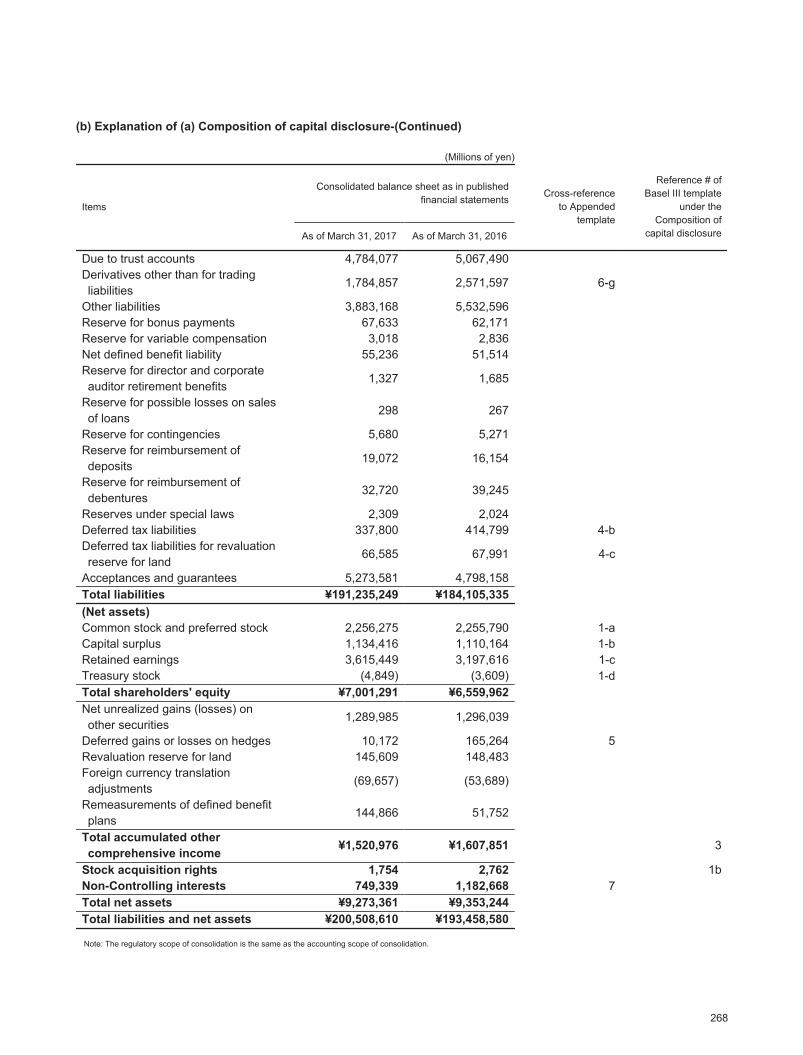
(b) Explanation of (a) Composition of capital disclosure-(Continued)
(Millions of yen)
Items
Consolidated balance sheet as in publishedfinancial statements Cross-reference
to Appendedtemplate
Reference # ofBasel III template
under theComposition of
capital disclosureAs of March 31, 2017 As of March 31, 2016
Due to trust accounts 4,784,077 5,067,490Derivatives other than for trading liabilities
1,784,857 2,571,597 6-g
Other liabilities 3,883,168 5,532,596Reserve for bonus payments 67,633 62,171Reserve for variable compensation 3,018 2,836Net defined benefit liability 55,236 51,514Reserve for director and corporate auditor retirement benefits
1,327 1,685
Reserve for possible losses on sales of loans
298 267
Reserve for contingencies 5,680 5,271Reserve for reimbursement of deposits
19,072 16,154
Reserve for reimbursement of debentures
32,720 39,245
Reserves under special laws 2,309 2,024Deferred tax liabilities 337,800 414,799 4-bDeferred tax liabilities for revaluation reserve for land
66,585 67,991 4-c
Acceptances and guarantees 5,273,581 4,798,158Total liabilities ¥191,235,249 ¥184,105,335(Net assets)Common stock and preferred stock 2,256,275 2,255,790 1-aCapital surplus 1,134,416 1,110,164 1-bRetained earnings 3,615,449 3,197,616 1-cTreasury stock (4,849) (3,609) 1-dTotal shareholders' equity ¥7,001,291 ¥6,559,962Net unrealized gains (losses) on other securities
1,289,985 1,296,039
Deferred gains or losses on hedges 10,172 165,264 5Revaluation reserve for land 145,609 148,483Foreign currency translation adjustments
(69,657) (53,689)
Remeasurements of defined benefit plans
144,866 51,752
Total accumulated other comprehensive income ¥1,520,976 ¥1,607,851 3
Stock acquisition rights 1,754 2,762 1bNon-Controlling interests 749,339 1,182,668 7Total net assets ¥9,273,361 ¥9,353,244Total liabilities and net assets ¥200,508,610 ¥193,458,580
Note: The regulatory scope of consolidation is the same as the accounting scope of consolidation.
268
Explanation of Composition of capital disclosure
Status of Capital AdequacyStatus of Mizuho Financial Group’s Consolidated Capital Adequacy
2017/09/06 9:42:26 / 17322939_株式会社みずほフィナンシャルグループ_総会その他(C)
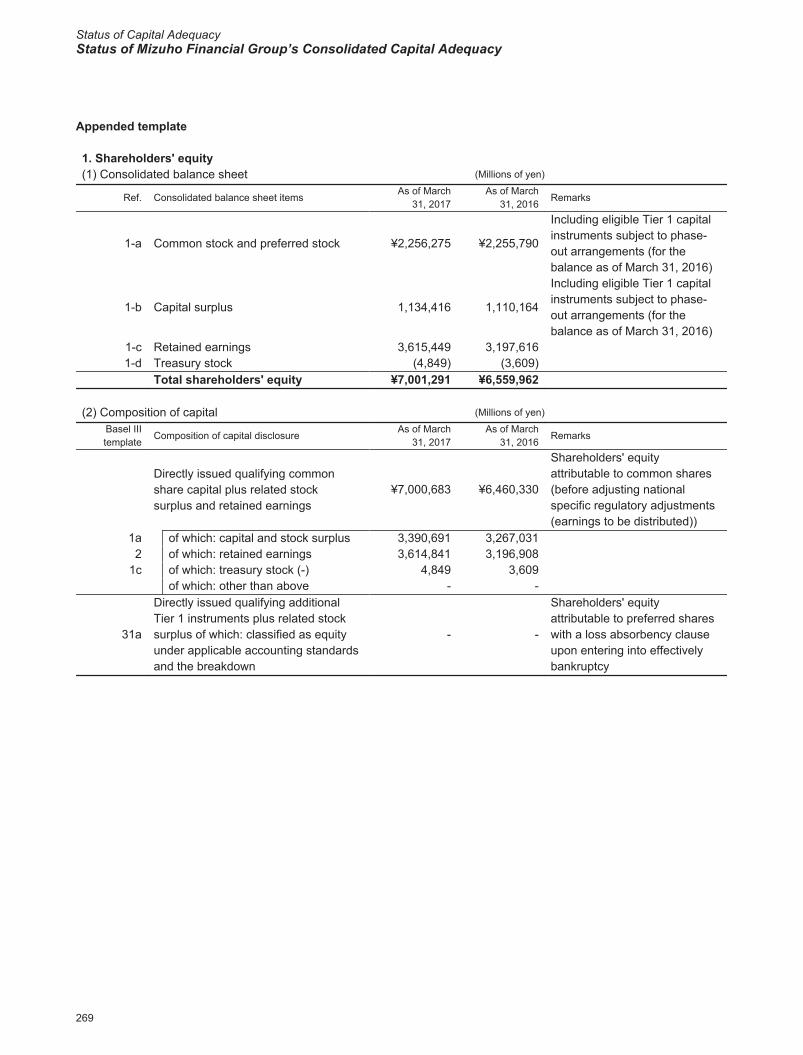
Appended template
1. Shareholders' equity(1) Consolidated balance sheet (Millions of yen)
Ref. Consolidated balance sheet itemsAs of March
31, 2017As of March
31, 2016Remarks
1-a Common stock and preferred stock ¥2,256,275 ¥2,255,790
Including eligible Tier 1 capital instruments subject to phase-out arrangements (for the balance as of March 31, 2016)
1-b Capital surplus 1,134,416 1,110,164
Including eligible Tier 1 capital instruments subject to phase-out arrangements (for the balance as of March 31, 2016)
1-c Retained earnings 3,615,449 3,197,6161-d Treasury stock (4,849) (3,609)
Total shareholders' equity ¥7,001,291 ¥6,559,962
(2) Composition of capital (Millions of yen)
Basel IIItemplate
Composition of capital disclosureAs of March
31, 2017As of March
31, 2016Remarks
Directly issued qualifying common share capital plus related stock surplus and retained earnings
¥7,000,683 ¥6,460,330
Shareholders' equity attributable to common shares (before adjusting national specific regulatory adjustments (earnings to be distributed))
1a of which: capital and stock surplus 3,390,691 3,267,0312 of which: retained earnings 3,614,841 3,196,908
1c of which: treasury stock (-) 4,849 3,609of which: other than above - -
31a
Directly issued qualifying additional Tier 1 instruments plus related stock surplus of which: classified as equity under applicable accounting standards and the breakdown
- -
Shareholders' equity attributable to preferred shares with a loss absorbency clause upon entering into effectively bankruptcy
269
Explanation of Composition of capital disclosure
2017/09/06 9:42:26 / 17322939_株式会社みずほフィナンシャルグループ_総会その他(C)
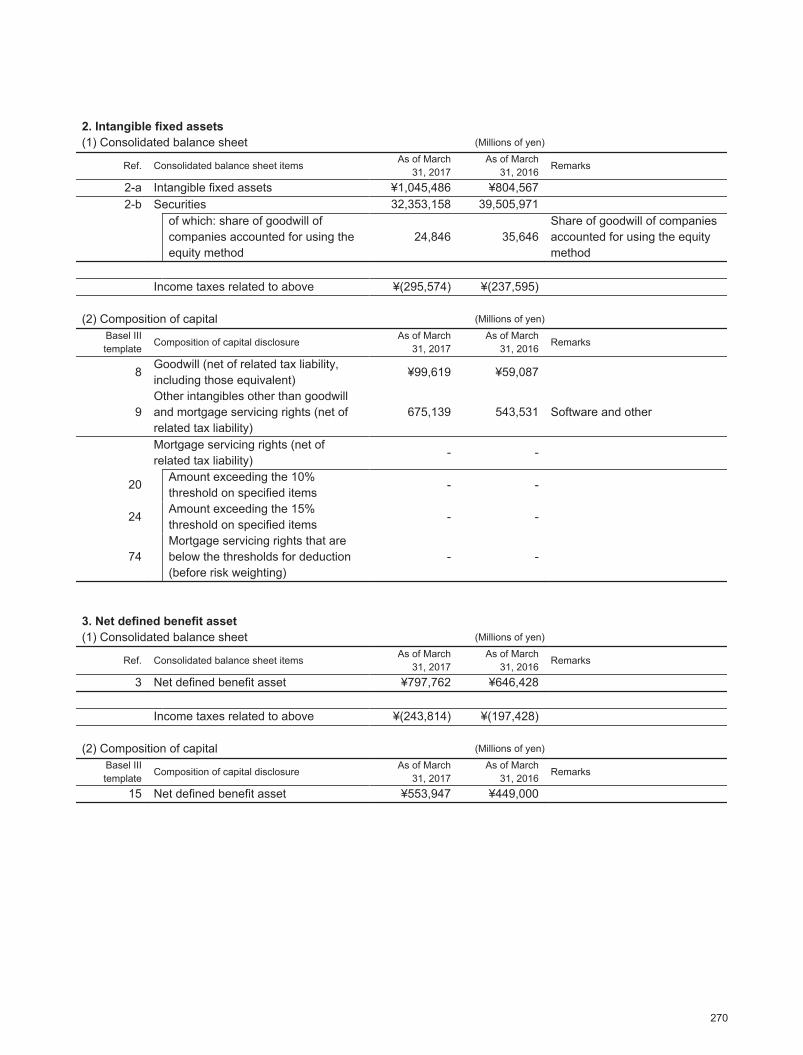
2. Intangible fixed assets(1) Consolidated balance sheet (Millions of yen)
Ref. Consolidated balance sheet itemsAs of March
31, 2017As of March
31, 2016Remarks
2-a Intangible fixed assets ¥1,045,486 ¥804,5672-b Securities 32,353,158 39,505,971
of which: share of goodwill of companies accounted for using the equity method
24,846 35,646Share of goodwill of companies accounted for using the equity method
Income taxes related to above ¥(295,574) ¥(237,595)
(2) Composition of capital (Millions of yen)
Basel IIItemplate
Composition of capital disclosureAs of March
31, 2017As of March
31, 2016Remarks
8Goodwill (net of related tax liability, including those equivalent)
¥99,619 ¥59,087
9Other intangibles other than goodwill and mortgage servicing rights (net of related tax liability)
675,139 543,531 Software and other
Mortgage servicing rights (net of related tax liability)
- -
20 Amount exceeding the 10% threshold on specified items
- -
24Amount exceeding the 15% threshold on specified items
- -
74Mortgage servicing rights that are below the thresholds for deduction (before risk weighting)
- -
3. Net defined benefit asset(1) Consolidated balance sheet (Millions of yen)
Ref. Consolidated balance sheet itemsAs of March
31, 2017As of March
31, 2016Remarks
3 Net defined benefit asset ¥797,762 ¥646,428
Income taxes related to above ¥(243,814) ¥(197,428)
(2) Composition of capital (Millions of yen)
Basel IIItemplate
Composition of capital disclosureAs of March
31, 2017As of March
31, 2016Remarks
15 Net defined benefit asset ¥553,947 ¥449,000
270
Explanation of Composition of capital disclosure
Status of Capital AdequacyStatus of Mizuho Financial Group’s Consolidated Capital Adequacy
2017/09/06 9:42:26 / 17322939_株式会社みずほフィナンシャルグループ_総会その他(C)
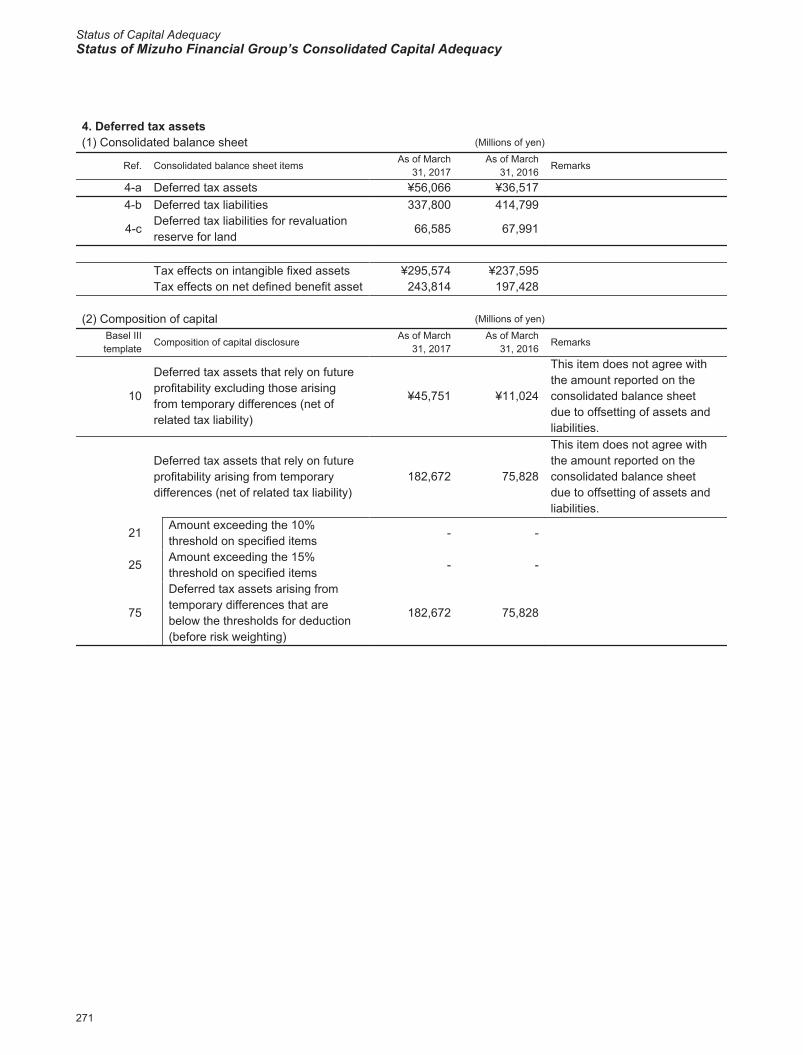
4. Deferred tax assets(1) Consolidated balance sheet (Millions of yen)
Ref. Consolidated balance sheet itemsAs of March
31, 2017As of March
31, 2016Remarks
4-a Deferred tax assets ¥56,066 ¥36,5174-b Deferred tax liabilities 337,800 414,799
4-cDeferred tax liabilities for revaluation reserve for land
66,585 67,991
Tax effects on intangible fixed assets ¥295,574 ¥237,595Tax effects on net defined benefit asset 243,814 197,428
(2) Composition of capital (Millions of yen)
Basel IIItemplate
Composition of capital disclosureAs of March
31, 2017As of March
31, 2016Remarks
10
Deferred tax assets that rely on future profitability excluding those arising from temporary differences (net of related tax liability)
¥45,751 ¥11,024
This item does not agree with the amount reported on the consolidated balance sheet due to offsetting of assets and liabilities.
Deferred tax assets that rely on future profitability arising from temporary differences (net of related tax liability)
182,672 75,828
This item does not agree with the amount reported on the consolidated balance sheet due to offsetting of assets and liabilities.
21 Amount exceeding the 10% threshold on specified items
- -
25Amount exceeding the 15% threshold on specified items
- -
75
Deferred tax assets arising from temporary differences that are below the thresholds for deduction (before risk weighting)
182,672 75,828
271
Explanation of Composition of capital disclosure

2017/09/06 9:42:26 / 17322939_株式会社みずほフィナンシャルグループ_総会その他(C)
5. Deferred gains or losses on derivatives under hedge accounting(1) Consolidated balance sheet (Millions of yen)
Ref. Consolidated balance sheet itemsAs of March
31, 2017As of March
31, 2016Remarks
5 Deferred gains or losses on hedges ¥10,172 ¥165,264
(2) Composition of capital (Millions of yen)
Basel IIItemplate
Composition of capital disclosureAs of March
31, 2017As of March
31, 2016Remarks
11Deferred gains or losses on derivatives under hedge accounting
¥10,172 ¥165,264
6. Items associated with investments in the capital of financial institutions(1) Consolidated balance sheet (Millions of yen)
Ref. Consolidated balance sheet itemsAs of March
31, 2017As of March
31, 2016Remarks
6-a Trading assets ¥10,361,787 ¥13,004,522Including trading account securities and derivatives for trading assets
6-b Securities 32,353,158 39,505,9716-c Loans and bills discounted 78,337,793 73,708,884 Including subordinated loans
6-dDerivatives other than for trading assets
2,170,750 3,157,752
6-e Other assets 4,180,339 4,144,131 Including money invested
6-f Trading liabilities 7,923,285 10,276,133Including trading account securities sold
6-gDerivatives other than for trading liabilities
1,784,857 2,571,597
272
Explanation of Composition of capital disclosure
Status of Capital AdequacyStatus of Mizuho Financial Group’s Consolidated Capital Adequacy
2017/09/06 9:42:26 / 17322939_株式会社みずほフィナンシャルグループ_総会その他(C)
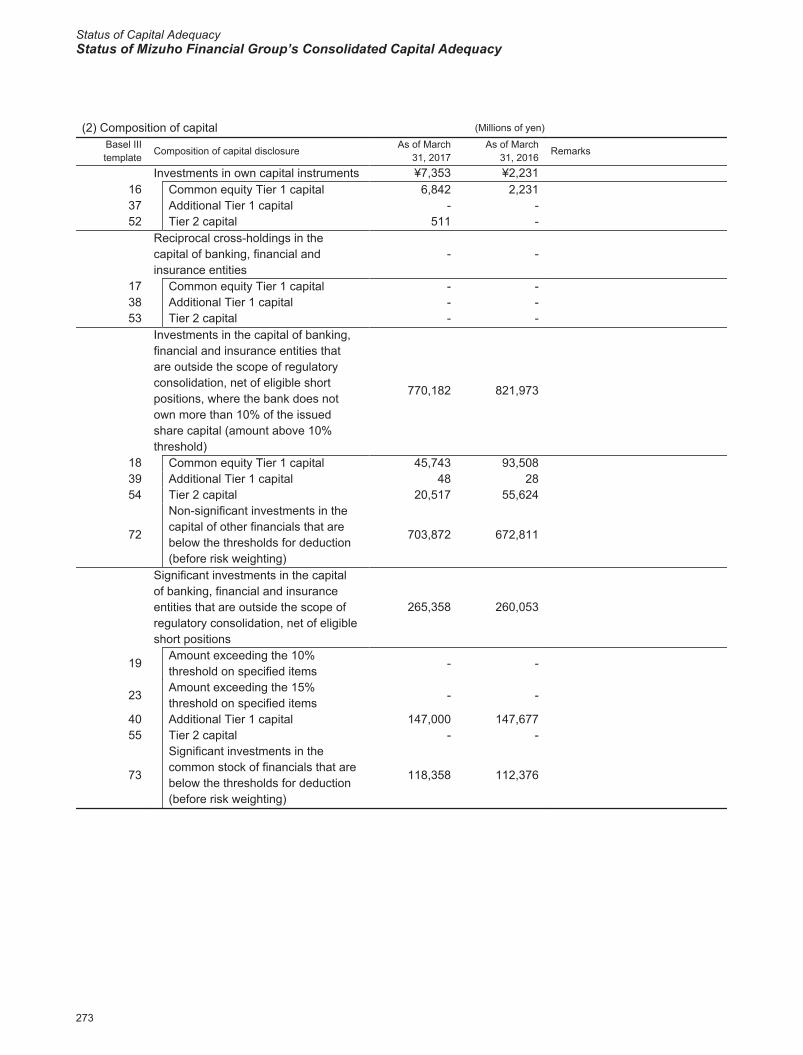
(2) Composition of capital (Millions of yen)
Basel IIItemplate
Composition of capital disclosureAs of March
31, 2017As of March
31, 2016Remarks
Investments in own capital instruments ¥7,353 ¥2,23116 Common equity Tier 1 capital 6,842 2,23137 Additional Tier 1 capital - -52 Tier 2 capital 511 -
Reciprocal cross-holdings in the capital of banking, financial and insurance entities
- -
17 Common equity Tier 1 capital - -38 Additional Tier 1 capital - -53 Tier 2 capital - -
Investments in the capital of banking, financial and insurance entities that are outside the scope of regulatory consolidation, net of eligible short positions, where the bank does not own more than 10% of the issued share capital (amount above 10% threshold)
770,182 821,973
18 Common equity Tier 1 capital 45,743 93,50839 Additional Tier 1 capital 48 2854 Tier 2 capital 20,517 55,624
72
Non-significant investments in the capital of other financials that are below the thresholds for deduction (before risk weighting)
703,872 672,811
Significant investments in the capital of banking, financial and insurance entities that are outside the scope of regulatory consolidation, net of eligible short positions
265,358 260,053
19 Amount exceeding the 10% threshold on specified items
- -
23Amount exceeding the 15% threshold on specified items
- -
40 Additional Tier 1 capital 147,000 147,67755 Tier 2 capital - -
73
Significant investments in the common stock of financials that are below the thresholds for deduction (before risk weighting)
118,358 112,376
273
Explanation of Composition of capital disclosure
2017/09/06 9:42:26 / 17322939_株式会社みずほフィナンシャルグループ_総会その他(C)
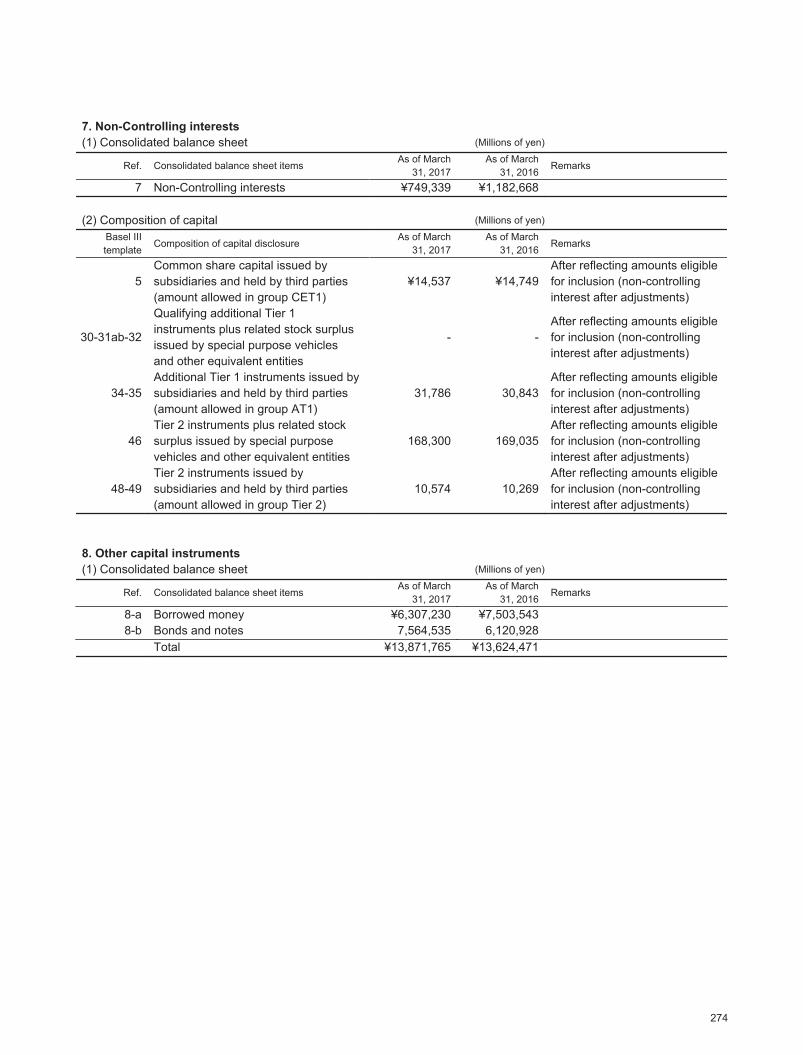
7. Non-Controlling interests(1) Consolidated balance sheet (Millions of yen)
Ref. Consolidated balance sheet itemsAs of March
31, 2017As of March
31, 2016Remarks
7 Non-Controlling interests ¥749,339 ¥1,182,668
(2) Composition of capital (Millions of yen)
Basel IIItemplate
Composition of capital disclosureAs of March
31, 2017As of March
31, 2016Remarks
5Common share capital issued by subsidiaries and held by third parties (amount allowed in group CET1)
¥14,537 ¥14,749After reflecting amounts eligible for inclusion (non-controlling interest after adjustments)
30-31ab-32
Qualifying additional Tier 1 instruments plus related stock surplus issued by special purpose vehicles and other equivalent entities
- -After reflecting amounts eligible for inclusion (non-controlling interest after adjustments)
34-35Additional Tier 1 instruments issued by subsidiaries and held by third parties (amount allowed in group AT1)
31,786 30,843After reflecting amounts eligible for inclusion (non-controlling interest after adjustments)
46Tier 2 instruments plus related stock surplus issued by special purpose vehicles and other equivalent entities
168,300 169,035After reflecting amounts eligible for inclusion (non-controlling interest after adjustments)
48-49Tier 2 instruments issued by subsidiaries and held by third parties (amount allowed in group Tier 2)
10,574 10,269After reflecting amounts eligible for inclusion (non-controlling interest after adjustments)
8. Other capital instruments(1) Consolidated balance sheet (Millions of yen)
Ref. Consolidated balance sheet itemsAs of March
31, 2017As of March
31, 2016Remarks
8-a Borrowed money ¥6,307,230 ¥7,503,5438-b Bonds and notes 7,564,535 6,120,928
Total ¥13,871,765 ¥13,624,471
274
Explanation of Composition of capital disclosure
Status of Capital AdequacyStatus of Mizuho Financial Group’s Consolidated Capital Adequacy
2017/09/06 9:42:26 / 17322939_株式会社みずほフィナンシャルグループ_総会その他(C)
(2) Composition of capital (Millions of yen)
Basel IIItemplate
Composition of capital disclosureAs of March
31, 2017As of March
31, 2016Remarks
32
Directly issued qualifying additional Tier 1 instruments plus related stock surplus of which: classified as liabilities under applicable accounting standards
¥760,000 ¥300,000
46
Directly issued qualifying Tier 2 instruments plus related stock surplus of which: classified as liabilities under applicable accounting standards
684,150 324,517
Note: Amounts in the "Composition of capital disclosure" are based on those before considering amounts under transitional arrangements and include "Amounts excluded under transitional arrangements" disclosed in "(A) Composition of capital disclosure" as well as amounts included as regulatory capital. In addition, items for regulatory purposes under transitional arrangements are excluded from this table.
■ Risk-based capital
(3) Summary of approach to assessing capital adequacy
In order to ensure that risk-based capital is sufficiently maintained in light of the risk held by us, we regularly conduct the following assessment of capital adequacy in addition to adopting a suitable and effective capital adequacy monitoring structure.
Maintaining a sufficient BIS capital ratio
We confirm our maintenance of a high level of financial soundness by conducting regular evaluations to examine whether our risk-based capital is adequate in qualitative as well as quantitative terms, in light of our business plans and strategic targets to match the increase in risk-weighted assets acquired for growth, in addition to maintaining our capital above the minimum requirements of common equity Tier 1 capital ratio, Tier 1 capital ratio, total capital ratio and capital buffer ratio.
Balancing risk and capital
On the basis of the framework for allocating risk capital, after obtaining the clearest possible grasp of the group’s overall risk exposure, we endeavor to control risk so as to keep it within the range of our business capacity by means of allocating capital that corresponds to the amount of risk to the principal banking subsidiaries, etc., within the bounds of our capital, and we conduct regular assessments to ensure that a sufficient level of capital is maintained for our risk profile. When making these assessments, we calculate the potential losses arising from assumed stress events and risk volumes, which we assess whether they balance with the group’s capital. Stress events are based on risk scenarios that are formulated based on the current economic condition and the economic outlook, etc. and from scenarios such as the occurrence of historical stress events. In addition, we examine whether an appropriate return on risk is maintained in the assessments.
275
Explanation of Composition of capital disclosure、Risk-based capital
2017/09/06 9:42:26 / 17322939_株式会社みずほフィナンシャルグループ_総会その他(C)
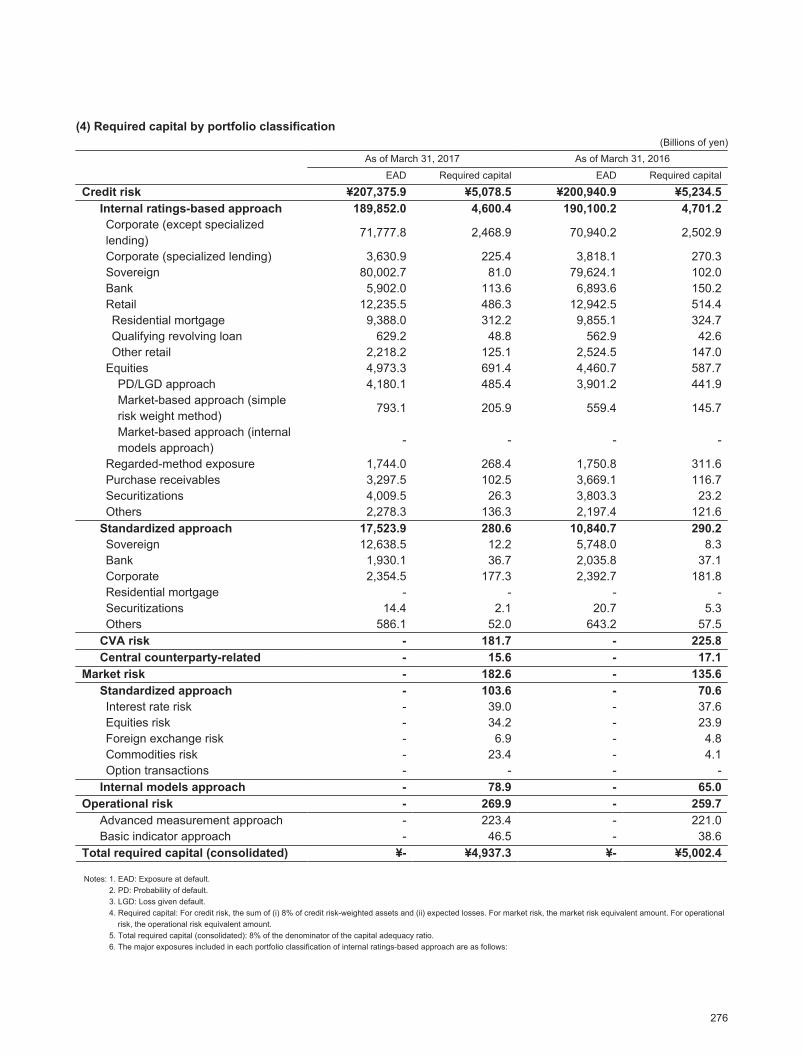
(4) Required capital by portfolio classification(Billions of yen)
As of March 31, 2017 As of March 31, 2016
EAD Required capital EAD Required capital
Credit risk ¥207,375.9 ¥5,078.5 ¥200,940.9 ¥5,234.5Internal ratings-based approach 189,852.0 4,600.4 190,100.2 4,701.2Corporate (except specialized lending)
71,777.8 2,468.9 70,940.2 2,502.9
Corporate (specialized lending) 3,630.9 225.4 3,818.1 270.3Sovereign 80,002.7 81.0 79,624.1 102.0Bank 5,902.0 113.6 6,893.6 150.2Retail 12,235.5 486.3 12,942.5 514.4Residential mortgage 9,388.0 312.2 9,855.1 324.7Qualifying revolving loan 629.2 48.8 562.9 42.6Other retail 2,218.2 125.1 2,524.5 147.0
Equities 4,973.3 691.4 4,460.7 587.7PD/LGD approach 4,180.1 485.4 3,901.2 441.9Market-based approach (simple risk weight method)
793.1 205.9 559.4 145.7
Market-based approach (internal models approach)
- - - -
Regarded-method exposure 1,744.0 268.4 1,750.8 311.6Purchase receivables 3,297.5 102.5 3,669.1 116.7Securitizations 4,009.5 26.3 3,803.3 23.2Others 2,278.3 136.3 2,197.4 121.6
Standardized approach 17,523.9 280.6 10,840.7 290.2Sovereign 12,638.5 12.2 5,748.0 8.3Bank 1,930.1 36.7 2,035.8 37.1Corporate 2,354.5 177.3 2,392.7 181.8Residential mortgage - - - -Securitizations 14.4 2.1 20.7 5.3Others 586.1 52.0 643.2 57.5
CVA risk - 181.7 - 225.8Central counterparty-related - 15.6 - 17.1
Market risk - 182.6 - 135.6Standardized approach - 103.6 - 70.6Interest rate risk - 39.0 - 37.6Equities risk - 34.2 - 23.9Foreign exchange risk - 6.9 - 4.8Commodities risk - 23.4 - 4.1Option transactions - - - -
Internal models approach - 78.9 - 65.0Operational risk - 269.9 - 259.7
Advanced measurement approach - 223.4 - 221.0Basic indicator approach - 46.5 - 38.6
Total required capital (consolidated) ¥- ¥4,937.3 ¥- ¥5,002.4
Notes: 1. EAD: Exposure at default.2. PD: Probability of default.3. LGD: Loss given default.4. Required capital: For credit risk, the sum of (i) 8% of credit risk-weighted assets and (ii) expected losses. For market risk, the market risk equivalent amount. For operational
risk, the operational risk equivalent amount.5. Total required capital (consolidated): 8% of the denominator of the capital adequacy ratio.6. The major exposures included in each portfolio classification of internal ratings-based approach are as follows:
276
Risk-based capital
Status of Capital AdequacyStatus of Mizuho Financial Group’s Consolidated Capital Adequacy
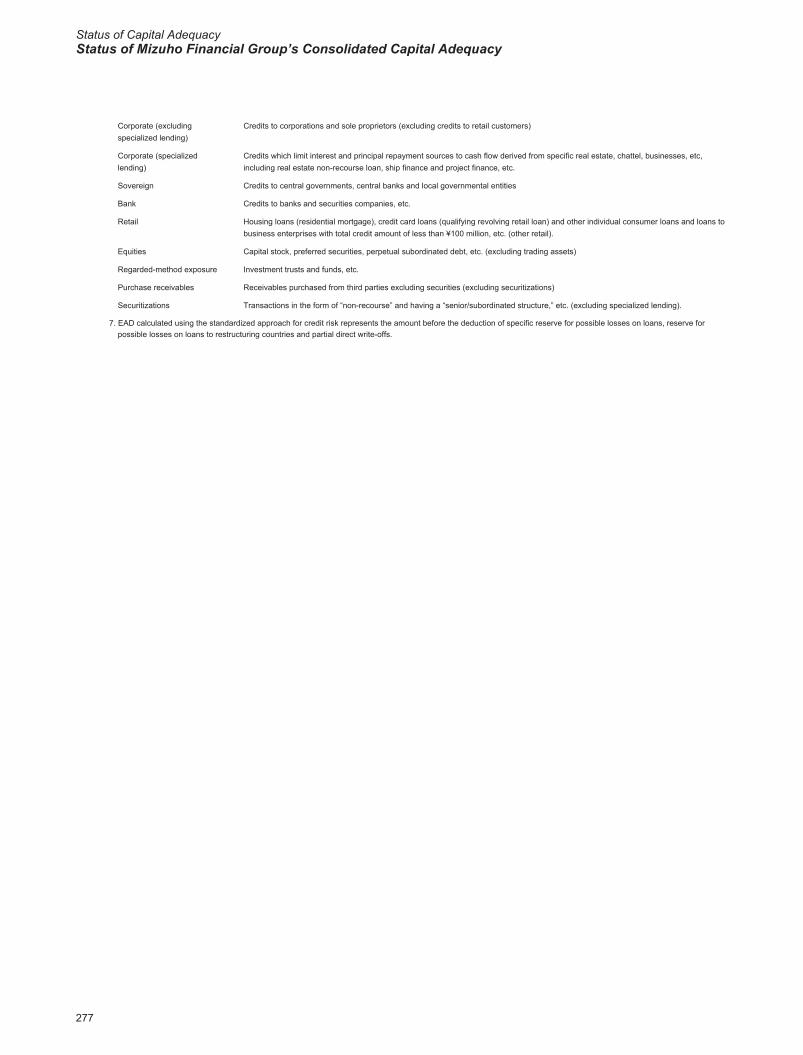
2017/09/06 9:42:26 / 17322939_株式会社みずほフィナンシャルグループ_総会その他(C)
Corporate (excludingspecialized lending)
Credits to corporations and sole proprietors (excluding credits to retail customers)
Corporate (specializedlending)
Credits which limit interest and principal repayment sources to cash flow derived from specific real estate, chattel, businesses, etc, including real estate non-recourse loan, ship finance and project finance, etc.
Sovereign Credits to central governments, central banks and local governmental entities
Bank Credits to banks and securities companies, etc.
Retail Housing loans (residential mortgage), credit card loans (qualifying revolving retail loan) and other individual consumer loans and loans to business enterprises with total credit amount of less than ¥100 million, etc. (other retail).
Equities Capital stock, preferred securities, perpetual subordinated debt, etc. (excluding trading assets)
Regarded-method exposure Investment trusts and funds, etc.
Purchase receivables Receivables purchased from third parties excluding securities (excluding securitizations)
Securitizations Transactions in the form of “non-recourse” and having a “senior/subordinated structure,” etc. (excluding specialized lending).
7. EAD calculated using the standardized approach for credit risk represents the amount before the deduction of specific reserve for possible losses on loans, reserve for possible losses on loans to restructuring countries and partial direct write-offs.
277
Risk-based capital
2017/09/06 9:42:26 / 17322939_株式会社みずほフィナンシャルグループ_総会その他(C)
■ Credit risk
(5) Credit risk management
○ Summary of credit risk management
See pages 111 to 114 for a summary of our credit risk management policies and procedures.We apply the advanced internal ratings-based approach to calculate credit risk-weighted assets under Basel Framework. With regard to some business units or asset classes that are deemed to be immaterial for purposes of calculating credit risk-weighted assets, we apply the standardized approach.We use our estimates of PD (probability of default) and LGD (loss given default) in calculating credit risk-weighted assets. In accordance with regulations, we estimate PD by using long-term averages of actual defaults, to which conservative adjustments are made, based on internal data, and make adjustments to LGD taking into account recessionary periods. We regularly perform verifications of PD and LGD through back testing and other methods. We also utilize these estimates for measuring credit risks for internal use, allocating risk capital and other purposes.
○ Status of portfolios to which the standardized approach is applied
Eligible external credit assessment institutions used for determining the risk weight for portfolios to which the standardized approach is applied are Rating and Investment Information, Inc. (R&I) in Japan and S&P Global Ratings overseas.We apply a risk weight of 100% for all of our corporate exposure.
○ Summary of our internal rating system
See pages 111 to 112 for a summary of our internal rating system and rating assignment procedures.The following table sets forth information with respect to the definition of obligor ratings.
278
Credit risk management、Status of portfolios to which the standardized approach is applied、Summary of our internal rating system
Status of Capital AdequacyStatus of Mizuho Financial Group’s Consolidated Capital Adequacy
2017/09/06 9:42:26 / 17322939_株式会社みずほフィナンシャルグループ_総会その他(C)
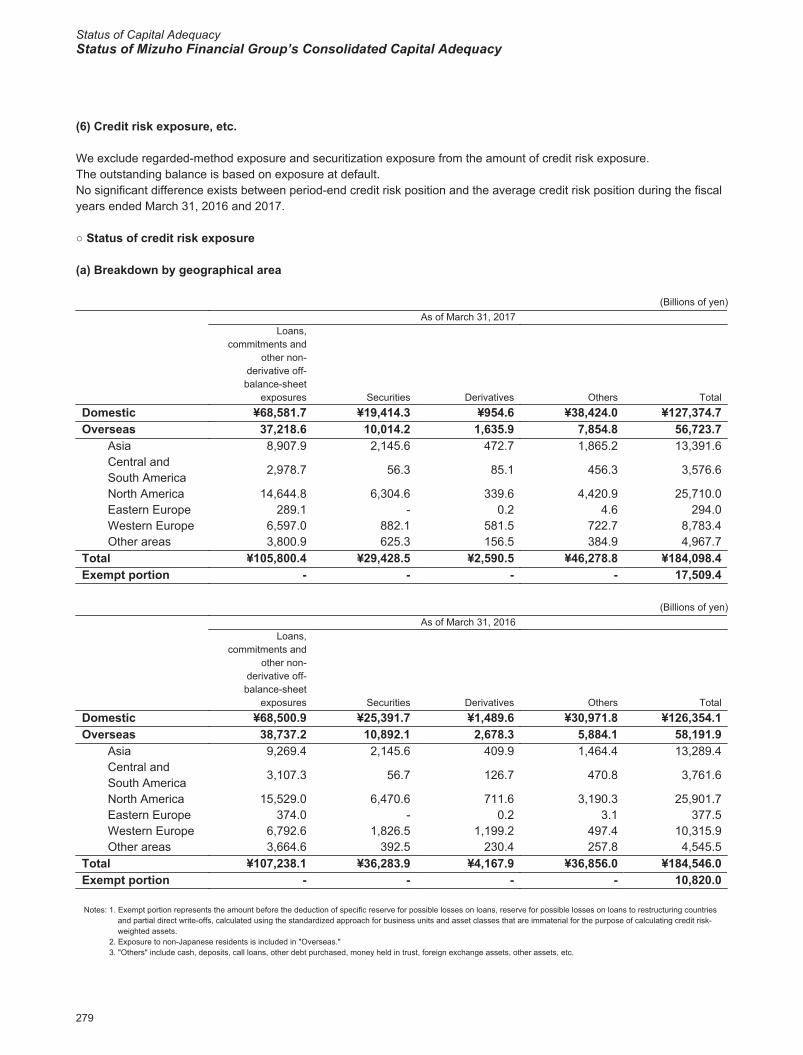
(6) Credit risk exposure, etc.
We exclude regarded-method exposure and securitization exposure from the amount of credit risk exposure.The outstanding balance is based on exposure at default.No significant difference exists between period-end credit risk position and the average credit risk position during the fiscal years ended March 31, 2016 and 2017.
○ Status of credit risk exposure
(a) Breakdown by geographical area
(Billions of yen)As of March 31, 2017
Loans,commitments and
other non-derivative off-
balance-sheetexposures Securities Derivatives Others Total
Domestic ¥68,581.7 ¥19,414.3 ¥954.6 ¥38,424.0 ¥127,374.7Overseas 37,218.6 10,014.2 1,635.9 7,854.8 56,723.7
Asia 8,907.9 2,145.6 472.7 1,865.2 13,391.6Central and South America
2,978.7 56.3 85.1 456.3 3,576.6
North America 14,644.8 6,304.6 339.6 4,420.9 25,710.0Eastern Europe 289.1 - 0.2 4.6 294.0Western Europe 6,597.0 882.1 581.5 722.7 8,783.4Other areas 3,800.9 625.3 156.5 384.9 4,967.7
Total ¥105,800.4 ¥29,428.5 ¥2,590.5 ¥46,278.8 ¥184,098.4Exempt portion - - - - 17,509.4
(Billions of yen)As of March 31, 2016
Loans,commitments and
other non-derivative off-
balance-sheetexposures Securities Derivatives Others Total
Domestic ¥68,500.9 ¥25,391.7 ¥1,489.6 ¥30,971.8 ¥126,354.1Overseas 38,737.2 10,892.1 2,678.3 5,884.1 58,191.9
Asia 9,269.4 2,145.6 409.9 1,464.4 13,289.4Central and South America
3,107.3 56.7 126.7 470.8 3,761.6
North America 15,529.0 6,470.6 711.6 3,190.3 25,901.7Eastern Europe 374.0 - 0.2 3.1 377.5Western Europe 6,792.6 1,826.5 1,199.2 497.4 10,315.9Other areas 3,664.6 392.5 230.4 257.8 4,545.5
Total ¥107,238.1 ¥36,283.9 ¥4,167.9 ¥36,856.0 ¥184,546.0Exempt portion - - - - 10,820.0
Notes: 1. Exempt portion represents the amount before the deduction of specific reserve for possible losses on loans, reserve for possible losses on loans to restructuring countries and partial direct write-offs, calculated using the standardized approach for business units and asset classes that are immaterial for the purpose of calculating credit risk-weighted assets.
2. Exposure to non-Japanese residents is included in "Overseas."3. "Others" include cash, deposits, call loans, other debt purchased, money held in trust, foreign exchange assets, other assets, etc.
279
Credit risk exposure, etc.、Status of credit risk exposure
2017/09/06 9:42:26 / 17322939_株式会社みずほフィナンシャルグループ_総会その他(C)
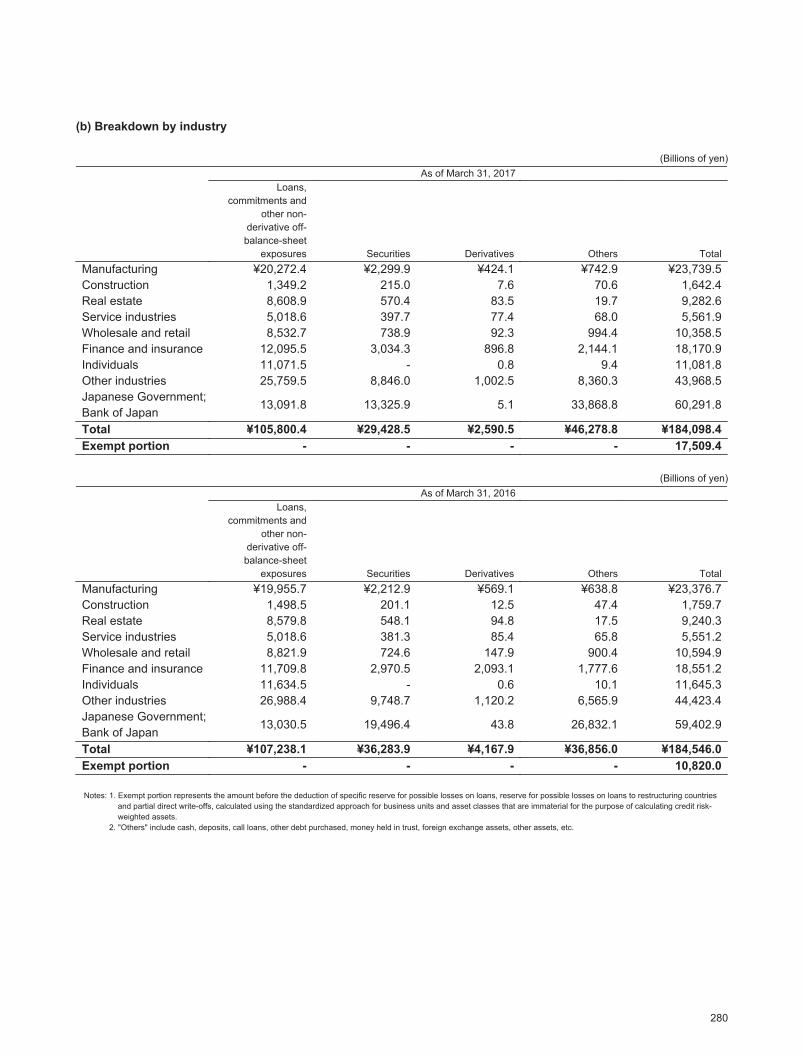
(b) Breakdown by industry
(Billions of yen)As of March 31, 2017
Loans,commitments and
other non-derivative off-
balance-sheetexposures Securities Derivatives Others Total
Manufacturing ¥20,272.4 ¥2,299.9 ¥424.1 ¥742.9 ¥23,739.5Construction 1,349.2 215.0 7.6 70.6 1,642.4Real estate 8,608.9 570.4 83.5 19.7 9,282.6Service industries 5,018.6 397.7 77.4 68.0 5,561.9Wholesale and retail 8,532.7 738.9 92.3 994.4 10,358.5Finance and insurance 12,095.5 3,034.3 896.8 2,144.1 18,170.9Individuals 11,071.5 - 0.8 9.4 11,081.8Other industries 25,759.5 8,846.0 1,002.5 8,360.3 43,968.5Japanese Government;Bank of Japan
13,091.8 13,325.9 5.1 33,868.8 60,291.8
Total ¥105,800.4 ¥29,428.5 ¥2,590.5 ¥46,278.8 ¥184,098.4Exempt portion - - - - 17,509.4
(Billions of yen)As of March 31, 2016
Loans,commitments and
other non-derivative off-
balance-sheetexposures Securities Derivatives Others Total
Manufacturing ¥19,955.7 ¥2,212.9 ¥569.1 ¥638.8 ¥23,376.7Construction 1,498.5 201.1 12.5 47.4 1,759.7Real estate 8,579.8 548.1 94.8 17.5 9,240.3Service industries 5,018.6 381.3 85.4 65.8 5,551.2Wholesale and retail 8,821.9 724.6 147.9 900.4 10,594.9Finance and insurance 11,709.8 2,970.5 2,093.1 1,777.6 18,551.2Individuals 11,634.5 - 0.6 10.1 11,645.3Other industries 26,988.4 9,748.7 1,120.2 6,565.9 44,423.4Japanese Government;Bank of Japan
13,030.5 19,496.4 43.8 26,832.1 59,402.9
Total ¥107,238.1 ¥36,283.9 ¥4,167.9 ¥36,856.0 ¥184,546.0Exempt portion - - - - 10,820.0
Notes: 1. Exempt portion represents the amount before the deduction of specific reserve for possible losses on loans, reserve for possible losses on loans to restructuring countries and partial direct write-offs, calculated using the standardized approach for business units and asset classes that are immaterial for the purpose of calculating credit risk-weighted assets.
2. "Others" include cash, deposits, call loans, other debt purchased, money held in trust, foreign exchange assets, other assets, etc.
280
Status of credit risk exposure
Status of Capital AdequacyStatus of Mizuho Financial Group’s Consolidated Capital Adequacy
2017/09/06 9:42:26 / 17322939_株式会社みずほフィナンシャルグループ_総会その他(C)
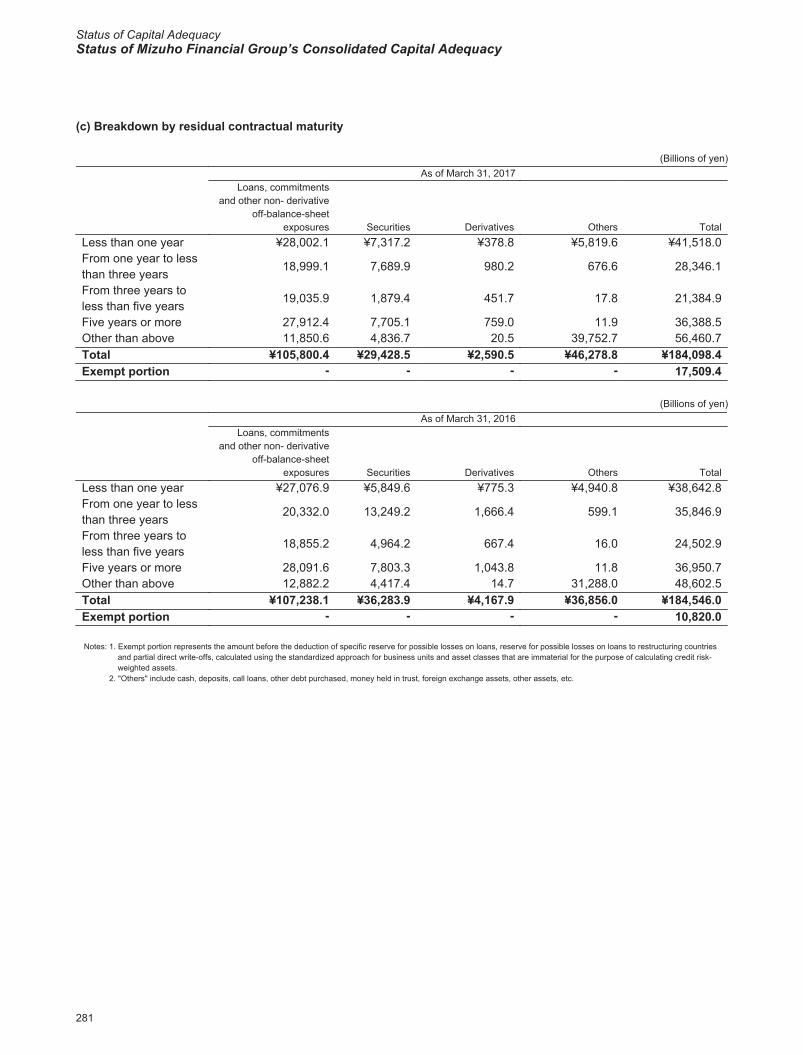
(c) Breakdown by residual contractual maturity
(Billions of yen)As of March 31, 2017
Loans, commitmentsand other non- derivative
off-balance-sheetexposures Securities Derivatives Others Total
Less than one year ¥28,002.1 ¥7,317.2 ¥378.8 ¥5,819.6 ¥41,518.0From one year to lessthan three years
18,999.1 7,689.9 980.2 676.6 28,346.1
From three years toless than five years
19,035.9 1,879.4 451.7 17.8 21,384.9
Five years or more 27,912.4 7,705.1 759.0 11.9 36,388.5Other than above 11,850.6 4,836.7 20.5 39,752.7 56,460.7Total ¥105,800.4 ¥29,428.5 ¥2,590.5 ¥46,278.8 ¥184,098.4Exempt portion - - - - 17,509.4
(Billions of yen)As of March 31, 2016
Loans, commitmentsand other non- derivative
off-balance-sheetexposures Securities Derivatives Others Total
Less than one year ¥27,076.9 ¥5,849.6 ¥775.3 ¥4,940.8 ¥38,642.8From one year to lessthan three years
20,332.0 13,249.2 1,666.4 599.1 35,846.9
From three years toless than five years
18,855.2 4,964.2 667.4 16.0 24,502.9
Five years or more 28,091.6 7,803.3 1,043.8 11.8 36,950.7Other than above 12,882.2 4,417.4 14.7 31,288.0 48,602.5Total ¥107,238.1 ¥36,283.9 ¥4,167.9 ¥36,856.0 ¥184,546.0Exempt portion - - - - 10,820.0
Notes: 1. Exempt portion represents the amount before the deduction of specific reserve for possible losses on loans, reserve for possible losses on loans to restructuring countries and partial direct write-offs, calculated using the standardized approach for business units and asset classes that are immaterial for the purpose of calculating credit risk-weighted assets.
2. "Others" include cash, deposits, call loans, other debt purchased, money held in trust, foreign exchange assets, other assets, etc.
281
Status of credit risk exposure
2017/09/06 9:42:26 / 17322939_株式会社みずほフィナンシャルグループ_総会その他(C)
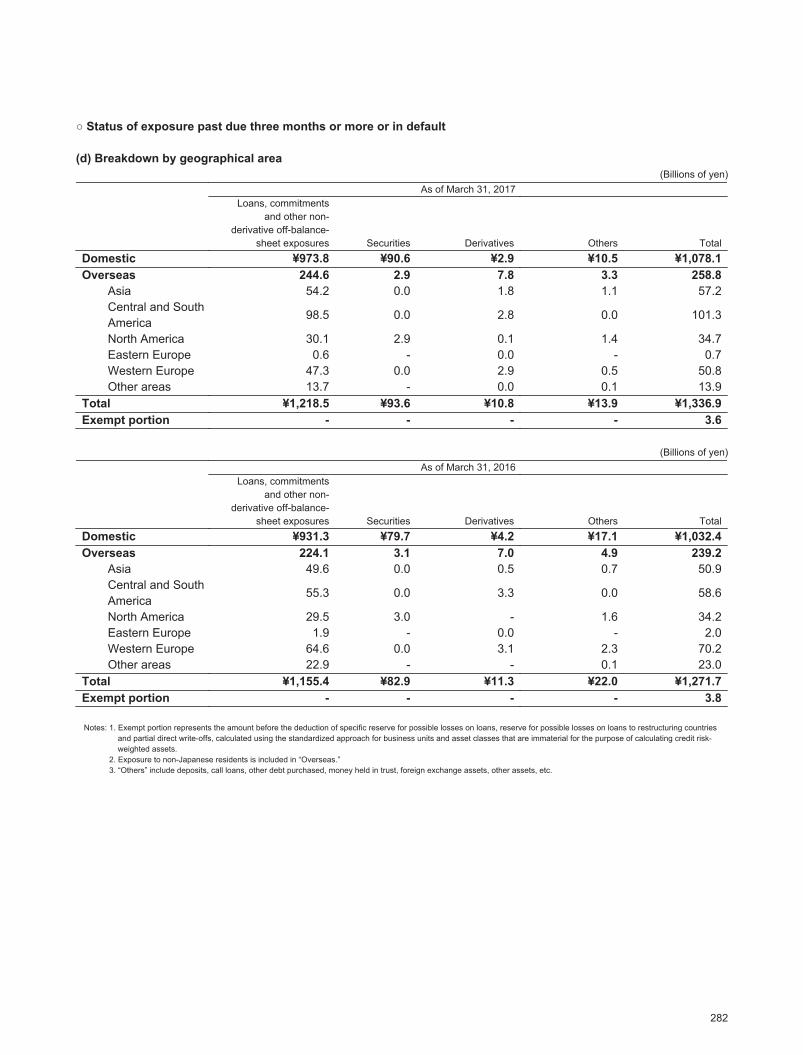
○ Status of exposure past due three months or more or in default
(d) Breakdown by geographical area(Billions of yen)
As of March 31, 2017Loans, commitments
and other non-derivative off-balance-
sheet exposures Securities Derivatives Others TotalDomestic ¥973.8 ¥90.6 ¥2.9 ¥10.5 ¥1,078.1Overseas 244.6 2.9 7.8 3.3 258.8
Asia 54.2 0.0 1.8 1.1 57.2Central and South America
98.5 0.0 2.8 0.0 101.3
North America 30.1 2.9 0.1 1.4 34.7Eastern Europe 0.6 - 0.0 - 0.7Western Europe 47.3 0.0 2.9 0.5 50.8Other areas 13.7 - 0.0 0.1 13.9
Total ¥1,218.5 ¥93.6 ¥10.8 ¥13.9 ¥1,336.9Exempt portion - - - - 3.6
(Billions of yen)As of March 31, 2016
Loans, commitmentsand other non-
derivative off-balance-sheet exposures Securities Derivatives Others Total
Domestic ¥931.3 ¥79.7 ¥4.2 ¥17.1 ¥1,032.4Overseas 224.1 3.1 7.0 4.9 239.2
Asia 49.6 0.0 0.5 0.7 50.9Central and South America
55.3 0.0 3.3 0.0 58.6
North America 29.5 3.0 - 1.6 34.2Eastern Europe 1.9 - 0.0 - 2.0Western Europe 64.6 0.0 3.1 2.3 70.2Other areas 22.9 - - 0.1 23.0
Total ¥1,155.4 ¥82.9 ¥11.3 ¥22.0 ¥1,271.7Exempt portion - - - - 3.8
Notes: 1. Exempt portion represents the amount before the deduction of specific reserve for possible losses on loans, reserve for possible losses on loans to restructuring countries and partial direct write-offs, calculated using the standardized approach for business units and asset classes that are immaterial for the purpose of calculating credit risk-weighted assets.
2. Exposure to non-Japanese residents is included in “Overseas.”3. “Others” include deposits, call loans, other debt purchased, money held in trust, foreign exchange assets, other assets, etc.
282
Status of exposure past due three months or more or in default
Status of Capital AdequacyStatus of Mizuho Financial Group’s Consolidated Capital Adequacy
2017/09/06 9:42:26 / 17322939_株式会社みずほフィナンシャルグループ_総会その他(C)
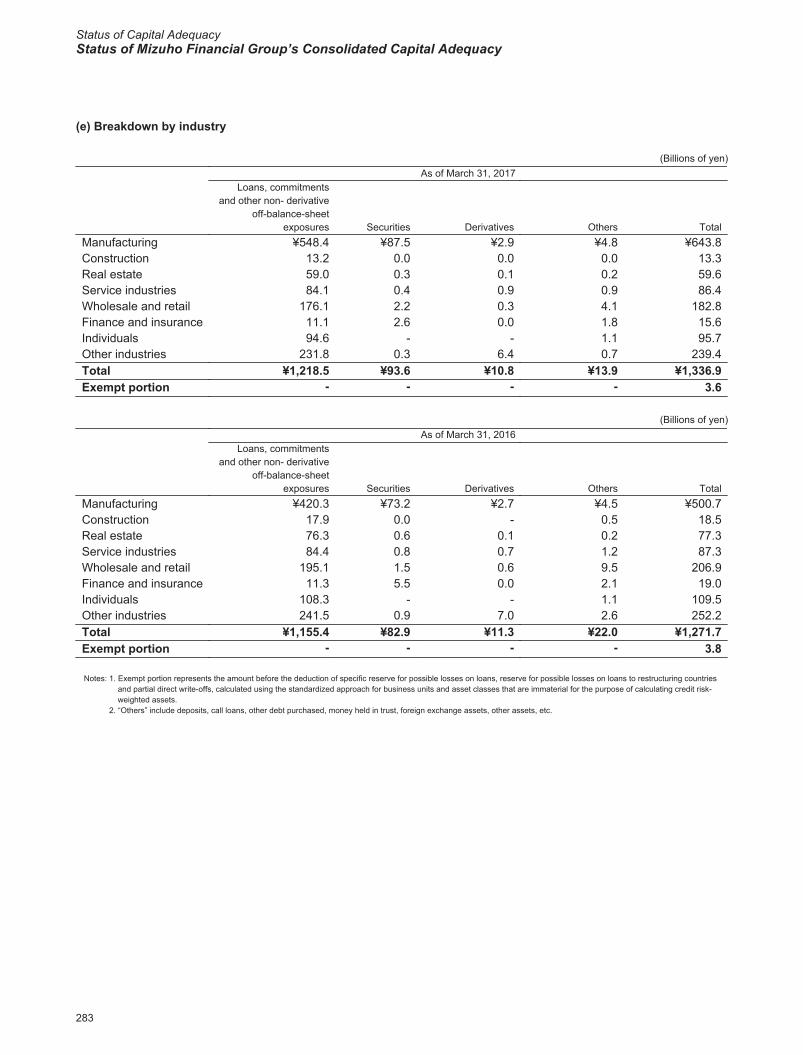
(e) Breakdown by industry
(Billions of yen)As of March 31, 2017
Loans, commitmentsand other non- derivative
off-balance-sheetexposures Securities Derivatives Others Total
Manufacturing ¥548.4 ¥87.5 ¥2.9 ¥4.8 ¥643.8Construction 13.2 0.0 0.0 0.0 13.3Real estate 59.0 0.3 0.1 0.2 59.6Service industries 84.1 0.4 0.9 0.9 86.4Wholesale and retail 176.1 2.2 0.3 4.1 182.8Finance and insurance 11.1 2.6 0.0 1.8 15.6Individuals 94.6 - - 1.1 95.7Other industries 231.8 0.3 6.4 0.7 239.4Total ¥1,218.5 ¥93.6 ¥10.8 ¥13.9 ¥1,336.9Exempt portion - - - - 3.6
(Billions of yen)As of March 31, 2016
Loans, commitmentsand other non- derivative
off-balance-sheetexposures Securities Derivatives Others Total
Manufacturing ¥420.3 ¥73.2 ¥2.7 ¥4.5 ¥500.7Construction 17.9 0.0 - 0.5 18.5Real estate 76.3 0.6 0.1 0.2 77.3Service industries 84.4 0.8 0.7 1.2 87.3Wholesale and retail 195.1 1.5 0.6 9.5 206.9Finance and insurance 11.3 5.5 0.0 2.1 19.0Individuals 108.3 - - 1.1 109.5Other industries 241.5 0.9 7.0 2.6 252.2Total ¥1,155.4 ¥82.9 ¥11.3 ¥22.0 ¥1,271.7Exempt portion - - - - 3.8
Notes: 1. Exempt portion represents the amount before the deduction of specific reserve for possible losses on loans, reserve for possible losses on loans to restructuring countries and partial direct write-offs, calculated using the standardized approach for business units and asset classes that are immaterial for the purpose of calculating credit risk-weighted assets.
2. “Others” include deposits, call loans, other debt purchased, money held in trust, foreign exchange assets, other assets, etc.
283
Status of exposure past due three months or more or in default
2017/09/06 9:42:26 / 17322939_株式会社みずほフィナンシャルグループ_総会その他(C)
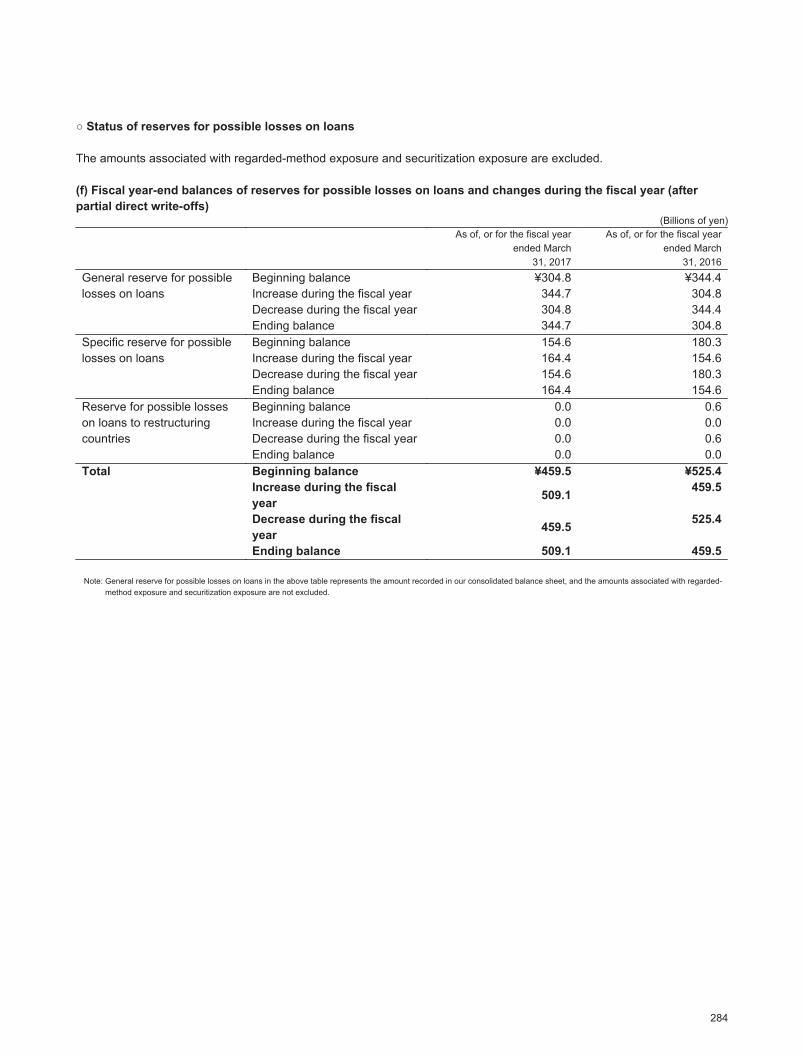
○ Status of reserves for possible losses on loans
The amounts associated with regarded-method exposure and securitization exposure are excluded.
(f) Fiscal year-end balances of reserves for possible losses on loans and changes during the fiscal year (afterpartial direct write-offs)
(Billions of yen)As of, or for the fiscal year
ended March31, 2017
As of, or for the fiscal yearended March
31, 2016General reserve for possiblelosses on loans
Beginning balance ¥304.8 ¥344.4Increase during the fiscal year 344.7 304.8Decrease during the fiscal year 304.8 344.4Ending balance 344.7 304.8
Specific reserve for possiblelosses on loans
Beginning balance 154.6 180.3Increase during the fiscal year 164.4 154.6Decrease during the fiscal year 154.6 180.3Ending balance 164.4 154.6
Reserve for possible losseson loans to restructuringcountries
Beginning balance 0.0 0.6Increase during the fiscal year 0.0 0.0Decrease during the fiscal year 0.0 0.6Ending balance 0.0 0.0
Total Beginning balance ¥459.5 ¥525.4Increase during the fiscalyear 509.1 459.5
Decrease during the fiscalyear 459.5 525.4
Ending balance 509.1 459.5
Note: General reserve for possible losses on loans in the above table represents the amount recorded in our consolidated balance sheet, and the amounts associated with regarded-method exposure and securitization exposure are not excluded.
284
Status of reserves for possible losses on loans
Status of Capital AdequacyStatus of Mizuho Financial Group’s Consolidated Capital Adequacy
2017/09/06 9:42:26 / 17322939_株式会社みずほフィナンシャルグループ_総会その他(C)
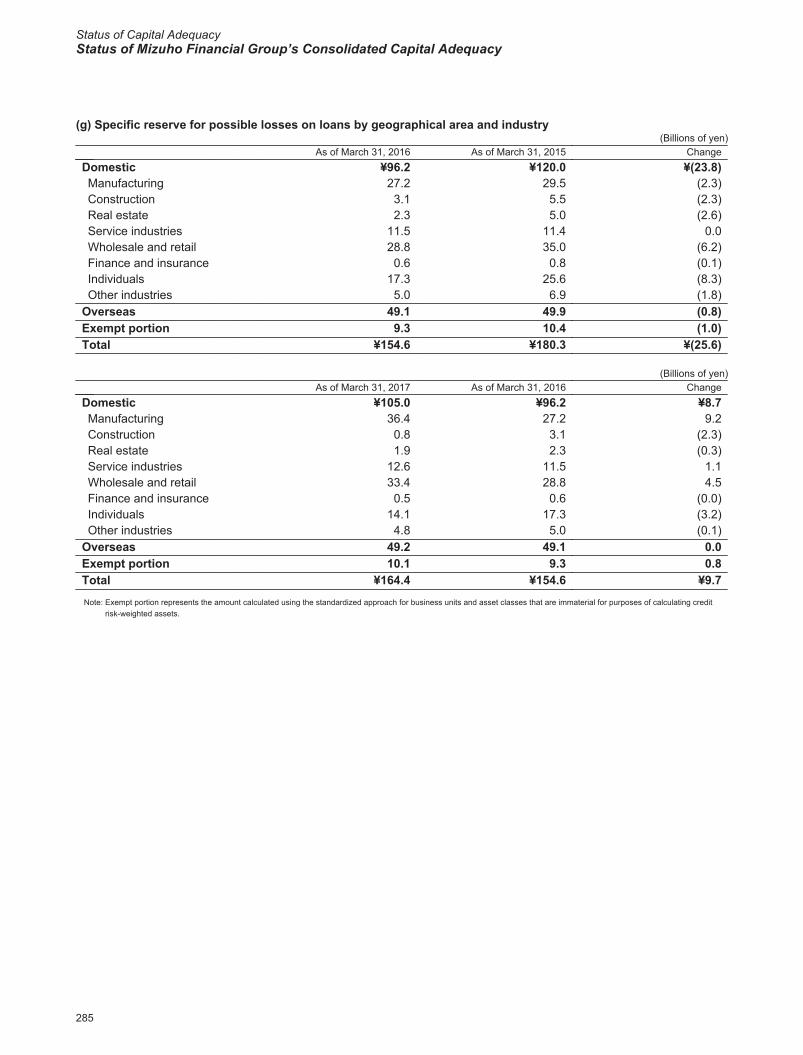
(g) Specific reserve for possible losses on loans by geographical area and industry(Billions of yen)
As of March 31, 2016 As of March 31, 2015 ChangeDomestic ¥96.2 ¥120.0 ¥(23.8)Manufacturing 27.2 29.5 (2.3)Construction 3.1 5.5 (2.3)Real estate 2.3 5.0 (2.6)Service industries 11.5 11.4 0.0Wholesale and retail 28.8 35.0 (6.2)Finance and insurance 0.6 0.8 (0.1)Individuals 17.3 25.6 (8.3)Other industries 5.0 6.9 (1.8)
Overseas 49.1 49.9 (0.8)Exempt portion 9.3 10.4 (1.0)Total ¥154.6 ¥180.3 ¥(25.6)
(Billions of yen)As of March 31, 2017 As of March 31, 2016 Change
Domestic ¥105.0 ¥96.2 ¥8.7Manufacturing 36.4 27.2 9.2Construction 0.8 3.1 (2.3)Real estate 1.9 2.3 (0.3)Service industries 12.6 11.5 1.1Wholesale and retail 33.4 28.8 4.5Finance and insurance 0.5 0.6 (0.0)Individuals 14.1 17.3 (3.2)Other industries 4.8 5.0 (0.1)
Overseas 49.2 49.1 0.0Exempt portion 10.1 9.3 0.8Total ¥164.4 ¥154.6 ¥9.7Note: Exempt portion represents the amount calculated using the standardized approach for business units and asset classes that are immaterial for purposes of calculating credit
risk-weighted assets.
285
Status of reserves for possible losses on loans
2017/09/06 9:42:26 / 17322939_株式会社みずほフィナンシャルグループ_総会その他(C)
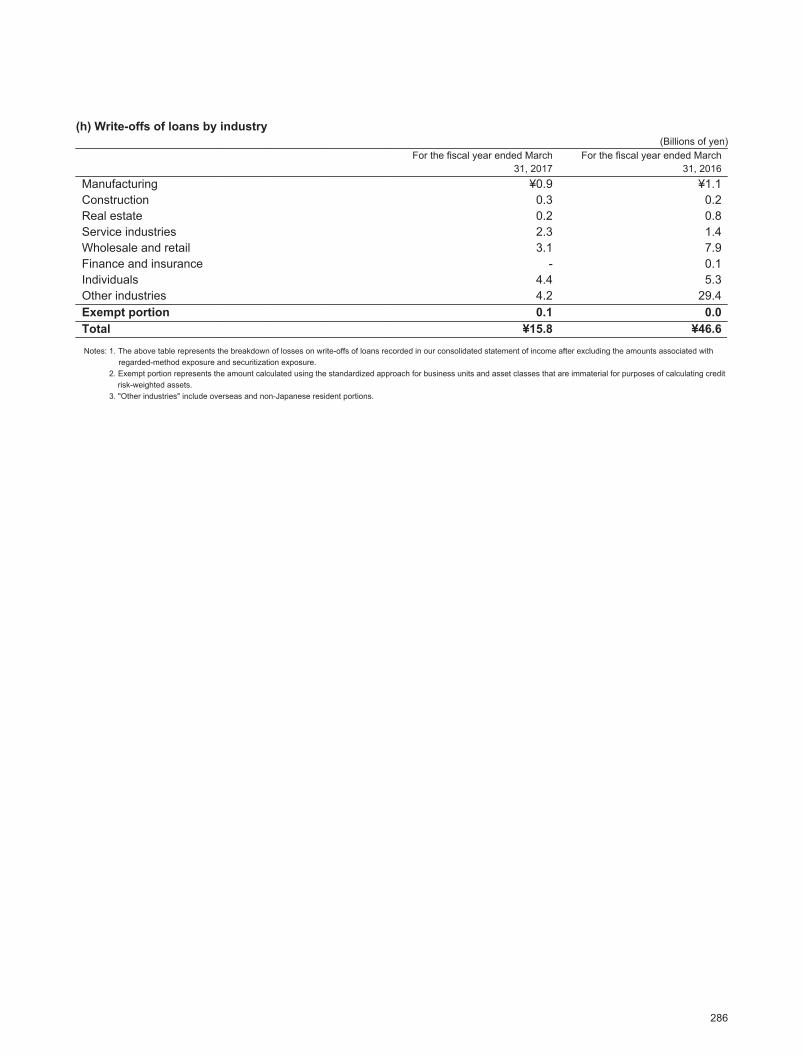
(h) Write-offs of loans by industry(Billions of yen)
For the fiscal year ended March31, 2017
For the fiscal year ended March31, 2016
Manufacturing ¥0.9 ¥1.1Construction 0.3 0.2Real estate 0.2 0.8Service industries 2.3 1.4Wholesale and retail 3.1 7.9Finance and insurance - 0.1Individuals 4.4 5.3Other industries 4.2 29.4Exempt portion 0.1 0.0Total ¥15.8 ¥46.6Notes: 1. The above table represents the breakdown of losses on write-offs of loans recorded in our consolidated statement of income after excluding the amounts associated with
regarded-method exposure and securitization exposure.2. Exempt portion represents the amount calculated using the standardized approach for business units and asset classes that are immaterial for purposes of calculating credit
risk-weighted assets.3. "Other industries" include overseas and non-Japanese resident portions.
286
Status of reserves for possible losses on loans
Status of Capital AdequacyStatus of Mizuho Financial Group’s Consolidated Capital Adequacy
2017/09/06 9:42:26 / 17322939_株式会社みずほフィナンシャルグループ_総会その他(C)
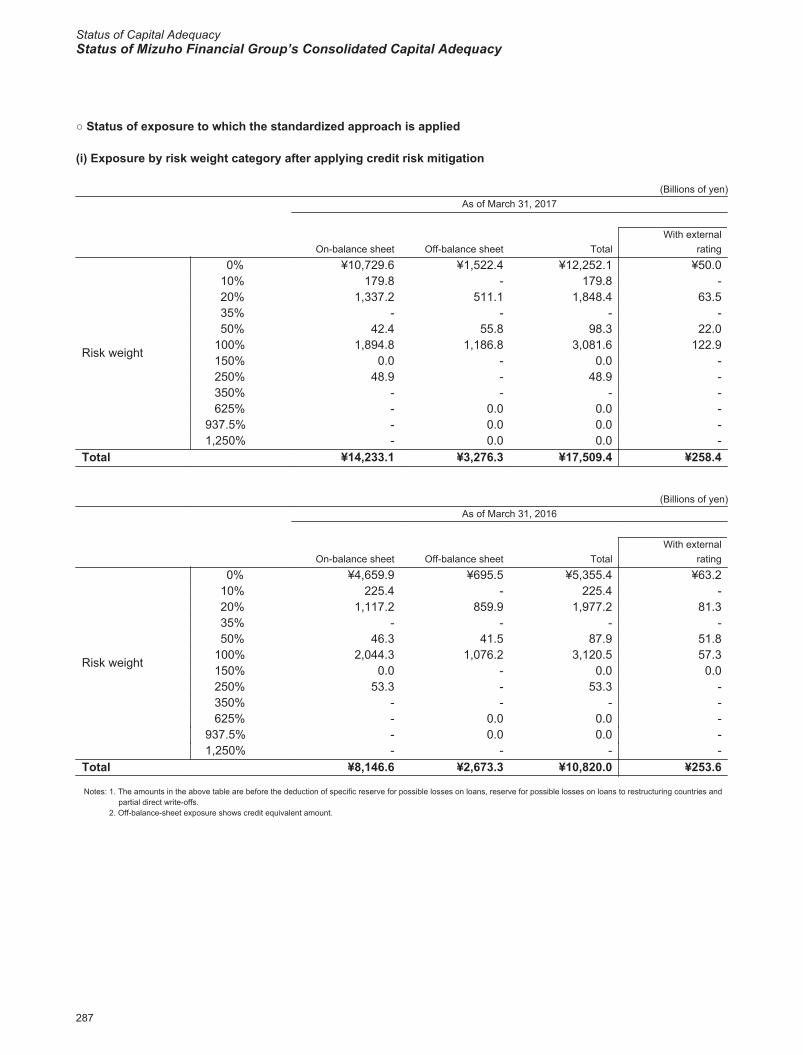
○ Status of exposure to which the standardized approach is applied
(i) Exposure by risk weight category after applying credit risk mitigation
(Billions of yen)As of March 31, 2017
On-balance sheet Off-balance sheet TotalWith external
rating
Risk weight
0% ¥10,729.6 ¥1,522.4 ¥12,252.1 ¥50.010% 179.8 - 179.8 -20% 1,337.2 511.1 1,848.4 63.535% - - - -50% 42.4 55.8 98.3 22.0
100% 1,894.8 1,186.8 3,081.6 122.9150% 0.0 - 0.0 -250% 48.9 - 48.9 -350% - - - -625% - 0.0 0.0 -
937.5% - 0.0 0.0 -1,250% - 0.0 0.0 -
Total ¥14,233.1 ¥3,276.3 ¥17,509.4 ¥258.4
(Billions of yen)As of March 31, 2016
On-balance sheet Off-balance sheet TotalWith external
rating
Risk weight
0% ¥4,659.9 ¥695.5 ¥5,355.4 ¥63.210% 225.4 - 225.4 -20% 1,117.2 859.9 1,977.2 81.335% - - - -50% 46.3 41.5 87.9 51.8
100% 2,044.3 1,076.2 3,120.5 57.3150% 0.0 - 0.0 0.0250% 53.3 - 53.3 -350% - - - -625% - 0.0 0.0 -
937.5% - 0.0 0.0 -1,250% - - - -
Total ¥8,146.6 ¥2,673.3 ¥10,820.0 ¥253.6
Notes: 1. The amounts in the above table are before the deduction of specific reserve for possible losses on loans, reserve for possible losses on loans to restructuring countries and partial direct write-offs.
2. Off-balance-sheet exposure shows credit equivalent amount.
287
Status of exposure to which the standardized approach is applied
2017/09/06 9:42:26 / 17322939_株式会社みずほフィナンシャルグループ_総会その他(C)
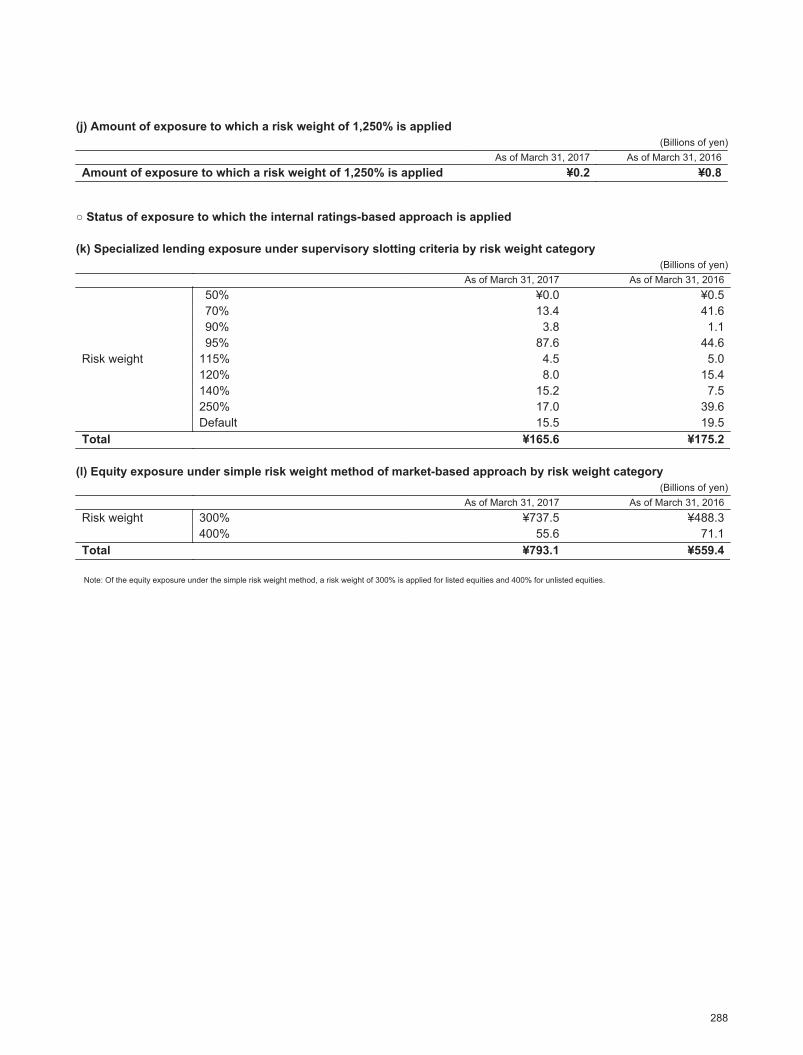
(j) Amount of exposure to which a risk weight of 1,250% is applied(Billions of yen)
As of March 31, 2017 As of March 31, 2016Amount of exposure to which a risk weight of 1,250% is applied ¥0.2 ¥0.8
○ Status of exposure to which the internal ratings-based approach is applied
(k) Specialized lending exposure under supervisory slotting criteria by risk weight category(Billions of yen)
As of March 31, 2017 As of March 31, 2016
Risk weight
50% ¥0.0 ¥0.570% 13.4 41.690% 3.8 1.195% 87.6 44.6
115% 4.5 5.0120% 8.0 15.4140% 15.2 7.5250% 17.0 39.6Default 15.5 19.5
Total ¥165.6 ¥175.2
(l) Equity exposure under simple risk weight method of market-based approach by risk weight category(Billions of yen)
As of March 31, 2017 As of March 31, 2016Risk weight 300% ¥737.5 ¥488.3
400% 55.6 71.1Total ¥793.1 ¥559.4
Note: Of the equity exposure under the simple risk weight method, a risk weight of 300% is applied for listed equities and 400% for unlisted equities.
288
Status of exposure to which the standardized approach is applied、Status of exposure to which the internal ratings-based approach is applied
Status of Capital AdequacyStatus of Mizuho Financial Group’s Consolidated Capital Adequacy
2017/09/06 9:42:26 / 17322939_株式会社みずほフィナンシャルグループ_総会その他(C)
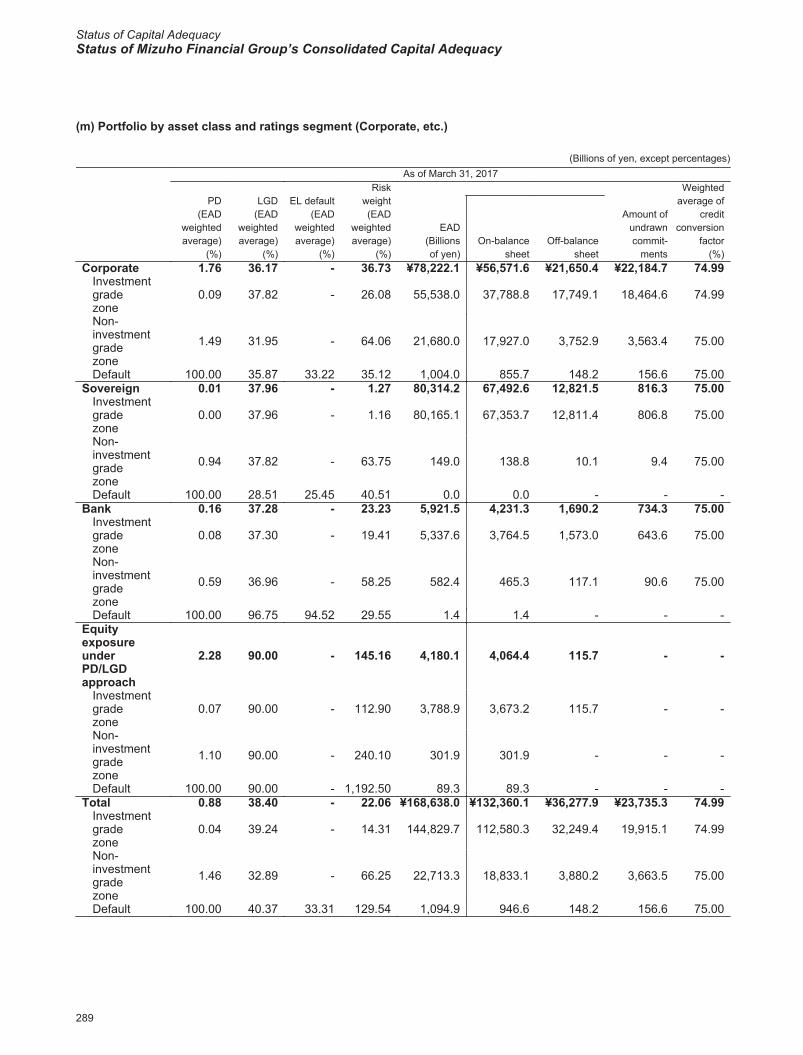
(m) Portfolio by asset class and ratings segment (Corporate, etc.)
(Billions of yen, except percentages)As of March 31, 2017
PD(EAD
weightedaverage)
(%)
LGD(EAD
weightedaverage)
(%)
EL default(EAD
weightedaverage)
(%)
Riskweight(EAD
weightedaverage)
(%)
EAD(Billionsof yen)
Amount ofundrawncommit-
ments
Weightedaverage of
creditconversion
factor(%)
On-balancesheet
Off-balancesheet
Corporate 1.76 36.17 - 36.73 ¥78,222.1 ¥56,571.6 ¥21,650.4 ¥22,184.7 74.99Investmentgradezone
0.09 37.82 - 26.08 55,538.0 37,788.8 17,749.1 18,464.6 74.99
Non-investmentgradezone
1.49 31.95 - 64.06 21,680.0 17,927.0 3,752.9 3,563.4 75.00
Default 100.00 35.87 33.22 35.12 1,004.0 855.7 148.2 156.6 75.00Sovereign 0.01 37.96 - 1.27 80,314.2 67,492.6 12,821.5 816.3 75.00
Investmentgradezone
0.00 37.96 - 1.16 80,165.1 67,353.7 12,811.4 806.8 75.00
Non-investmentgradezone
0.94 37.82 - 63.75 149.0 138.8 10.1 9.4 75.00
Default 100.00 28.51 25.45 40.51 0.0 0.0 - - -Bank 0.16 37.28 - 23.23 5,921.5 4,231.3 1,690.2 734.3 75.00
Investmentgradezone
0.08 37.30 - 19.41 5,337.6 3,764.5 1,573.0 643.6 75.00
Non-investmentgradezone
0.59 36.96 - 58.25 582.4 465.3 117.1 90.6 75.00
Default 100.00 96.75 94.52 29.55 1.4 1.4 - - -EquityexposureunderPD/LGDapproach
2.28 90.00 - 145.16 4,180.1 4,064.4 115.7 - -
Investmentgradezone
0.07 90.00 - 112.90 3,788.9 3,673.2 115.7 - -
Non-investmentgradezone
1.10 90.00 - 240.10 301.9 301.9 - - -
Default 100.00 90.00 - 1,192.50 89.3 89.3 - - -Total 0.88 38.40 - 22.06 ¥168,638.0 ¥132,360.1 ¥36,277.9 ¥23,735.3 74.99
Investmentgradezone
0.04 39.24 - 14.31 144,829.7 112,580.3 32,249.4 19,915.1 74.99
Non-investmentgradezone
1.46 32.89 - 66.25 22,713.3 18,833.1 3,880.2 3,663.5 75.00
Default 100.00 40.37 33.31 129.54 1,094.9 946.6 148.2 156.6 75.00
289
Status of exposure to which the internal ratings-based approach is applied
2017/09/06 9:42:26 / 17322939_株式会社みずほフィナンシャルグループ_総会その他(C)
(Billions of yen, except percentages)As of March 31, 2016
PD(EAD
weightedaverage)
(%)
LGD(EAD
weightedaverage)
(%)
EL default(EAD
weightedaverage)
(%)
Riskweight(EAD
weightedaverage)
(%)
EAD(Billionsof yen)
Amount ofundrawncommit-
ments
Weightedaverage of
creditconversion
factor(%)
On-balancesheet
Off-balancesheet
Corporate 1.72 36.43 - 37.92 ¥77,953.6 ¥56,053.9 ¥21,899.7 ¥22,666.8 74.99Investmentgradezone
0.10 38.05 - 27.27 54,868.1 36,687.2 18,180.9 19,298.2 74.99
Non-investmentgradezone
1.49 32.28 - 64.49 22,127.0 18,442.6 3,684.4 3,360.5 75.00
Default 100.00 39.19 36.60 34.30 958.4 924.0 34.4 8.0 75.00Sovereign 0.01 38.29 - 1.60 79,893.0 65,570.6 14,322.4 854.0 75.00
Investmentgradezone
0.00 38.29 - 1.49 79,739.7 65,426.9 14,312.7 845.5 75.00
Non-investmentgradezone
0.72 38.13 - 61.26 153.2 143.5 9.7 8.4 75.00
Default 100.00 56.88 52.15 62.73 0.0 0.0 - - -Bank 0.18 35.19 - 26.25 6,923.3 4,151.3 2,772.0 555.6 75.00
Investmentgradezone
0.09 35.00 - 22.09 6,198.3 3,557.9 2,640.4 451.8 75.00
Non-investmentgradezone
0.69 36.65 - 61.91 723.0 591.4 131.5 103.8 75.00
Default 100.00 97.07 94.79 30.21 1.9 1.9 - - -EquityexposureunderPD/LGDapproach
2.04 90.00 - 141.61 3,901.2 3,858.0 43.1 - -
Investmentgradezone
0.07 90.00 - 112.47 3,558.7 3,515.5 43.1 - -
Non-investmentgradezone
1.03 90.00 - 236.83 268.0 268.0 - - -
Default 100.00 90.00 - 1,191.88 74.4 74.4 - - -Total 0.85 38.50 - 22.64 ¥168,671.3 ¥129,633.9 ¥39,037.4 ¥24,076.5 74.99
Investmentgradezone
0.05 39.33 - 14.90 144,364.9 109,187.6 35,177.2 20,595.6 74.99
Non-investmentgradezone
1.45 33.11 - 66.37 23,271.5 19,445.7 3,825.7 3,472.8 75.00
Default 100.00 42.95 36.72 117.56 1,034.9 1,000.5 34.4 8.0 75.00
Notes: 1. Investment grade zone includes obligor ratings A1 through B2, non-investment grade zone includes C1 through E2 (excluding E2R), and default includes E2R through H1.2. "Corporate" does not include specialized lending exposure under supervisory slotting criteria.3. Each asset class includes purchased receivables.4. The commitments that can be terminated at any time without condition or terminated automatically are not included in the amount of undrawn commitments and weighted
average of credit conversion factor.5. Regarding equity exposure under the PD/LGD approach, we recognize the risk-weighted assets by multiplying 1,250% by the expected loss ("EL").
290
Status of exposure to which the internal ratings-based approach is applied
Status of Capital AdequacyStatus of Mizuho Financial Group’s Consolidated Capital Adequacy
2017/09/06 9:42:26 / 17322939_株式会社みずほフィナンシャルグループ_総会その他(C)
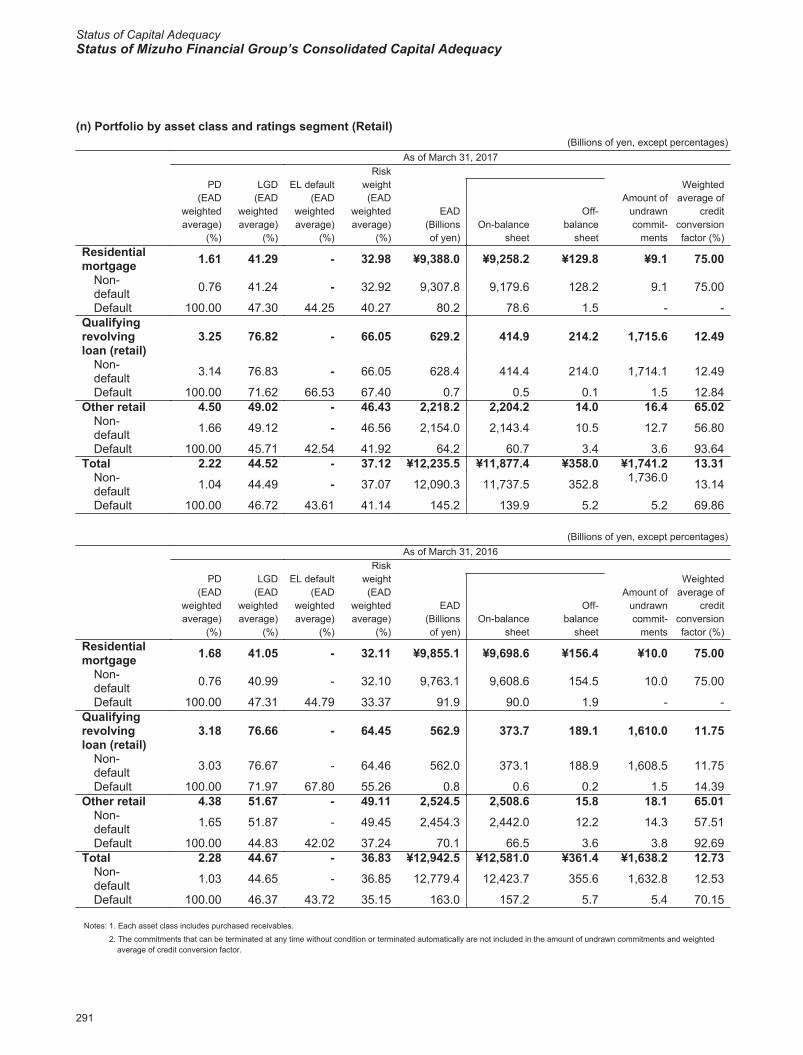
(n) Portfolio by asset class and ratings segment (Retail)(Billions of yen, except percentages)
As of March 31, 2017
PD(EAD
weightedaverage)
(%)
LGD(EAD
weightedaverage)
(%)
EL default(EAD
weightedaverage)
(%)
Riskweight(EAD
weightedaverage)
(%)
EAD(Billionsof yen)
Amount ofundrawncommit-
ments
Weightedaverage of
creditconversionfactor (%)
On-balancesheet
Off-balance
sheetResidentialmortgage 1.61 41.29 - 32.98 ¥9,388.0 ¥9,258.2 ¥129.8 ¥9.1 75.00
Non-default 0.76 41.24 - 32.92 9,307.8 9,179.6 128.2 9.1 75.00
Default 100.00 47.30 44.25 40.27 80.2 78.6 1.5 - -Qualifyingrevolvingloan (retail)
3.25 76.82 - 66.05 629.2 414.9 214.2 1,715.6 12.49
Non-default 3.14 76.83 - 66.05 628.4 414.4 214.0 1,714.1 12.49
Default 100.00 71.62 66.53 67.40 0.7 0.5 0.1 1.5 12.84Other retail 4.50 49.02 - 46.43 2,218.2 2,204.2 14.0 16.4 65.02
Non-default 1.66 49.12 - 46.56 2,154.0 2,143.4 10.5 12.7 56.80
Default 100.00 45.71 42.54 41.92 64.2 60.7 3.4 3.6 93.64Total 2.22 44.52 - 37.12 ¥12,235.5 ¥11,877.4 ¥358.0 ¥1,741.2 13.31
Non-default 1.04 44.49 - 37.07 12,090.3 11,737.5 352.8 1,736.0 13.14
Default 100.00 46.72 43.61 41.14 145.2 139.9 5.2 5.2 69.86
(Billions of yen, except percentages)As of March 31, 2016
PD(EAD
weightedaverage)
(%)
LGD(EAD
weightedaverage)
(%)
EL default(EAD
weightedaverage)
(%)
Riskweight(EAD
weightedaverage)
(%)
EAD(Billionsof yen)
Amount ofundrawncommit-
ments
Weightedaverage of
creditconversionfactor (%)
On-balancesheet
Off-balance
sheetResidentialmortgage 1.68 41.05 - 32.11 ¥9,855.1 ¥9,698.6 ¥156.4 ¥10.0 75.00
Non-default 0.76 40.99 - 32.10 9,763.1 9,608.6 154.5 10.0 75.00
Default 100.00 47.31 44.79 33.37 91.9 90.0 1.9 - -Qualifyingrevolvingloan (retail)
3.18 76.66 - 64.45 562.9 373.7 189.1 1,610.0 11.75
Non-default 3.03 76.67 - 64.46 562.0 373.1 188.9 1,608.5 11.75
Default 100.00 71.97 67.80 55.26 0.8 0.6 0.2 1.5 14.39Other retail 4.38 51.67 - 49.11 2,524.5 2,508.6 15.8 18.1 65.01
Non-default 1.65 51.87 - 49.45 2,454.3 2,442.0 12.2 14.3 57.51
Default 100.00 44.83 42.02 37.24 70.1 66.5 3.6 3.8 92.69Total 2.28 44.67 - 36.83 ¥12,942.5 ¥12,581.0 ¥361.4 ¥1,638.2 12.73
Non-default 1.03 44.65 - 36.85 12,779.4 12,423.7 355.6 1,632.8 12.53
Default 100.00 46.37 43.72 35.15 163.0 157.2 5.7 5.4 70.15
Notes: 1. Each asset class includes purchased receivables.
2. The commitments that can be terminated at any time without condition or terminated automatically are not included in the amount of undrawn commitments and weighted average of credit conversion factor.
291
Status of exposure to which the internal ratings-based approach is applied
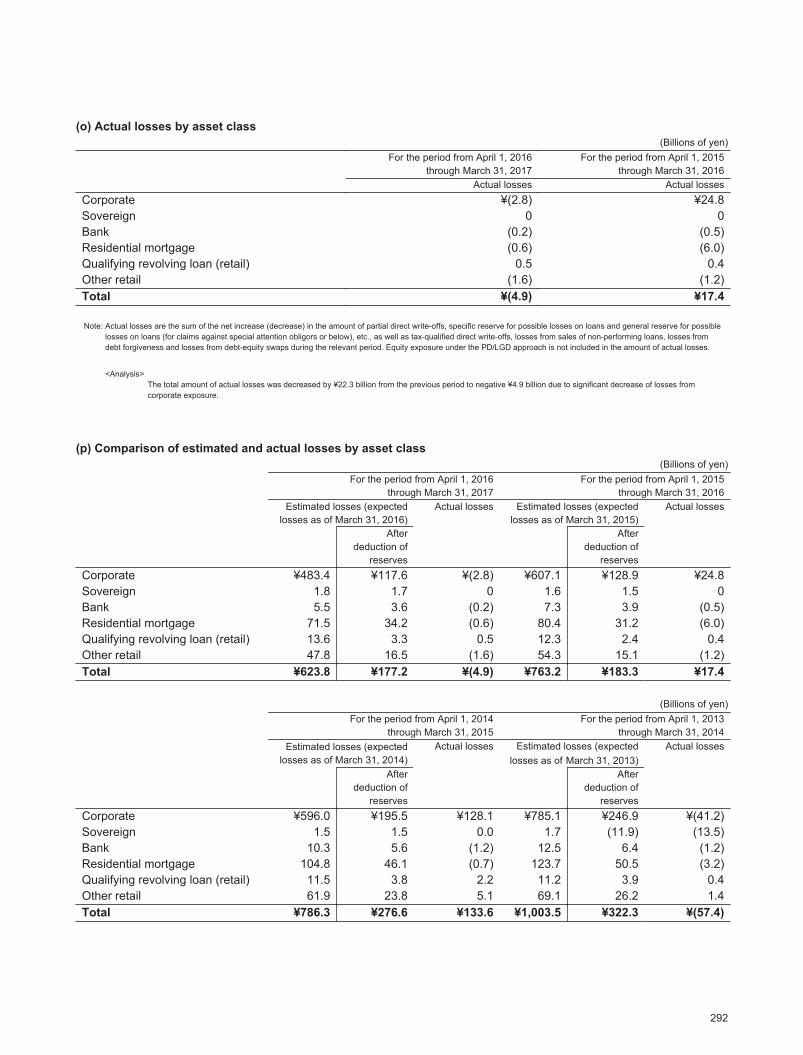
2017/09/06 9:42:26 / 17322939_株式会社みずほフィナンシャルグループ_総会その他(C)
(o) Actual losses by asset class(Billions of yen)
For the period from April 1, 2016through March 31, 2017
For the period from April 1, 2015through March 31, 2016
Actual losses Actual lossesCorporate ¥(2.8) ¥24.8Sovereign 0 0Bank (0.2) (0.5)Residential mortgage (0.6) (6.0)Qualifying revolving loan (retail) 0.5 0.4Other retail (1.6) (1.2)Total ¥(4.9) ¥17.4
Note: Actual losses are the sum of the net increase (decrease) in the amount of partial direct write-offs, specific reserve for possible losses on loans and general reserve for possible losses on loans (for claims against special attention obligors or below), etc., as well as tax-qualified direct write-offs, losses from sales of non-performing loans, losses from debt forgiveness and losses from debt-equity swaps during the relevant period. Equity exposure under the PD/LGD approach is not included in the amount of actual losses.
<Analysis>The total amount of actual losses was decreased by ¥22.3 billion from the previous period to negative ¥4.9 billion due to significant decrease of losses from corporate exposure.
(p) Comparison of estimated and actual losses by asset class(Billions of yen)
For the period from April 1, 2016through March 31, 2017
For the period from April 1, 2015through March 31, 2016
Estimated losses (expectedlosses as of March 31, 2016)
Actual losses Estimated losses (expectedlosses as of March 31, 2015)
Actual losses
Afterdeduction of
reserves
Afterdeduction of
reservesCorporate ¥483.4 ¥117.6 ¥(2.8) ¥607.1 ¥128.9 ¥24.8Sovereign 1.8 1.7 0 1.6 1.5 0Bank 5.5 3.6 (0.2) 7.3 3.9 (0.5)Residential mortgage 71.5 34.2 (0.6) 80.4 31.2 (6.0)Qualifying revolving loan (retail) 13.6 3.3 0.5 12.3 2.4 0.4Other retail 47.8 16.5 (1.6) 54.3 15.1 (1.2)Total ¥623.8 ¥177.2 ¥(4.9) ¥763.2 ¥183.3 ¥17.4
(Billions of yen)For the period from April 1, 2014
through March 31, 2015For the period from April 1, 2013
through March 31, 2014Estimated losses (expected
losses as of March 31, 2014)Actual losses Estimated losses (expected
losses as of March 31, 2013)Actual losses
Afterdeduction of
reserves
Afterdeduction of
reservesCorporate ¥596.0 ¥195.5 ¥128.1 ¥785.1 ¥246.9 ¥(41.2)Sovereign 1.5 1.5 0.0 1.7 (11.9) (13.5)Bank 10.3 5.6 (1.2) 12.5 6.4 (1.2)Residential mortgage 104.8 46.1 (0.7) 123.7 50.5 (3.2)Qualifying revolving loan (retail) 11.5 3.8 2.2 11.2 3.9 0.4Other retail 61.9 23.8 5.1 69.1 26.2 1.4Total ¥786.3 ¥276.6 ¥133.6 ¥1,003.5 ¥322.3 ¥(57.4)
292
Status of exposure to which the internal ratings-based approach is applied
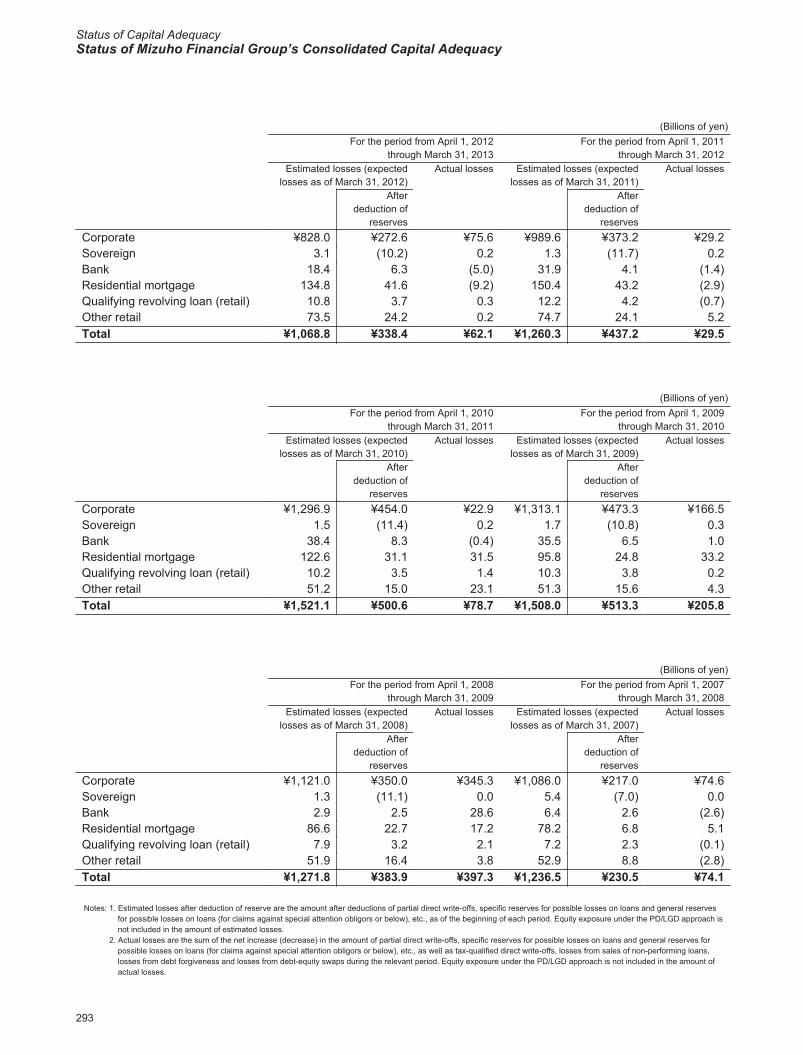
Status of Capital AdequacyStatus of Mizuho Financial Group’s Consolidated Capital Adequacy
2017/09/06 9:42:26 / 17322939_株式会社みずほフィナンシャルグループ_総会その他(C)
(Billions of yen)For the period from April 1, 2012
through March 31, 2013For the period from April 1, 2011
through March 31, 2012Estimated losses (expected
losses as of March 31, 2012)Actual losses Estimated losses (expected
losses as of March 31, 2011)Actual losses
Afterdeduction of
reserves
Afterdeduction of
reservesCorporate ¥828.0 ¥272.6 ¥75.6 ¥989.6 ¥373.2 ¥29.2Sovereign 3.1 (10.2) 0.2 1.3 (11.7) 0.2Bank 18.4 6.3 (5.0) 31.9 4.1 (1.4)Residential mortgage 134.8 41.6 (9.2) 150.4 43.2 (2.9)Qualifying revolving loan (retail) 10.8 3.7 0.3 12.2 4.2 (0.7)Other retail 73.5 24.2 0.2 74.7 24.1 5.2Total ¥1,068.8 ¥338.4 ¥62.1 ¥1,260.3 ¥437.2 ¥29.5
(Billions of yen)For the period from April 1, 2010
through March 31, 2011For the period from April 1, 2009
through March 31, 2010Estimated losses (expected
losses as of March 31, 2010)Actual losses Estimated losses (expected
losses as of March 31, 2009)Actual losses
Afterdeduction of
reserves
Afterdeduction of
reservesCorporate ¥1,296.9 ¥454.0 ¥22.9 ¥1,313.1 ¥473.3 ¥166.5Sovereign 1.5 (11.4) 0.2 1.7 (10.8) 0.3Bank 38.4 8.3 (0.4) 35.5 6.5 1.0Residential mortgage 122.6 31.1 31.5 95.8 24.8 33.2Qualifying revolving loan (retail) 10.2 3.5 1.4 10.3 3.8 0.2Other retail 51.2 15.0 23.1 51.3 15.6 4.3Total ¥1,521.1 ¥500.6 ¥78.7 ¥1,508.0 ¥513.3 ¥205.8
(Billions of yen)For the period from April 1, 2008
through March 31, 2009For the period from April 1, 2007
through March 31, 2008Estimated losses (expected
losses as of March 31, 2008)Actual losses Estimated losses (expected
losses as of March 31, 2007)Actual losses
Afterdeduction of
reserves
Afterdeduction of
reservesCorporate ¥1,121.0 ¥350.0 ¥345.3 ¥1,086.0 ¥217.0 ¥74.6Sovereign 1.3 (11.1) 0.0 5.4 (7.0) 0.0Bank 2.9 2.5 28.6 6.4 2.6 (2.6)Residential mortgage 86.6 22.7 17.2 78.2 6.8 5.1Qualifying revolving loan (retail) 7.9 3.2 2.1 7.2 2.3 (0.1)Other retail 51.9 16.4 3.8 52.9 8.8 (2.8)Total ¥1,271.8 ¥383.9 ¥397.3 ¥1,236.5 ¥230.5 ¥74.1
Notes: 1. Estimated losses after deduction of reserve are the amount after deductions of partial direct write-offs, specific reserves for possible losses on loans and general reserves for possible losses on loans (for claims against special attention obligors or below), etc., as of the beginning of each period. Equity exposure under the PD/LGD approach is not included in the amount of estimated losses.
2. Actual losses are the sum of the net increase (decrease) in the amount of partial direct write-offs, specific reserves for possible losses on loans and general reserves for possible losses on loans (for claims against special attention obligors or below), etc., as well as tax-qualified direct write-offs, losses from sales of non-performing loans, losses from debt forgiveness and losses from debt-equity swaps during the relevant period. Equity exposure under the PD/LGD approach is not included in the amount of actual losses.
293
Status of exposure to which the internal ratings-based approach is applied
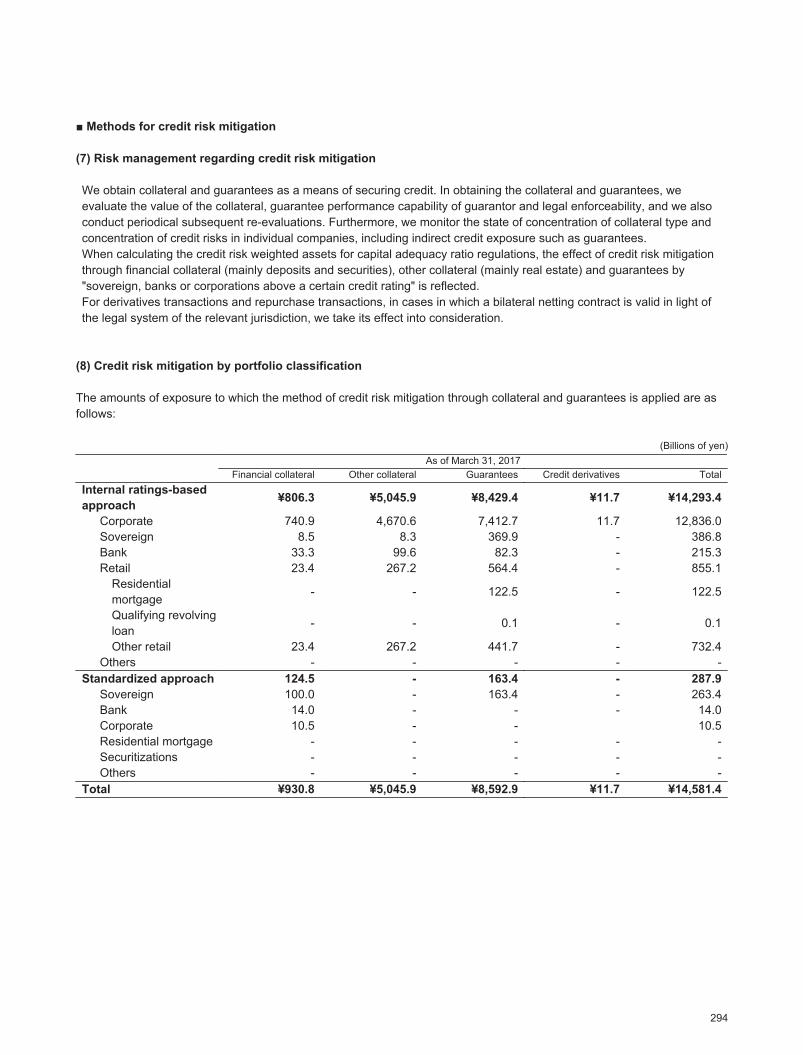
2017/09/06 9:42:26 / 17322939_株式会社みずほフィナンシャルグループ_総会その他(C)
■ Methods for credit risk mitigation
(7) Risk management regarding credit risk mitigation
We obtain collateral and guarantees as a means of securing credit. In obtaining the collateral and guarantees, we evaluate the value of the collateral, guarantee performance capability of guarantor and legal enforceability, and we also conduct periodical subsequent re-evaluations. Furthermore, we monitor the state of concentration of collateral type and concentration of credit risks in individual companies, including indirect credit exposure such as guarantees.When calculating the credit risk weighted assets for capital adequacy ratio regulations, the effect of credit risk mitigation through financial collateral (mainly deposits and securities), other collateral (mainly real estate) and guarantees by "sovereign, banks or corporations above a certain credit rating" is reflected.For derivatives transactions and repurchase transactions, in cases in which a bilateral netting contract is valid in light of the legal system of the relevant jurisdiction, we take its effect into consideration.
(8) Credit risk mitigation by portfolio classification
The amounts of exposure to which the method of credit risk mitigation through collateral and guarantees is applied are as follows:
(Billions of yen)As of March 31, 2017
Financial collateral Other collateral Guarantees Credit derivatives TotalInternal ratings-basedapproach ¥806.3 ¥5,045.9 ¥8,429.4 ¥11.7 ¥14,293.4
Corporate 740.9 4,670.6 7,412.7 11.7 12,836.0Sovereign 8.5 8.3 369.9 - 386.8Bank 33.3 99.6 82.3 - 215.3Retail 23.4 267.2 564.4 - 855.1
Residential mortgage - - 122.5 - 122.5
Qualifying revolvingloan - - 0.1 - 0.1
Other retail 23.4 267.2 441.7 - 732.4Others - - - - -
Standardized approach 124.5 - 163.4 - 287.9Sovereign 100.0 - 163.4 - 263.4Bank 14.0 - - - 14.0Corporate 10.5 - - 10.5Residential mortgage - - - - -Securitizations - - - - -Others - - - - -
Total ¥930.8 ¥5,045.9 ¥8,592.9 ¥11.7 ¥14,581.4
294
Methods for credit risk mitigation、Credit risk mitigation by portfolio classification
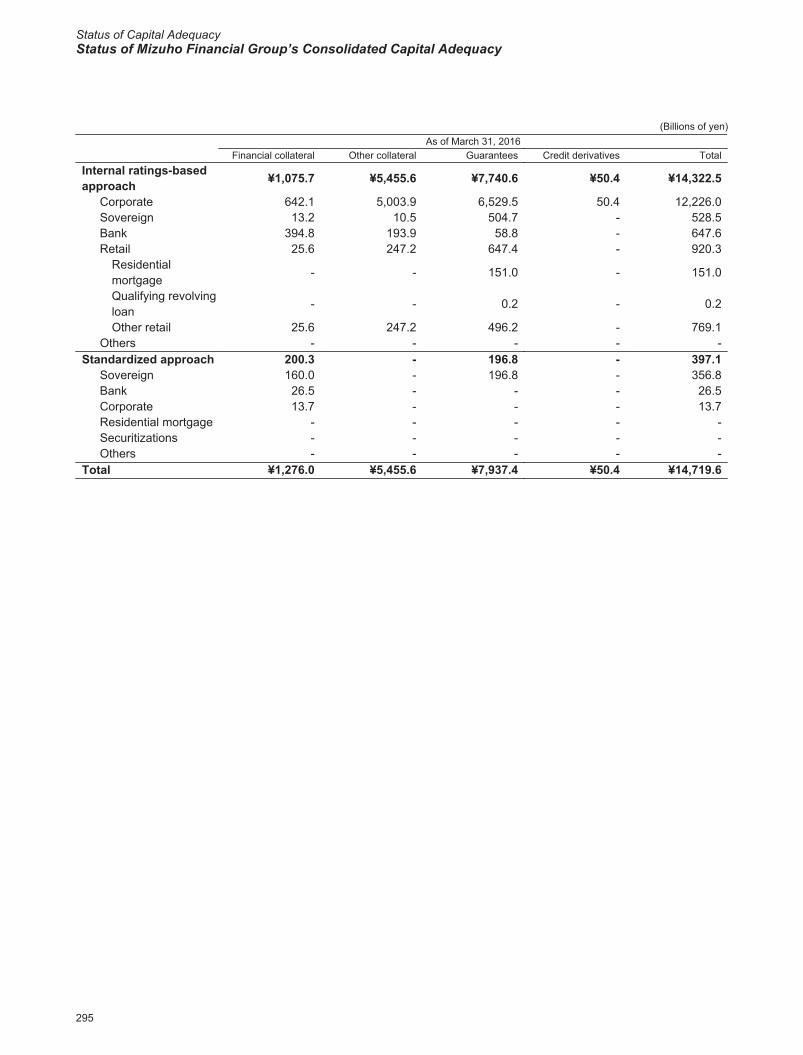
Status of Capital AdequacyStatus of Mizuho Financial Group’s Consolidated Capital Adequacy
2017/09/06 9:42:26 / 17322939_株式会社みずほフィナンシャルグループ_総会その他(C)
(Billions of yen)As of March 31, 2016
Financial collateral Other collateral Guarantees Credit derivatives TotalInternal ratings-basedapproach ¥1,075.7 ¥5,455.6 ¥7,740.6 ¥50.4 ¥14,322.5
Corporate 642.1 5,003.9 6,529.5 50.4 12,226.0Sovereign 13.2 10.5 504.7 - 528.5Bank 394.8 193.9 58.8 - 647.6Retail 25.6 247.2 647.4 - 920.3
Residential mortgage - - 151.0 - 151.0
Qualifying revolvingloan - - 0.2 - 0.2
Other retail 25.6 247.2 496.2 - 769.1Others - - - - -
Standardized approach 200.3 - 196.8 - 397.1Sovereign 160.0 - 196.8 - 356.8Bank 26.5 - - - 26.5Corporate 13.7 - - - 13.7Residential mortgage - - - - -Securitizations - - - - -Others - - - - -
Total ¥1,276.0 ¥5,455.6 ¥7,937.4 ¥50.4 ¥14,719.6
295
Credit risk mitigation by portfolio classification
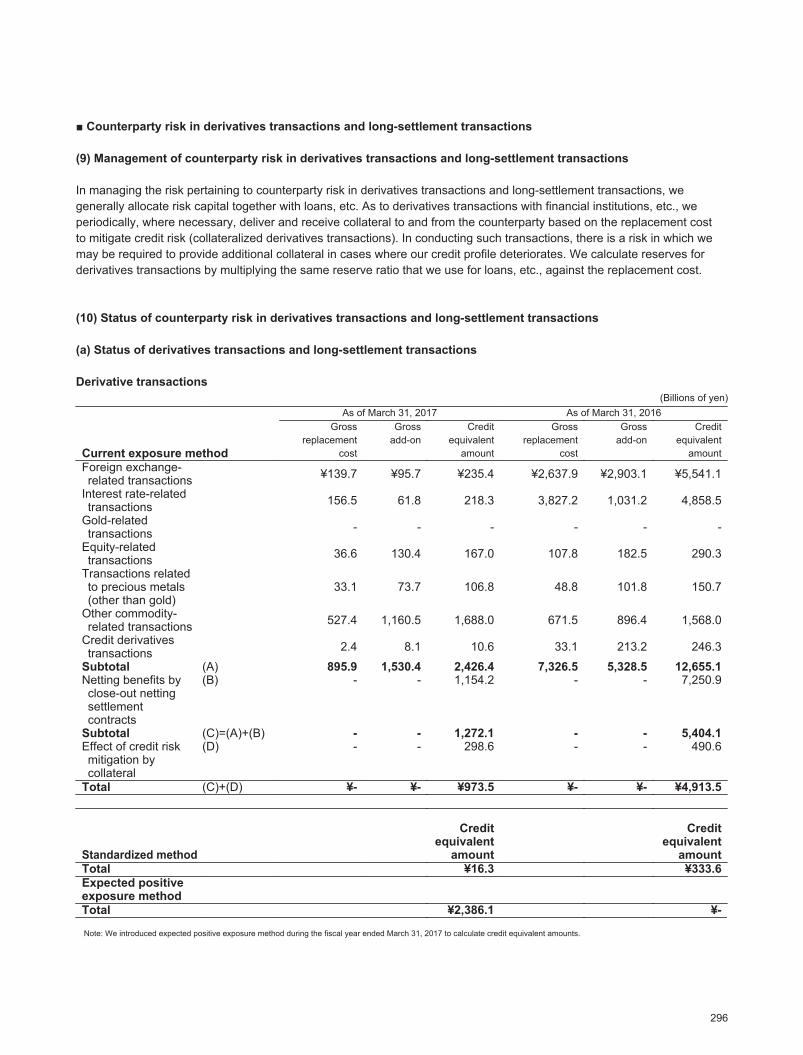
2017/09/06 9:42:26 / 17322939_株式会社みずほフィナンシャルグループ_総会その他(C)
■ Counterparty risk in derivatives transactions and long-settlement transactions
(9) Management of counterparty risk in derivatives transactions and long-settlement transactions
In managing the risk pertaining to counterparty risk in derivatives transactions and long-settlement transactions, we generally allocate risk capital together with loans, etc. As to derivatives transactions with financial institutions, etc., we periodically, where necessary, deliver and receive collateral to and from the counterparty based on the replacement cost to mitigate credit risk (collateralized derivatives transactions). In conducting such transactions, there is a risk in which we may be required to provide additional collateral in cases where our credit profile deteriorates. We calculate reserves for derivatives transactions by multiplying the same reserve ratio that we use for loans, etc., against the replacement cost.
(10) Status of counterparty risk in derivatives transactions and long-settlement transactions
(a) Status of derivatives transactions and long-settlement transactions
Derivative transactions(Billions of yen)
As of March 31, 2017 As of March 31, 2016
Current exposure method
Grossreplacement
cost
Grossadd-on
Creditequivalent
amount
Grossreplacement
cost
Grossadd-on
Creditequivalent
amountForeign exchange-related transactions ¥139.7 ¥95.7 ¥235.4 ¥2,637.9 ¥2,903.1 ¥5,541.1
Interest rate-relatedtransactions 156.5 61.8 218.3 3,827.2 1,031.2 4,858.5
Gold-relatedtransactions - - - - - -
Equity-relatedtransactions 36.6 130.4 167.0 107.8 182.5 290.3
Transactions relatedto precious metals(other than gold)
33.1 73.7 106.8 48.8 101.8 150.7
Other commodity-related transactions 527.4 1,160.5 1,688.0 671.5 896.4 1,568.0
Credit derivativestransactions 2.4 8.1 10.6 33.1 213.2 246.3
Subtotal (A) 895.9 1,530.4 2,426.4 7,326.5 5,328.5 12,655.1Netting benefits byclose-out nettingsettlementcontracts
(B) - - 1,154.2 - - 7,250.9
Subtotal (C)=(A)+(B) - - 1,272.1 - - 5,404.1Effect of credit riskmitigation bycollateral
(D) - - 298.6 - - 490.6
Total (C)+(D) ¥- ¥- ¥973.5 ¥- ¥- ¥4,913.5
Standardized method
Creditequivalent
amount
Creditequivalent
amountTotal ¥16.3 ¥333.6Expected positive exposure methodTotal ¥2,386.1 ¥-
Note: We introduced expected positive exposure method during the fiscal year ended March 31, 2017 to calculate credit equivalent amounts.
296
Counterparty risk in derivatives transactions and long-settlement transactions、Status of counterparty risk in derivatives transactions and long-settlement transactions
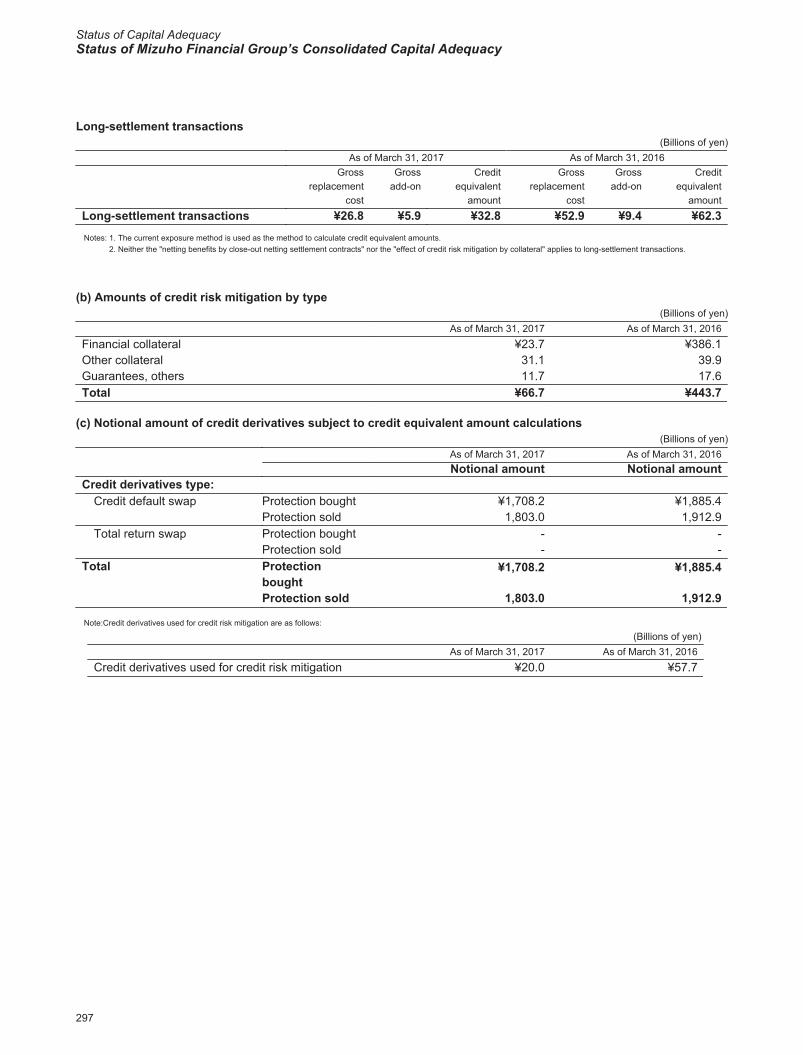
Status of Capital AdequacyStatus of Mizuho Financial Group’s Consolidated Capital Adequacy
2017/09/06 9:42:26 / 17322939_株式会社みずほフィナンシャルグループ_総会その他(C)
Long-settlement transactions(Billions of yen)
As of March 31, 2017 As of March 31, 2016Gross
replacementcost
Grossadd-on
Creditequivalent
amount
Grossreplacement
cost
Grossadd-on
Creditequivalent
amountLong-settlement transactions ¥26.8 ¥5.9 ¥32.8 ¥52.9 ¥9.4 ¥62.3Notes: 1. The current exposure method is used as the method to calculate credit equivalent amounts.
2. Neither the "netting benefits by close-out netting settlement contracts" nor the "effect of credit risk mitigation by collateral" applies to long-settlement transactions.
(b) Amounts of credit risk mitigation by type(Billions of yen)
As of March 31, 2017 As of March 31, 2016Financial collateral ¥23.7 ¥386.1Other collateral 31.1 39.9Guarantees, others 11.7 17.6Total ¥66.7 ¥443.7
(c) Notional amount of credit derivatives subject to credit equivalent amount calculations(Billions of yen)
As of March 31, 2017 As of March 31, 2016Notional amount Notional amount
Credit derivatives type:Credit default swap Protection bought ¥1,708.2 ¥1,885.4
Protection sold 1,803.0 1,912.9Total return swap Protection bought - -
Protection sold - -Total Protection
bought¥1,708.2 ¥1,885.4
Protection sold 1,803.0 1,912.9
Note:Credit derivatives used for credit risk mitigation are as follows:
(Billions of yen)As of March 31, 2017 As of March 31, 2016
Credit derivatives used for credit risk mitigation ¥20.0 ¥57.7
297
Status of counterparty risk in derivatives transactions and long-settlement transactions
2017/09/06 9:42:26 / 17322939_株式会社みずほフィナンシャルグループ_総会その他(C)
■ Securitization exposure
We classify transactions as securitization exposure based on two characteristics, "non-recourse" and "senior/subordinated structure," pursuant to the definitions set forth in the FSA Notice No. 20, etc.; provided that the transactions do not include those which fall within specialized lending exposure.
(11) Summary of securitization exposure and its risk management
We are associated with securitization transactions from various purposes and positions through our banking book and trading book. Quantitative information related to (a) to (c) below is disclosed in "(13) Quantitative disclosure items for securitization exposure," in accordance with the definitions set forth in the FSA Notice No. 20. Securitization exposures are separately disclosed for calculation of credit risk-weighted assets and market risk equivalent amounts.
○The role of our securitization transactions
(a) Securitization of our assets ("Securitization as originator")For the purposes of mitigating credit risk and credit concentration risk, controlling economic capital and responding to the needs of our investors, etc., we engage in securitization transactions the underlying assets of which include mortgage loans and loans to our corporate customers. When conducting a securitization as an originator, we consider such transaction from various aspects, including the effects of reduction of economic capital and improvement of return on risk as well as the practical effects of risk transfers, and make a comprehensive judgment on structure and appropriateness of transaction.
(b) Securitization program (ABCP/ABL) sponsorAs a means of supporting our customers in their securitization of their account receivables and notes receivables, etc., we retain securitization exposure by providing asset-backed loans (ABLs, which are on-balance-sheet transactions), and providing asset-backed commercial paper (ABCP) backup lines (off-balance-sheet transactions), as sponsor to special purpose companies (in the form of Cayman Islands Corporations, etc.). In such cases, in addition to gaining firm understanding of the actual risk profile through due diligence from the viewpoint of investors, we assign internal ratings and make evaluations by assessing such transactions and carefully managing the exposure together with other direct loan assets.
(c) Investment in alternative credit risk assets ("Securitization transactions as investor")We hold securitization products, such as ABS, CMBS, RMBS, and CDO, and resecuritization products, the underlying assets of which are mainly RMBS and CDO, etc., for the purpose of investing in alternative credit risk assets that are different from conventional credit risk assets in order to diversify our investment portfolio. The Risk Management Committee, etc. set limits on the amount of investment for securitization transactions as investor, and we maintain a stringent structure for management of such transactions. In addition, we implement stress tests based on scenarios under the market liquidity depletion and sharp price declines.
In addition, we undertake various securitization program arrangements such as ABL, ABCP and trust schemes, etc., as ameans of financing for our customers. We endeavor to understand the actual risk profile, including the underlying assets, and to disclose appropriately the risks and terms of the program to the customers who invest in the product.Furthermore, we actively act as servicer for securitization transactions, offer settlement account facilities (servicer cash advance) and provide interest rate swaps to securitization conduits.
None of our affiliated entities hold securitization products in which we are involved as originators or sponsors.
○ Overview of risk characteristics in securitization and monitoring system
In addition to price fluctuation and market liquidity risks, securitization and resecuritization products are exposed to risks related to default, recovery and granularity of underlying asset portfolio.
298
Summary of securitization exposure and its risk management
Status of Capital AdequacyStatus of Mizuho Financial Group’s Consolidated Capital Adequacy
2017/09/06 9:42:26 / 17322939_株式会社みずほフィナンシャルグループ_総会その他(C)
The structure of these products also contains risks related to the originators, the administrators, trustees and managers of the underlying assets.
To address these risks, we also analyze the structure in terms of the underlying assets and credit events. We monitor the ability, quality and operating performance of originators and managers in charge of controlling the underlying assets as well as covenant information and credit status of the parties related to the program.In addition, for resecuritization products, we pay attention to the underlying assets of the underlying securitization products.
We also assign internal ratings to all products and review the rating at least once a year. If there is a change in the credit situations, we will review the internal rating as appropriate. As mentioned above, we have established a system to comprehensively understand the risk characteristics of securitization exposures and manage these exposures.
We conduct credit risk measurements on all credit transactions, including securitization transactions. Furthermore, we carry out periodic monitoring on investment amount and performance on securitization transactions and report the situations to our Risk Management Committee, etc.
○Status of response to Basel Framework
In calculating credit risk-weighted assets of securitization exposure under the internal ratings-based approach, we apply the ratings-based approach ("RBA") if the asset has a rating obtained from eligible external credit assessment institutions and apply the supervisory formula approach ("SF") in other cases pursuant to the FSA Notice No. 20. We apply a risk weight of 1,250% under Basel III when neither RBA nor SF can be applied.
In addition, in calculating credit risk-weighted assets of securitization exposure under the standardized approach, we calculate based on risk weight according to ratings by eligible external credit assessment institutions and weighted average risk weight of underlying assets.
In terms of securitization exposure in our trading book that is subject to market risk regulations, we adopt the standardized measurement method and calculate market risk equivalent amounts in connection with the specific risks of securitization products based on risk weights according to ratings assigned by eligible external credit assessment institutions pursuant to the FSA Notice No. 20.
As for the eligible external credit assessment institutions, we refer to Rating and Investment Information, Inc. (R&I), Japan Credit Rating Agency, Ltd. (JCR), Moody's Investors Service Inc. (Moody's), Standard & Poor's (S&P) and Fitch Ratings, Ltd. in determining securitization exposure risk weight (We do not separately designate eligible external credit assessment institutions for each type of securitization exposure).
(12) Accounting policies for securitization transactions
The point at which financial assets and liabilities relating to securitization transactions begin or cease to be recognized, their evaluation and accounting treatment are pursuant to "Accounting Standards Relating to Financial Products" (Business Accounting Standards No. 10), etc., and we applied (a) valuations obtained from brokers and others or (b) reasonably calculated prices based on the reasonable estimates of our management as fair value, unless it is deemed to be extremely difficult to determine the fair value. In deriving reasonably calculated prices based on the reasonable estimates of our management, we used the discounted cash flow method, and the price decision variables include default rates, recovery rates, pre-payment rates and discount rates.
Furthermore, we apply appropriate accounting treatment on compound financial products based on "Report on Auditing Securitized Instruments", announced by the Japanese Institute of Certified Public Accountants on March 26, 2008.
299
Summary of securitization exposure and its risk management
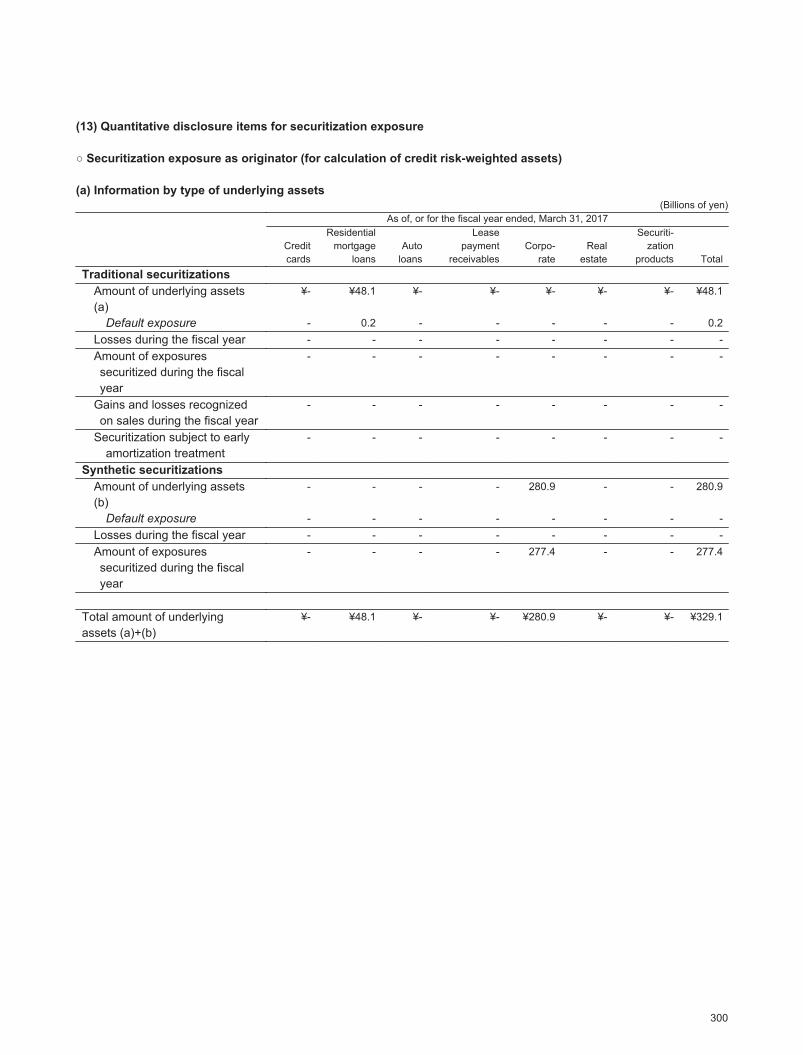
2017/09/06 9:42:26 / 17322939_株式会社みずほフィナンシャルグループ_総会その他(C)
(13) Quantitative disclosure items for securitization exposure
○ Securitization exposure as originator (for calculation of credit risk-weighted assets)
(a) Information by type of underlying assets(Billions of yen)
As of, or for the fiscal year ended, March 31, 2017
Creditcards
Residentialmortgage
loansAuto
loans
Leasepayment
receivablesCorpo-
rateReal
estate
Securiti-zation
products TotalTraditional securitizations
Amount of underlying assets (a)
¥- ¥48.1 ¥- ¥- ¥- ¥- ¥- ¥48.1
Default exposure - 0.2 - - - - - 0.2Losses during the fiscal year - - - - - - - -Amount of exposures securitized during the fiscal year
- - - - - - - -
Gains and losses recognized on sales during the fiscal year
- - - - - - - -
Securitization subject to earlyamortization treatment
- - - - - - - -
Synthetic securitizationsAmount of underlying assets (b)
- - - - 280.9 - - 280.9
Default exposure - - - - - - - -Losses during the fiscal year - - - - - - - -Amount of exposures securitized during the fiscal year
- - - - 277.4 - - 277.4
Total amount of underlying assets (a)+(b)
¥- ¥48.1 ¥- ¥- ¥280.9 ¥- ¥- ¥329.1
300
Securitization exposure as originator (for calculation of credit risk-weighted assets)
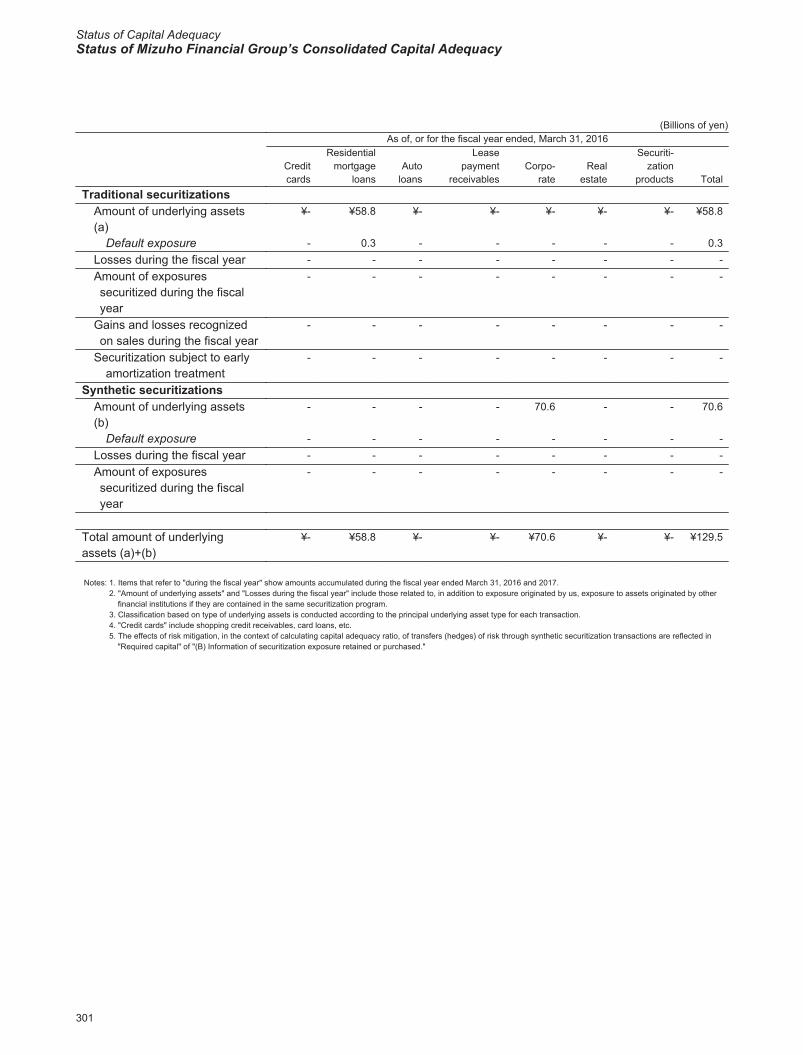
Status of Capital AdequacyStatus of Mizuho Financial Group’s Consolidated Capital Adequacy
2017/09/06 9:42:26 / 17322939_株式会社みずほフィナンシャルグループ_総会その他(C)
(Billions of yen)As of, or for the fiscal year ended, March 31, 2016
Creditcards
Residentialmortgage
loansAuto
loans
Leasepayment
receivablesCorpo-
rateReal
estate
Securiti-zation
products TotalTraditional securitizations
Amount of underlying assets (a)
¥- ¥58.8 ¥- ¥- ¥- ¥- ¥- ¥58.8
Default exposure - 0.3 - - - - - 0.3Losses during the fiscal year - - - - - - - -Amount of exposures securitized during the fiscal year
- - - - - - - -
Gains and losses recognized on sales during the fiscal year
- - - - - - - -
Securitization subject to earlyamortization treatment
- - - - - - - -
Synthetic securitizationsAmount of underlying assets (b)
- - - - 70.6 - - 70.6
Default exposure - - - - - - - -Losses during the fiscal year - - - - - - - -Amount of exposures securitized during the fiscal year
- - - - - - - -
Total amount of underlying assets (a)+(b)
¥- ¥58.8 ¥- ¥- ¥70.6 ¥- ¥- ¥129.5
Notes: 1. Items that refer to "during the fiscal year" show amounts accumulated during the fiscal year ended March 31, 2016 and 2017.2. "Amount of underlying assets" and "Losses during the fiscal year" include those related to, in addition to exposure originated by us, exposure to assets originated by other
financial institutions if they are contained in the same securitization program.3. Classification based on type of underlying assets is conducted according to the principal underlying asset type for each transaction.4. "Credit cards" include shopping credit receivables, card loans, etc.5. The effects of risk mitigation, in the context of calculating capital adequacy ratio, of transfers (hedges) of risk through synthetic securitization transactions are reflected in
"Required capital" of "(B) Information of securitization exposure retained or purchased."
301
Securitization exposure as originator (for calculation of credit risk-weighted assets)
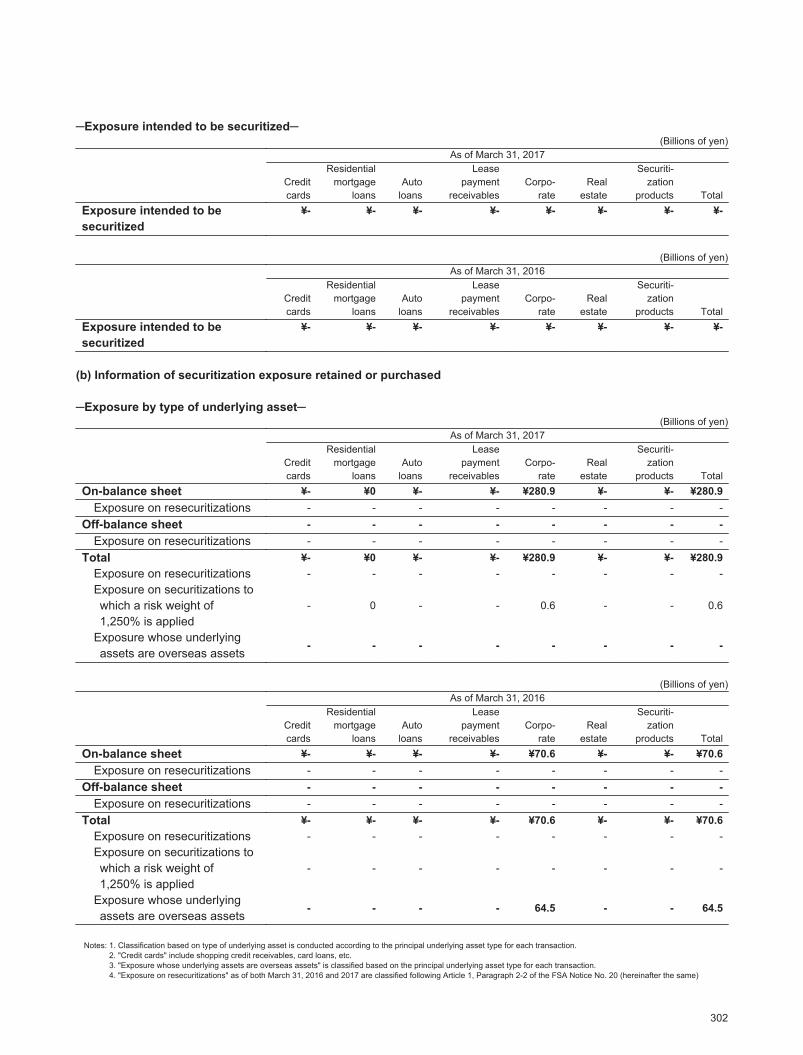
2017/09/06 9:42:26 / 17322939_株式会社みずほフィナンシャルグループ_総会その他(C)
─Exposure intended to be securitized─(Billions of yen)
As of March 31, 2017
Creditcards
Residentialmortgage
loansAuto
loans
Leasepayment
receivablesCorpo-
rateReal
estate
Securiti-zation
products TotalExposure intended to besecuritized
¥- ¥- ¥- ¥- ¥- ¥- ¥- ¥-
(Billions of yen)As of March 31, 2016
Creditcards
Residentialmortgage
loansAuto
loans
Leasepayment
receivablesCorpo-
rateReal
estate
Securiti-zation
products TotalExposure intended to besecuritized
¥- ¥- ¥- ¥- ¥- ¥- ¥- ¥-
(b) Information of securitization exposure retained or purchased
─Exposure by type of underlying asset─(Billions of yen)
As of March 31, 2017
Creditcards
Residentialmortgage
loansAuto
loans
Leasepayment
receivablesCorpo-
rateReal
estate
Securiti-zation
products TotalOn-balance sheet ¥- ¥0 ¥- ¥- ¥280.9 ¥- ¥- ¥280.9
Exposure on resecuritizations - - - - - - - -Off-balance sheet - - - - - - - -
Exposure on resecuritizations - - - - - - - -Total ¥- ¥0 ¥- ¥- ¥280.9 ¥- ¥- ¥280.9
Exposure on resecuritizations - - - - - - - -Exposure on securitizations to which a risk weight of 1,250% is applied
- 0 - - 0.6 - - 0.6
Exposure whose underlying assets are overseas assets
- - - - - - - -
(Billions of yen)As of March 31, 2016
Creditcards
Residentialmortgage
loansAuto
loans
Leasepayment
receivablesCorpo-
rateReal
estate
Securiti-zation
products TotalOn-balance sheet ¥- ¥- ¥- ¥- ¥70.6 ¥- ¥- ¥70.6
Exposure on resecuritizations - - - - - - - -Off-balance sheet - - - - - - - -
Exposure on resecuritizations - - - - - - - -Total ¥- ¥- ¥- ¥- ¥70.6 ¥- ¥- ¥70.6
Exposure on resecuritizations - - - - - - - -Exposure on securitizations to which a risk weight of 1,250% is applied
- - - - - - - -
Exposure whose underlying assets are overseas assets
- - - - 64.5 - - 64.5
Notes: 1. Classification based on type of underlying asset is conducted according to the principal underlying asset type for each transaction.2. "Credit cards" include shopping credit receivables, card loans, etc.3. "Exposure whose underlying assets are overseas assets" is classified based on the principal underlying asset type for each transaction.4. "Exposure on resecuritizations" as of both March 31, 2016 and 2017 are classified following Article 1, Paragraph 2-2 of the FSA Notice No. 20 (hereinafter the same)
302
Securitization exposure as originator (for calculation of credit risk-weighted assets)
Status of Capital AdequacyStatus of Mizuho Financial Group’s Consolidated Capital Adequacy
2017/09/06 9:42:26 / 17322939_株式会社みずほフィナンシャルグループ_総会その他(C)
─Exposure by risk weight category─(Billions of yen)
As of March 31, 2017On-
balancesheet
Off-balance
sheet TotalExposure on
resecuritizationsExposure on
resecuritizationsExposure on
resecuritizations
Riskweight
Up to 20% ¥267.4 ¥- ¥- ¥- ¥267.4 ¥-Up to 50% - - - - - -Up to 100% - - - - - -Up to 250% 1.7 - - - 1.7 -Up to 650% - - - - - -Less than 1,250%
11.1 - - - 11.1 -
1,250% 0.6 - - - 0.6 -Total ¥280.9 ¥- ¥- ¥- ¥280.9 ¥-
(Billions of yen)As of March 31, 2016
On-balance
sheet
Off-balance
sheet TotalExposure on
resecuritizationsExposure on
resecuritizationsExposure on
resecuritizations
Riskweight
Up to 20% ¥62.7 ¥- ¥- ¥- ¥62.7 ¥-Up to 50% - - - - - -Up to 100% - - - - - -Up to 250% 1.7 - - - 1.7 -Up to 650% 6.1 - - - 6.1 -Less than 1,250%
- - - - - -
1,250% - - - - - -Total ¥70.6 ¥- ¥- ¥- ¥70.6 ¥-
─Amount of required capital by risk weight category─(Billions of yen)
As of March 31, 2017On-
balancesheet
Off-balance
sheet TotalExposure on
resecuritizationsExposure on
resecuritizationsExposure on
resecuritizations
Riskweight
Up to 20% ¥1.5 ¥- ¥- ¥- ¥1.5 ¥-Up to 50% - - - - - -Up to 100% - - - - - -Up to 250% - - - - - -Up to 650% - - - - - -Less than 1,250%
0.2 - - - 0.2 -
1,250% 0.7 - - - 0.7 -Total ¥2.6 ¥- ¥- ¥- ¥2.6 ¥-
303
Securitization exposure as originator (for calculation of credit risk-weighted assets)
2017/09/06 9:42:26 / 17322939_株式会社みずほフィナンシャルグループ_総会その他(C)
(Billions of yen)As of March 31, 2016
On-balance
sheet
Off-balance
sheet TotalExposure on
resecuritizationsExposure on
resecuritizationsExposure on
resecuritizations
Riskweight
Up to 20% ¥0.3 ¥- ¥- ¥- ¥0.3 ¥-Up to 50% - - - - - -Up to 100% - - - - - -Up to 250% - - - - - -Up to 650% 0.5 - - - 0.5 -Less than 1,250%
- - - - - -
1,250% - - - - - -Total ¥0.9 ¥- ¥- ¥- ¥0.9 ¥-
─Credit risk mitigation against exposure on resecuritizations─(Billions of yen)
As of March 31, 2017 As of March 31, 2016
Riskweight
Up to 20% ¥- ¥-Up to 50% - -Up to 100% - -Up to 250% - -Up to 650% - -Over 650% - -
Total ¥- ¥-
Note: The above table shows the exposure on resecuritizations based on the risk weight after taking into consideration the effect of method to mitigate credit risk.
─Capital increase due to securitization transactions─(Billions of yen)
As of March 31, 2017
Creditcards
Residentialmortgage
loansAuto
loans
Leasepayment
receivables CorporateReal
estate
Securiti-zation
products TotalCapital increase due to securitization transactions
¥- ¥- ¥- ¥- ¥- ¥- ¥- ¥-
(Billions of yen)As of March 31, 2016
Creditcards
Residentialmortgage
loansAuto
loans
Leasepayment
receivables CorporateReal
estate
Securiti-zation
products TotalCapital increase due to securitization transactions
¥- ¥- ¥- ¥- ¥- ¥- ¥- ¥-
304
Securitization exposure as originator (for calculation of credit risk-weighted assets)
Status of Capital AdequacyStatus of Mizuho Financial Group’s Consolidated Capital Adequacy
2017/09/06 9:42:26 / 17322939_株式会社みずほフィナンシャルグループ_総会その他(C)
○ Securitization exposure as sponsor of securitization programs (ABCP/ABL) (for calculation of credit risk-weighted assets)
(c) Information by type of underlying assets(Billions of yen)
As of, or for the fiscal year ended, March 31, 2017
Creditcards
Residentialmortgage
loansAuto
loans
Leasepayment
receivables
Accountand note
receivablesReal
estate Others TotalAmount of underlying assets
¥43.3 ¥- ¥74.4 ¥31.9 ¥307.5 ¥- ¥43.3 ¥500.6
Default exposure - - - - 4.9 - - 4.9Estimated loss amountrelated to underlying assets during the fiscal year
1.6 - 0.8 0.5 5.8 - 0.7 9.6
Amount of exposuressecuritized during the fiscal year
¥394.0 ¥- ¥814.3 ¥753.7 ¥2,512.4 ¥- ¥680.3 ¥5,154.9
(Billions of yen)As of, or for the fiscal year ended, March 31, 2016
Creditcards
Residentialmortgage
loansAuto
loans
Leasepayment
receivables
Accountand note
receivablesReal
estate Others TotalAmount of underlying assets
¥60.8 ¥- ¥103.2 ¥161.5 ¥400.2 ¥- ¥61.2 ¥787.1
Default exposure - - - - 3.3 - - 3.3Estimated loss amountrelated to underlying assets during the fiscal year
1.5 - 0.8 3.6 5.0 - 2.2 13.3
Amount of exposuressecuritized during the fiscal year
¥1,263.5 ¥- ¥862.3 ¥648.8 ¥3,077.6 ¥- ¥828.7 ¥6,681.0
Notes: 1. Items that refer to "during the fiscal year" show amounts accumulated during the fiscal year ended March 31, 2016 and 2017.2. Securitization exposure that is acquired in securitization of customer’s claims other than as sponsor (in the form of asset-backed securities, trust beneficiary rights and other
transferable instruments) is categorized as securitization exposure as investor.3. The amount of default exposure is the amount of the underlying assets recognized as default in the calculation of capital adequacy ratio.4. Estimated loss amount related to underlying assets is based on the amount of the underlying assets as of the relevant date and the following parameters that are used in
the calculation of capital adequacy ratio:・ parameters used in the calculation of required capital for an underlying asset when applying the supervisory formula (e.g., PD); and・ with respect to underlying assets classified as securitization exposure, the conservative application of risk weights used in the ratings-based approach.
5. Classification based on type of underlying assets is conducted according to the principal underlying asset type for each transaction. Transactions that are difficult to classify are included under "Others."
6. "Credit cards" include shopping credit receivables, card loans, etc
305
Securitization exposure as sponsor of securitization programs (ABCP/ABL) (for calculation of credit risk-weighted assets)
2017/09/06 9:42:26 / 17322939_株式会社みずほフィナンシャルグループ_総会その他(C)
(d) Information of securitization exposure retained or purchased
─Exposure by type of underlying asset─(Billions of yen)
As of March 31, 2017
Creditcards
Residentialmortgage
loansAuto
loans
Leasepayment
receivables
Accountand note
receivablesReal
estate Others TotalOn-balance sheet ¥17.8 ¥- ¥62.7 ¥30.1 ¥296.3 ¥- ¥43.3 ¥450.6
Exposure onresecuritizations
- - - - - - - -
Off-balance sheet 136.3 - 0.1 - 54.0 - 27.6 218.2Exposure onresecuritizations
- - - - - - - -
Total ¥154.2 ¥- ¥62.9 ¥30.1 ¥350.4 ¥- ¥71.0 ¥668.8Exposure on resecuritizations
- - - - - - - -
Exposure onsecuritizations towhich a risk weightof 1,250% is applied
- - - - - - - -
Exposure whoseunderlying assetsare overseasassets
98.2 - - 18.0 153.0 - 58.3 327.7
(Billions of yen)As of March 31, 2016
Creditcards
Residentialmortgage
loansAuto
loans
Leasepayment
receivables
Accountand note
receivablesReal
estate Others TotalOn-balance sheet ¥32.3 ¥- ¥95.9 ¥78.0 ¥388.6 ¥- ¥61.0 ¥656.1
Exposure onresecuritizations
- - - - - - - -
Off-balance sheet 137.3 - 48.6 0.0 64.9 - - 251.0Exposure onresecuritizations
- - - - - - - -
Total ¥169.7 ¥- ¥144.5 ¥78.1 ¥453.6 ¥- ¥61.0 ¥907.1Exposure onresecuritizations
- - - - - - - -
Exposure onsecuritizations towhich a risk weightof 1,250% is applied
- - - - - - - -
Exposure whoseunderlying assetsare overseasassets
111.5 - 90.2 53.5 200.4 - 31.8 487.6
Notes: 1. Securitization exposure retained or purchased includes unused portions of securitization programs that are subject to allocation of required capital.2. Classification based on type of underlying assets is conducted according to the principal underlying asset type for each transaction. Transactions that are difficult to classify
are included under "Others."3. Credit cards" include shopping credit receivables, card loans, etc.4. The classification of transactions of which the underlying assets are overseas assets is conducted according to the principal underlying assets of each transaction.5. "Exposure on resecuritizations" as of both March 31, 2016 and 2017 are classified following Article 1, Paragraph 2-2 of the FSA Notice No. 20 (hereinafter the same)
306
Securitization exposure as sponsor of securitization programs (ABCP/ABL) (for calculation of credit risk-weighted assets)
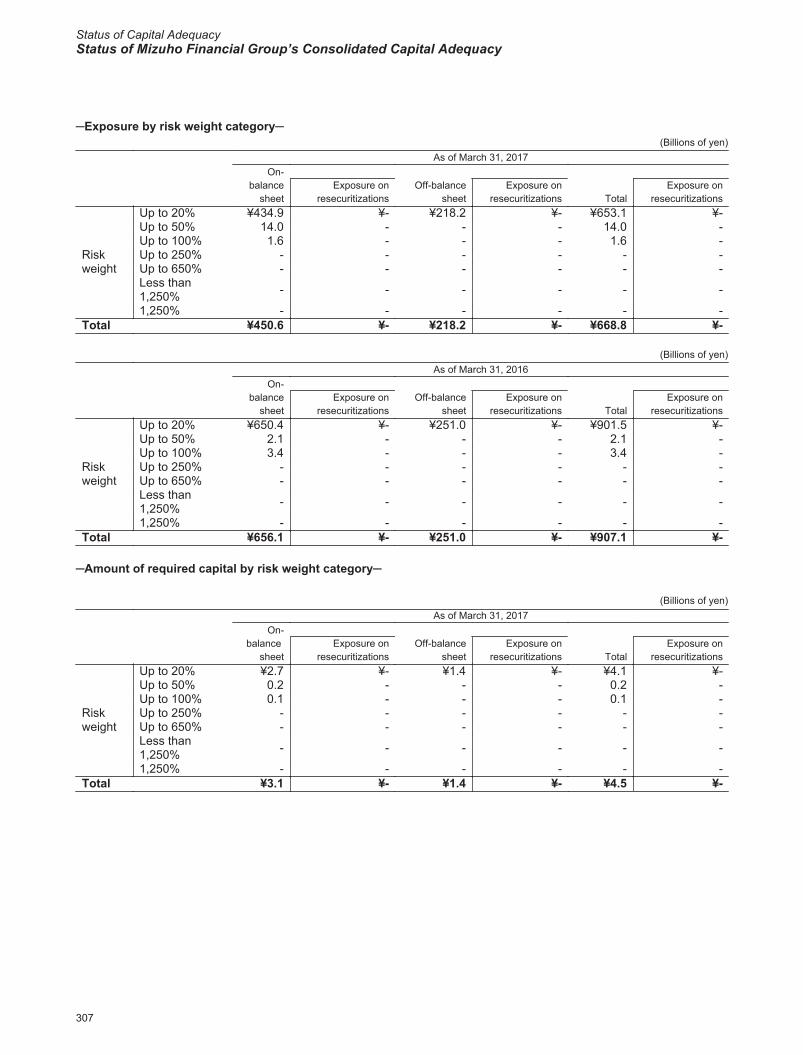
Status of Capital AdequacyStatus of Mizuho Financial Group’s Consolidated Capital Adequacy
2017/09/06 9:42:26 / 17322939_株式会社みずほフィナンシャルグループ_総会その他(C)
─Exposure by risk weight category─(Billions of yen)
As of March 31, 2017On-
balancesheet
Off-balancesheet Total
Exposure onresecuritizations
Exposure onresecuritizations
Exposure onresecuritizations
Riskweight
Up to 20% ¥434.9 ¥- ¥218.2 ¥- ¥653.1 ¥-Up to 50% 14.0 - - - 14.0 -Up to 100% 1.6 - - - 1.6 -Up to 250% - - - - - -Up to 650% - - - - - -Less than 1,250% - - - - - -
1,250% - - - - - -Total ¥450.6 ¥- ¥218.2 ¥- ¥668.8 ¥-
(Billions of yen)As of March 31, 2016
On-balance
sheetOff-balance
sheet TotalExposure on
resecuritizationsExposure on
resecuritizationsExposure on
resecuritizations
Riskweight
Up to 20% ¥650.4 ¥- ¥251.0 ¥- ¥901.5 ¥-Up to 50% 2.1 - - - 2.1 -Up to 100% 3.4 - - - 3.4 -Up to 250% - - - - - -Up to 650% - - - - - -Less than 1,250% - - - - - -
1,250% - - - - - -Total ¥656.1 ¥- ¥251.0 ¥- ¥907.1 ¥-
─Amount of required capital by risk weight category─
(Billions of yen)As of March 31, 2017
On-balance
sheetOff-balance
sheet TotalExposure on
resecuritizationsExposure on
resecuritizationsExposure on
resecuritizations
Riskweight
Up to 20% ¥2.7 ¥- ¥1.4 ¥- ¥4.1 ¥-Up to 50% 0.2 - - - 0.2 -Up to 100% 0.1 - - - 0.1 -Up to 250% - - - - - -Up to 650% - - - - - -Less than 1,250% - - - - - -
1,250% - - - - - -Total ¥3.1 ¥- ¥1.4 ¥- ¥4.5 ¥-
307
Securitization exposure as sponsor of securitization programs (ABCP/ABL) (for calculation of credit risk-weighted assets)
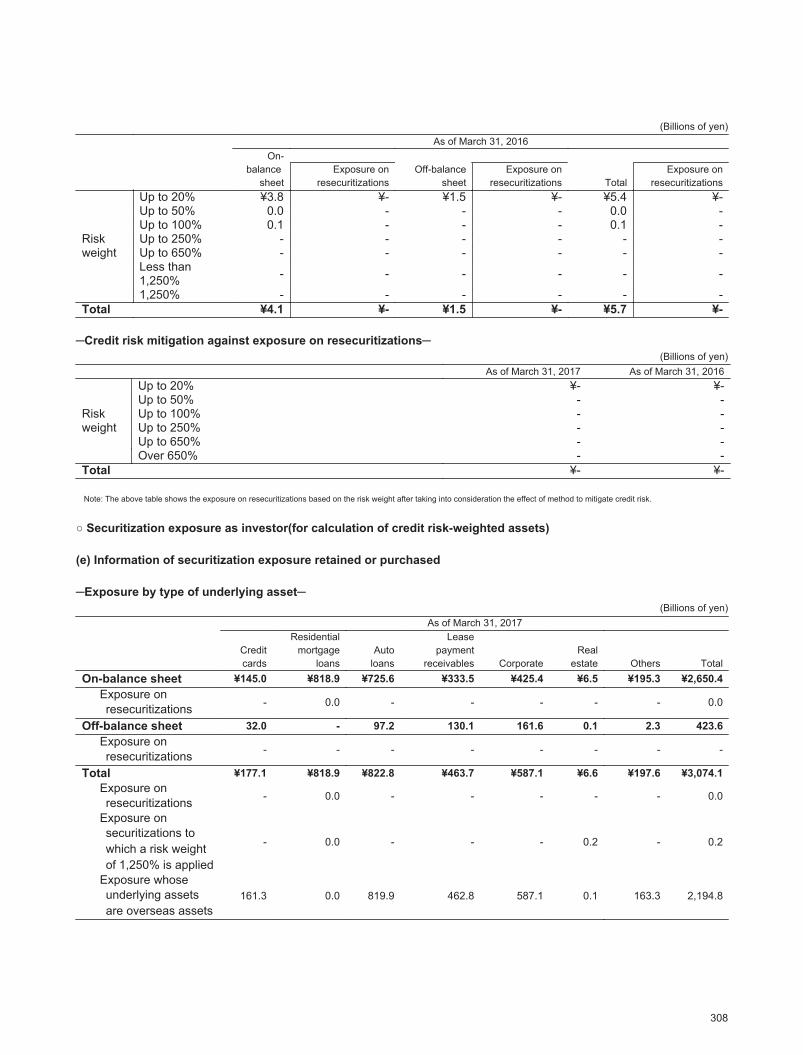
2017/09/06 9:42:26 / 17322939_株式会社みずほフィナンシャルグループ_総会その他(C)
(Billions of yen)As of March 31, 2016
On-balance
sheetOff-balance
sheet TotalExposure on
resecuritizationsExposure on
resecuritizationsExposure on
resecuritizations
Riskweight
Up to 20% ¥3.8 ¥- ¥1.5 ¥- ¥5.4 ¥-Up to 50% 0.0 - - - 0.0 -Up to 100% 0.1 - - - 0.1 -Up to 250% - - - - - -Up to 650% - - - - - -Less than 1,250% - - - - - -
1,250% - - - - - -Total ¥4.1 ¥- ¥1.5 ¥- ¥5.7 ¥-
─Credit risk mitigation against exposure on resecuritizations─(Billions of yen)
As of March 31, 2017 As of March 31, 2016
Riskweight
Up to 20% ¥- ¥-Up to 50% - -Up to 100% - -Up to 250% - -Up to 650% - -Over 650% - -
Total ¥- ¥-
Note: The above table shows the exposure on resecuritizations based on the risk weight after taking into consideration the effect of method to mitigate credit risk.
○ Securitization exposure as investor(for calculation of credit risk-weighted assets)
(e) Information of securitization exposure retained or purchased
─Exposure by type of underlying asset─(Billions of yen)
As of March 31, 2017
Creditcards
Residentialmortgage
loansAuto
loans
Leasepayment
receivables CorporateReal
estate Others TotalOn-balance sheet ¥145.0 ¥818.9 ¥725.6 ¥333.5 ¥425.4 ¥6.5 ¥195.3 ¥2,650.4
Exposure onresecuritizations - 0.0 - - - - - 0.0
Off-balance sheet 32.0 - 97.2 130.1 161.6 0.1 2.3 423.6Exposure onresecuritizations - - - - - - - -
Total ¥177.1 ¥818.9 ¥822.8 ¥463.7 ¥587.1 ¥6.6 ¥197.6 ¥3,074.1Exposure onresecuritizations - 0.0 - - - - - 0.0
Exposure onsecuritizations towhich a risk weightof 1,250% is applied
- 0.0 - - - 0.2 - 0.2
Exposure whoseunderlying assetsare overseas assets
161.3 0.0 819.9 462.8 587.1 0.1 163.3 2,194.8
308
Securitization exposure as sponsor of securitization programs (ABCP/ABL) (for calculation of credit risk-weighted assets)、Securitization exposure as investor (for calculation of credit risk-weighted assets)
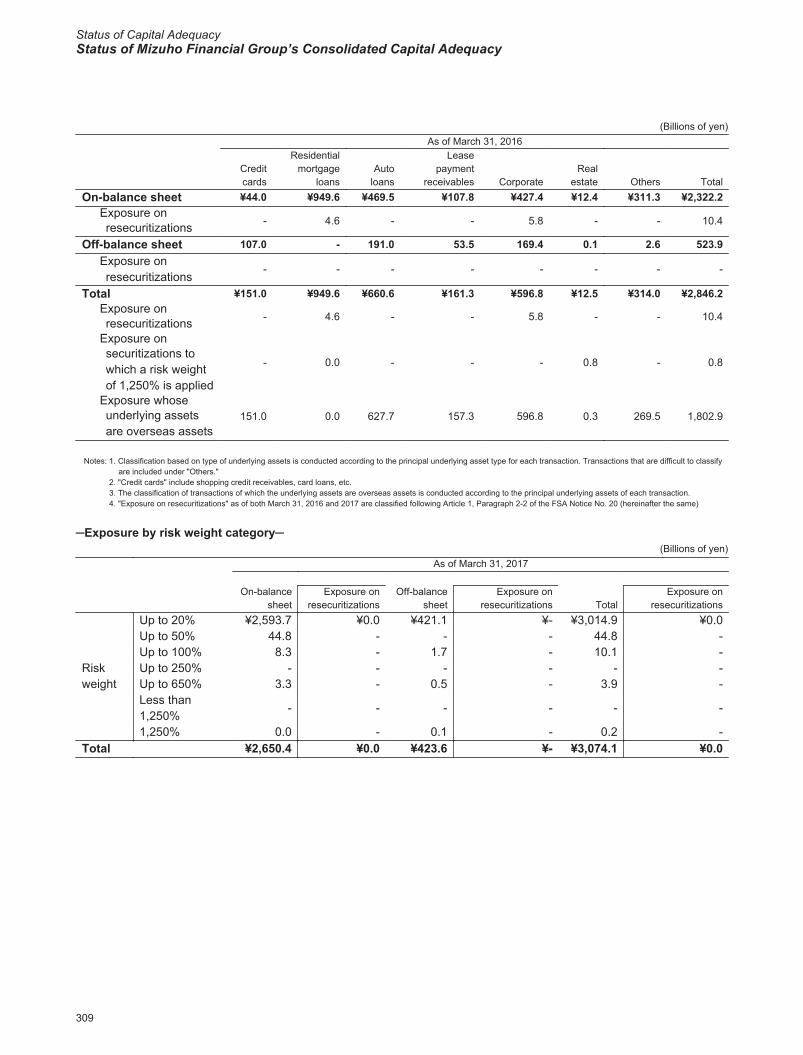
Status of Capital AdequacyStatus of Mizuho Financial Group’s Consolidated Capital Adequacy
2017/09/06 9:42:26 / 17322939_株式会社みずほフィナンシャルグループ_総会その他(C)
(Billions of yen)As of March 31, 2016
Creditcards
Residentialmortgage
loansAuto
loans
Leasepayment
receivables CorporateReal
estate Others TotalOn-balance sheet ¥44.0 ¥949.6 ¥469.5 ¥107.8 ¥427.4 ¥12.4 ¥311.3 ¥2,322.2
Exposure onresecuritizations - 4.6 - - 5.8 - - 10.4
Off-balance sheet 107.0 - 191.0 53.5 169.4 0.1 2.6 523.9Exposure onresecuritizations
- - - - - - - -
Total ¥151.0 ¥949.6 ¥660.6 ¥161.3 ¥596.8 ¥12.5 ¥314.0 ¥2,846.2Exposure onresecuritizations - 4.6 - - 5.8 - - 10.4
Exposure onsecuritizations towhich a risk weightof 1,250% is applied
- 0.0 - - - 0.8 - 0.8
Exposure whoseunderlying assetsare overseas assets
151.0 0.0 627.7 157.3 596.8 0.3 269.5 1,802.9
Notes: 1. Classification based on type of underlying assets is conducted according to the principal underlying asset type for each transaction. Transactions that are difficult to classify are included under "Others."
2. "Credit cards" include shopping credit receivables, card loans, etc.3. The classification of transactions of which the underlying assets are overseas assets is conducted according to the principal underlying assets of each transaction.4. "Exposure on resecuritizations" as of both March 31, 2016 and 2017 are classified following Article 1, Paragraph 2-2 of the FSA Notice No. 20 (hereinafter the same)
─Exposure by risk weight category─(Billions of yen)
As of March 31, 2017
On-balancesheet
Off-balancesheet Total
Exposure onresecuritizations
Exposure onresecuritizations
Exposure onresecuritizations
Riskweight
Up to 20% ¥2,593.7 ¥0.0 ¥421.1 ¥- ¥3,014.9 ¥0.0Up to 50% 44.8 - - - 44.8 -Up to 100% 8.3 - 1.7 - 10.1 -Up to 250% - - - - - -Up to 650% 3.3 - 0.5 - 3.9 -Less than 1,250%
- - - - - -
1,250% 0.0 - 0.1 - 0.2 -Total ¥2,650.4 ¥0.0 ¥423.6 ¥- ¥3,074.1 ¥0.0
309
Securitization exposure as investor (for calculation of credit risk-weighted assets)
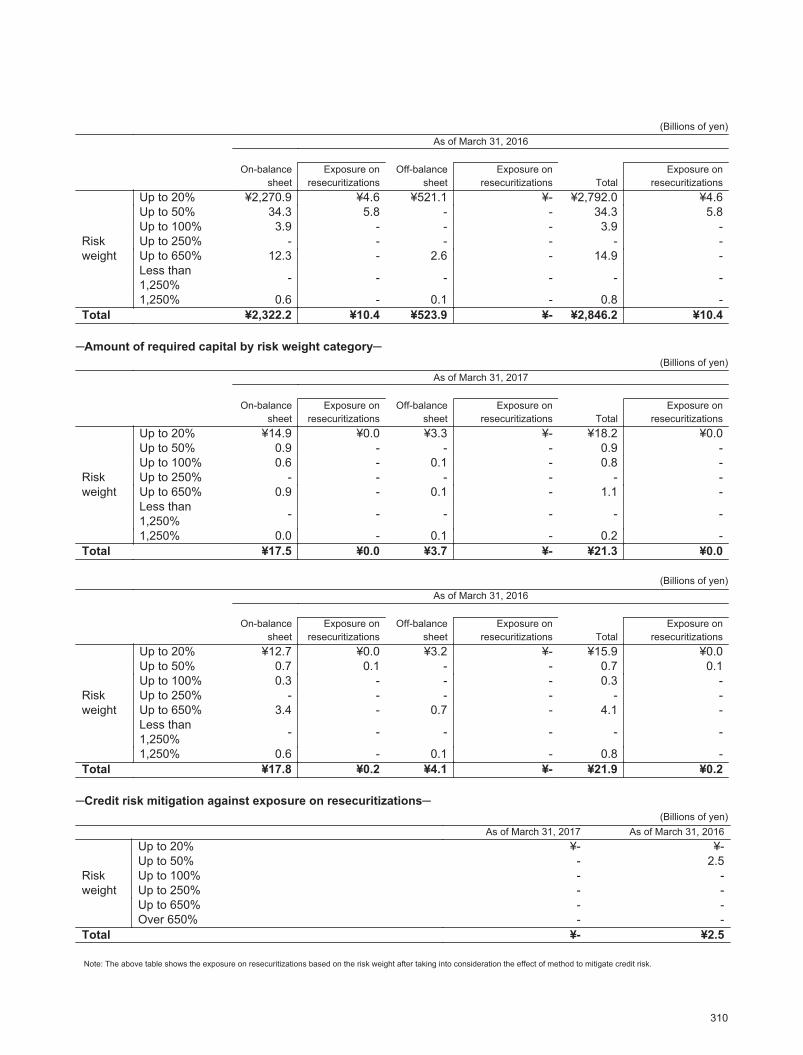
2017/09/06 9:42:26 / 17322939_株式会社みずほフィナンシャルグループ_総会その他(C)
(Billions of yen)As of March 31, 2016
On-balancesheet
Off-balancesheet Total
Exposure onresecuritizations
Exposure onresecuritizations
Exposure onresecuritizations
Riskweight
Up to 20% ¥2,270.9 ¥4.6 ¥521.1 ¥- ¥2,792.0 ¥4.6Up to 50% 34.3 5.8 - - 34.3 5.8Up to 100% 3.9 - - - 3.9 -Up to 250% - - - - - -Up to 650% 12.3 - 2.6 - 14.9 -Less than 1,250% - - - - - -
1,250% 0.6 - 0.1 - 0.8 -Total ¥2,322.2 ¥10.4 ¥523.9 ¥- ¥2,846.2 ¥10.4
─Amount of required capital by risk weight category─(Billions of yen)
As of March 31, 2017
On-balancesheet
Off-balancesheet Total
Exposure onresecuritizations
Exposure onresecuritizations
Exposure onresecuritizations
Riskweight
Up to 20% ¥14.9 ¥0.0 ¥3.3 ¥- ¥18.2 ¥0.0Up to 50% 0.9 - - - 0.9 -Up to 100% 0.6 - 0.1 - 0.8 -Up to 250% - - - - - -Up to 650% 0.9 - 0.1 - 1.1 -Less than 1,250% - - - - - -
1,250% 0.0 - 0.1 - 0.2 -Total ¥17.5 ¥0.0 ¥3.7 ¥- ¥21.3 ¥0.0
(Billions of yen)As of March 31, 2016
On-balancesheet
Off-balancesheet Total
Exposure onresecuritizations
Exposure onresecuritizations
Exposure onresecuritizations
Riskweight
Up to 20% ¥12.7 ¥0.0 ¥3.2 ¥- ¥15.9 ¥0.0Up to 50% 0.7 0.1 - - 0.7 0.1Up to 100% 0.3 - - - 0.3 -Up to 250% - - - - - -Up to 650% 3.4 - 0.7 - 4.1 -Less than 1,250% - - - - - -
1,250% 0.6 - 0.1 - 0.8 -Total ¥17.8 ¥0.2 ¥4.1 ¥- ¥21.9 ¥0.2
─Credit risk mitigation against exposure on resecuritizations─(Billions of yen)
As of March 31, 2017 As of March 31, 2016
Riskweight
Up to 20% ¥- ¥-Up to 50% - 2.5Up to 100% - -Up to 250% - -Up to 650% - -Over 650% - -
Total ¥- ¥2.5
Note: The above table shows the exposure on resecuritizations based on the risk weight after taking into consideration the effect of method to mitigate credit risk.
310
Securitization exposure as investor (for calculation of credit risk-weighted assets)
Status of Capital AdequacyStatus of Mizuho Financial Group’s Consolidated Capital Adequacy
2017/09/06 9:42:26 / 17322939_株式会社みずほフィナンシャルグループ_総会その他(C)
○ Securitization exposure as originator (for calculation of market risk equivalent amounts)
(f) Information by type of underlying assetsNone as of March 31, 2016 and 2017
(g) Information of securitization exposure retained or purchasedNone as of March 31, 2016 and 2017
○ Securitization exposure as sponsor of securitization programs (ABCP/ABL) (for calculation of market risk equivalent amounts)
(h) Information by type of underlying assetsNone as of March 31, 2016 and 2017
(i) Information of securitization exposure retained or purchasedNone as of March 31, 2016 and 2017
311
Securitization exposure as originator (for calculation of market risk equivalent amounts)、Securitization exposure as sponsor of securitization programs (ABCP/ABL) (for calculation of market risk equivalent amounts)

2017/09/06 9:42:26 / 17322939_株式会社みずほフィナンシャルグループ_総会その他(C)
○ Securitization exposure as investor (for calculation of market risk equivalent amounts)
(j) Information of securitization exposure retained or purchased─Exposure by type of underlying asset─
(Billions of yen)As of March 31, 2017
CreditCards
Residentialmortgage
loansAuto
loans
Leasepayment
receivables CorporateReal
estate Others TotalOn-balance sheet ¥0.0 ¥3.7 ¥13.8 ¥0.6 ¥0.0 ¥3.0 ¥7.0 ¥28.4
Exposure onresecuritizations
- - - - - - 0.0 0.0
Off-balance sheet - - - - - - - -Exposure onresecuritizations
- - - - - - - -
Total ¥0.0 ¥3.7 ¥13.8 ¥0.6 ¥0.0 ¥3.0 ¥7.0 ¥28.4Exposure onresecuritizations
- - - - - - 0.0 0.0
Exposure onsecuritizations towhich a risk weight of100% is applied
- 3.6 0.4 - 0.0 - 0.3 4.4
Exposure whoseunderlying assets areoverseas assets
- 3.5 13.8 0.6 0.0 3.0 7.0 28.2
(Billions of yen)As of March 31, 2016
CreditCards
Residentialmortgage
loansAuto
loans
Leasepayment
receivables CorporateReal
estate Others TotalOn-balance sheet ¥- ¥1.0 ¥0.0 ¥- ¥0.0 ¥4.0 ¥1.4 ¥6.5
Exposure onresecuritizations
- - - - - - 0.3 0.3
Off-balance sheet - - - - - - - -Exposure onresecuritizations
- - - - - - - -
Total ¥- ¥1.0 ¥0.0 ¥- ¥0.0 ¥4.0 ¥1.4 ¥6.5Exposure onresecuritizations
- - - - - - 0.3 0.3
Exposure onsecuritizations towhich a risk weight of100% is applied
- 1.0 - - 0.0 0.3 0.3 1.7
Exposure whoseunderlying assets areoverseas assets
- 0.9 0.0 - 0.0 2.0 1.1 4.0
Notes: 1. Classification based on type of underlying assets is conducted according to the principal underlying asset type for each transaction. Transactions that are difficult to classify are included under "Others."
2. "Credit cards" include shopping credit receivables, card loans, etc.3. The classification of transactions of which the underlying assets are overseas assets is conducted according to the principal underlying assets of each transaction.4. "Exposure on resecuritizations" are classified following Article 1, Paragraph 2-2 of the FSA Notice No. 20 (hereinafter the same).
312
Securitization exposure as investor (for calculation of market risk equivalent amounts)
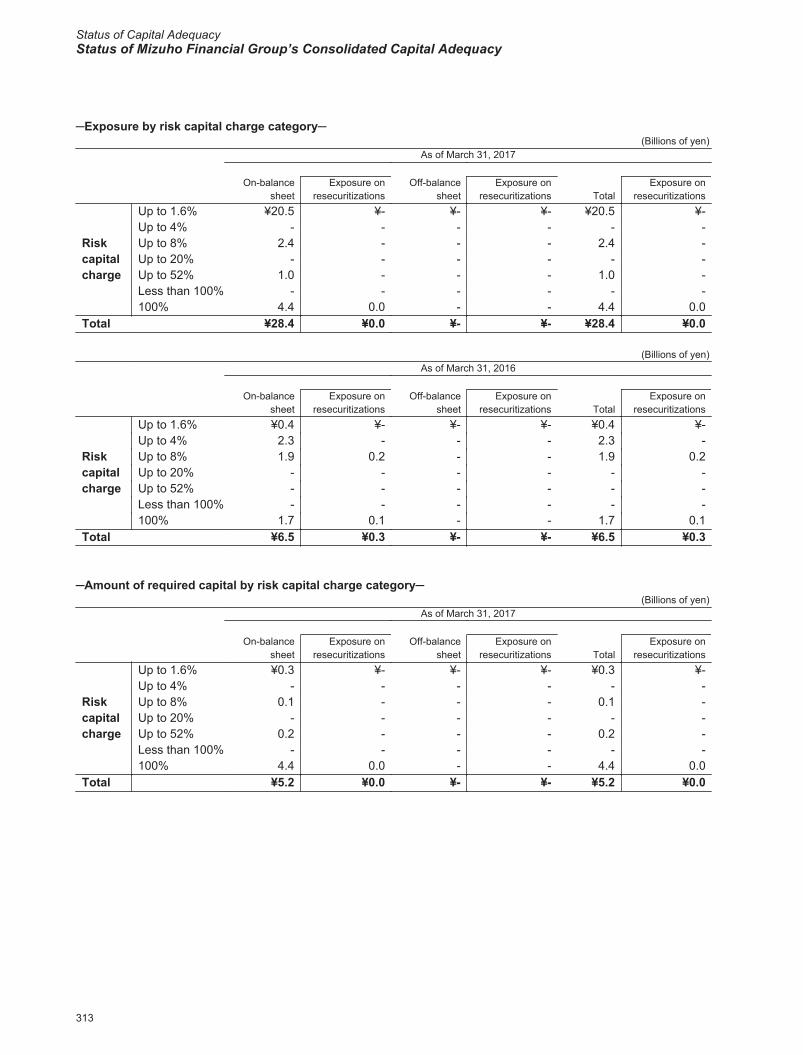
Status of Capital AdequacyStatus of Mizuho Financial Group’s Consolidated Capital Adequacy
2017/09/06 9:42:26 / 17322939_株式会社みずほフィナンシャルグループ_総会その他(C)
─Exposure by risk capital charge category─(Billions of yen)
As of March 31, 2017
On-balancesheet
Off-balancesheet Total
Exposure onresecuritizations
Exposure onresecuritizations
Exposure onresecuritizations
Riskcapitalcharge
Up to 1.6% ¥20.5 ¥- ¥- ¥- ¥20.5 ¥-Up to 4% - - - - - -Up to 8% 2.4 - - - 2.4 -Up to 20% - - - - - -Up to 52% 1.0 - - - 1.0 -Less than 100% - - - - - -100% 4.4 0.0 - - 4.4 0.0
Total ¥28.4 ¥0.0 ¥- ¥- ¥28.4 ¥0.0
(Billions of yen)As of March 31, 2016
On-balancesheet
Off-balancesheet Total
Exposure onresecuritizations
Exposure onresecuritizations
Exposure onresecuritizations
Riskcapitalcharge
Up to 1.6% ¥0.4 ¥- ¥- ¥- ¥0.4 ¥-Up to 4% 2.3 - - - 2.3 -Up to 8% 1.9 0.2 - - 1.9 0.2Up to 20% - - - - - -Up to 52% - - - - - -Less than 100% - - - - - -100% 1.7 0.1 - - 1.7 0.1
Total ¥6.5 ¥0.3 ¥- ¥- ¥6.5 ¥0.3
─Amount of required capital by risk capital charge category─(Billions of yen)
As of March 31, 2017
On-balancesheet
Off-balancesheet Total
Exposure onresecuritizations
Exposure onresecuritizations
Exposure onresecuritizations
Riskcapitalcharge
Up to 1.6% ¥0.3 ¥- ¥- ¥- ¥0.3 ¥-Up to 4% - - - - - -Up to 8% 0.1 - - - 0.1 -Up to 20% - - - - - -Up to 52% 0.2 - - - 0.2 -Less than 100% - - - - - -100% 4.4 0.0 - - 4.4 0.0
Total ¥5.2 ¥0.0 ¥- ¥- ¥5.2 ¥0.0
313
Securitization exposure as investor (for calculation of market risk equivalent amounts)
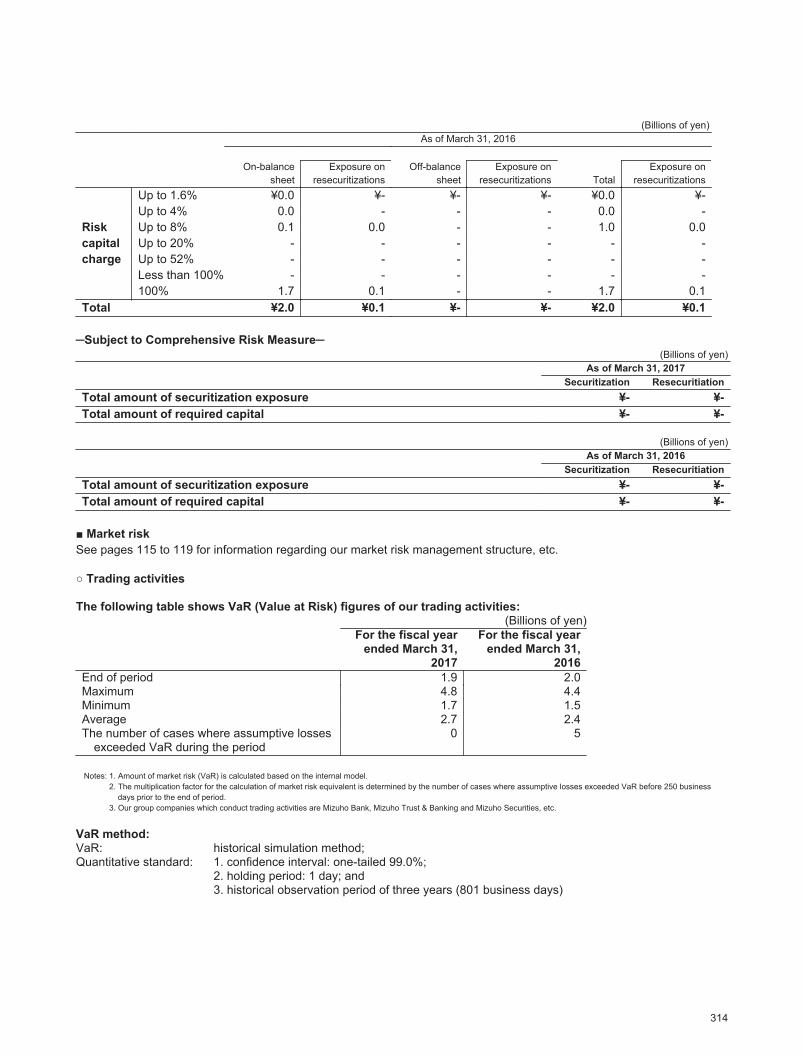
2017/09/06 9:42:26 / 17322939_株式会社みずほフィナンシャルグループ_総会その他(C)
(Billions of yen)As of March 31, 2016
On-balancesheet
Off-balancesheet Total
Exposure onresecuritizations
Exposure onresecuritizations
Exposure onresecuritizations
Riskcapitalcharge
Up to 1.6% ¥0.0 ¥- ¥- ¥- ¥0.0 ¥-Up to 4% 0.0 - - - 0.0 -Up to 8% 0.1 0.0 - - 1.0 0.0Up to 20% - - - - - -Up to 52% - - - - - -Less than 100% - - - - - -100% 1.7 0.1 - - 1.7 0.1
Total ¥2.0 ¥0.1 ¥- ¥- ¥2.0 ¥0.1
─Subject to Comprehensive Risk Measure─(Billions of yen)
As of March 31, 2017Securitization Resecuritiation
Total amount of securitization exposure ¥- ¥-Total amount of required capital ¥- ¥-
(Billions of yen)As of March 31, 2016
Securitization ResecuritiationTotal amount of securitization exposure ¥- ¥-Total amount of required capital ¥- ¥-
■ Market riskSee pages 115 to 119 for information regarding our market risk management structure, etc.
○ Trading activities
The following table shows VaR (Value at Risk) figures of our trading activities: (Billions of yen)
For the fiscal yearended March 31,
2017
For the fiscal yearended March 31,
2016End of period 1.9 2.0Maximum 4.8 4.4Minimum 1.7 1.5Average 2.7 2.4The number of cases where assumptive losses
exceeded VaR during the period0 5
Notes: 1. Amount of market risk (VaR) is calculated based on the internal model.2. The multiplication factor for the calculation of market risk equivalent is determined by the number of cases where assumptive losses exceeded VaR before 250 business
days prior to the end of period.3. Our group companies which conduct trading activities are Mizuho Bank, Mizuho Trust & Banking and Mizuho Securities, etc.
VaR method:VaR: historical simulation method;Quantitative standard: 1. confidence interval: one-tailed 99.0%;
2. holding period: 1 day; and3. historical observation period of three years (801 business days)
314
Securitization exposure as investor (for calculation of market risk equivalent amounts)、Market risk
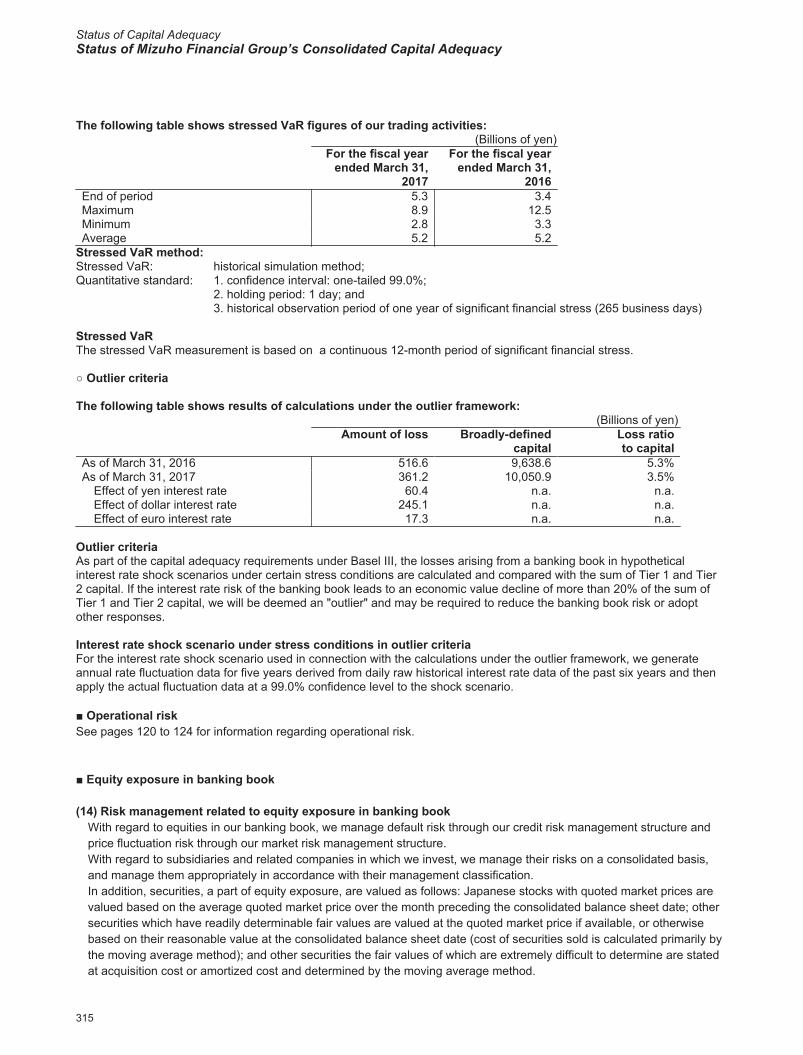
Status of Capital AdequacyStatus of Mizuho Financial Group’s Consolidated Capital Adequacy
2017/09/06 9:42:26 / 17322939_株式会社みずほフィナンシャルグループ_総会その他(C)
The following table shows stressed VaR figures of our trading activities: (Billions of yen)
For the fiscal yearended March 31,
2017
For the fiscal yearended March 31,
2016End of period 5.3 3.4Maximum 8.9 12.5Minimum 2.8 3.3Average 5.2 5.2
Stressed VaR method:Stressed VaR: historical simulation method;Quantitative standard: 1. confidence interval: one-tailed 99.0%;
2. holding period: 1 day; and3. historical observation period of one year of significant financial stress (265 business days)
Stressed VaRThe stressed VaR measurement is based on a continuous 12-month period of significant financial stress.
○ Outlier criteria
The following table shows results of calculations under the outlier framework:(Billions of yen)
Amount of loss Broadly-definedcapital
Loss ratioto capital
As of March 31, 2016 516.6 9,638.6 5.3%As of March 31, 2017 361.2 10,050.9 3.5%
Effect of yen interest rate 60.4 n.a. n.a.Effect of dollar interest rate 245.1 n.a. n.a.Effect of euro interest rate 17.3 n.a. n.a.
Outlier criteriaAs part of the capital adequacy requirements under Basel III, the losses arising from a banking book in hypothetical interest rate shock scenarios under certain stress conditions are calculated and compared with the sum of Tier 1 and Tier 2 capital. If the interest rate risk of the banking book leads to an economic value decline of more than 20% of the sum of Tier 1 and Tier 2 capital, we will be deemed an "outlier" and may be required to reduce the banking book risk or adopt other responses.
Interest rate shock scenario under stress conditions in outlier criteriaFor the interest rate shock scenario used in connection with the calculations under the outlier framework, we generate annual rate fluctuation data for five years derived from daily raw historical interest rate data of the past six years and then apply the actual fluctuation data at a 99.0% confidence level to the shock scenario.
■ Operational riskSee pages 120 to 124 for information regarding operational risk.
■ Equity exposure in banking book
(14) Risk management related to equity exposure in banking bookWith regard to equities in our banking book, we manage default risk through our credit risk management structure and price fluctuation risk through our market risk management structure.With regard to subsidiaries and related companies in which we invest, we manage their risks on a consolidated basis, and manage them appropriately in accordance with their management classification.In addition, securities, a part of equity exposure, are valued as follows: Japanese stocks with quoted market prices are valued based on the average quoted market price over the month preceding the consolidated balance sheet date; other securities which have readily determinable fair values are valued at the quoted market price if available, or otherwise based on their reasonable value at the consolidated balance sheet date (cost of securities sold is calculated primarily by the moving average method); and other securities the fair values of which are extremely difficult to determine are stated at acquisition cost or amortized cost and determined by the moving average method.
315
Market risk、Operational risk、Equity exposure in banking book
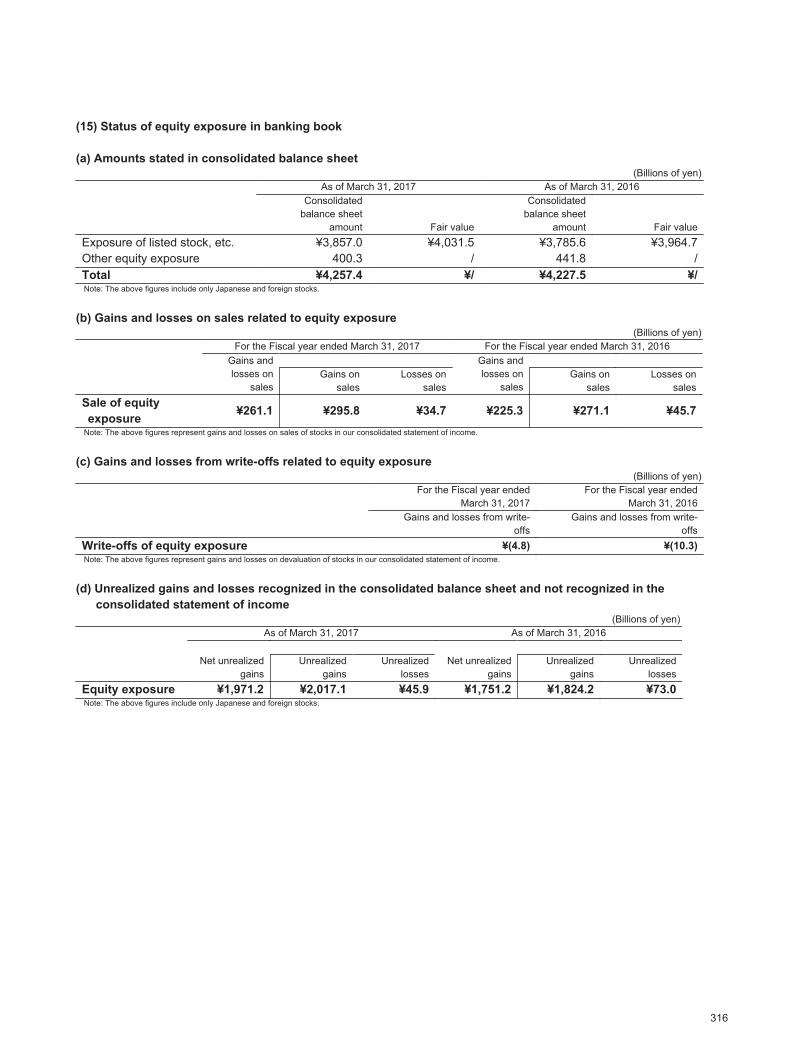
2017/09/06 9:42:26 / 17322939_株式会社みずほフィナンシャルグループ_総会その他(C)
(15) Status of equity exposure in banking book
(a) Amounts stated in consolidated balance sheet(Billions of yen)
As of March 31, 2017 As of March 31, 2016Consolidated
balance sheetamount Fair value
Consolidatedbalance sheet
amount Fair valueExposure of listed stock, etc. ¥3,857.0 ¥4,031.5 ¥3,785.6 ¥3,964.7Other equity exposure 400.3 / 441.8 /Total ¥4,257.4 ¥/ ¥4,227.5 ¥/Note: The above figures include only Japanese and foreign stocks.
(b) Gains and losses on sales related to equity exposure(Billions of yen)
For the Fiscal year ended March 31, 2017 For the Fiscal year ended March 31, 2016Gains andlosses on
sales
Gains andlosses on
salesGains on
salesLosses on
salesGains on
salesLosses on
salesSale of equity exposure ¥261.1 ¥295.8 ¥34.7 ¥225.3 ¥271.1 ¥45.7
Note: The above figures represent gains and losses on sales of stocks in our consolidated statement of income.
(c) Gains and losses from write-offs related to equity exposure(Billions of yen)
For the Fiscal year endedMarch 31, 2017
For the Fiscal year endedMarch 31, 2016
Gains and losses from write-offs
Gains and losses from write-offs
Write-offs of equity exposure ¥(4.8) ¥(10.3)Note: The above figures represent gains and losses on devaluation of stocks in our consolidated statement of income.
(d) Unrealized gains and losses recognized in the consolidated balance sheet and not recognized in the consolidated statement of income
(Billions of yen)As of March 31, 2017 As of March 31, 2016
Net unrealizedgains
Net unrealizedgains
Unrealizedgains
Unrealizedlosses
Unrealizedgains
Unrealizedlosses
Equity exposure ¥1,971.2 ¥2,017.1 ¥45.9 ¥1,751.2 ¥1,824.2 ¥73.0Note: The above figures include only Japanese and foreign stocks.
316
Equity exposure in banking book
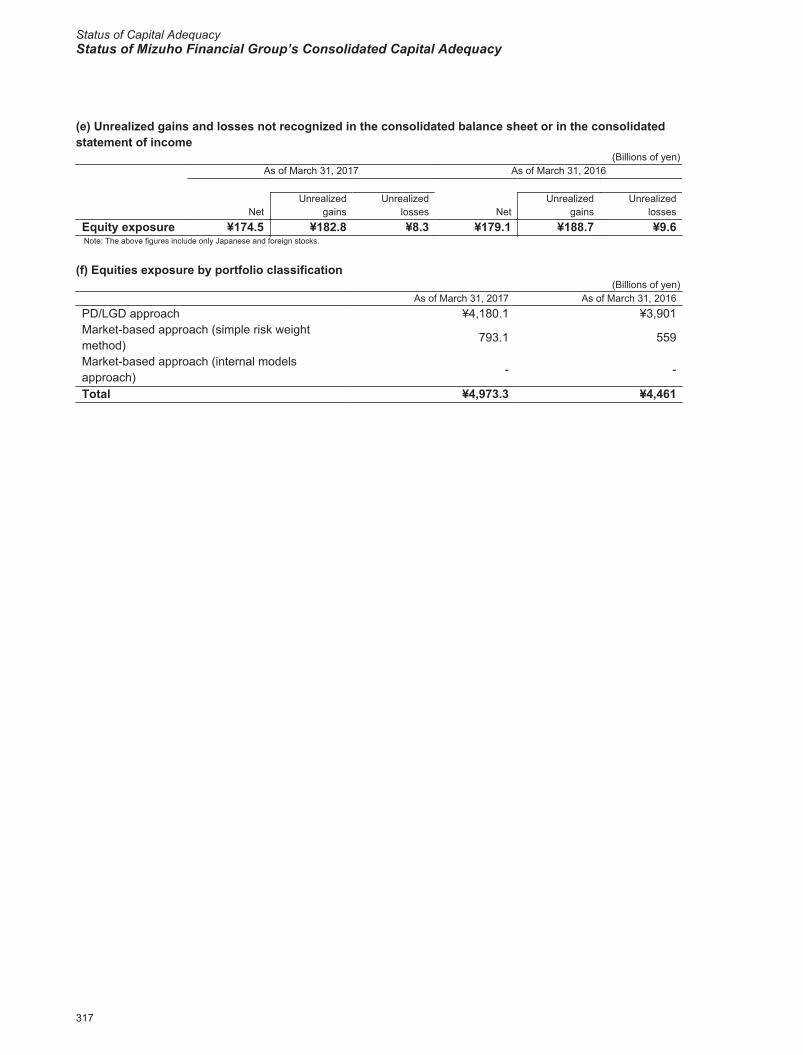
Status of Capital AdequacyStatus of Mizuho Financial Group’s Consolidated Capital Adequacy
2017/09/06 9:42:26 / 17322939_株式会社みずほフィナンシャルグループ_総会その他(C)
(e) Unrealized gains and losses not recognized in the consolidated balance sheet or in the consolidated statement of income
(Billions of yen)As of March 31, 2017 As of March 31, 2016
Net NetUnrealized
gainsUnrealized
lossesUnrealized
gainsUnrealized
lossesEquity exposure ¥174.5 ¥182.8 ¥8.3 ¥179.1 ¥188.7 ¥9.6Note: The above figures include only Japanese and foreign stocks.
(f) Equities exposure by portfolio classification(Billions of yen)
As of March 31, 2017 As of March 31, 2016PD/LGD approach ¥4,180.1 ¥3,901Market-based approach (simple risk weight method)
793.1 559
Market-based approach (internal models approach)
- -
Total ¥4,973.3 ¥4,461
317
Equity exposure in banking book
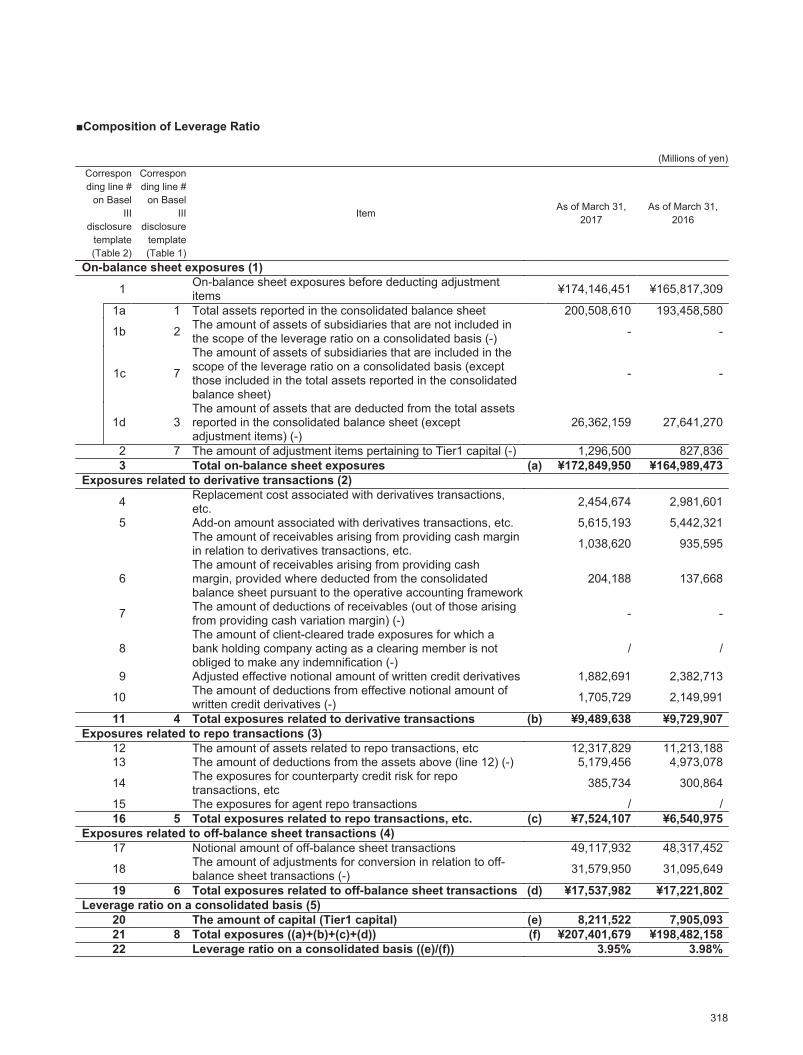
2017/09/06 9:42:26 / 17322939_株式会社みずほフィナンシャルグループ_総会その他(C)
■Composition of Leverage Ratio
(Millions of yen)Corresponding line #
on BaselIII
disclosuretemplate(Table 2)
Corresponding line #
on Basel III
disclosuretemplate(Table 1)
ItemAs of March 31,
2017As of March 31,
2016
On-balance sheet exposures (1)
1 On-balance sheet exposures before deducting adjustment items ¥174,146,451 ¥165,817,309
1a 1 Total assets reported in the consolidated balance sheet 200,508,610 193,458,580
1b 2 The amount of assets of subsidiaries that are not included in the scope of the leverage ratio on a consolidated basis (-) - -
1c 7
The amount of assets of subsidiaries that are included in the scope of the leverage ratio on a consolidated basis (except those included in the total assets reported in the consolidated balance sheet)
- -
1d 3The amount of assets that are deducted from the total assets reported in the consolidated balance sheet (except adjustment items) (-)
26,362,159 27,641,270
2 7 The amount of adjustment items pertaining to Tier1 capital (-) 1,296,500 827,8363 Total on-balance sheet exposures (a) ¥172,849,950 ¥164,989,473
Exposures related to derivative transactions (2)
4 Replacement cost associated with derivatives transactions, etc. 2,454,674 2,981,601
5 Add-on amount associated with derivatives transactions, etc. 5,615,193 5,442,321The amount of receivables arising from providing cash margin in relation to derivatives transactions, etc. 1,038,620 935,595
6The amount of receivables arising from providing cash margin, provided where deducted from the consolidated balance sheet pursuant to the operative accounting framework
204,188 137,668
7 The amount of deductions of receivables (out of those arising from providing cash variation margin) (-) - -
8The amount of client-cleared trade exposures for which a bank holding company acting as a clearing member is not obliged to make any indemnification (-)
/ /
9 Adjusted effective notional amount of written credit derivatives 1,882,691 2,382,713
10 The amount of deductions from effective notional amount of written credit derivatives (-) 1,705,729 2,149,991
11 4 Total exposures related to derivative transactions (b) ¥9,489,638 ¥9,729,907Exposures related to repo transactions (3)
12 The amount of assets related to repo transactions, etc 12,317,829 11,213,18813 The amount of deductions from the assets above (line 12) (-) 5,179,456 4,973,078
14 The exposures for counterparty credit risk for repo transactions, etc 385,734 300,864
15 The exposures for agent repo transactions / /16 5 Total exposures related to repo transactions, etc. (c) ¥7,524,107 ¥6,540,975
Exposures related to off-balance sheet transactions (4)17 Notional amount of off-balance sheet transactions 49,117,932 48,317,452
18 The amount of adjustments for conversion in relation to off-balance sheet transactions (-) 31,579,950 31,095,649
19 6 Total exposures related to off-balance sheet transactions (d) ¥17,537,982 ¥17,221,802Leverage ratio on a consolidated basis (5)
20 The amount of capital (Tier1 capital) (e) 8,211,522 7,905,09321 8 Total exposures ((a)+(b)+(c)+(d)) (f) ¥207,401,679 ¥198,482,15822 Leverage ratio on a consolidated basis ((e)/(f)) 3.95% 3.98%
318
Composition of Leverage Ratio
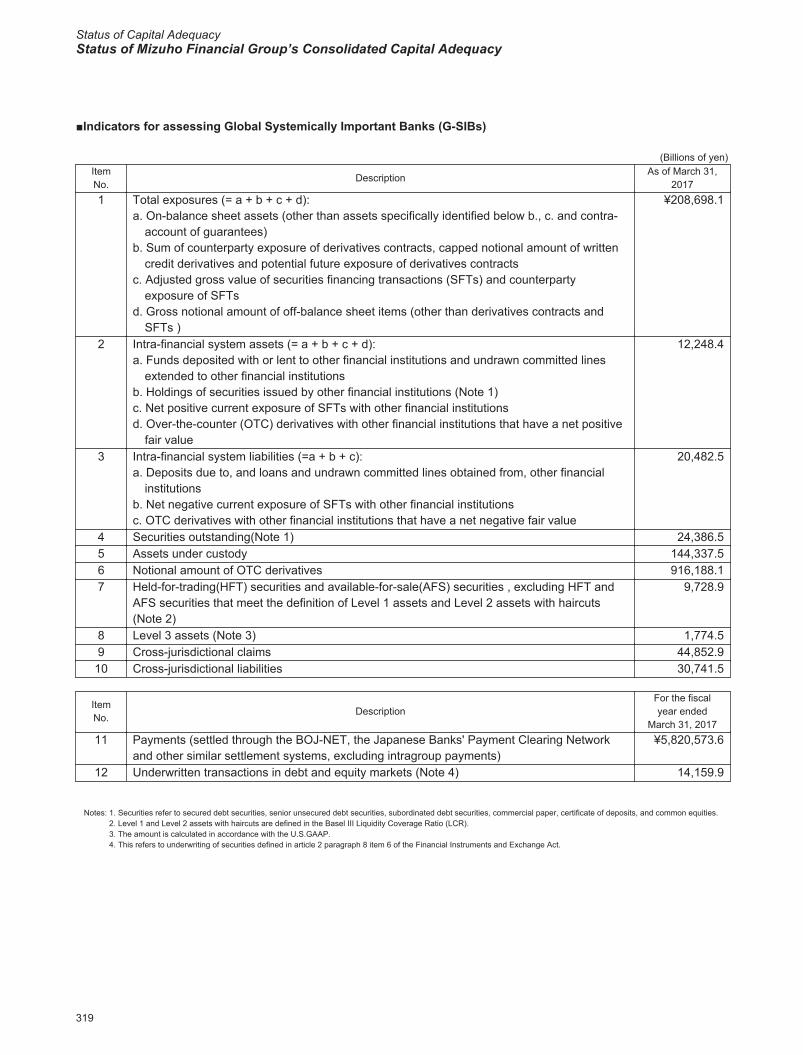
Status of Capital AdequacyStatus of Mizuho Financial Group’s Consolidated Capital Adequacy
2017/09/06 9:42:26 / 17322939_株式会社みずほフィナンシャルグループ_総会その他(C)
■Indicators for assessing Global Systemically Important Banks (G-SIBs)
(Billions of yen)ItemNo.
DescriptionAs of March 31,
20171 Total exposures (= a + b + c + d):
a. On-balance sheet assets (other than assets specifically identified below b., c. and contra-account of guarantees)
b. Sum of counterparty exposure of derivatives contracts, capped notional amount of written credit derivatives and potential future exposure of derivatives contracts
c. Adjusted gross value of securities financing transactions (SFTs) and counterparty exposure of SFTs
d. Gross notional amount of off-balance sheet items (other than derivatives contracts and SFTs )
¥208,698.1
2 Intra-financial system assets (= a + b + c + d):a. Funds deposited with or lent to other financial institutions and undrawn committed lines
extended to other financial institutionsb. Holdings of securities issued by other financial institutions (Note 1)c. Net positive current exposure of SFTs with other financial institutionsd. Over-the-counter (OTC) derivatives with other financial institutions that have a net positive
fair value
12,248.4
3 Intra-financial system liabilities (=a + b + c):a. Deposits due to, and loans and undrawn committed lines obtained from, other financial
institutionsb. Net negative current exposure of SFTs with other financial institutionsc. OTC derivatives with other financial institutions that have a net negative fair value
20,482.5
4 Securities outstanding(Note 1) 24,386.55 Assets under custody 144,337.56 Notional amount of OTC derivatives 916,188.17 Held-for-trading(HFT) securities and available-for-sale(AFS) securities , excluding HFT and
AFS securities that meet the definition of Level 1 assets and Level 2 assets with haircuts (Note 2)
9,728.9
8 Level 3 assets (Note 3) 1,774.59 Cross-jurisdictional claims 44,852.9
10 Cross-jurisdictional liabilities 30,741.5
ItemNo.
DescriptionFor the fiscalyear ended
March 31, 201711 Payments (settled through the BOJ-NET, the Japanese Banks' Payment Clearing Network
and other similar settlement systems, excluding intragroup payments)¥5,820,573.6
12 Underwritten transactions in debt and equity markets (Note 4) 14,159.9
Notes: 1. Securities refer to secured debt securities, senior unsecured debt securities, subordinated debt securities, commercial paper, certificate of deposits, and common equities.2. Level 1 and Level 2 assets with haircuts are defined in the Basel III Liquidity Coverage Ratio (LCR).3. The amount is calculated in accordance with the U.S.GAAP.4. This refers to underwriting of securities defined in article 2 paragraph 8 item 6 of the Financial Instruments and Exchange Act.
319
Indicators for assessing Global Systemically Important Banks (G-SIBs)
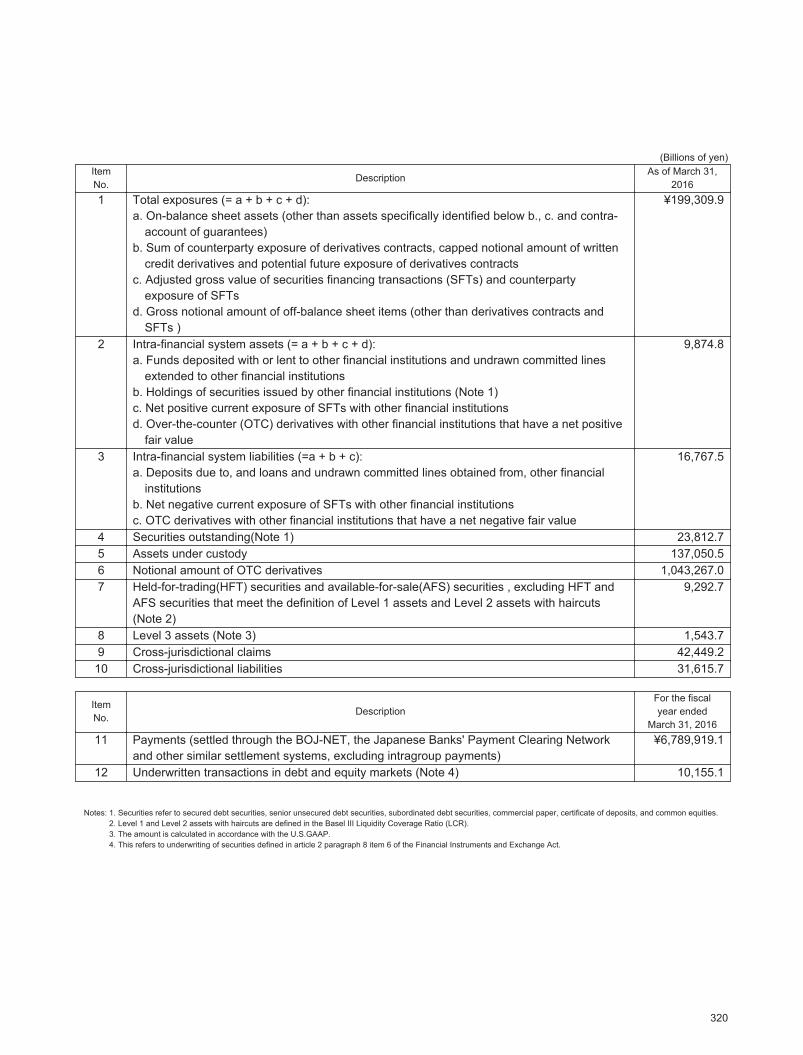
2017/09/06 9:42:26 / 17322939_株式会社みずほフィナンシャルグループ_総会その他(C)
(Billions of yen)ItemNo.
DescriptionAs of March 31,
20161 Total exposures (= a + b + c + d):
a. On-balance sheet assets (other than assets specifically identified below b., c. and contra-account of guarantees)
b. Sum of counterparty exposure of derivatives contracts, capped notional amount of written credit derivatives and potential future exposure of derivatives contracts
c. Adjusted gross value of securities financing transactions (SFTs) and counterparty exposure of SFTs
d. Gross notional amount of off-balance sheet items (other than derivatives contracts and SFTs )
¥199,309.9
2 Intra-financial system assets (= a + b + c + d):a. Funds deposited with or lent to other financial institutions and undrawn committed lines
extended to other financial institutionsb. Holdings of securities issued by other financial institutions (Note 1)c. Net positive current exposure of SFTs with other financial institutionsd. Over-the-counter (OTC) derivatives with other financial institutions that have a net positive
fair value
9,874.8
3 Intra-financial system liabilities (=a + b + c):a. Deposits due to, and loans and undrawn committed lines obtained from, other financial
institutionsb. Net negative current exposure of SFTs with other financial institutionsc. OTC derivatives with other financial institutions that have a net negative fair value
16,767.5
4 Securities outstanding(Note 1) 23,812.75 Assets under custody 137,050.56 Notional amount of OTC derivatives 1,043,267.07 Held-for-trading(HFT) securities and available-for-sale(AFS) securities , excluding HFT and
AFS securities that meet the definition of Level 1 assets and Level 2 assets with haircuts (Note 2)
9,292.7
8 Level 3 assets (Note 3) 1,543.79 Cross-jurisdictional claims 42,449.210 Cross-jurisdictional liabilities 31,615.7
ItemNo.
DescriptionFor the fiscalyear ended
March 31, 201611 Payments (settled through the BOJ-NET, the Japanese Banks' Payment Clearing Network
and other similar settlement systems, excluding intragroup payments)¥6,789,919.1
12 Underwritten transactions in debt and equity markets (Note 4) 10,155.1
Notes: 1. Securities refer to secured debt securities, senior unsecured debt securities, subordinated debt securities, commercial paper, certificate of deposits, and common equities.2. Level 1 and Level 2 assets with haircuts are defined in the Basel III Liquidity Coverage Ratio (LCR).3. The amount is calculated in accordance with the U.S.GAAP.4. This refers to underwriting of securities defined in article 2 paragraph 8 item 6 of the Financial Instruments and Exchange Act.
320
Indicators for assessing Global Systemically Important Banks (G-SIBs)
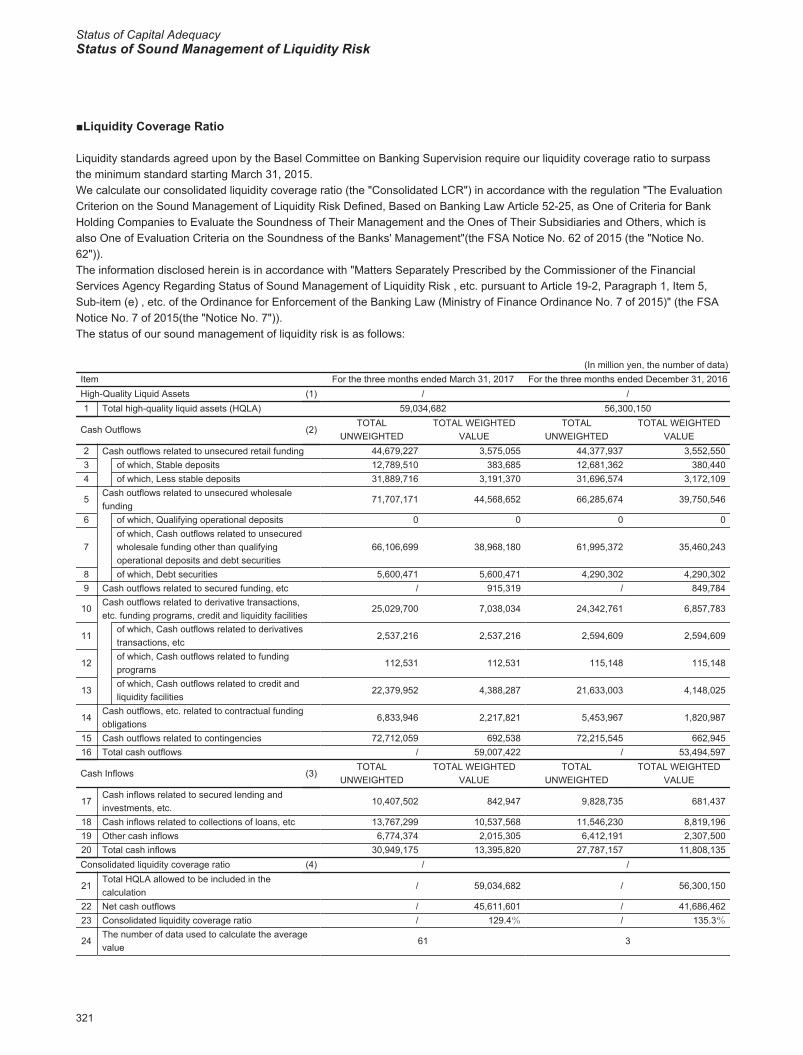
Status of Capital AdequacyStatus of Sound Management of Liquidity Risk
2017/09/06 9:42:26 / 17322939_株式会社みずほフィナンシャルグループ_総会その他(C)
■Liquidity Coverage Ratio
Liquidity standards agreed upon by the Basel Committee on Banking Supervision require our liquidity coverage ratio to surpass the minimum standard starting March 31, 2015.We calculate our consolidated liquidity coverage ratio (the "Consolidated LCR") in accordance with the regulation "The Evaluation Criterion on the Sound Management of Liquidity Risk Defined, Based on Banking Law Article 52-25, as One of Criteria for Bank Holding Companies to Evaluate the Soundness of Their Management and the Ones of Their Subsidiaries and Others, which is also One of Evaluation Criteria on the Soundness of the Banks' Management"(the FSA Notice No. 62 of 2015 (the "Notice No. 62")).The information disclosed herein is in accordance with "Matters Separately Prescribed by the Commissioner of the Financial Services Agency Regarding Status of Sound Management of Liquidity Risk , etc. pursuant to Article 19-2, Paragraph 1, Item 5, Sub-item (e) , etc. of the Ordinance for Enforcement of the Banking Law (Ministry of Finance Ordinance No. 7 of 2015)" (the FSA Notice No. 7 of 2015(the "Notice No. 7")).The status of our sound management of liquidity risk is as follows:
(In million yen, the number of data)Item For the three months ended March 31, 2017 For the three months ended December 31, 2016High-Quality Liquid Assets (1) / /1 Total high-quality liquid assets (HQLA) 59,034,682 56,300,150
Cash Outflows (2)TOTAL
UNWEIGHTEDTOTAL WEIGHTED
VALUETOTAL
UNWEIGHTEDTOTAL WEIGHTED
VALUE2 Cash outflows related to unsecured retail funding 44,679,227 3,575,055 44,377,937 3,552,5503 of which, Stable deposits 12,789,510 383,685 12,681,362 380,4404 of which, Less stable deposits 31,889,716 3,191,370 31,696,574 3,172,109
5Cash outflows related to unsecured wholesale funding
71,707,171 44,568,652 66,285,674 39,750,546
6 of which, Qualifying operational deposits 0 0 0 0
7of which, Cash outflows related to unsecured wholesale funding other than qualifying operational deposits and debt securities
66,106,699 38,968,180 61,995,372 35,460,243
8 of which, Debt securities 5,600,471 5,600,471 4,290,302 4,290,3029 Cash outflows related to secured funding, etc / 915,319 / 849,784
10Cash outflows related to derivative transactions, etc. funding programs, credit and liquidity facilities
25,029,700 7,038,034 24,342,761 6,857,783
11of which, Cash outflows related to derivatives transactions, etc
2,537,216 2,537,216 2,594,609 2,594,609
12of which, Cash outflows related to funding programs
112,531 112,531 115,148 115,148
13of which, Cash outflows related to credit and liquidity facilities
22,379,952 4,388,287 21,633,003 4,148,025
14Cash outflows, etc. related to contractual funding obligations
6,833,946 2,217,821 5,453,967 1,820,987
15 Cash outflows related to contingencies 72,712,059 692,538 72,215,545 662,94516 Total cash outflows / 59,007,422 / 53,494,597
Cash Inflows (3)TOTAL
UNWEIGHTEDTOTAL WEIGHTED
VALUETOTAL
UNWEIGHTEDTOTAL WEIGHTED
VALUE
17Cash inflows related to secured lending and investments, etc.
10,407,502 842,947 9,828,735 681,437
18 Cash inflows related to collections of loans, etc 13,767,299 10,537,568 11,546,230 8,819,19619 Other cash inflows 6,774,374 2,015,305 6,412,191 2,307,50020 Total cash inflows 30,949,175 13,395,820 27,787,157 11,808,135Consolidated liquidity coverage ratio (4) / /
21Total HQLA allowed to be included in the calculation
/ 59,034,682 / 56,300,150
22 Net cash outflows / 45,611,601 / 41,686,46223 Consolidated liquidity coverage ratio / 129.4% / 135.3%
24The number of data used to calculate the average value
61 3
321
Liquidity Coverage Ratio
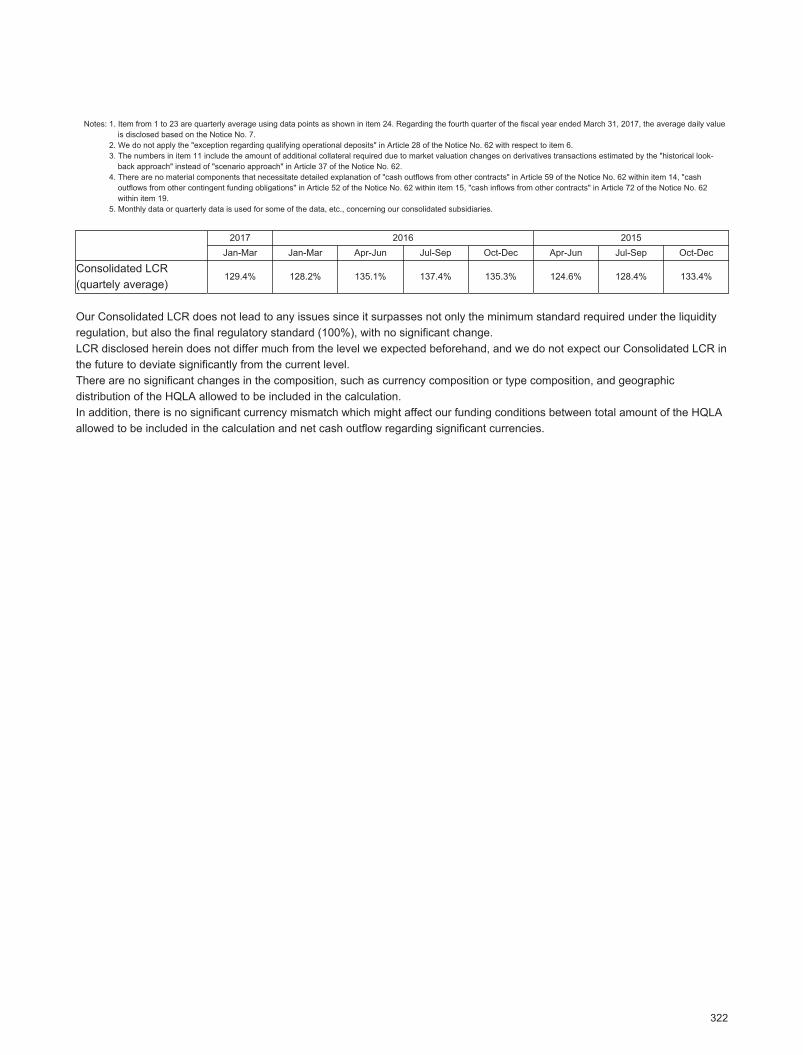
2017/09/06 9:42:26 / 17322939_株式会社みずほフィナンシャルグループ_総会その他(C)
Notes: 1. Item from 1 to 23 are quarterly average using data points as shown in item 24. Regarding the fourth quarter of the fiscal year ended March 31, 2017, the average daily value is disclosed based on the Notice No. 7.
2. We do not apply the "exception regarding qualifying operational deposits" in Article 28 of the Notice No. 62 with respect to item 6.3. The numbers in item 11 include the amount of additional collateral required due to market valuation changes on derivatives transactions estimated by the "historical look-
back approach" instead of "scenario approach" in Article 37 of the Notice No. 62.4. There are no material components that necessitate detailed explanation of "cash outflows from other contracts" in Article 59 of the Notice No. 62 within item 14, "cash
outflows from other contingent funding obligations" in Article 52 of the Notice No. 62 within item 15, "cash inflows from other contracts" in Article 72 of the Notice No. 62 within item 19.
5. Monthly data or quarterly data is used for some of the data, etc., concerning our consolidated subsidiaries.
2017 2016 2015Jan-Mar Jan-Mar Apr-Jun Jul-Sep Oct-Dec Apr-Jun Jul-Sep Oct-Dec
Consolidated LCR(quartely average)
129.4% 128.2% 135.1% 137.4% 135.3% 124.6% 128.4% 133.4%
Our Consolidated LCR does not lead to any issues since it surpasses not only the minimum standard required under the liquidity regulation, but also the final regulatory standard (100%), with no significant change.LCR disclosed herein does not differ much from the level we expected beforehand, and we do not expect our Consolidated LCR inthe future to deviate significantly from the current level.There are no significant changes in the composition, such as currency composition or type composition, and geographic distribution of the HQLA allowed to be included in the calculation.In addition, there is no significant currency mismatch which might affect our funding conditions between total amount of the HQLA allowed to be included in the calculation and net cash outflow regarding significant currencies.
322
Liquidity Coverage Ratio
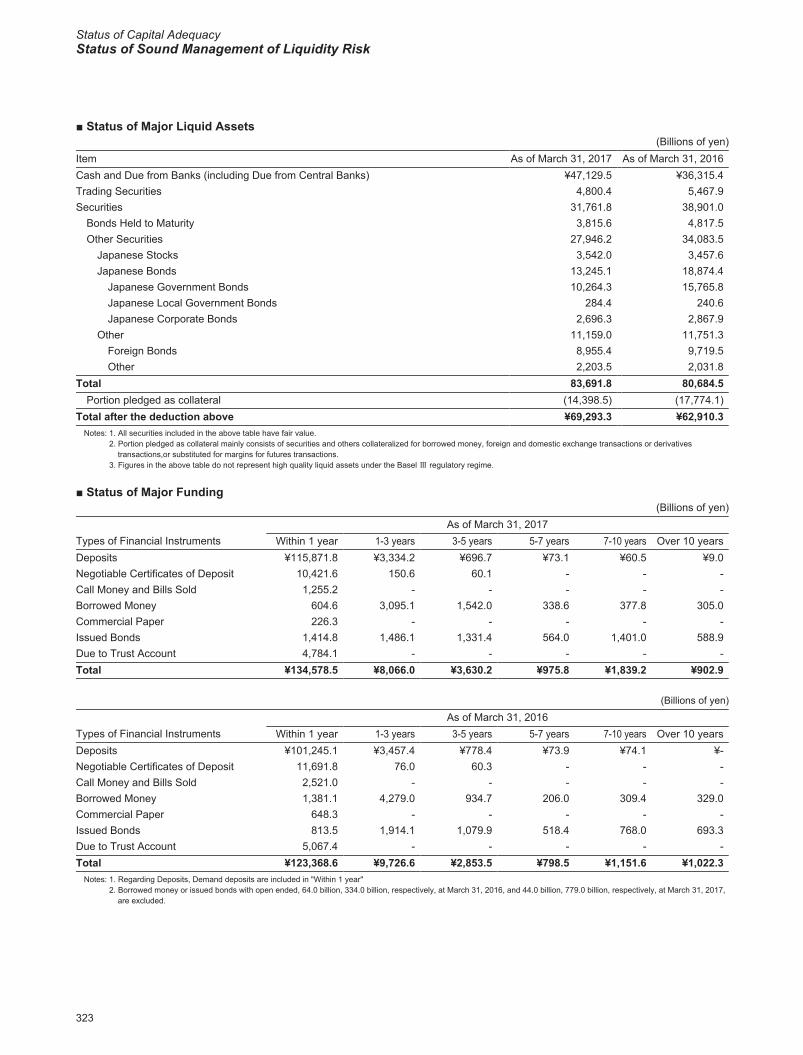
Status of Capital AdequacyStatus of Sound Management of Liquidity Risk
2017/09/06 9:42:26 / 17322939_株式会社みずほフィナンシャルグループ_総会その他(C)
■ Status of Major Liquid Assets(Billions of yen)
Item As of March 31, 2017 As of March 31, 2016Cash and Due from Banks (including Due from Central Banks) ¥47,129.5 ¥36,315.4Trading Securities 4,800.4 5,467.9Securities 31,761.8 38,901.0
Bonds Held to Maturity 3,815.6 4,817.5Other Securities 27,946.2 34,083.5
Japanese Stocks 3,542.0 3,457.6Japanese Bonds 13,245.1 18,874.4
Japanese Government Bonds 10,264.3 15,765.8Japanese Local Government Bonds 284.4 240.6Japanese Corporate Bonds 2,696.3 2,867.9
Other 11,159.0 11,751.3Foreign Bonds 8,955.4 9,719.5Other 2,203.5 2,031.8
Total 83,691.8 80,684.5Portion pledged as collateral (14,398.5) (17,774.1)
Total after the deduction above ¥69,293.3 ¥62,910.3Notes: 1. All securities included in the above table have fair value.
2. Portion pledged as collateral mainly consists of securities and others collateralized for borrowed money, foreign and domestic exchange transactions or derivatives transactions,or substituted for margins for futures transactions.
3. Figures in the above table do not represent high quality liquid assets under the Basel Ⅲ regulatory regime.
■ Status of Major Funding(Billions of yen)
As of March 31, 2017Types of Financial Instruments Within 1 year 1-3 years 3-5 years 5-7 years 7-10 years Over 10 yearsDeposits ¥115,871.8 ¥3,334.2 ¥696.7 ¥73.1 ¥60.5 ¥9.0Negotiable Certificates of Deposit 10,421.6 150.6 60.1 - - -Call Money and Bills Sold 1,255.2 - - - - -Borrowed Money 604.6 3,095.1 1,542.0 338.6 377.8 305.0Commercial Paper 226.3 - - - - -Issued Bonds 1,414.8 1,486.1 1,331.4 564.0 1,401.0 588.9Due to Trust Account 4,784.1 - - - - -Total ¥134,578.5 ¥8,066.0 ¥3,630.2 ¥975.8 ¥1,839.2 ¥902.9
(Billions of yen)
As of March 31, 2016Types of Financial Instruments Within 1 year 1-3 years 3-5 years 5-7 years 7-10 years Over 10 yearsDeposits ¥101,245.1 ¥3,457.4 ¥778.4 ¥73.9 ¥74.1 ¥-Negotiable Certificates of Deposit 11,691.8 76.0 60.3 - - -Call Money and Bills Sold 2,521.0 - - - - -Borrowed Money 1,381.1 4,279.0 934.7 206.0 309.4 329.0Commercial Paper 648.3 - - - - -Issued Bonds 813.5 1,914.1 1,079.9 518.4 768.0 693.3Due to Trust Account 5,067.4 - - - - -Total ¥123,368.6 ¥9,726.6 ¥2,853.5 ¥798.5 ¥1,151.6 ¥1,022.3
Notes: 1. Regarding Deposits, Demand deposits are included in "Within 1 year"2. Borrowed money or issued bonds with open ended, 64.0 billion, 334.0 billion, respectively, at March 31, 2016, and 44.0 billion, 779.0 billion, respectively, at March 31, 2017,
are excluded.
323
Liquidity Coverage Ratio
Status of Capital AdequacyCompensation of directors, corporate auditors and employees
2017/09/06 9:42:26 / 17322939_株式会社みずほフィナンシャルグループ_総会その他(C)
(16) Qualitative disclosure
(a) State of the organizational system relating to compensation of "Subject directors, corporate auditors and employees" of Mizuho group
1. Scope of "Subject directors, corporate auditors and employees""Subject directors, etc." and "Subject employees, etc." subject to disclosure as provided for in the FSA Notice (collectively, "Subject directors, corporate auditors and employees") are as follows:(1) Scope of "Subject directors, etc."
"Subject directors, etc." are directors and executive officers as defined in the Companies Act of Mizuho Financial Group, Inc. ("MHFG"). Outside directors auditors are excluded.
(2) Scope of "Subject employees, etc.""Subject employees, etc." who are subject to disclosure are executive officers (as defined in our internal regulations), specialist officers and employees of MHFG and directors, corporate auditors and employees of its major consolidated subsidiaries, who are "persons who receive large amounts of compensation" and "materially affect the operation of business or the state of assets of Mizuho group or its major consolidated subsidiaries."(a) Scope of "Major consolidated subsidiaries"
A "Major consolidated subsidiary" is a consolidated subsidiary, etc., (i) whose total assets as a percentage of consolidated total assets exceeds 2% of a bank holding company or bank and (ii) who materially affects the management of our group. Specifically, those are Mizuho Bank, Ltd. ("MHBK"), Mizuho Bank (USA) and other subsidiaries who conduct banking business similar to a branch of MHBK, Mizuho Trust & Banking Co., Ltd. ("MHTB"), Mizuho Securities Co., Ltd. ("MHSC"), Trust & Custody Services Bank, Ltd., Mizuho Securities USA Inc. and Mizuho International Plc.
(b) Scope of "Persons who receive large amounts of compensation"A "Person who receives large amounts of compensation" refers to a person who receives compensation that exceeds the base amount from MHFG or its major consolidated subsidiaries. The base amount at MHFG has been set at ¥50 million. Such base amount has been set based on the average amounts of the compensation of directors, executive officers (as defined in the Companies Act) and corporate auditors of MHFG, MHBK and MHTB for the last three fiscal years (excluding persons who resigned or retired during each of such fiscal years), taking into account fluctuations in amounts of compensation over past fiscal years. The preceding base amount has been adopted as the common base in order to unify the selection criteria of persons who receive large amounts of compensation at each of the companies in this paragraph.
(c) Scope of "Persons who materially affect the operation of business or the state of assets of Mizuho group"A "Person who materially affects the operation of business or the state of assets of Mizuho group" means a person who exerts significant influence on the operation of the business of MHFG or a major consolidated subsidiary through his or her work in conducting transactions or management, or who materially affects the state of assets by incurring losses on transactions. Specifically, it includes executive officers (as defined in our internal regulations) and specialist officers of MHFG and directors, corporate auditors, executive officers (as defined in our internal regulations), specialist officers and market department employees of major consolidated subsidiaries.
2. Decisions on compensation of "Subject directors, corporate auditors and employees"(1) Decisions on compensation of subject directors, etc.
MHFG is a Company with Three Committees, and has established the Compensation Committee as a statutory committee.The chairman of the statutory Compensation Committee shall be an outside director, and in principle its members shall be appointed from among the outside directors (or at least non-executive directors) in order to ensure objectivity and transparency in director and executive officer compensation. As of March 2017, all four members of the Compensation Committee, including the chairman, were outside directors. The Compensation Committee shall determine the basic policy and compensation system for directors and executive officers of MHFG, MHBK, MHTB and MHSC, determine the compensation for each individual director and executive officer (as defined in the Companies Act) of MHFG, and exercise approval rights in MHFG for compensation for each individual director of MHBK, MHTB and MHSC.In addition, the president of each of MHBK, MHTB and MHSC determines the amount of compensation for each of its executive officers and specialist officers.
324
Qualitative disclosure
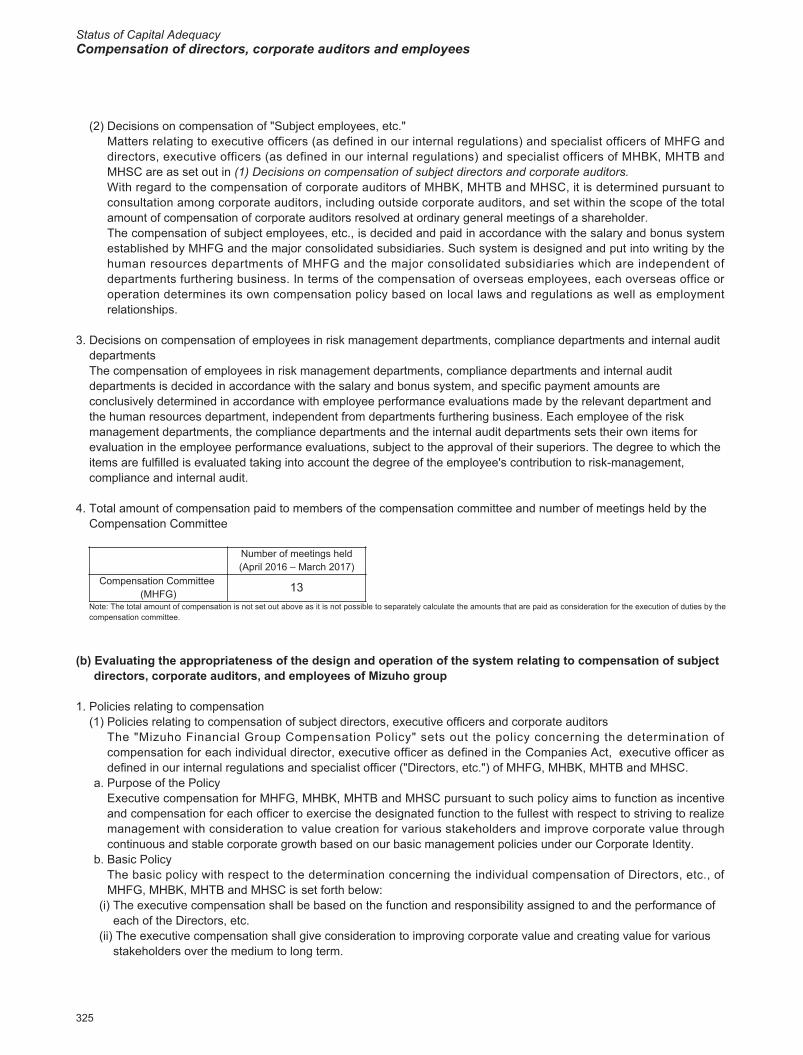
Status of Capital AdequacyCompensation of directors, corporate auditors and employees
2017/09/06 9:42:26 / 17322939_株式会社みずほフィナンシャルグループ_総会その他(C)
(2) Decisions on compensation of "Subject employees, etc."Matters relating to executive officers (as defined in our internal regulations) and specialist officers of MHFG and directors, executive officers (as defined in our internal regulations) and specialist officers of MHBK, MHTB and MHSC are as set out in (1) Decisions on compensation of subject directors and corporate auditors.With regard to the compensation of corporate auditors of MHBK, MHTB and MHSC, it is determined pursuant to consultation among corporate auditors, including outside corporate auditors, and set within the scope of the total amount of compensation of corporate auditors resolved at ordinary general meetings of a shareholder.The compensation of subject employees, etc., is decided and paid in accordance with the salary and bonus system established by MHFG and the major consolidated subsidiaries. Such system is designed and put into writing by the human resources departments of MHFG and the major consolidated subsidiaries which are independent of departments furthering business. In terms of the compensation of overseas employees, each overseas office or operation determines its own compensation policy based on local laws and regulations as well as employment relationships.
3. Decisions on compensation of employees in risk management departments, compliance departments and internal audit departmentsThe compensation of employees in risk management departments, compliance departments and internal audit departments is decided in accordance with the salary and bonus system, and specific payment amounts are conclusively determined in accordance with employee performance evaluations made by the relevant department and the human resources department, independent from departments furthering business. Each employee of the risk management departments, the compliance departments and the internal audit departments sets their own items for evaluation in the employee performance evaluations, subject to the approval of their superiors. The degree to which the items are fulfilled is evaluated taking into account the degree of the employee's contribution to risk-management, compliance and internal audit.
4. Total amount of compensation paid to members of the compensation committee and number of meetings held by the Compensation Committee
Number of meetings held(April 2016 – March 2017)
Compensation Committee (MHFG) 13
Note: The total amount of compensation is not set out above as it is not possible to separately calculate the amounts that are paid as consideration for the execution of duties by the compensation committee.
(b) Evaluating the appropriateness of the design and operation of the system relating to compensation of subject directors, corporate auditors, and employees of Mizuho group
1. Policies relating to compensation(1) Policies relating to compensation of subject directors, executive officers and corporate auditors
The "Mizuho Financial Group Compensation Policy" sets out the policy concerning the determination of compensation for each individual director, executive officer as defined in the Companies Act, executive officer as defined in our internal regulations and specialist officer ("Directors, etc.") of MHFG, MHBK, MHTB and MHSC.
a. Purpose of the PolicyExecutive compensation for MHFG, MHBK, MHTB and MHSC pursuant to such policy aims to function as incentive and compensation for each officer to exercise the designated function to the fullest with respect to striving to realize management with consideration to value creation for various stakeholders and improve corporate value through continuous and stable corporate growth based on our basic management policies under our Corporate Identity.
b. Basic PolicyThe basic policy with respect to the determination concerning the individual compensation of Directors, etc., of MHFG, MHBK, MHTB and MHSC is set forth below:
(i) The executive compensation shall be based on the function and responsibility assigned to and the performance of each of the Directors, etc.
(ii) The executive compensation shall give consideration to improving corporate value and creating value for various stakeholders over the medium to long term.
325
Qualitative disclosure
2017/09/06 9:42:26 / 17322939_株式会社みずほフィナンシャルグループ_総会その他(C)
(iii) The executive compensation shall reflect the management environment and business performance of our group.(iv) The executive compensation shall enable compensation for securing expert personnel such as professionals with
a competitive edge in the market.(v) The compensation system and standards shall be reevaluated based on such factors as the economic and social
conditions and survey data with respect to management compensation provided by external specialized organizations.
(vi) Regulations and guidelines, etc., concerning executive compensation, both in Japan and overseas, shall be complied with.
c. Compensation SystemI. The compensation system for executive officers as defined in the Companies Act (including executive officers who
are directors), executive officers as defined in our internal regulations and specialist officers of MHFG and directors, executive officers and specialist officers of MHBK, MHTB and MHSC responsible for business execution ("Officers Responsible for Business Execution") shall be separate from that for the non-executive directors of MHFG and the directors of MHBK, MHTB and MHSC responsible for management supervision ("Non-Executive Officers Responsible for Management Supervision").
II. The basic compensation system for Officers Responsible for Business Execution shall consist of basic salaries in the form of fixed compensation as well as variable compensation consisting of performance payments and performance-based stock compensation. The ratio of fixed compensation to variable compensation, the range of variable compensation based on business performance and the payment method shall be designated in light of sound incentivization for sustainable growth and restraint on excessive risk taking, while taking into account regulations and guidelines as well as research data, etc., both in Japan and overseas, concerning executive compensation. In principle, the ratio of fixed to variable compensation shall be 6 to 4 and the ratio of performance payments to performance-based stock compensation shall be 1 to 1, based on which the standard amount shall be calculated for each position. The variable compensation shall reflect each officer’s performance within the range of 0% to 150% of the standard amount for each position. The basic salaries, the performance payments and the performance-based stock compensation as well as the payment methods, etc., are in principle as set forth below:
(i) The basic salaries shall factor in each officer’s function and responsibility in addition to the standard amount for each position.
(ii) The performance payments shall be monetary made as officers’ incentive to achieve the annual budget and as compensation for their achievement. The payment thereof shall reflect each officer’s performance in addition to the standard amount for each position. A system shall be adopted which enables a certain amount of deferred payments of the performance payments over three years, as well as a decrease or forfeiture of the deferred amount depending on performance of the company and such officer.
(iii) The performance-based stock compensation shall be paid in the form of shares of common stock of MHFG acquired from the stock market through a trust with an aim to align officers’ interests with those of the shareholders and increase the incentive to enhance corporate value. The payment thereof shall reflect each officer’s performance in addition to the standard amount for each position. A system shall be adopted which enables the entire amount of deferred payments of the performance-based stock compensation over three years, as well as a decrease or forfeiture of the deferred amount depending on performance, etc., of the company and such officer.
(iv) The variable compensation intended for professional personnel, etc., appointed from outside the group shall be individually designed based on the duties and characteristics of business responsibilities and market values, etc., of each officer, a system which enables certain amount or a portion of deferred payments and non-monetary payments such as stock, as well as a decrease or forfeiture (clawback) of the deferred amount depending on the performance, etc., of the company and such personnel.
III. The compensation for Non-Executive Officers Responsible for Management Supervision, in principle, shall be in the form of fixed compensation from the perspective of ensuring the effectiveness of the supervisory function and shall consist of basic salaries and stock compensations.
(i) The basic salaries shall factor in each officer’s function and responsibilities in addition to the standard amount for each of the full-time and part-time non-executive officers.
(ii) The stock compensation shall be paid to full-time internal directors excluding outside directors in accordance with the standard amount based on each position. However, the payment standards shall not fluctuate depending on each director’s level of performance. A system shall be adopted which enables the entire amount of deferred payments of the stock compensation over three years, as well as a decrease or forfeiture of the deferred amount depending on performance, etc., of the company.
326
Qualitative disclosure
Status of Capital AdequacyCompensation of directors, corporate auditors and employees
2017/09/06 9:42:26 / 17322939_株式会社みずほフィナンシャルグループ_総会その他(C)
d. Compensation Determination ProcessI. The Compensation Committee shall determine the determination policy of executive compensation for MHFG,
MHBK, MHTB and MHSC. In addition, the Compensation Committee shall determine the compensation for each individual director and executive officer of MHFG and approve at MHFG the compensation of each individual director of MHBK, MHTB and MHSC.
II. The President & Executive Officer, pursuant to this policy and regulations and detailed rules, etc., shall determine the compensation for each executive officer as defined in our internal regulations and specialist officer of MHFG and approve at MHFG the compensation of each individual executive officer and specialist officer of MHBK, MHTB and MHSC.
III. All members of the Compensation Committee shall be appointed from among outside directors (or at least non-executive directors) and the chairman thereof shall be an outside director.
IV. The Compensation Committee, where necessary, may have officers who are not members of the committee (including officers of MHBK, MHTB and MHSC) such as the President & Executive Officer and external experts, etc., attend its meetings and request their opinion.
(2) Policies relating to compensation of subject employees, etc.The policies relating to compensation for executive officers (as defined in our internal regulations) and specialist officers of MHFG and directors, executive officers (as defined in our internal regulations) and specialist officers of MHBK, MHTB and MHSC are also the same as the policies described in (1) Policies relating to compensation of subject directors and corporate auditors above. The compensation of corporate auditors is determined pursuant to consultation among corporate auditors, including outside corporate auditors, and set within the scope of the total amount of compensation of corporate auditors resolved at ordinary general meetings of a shareholder.Compensation for other employees, etc., is determined in accordance with their duties and responsibilities. Some bonuses that are linked to performance are determined after comprehensively evaluating the employee’s contribution to business, including any qualitative contributions to the organization, in a manner that does not place an excessive emphasis on results.
2. The effect of the overall level of compensation, etc., on equity capitalThe Compensation Committee of MHFG receives reports on the amount of compensation paid to directors, executive officers (as defined in the Companies Act), executive officers (as defined in our internal regulations) and specialist officers of MHFG, MHBK, MHTB and MHSC in the previous fiscal year and confirms that there is no material effect on the Mizuho group’s performance or the adequacy of equity capital.
(c) Compatibility between system for compensation of subject directors, corporate auditors and employees of Mizuho group and risk management and matters relating to linking compensation with performance
The performance payments and performance-based stock compensation for Officers Responsible for Business Execution are made or paid based on the standard amount set for each position, with which each officer’s performance shall be reflected, and determined in accord with a performance evaluation, etc., against the annual business plan. A certain amount of the performance payments and the entire amount of the performance-based stock compensation shall be made or paid in deferred payments over three years, and a decrease or forfeiture of the deferred amount may be made depending on the performance, etc., of the company and such officer. It should be noted that certain subject directors, corporate auditors and employees have entered into compensation-related contracts.Stock compensation for Non-Executive Officers Responsible for Management Supervision shall be made in according with the standard amount set for each position, and the payment level shall not change based on the performance of each officer. The entire amount of the stock compensation shall be paid in deferred payments over three years, and a decrease or forfeiture of the deferred amount may be made depending on the performance, etc., of the company.
327
Qualitative disclosure
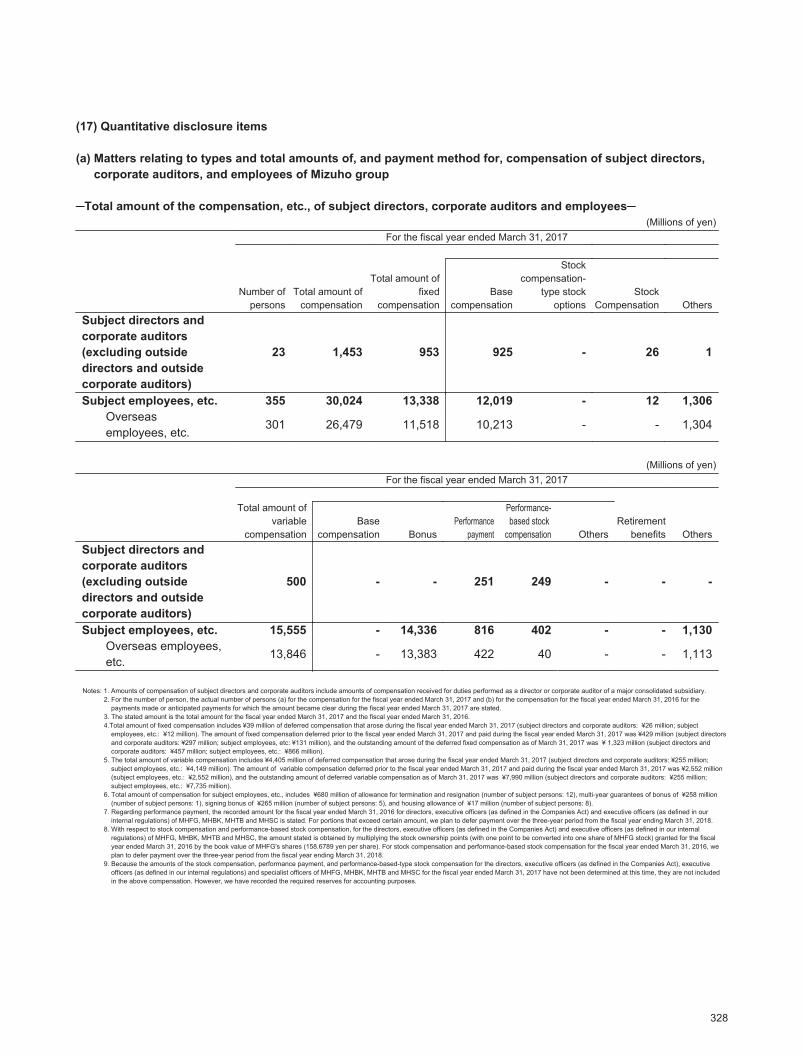
2017/09/06 9:42:26 / 17322939_株式会社みずほフィナンシャルグループ_総会その他(C)
(17) Quantitative disclosure items
(a) Matters relating to types and total amounts of, and payment method for, compensation of subject directors, corporate auditors, and employees of Mizuho group
─Total amount of the compensation, etc., of subject directors, corporate auditors and employees─(Millions of yen)
For the fiscal year ended March 31, 2017
Number ofpersons
Total amount ofcompensation
Total amount offixed
compensationBase
compensation
Stockcompensation-
type stockoptions
StockCompensation Others
Subject directors and corporate auditors (excluding outside directors and outside corporate auditors)
23 1,453 953 925 - 26 1
Subject employees, etc. 355 30,024 13,338 12,019 - 12 1,306Overseasemployees, etc.
301 26,479 11,518 10,213 - - 1,304
(Millions of yen)For the fiscal year ended March 31, 2017
Total amount ofvariable
compensationRetirement
benefits OthersBase
compensation BonusPerformance
payment
Performance-based stock
compensation OthersSubject directors and corporate auditors (excluding outside directors and outside corporate auditors)
500 - - 251 249 - - -
Subject employees, etc. 15,555 - 14,336 816 402 - - 1,130Overseas employees, etc.
13,846 - 13,383 422 40 - - 1,113
Notes: 1. Amounts of compensation of subject directors and corporate auditors include amounts of compensation received for duties performed as a director or corporate auditor of a major consolidated subsidiary.2. For the number of person, the actual number of persons (a) for the compensation for the fiscal year ended March 31, 2017 and (b) for the compensation for the fiscal year ended March 31, 2016 for the
payments made or anticipated payments for which the amount became clear during the fiscal year ended March 31, 2017 are stated.3. The stated amount is the total amount for the fiscal year ended March 31, 2017 and the fiscal year ended March 31, 2016.4.Total amount of fixed compensation includes ¥39 million of deferred compensation that arose during the fiscal year ended March 31, 2017 (subject directors and corporate auditors: ¥26 million; subject
employees, etc.: ¥12 million). The amount of fixed compensation deferred prior to the fiscal year ended March 31, 2017 and paid during the fiscal year ended March 31, 2017 was ¥429 million (subject directors and corporate auditors: ¥297 million; subject employees, etc: ¥131 million), and the outstanding amount of the deferred fixed compensation as of March 31, 2017 was ¥ 1,323 million (subject directors and corporate auditors: ¥457 million; subject employees, etc.: ¥866 million).
5. The total amount of variable compensation includes ¥4,405 million of deferred compensation that arose during the fiscal year ended March 31, 2017 (subject directors and corporate auditors: ¥255 million; subject employees, etc.: ¥4,149 million). The amount of variable compensation deferred prior to the fiscal year ended March 31, 2017 and paid during the fiscal year ended March 31, 2017 was ¥2,552 million (subject employees, etc.: ¥2,552 million), and the outstanding amount of deferred variable compensation as of March 31, 2017 was ¥7,990 million (subject directors and corporate auditors: ¥255 million; subject employees, etc.: ¥7,735 million).
6. Total amount of compensation for subject employees, etc., includes ¥680 million of allowance for termination and resignation (number of subject persons: 12), multi-year guarantees of bonus of ¥258 million (number of subject persons: 1), signing bonus of ¥265 million (number of subject persons: 5), and housing allowance of ¥17 million (number of subject persons: 8).
7. Regarding performance payment, the recorded amount for the fiscal year ended March 31, 2016 for directors, executive officers (as defined in the Companies Act) and executive officers (as defined in our internal regulations) of MHFG, MHBK, MHTB and MHSC is stated. For portions that exceed certain amount, we plan to defer payment over the three-year period from the fiscal year ending March 31, 2018.
8. With respect to stock compensation and performance-based stock compensation, for the directors, executive officers (as defined in the Companies Act) and executive officers (as defined in our internal regulations) of MHFG, MHBK, MHTB and MHSC, the amount stated is obtained by multiplying the stock ownership points (with one point to be converted into one share of MHFG stock) granted for the fiscal year ended March 31, 2016 by the book value of MHFG's shares (158.6789 yen per share). For stock compensation and performance-based stock compensation for the fiscal year ended March 31, 2016, we plan to defer payment over the three-year period from the fiscal year ending March 31, 2018.
9. Because the amounts of the stock compensation, performance payment, and performance-based-type stock compensation for the directors, executive officers (as defined in the Companies Act), executive officers (as defined in our internal regulations) and specialist officers of MHFG, MHBK, MHTB and MHSC for the fiscal year ended March 31, 2017 have not been determined at this time, they are not included in the above compensation. However, we have recorded the required reserves for accounting purposes.
328
Quantitative disclosure items
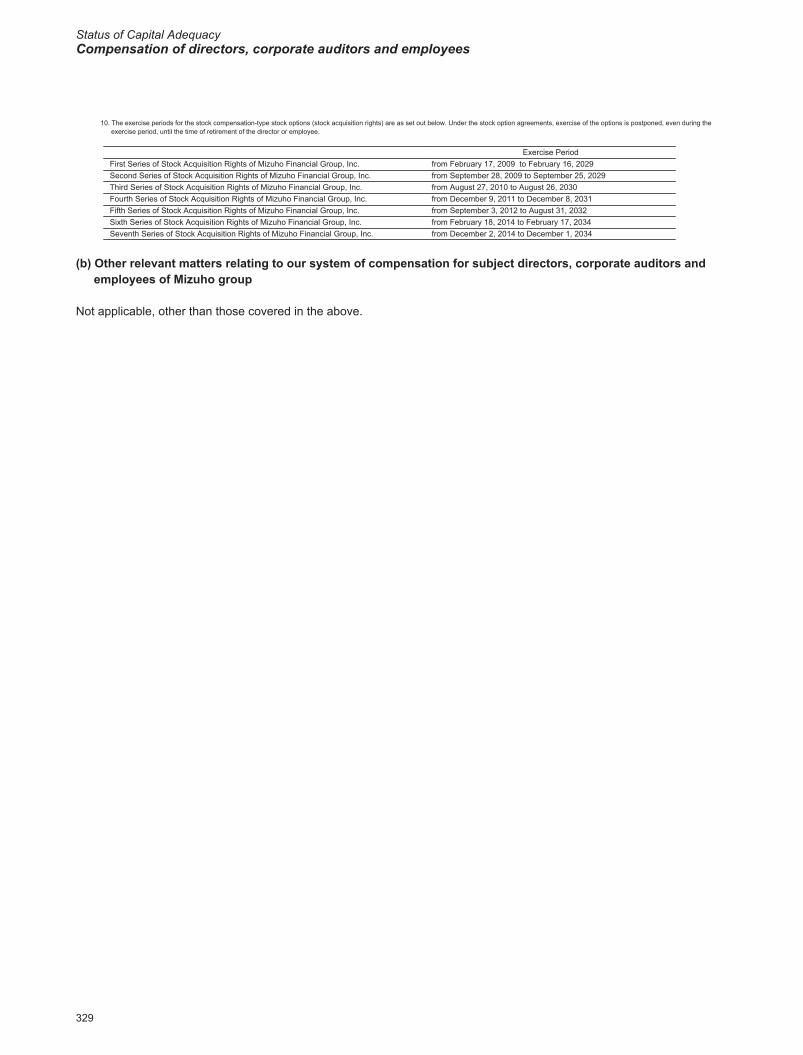
Status of Capital AdequacyCompensation of directors, corporate auditors and employees
2017/09/06 9:42:26 / 17322939_株式会社みずほフィナンシャルグループ_総会その他(C)
10. The exercise periods for the stock compensation-type stock options (stock acquisition rights) are as set out below. Under the stock option agreements, exercise of the options is postponed, even during the exercise period, until the time of retirement of the director or employee.
Exercise PeriodFirst Series of Stock Acquisition Rights of Mizuho Financial Group, Inc. from February 17, 2009 to February 16, 2029Second Series of Stock Acquisition Rights of Mizuho Financial Group, Inc. from September 28, 2009 to September 25, 2029Third Series of Stock Acquisition Rights of Mizuho Financial Group, Inc. from August 27, 2010 to August 26, 2030Fourth Series of Stock Acquisition Rights of Mizuho Financial Group, Inc. from December 9, 2011 to December 8, 2031Fifth Series of Stock Acquisition Rights of Mizuho Financial Group, Inc. from September 3, 2012 to August 31, 2032Sixth Series of Stock Acquisition Rights of Mizuho Financial Group, Inc. from February 18, 2014 to February 17, 2034Seventh Series of Stock Acquisition Rights of Mizuho Financial Group, Inc. from December 2, 2014 to December 1, 2034
(b) Other relevant matters relating to our system of compensation for subject directors, corporate auditors and employees of Mizuho group
Not applicable, other than those covered in the above.
329
Quantitative disclosure items


![-PsLs[t lgb]{zg, @)& / ;f] kZrft ldlt ... - archive.nrb.org.np · æsÆ ju{ Capital Adequacy Framework, 2015 adf]lhd /fli6«o:t/sf ævÆ ju{ Capital Adequacy Framework, 2007 (Updated](https://static.fdocument.pub/doc/165x107/5f743c586216800b757e71fa/pslst-lgbzg-f-kzrft-ldlt-s-ju-capital-adequacy-framework.jpg)