Phase-Specific Polypeptides andPoly(A) RNAs during Cell ... · during theG2phasedid...
8
Plant Physiol. (1989) 89, 910-917 0032-0889/89/89/091 0/08/$01 .00/0 Received for publication June 9, 1988 and in revised form October 21, 1988 Phase-Specific Polypeptides and Poly(A) RNAs during the Cell Cycle in Synchronous Cultures of Catharanthus roseus Cells1 Hiroaki Kodama*, Naoto Kawakami2, Akira Watanabe, and Atsushi Komamine Biological Institute, Faculty of Science, Tohoku University, Sendai, 980, Japan (H.K., A.K.); and Research Institute for Biochemical Regulation, Faculty of Agriculture, Nagoya University, Chikusa-ku, Nagoya, 464, Japan (N.K., A.W.) ABSTRACT This study shows an overall analysis of gene expression during the cell cycle in synchronous suspension cultures of Catharan- thus roseus cells. First, the cellular cytoplasmic proteins were fractionated by two-dimensional gel electrophoresis and visual- ized by staining with silver. Seventeen polypeptides showed qualitative or quantitafive changes during the cell cycle. Second, the rates of synthesis of cytoplasmic proteins were also investi- gated by autoradiography by labeling cells with [S]methionine at each phase of the cell cycle. The rates of synthesis of 13 polypeptides were found to vary during the cell cycle. The silver- stained electrophoretic pattem of proteins in the G2 phase in particular showed characteristic changes in levels of polypep- tides, while the rates of synthesis of polypeptides synthesized during the G2 phase did not show such phase-specific changes. This result suggests that posttranslational processing of polypep- tides occurs during or prior to the G2 phase. In the G1 and S phases and during cytokinesis, several other polypeptides were specifically synthesized. Finally, the variation of mRNAs was analyzed from the autoradiograms of In vitro translafton products of poly(A)+ RNA isolated at each phase. Three poly(A)+ RNAs increased in amount from the GI to the S phase and one poly (A)+ RNA increased preferentially from the G2 phase to cytokinesis. The cell cycle in eukaryotes consists of an ordered sequence of events, which include DNA synthesis, replication of organ- elles, and mitosis, and which are controlled by the ordered expression of genes. Many studies have been undertaken to examine the changes in protein patterns through which the sequential action of genes during the cell cycle is reflected, and to demonstrate that genes involved in cell proliferation are expressed transiently during the cell cycle. Two-dimen- sional gel electrophoresis has revealed the presence of several phase-specific proteins in mammalian cells which appear in the G2 phase (1) or which are synthesized in the S phase (10) and the G2/M phase (41). There are also reports (8, 15, 29) that no unique proteins are synthesized during the cell cycle in HeLa cells and yeast. 'This research was supported by grants-in-aid for scientific research (622002) from the Ministry of Education, Science and Culture, Japan. 2Present address: Kihara Institute for Biological Research, Yoko- hama City University, Mutsukawa 3-122-20, Minami-ku, Yokohama, 232, Japan. There have been also a number of reports on gene expres- sion considered in terms of variations in mRNAs during the cell cycle in mammalian cells and yeast. Several genes related to DNA synthesis, such as those that encoded dihydrofolate reductase (20), thymidine kinase (38), thymidylate synthetase (6), and histones (22, 34), are associated with transient in- creases in levels of their respective mRNAs during the cell cycle. It has been suggested that proto-oncogenes are involved in the intracellular events that govern cellular proliferation in mammalian cells (19). Altered expression of other specific genes has been detected via the appearance of new, translat- able mRNAs after stimulation of growth (21). Genes activated by mitogenic stimuli have also been investigated by differen- tial screening of cDNA libraries prepared from RNA of resting cells exposed to serum or growth factors, and a number of mRNAs have been shown to appear at specific intervals between stimulation and DNA synthesis (12, 26). On the other hand, only a few reports on studies of gene expression during the cell cycle of higher plant cells have appeared. Newly synthesized proteins in tobacco mesophyll protoplasts, cultivated in vitro, have been investigated by two- dimensional gel electrophoresis, but none of the proteins seen on the gels was specifically synthesized during the S, G2, or M phases (27). In cytokinin-requiring strains of soybean cells in suspension cultures, it was shown by Fosket et al. (17) that an increase in mitotic activity occurred after treatment of the cells with cytokinin. Deprivation of cytokinin caused mitotic arrest and the addition of cytokinin was followed by a change in the spectrum of proteins synthesized by the cells. Jouan- neau (23) also reported similar changes in proteins in tobacco suspension cultures. By contrast, Wang et al. (39) reported that in soybean suspension cultures deprivation of cytokinin did not cause arrest at any particular point in the cell cycle, and that no qualitative changes occurred in patterns of pro- teins examined by IEF.3 In fact, there are only a few reports dealing with gene expression during the cell cycle in synchron- ous culture systems of higher plant cells, and it is, therefore, appropriate at this time to generate the polypeptide maps at each phase of the cell cycle for such a system. The cells of Catharanthus roseus (periwinkle) contain sev- eral indole alkaloids, which have been applied in the treatment of circulatory diseases and leukemia. Many studies on the 3 Abbreviation: IEF, isoelectric focusing; PCNA, proliferating cell nuclear antigen. 910 www.plantphysiol.org on August 6, 2019 - Published by Downloaded from Copyright © 1989 American Society of Plant Biologists. All rights reserved.
Transcript of Phase-Specific Polypeptides andPoly(A) RNAs during Cell ... · during theG2phasedid...
Plant Physiol. (1989) 89, 910-9170032-0889/89/89/091 0/08/$01 .00/0
Received for publication June 9, 1988and in revised form October 21, 1988
Phase-Specific Polypeptides and Poly(A) RNAs during theCell Cycle in Synchronous Cultures of Catharanthus roseus
Cells1
Hiroaki Kodama*, Naoto Kawakami2, Akira Watanabe, and Atsushi Komamine
Biological Institute, Faculty of Science, Tohoku University, Sendai, 980, Japan (H.K., A.K.); and Research Institutefor Biochemical Regulation, Faculty of Agriculture, Nagoya University, Chikusa-ku, Nagoya, 464, Japan (N.K., A.W.)
ABSTRACT
This study shows an overall analysis of gene expression duringthe cell cycle in synchronous suspension cultures of Catharan-thus roseus cells. First, the cellular cytoplasmic proteins werefractionated by two-dimensional gel electrophoresis and visual-ized by staining with silver. Seventeen polypeptides showedqualitative or quantitafive changes during the cell cycle. Second,the rates of synthesis of cytoplasmic proteins were also investi-gated by autoradiography by labeling cells with [S]methionineat each phase of the cell cycle. The rates of synthesis of 13polypeptides were found to vary during the cell cycle. The silver-stained electrophoretic pattem of proteins in the G2 phase inparticular showed characteristic changes in levels of polypep-tides, while the rates of synthesis of polypeptides synthesizedduring the G2 phase did not show such phase-specific changes.This result suggests that posttranslational processing of polypep-tides occurs during or prior to the G2 phase. In the G1 and Sphases and during cytokinesis, several other polypeptides werespecifically synthesized. Finally, the variation of mRNAs wasanalyzed from the autoradiograms of In vitro translafton productsof poly(A)+ RNA isolated at each phase. Three poly(A)+ RNAsincreased in amount from the GI to the S phase and one poly (A)+RNA increased preferentially from the G2 phase to cytokinesis.
The cell cycle in eukaryotes consists ofan ordered sequenceof events, which include DNA synthesis, replication of organ-elles, and mitosis, and which are controlled by the orderedexpression of genes. Many studies have been undertaken toexamine the changes in protein patterns through which thesequential action of genes during the cell cycle is reflected,and to demonstrate that genes involved in cell proliferationare expressed transiently during the cell cycle. Two-dimen-sional gel electrophoresis has revealed the presence of severalphase-specific proteins in mammalian cells which appear inthe G2 phase (1) or which are synthesized in the S phase (10)and the G2/M phase (41). There are also reports (8, 15, 29)that no unique proteins are synthesized during the cell cyclein HeLa cells and yeast.
'This research was supported by grants-in-aid for scientific research(622002) from the Ministry ofEducation, Science and Culture, Japan.
2Present address: Kihara Institute for Biological Research, Yoko-hama City University, Mutsukawa 3-122-20, Minami-ku, Yokohama,232, Japan.
There have been also a number of reports on gene expres-sion considered in terms of variations in mRNAs during thecell cycle in mammalian cells and yeast. Several genes relatedto DNA synthesis, such as those that encoded dihydrofolatereductase (20), thymidine kinase (38), thymidylate synthetase(6), and histones (22, 34), are associated with transient in-creases in levels of their respective mRNAs during the cellcycle. It has been suggested that proto-oncogenes are involvedin the intracellular events that govern cellular proliferation inmammalian cells (19). Altered expression of other specificgenes has been detected via the appearance of new, translat-able mRNAs after stimulation ofgrowth (21). Genes activatedby mitogenic stimuli have also been investigated by differen-tial screening ofcDNA libraries prepared from RNA ofrestingcells exposed to serum or growth factors, and a number ofmRNAs have been shown to appear at specific intervalsbetween stimulation and DNA synthesis (12, 26).On the other hand, only a few reports on studies of gene
expression during the cell cycle of higher plant cells haveappeared. Newly synthesized proteins in tobacco mesophyllprotoplasts, cultivated in vitro, have been investigated by two-dimensional gel electrophoresis, but none ofthe proteins seenon the gels was specifically synthesized during the S, G2, orM phases (27). In cytokinin-requiring strains of soybean cellsin suspension cultures, it was shown by Fosket et al. (17) thatan increase in mitotic activity occurred after treatment of thecells with cytokinin. Deprivation of cytokinin caused mitoticarrest and the addition of cytokinin was followed by a changein the spectrum of proteins synthesized by the cells. Jouan-neau (23) also reported similar changes in proteins in tobaccosuspension cultures. By contrast, Wang et al. (39) reportedthat in soybean suspension cultures deprivation of cytokinindid not cause arrest at any particular point in the cell cycle,and that no qualitative changes occurred in patterns of pro-teins examined by IEF.3 In fact, there are only a few reportsdealing with gene expression during the cell cycle in synchron-ous culture systems of higher plant cells, and it is, therefore,appropriate at this time to generate the polypeptide maps ateach phase of the cell cycle for such a system.The cells of Catharanthus roseus (periwinkle) contain sev-
eral indole alkaloids, which have been applied in the treatmentof circulatory diseases and leukemia. Many studies on the
3 Abbreviation: IEF, isoelectric focusing; PCNA, proliferating cellnuclear antigen.
910 www.plantphysiol.orgon August 6, 2019 - Published by Downloaded from
Copyright © 1989 American Society of Plant Biologists. All rights reserved.
CHANGES IN POLYPEPTIDES AND mRNAs DURING THE CELL CYCLE
accumulation of indole alkaloids in C. roseus cells have beenreported (14). Several investigations in terms of cell prolifer-ation have also been performed in C. roseus cells grown insuspension (13, 16).Amino et al. (3) have established a system of synchronous
cell division in suspension cultures of C. roseus cells. Usingthis systems, this paper presents a comprehensive study of thechanges in gene expression during the cell cycle of a higherplant by providing a catalog of constituent polypeptides, oftheir relative rates of synthesis and of the population oftranslatable mRNA. Possible roles in the cell cycle of thepolypeptides and mRNAs that have been revealed by thisstudy, are discussed.
Materials and Methods
Cells and Synchronized Growth
Cultures of cells of Catharanthus roseus L. (G) Don. weremaintained at 27°C, in the dark, in Murashige-Skoog mediumwhich contained 3% (w/v) sucrose and 2.2 x 10 M-6 2,4-D.Cells were subcultured every 7 d, and were synchronized inearly GI by the double phosphate starvation method (3). Cellswere cultured in phosphate-free medium at an initial celldensity of about 3 x 10⁵ cells/mL for 3 d. Pi was then addedto the medium at a final concentration of 0.14 mm. Eighteenh later the cells were washed with phosphate-free mediumand transferred to phosphate-free medium at a cell density ofabout 2 x I05 cells/mL. Pi was added again after 3 d inculture, and the synchronized division of cells was observed.In this system, the total duration of the cell cycle was about30 h, and 70 to 80% of the cells usually divided within a 4-hinterval. This period of cell division was designated 'cytoki-nesis.' The duration of each phase of the cell cycle wasdetermined as previously described (3). The average durationof the GI phase was 12 h, that of the S phase was 13 h, andthat ofthe G2 plusM phases was 7 h. The degree ofsynchronyin this system was checked by analyzing the cell number andmitotic index of synchronized populations, and the DNAcontent of synchronized cells was also measured by flowcytometrical analysis as previously reported (4).
Harvesting and Labeling of Cells
Cells were collected on Miracloth at the following timesafter the addition of Pi: 15 h (S phase); 27 h (G2 phase); 29 h(cytokinesis); and 35 h (G1 phase). Cells in the first G1 phase(0-12 h) were not used, because the protein pattern in thosecells is affected by the addition of phosphate after starvation.Two hundred mg of cells were harvested for the preparationof soluble proteins and 11 to 13 g of cells harvested for theisolation of poly(A)+ RNA. Both groups of cells were frozenin liquid nitrogen and stored at -80°C.
In order to detect the polypeptides synthesized at eachphase, 1 mL of a suspension of synchronized cells (about 1 x10⁶ cells/mL) was incubated with 50 1Ci [35S]methionine(specific activity 44.6 Tbq/mmol, Amersham) at 27°C for 60min. This labeling was started at the midpoint of each phase,namely, 15 h (S phase), 25 h (G2 phase), 27.5 h (cytokinesis),and 36 h (GI phase) after Pi was added. The labeled cells were
collected by centrifugation at 300g for 2 min, frozen directlyin liquid nitrogen, and stored at -80°C.
Preparation of Cytoplasmic Proteins
Aliquots of 200 mg of frozen unlabeled cells or 60 mg offrozen labeled cells were suspended in 600 gL of extractionbuffer (10 mm potassium phosphate [pH 7.5], 5 mM MgC12,5 mM 2-mercaptoethanol) that contained 20 mg polyvinyl-polypyrrolidone, and homogenized with a glass homogenizer.Large fragments of cell debris were eliminated from thehomogenate by centrifugation at 6,000g for 2 min, and thesupernatant was centrifuged again at 20,000g for 30 min. Thesupernatant was dialyzed in extraction buffer overnight at4°C. The cleared supernatant was adjusted to a final concen-tration of 8 M urea, 2% (v/v) amphoiyte (pH 3.5- 10, Ampho-line, LKB) and 2% (v/v) Nonidet P-40. The diluted sampleswere stored at -80°C. Protein concentrations were measuredby Bradford's method (7). To measure rates of protein syn-thesis, the incorporation of [35S]methionine into hot-TCA-insoluble material was measured (35).
Extraction of Poly(A) RNA
The high-mol wt RNA was extracted as described bySchmidt et al. (36). Eleven to 13 g of frozen cells werehomogenized with 40 mL of 50 mM Tris-HCl (pH 9.0), 1%(w/v) SDS, and an equal volume of 90% (v/v) phenol in aWaring blender. The aqueous phase obtained upon centrifu-gation was extracted with an equal volume ofphenol:chloroform (1:1, v/v) and extracted with an equalvolume of chloroform. The final aqueous extract was thenadjusted to pH 5.0 by the addition of acetic acid and made0.2 M in NaCl. The nucleic acids were precipitated with 0.6vol of isopropanol at -20C overnight. The precipitated nu-cleic acids were dissolved in sterile H20, and the high-mol wtRNA was precipitated overnight at 4°C in 2 M LiCl. Theprecipitated high-mol wt RNA was washed twice with 70%(w/v) ethanol, and then dissolved in sterile water. Poly(A)+RNA was prepared from this RNA fraction by chromatogra-phy on oligodeoxythymidylic acid-cellulose (Pharmacia) (5).
Protein Synthesis in Vitro in the Wheat Germ System
Wheat germ extract was prepared according to the methodof Marcu and Dudock (25), and used to translate poly(A)+RNA in vitro (40). One Ag of poly(A)+ RNA and 10 ,uCi of[35S]methionine (specific activity 34.6 TBq/mmol, New Eng-land Nuclear) were added per 10 zL ofwheat germ translationmixture and incubated at 30°C for 60 min. The translationreaction was stopped by the addition of 10 ,g/mL RNase A(Sigma) followed by incubation at 30C for 15 min. Thereaction mixture was diluted with 60 ,uL of 9.5 M urea, 2%(v/v) Nonidet P-40 and 2% (v/v) ampholyte (pH 3.5-10,Ampholine, LKB) and stored at -80°C. The incorporation of[35S]methionine into hot-TCA-insoluble material was alsomeasured.
Two-Dimensional Gel ElectrophoresisIEF in the first dimension (ampholytes, pH 4-7) and SDS/
PAGE in the second dimension (12.5%, w/v, acrylamide) was
911
www.plantphysiol.orgon August 6, 2019 - Published by Downloaded from Copyright © 1989 American Society of Plant Biologists. All rights reserved.
Plant Physiol. Vol. 89,1989
performed by the method of O'Farrell (31). Volumes ofsamples applied to the first dimension were adjusted as fol-lows: samples containing 20,g protein were used for analysisby silver-staining, samples containing 4 x 10⁵ cpm of radio-active protein were used for the detection of polypeptidessynthesized at each phase and sample consisted of 30 ,L ofdiluted reaction mixture that contained translated polypep-tides from about 0.5 Mg poly(A)+ RNA. Poly(A)+ RNAsisolated from the cells at each phase of the cell cycle weretranslated with same efficiency. The aliquots of each reactionmixture, therefore, contained equal amounts of radioactivityas protein. After electrophoresis, the gels were fixed andstained with silver nitrate according to a modified version ofthe procedure ofOakley et al. (30). In the case ofthe detectionof polypeptides labeled with [35S]methionine, gels were fluo-rographed (24), dried, and exposed to Kodak XAR 5 film at-80°C for 2 to 7 d. Mol wt were estimated from the migrationon gels relative to mol wt markers from Biorad: lysosome(14,400 D), soybean trypsin inhibitor (21,500 D), carbonicanhydrase (31,500 D), ovalbumin (41,500 D), bovine serumalbumin (66,200 D), and phosphorylase B (92,500 D).
RESULTS
Changes in Electrophoretic Patterns of PolypeptidesVisualized by Silver-Staining
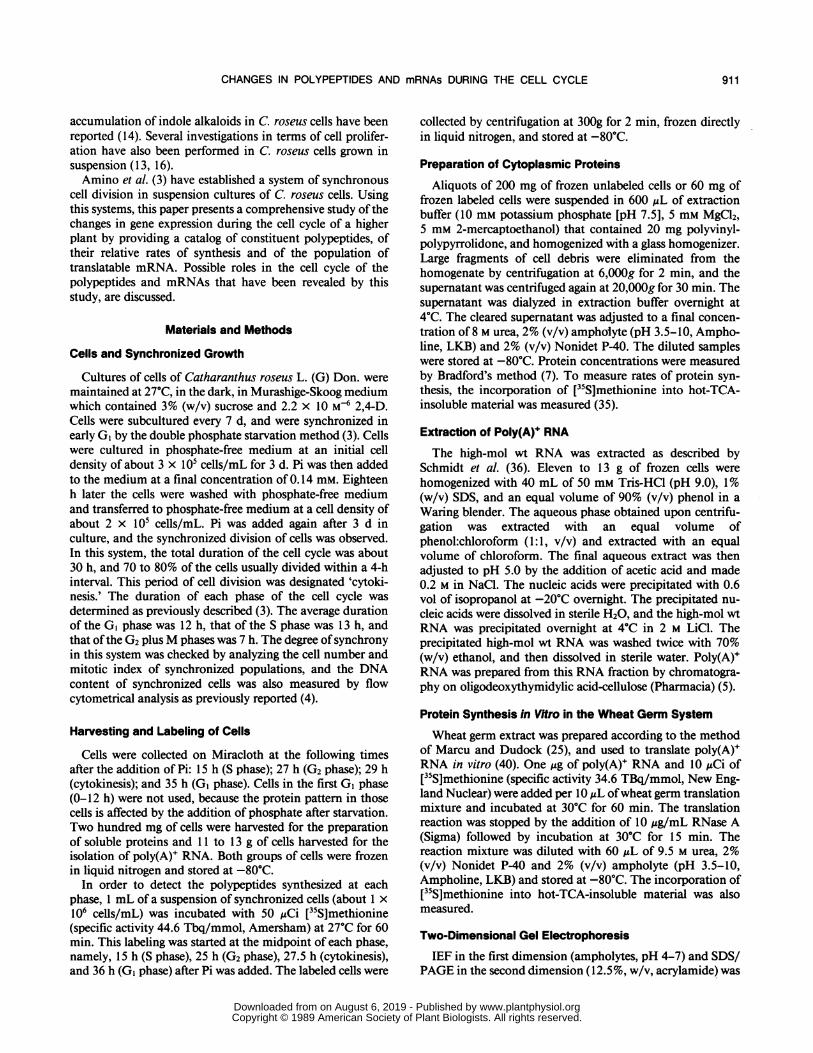
The measurements undertaken demonstrated several dis-tinct changes in proteins at various stages of the cell cycle.The extraction procedure yielded primarily cytoplasmic pro-teins. Proteins bound to membranes and associated withchromatin were not extracted because ofthe low ionic strengthof the buffer and the absence of a surface-active agent. Figure1 shows the patterns of polypeptides at each phase of the cellcycle. Small differences can be seen between these four poly-peptide patterns which have been visualized by staining withsilver nitrate. Figure 2 shows the polypeptide map preparedfrom the two-dimensional electrophoretic pattern of cyto-plasmic proteins in the G2 phase. The relative intensity of apolypeptide spot indicates the relative size of the pool of thatpolypeptide. Seventeen kinds of polypeptide, indicated by
:. t
GI
-_
Figure 1. Silver-stained electrophoretic patterns of polypeptides ateach phase of the cell cycle in C. roseus cells. C indicates cytokinesis.
l
cza.
Lfl
a'F)IEF
_~
_*~
*_.: -~-12.X-
1 14*
..
1 -l
* *
t0
Figure 2. Two-dimensional map of polypeptides detected by silver-staining. The map was prepared by tracing the electrophoretic patternof polypeptides isolated during the G2 phase. Numbers (1-17) havebeen assigned to polypeptides in which qualitative or quantitativechanges were observed during the cell cycle. The positions of poly-peptides 2, 7, 8, and 13, which were not detected in the silver-stainedelectrophoretic pattem obtained from cells in the G2 phase, areindicated by arrows. Thus, there are no spots corresponding to thesepolypeptides in this figure.
.G.-_a ._
.-lo
14I
4b
'W 9, I;iSn
S -G2 C
l3e~~~ 4 4 p
_ _ __~1
_0 6
o* 1
100 I
Figure 3. Silver-stained electrophoretic pattems of polypeptides ateach phase of the cell cycle. Polypeptides marked with circles (6-14)were those in which changes were observed during the cell cycle.
arrows, display qualitative and quantitative changes duringthe cell cycle. Figure 3, for example, shows that polypeptides7, 9, 10, and 11 were clearly detectable in the S phase buthardly detectable during cytokinesis. Polypeptides 8 and 12were detected only in the S and G2 phases, respectively. InTable I, the variations in polypeptides during the cell cycleare summarized with their mol wt. Polypeptides 4, 8, 12, and15 each appeared at a specific phase in the cell cycle. Poly-peptides 1, 2, 13, and 16 disappeared or their levels decreasedat specific phases, but in other phases these polypeptides weredetected at constant levels. Levels of polypeptides 5, 6, 14,and 17 increased at particular phases, and those of polypep-tides 3, 7, 9, 10, and 11 increased gradually and reachedmaximum levels at particular phases. All other polypeptides
912 KODAMA ET AL.
t
-.71.
I
4w . 0
iw 1
-
I
www.plantphysiol.orgon August 6, 2019 - Published by Downloaded from Copyright © 1989 American Society of Plant Biologists. All rights reserved.
CHANGES IN POLYPEPTIDES AND mRNAs DURING THE CELL CYCLE
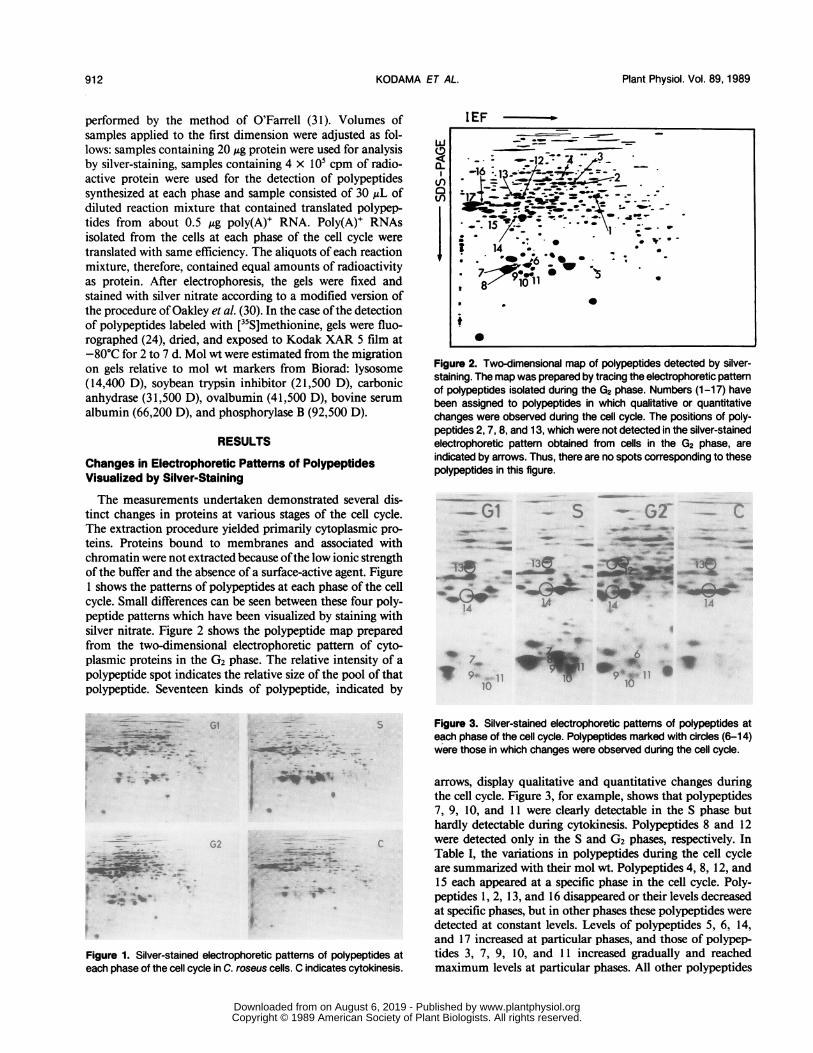
Table I. Relative Amounts of Polypeptides at Each Phase of the CellCycle
Results were obtained from the silver-stained electrophoretic pat-terns by visual estimation of the relative amounts of each polypeptide.
Polypeptidesa Mol wt G, S G2 Cb
kD
1 46 +++c + +++ +++2 52 ++ ++ - ++3 53 ++ + +++ +4 55 - - ++ -5 27 +++ + + +6 27 + + +++ +7 27 ++ +++ - +8 26 - ++ - -9 26 + +++ ++ +10 26 + +++ ++ +11 26 + +++ ++ +12 45 - +++ -
13 45 ++ ++ + ++14 38 + + + +++15 38 - - ++ -16 42 +++ +++ + +++17 42 + + +++ +
a Polypeptide numbers correspond to those shown in Figure1. b C, cytokinesis. c +++, Clearly detected; ++, detected;+, trace; ±, obscure; -, not detected.
_- - _- _ - GIt- _:_
pP Vv~~~~~t
4
S
c
wLL
a-un0T)
IEF -
- ~ ~ .~
S_~~~~.. B
M'A
0a. / .-W _
\ ,, ~~~-F -.
.~~~ ~ ~ ~ ~ ~ . *
SC
Figure 5. Two-dimensional map of synthesized polypeptides. Themap was prepared by tracing the autoradiogram of polypeptidessynthesized during the G2 phase. Letters (A-M) indicate polypeptidesin which changes were observed during the cell cycle. Althoughpolypeptides A and G are not detected in the G2 phase, the positionsof these polypeptides are indicated by arrows.
;WOK _ *OK_
40"W9 -_s
_ W
J I j I
GI'.
G2 -
-, .
,.
S
_KeKe
40 _
0 G2 CFigure 4. Autoradiograms of polypeptides synthesized at each phaseof the cell cycle in C. roseus cells. C indicates cytokinesis.
shown in Figure 2 constituted about 95% of the total cyto-plasmic protein and no changes in their levels were observedduring the cell cycle.
Changes in Rates of Synthesis of CytoplasmicPolypeptides
Cells in the GI, S, and G2 phases and cells during cytokinesiswere labeled with [35S]methionine for 60 min. Figure 4 showsthe two-dimensional gel electrophoretic patterns of polypep-tides synthesized during each phase. Autoradiograms of la-beled polypeptides from cells in the GI, S, G2, and during
Figure 6. Autoradiograms of polypeptides synthesized at each phaseof the cell cycle. Polypeptides marked with circles (G-K) are thosefor which changes were observed during the cell cycle.
cytokinesis revealed that the rates of synthesis of 13 differentpolypeptides (A-M) varied during the cell cycle (Figs. 4 and5). In Figure 6, the changes in the rates of synthesis ofpolypeptides (G-K) are shown. Polypeptide J was synthesizedat a constant rate in the GI, S, and G2 phases, but duringcytokinesis the intensity of the corresponding spot on the gelwas significantly reduced. Polypeptide G was detected clearlyonly in the GI phase. Changes in the rates of synthesis andthe mol wt of these 13 polypeptides are listed in Table II.Polypeptides A, G, and H seemed to be synthesized exclu-sively during one specific phase of the cell cycle. The rate of
913
--
...
www.plantphysiol.orgon August 6, 2019 - Published by Downloaded from Copyright © 1989 American Society of Plant Biologists. All rights reserved.
Plant Physiol. Vol. 89,1989
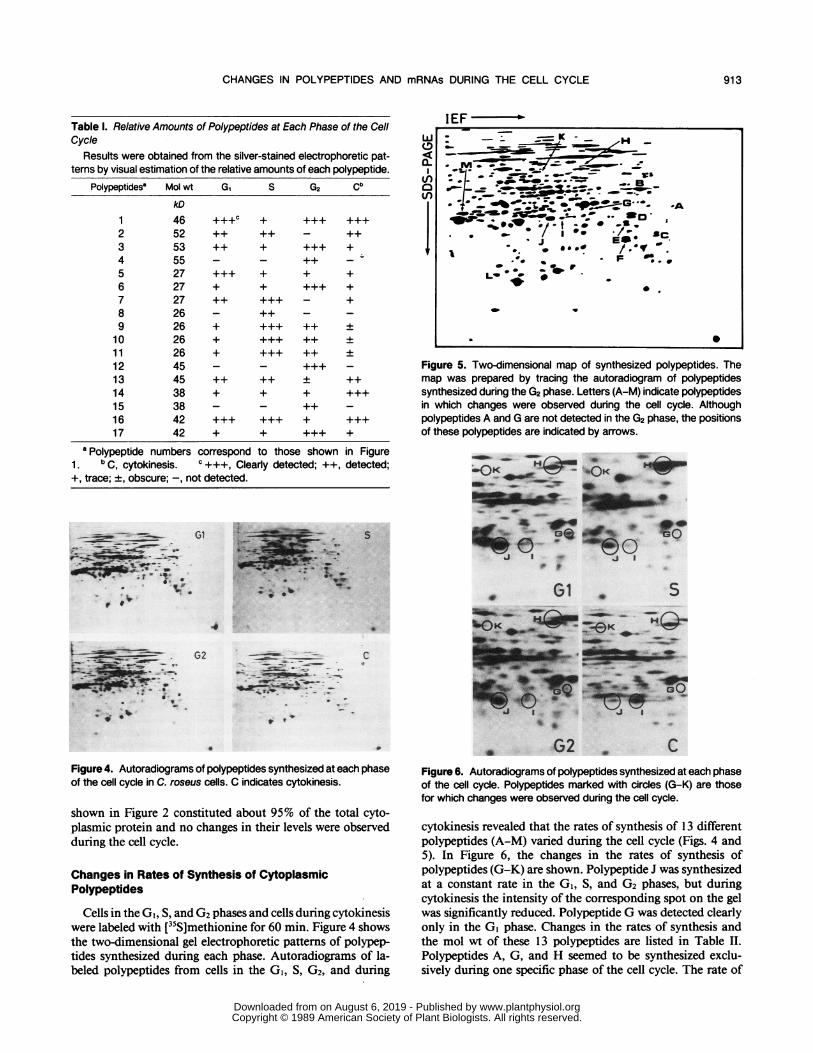
Table II. Relative Rates of Synthesis of Polypeptides at Each Phaseof the Cell Cycle
Results were obtained from the autoradiograms by visual estima-tion of the relative intensities of the spots corresponding to thepolypeptides.
Polypeptides" Mol wt GI S G2 Cb
kDA 44 ++c _ _ _B 52 +++ + +++ +++C 34 ++ - ++ -
D 40 ++ - ++ -E 38 ++ - ++ -F 33 ++ - ++ -G 43 +++ - - -H 73 - +++ - -
44 + + + +++J 44 +++ +++ +++ +K 65 + - + ++L 26 + +++ ++ +M 43 ++ ++ ++ -
a Polypeptide letters correspond to those shown in Figure5. b C, cytokinesis. c See footnote in Table I.
G2(A)
.~~-'a WI ---Iw
m
. _.I
ai
. .
. I
GI
A
(G7|~~~~~~~~~~~~~~N
~~~~~~~v -
0%,_ . w
_ 6 ,
,_ _
.0.
t
A
Figure 8. Autoradiograms of polypeptides translated from poly(A)+RNA isolated at each phase of the cell cycle from C. rosews cells.Poly(A)+ RNA was purified from total RNA as described in "Materialsand Methods" and translated in a wheat germ system.
IEFw
V)001)~~ ~ ~ ~ ~ ~ .
q
.. %
tf A w
a*A
G2(B)
Figure 7. Comparison between a silver-stained gel and an autoradi-ogram. Silver-stained pattem of polypeptides in the G2 phase (A).Autoradiogram of polypeptides synthesized during the G2 phase (B).
synthesis of polypeptide I showed a remarkable increase dur-ing cytokinesis, while in the GI, S, and G2 phases polypeptideI was present at all times and synthesized at a relatively lowrate. Synthesis of polypeptides B, J, and M ceased or theirrates of synthesis decreased considerably during specificphases of the cell cycle. Polypeptides C, D, E, and F were
periodically detected in the autoradiograms of cells in the GIand G2 phases. Polypeptide K was synthesized at a maximumrate during cytokinesis, while polypeptide L was synthesizedat a maximum rate during the S phase. Other unnamed
Figure 9. Two-dimensional map of polypeptides translated frompoly(A)+ RNA. The map was prepared by tracing the autoradiogramof polypeptides translated from poly(A)+ RNA isolated from cells inthe S phase. Letters (a-d) have been assigned to polypeptides forwhich qualitative or quantitative changes were observed during thecell cycle. Polypeptide d was not detected in the autoradiogram forthe S phase, so in this figure there is no spot for this polypeptide,but its position is indicated by an arrow.
polypeptides, representing about 95% ofthe total polypeptidesseen on autoradiograms, were unchanged, in terms of theintensities of their respective spots, throughout the cell cycle.Almost all spots detected on autoradiograms were also
detected on silver-stained gels. However, the changes observedin the silver-stained electrophoretic patterns do not reflectchanges in the rates of synthesis of polypeptides. Only one
polypeptide, designated as 17 on the silver-stained gels (Fig.2) and as M in the autoradiograms (Fig. 5) showed a parallelchange in both its level and its rate of synthesis (Tables I and
.h . -. --
. 'C. .. -
t9-.- ...
0.w w
0*e . * *'@... S* - *0
S S
9
KODAMA ET AL.914
*
www.plantphysiol.orgon August 6, 2019 - Published by Downloaded from Copyright © 1989 American Society of Plant Biologists. All rights reserved.
CHANGES IN POLYPEPTIDES AND mRNAs DURING THE CELL CYCLE
Gl s G2 C*~~~all a<3 acgd _
ti¢*
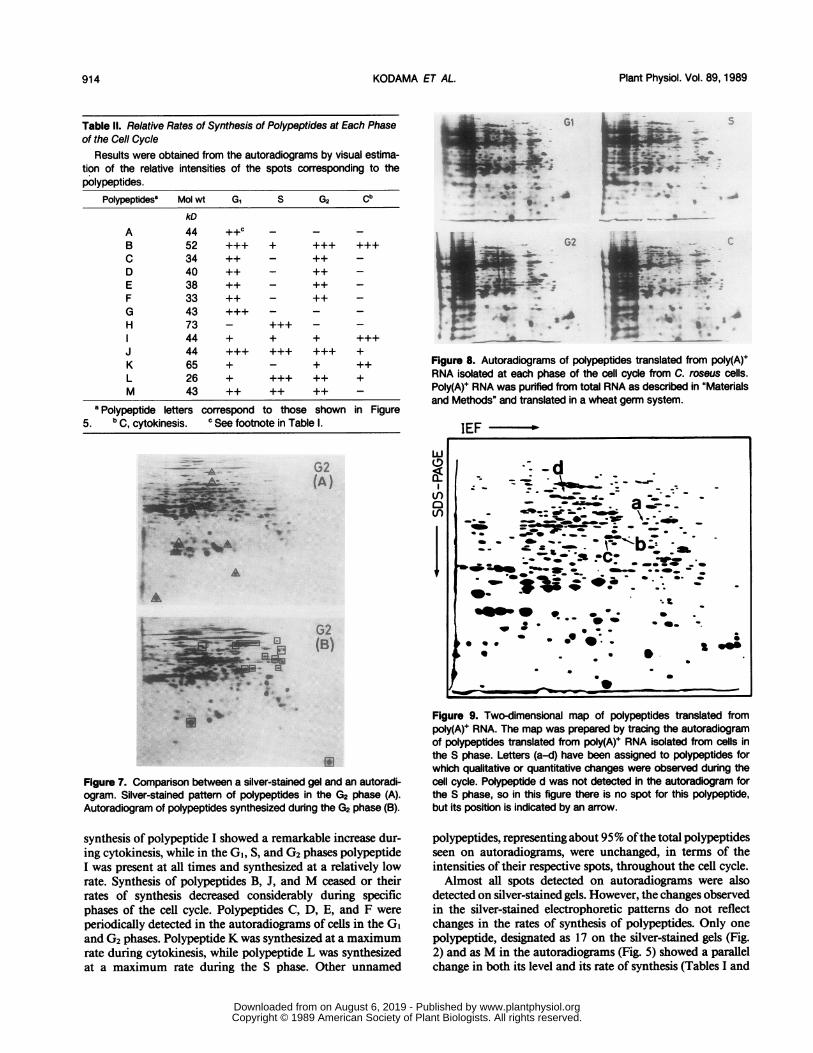
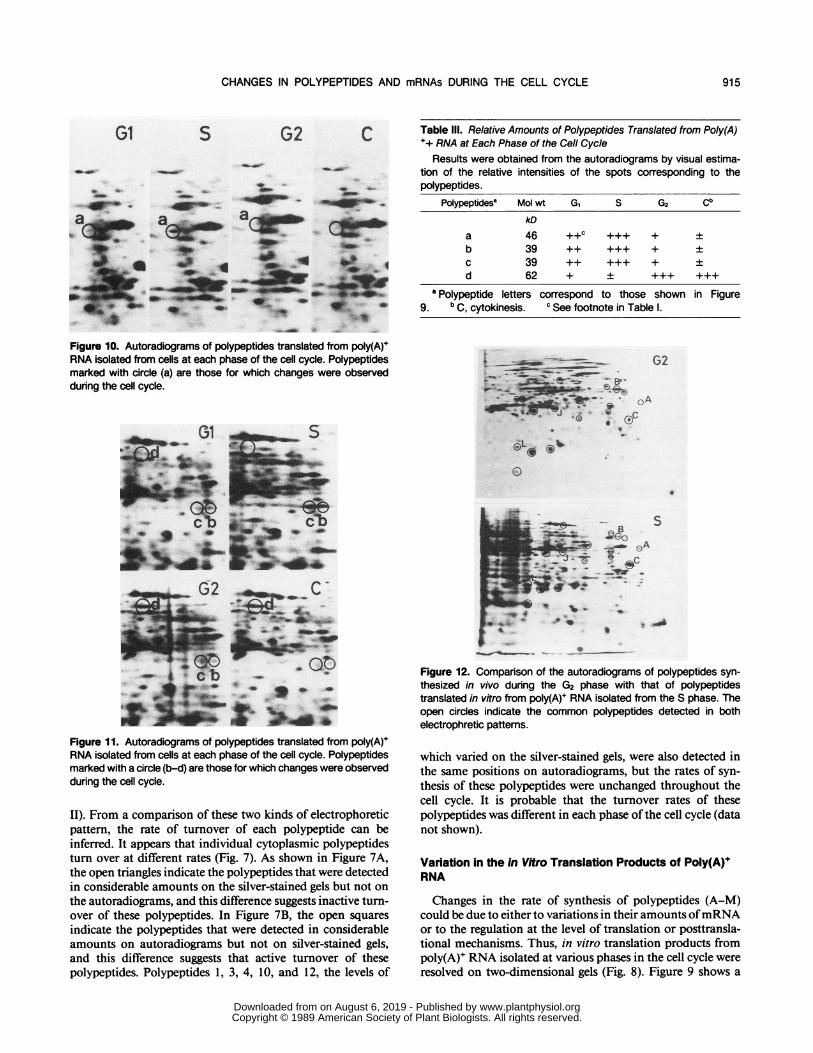
4A'AFigure 10. Autoradiograms of polypeptides translated from poly(A)+RNA isolated from cells at each phase of the cell cycle. Polypeptidesmarked with circle (a) are those for which changes were observedduring the cell cycle.
Gi s
_ ~~~~~~CAE ___
_ 1) _,' o~~~~~~~~~~f
Table Ill. Relative Amounts of Polypeptides Translated from Poly(A)++ RNA at Each Phase of the Cell Cycle
Results were obtained from the autoradiograms by visual estima-tion of the relative intensities of the spots corresponding to thepolypeptides.
Polypeptidesa Mol wt G, S G2 Cb
kD
a 46 ++c +++ + +b 39 ++ +++ + +c 39 ++ +++ + +d 62 + + +++ +++
a Polypeptide letters correspond to those shown in Figure9. b C, cytokinesis. c See footnote in Table I.t_- ~~~~G2
*------4 G
- . e
0
-0-eo-- B.9A-r- 0
-C..-M.;& .0- -.0.ir,0 '010-ill
gSr, O
A.41 _fw4
oDF s _ *~~~~,-WO~~~~~~~~~~~~~~~~~R
4
_0il4_ .
, * .'s w
-AMP t qCD
l k
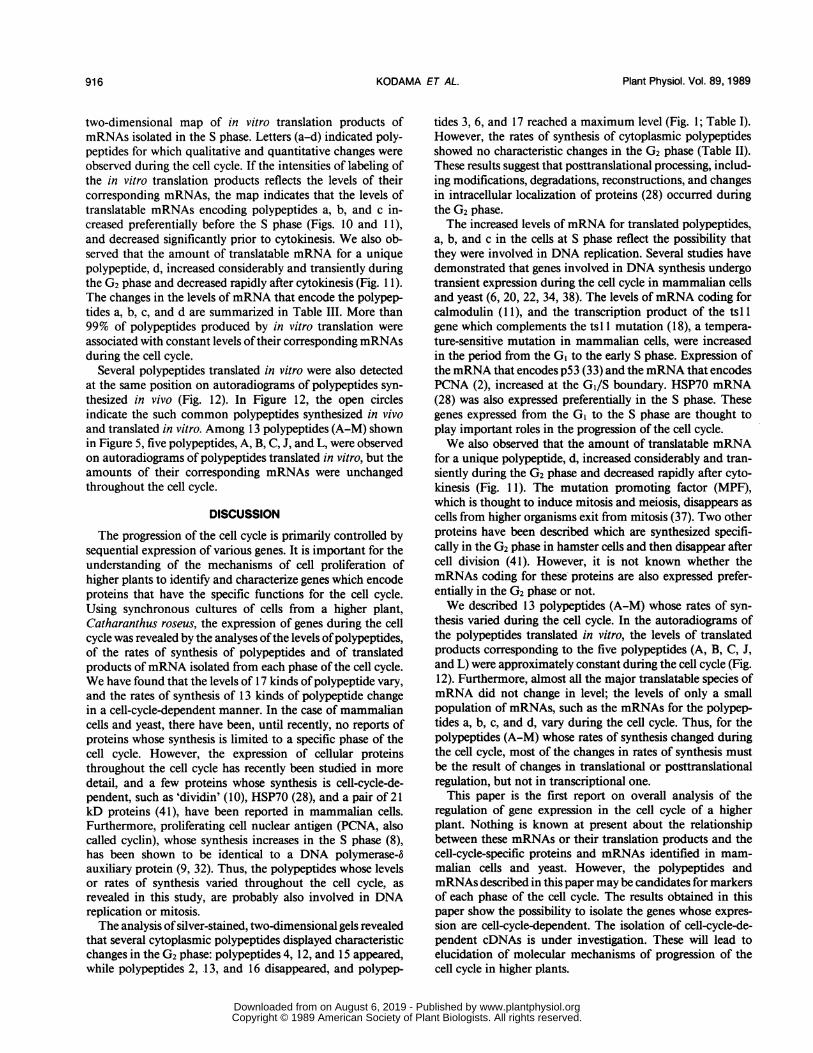
Figure 11. Autoradiograms of polypeptides translated from poly(A)+RNA isolated from cells at each phase of the cell cycle. Polypeptidesmarked with a circle (b-d) are those for which changes were observedduring the cell cycle.
II). From a comparison of these two kinds of electrophoreticpattern, the rate of turnover of each polypeptide can beinferred. It appears that individual cytoplasmic polypeptidesturn over at different rates (Fig. 7). As shown in Figure 7A,the open triangles indicate the polypeptides that were detectedin considerable amounts on the silver-stained gels but not on
the autoradiograms, and this difference suggests inactive turn-over of these polypeptides. In Figure 7B, the open squaresindicate the polypeptides that were detected in considerableamounts on autoradiograms but not on silver-stained gels,and this difference suggests that active turnover of thesepolypeptides. Polypeptides 1, 3, 4, 10, and 12, the levels of
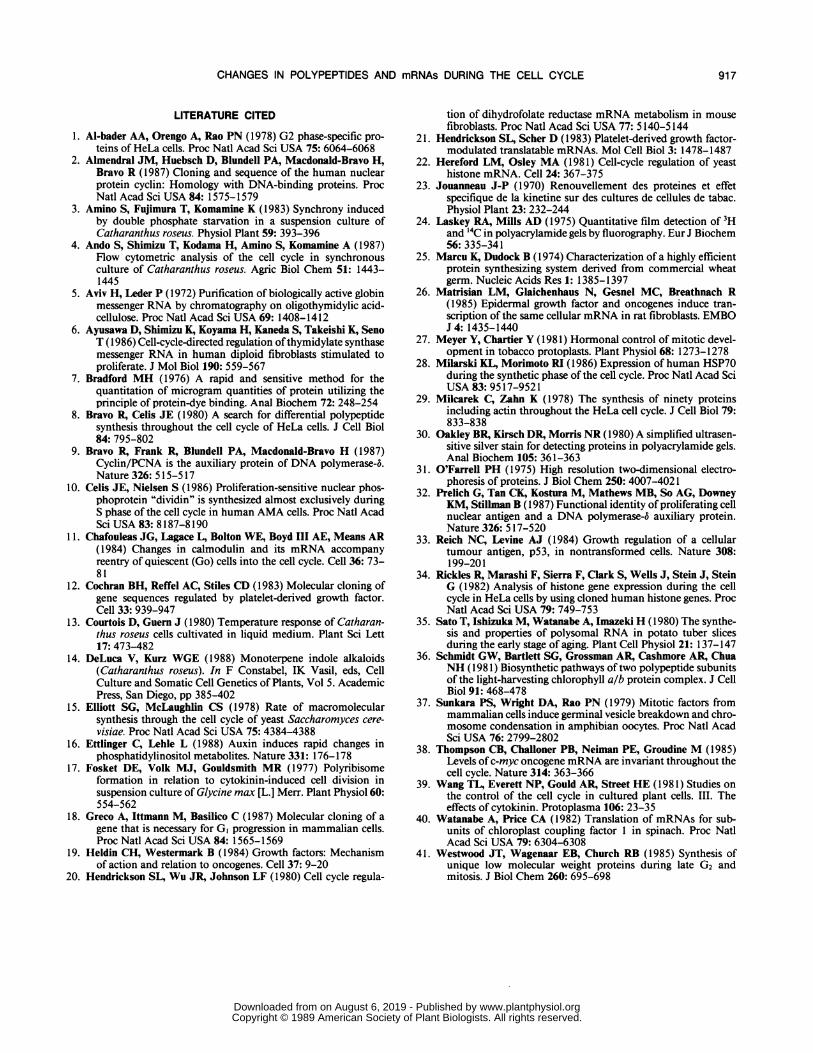
Figure 12. Comparison of the autoradiograms of polypeptides syn-thesized in vivo during the G2 phase with that of polypeptidestranslated in vitro from poly(A)+ RNA isolated from the S phase. Theopen circles indicate the common polypeptides detected in bothelectrophretic pattems.
which varied on the silver-stained gels, were also detected inthe same positions on autoradiograms, but the rates of syn-thesis of these polypeptides were unchanged throughout thecell cycle. It is probable that the turnover rates of thesepolypeptides was different in each phase of the cell cycle (datanot shown).
Variation in the in Vitro Translation Products of Poly(A)RNA
Changes in the rate of synthesis of polypeptides (A-M)could be due to either to variations in their amounts ofmRNAor to the regulation at the level of translation or posttransla-tional mechanisms. Thus, in vitro translation products frompoly(A)+ RNA isolated at various phases in the cell cycle wereresolved on two-dimensional gels (Fig. 8). Figure 9 shows a
S
915
www.plantphysiol.orgon August 6, 2019 - Published by Downloaded from Copyright © 1989 American Society of Plant Biologists. All rights reserved.
Plant Physiol. Vol. 89,1989
two-dimensional map of in vitro translation products ofmRNAs isolated in the S phase. Letters (a-d) indicated poly-peptides for which qualitative and quantitative changes wereobserved during the cell cycle. If the intensities of labeling ofthe in vitro translation products reflects the levels of theircorresponding mRNAs, the map indicates that the levels oftranslatable mRNAs encoding polypeptides a, b, and c in-creased preferentially before the S phase (Figs. 10 and 11),and decreased significantly prior to cytokinesis. We also ob-served that the amount of translatable mRNA for a uniquepolypeptide, d, increased considerably and transiently duringthe G2 phase and decreased rapidly after cytokinesis (Fig. 1 1).The changes in the levels ofmRNA that encode the polypep-tides a, b, c, and d are summarized in Table III. More than99% of polypeptides produced by in vitro translation wereassociated with constant levels oftheir corresponding mRNAsduring the cell cycle.
Several polypeptides translated in vitro were also detectedat the same position on autoradiograms of polypeptides syn-thesized in vivo (Fig. 12). In Figure 12, the open circlesindicate the such common polypeptides synthesized in vivoand translated in vitro. Among 13 polypeptides (A-M) shownin Figure 5, five polypeptides, A, B, C, J, and L, were observedon autoradiograms of polypeptides translated in vitro, but theamounts of their corresponding mRNAs were unchangedthroughout the cell cycle.
DISCUSSION
The progression of the cell cycle is primarily controlled bysequential expression of various genes. It is important for theunderstanding of the mechanisms of cell proliferation ofhigher plants to identify and characterize genes which encodeproteins that have the specific functions for the cell cycle.Using synchronous cultures of cells from a higher plant,Catharanthus roseus, the expression of genes during the cellcycle was revealed by the analyses ofthe levels ofpolypeptides,of the rates of synthesis of polypeptides and of translatedproducts ofmRNA isolated from each phase of the cell cycle.We have found that the levels of 17 kinds ofpolypeptide vary,and the rates of synthesis of 13 kinds of polypeptide changein a cell-cycle-dependent manner. In the case of mammaliancells and yeast, there have been, until recently, no reports ofproteins whose synthesis is limited to a specific phase of thecell cycle. However, the expression of cellular proteinsthroughout the cell cycle has recently been studied in moredetail, and a few proteins whose synthesis is cell-cycle-de-pendent, such as 'dividin' (10), HSP70 (28), and a pair of 21kD proteins (41), have been reported in mammalian cells.Furthermore, proliferating cell nuclear antigen (PCNA, alsocalled cyclin), whose synthesis increases in the S phase (8),has been shown to be identical to a DNA polymerase-6auxiliary protein (9, 32). Thus, the polypeptides whose levelsor rates of synthesis varied throughout the cell cycle, asrevealed in this study, are probably also involved in DNAreplication or mitosis.The analysis ofsilver-stained, two-dimensional gels revealed
that several cytoplasmic polypeptides displayed characteristicchanges in the G2 phase: polypeptides 4, 12, and 15 appeared,while polypeptides 2, 13, and 16 disappeared, and polypep-
tides 3, 6, and 17 reached a maximum level (Fig. 1; Table I).However, the rates of synthesis of cytoplasmic polypeptidesshowed no characteristic changes in the G2 phase (Table II).These results suggest that posttranslational processing, includ-ing modifications, degradations, reconstructions, and changesin intracellular localization of proteins (28) occurred duringthe G2 phase.The increased levels ofmRNA for translated polypeptides,
a, b, and c in the cells at S phase reflect the possibility thatthey were involved in DNA replication. Several studies havedemonstrated that genes involved in DNA synthesis undergotransient expression during the cell cycle in mammalian cellsand yeast (6, 20, 22, 34, 38). The levels ofmRNA coding forcalmodulin (11), and the transcription product of the tsl 1gene which complements the tsl 1 mutation (18), a tempera-ture-sensitive mutation in mammalian cells, were increasedin the period from the GI to the early S phase. Expression ofthe mRNA that encodes p53 (33) and the mRNA that encodesPCNA (2), increased at the G,/S boundary. HSP70 mRNA(28) was also expressed preferentially in the S phase. Thesegenes expressed from the G1 to the S phase are thought toplay important roles in the progression of the cell cycle.We also observed that the amount of translatable mRNA
for a unique polypeptide, d, increased considerably and tran-siently during the G2 phase and decreased rapidly after cyto-kinesis (Fig. 11). The mutation promoting factor (MPF),which is thought to induce mitosis and meiosis, disappears ascells from higher organisms exit from mitosis (37). Two otherproteins have been described which are synthesized specifi-cally in the G2 phase in hamster cells and then disappear aftercell division (41). However, it is not known whether themRNAs coding for these- proteins are also expressed prefer-entially in the G2 phase or not.We described 13 polypeptides (A-M) whose rates of syn-
thesis varied during the cell cycle. In the autoradiograms ofthe polypeptides translated in vitro, the levels of translatedproducts corresponding to the five polypeptides (A, B, C, J,and L) were approximately constant during the cell cycle (Fig.12). Furthermore, almost all the major translatable species ofmRNA did not change in level; the levels of only a smallpopulation of mRNAs, such as the mRNAs for the polypep-tides a, b, c, and d, vary during the cell cycle. Thus, for thepolypeptides (A-M) whose rates of synthesis changed duringthe cell cycle, most of the changes in rates of synthesis mustbe the result of changes in translational or posttranslationalregulation, but not in transcriptional one.
This paper is the first report on overall analysis of theregulation of gene expression in the cell cycle of a higherplant. Nothing is known at present about the relationshipbetween these mRNAs or their translation products and thecell-cycle-specific proteins and mRNAs identified in mam-malian cells and yeast. However, the polypeptides andmRNAs described in this paper may be candidates for markersof each phase of the cell cycle. The results obtained in thispaper show the possibility to isolate the genes whose expres-sion are cell-cycle-dependent. The isolation of cell-cycle-de-pendent cDNAs is under investigation. These will lead toelucidation of molecular mechanisms of progression of thecell cycle in higher plants.
KODAMA ET AL.916
www.plantphysiol.orgon August 6, 2019 - Published by Downloaded from Copyright © 1989 American Society of Plant Biologists. All rights reserved.
CHANGES IN POLYPEPTIDES AND mRNAs DURING THE CELL CYCLE
LITERATURE CITED
1. Al-bader AA, Orengo A, Rao PN (1978) G2 phase-specific pro-teins of HeLa cells. Proc Natl Acad Sci USA 75: 6064-6068
2. Almendral JM, Huebsch D, Blundell PA, Macdonald-Bravo H,Bravo R (1987) Cloning and sequence of the human nuclearprotein cyclin: Homology with DNA-binding proteins. ProcNatl Acad Sci USA 84: 1575-1579
3. Amino S, Fujimura T, Komamine K (1983) Synchrony inducedby double phosphate starvation in a suspension culture ofCatharanthus roseus. Physiol Plant 59: 393-396
4. Ando S, Shimizu T, Kodama H, Amino S, Komamine A (1987)Flow cytometric analysis of the cell cycle in synchronousculture of Catharanthus roseus. Agric Biol Chem 51: 1443-1445
5. Aviv H, Leder P (1972) Purification of biologically active globinmessenger RNA by chromatography on oligothymidylic acid-cellulose. Proc Natl Acad Sci USA 69: 1408-1412
6. Ayusawa D, Shimizu K, Koyama H, Kaneda S, Takeishi K, SenoT (1986) Cell-cycle-directed regulation ofthymidylate synthasemessenger RNA in human diploid fibroblasts stimulated toproliferate. J Mol Biol 190: 559-567
7. Bradford MH (1976) A rapid and sensitive method for thequantitation of microgram quantities of protein utilizing theprinciple of protein-dye binding. Anal Biochem 72: 248-254
8. Bravo R, Celis JE (1980) A search for differential polypeptidesynthesis throughout the cell cycle of HeLa cells. J Cell Biol84: 795-802
9. Bravo R, Frank R, Blundell PA, Macdonald-Bravo H (1987)Cyclin/PCNA is the auxiliary protein of DNA polymerase-6.Nature 326: 515-517
10. Celis JE, Nielsen S (1986) Proliferation-sensitive nuclear phos-phoprotein "dividin" is synthesized almost exclusively duringS phase of the cell cycle in human AMA cells. Proc Natl AcadSci USA 83: 8187-8190
11. Chafouleas JG, Lagace L, Bolton WE, Boyd III AE, Means AR(1984) Changes in calmodulin and its mRNA accompanyreentry of quiescent (Go) cells into the cell cycle. Cell 36: 73-81
12. Cochran BH, Reffel AC, Stiles CD (1983) Molecular cloning ofgene sequences regulated by platelet-derived growth factor.Cell 33: 939-947
13. Courtois D, Guern J (1980) Temperature response of Catharan-thus roseus cells cultivated in liquid medium. Plant Sci Lett17: 473-482
14. DeLuca V, Kurz WGE (1988) Monoterpene indole alkaloids(Catharanthus roseus). In F Constabel, IK Vasil, eds, CellCulture and Somatic Cell Genetics of Plants, Vol 5. AcademicPress, San Diego, pp 385-402
15. Elliott SG, McLaughlin CS (1978) Rate of macromolecularsynthesis through the cell cycle of yeast Saccharomyces cere-visiae. Proc Natl Acad Sci USA 75: 4384-4388
16. Ettlinger C, Lehle L (1988) Auxin induces rapid changes inphosphatidylinositol metabolites. Nature 331: 176-178
17. Fosket DE, Volk MJ, Gouldsmith MR (1977) Polyribisomeformation in relation to cytokinin-induced cell division insuspension culture of Glycine max [L.] Merr. Plant Physiol 60:554-562
18. Greco A, Ittmann M, Basilico C (1987) Molecular cloning of agene that is necessary for GI progression in mammalian cells.Proc Natl Acad Sci USA 84: 1565-1569
19. Heldin CH, Westermark B (1984) Growth factors: Mechanismof action and relation to oncogenes. Cell 37: 9-20
20. Hendrickson SL, Wu JR, Johnson LF (1980) Cell cycle regula-
tion of dihydrofolate reductase mRNA metabolism in mousefibroblasts. Proc Natl Acad Sci USA 77: 5140-5144
21. Hendrickson SL, Scher D (1983) Platelet-derived growth factor-modulated translatable mRNAs. Mol Cell Biol 3: 1478-1487
22. Hereford LM, Osley MA (1981) Cell-cycle regulation of yeasthistone mRNA. Cell 24: 367-375
23. Jouanneau J-P (1970) Renouvellement des proteines et effetspecifique de la kinetine sur des cultures de cellules de tabac.Physiol Plant 23: 232-244
24. Laskey RA, Mills AD (1975) Quantitative film detection of 3Hand 14C in polyacrylamide gels by fluorography. Eur J Biochem56: 335-341
25. Marcu K, Dudock B (1974) Characterization of a highly efficientprotein synthesizing system derived from commercial wheatgerm. Nucleic Acids Res 1: 1385-1397
26. Matrisian LM, Glaichenhaus N, Gesnel MC, Breathnach R(1985) Epidermal growth factor and oncogenes induce tran-scription of the same cellular mRNA in rat fibroblasts. EMBOJ 4: 1435-1440
27. Meyer Y, Chartier Y (1981) Hormonal control of mitotic devel-opment in tobacco protoplasts. Plant Physiol 68: 1273-1278
28. Milarski KL, Morimoto RI (1986) Expression of human HSP70during the synthetic phase of the cell cycle. Proc Natl Acad SciUSA 83: 9517-9521
29. Milcarek C, Zahn K (1978) The synthesis of ninety proteinsincluding actin throughout the HeLa cell cycle. J Cell Biol 79:833-838
30. Oakley BR, Kirsch DR, Morris NR (1980) A simplified ultrasen-sitive silver stain for detecting proteins in polyacrylamide gels.Anal Biochem 105: 361-363
31. O'Farrell PH (1975) High resolution two-dimensional electro-phoresis of proteins. J Biol Chem 250: 4007-4021
32. Prelich G, Tan CK, Kostura M, Mathews MB, So AG, DowneyKM, Stillman B (1987) Functional identity of proliferating cellnuclear antigen and a DNA polymerase-6 auxiliary protein.Nature 326: 517-520
33. Reich NC, Levine AJ (1984) Growth regulation of a cellulartumour antigen, p53, in nontransformed cells. Nature 308:199-201
34. Rickles R, Marashi F, Sierra F, Clark S, Wells J, Stein J, SteinG (1982) Analysis of histone gene expression during the cellcycle in HeLa cells by using cloned human histone genes. ProcNatl Acad Sci USA 79: 749-753
35. Sato T, Ishizuka M, Watanabe A, Imazeki H (1980) The synthe-sis and properties of polysomal RNA in potato tuber slicesduring the early stage of aging. Plant Cell Physiol 21: 137-147
36. Schmidt GW, Bartlett SG, Grossman AR, Cashmore AR, ChuaNH (1981) Biosynthetic pathways oftwo polypeptide subunitsof the light-harvesting chlorophyll a/b protein complex. J CellBiol 91: 468-478
37. Sunkara PS, Wright DA, Rao PN (1979) Mitotic factors frommammalian cells induce germinal vesicle breakdown and chro-mosome condensation in amphibian oocytes. Proc Natl AcadSci USA 76: 2799-2802
38. Thompson CB, Challoner PB, Neiman PE, Groudine M (1985)Levels ofc-myc oncogene mRNA are invariant throughout thecell cycle. Nature 314: 363-366
39. Wang TL, Everett NP, Gould AR, Street HE (1981) Studies onthe control of the cell cycle in cultured plant cells. III. Theeffects of cytokinin. Protoplasma 106: 23-35
40. Watanabe A, Price CA (1982) Translation of mRNAs for sub-units of chloroplast coupling factor 1 in spinach. Proc NatlAcad Sci USA 79: 6304-6308
41. Westwood JT, Wagenaar EB, Church RB (1985) Synthesis ofunique low molecular weight proteins during late G2 andmitosis. J Biol Chem 260: 695-698
917
www.plantphysiol.orgon August 6, 2019 - Published by Downloaded from Copyright © 1989 American Society of Plant Biologists. All rights reserved.