
NIRI IR Profession, Budget and Staffing Research Report · · 2016-11-30NIRI ANALYTICS | IR...
20
NIRI ANALYTICS NIRI IR Profession, Budget and Staffing Research Report
Transcript of NIRI IR Profession, Budget and Staffing Research Report · · 2016-11-30NIRI ANALYTICS | IR...
N I R I A N A L Y T I C S
NIRI IR Profession, Budget and Staf f ing Research Repor t
N I R I A N A LY T I C S | I R P R O F E S S I O N , B U D G E T A N D S TA F F I N G R E S E A R C H R E P O R T
2
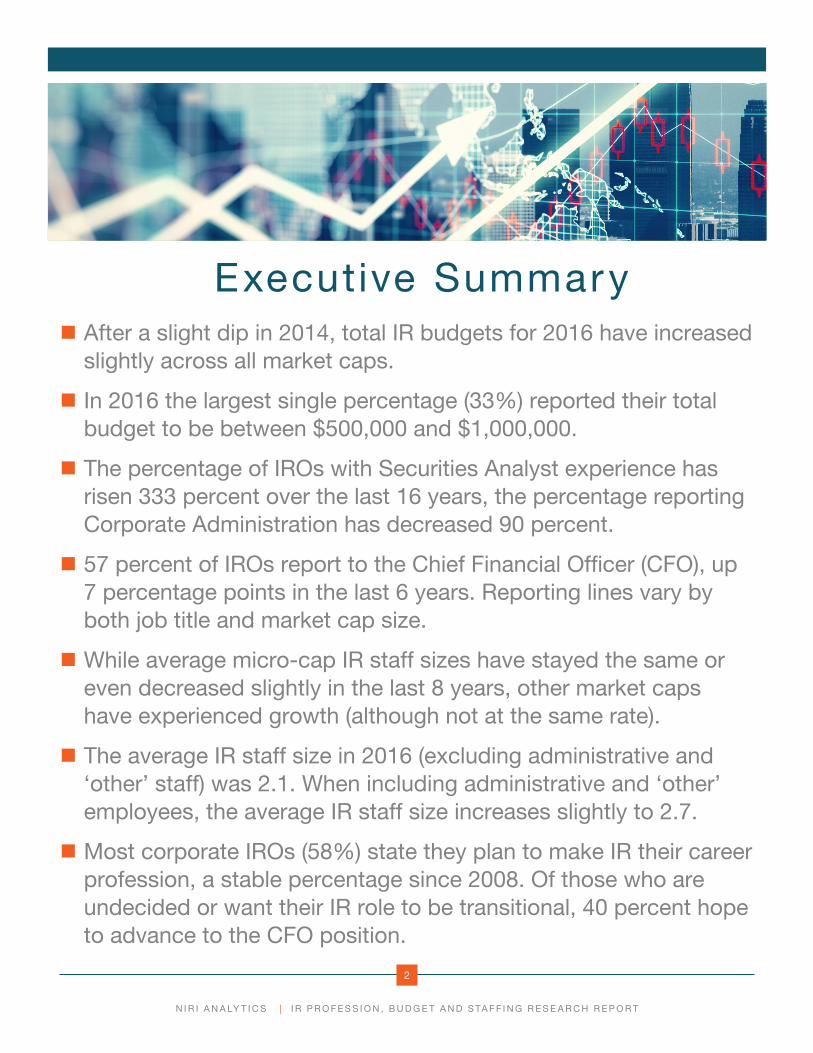
Executive Summary � After a slight dip in 2014, total IR budgets for 2016 have increased slightly across all market caps.
� In 2016 the largest single percentage (33%) reported their total budget to be between $500,000 and $1,000,000.
� The percentage of IROs with Securities Analyst experience has risen 333 percent over the last 16 years, the percentage reporting Corporate Administration has decreased 90 percent.
� 57 percent of IROs report to the Chief Financial Officer (CFO), up 7 percentage points in the last 6 years. Reporting lines vary by both job title and market cap size.
� While average micro-cap IR staff sizes have stayed the same or even decreased slightly in the last 8 years, other market caps have experienced growth (although not at the same rate).
� The average IR staff size in 2016 (excluding administrative and ‘other’ staff) was 2.1. When including administrative and ‘other’ employees, the average IR staff size increases slightly to 2.7.
� Most corporate IROs (58%) state they plan to make IR their career profession, a stable percentage since 2008. Of those who are undecided or want their IR role to be transitional, 40 percent hope to advance to the CFO position.

S E C T I O N 1
Respondent Demographics and
Survey Methodology
N I R I A N A LY T I C S | I R P R O F E S S I O N , B U D G E T A N D S TA F F I N G R E S E A R C H R E P O R T
4
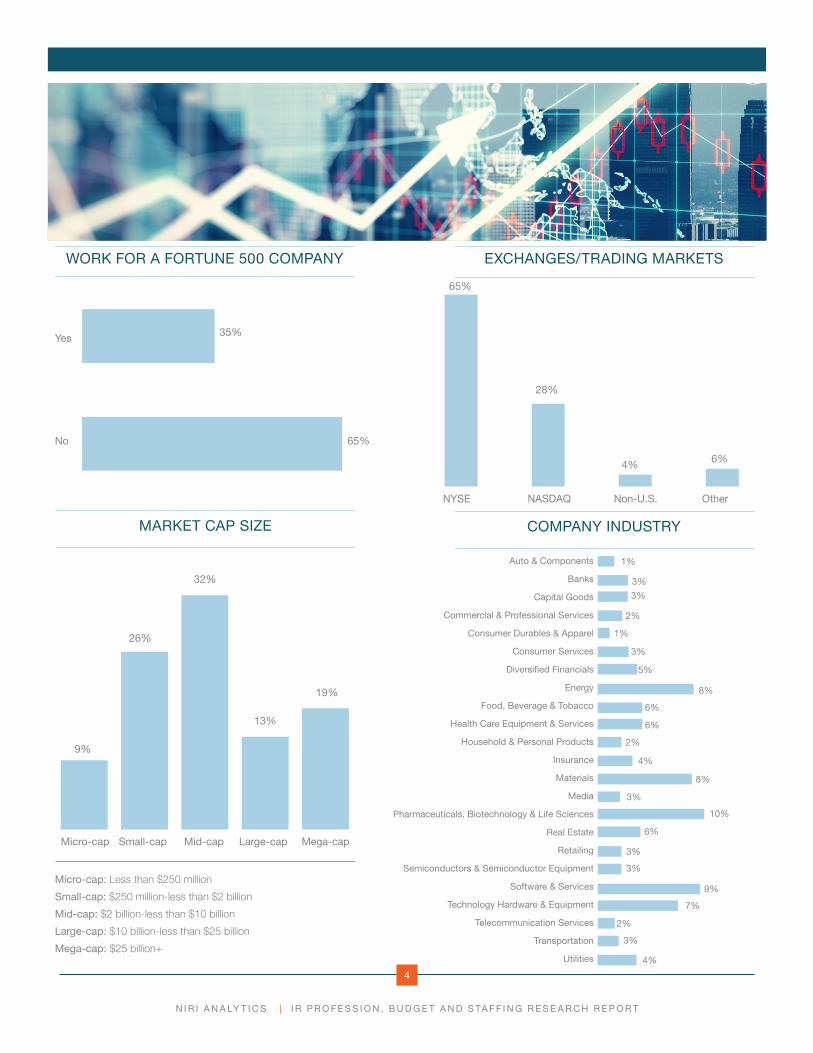
MARKET CAP SIZE COMPANY INDUSTRY
9%
26%
32%
13%
19%
Small-cap Mid-cap Large-cap Mega-cap
Micro-cap: Less than $250 million
Small-cap: $250 million-less than $2 billion
Mid-cap: $2 billion-less than $10 billion
Large-cap: $10 billion-less than $25 billion
Mega-cap: $25 billion+
1%
3%
3%
2%
5%
8%
6%
6%
2%
4%
8%
3%
10%
6%
3%
3%
9%
7%
2%
3%
4%
1%
3%
Auto & Components
Banks
Capital Goods
Commercial & Professional Services
Consumer Durables & Apparel
Consumer Services
Diversified Financials
Energy
Food, Beverage & Tobacco
Health Care Equipment & Services
Household & Personal Products
Insurance
Materials
Media
Pharmaceuticals, Biotechnology & Life Sciences
Real Estate
Retailing
Semiconductors & Semiconductor Equipment
Software & Services
Technology Hardware & Equipment
Telecommunication Services
Transportation
Utilities
Micro-cap
WORK FOR A FORTUNE 500 COMPANY EXCHANGES/TRADING MARKETS
35%
65%
Yes
No
NYSE NASDAQ Non-U.S. Other
28%
65%
4% 6%
N I R I A N A LY T I C S | I R P R O F E S S I O N , B U D G E T A N D S TA F F I N G R E S E A R C H R E P O R T
5
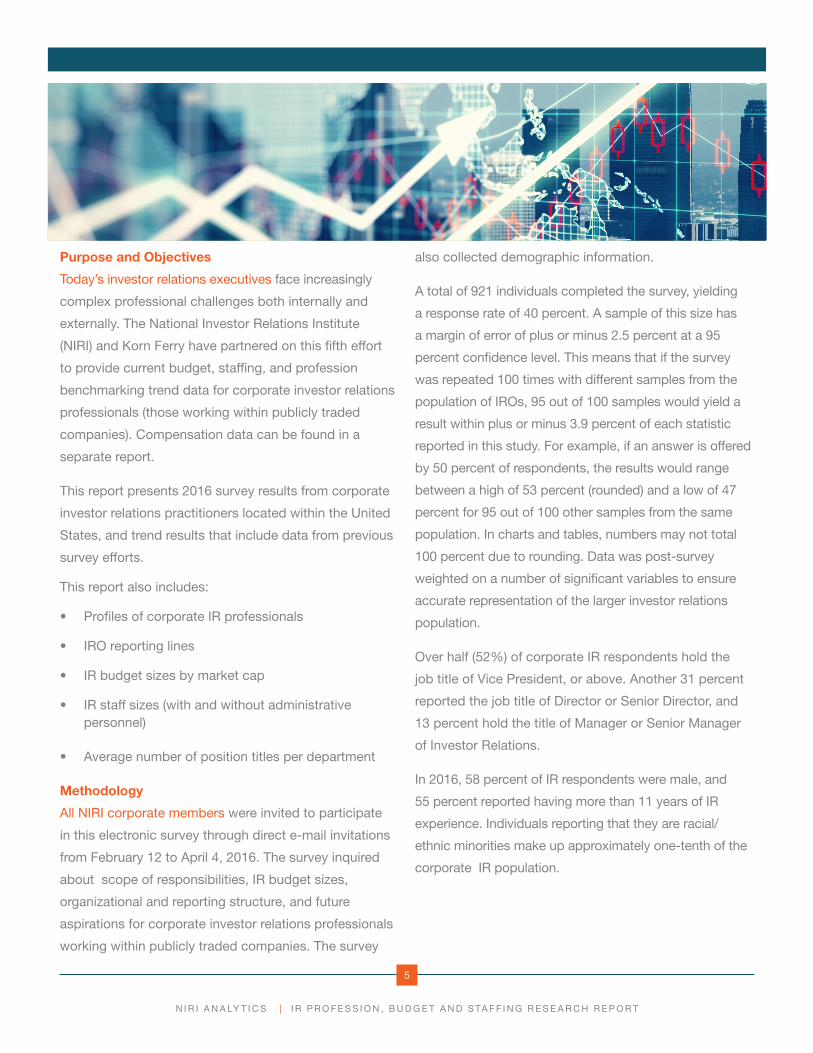
Purpose and Objectives
Today’s investor relations executives face increasingly
complex professional challenges both internally and
externally. The National Investor Relations Institute
(NIRI) and Korn Ferry have partnered on this fifth effort
to provide current budget, staffing, and profession
benchmarking trend data for corporate investor relations
professionals (those working within publicly traded
companies). Compensation data can be found in a
separate report.
This report presents 2016 survey results from corporate
investor relations practitioners located within the United
States, and trend results that include data from previous
survey efforts.
This report also includes:
• Profiles of corporate IR professionals
• IRO reporting lines
• IR budget sizes by market cap
• IR staff sizes (with and without administrative personnel)
• Average number of position titles per department
Methodology
All NIRI corporate members were invited to participate
in this electronic survey through direct e-mail invitations
from February 12 to April 4, 2016. The survey inquired
about scope of responsibilities, IR budget sizes,
organizational and reporting structure, and future
aspirations for corporate investor relations professionals
working within publicly traded companies. The survey
also collected demographic information.
A total of 921 individuals completed the survey, yielding
a response rate of 40 percent. A sample of this size has
a margin of error of plus or minus 2.5 percent at a 95
percent confidence level. This means that if the survey
was repeated 100 times with different samples from the
population of IROs, 95 out of 100 samples would yield a
result within plus or minus 3.9 percent of each statistic
reported in this study. For example, if an answer is offered
by 50 percent of respondents, the results would range
between a high of 53 percent (rounded) and a low of 47
percent for 95 out of 100 other samples from the same
population. In charts and tables, numbers may not total
100 percent due to rounding. Data was post-survey
weighted on a number of significant variables to ensure
accurate representation of the larger investor relations
population.
Over half (52%) of corporate IR respondents hold the
job title of Vice President, or above. Another 31 percent
reported the job title of Director or Senior Director, and
13 percent hold the title of Manager or Senior Manager
of Investor Relations.
In 2016, 58 percent of IR respondents were male, and
55 percent reported having more than 11 years of IR
experience. Individuals reporting that they are racial/
ethnic minorities make up approximately one-tenth of the
corporate IR population.
S E C T I O N 2
IR Profession
N I R I A N A LY T I C S | I R P R O F E S S I O N , B U D G E T A N D S TA F F I N G R E S E A R C H R E P O R T
7
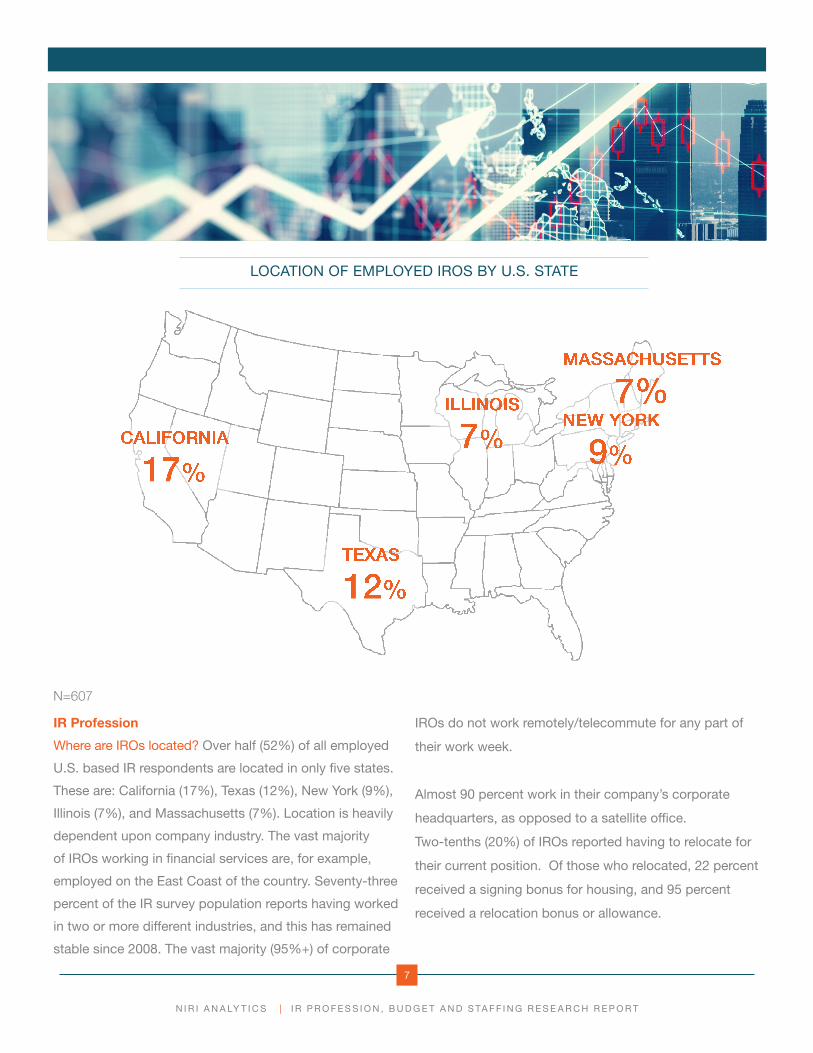
LOCATION OF EMPLOYED IROS BY U.S. STATE
IR Profession
Where are IROs located? Over half (52%) of all employed
U.S. based IR respondents are located in only five states.
These are: California (17%), Texas (12%), New York (9%),
Illinois (7%), and Massachusetts (7%). Location is heavily
dependent upon company industry. The vast majority
of IROs working in financial services are, for example,
employed on the East Coast of the country. Seventy-three
percent of the IR survey population reports having worked
in two or more different industries, and this has remained
stable since 2008. The vast majority (95%+) of corporate
IROs do not work remotely/telecommute for any part of
their work week.
Almost 90 percent work in their company’s corporate
headquarters, as opposed to a satellite office.
Two-tenths (20%) of IROs reported having to relocate for
their current position. Of those who relocated, 22 percent
received a signing bonus for housing, and 95 percent
received a relocation bonus or allowance.
N=607
N I R I A N A LY T I C S | I R P R O F E S S I O N , B U D G E T A N D S TA F F I N G R E S E A R C H R E P O R T
8
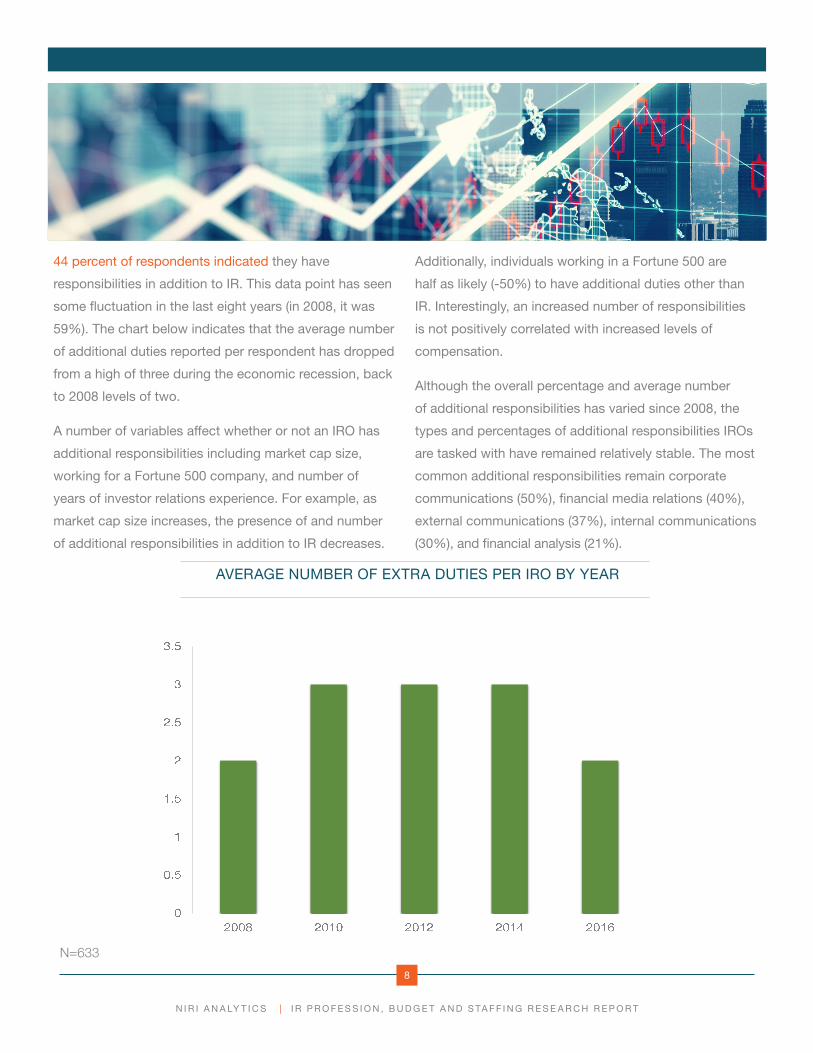
44 percent of respondents indicated they have
responsibilities in addition to IR. This data point has seen
some fluctuation in the last eight years (in 2008, it was
59%). The chart below indicates that the average number
of additional duties reported per respondent has dropped
from a high of three during the economic recession, back
to 2008 levels of two.
A number of variables affect whether or not an IRO has
additional responsibilities including market cap size,
working for a Fortune 500 company, and number of
years of investor relations experience. For example, as
market cap size increases, the presence of and number
of additional responsibilities in addition to IR decreases.
Additionally, individuals working in a Fortune 500 are
half as likely (-50%) to have additional duties other than
IR. Interestingly, an increased number of responsibilities
is not positively correlated with increased levels of
compensation.
Although the overall percentage and average number
of additional responsibilities has varied since 2008, the
types and percentages of additional responsibilities IROs
are tasked with have remained relatively stable. The most
common additional responsibilities remain corporate
communications (50%), financial media relations (40%),
external communications (37%), internal communications
(30%), and financial analysis (21%).
AVERAGE NUMBER OF EXTRA DUTIES PER IRO BY YEAR
N=633
N I R I A N A LY T I C S | I R P R O F E S S I O N , B U D G E T A N D S TA F F I N G R E S E A R C H R E P O R T
9
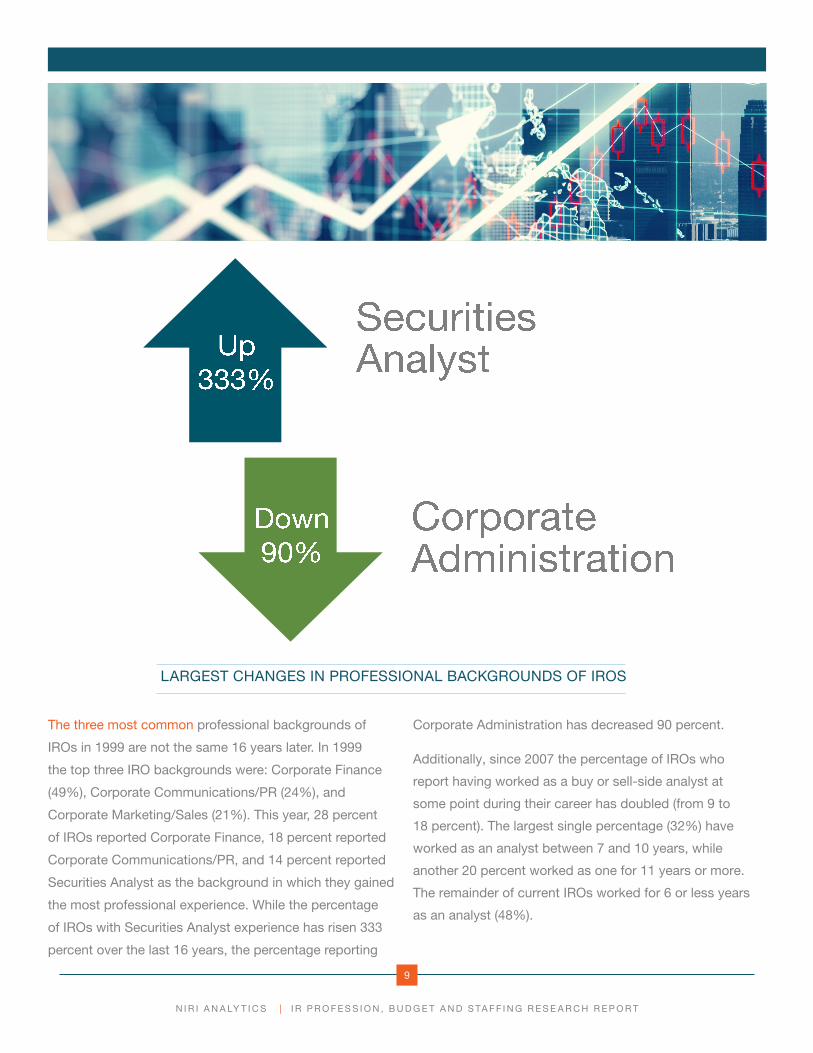
LARGEST CHANGES IN PROFESSIONAL BACKGROUNDS OF IROS
The three most common professional backgrounds of
IROs in 1999 are not the same 16 years later. In 1999
the top three IRO backgrounds were: Corporate Finance
(49%), Corporate Communications/PR (24%), and
Corporate Marketing/Sales (21%). This year, 28 percent
of IROs reported Corporate Finance, 18 percent reported
Corporate Communications/PR, and 14 percent reported
Securities Analyst as the background in which they gained
the most professional experience. While the percentage
of IROs with Securities Analyst experience has risen 333
percent over the last 16 years, the percentage reporting
Corporate Administration has decreased 90 percent.
Additionally, since 2007 the percentage of IROs who
report having worked as a buy or sell-side analyst at
some point during their career has doubled (from 9 to
18 percent). The largest single percentage (32%) have
worked as an analyst between 7 and 10 years, while
another 20 percent worked as one for 11 years or more.
The remainder of current IROs worked for 6 or less years
as an analyst (48%).
S E C T I O N 3
IR Budget and Staf f ing
N I R I A N A LY T I C S | I R P R O F E S S I O N , B U D G E T A N D S TA F F I N G R E S E A R C H R E P O R T
11
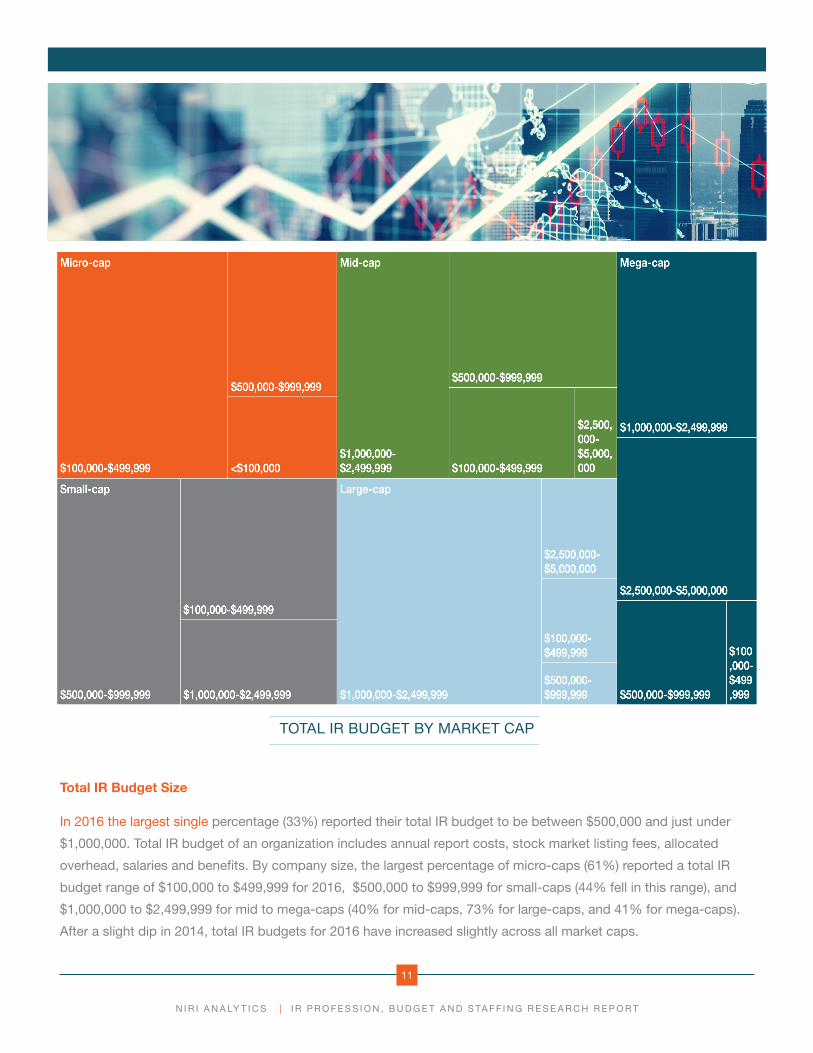
TOTAL IR BUDGET BY MARKET CAP
Total IR Budget Size
In 2016 the largest single percentage (33%) reported their total IR budget to be between $500,000 and just under
$1,000,000. Total IR budget of an organization includes annual report costs, stock market listing fees, allocated
overhead, salaries and benefits. By company size, the largest percentage of micro-caps (61%) reported a total IR
budget range of $100,000 to $499,999 for 2016, $500,000 to $999,999 for small-caps (44% fell in this range), and
$1,000,000 to $2,499,999 for mid to mega-caps (40% for mid-caps, 73% for large-caps, and 41% for mega-caps).
After a slight dip in 2014, total IR budgets for 2016 have increased slightly across all market caps.
N I R I A N A LY T I C S | I R P R O F E S S I O N , B U D G E T A N D S TA F F I N G R E S E A R C H R E P O R T
12
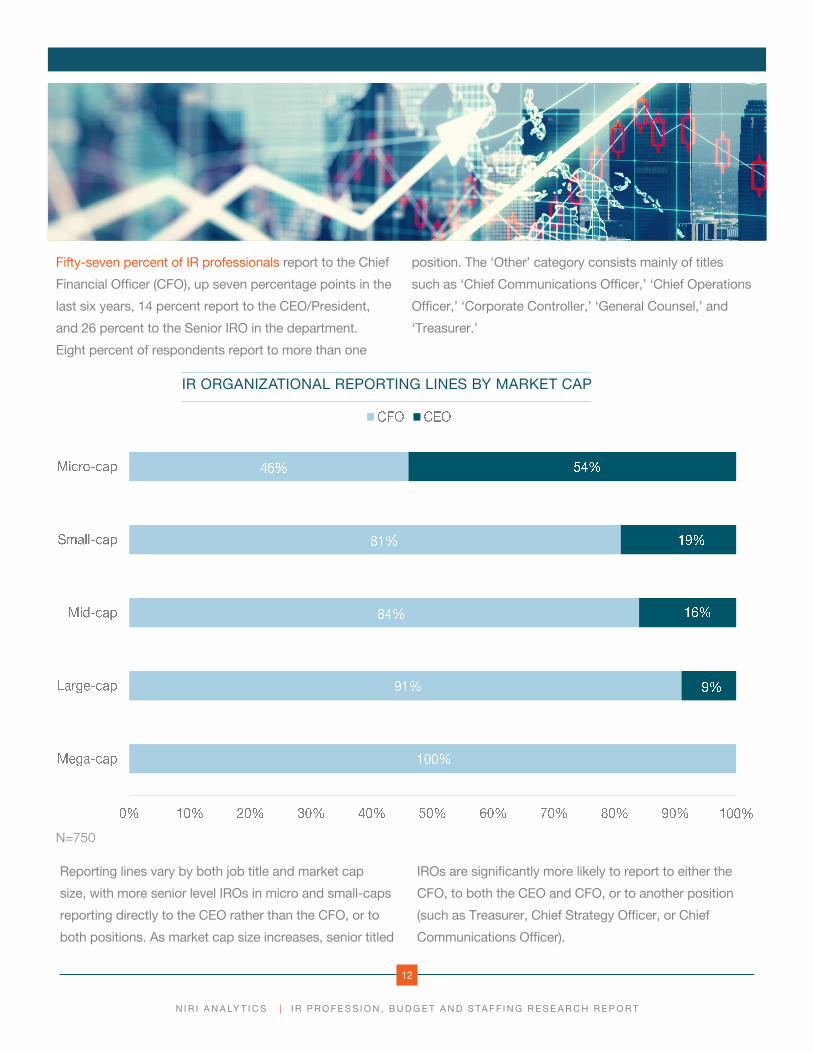
Fifty-seven percent of IR professionals report to the Chief
Financial Officer (CFO), up seven percentage points in the
last six years, 14 percent report to the CEO/President,
and 26 percent to the Senior IRO in the department.
Eight percent of respondents report to more than one
position. The ‘Other’ category consists mainly of titles
such as ‘Chief Communications Officer,’ ‘Chief Operations
Officer,’ ‘Corporate Controller,’ ‘General Counsel,’ and
‘Treasurer.’
IR ORGANIZATIONAL REPORTING LINES BY MARKET CAP
N=750
Reporting lines vary by both job title and market cap
size, with more senior level IROs in micro and small-caps
reporting directly to the CEO rather than the CFO, or to
both positions. As market cap size increases, senior titled
IROs are significantly more likely to report to either the
CFO, to both the CEO and CFO, or to another position
(such as Treasurer, Chief Strategy Officer, or Chief
Communications Officer).

N I R I A N A LY T I C S | I R P R O F E S S I O N , B U D G E T A N D S TA F F I N G R E S E A R C H R E P O R T
13
AVERAGE IR STAFF SIZE BY MARKET CAP AND YEAR
N=650
IR Staffing
In 2008 the average IR staff size was 1.15; in 2016, it is
2.11.
While average micro-cap IR staff sizes have stayed the
same or even decreased slightly, other market cap IR
departments have experienced growth (although not at
the same rate) over the last eight years. While small-cap
company IR departments have increased approximately
28 percent, mega-cap company IR staff sizes have
increased an astounding 160 percent during the same
period of time.

N I R I A N A LY T I C S | I R P R O F E S S I O N , B U D G E T A N D S TA F F I N G R E S E A R C H R E P O R T
14
AVERAGE IR STAFF SIZE AND PERCENT CHANGE BY INDUSTRY
N=600
Additionally, while all sectors have experienced IR staff
size growth in the last eight years, growth has not been
consistent across industries. Between 2008 and 2016
Consumer Staples, Utilities, Real Estate, Health Care and
Industrials all experienced staff size percent increases
of over 100 percent, while the IT and Telecomm sector
experienced a 14 and 6 percent increase, respectively.
N I R I A N A LY T I C S | I R P R O F E S S I O N , B U D G E T A N D S TA F F I N G R E S E A R C H R E P O R T
15
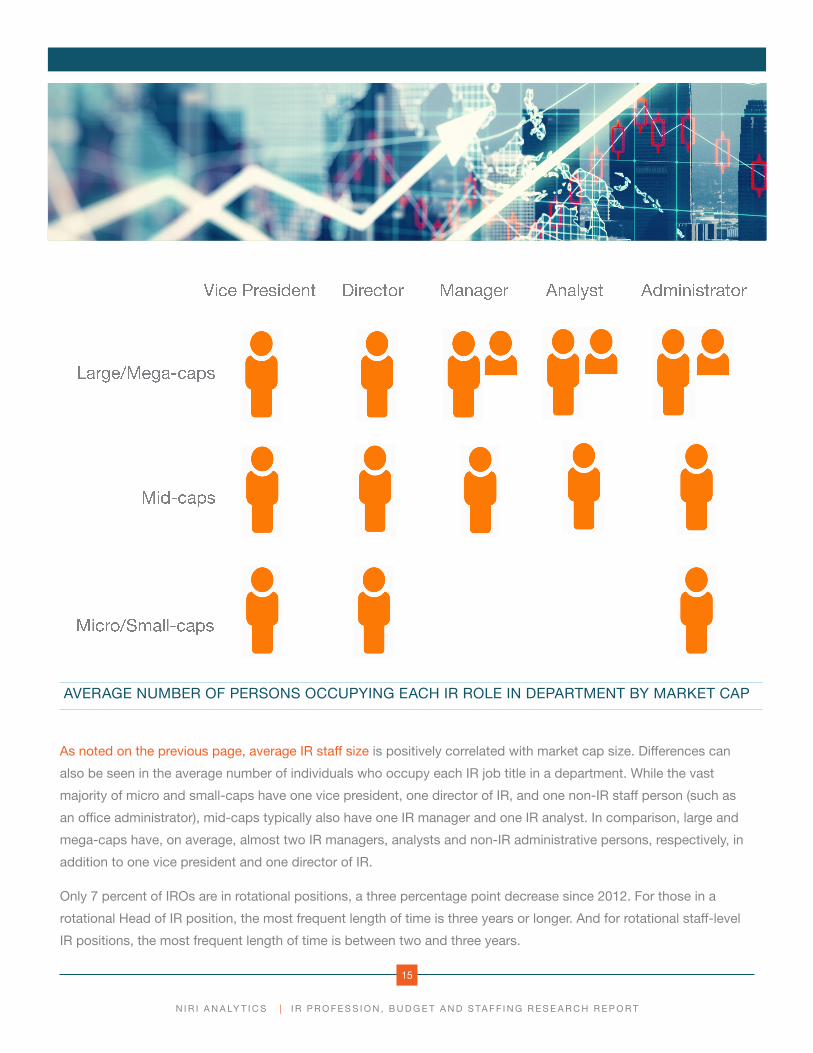
As noted on the previous page, average IR staff size is positively correlated with market cap size. Differences can
also be seen in the average number of individuals who occupy each IR job title in a department. While the vast
majority of micro and small-caps have one vice president, one director of IR, and one non-IR staff person (such as
an office administrator), mid-caps typically also have one IR manager and one IR analyst. In comparison, large and
mega-caps have, on average, almost two IR managers, analysts and non-IR administrative persons, respectively, in
addition to one vice president and one director of IR.
Only 7 percent of IROs are in rotational positions, a three percentage point decrease since 2012. For those in a
rotational Head of IR position, the most frequent length of time is three years or longer. And for rotational staff-level
IR positions, the most frequent length of time is between two and three years.
AVERAGE NUMBER OF PERSONS OCCUPYING EACH IR ROLE IN DEPARTMENT BY MARKET CAP
N I R I A N A LY T I C S | I R P R O F E S S I O N , B U D G E T A N D S TA F F I N G R E S E A R C H R E P O R T
16
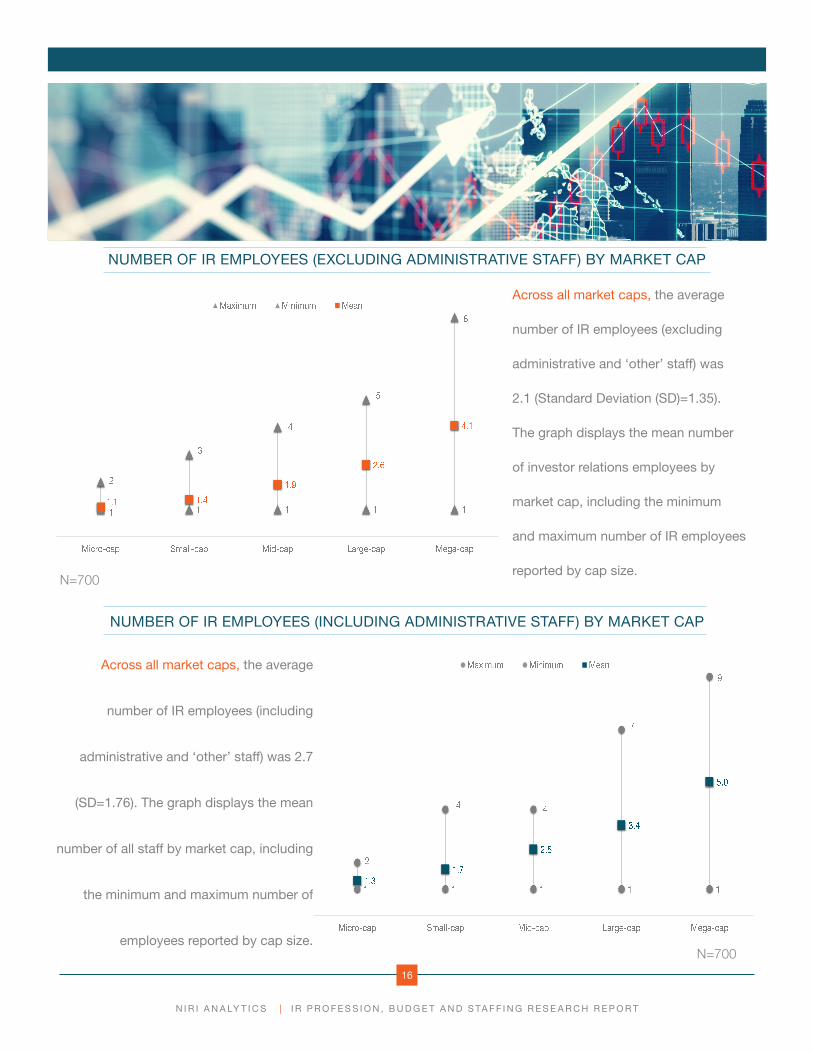
NUMBER OF IR EMPLOYEES (EXCLUDING ADMINISTRATIVE STAFF) BY MARKET CAP
Across all market caps, the average
number of IR employees (excluding
administrative and ‘other’ staff) was
2.1 (Standard Deviation (SD)=1.35).
The graph displays the mean number
of investor relations employees by
market cap, including the minimum
and maximum number of IR employees
reported by cap size.
NUMBER OF IR EMPLOYEES (INCLUDING ADMINISTRATIVE STAFF) BY MARKET CAP
Across all market caps, the average
number of IR employees (including
administrative and ‘other’ staff) was 2.7
(SD=1.76). The graph displays the mean
number of all staff by market cap, including
the minimum and maximum number of
employees reported by cap size.
N=700
N=700

S E C T I O N 4
Future Aspirations of IROs
N I R I A N A LY T I C S | I R P R O F E S S I O N , B U D G E T A N D S TA F F I N G R E S E A R C H R E P O R T
18
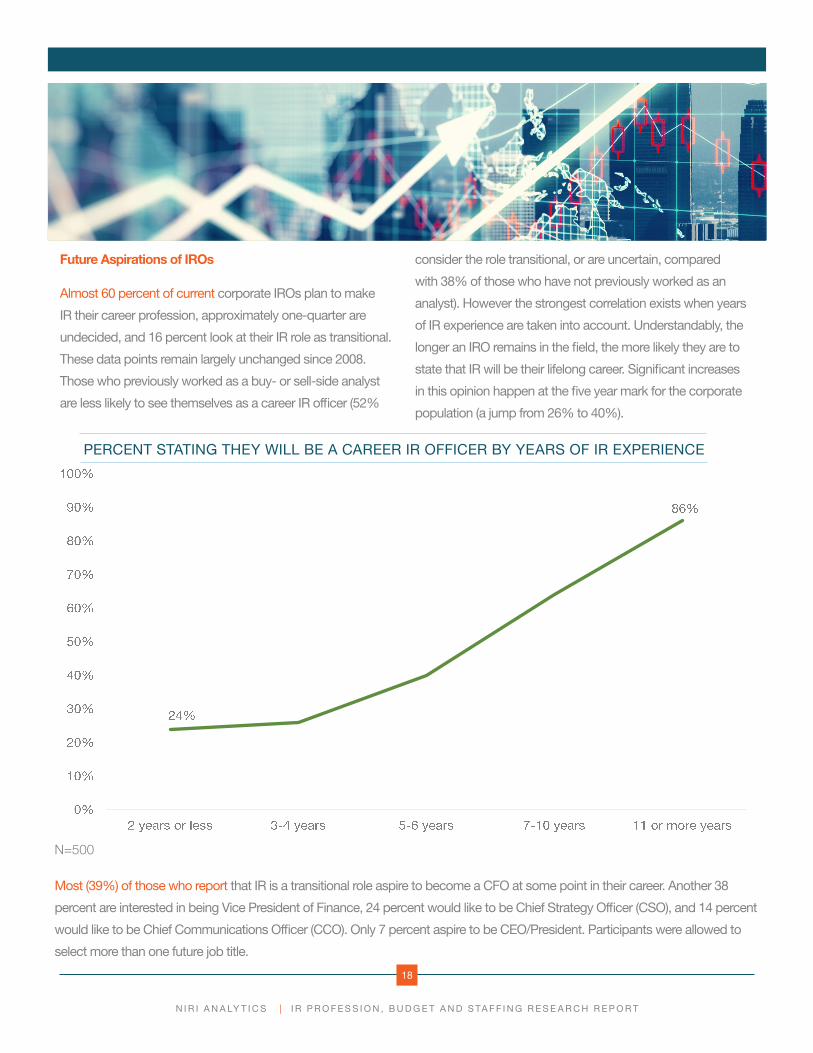
Future Aspirations of IROs
Almost 60 percent of current corporate IROs plan to make
IR their career profession, approximately one-quarter are
undecided, and 16 percent look at their IR role as transitional.
These data points remain largely unchanged since 2008.
Those who previously worked as a buy- or sell-side analyst
are less likely to see themselves as a career IR officer (52%
consider the role transitional, or are uncertain, compared
with 38% of those who have not previously worked as an
analyst). However the strongest correlation exists when years
of IR experience are taken into account. Understandably, the
longer an IRO remains in the field, the more likely they are to
state that IR will be their lifelong career. Significant increases
in this opinion happen at the five year mark for the corporate
population (a jump from 26% to 40%).
PERCENT STATING THEY WILL BE A CAREER IR OFFICER BY YEARS OF IR EXPERIENCE
N=500
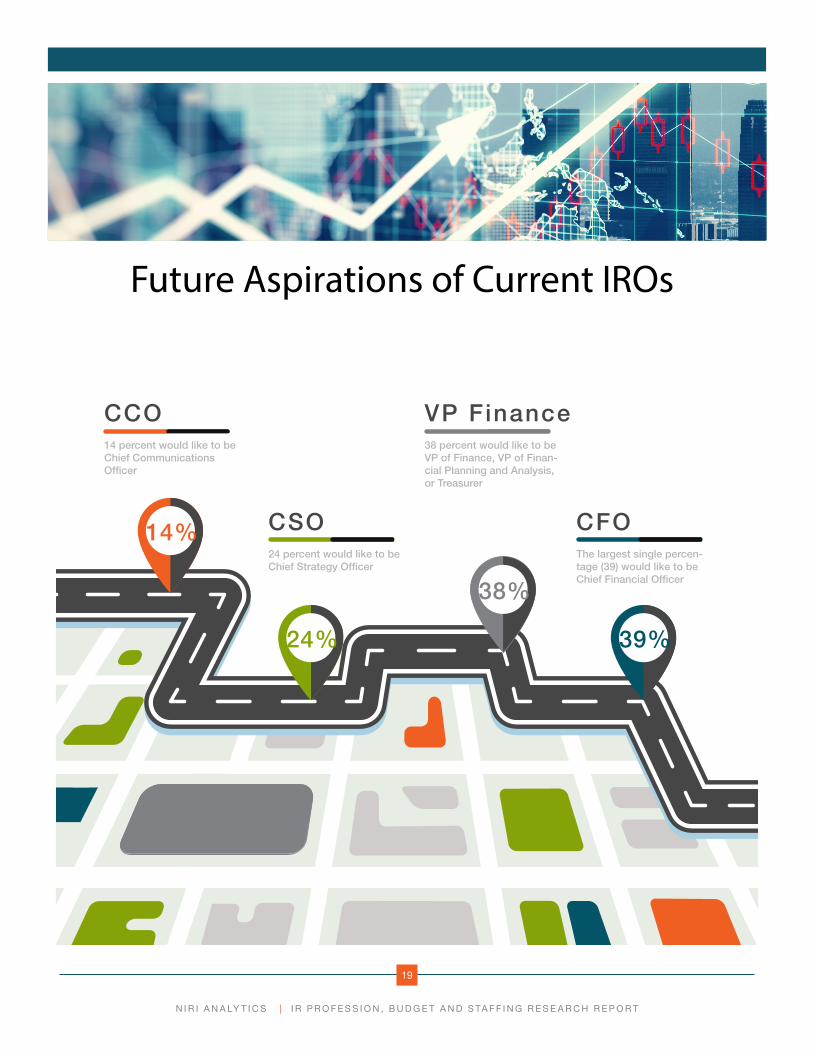
Most (39%) of those who report that IR is a transitional role aspire to become a CFO at some point in their career. Another 38
percent are interested in being Vice President of Finance, 24 percent would like to be Chief Strategy Officer (CSO), and 14 percent
would like to be Chief Communications Officer (CCO). Only 7 percent aspire to be CEO/President. Participants were allowed to
select more than one future job title.
N I R I A N A LY T I C S | I R P R O F E S S I O N , B U D G E T A N D S TA F F I N G R E S E A R C H R E P O R T
19
CFOThe largest single percen-tage (39) would like to be Chief Financial Officer
VP Finance38 percent would like to be VP of Finance, VP of Finan-cial Planning and Analysis, or Treasurer
CCO14 percent would like to be Chief Communications Officer
CSO24 percent would like to be Chief Strategy Officer
14%
24%
38%
39%
Future Aspirations of Current IROs

NIRI is dedicated to advancing the practice
of investor relations and the professional
competency and stature of its members.
All contents © 2016 National Investor Relations Institute. All rights are reserved and content may not be reproduced, downloaded, disseminated, or transferred, in any form or by any means, except with the written prior agreement of NIRI.
Connect with us:
National Investor Relations Institute
225 Reinekers Lane, Suite 560
Alexandria, VA 22314
703.562.7700
www.niri.org