Necessity Drives Value - نادي خبراء المال...
35
REGIONAL FOOD | KFC June 21, 2010 Please Read Last Page For Contact Details and Important Disclaimer Kuwait Food Company (Americana) Necessity Drives Value jam
Transcript of Necessity Drives Value - نادي خبراء المال...
REGIONAL FOOD | KFC
June 21, 2010
Please Read Last Page For Contact Details and Important Disclaimer
Kuwait Food Company (Americana)
Necessity Drives Value
jam
REGIONAL FOOD | KFC
June 21, 2010
2
INITI
ATIO
N O
F C
OVE
RAG
E
Please Read Last Page for Contact Details and Important Disclaimer
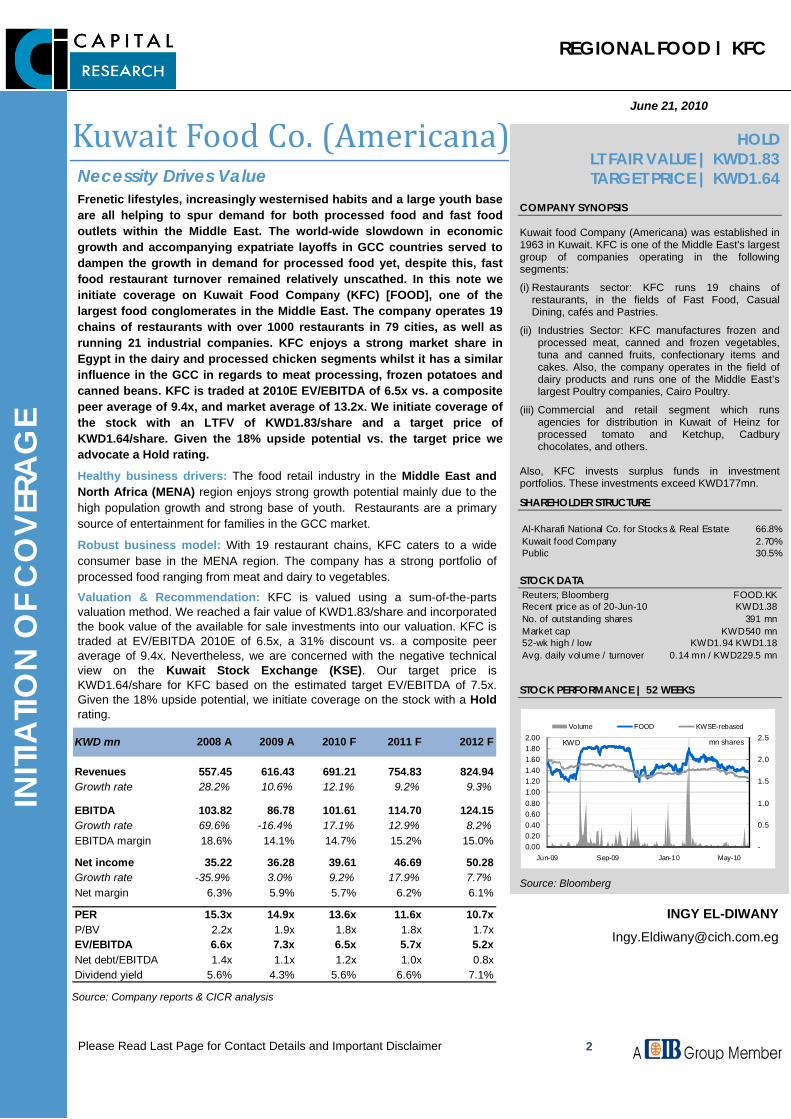
Kuwait Food Co. (Americana) Necessity Drives Value Frenetic lifestyles, increasingly westernised habits and a large youth base are all helping to spur demand for both processed food and fast food outlets within the Middle East. The world-wide slowdown in economic growth and accompanying expatriate layoffs in GCC countries served to dampen the growth in demand for processed food yet, despite this, fast food restaurant turnover remained relatively unscathed. In this note we initiate coverage on Kuwait Food Company (KFC) [FOOD], one of the largest food conglomerates in the Middle East. The company operates 19 chains of restaurants with over 1000 restaurants in 79 cities, as well as running 21 industrial companies. KFC enjoys a strong market share in Egypt in the dairy and processed chicken segments whilst it has a similar influence in the GCC in regards to meat processing, frozen potatoes and canned beans. KFC is traded at 2010E EV/EBITDA of 6.5x vs. a composite peer average of 9.4x, and market average of 13.2x. We initiate coverage of the stock with an LTFV of KWD1.83/share and a target price of KWD1.64/share. Given the 18% upside potential vs. the target price we advocate a Hold rating.
Healthy business drivers: The food retail industry in the Middle East and North Africa (MENA) region enjoys strong growth potential mainly due to the high population growth and strong base of youth. Restaurants are a primary source of entertainment for families in the GCC market.
Robust business model: With 19 restaurant chains, KFC caters to a wide consumer base in the MENA region. The company has a strong portfolio of processed food ranging from meat and dairy to vegetables.
Valuation & Recommendation: KFC is valued using a sum-of-the-parts valuation method. We reached a fair value of KWD1.83/share and incorporated the book value of the available for sale investments into our valuation. KFC is traded at EV/EBITDA 2010E of 6.5x, a 31% discount vs. a composite peer average of 9.4x. Nevertheless, we are concerned with the negative technical view on the Kuwait Stock Exchange (KSE). Our target price is KWD1.64/share for KFC based on the estimated target EV/EBITDA of 7.5x. Given the 18% upside potential, we initiate coverage on the stock with a Hold rating.
KWD mn 2008 A 2009 A 2010 F 2011 F 2012 F
Revenues 557.45 616.43 691.21 754.83 824.94Growth rate 28.2% 10.6% 12.1% 9.2% 9.3%
EBITDA 103.82 86.78 101.61 114.70 124.15Growth rate 69.6% -16.4% 17.1% 12.9% 8.2%EBITDA margin 18.6% 14.1% 14.7% 15.2% 15.0%
Net income 35.22 36.28 39.61 46.69 50.28Growth rate -35.9% 3.0% 9.2% 17.9% 7.7%Net margin 6.3% 5.9% 5.7% 6.2% 6.1%
PER 15.3x 14.9x 13.6x 11.6x 10.7xP/BV 2.2x 1.9x 1.8x 1.8x 1.7xEV/EBITDA 6.6x 7.3x 6.5x 5.7x 5.2xNet debt/EBITDA 1.4x 1.1x 1.2x 1.0x 0.8xDividend yield 5.6% 4.3% 5.6% 6.6% 7.1% Source: Company reports & CICR analysis
INGY EL-DIWANY
HOLD LT FAIR VALUE | KWD1.83 TARGET PRICE | KWD1.64
COMPANY SYNOPSIS Kuwait food Company (Americana) was established in 1963 in Kuwait. KFC is one of the Middle East's largest group of companies operating in the following segments:
(i) Restaurants sector: KFC runs 19 chains of restaurants, in the fields of Fast Food, Casual Dining, cafés and Pastries.
(ii) Industries Sector: KFC manufactures frozen and processed meat, canned and frozen vegetables, tuna and canned fruits, confectionary items and cakes. Also, the company operates in the field of dairy products and runs one of the Middle East’s largest Poultry companies, Cairo Poultry.
(iii) Commercial and retail segment which runs agencies for distribution in Kuwait of Heinz for processed tomato and Ketchup, Cadbury chocolates, and others.
Also, KFC invests surplus funds in investment portfolios. These investments exceed KWD177mn.
SHAREHOLDER STRUCTURE
Al-Kharafi National Co. for Stocks & Real Estate 66.8%Kuwait food Company 2.70%Public 30.5% STOCK DATA Reuters; Bloomberg FOOD.KK Recent price as of 20-Jun-10 KWD1.38No. of outstanding shares 391 mnMarket cap KWD540 mn52-wk high / low KWD1.94 KWD1.18Avg. daily volume / turnover 0.14 mn / KWD229.5 mn
STOCK PERFORMANCE | 52 WEEKS
-
0.5
1.0
1.5
2.0
2.5
0.000.200.400.600.801.001.201.401.601.802.00
Jun-09 Sep-09 Jan-10 May-10
mn sharesKWD
Volume FOOD KWSE-rebased
Source: Bloomberg
REGIONAL FOOD | KFC
June 21, 2010
3
INITI
ATIO
N O
F C
OVE
RAG
E
Please Read Last Page for Contact Details and Important Disclaimer
Table of Contents Executive Summary _______________________________________________________________ 4 I. Investment Case ________________________________________________________________ 5 II. Valuation ______________________________________________________________________ 7 III. Industry Overview _____________________________________________________________ 14
A. Global Food Business _________________________________________________________ 14
B. Food Industry in the MENA Region _______________________________________________ 15 1. Main Characteristics ______________________________________________________________ 15
2. Dynamics of the Food Industry ______________________________________________________ 16
3. Key Regional Food Markets _________________________________________________________ 18
4. Future Outlook ___________________________________________________________________ 21
IV. Company Profile ______________________________________________________________ 23 A. Company Synopsis ___________________________________________________________ 23
B. Business segments ___________________________________________________________ 24
C. Recent Developments _________________________________________________________ 27
V. Operational and Financial Analysis _______________________________________________ 28 A. Operational Analysis __________________________________________________________ 28
B. Financial Analysis ____________________________________________________________ 29
i. Dec 2005–Dec 2009 _________________________________________________________ 29
ii. Interim Financial Summary (1Q10 vs. 1Q09) ______________________________________ 31
VI. Projection Assumptions ________________________________________________________ 32

REGIONAL FOOD | KFC
June 21, 2010
4
INITI
ATIO
N O
F C
OVE
RAG
E
Please Read Last Page for Contact Details and Important Disclaimer
Executive Summary
A shift in consumption patterns towards ready-to-eat food and out-of-home consumption is driving growth in the food market. Global food sales, estimated to be in the vicinity of USD6.7tn in 2009, consist of the retail food (fresh and processed food) and the food service establishment (restaurants and hotels) segments.
Kuwait Food Company (KFC) [FOOD] is one of the largest food players in the MENA region. And it really is a regional entity, operating in the GCC, Egypt and Africa, as well as the Levant.
The food market in the MENA region is sizable, with Egypt accounting for 51% of food sales with a total food retail value of USD44.8bn in 2009. In Egypt, the food industrial market is relatively underpenetrated as the vast majority of population lies within the mid-to-low income segments that prefer traditional fresh food products. The food service market is concentrated, with a few fast food outlets dominating the market.
Saudi Arabia is one of the most attractive consumer markets in the region in light of its large population base, a large tranche of foreign labour and the increasing average income in recent years. On top of this, demand from pilgrims for convenience foods such as pre-packed and ready-to-eat meals makes a major contribution to food retail sales and fast food chains.
Kuwait too provides a healthy potential for the food industry, driven in large by (i) a high GDP/Capita, and (ii) a young expat population (86% of the foreign population is between 15 and 64 years old).
KFC is a consumer-driven company and operates three business segments: a restaurants segment (51% of total revenues in 2009), industries segment (46% of revenues in 2009) and a commercial and retail segment (3% of revenues in 2009).
Through its restaurants and industries segments, KFC caters to a raft of different consumption patterns across the MENA region. Indeed, KFC operated international franchises across 79 cities in the MENA region through 1,157 restaurants under 19 restaurant chains at the end of 2009. Through its industries segment, KFC offers packaged food and enjoys a strong position in the manufacturing of meat, dairy products, and canned and frozen vegetables in its markets. The company’s packaged food business targets middle and high-end income classes who prefer buying ready-to-eat foods. The commercial & retail sector handles the distribution of Heinz ketchup and California Garden for canned foods in Kuwait.
KFC adopts a backward integration strategy by sourcing some of its basic requirements for chicken for its meat plants and restaurants from its subsidiary, Cairo Poultry Company [POUL]. Furthermore, KFC cultivates a number of crops used for production at its factories, including potatoes and vegetables for its subsidiaries Farm Frites and Egyptian Canning Company.
Though the prospects for KFC are promising, we believe rising food prices will remain the company’s main concern with prices expected to increase in light of the anticipated rebound in the global economy. To negotiate this, KFC is seeking to minimize its costs by diversifying purchase sources and rationalize its expenses along the value chain.
KFC is valued using a sum-of-the-parts valuation method. We reached a fair value of KWD1.83/share, providing a 33% upside potential over the recent market price. We incorporated the book value of the available for sale investments into our valuation. Despite the solid performance for the company being traded at EV/EBITDA 2010E of 6.5x, a 31% discount vs. peer composite average of 9.4x, we are mostly concerned with the negative technical view of the Kuwait Stock Exchange (KSE). Our target price for KFC is KWD1.64/share and, given the 18% upside potential, we assign the stock a Hold rating.
Global food sales estimated at USD6.7tn in 2009
Egypt accounted for 51% of the sizeable food market in the MENA region
Saudi Arabia is an attractive consumer market
Healthy potential in the Kuwaiti market
KFC operates in the food service and the food retail sectors
Part of KFC’s needs are supplied within the group
Rising food prices remain the company’s main concern
LTFV is KWD1.83/share Target price is KWD1.64/share; Recommendation: Hold
REGIONAL FOOD | KFC
June 21, 2010
5
INITI
ATIO
N O
F C
OVE
RAG
E
Please Read Last Page for Contact Details and Important Disclaimer
I. Investment Case
Positives
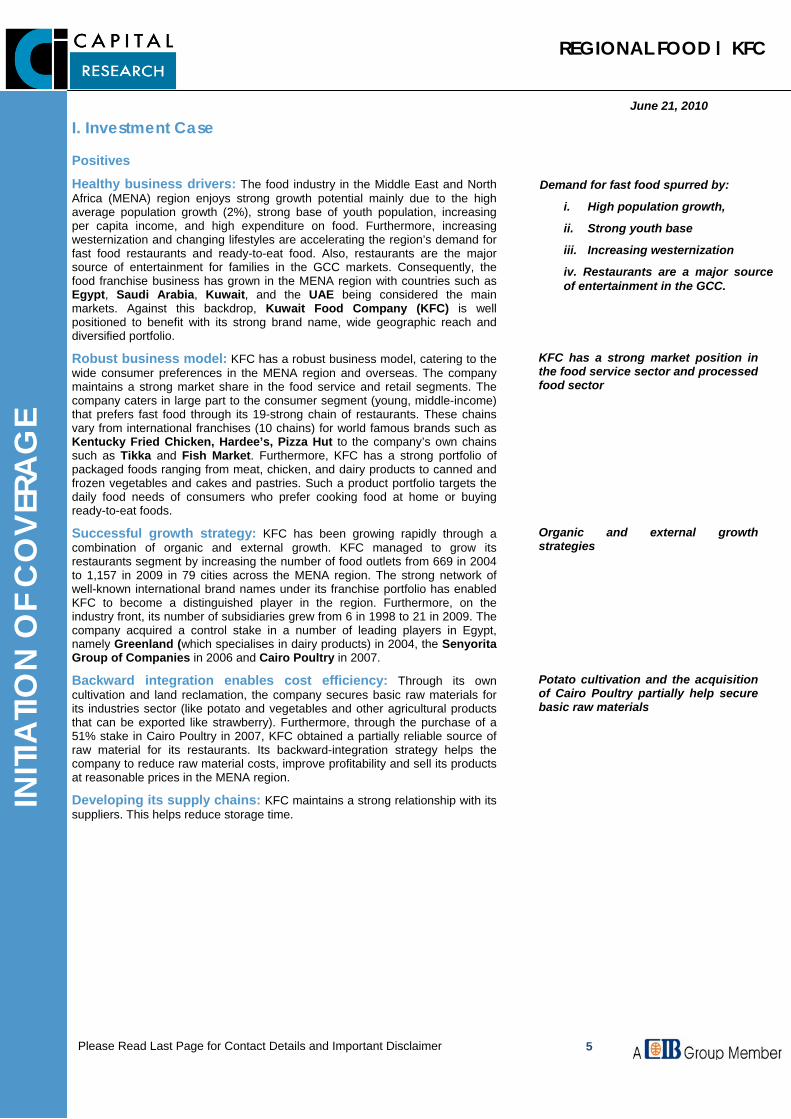
Healthy business drivers: The food industry in the Middle East and North Africa (MENA) region enjoys strong growth potential mainly due to the high average population growth (2%), strong base of youth population, increasing per capita income, and high expenditure on food. Furthermore, increasing westernization and changing lifestyles are accelerating the region’s demand for fast food restaurants and ready-to-eat food. Also, restaurants are the major source of entertainment for families in the GCC markets. Consequently, the food franchise business has grown in the MENA region with countries such as Egypt, Saudi Arabia, Kuwait, and the UAE being considered the main markets. Against this backdrop, Kuwait Food Company (KFC) is well positioned to benefit with its strong brand name, wide geographic reach and diversified portfolio.
Robust business model: KFC has a robust business model, catering to the wide consumer preferences in the MENA region and overseas. The company maintains a strong market share in the food service and retail segments. The company caters in large part to the consumer segment (young, middle-income) that prefers fast food through its 19-strong chain of restaurants. These chains vary from international franchises (10 chains) for world famous brands such as Kentucky Fried Chicken, Hardee’s, Pizza Hut to the company’s own chains such as Tikka and Fish Market. Furthermore, KFC has a strong portfolio of packaged foods ranging from meat, chicken, and dairy products to canned and frozen vegetables and cakes and pastries. Such a product portfolio targets the daily food needs of consumers who prefer cooking food at home or buying ready-to-eat foods.
Successful growth strategy: KFC has been growing rapidly through a combination of organic and external growth. KFC managed to grow its restaurants segment by increasing the number of food outlets from 669 in 2004 to 1,157 in 2009 in 79 cities across the MENA region. The strong network of well-known international brand names under its franchise portfolio has enabled KFC to become a distinguished player in the region. Furthermore, on the industry front, its number of subsidiaries grew from 6 in 1998 to 21 in 2009. The company acquired a control stake in a number of leading players in Egypt, namely Greenland (which specialises in dairy products) in 2004, the Senyorita Group of Companies in 2006 and Cairo Poultry in 2007.
Backward integration enables cost efficiency: Through its own cultivation and land reclamation, the company secures basic raw materials for its industries sector (like potato and vegetables and other agricultural products that can be exported like strawberry). Furthermore, through the purchase of a 51% stake in Cairo Poultry in 2007, KFC obtained a partially reliable source of raw material for its restaurants. Its backward-integration strategy helps the company to reduce raw material costs, improve profitability and sell its products at reasonable prices in the MENA region.
Developing its supply chains: KFC maintains a strong relationship with its suppliers. This helps reduce storage time.
Demand for fast food spurred by:
i. High population growth,
ii. Strong youth base
iii. Increasing westernization
iv. Restaurants are a major sourceof entertainment in the GCC.
KFC has a strong market position in the food service sector and processed food sector
Organic and external growth strategies
Potato cultivation and the acquisition of Cairo Poultry partially help secure basic raw materials
REGIONAL FOOD | KFC
June 21, 2010
6
INITI
ATIO
N O
F C
OVE
RAG
E
Please Read Last Page for Contact Details and Important Disclaimer
Negatives
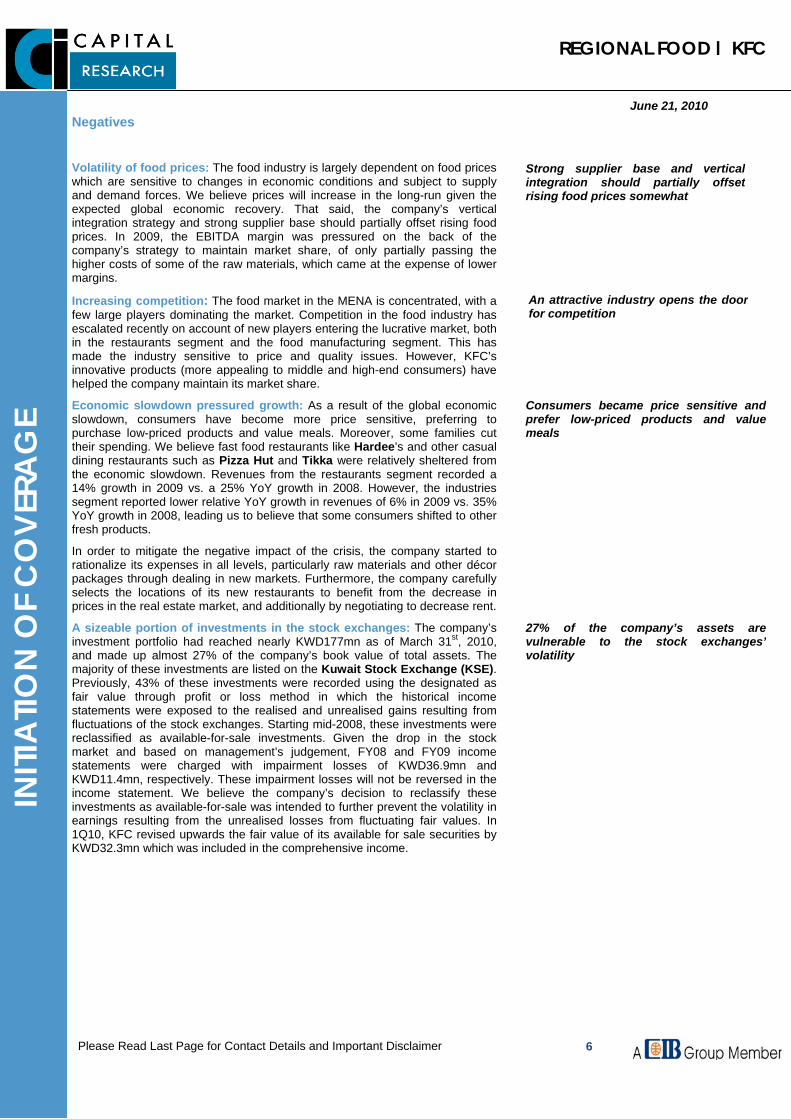
Volatility of food prices: The food industry is largely dependent on food prices which are sensitive to changes in economic conditions and subject to supply and demand forces. We believe prices will increase in the long-run given the expected global economic recovery. That said, the company’s vertical integration strategy and strong supplier base should partially offset rising food prices. In 2009, the EBITDA margin was pressured on the back of the company’s strategy to maintain market share, of only partially passing the higher costs of some of the raw materials, which came at the expense of lower margins.
Increasing competition: The food market in the MENA is concentrated, with a few large players dominating the market. Competition in the food industry has escalated recently on account of new players entering the lucrative market, both in the restaurants segment and the food manufacturing segment. This has made the industry sensitive to price and quality issues. However, KFC’s innovative products (more appealing to middle and high-end consumers) have helped the company maintain its market share.
Economic slowdown pressured growth: As a result of the global economic slowdown, consumers have become more price sensitive, preferring to purchase low-priced products and value meals. Moreover, some families cut their spending. We believe fast food restaurants like Hardee’s and other casual dining restaurants such as Pizza Hut and Tikka were relatively sheltered from the economic slowdown. Revenues from the restaurants segment recorded a 14% growth in 2009 vs. a 25% YoY growth in 2008. However, the industries segment reported lower relative YoY growth in revenues of 6% in 2009 vs. 35% YoY growth in 2008, leading us to believe that some consumers shifted to other fresh products.
In order to mitigate the negative impact of the crisis, the company started to rationalize its expenses in all levels, particularly raw materials and other décor packages through dealing in new markets. Furthermore, the company carefully selects the locations of its new restaurants to benefit from the decrease in prices in the real estate market, and additionally by negotiating to decrease rent.
A sizeable portion of investments in the stock exchanges: The company’s investment portfolio had reached nearly KWD177mn as of March 31st, 2010, and made up almost 27% of the company’s book value of total assets. The majority of these investments are listed on the Kuwait Stock Exchange (KSE). Previously, 43% of these investments were recorded using the designated as fair value through profit or loss method in which the historical income statements were exposed to the realised and unrealised gains resulting from fluctuations of the stock exchanges. Starting mid-2008, these investments were reclassified as available-for-sale investments. Given the drop in the stock market and based on management’s judgement, FY08 and FY09 income statements were charged with impairment losses of KWD36.9mn and KWD11.4mn, respectively. These impairment losses will not be reversed in the income statement. We believe the company’s decision to reclassify these investments as available-for-sale was intended to further prevent the volatility in earnings resulting from the unrealised losses from fluctuating fair values. In 1Q10, KFC revised upwards the fair value of its available for sale securities by KWD32.3mn which was included in the comprehensive income.
Strong supplier base and verticalintegration should partially offsetrising food prices somewhat
An attractive industry opens the door for competition
Consumers became price sensitive and prefer low-priced products and valuemeals
27% of the company’s assets are vulnerable to the stock exchanges’volatility
REGIONAL FOOD | KFC
June 21, 2010
7
INITI
ATIO
N O
F C
OVE
RAG
E
Please Read Last Page for Contact Details and Important Disclaimer
II. Valuation
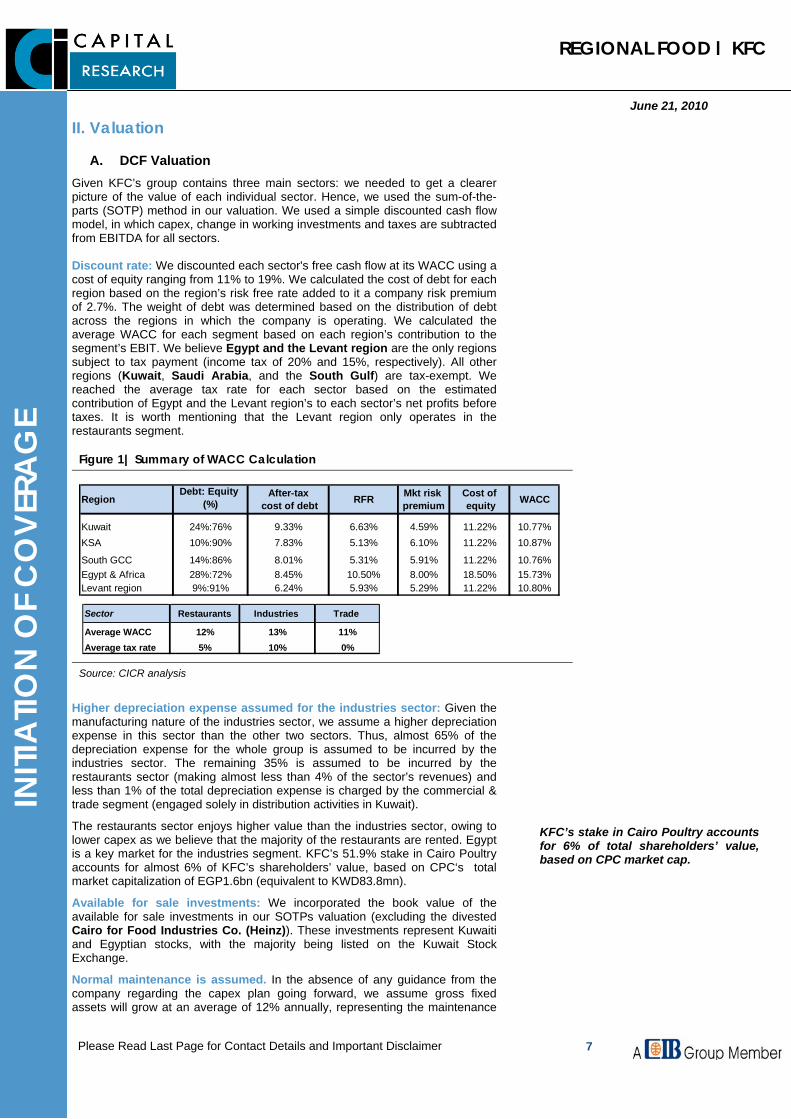
A. DCF Valuation Given KFC’s group contains three main sectors: we needed to get a clearer picture of the value of each individual sector. Hence, we used the sum-of-the-parts (SOTP) method in our valuation. We used a simple discounted cash flow model, in which capex, change in working investments and taxes are subtracted from EBITDA for all sectors. Discount rate: We discounted each sector's free cash flow at its WACC using a cost of equity ranging from 11% to 19%. We calculated the cost of debt for each region based on the region’s risk free rate added to it a company risk premium of 2.7%. The weight of debt was determined based on the distribution of debt across the regions in which the company is operating. We calculated the average WACC for each segment based on each region’s contribution to the segment’s EBIT. We believe Egypt and the Levant region are the only regions subject to tax payment (income tax of 20% and 15%, respectively). All other regions (Kuwait, Saudi Arabia, and the South Gulf) are tax-exempt. We reached the average tax rate for each sector based on the estimated contribution of Egypt and the Levant region’s to each sector’s net profits before taxes. It is worth mentioning that the Levant region only operates in the restaurants segment.
Figure 1| Summary of WACC Calculation
RegionDebt: Equity
(%)After-tax
cost of debt RFR Mkt risk premium
Cost of equity WACC
Kuwait 24%:76% 9.33% 6.63% 4.59% 11.22% 10.77%KSA 10%:90% 7.83% 5.13% 6.10% 11.22% 10.87%
South GCC 14%:86% 8.01% 5.31% 5.91% 11.22% 10.76%Egypt & Africa 28%:72% 8.45% 10.50% 8.00% 18.50% 15.73%Levant region 9%:91% 6.24% 5.93% 5.29% 11.22% 10.80%
Sector Restaurants Industries Trade
Average WACC 12% 13% 11%Average tax rate 5% 10% 0%
Source: CICR analysis
Higher depreciation expense assumed for the industries sector: Given the manufacturing nature of the industries sector, we assume a higher depreciation expense in this sector than the other two sectors. Thus, almost 65% of the depreciation expense for the whole group is assumed to be incurred by the industries sector. The remaining 35% is assumed to be incurred by the restaurants sector (making almost less than 4% of the sector’s revenues) and less than 1% of the total depreciation expense is charged by the commercial & trade segment (engaged solely in distribution activities in Kuwait). The restaurants sector enjoys higher value than the industries sector, owing to lower capex as we believe that the majority of the restaurants are rented. Egypt is a key market for the industries segment. KFC’s 51.9% stake in Cairo Poultry accounts for almost 6% of KFC’s shareholders’ value, based on CPC‘s total market capitalization of EGP1.6bn (equivalent to KWD83.8mn).
Available for sale investments: We incorporated the book value of the available for sale investments in our SOTPs valuation (excluding the divested Cairo for Food Industries Co. (Heinz)). These investments represent Kuwaiti and Egyptian stocks, with the majority being listed on the Kuwait Stock Exchange.
Normal maintenance is assumed. In the absence of any guidance from the company regarding the capex plan going forward, we assume gross fixed assets will grow at an average of 12% annually, representing the maintenance
KFC’s stake in Cairo Poultry accountsfor 6% of total shareholders’ value,based on CPC market cap.

REGIONAL FOOD | KFC
June 21, 2010
8
INITI
ATIO
N O
F C
OVE
RAG
E
Please Read Last Page for Contact Details and Important Disclaimer
rate. We assume a greater portion of capex will be allocated to the industries sector and a minor portion allocated to the restaurants sector.
Net debt by sector: The absence of standalone financials for each sector led us to assume each sector's outstanding cash and short-term debt level as per its contribution to consolidated revenues. We assumed that the majority of the medium-term financing is withdrawn by the industries segment.
Figure 2 | Valuation of the Restaurants Sector
1. Restaurants (KWD000) Dec-10 Dec-11 Dec-12 Dec-13 Dec-14 Perpetual
Revenues 357,789 385,436 418,533 459,276 503,673 Revenues growth 10.9% 7.7% 8.6% 9.7% 9.7%EBITDA 45,106 51,368 55,312 60,435 65,817 EBITDA growth 11.2% 13.9% 7.7% 9.3% 8.9%EBITDA Margin 12.6% 13.3% 13.2% 13.2% 13.1%D&A as a %age of rev. 3.7% 3.8% 3.9% 4.0% 4.0%D&A 13,257 14,751 16,389 18,182 19,983 EBIT 31,849 36,616 38,924 42,253 45,834 Tax rate 5.2% 5.2% 5.2% 5.2% 5.2%Tax expense 1,640 1,886 2,005 2,176 2,360 EBITDA - Tax expense 43,466 49,482 53,308 58,259 63,457 CAPEX 15,570 17,202 18,345 20,549 22,016 CAPEX/Revenues 4% 4% 4% 4% 4%Change in Working Investments 13,680 2,861 3,080 3,570 3,779 FCFF 14,216 29,419 31,883 34,139 37,662 38,792
WACC 12.0%Perpetual Growth Rate 3.0%
PV of FCFF 14,998 27,704 26,791 25,607 25,215 287,586
Current Enterprise Value 407,902
Net debt 17,306 Equity value 390,595 Value/share (KWD) 1.00
Source: CICR analysis
Figure 3 | Valuation of the Industries Sector
2. Industries sector (KWD 000) Dec-10 Dec-11 Dec-12 Dec-13 Dec-14 Perpetual
Revenues 333,045 369,969 408,081 444,728 484,344 Revenues growth 14.0% 11.1% 10.3% 9.0% 8.9%EBITDA 55,259 62,028 67,480 72,858 78,902 EBITDA growth 26.3% 12.2% 8.8% 8.0% 8.3%EBITDA Margin 16.6% 16.8% 16.5% 16.4% 16.3%D&A as a %age of rev. 6.4% 6.4% 6.4% 6.4% 6.4%D&A 23,756 26,511 29,528 32,832 36,280 EBIT 31,503 35,517 37,952 40,026 42,622 Tax rate 9.8% 9.8% 9.8% 9.8% 9.8%Tax expense 3,087 3,480 3,718 3,922 4,176 EBITDA - Tax expense 52,173 58,548 63,762 68,936 74,726 CAPEX 28,806 32,500 35,003 38,936 41,456 CAPEX/Revenues 9% 9% 9% 9% 9%Change in Working Investments 12,734 2,746 3,003 3,457 3,634 FCFF 10,633 23,302 25,756 26,544 29,637 30,526
WACC 13.2%Perpetual Growth Rate 3.0%
PV of FCFF 11,275 21,820 21,292 19,378 19,108 192,301
Current Enterprise Value 285,173
Net debt 95,133 Equity value 190,040
Value/share 0.49 Source: CICR analysis

REGIONAL FOOD | KFC
June 21, 2010
9
INITI
ATIO
N O
F C
OVE
RAG
E
Please Read Last Page for Contact Details and Important Disclaimer
Figure 4 |Valuation of the Commercial & Retail Sector 3. Commercial & Retail sector (KWD000) Dec-10 Dec-11 Dec-12 Dec-13 Dec-14 Perpetual
Revenues 23,388 24,557 25,785 27,074 28,428 Revenues growth 5.0% 5.0% 5.0% 5.0% 5.0%EBITDA 1,248 1,304 1,357 1,413 1,470 EBITDA growth 5.1% 4.5% 4.1% 4.1% 4.1%EBITDA Margin 5.3% 5.3% 5.3% 5.2% 5.2%D&A as a %age of rev. 1.0% 1.0% 1.0% 1.0% 1.0%D&A 178 199 223 248 276 EBIT 1,070 1,105 1,135 1,164 1,194 Tax rate 0.0% 0.0% 0.0% 0.0% 0.0%Tax expense - - - - - EBITDA - Tax expense 1,248 1,304 1,357 1,413 1,470 CAPEX 25 26 27 28 29 CAPEX/Revenues 2% 2% 2% 2% 2%Change in Working Investments 894 182 190 210 213 FCFF 329 1,096 1,140 1,174 1,228 1,252
WACC 10.8%Perpetual Growth Rate 2.0%
PV of FCFF 345 1,038 975 906 855 9,947
Current Enterprise Value 14,067 Net debt 517
Equity value 13,550 Value/share 0.03
Source: CICR analysis
LTFV of 1.83/share: Consequently, we reached a fair value of KWD1.83/share, providing a 33% upside potential over the recent market price.
Figure 5 | Summary of the Sum-of-the-Parts Valuation
Segment WACC g EV Net Debt (Debt-Cash)
Equity [ EV-Net Debt]
%age of total value FV/share
KWD 000 except for per share values
1. Restaurants (000)Restaurants segment shareholders' value 12.0% 3% 407,902 17,306 390,595 51% 1.00
2. Industries Sector (000)Industries Sector shareholders' value 13.2% 3% 285,173 95,133 190,040 25% 0.49
3. Commercial and retails sector (000)Commercial and retail sector shareholders' value 10.8% 2% 14,067 517 13,550 2% 0.03
Total value of segments 594,185
Book value of available for sale investments 176,970 23% 0.45 Total EV (000) 771,155 100%Less value of minority interest* 55,669 SOTP valuation (000) 715,486 1.83 No. of outstanding shares (000) 391,154
* We incorporated the minority interest’s value for Cairo Poultry based on its market capitalization
Source: CICR analysis
REGIONAL FOOD | KFC
June 21, 2010
10
INITI
ATIO
N O
F C
OVE
RAG
E
Please Read Last Page for Contact Details and Important Disclaimer
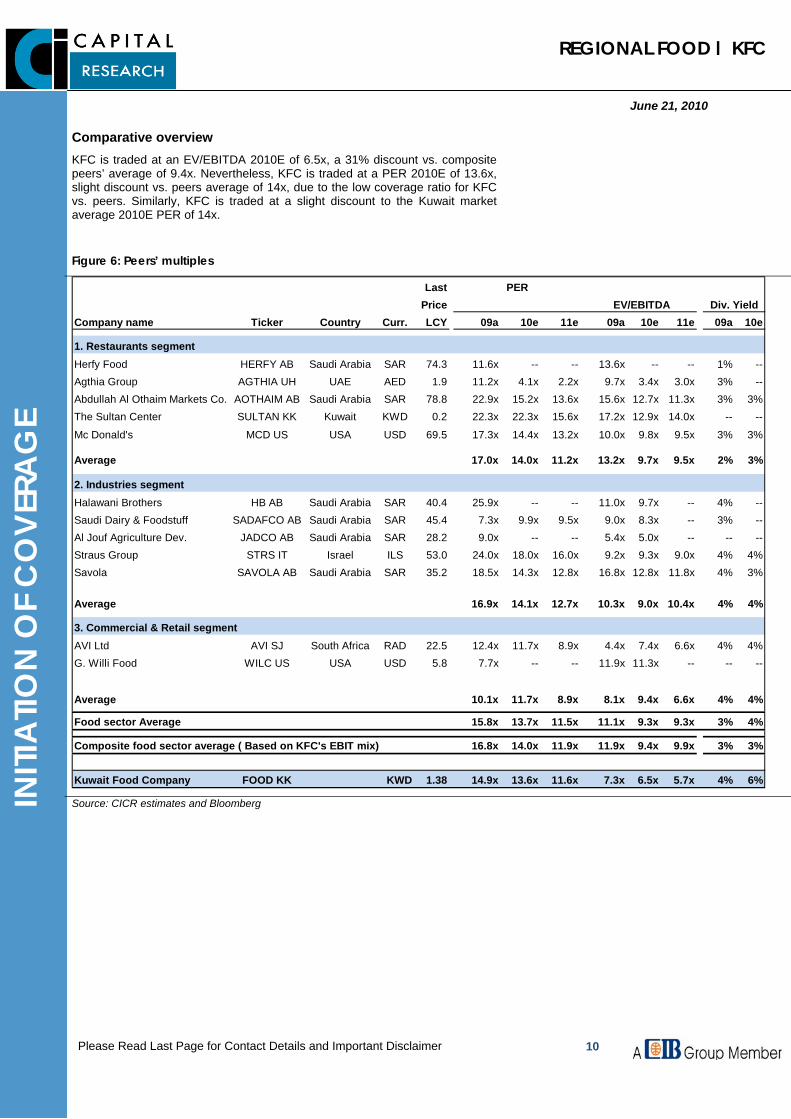
Comparative overview KFC is traded at an EV/EBITDA 2010E of 6.5x, a 31% discount vs. composite peers’ average of 9.4x. Nevertheless, KFC is traded at a PER 2010E of 13.6x, slight discount vs. peers average of 14x, due to the low coverage ratio for KFC vs. peers. Similarly, KFC is traded at a slight discount to the Kuwait market average 2010E PER of 14x.
Figure 6: Peers’ multiples
LastPrice
Company name Ticker Country Curr. LCY 09a 10e 11e 09a 10e 11e 09a 10e
1. Restaurants segmentHerfy Food HERFY AB Saudi Arabia SAR 74.3 11.6x -- -- 13.6x -- -- 1% --Agthia Group AGTHIA UH UAE AED 1.9 11.2x 4.1x 2.2x 9.7x 3.4x 3.0x 3% --Abdullah Al Othaim Markets Co. AOTHAIM AB Saudi Arabia SAR 78.8 22.9x 15.2x 13.6x 15.6x 12.7x 11.3x 3% 3%The Sultan Center SULTAN KK Kuwait KWD 0.2 22.3x 22.3x 15.6x 17.2x 12.9x 14.0x -- --
Mc Donald's MCD US USA USD 69.5 17.3x 14.4x 13.2x 10.0x 9.8x 9.5x 3% 3%
Average 17.0x 14.0x 11.2x 13.2x 9.7x 9.5x 2% 3%
2. Industries segment Halawani Brothers HB AB Saudi Arabia SAR 40.4 25.9x -- -- 11.0x 9.7x -- 4% --Saudi Dairy & Foodstuff SADAFCO AB Saudi Arabia SAR 45.4 7.3x 9.9x 9.5x 9.0x 8.3x -- 3% --Al Jouf Agriculture Dev. JADCO AB Saudi Arabia SAR 28.2 9.0x -- -- 5.4x 5.0x -- -- --Straus Group STRS IT Israel ILS 53.0 24.0x 18.0x 16.0x 9.2x 9.3x 9.0x 4% 4%Savola SAVOLA AB Saudi Arabia SAR 35.2 18.5x 14.3x 12.8x 16.8x 12.8x 11.8x 4% 3%
Average 16.9x 14.1x 12.7x 10.3x 9.0x 10.4x 4% 4%
3. Commercial & Retail segmentAVI Ltd AVI SJ South Africa RAD 22.5 12.4x 11.7x 8.9x 4.4x 7.4x 6.6x 4% 4%G. Willi Food WILC US USA USD 5.8 7.7x -- -- 11.9x 11.3x -- -- --
Average 10.1x 11.7x 8.9x 8.1x 9.4x 6.6x 4% 4%
Food sector Average 15.8x 13.7x 11.5x 11.1x 9.3x 9.3x 3% 4%
Composite food sector average ( Based on KFC's EBIT mix) 16.8x 14.0x 11.9x 11.9x 9.4x 9.9x 3% 3%
Kuwait Food Company FOOD KK KWD 1.38 14.9x 13.6x 11.6x 7.3x 6.5x 5.7x 4% 6%
Div. YieldEV/EBITDAPER
Source: CICR estimates and Bloomberg

REGIONAL FOOD | KFC
June 21, 2010
11
INITI
ATIO
N O
F C
OVE
RAG
E
Please Read Last Page for Contact Details and Important Disclaimer
B. Target Price Determination We reached our target price of KWD1.64/share, which is the implied value based on a target EV/EBITDA of 7.5x (a slight premium to the historical average of 7.2x excluding outliers).
Given the 18% upside potential vs. our target price, we initiate coverage on the stock with a Hold recommendation.
Figure 7 |Target Price Calculation
Outstanding no. of shares 391,154 Market price (KWD/share) 1.38EBITDA 2010 (KWD 000) 101,613 Net Debt 2010 (KWD 000) 118,904
Target Price Calculation Implied valueTarget EV/EBITDA 7.5x 1.64
Target price
Source: CICR analysis
We believe that based on the target price of KWD1.64/share, KFC will be traded at 2011E P/E ratio of 13.8x and EV/EBITDA of 6.6x. We believe the target price is feasible based on KFC’s expected 5-year normalized earnings’ CAGR of 16%. Furthermore, based on 2011E EV/EBITDA, KFC will still be traded at a discount compared to composite peers’ average of 9.8x. Yet, our target price might not be reached in case the stock exchange remains unstable and lower-than-expected dividend is distributed by KFC in FY10.
Figure 8 |Implied P/E ratios and EV/EBITDA based on Target price
Current Price KWD1.38 2010E 2011E 2012EP/E 2010 13.6x 11.6x 10.7xEV/EBITDA 6.5x 5.7x 5.2x
Target Price KWD1.64 2010E 2011E 2012EP/E 2010 16.2x 13.8x 12.8xEV/EBITDA 7.5x 6.6x 6.0x Source: CICR analysis

REGIONAL FOOD | KFC
June 21, 2010
12
INITI
ATIO
N O
F C
OVE
RAG
E
Please Read Last Page for Contact Details and Important Disclaimer
Risks & Catalysts
Risks to our Recommendation
• Lower-than-expected payout ratio to finance expansions.
• Prolonged negative technical view on the stock market.
• Spread of disease may threaten demand for fast-food restaurants.
• Higher food prices and the inability to fully pass them to the end consumer.
• Scepticism about the merits of processed and fast-food in terms of health hygiene.
Catalysts for Future Growth
• Busy lifestyles, increased westernization and the growing number of working women.
• A growing population in the MENA region.
• The fact that a large tranche of the GCC market’s population is youthful is likely to boost fast-food demand.
• Food consumption is a key priority of consumers in the MENA region.
REGIONAL FOOD | KFC
June 21, 2010
13
INITI
ATIO
N O
F C
OVE
RAG
E
Please Read Last Page for Contact Details and Important Disclaimer
C. Technical Analysis
Mohamed El-Zayat, MSTA, CFTe | [email protected] Mohamed Kamel, ESTA | [email protected]
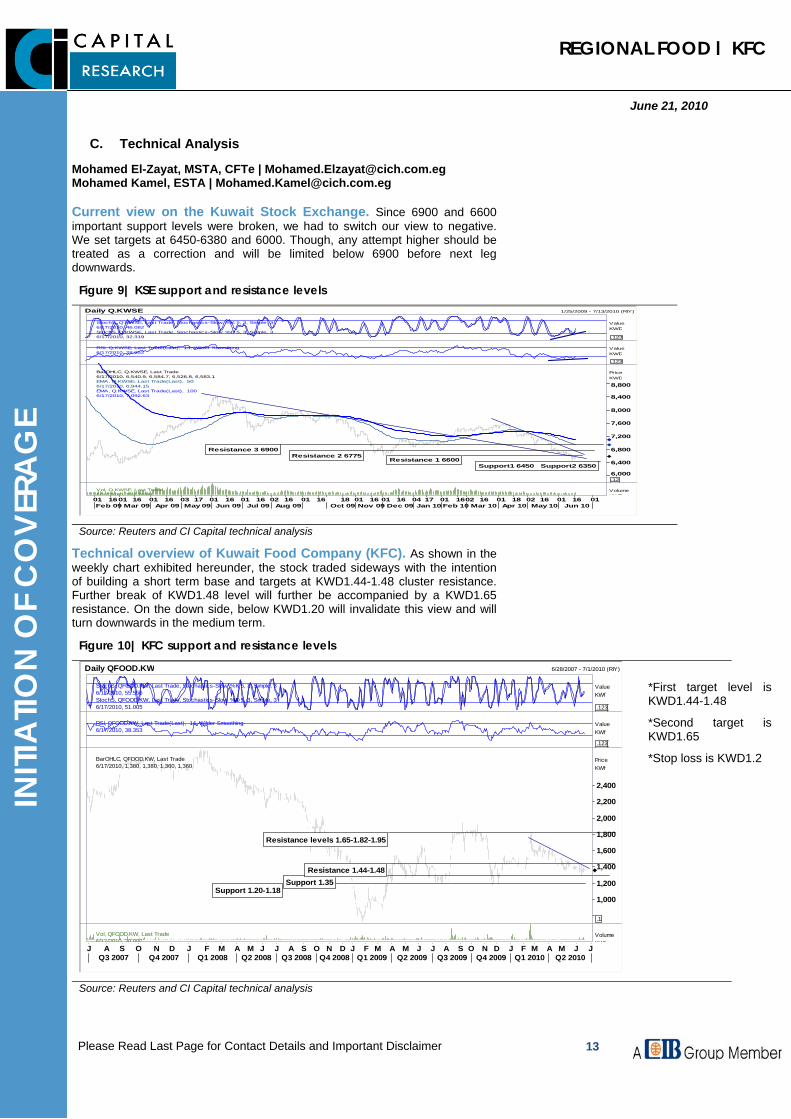
Current view on the Kuwait Stock Exchange. Since 6900 and 6600 important support levels were broken, we had to switch our view to negative. We set targets at 6450-6380 and 6000. Though, any attempt higher should be treated as a correction and will be limited below 6900 before next leg downwards.
Figure 9| KSE support and resistance levels Daily Q.KWSE 1/25/2009 - 7/13/2010 (RIY)
StochS, Q.KWSE, Last Trade, Stochastics-Slow %K 5, 3, Simple, 36/17/2010, 46.082StochS, Q.KWSE, Last Trade, Stochastics-Slow %D 5, 3, Simple, 36/17/2010, 32.319
ValueKWD
.123
RSI, Q.KWSE, Last Trade(Last), 14, Wilder Smoothing6/17/2010, 28.952
ValueKWD
.123
Resistance 1 6600Resistance 2 6775
Resistance 3 6900
Support1 6450 Support2 6350
BarOHLC, Q.KWSE, Last Trade6/17/2010, 6,540.9, 6,584.7, 6,526.8, 6,583.1EMA, Q.KWSE, Last Trade(Last), 506/17/2010, 6,944.15EMA, Q.KWSE, Last Trade(Last), 1006/17/2010, 7,092.63
PriceKWD
.126,000
6,400
6,800
7,200
7,600
8,000
8,400
8,800
Vol, Q.KWSE, Last Trade6/17/2010 234 255M
VolumeKWD
01 16 01 16 01 16 03 17 01 16 01 16 02 16 01 16 18 01 16 01 16 04 17 01 16 02 16 01 18 02 16 01 16 01Feb 09 Mar 09 Apr 09 May 09 Jun 09 Jul 09 Aug 09 Oct 09 Nov 09 Dec 09 Jan 10 Feb 10 Mar 10 Apr 10 May 10 Jun 10
Source: Reuters and CI Capital technical analysis
Technical overview of Kuwait Food Company (KFC). As shown in the weekly chart exhibited hereunder, the stock traded sideways with the intention of building a short term base and targets at KWD1.44-1.48 cluster resistance. Further break of KWD1.48 level will further be accompanied by a KWD1.65 resistance. On the down side, below KWD1.20 will invalidate this view and will turn downwards in the medium term.
Figure 10| KFC support and resistance levels
Daily QFOOD.KW 6/28/2007 - 7/1/2010 (RIY)
StochS, QFOOD.KW, Last Trade, Stochastics-Slow %K 5, 3, Simple, 36/17/2010, 55.556StochS, QFOOD.KW, Last Trade, Stochastics-Slow %D 5, 3, Simple, 36/17/2010, 51.005
ValueKWf
.123
RSI, QFOOD.KW, Last Trade(Last), 14, Wilder Smoothing6/17/2010, 38.353
ValueKWf
.123
Support 1.20-1.18Support 1.35
Resistance 1.44-1.48
Resistance levels 1.65-1.82-1.95
BarOHLC, QFOOD.KW, Last Trade6/17/2010, 1,380, 1,380, 1,360, 1,360
PriceKWf
.1
1,000
1,200
1,400
1,600
1,800
2,000
2,200
2,400
Vol, QFOOD.KW, Last Trade6/17/2010, 30,000
VolumeKWf
J A S O N D J F M A M J J A S O N D J F M A M J J A S O N D J F M A M J JQ3 2007 Q4 2007 Q1 2008 Q2 2008 Q3 2008 Q4 2008 Q1 2009 Q2 2009 Q3 2009 Q4 2009 Q1 2010 Q2 2010
Source: Reuters and CI Capital technical analysis
*First target level is KWD1.44-1.48
*Second target is KWD1.65
*Stop loss is KWD1.2

REGIONAL FOOD | KFC
June 21, 2010
14
INITI
ATIO
N O
F C
OVE
RAG
E
Please Read Last Page for Contact Details and Important Disclaimer
III. Industry Overview
A. Global Food Business
Global food sales reached USD6.7tn in 2009. Global food sales (estimated to be in the vicinity of USD6.7tn in 2009) are comprised of the retail food (fresh and processed food) and food service establishment (restaurants and hotels) segments. Food retail sales reached an estimated value of USD5.2tn in 2009, exhibiting a four-year CAGR growth of 7% over the period 2005–09. The food service market—which includes restaurants, fast food establishments, and all other outdoor eating establishments—was valued at about USD1.5tn in 20091, accounting for almost 22% of global food sales. A shift in consumption patterns towards ready-to-eat food and out-of-home consumption is driving growth in the food market. The US led the global food market with expenditure on food, beverage and tobacco reaching USD890bn in 2009. Now, emerging economies in Asia and the MENA region are witnessing strong growth in the food retail and service businesses due to economic expansions, busy lifestyles and increasing urbanization. Figure 11| Structure of the Food Market
Food market
Retail
Fresh Processed
Packaged Food Beverages
Food service establishment
Hotels Restaurants
1 Source: Yum Brand Presentation
Source: Economic Research Service/ USDA
POTENTIALS
Food consumption accounts for a large portion of total spending in the MENA region.
Strong population base of over 300mn capita in the MENA region.
Wide tranche of youth population and foreign expats in GCC markets.
Increasing demand for dining and food. Changing lifestyles, increasing
westernization and growing numbers of working women.
RISKS
A large portion of Egypt’s population - a major food market in MENA - falls into the lower income bracket and consumes a higher portion of traditional food products.
Scepticism about the merits of processed and fast food in terms of health hygiene.
Fluctuating international food prices. Shortage of arable area and limited water
supply in the MENA. Vulnerability to food product spoilage in the
event of malfunctioning freezing systems or lower demand.
The spread of diseases such as the swine flu, Avian flu and the foot-and-mouth disease virus.
REGIONAL FOOD | KFC
June 21, 2010
15
INITI
ATIO
N O
F C
OVE
RAG
E
Please Read Last Page for Contact Details and Important Disclaimer
B. Food Industry in the MENA Region
The food industry in the MENA region has a diverse structure due to varying rates of economic development across the region. Several countries in the Middle East and a few countries in North Africa (such as Egypt) have witnessed strong growth in the food market.
1. Main Characteristics
a) Size of the food market
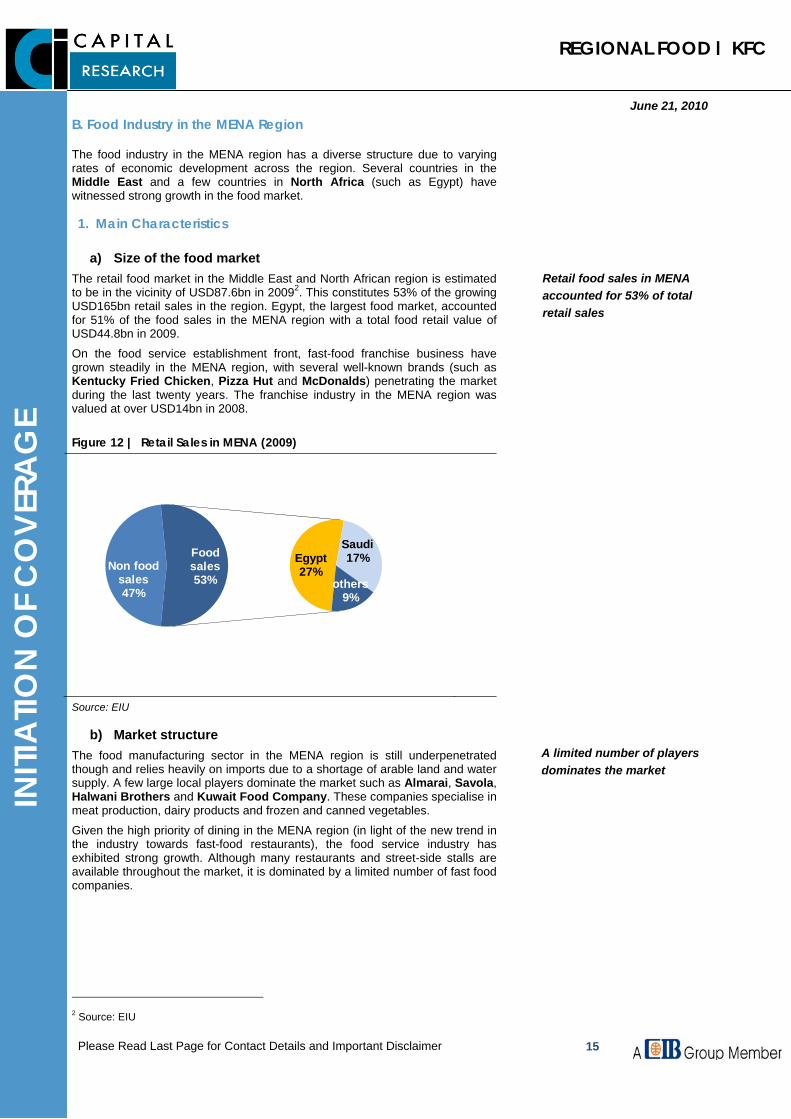
The retail food market in the Middle East and North African region is estimated to be in the vicinity of USD87.6bn in 20092. This constitutes 53% of the growing USD165bn retail sales in the region. Egypt, the largest food market, accounted for 51% of the food sales in the MENA region with a total food retail value of USD44.8bn in 2009.
On the food service establishment front, fast-food franchise business have grown steadily in the MENA region, with several well-known brands (such as Kentucky Fried Chicken, Pizza Hut and McDonalds) penetrating the market during the last twenty years. The franchise industry in the MENA region was valued at over USD14bn in 2008.
Source: EIU
b) Market structure
The food manufacturing sector in the MENA region is still underpenetrated though and relies heavily on imports due to a shortage of arable land and water supply. A few large local players dominate the market such as Almarai, Savola, Halwani Brothers and Kuwait Food Company. These companies specialise in meat production, dairy products and frozen and canned vegetables.
Given the high priority of dining in the MENA region (in light of the new trend in the industry towards fast-food restaurants), the food service industry has exhibited strong growth. Although many restaurants and street-side stalls are available throughout the market, it is dominated by a limited number of fast food companies.
2 Source: EIU
Retail food sales in MENA accounted for 53% of total retail sales
Figure 12 | Retail Sales in MENA (2009)
Non food sales47%
Egypt 27%
Saudi 17%
others9%
Food sales53%
A limited number of players dominates the market
REGIONAL FOOD | KFC
June 21, 2010
16
INITI
ATIO
N O
F C
OVE
RAG
E
Please Read Last Page for Contact Details and Important Disclaimer
* Number of outlets as of August, 2009
Source: CICR analysis
2. Dynamics of the Food Industry
a) Healthy demographic structure. With a total population size of over 300mn, the MENA region provides a healthy and youthful base for the food industry. Additionally, the increasing number of working women and the growing working population has led to an increasing number of retail consumers in the region. Increasing numbers of expats in the GCC countries have also helped fuel demand for ready-to-eat food.
b) Subject to volatility of food prices.
Food prices fell in 2009 from the peak reached during the 2008 food price crisis. The extreme rise in food prices was driven by several factors, including:
(i) Falling cereal stock due to prolonged droughts in food exporting countries.
(ii) Rising demand for meat in emerging economies due to improving standards of living.
(iii) Diverting food crops to bio-fuels.
Food prices have fluctuated since mid-2007. Average food prices started to ease in late 2008 due to falling demand amid the global recession and lower demand for bio-fuels due to reduced oil prices. Sugar prices rose to very high levels in 4Q09 due to tightening supply before falling sharply in 1H10 due to better than expected production in Brazil and India. Meanwhile, prices of meat, oil and dairy prices have been risen lately on strong demand.
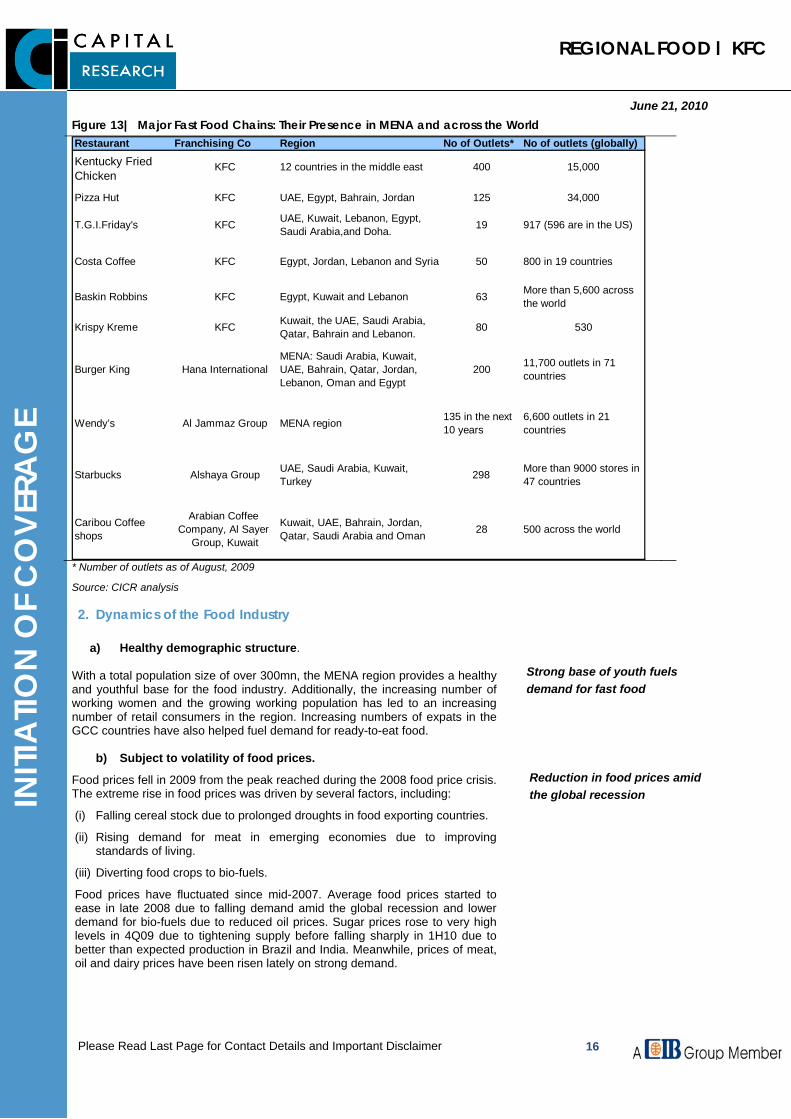
Figure 13| Major Fast Food Chains: Their Presence in MENA and across the World Restaurant Franchising Co Region No of Outlets* No of outlets (globally)
Kentucky Fried Chicken
KFC 12 countries in the middle east 400 15,000
Pizza Hut KFC UAE, Egypt, Bahrain, Jordan 125 34,000
T.G.I.Friday's KFC UAE, Kuwait, Lebanon, Egypt, Saudi Arabia,and Doha. 19 917 (596 are in the US)
Costa Coffee KFC Egypt, Jordan, Lebanon and Syria 50 800 in 19 countries
Baskin Robbins KFC Egypt, Kuwait and Lebanon 63 More than 5,600 across the world
Krispy Kreme KFC Kuwait, the UAE, Saudi Arabia, Qatar, Bahrain and Lebanon. 80 530
Burger King Hana International MENA: Saudi Arabia, Kuwait, UAE, Bahrain, Qatar, Jordan, Lebanon, Oman and Egypt
200 11,700 outlets in 71 countries
Wendy’s Al Jammaz Group MENA region 135 in the next 10 years
6,600 outlets in 21 countries
Starbucks Alshaya Group UAE, Saudi Arabia, Kuwait, Turkey 298 More than 9000 stores in
47 countries
Caribou Coffee shops
Arabian Coffee Company, Al Sayer
Group, Kuwait
Kuwait, UAE, Bahrain, Jordan, Qatar, Saudi Arabia and Oman 28 500 across the world
Strong base of youth fuels demand for fast food
Reduction in food prices amid the global recession

REGIONAL FOOD | KFC
June 21, 2010
17
INITI
ATIO
N O
F C
OVE
RAG
E
Please Read Last Page for Contact Details and Important Disclaimer
Source: FAO
c) High per capita consumption.
Given that food is a major priority in the MENA region, per capita food consumption as a percentage of household consumption is high in the MENA region (particularly in UAE, Saudi Arabia (KSA) and Kuwait).
Figure 15 | 2009 GDP per Capita (PPP) (USD based on 2005 prices)
1,580 2,494
12,161
30,622 32,168
37,19841,646
0
5,000
10,000
15,000
20,000
25,000
30,000
35,000
40,000
45,000
Egypt China KSA Kuwait UAE UK USA
USD
/ Cap
ita
Source: ERS International macroeconomic data
Figure 14 | International Food Price Indices: 2006-1H10
0
50
100
150
200
250
300
350
400
Jan-06 Jul-06 Jan-07 Jul-07 Jan-08 Jul-08 Jan-09 Jul-09 Jan-10
Food Price Index Meat Price Index Dairy Price IndexOils Price Index Sugar Price Index
Meat
Food
Oil
Sugar
Dairy
Food is a major priority in MENA
REGIONAL FOOD | KFC
June 21, 2010
18
INITI
ATIO
N O
F C
OVE
RAG
E
Please Read Last Page for Contact Details and Important Disclaimer
3. Key Regional Food Markets
KFC operates in various MENA food markets, with its major markets being Egypt, Kuwait, Saudi Arabia, and the southern Gulf countries such as the UAE, Qatar and Bahrain. The business dynamics of these markets are discussed below. a) Egypt: Backed by a populous market
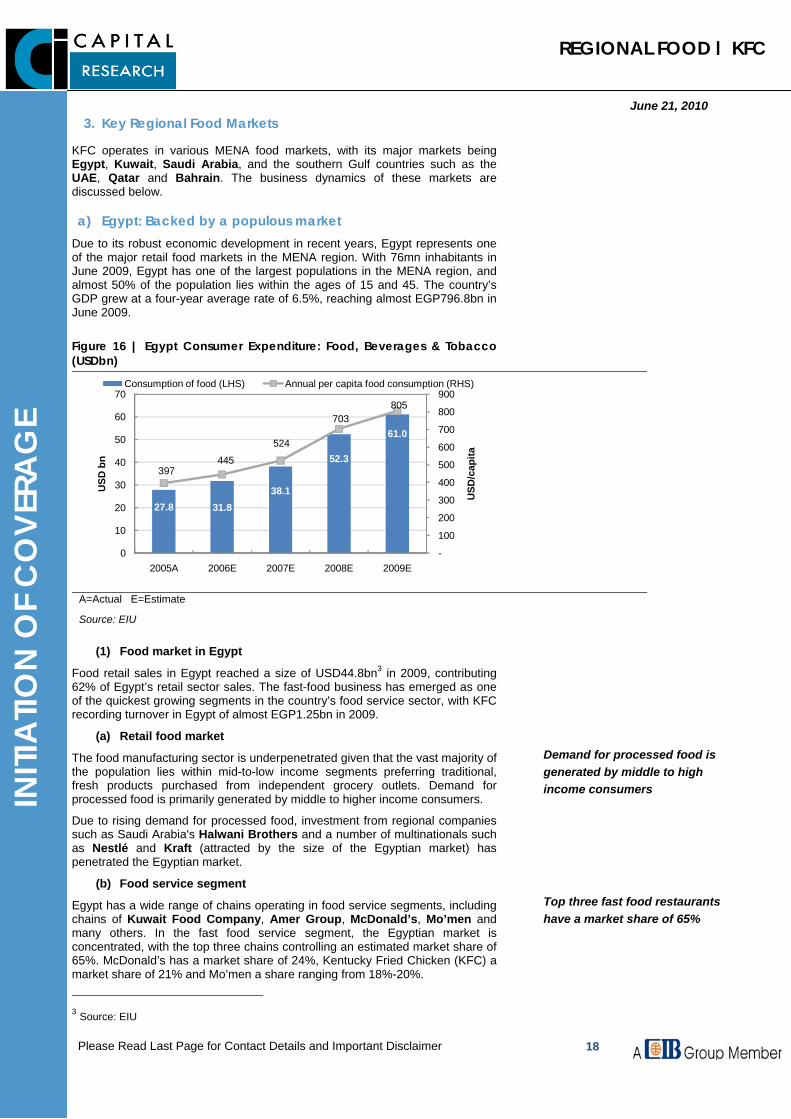
Due to its robust economic development in recent years, Egypt represents one of the major retail food markets in the MENA region. With 76mn inhabitants in June 2009, Egypt has one of the largest populations in the MENA region, and almost 50% of the population lies within the ages of 15 and 45. The country’s GDP grew at a four-year average rate of 6.5%, reaching almost EGP796.8bn in June 2009.
Figure 16 | Egypt Consumer Expenditure: Food, Beverages & Tobacco (USDbn)
A= Actual E=Estimated
27.8 31.838.1
52.3
61.0
397 445
524
703 805
-
100
200
300
400
500
600
700
800
900
0
10
20
30
40
50
60
70
2005A 2006E 2007E 2008E 2009E
USD
/cap
ita
USD
bn
Consumption of food (LHS) Annual per capita food consumption (RHS)
A=Actual E=Estimate
Source: EIU
(1) Food market in Egypt
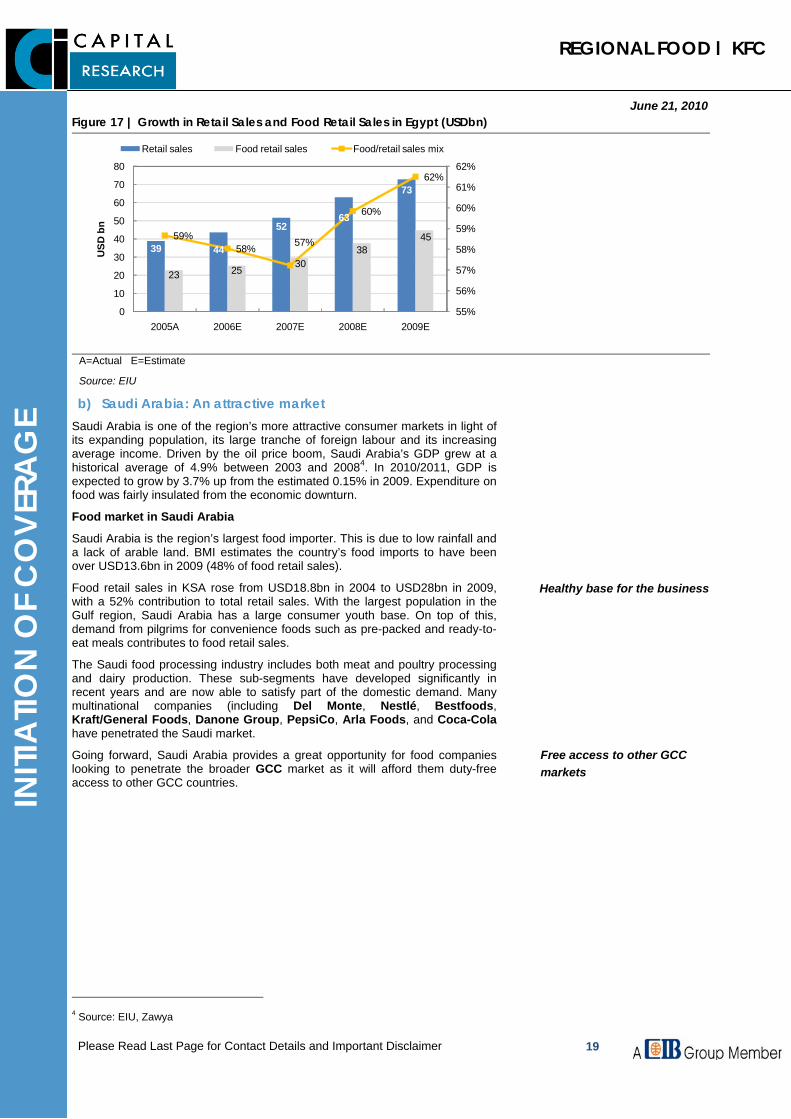
Food retail sales in Egypt reached a size of USD44.8bn3 in 2009, contributing 62% of Egypt’s retail sector sales. The fast-food business has emerged as one of the quickest growing segments in the country’s food service sector, with KFC recording turnover in Egypt of almost EGP1.25bn in 2009.
(a) Retail food market
The food manufacturing sector is underpenetrated given that the vast majority of the population lies within mid-to-low income segments preferring traditional, fresh products purchased from independent grocery outlets. Demand for processed food is primarily generated by middle to higher income consumers.
Due to rising demand for processed food, investment from regional companies such as Saudi Arabia's Halwani Brothers and a number of multinationals such as Nestlé and Kraft (attracted by the size of the Egyptian market) has penetrated the Egyptian market.
(b) Food service segment
Egypt has a wide range of chains operating in food service segments, including chains of Kuwait Food Company, Amer Group, McDonald’s, Mo’men and many others. In the fast food service segment, the Egyptian market is concentrated, with the top three chains controlling an estimated market share of 65%. McDonald’s has a market share of 24%, Kentucky Fried Chicken (KFC) a market share of 21% and Mo’men a share ranging from 18%-20%.
3 Source: EIU
Demand for processed food is generated by middle to high income consumers
Top three fast food restaurants have a market share of 65%
REGIONAL FOOD | KFC
June 21, 2010
19
INITI
ATIO
N O
F C
OVE
RAG
E
Please Read Last Page for Contact Details and Important Disclaimer
Figure 17 | Growth in Retail Sales and Food Retail Sales in Egypt (USDbn)
39 44
5263
73
23 2530
384559%
58% 57%
60%
62%
55%
56%
57%
58%
59%
60%
61%
62%
0
10
20
30
40
50
60
70
80
2005A 2006E 2007E 2008E 2009E
USD
bn
Retail sales Food retail sales Food/retail sales mix
A=Actual E=Estimate
Source: EIU
b) Saudi Arabia: An attractive market Saudi Arabia is one of the region’s more attractive consumer markets in light of its expanding population, its large tranche of foreign labour and its increasing average income. Driven by the oil price boom, Saudi Arabia’s GDP grew at a historical average of 4.9% between 2003 and 20084. In 2010/2011, GDP is expected to grow by 3.7% up from the estimated 0.15% in 2009. Expenditure on food was fairly insulated from the economic downturn.
Food market in Saudi Arabia
Saudi Arabia is the region’s largest food importer. This is due to low rainfall and a lack of arable land. BMI estimates the country’s food imports to have been over USD13.6bn in 2009 (48% of food retail sales).
Food retail sales in KSA rose from USD18.8bn in 2004 to USD28bn in 2009, with a 52% contribution to total retail sales. With the largest population in the Gulf region, Saudi Arabia has a large consumer youth base. On top of this, demand from pilgrims for convenience foods such as pre-packed and ready-to-eat meals contributes to food retail sales.
The Saudi food processing industry includes both meat and poultry processing and dairy production. These sub-segments have developed significantly in recent years and are now able to satisfy part of the domestic demand. Many multinational companies (including Del Monte, Nestlé, Bestfoods, Kraft/General Foods, Danone Group, PepsiCo, Arla Foods, and Coca-Cola have penetrated the Saudi market.
Going forward, Saudi Arabia provides a great opportunity for food companies looking to penetrate the broader GCC market as it will afford them duty-free access to other GCC countries.
4 Source: EIU, Zawya
Healthy base for the business
Free access to other GCC markets
REGIONAL FOOD | KFC
June 21, 2010
20
INITI
ATIO
N O
F C
OVE
RAG
E
Please Read Last Page for Contact Details and Important Disclaimer
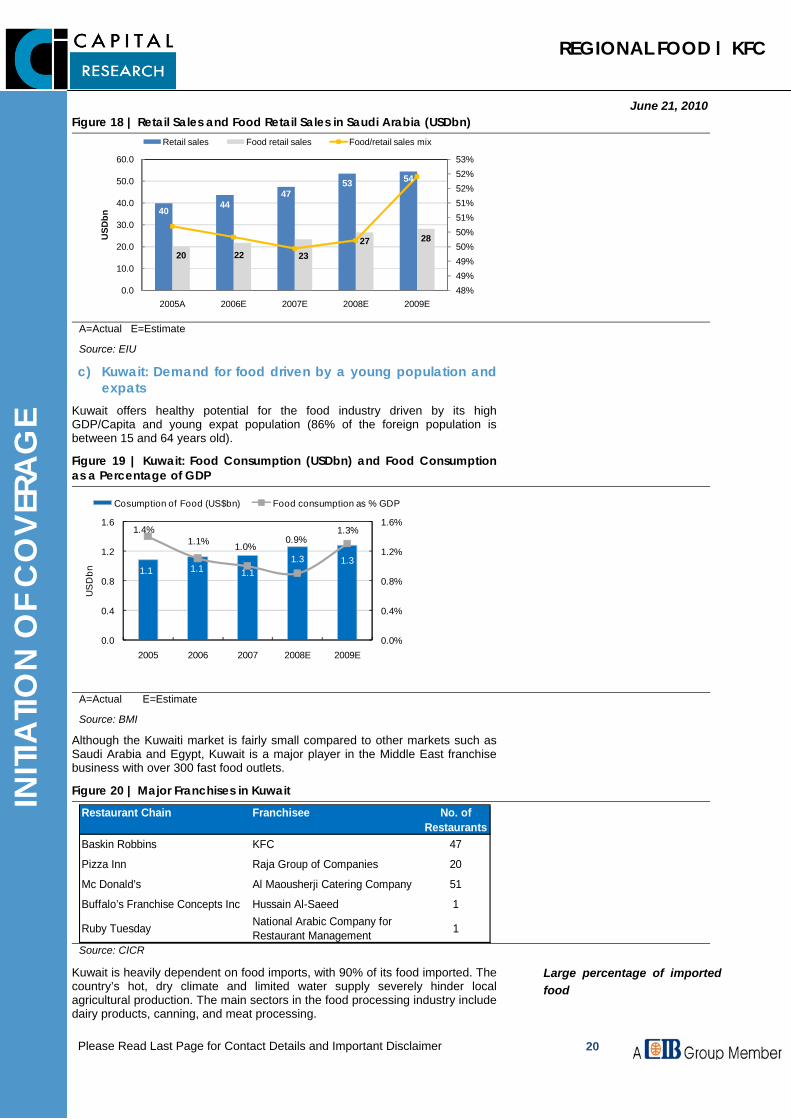
Figure 18 | Retail Sales and Food Retail Sales in Saudi Arabia (USDbn)
A= Actual E=Expected F=ForecastSource: EIU
4044
4753 54
20 22 2327 28
48%49%49%50%50%51%51%52%52%53%
0.0
10.0
20.0
30.0
40.0
50.0
60.0
2005A 2006E 2007E 2008E 2009E
USD
bn
Retail sales Food retail sales Food/retail sales mix
A=Actual E=Estimate
Source: EIU
c) Kuwait: Demand for food driven by a young population and expats
Kuwait offers healthy potential for the food industry driven by its high GDP/Capita and young expat population (86% of the foreign population is between 15 and 64 years old).
Figure 19 | Kuwait: Food Consumption (USDbn) and Food Consumption as a Percentage of GDP
1.1 1.1 1.11.3 1.3
1.4%1.1% 1.0%
0.9%1.3%
0.0%
0.4%
0.8%
1.2%
1.6%
0.0
0.4
0.8
1.2
1.6
2005 2006 2007 2008E 2009E
US
Dbn
Cosumption of Food (US$bn) Food consumption as % GDP
A=Actual E=Estimate
Source: BMI
Although the Kuwaiti market is fairly small compared to other markets such as Saudi Arabia and Egypt, Kuwait is a major player in the Middle East franchise business with over 300 fast food outlets.
Figure 20 | Major Franchises in Kuwait Restaurant Chain Franchisee No. of
RestaurantsBaskin Robbins KFC 47
Pizza Inn Raja Group of Companies 20
Mc Donald’s Al Maousherji Catering Company 51
Buffalo’s Franchise Concepts Inc Hussain Al-Saeed 1
Ruby Tuesday National Arabic Company for Restaurant Management 1
Source: CICR
Kuwait is heavily dependent on food imports, with 90% of its food imported. The country’s hot, dry climate and limited water supply severely hinder local agricultural production. The main sectors in the food processing industry include dairy products, canning, and meat processing.
Large percentage of imported food
REGIONAL FOOD | KFC
June 21, 2010
21
INITI
ATIO
N O
F C
OVE
RAG
E
Please Read Last Page for Contact Details and Important Disclaimer
d) Other GCC markets Bahrain and the UAE are the major markets in the southern Gulf region for KFC.
(1) Bahrain
The food retail market in Bahrain is relatively underdeveloped, mainly due to its small population (approximately 1mn) and lower percentage of food expenditure. Bahrain’s GDP growth is estimated to reach 4.1%5 in 2010/2011 (up from 3.1% in 2009). According to BMI, food consumption in Bahrain is estimated to rise to USD0.39bn in 2013 up from USD0.35bn in 2008.
The Government’s initiative to transform Bahrain into the region’s financial hub is expected to benefit the country’s retail food industry.
(2) UAE
UAE’s fast food market has been growing largely due to increasing consumer preference for ready-to-eat fast food. The UAE is heavily reliant on food and drink imports to meet domestic demand. Amid the current economic downturn, consumers are shifting more towards cooking at home low-cost fast food. Yet, KFC’s restaurant’s turnover in the UAE exceeded AED1bn in 2009.
4. Future Outlook
Stable demand for the food industry in MENA: While the food industry in developed economies is bearing the brunt of the economic downturn, the relatively strong economic position of most Middle East countries is enabling MENA’s food sector to make it through relatively unscathed. Furthermore, fast-food is doing well, owing to its low priced products. This is exemplified by the strong performance of fast-food restaurants in the MENA region (an 11% YoY increase in net sales of both Herfy in Saudi Arabia and Kuwait Food Company in 2009). Going forward, MENA countries’ 2010 real GDP growth is expected to remain higher (4.5%) than that of developed economies (3.1% in the US and 1.3% in the UK). Given that food spending accounts for the largest expenditure in MENA, the region offers a stable market for companies operating in this sector.
Rising food prices: In light of the expected rebound in the global economy, food prices are expected to increase. Although currently prices of some of the major food staples have eased (such as wheat and sugar) from their high levels, other food products such as meat, dairy products and oil have escalated, spurred on by growing demand.
5 Source: EIU
Strong economic position in MENA sheltered the food sector
Food prices will rise on the back of the rebound in the economy
REGIONAL FOOD | KFC
June 21, 2010
22
INITI
ATIO
N O
F C
OVE
RAG
E
Please Read Last Page for Contact Details and Important Disclaimer
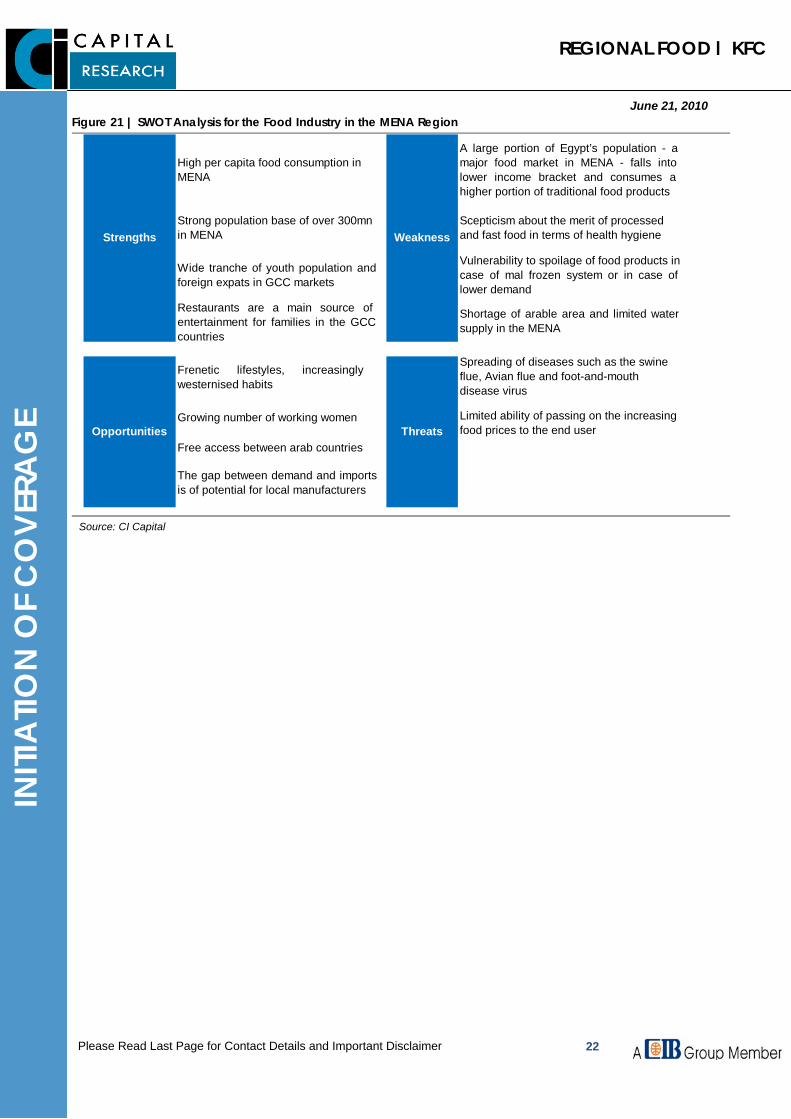
Figure 21 | SWOT Analysis for the Food Industry in the MENA Region
High per capita food consumption in MENA
A large portion of Egypt’s population - amajor food market in MENA - falls intolower income bracket and consumes ahigher portion of traditional food products
Strong population base of over 300mn in MENA
Scepticism about the merit of processed and fast food in terms of health hygiene
Wide tranche of youth population andforeign expats in GCC markets
Vulnerability to spoilage of food products in case of mal frozen system or in case oflower demand
Restaurants are a main source ofentertainment for families in the GCCcountries
Shortage of arable area and limited watersupply in the MENA
Frenetic lifestyles, increasinglywesternised habits
Spreading of diseases such as the swine flue, Avian flue and foot-and-mouth disease virus
Growing number of working women Limited ability of passing on the increasing food prices to the end user
Free access between arab countries
The gap between demand and importsis of potential for local manufacturers
Opportunities Threats
Strengths Weakness
Source: CI Capital
REGIONAL FOOD | KFC
June 21, 2010
23
INITI
ATIO
N O
F C
OVE
RAG
E
Please Read Last Page for Contact Details and Important Disclaimer
IV. Company Profile
A. Company Synopsis
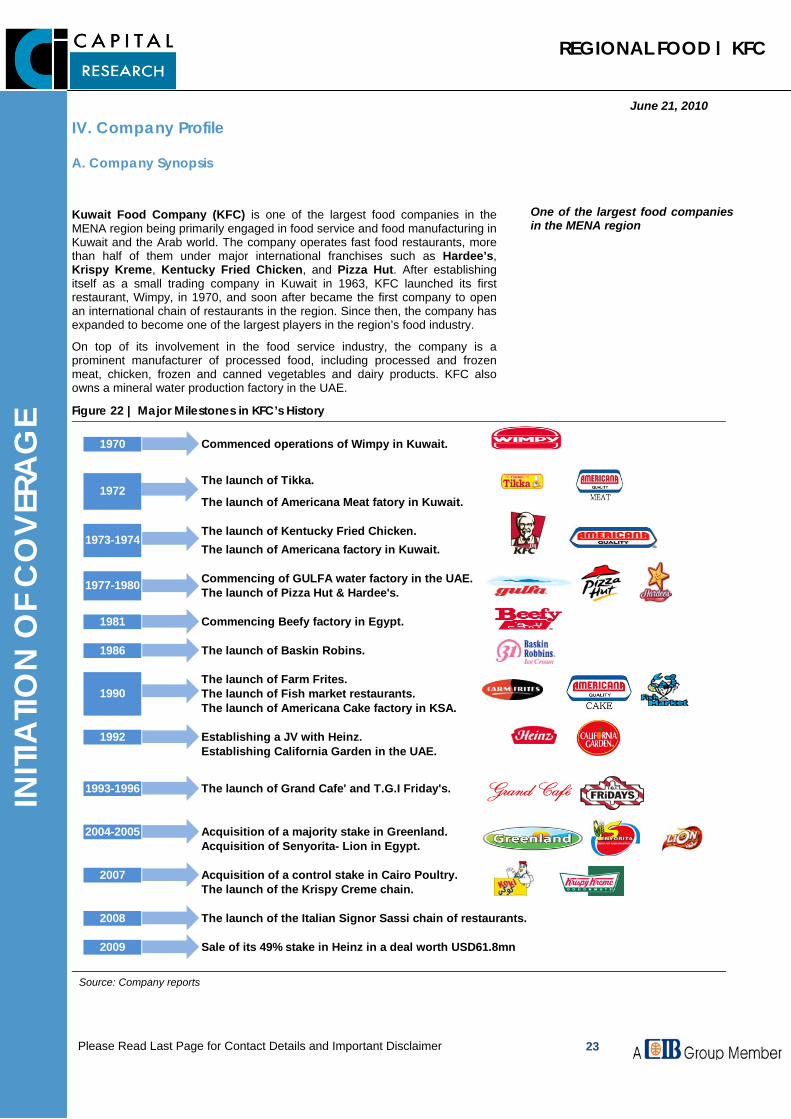
Kuwait Food Company (KFC) is one of the largest food companies in the MENA region being primarily engaged in food service and food manufacturing in Kuwait and the Arab world. The company operates fast food restaurants, more than half of them under major international franchises such as Hardee’s, Krispy Kreme, Kentucky Fried Chicken, and Pizza Hut. After establishing itself as a small trading company in Kuwait in 1963, KFC launched its first restaurant, Wimpy, in 1970, and soon after became the first company to open an international chain of restaurants in the region. Since then, the company has expanded to become one of the largest players in the region’s food industry.
On top of its involvement in the food service industry, the company is a prominent manufacturer of processed food, including processed and frozen meat, chicken, frozen and canned vegetables and dairy products. KFC also owns a mineral water production factory in the UAE.
Figure 22 | Major Milestones in KFC’s History
1970
1981
1986
The launch of Fish market restaurants.The launch of Americana Cake factory in KSA.
1992Establishing California Garden in the UAE.
1993-1996
2004-2005
2007
2008 The launch of the Italian Signor Sassi chain of restaurants.
2009 Sale of its 49% stake in Heinz in a deal worth USD61.8mn
The launch of Grand Cafe' and T.G.I Friday's.
Commencing of GULFA water factory in the UAE.
Acquisition of a majority stake in Greenland.Acquisition of Senyorita- Lion in Egypt.
The launch of the Krispy Creme chain.Acquisition of a control stake in Cairo Poultry.
The launch of Pizza Hut & Hardee's.
Commencing Beefy factory in Egypt.
The launch of Baskin Robins.
The launch of Farm Frites.1990
Establishing a JV with Heinz.
1972
1973-1974
1977-1980
Commenced operations of Wimpy in Kuwait.
The launch of Tikka.
The launch of Americana Meat fatory in Kuwait.
The launch of Kentucky Fried Chicken.The launch of Americana factory in Kuwait.
Source: Company reports
One of the largest food companies in the MENA region
REGIONAL FOOD | KFC
June 21, 2010
24
INITI
ATIO
N O
F C
OVE
RAG
E
Please Read Last Page for Contact Details and Important Disclaimer
B. Business segments
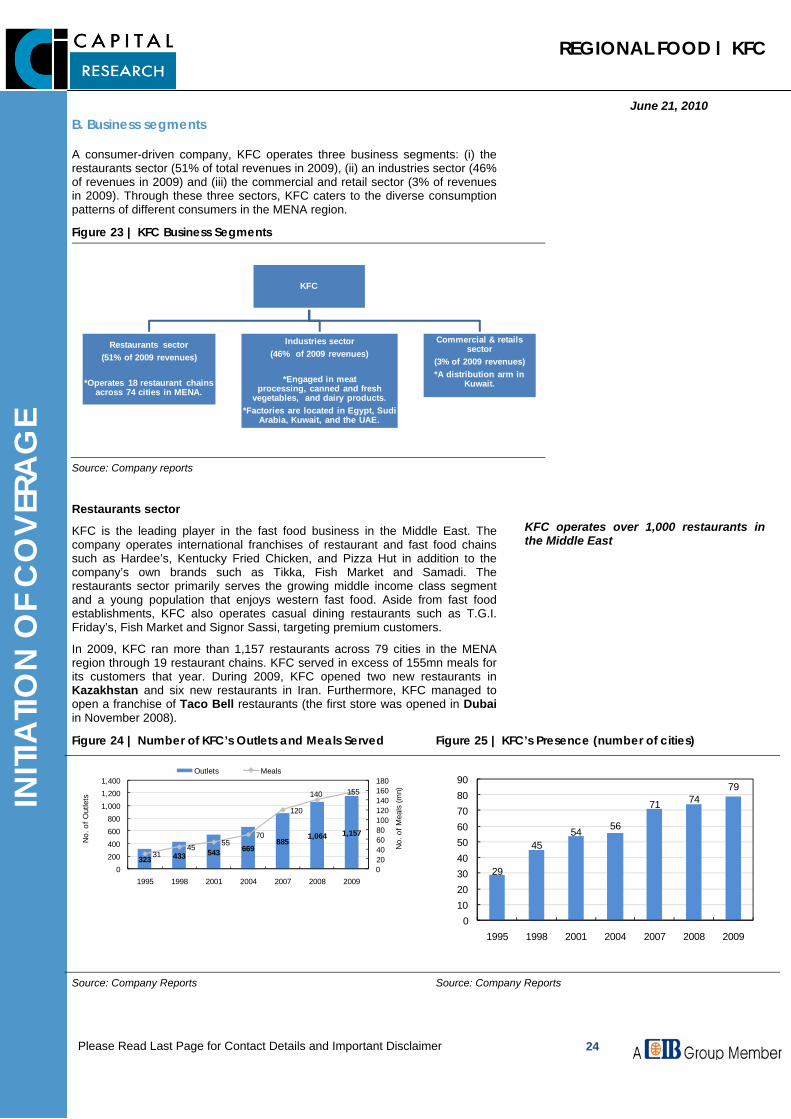
A consumer-driven company, KFC operates three business segments: (i) the restaurants sector (51% of total revenues in 2009), (ii) an industries sector (46% of revenues in 2009) and (iii) the commercial and retail sector (3% of revenues in 2009). Through these three sectors, KFC caters to the diverse consumption patterns of different consumers in the MENA region.
Figure 23 | KFC Business Segments
KFC
Restaurants sector(51% of 2009 revenues)
*Operates 18 restaurant chains across 74 cities in MENA.
Industries sector(46% of 2009 revenues)
*Engaged in meat processing, canned and fresh
vegetables, and dairy products. *Factories are located in Egypt, Sudi
Arabia, Kuwait, and the UAE.
Commercial & retails sector
(3% of 2009 revenues)*A distribution arm in
Kuwait.
Source: Company reports
Restaurants sector
KFC is the leading player in the fast food business in the Middle East. The company operates international franchises of restaurant and fast food chains such as Hardee’s, Kentucky Fried Chicken, and Pizza Hut in addition to the company’s own brands such as Tikka, Fish Market and Samadi. The restaurants sector primarily serves the growing middle income class segment and a young population that enjoys western fast food. Aside from fast food establishments, KFC also operates casual dining restaurants such as T.G.I. Friday’s, Fish Market and Signor Sassi, targeting premium customers.
In 2009, KFC ran more than 1,157 restaurants across 79 cities in the MENA region through 19 restaurant chains. KFC served in excess of 155mn meals for its customers that year. During 2009, KFC opened two new restaurants in Kazakhstan and six new restaurants in Iran. Furthermore, KFC managed to open a franchise of Taco Bell restaurants (the first store was opened in Dubai in November 2008).
Figure 24 | Number of KFC’s Outlets and Meals Served Figure 25 | KFC’s Presence (number of cities)
323 433 543 669885
1,064 1,157
3145 55
70
120
140 155
020406080100120140160180
0200400600800
1,0001,2001,400
1995 1998 2001 2004 2007 2008 2009
No.
of M
eals
(mn)
No.
of O
utle
ts
Outlets Meals
29
4554 56
71 7479
0102030405060708090
1995 1998 2001 2004 2007 2008 2009
Source: Company Reports Source: Company Reports
KFC operates over 1,000 restaurants in the Middle East

REGIONAL FOOD | KFC
June 21, 2010
25
INITI
ATIO
N O
F C
OVE
RAG
E
Please Read Last Page for Contact Details and Important Disclaimer
Figure 26 |KFC’s Restaurants and Stores across MENA Figure 27 | Geographic Revenues Breakdown of the Restaurants Sector (2009)
Restaurants & Stores Year of Launch Description Outlets
Chicken Tikka 1972KFC’s first owned restaurant. This chain is spread across Egypt, Kuwait, Oman, Saudi Arabia, and the UAE .
20
Kentucky Fried Chicken 1973
Kentucky Fried Chicken is KFC's fastest growing chain in Bahrain, Egypt, Jordan, Kuwait, Lebanon, Morocco, Oman, Qatar, Saudi Arabia, Syria, and the UAE.
400
Samadi 1975 KFC introduced Samadi sweets in Egypt and Kuwait. 50
Pizza Hut 1979Pizza Hut was first launched in the UAE followed by Egypt; it subsequently reached Bahrain and Jordan.
125
Hardee’s 1980Hardee’s, the US sandwich chain, is located in Bahrain, Egypt, Kuwait, Jordan, Lebanon, Oman, Qatar, Saudi Arabia, and the UAE.
170
Baskin Robbins 1986 This ice cream chain is present in Egypt, Kuwait, and Lebanon. 63
Fish Market 1990 Fish Market restaurants offer seafood cuisine in Egypt and recently in Kuwait. 7
Grand Café 1993 The first Grand Café was opened in Alexandria, Egypt. 8
TGIF’s 1996
With TGIF’s, KFC became the first company to open an international casual dining restaurant chain in the Middle East; and is spread across Egypt, Kuwait, Lebanon, Qatar, Saudi Arabia, and the UAE.
15
Costa Coffee 2004
KFC engaged in the branded coffee shop service by launching Costa Coffee in Egypt followed by Jordan, Lebanon, Syria, and Turkey.
NA
Krispy Kreme 2006Krispy Kreme is a leading branded retailer of doughnuts in Kuwait, the UAE, Saudi Arabia, Qatar, Bahrain, and Lebanon.
80
South Gulf37%
Egypt and Africa20%
Saudi Arabia18%
Kuwait17%
Sham and others
8%
* Number of outlets as of August, 2009
Source: Company’s website
Source: Company reports
Industries Sector
Through its Industries sector, KFC maintains a strong market share in the fields of meat processing, dairy production, and canned and frozen vegetables. The company’s processed food retail business targets the middle and high-end income classes that prefer buying ready-to-eat foods for daily consumption.
Meat processing: Through the National Company for Food Industries, KFC has an important position in the meat processing market in the Middle East. Despite the challenges faced in terms of high costs, scarcity and increasing competition, through developing its relationship with suppliers, KFC has managed to combat these challenges and provide products at reasonable prices without reducing their quality. In 2009, the company held a 38% share of the frozen meat market in KSA and 29% in Qatar. Also, KFC had a 36% and 61% share of frozen meat and cooked meat in Kuwait. In 2007, KFC had a 12% share in Bahrain, and 11% in UAE.
Strong share in the Egyptian dairy sector: In Egypt, Greenland Company (a 75% subsidiary of KFC) maintained an estimated market share of 40% in the Egyptian dairy sector in 2009. Greenland exports its products to more than 10 Arab countries and 4 European Countries.
Frozen vegetables: KFC engages in agricultural production and processing through its Egyptian subsidiary, International Company for Agricultural Development (Farm Frites), which is the leading company in the Arab world for producing frozen potato. The company adopts a backward integration strategy in the cultivation of potato necessary for the production process. Farm
A considerable market share in the GCC meat markets
Greenland had a 40% share of the Egyptian dairy market in 2009
REGIONAL FOOD | KFC
June 21, 2010
26
INITI
ATIO
N O
F C
OVE
RAG
E
Please Read Last Page for Contact Details and Important Disclaimer
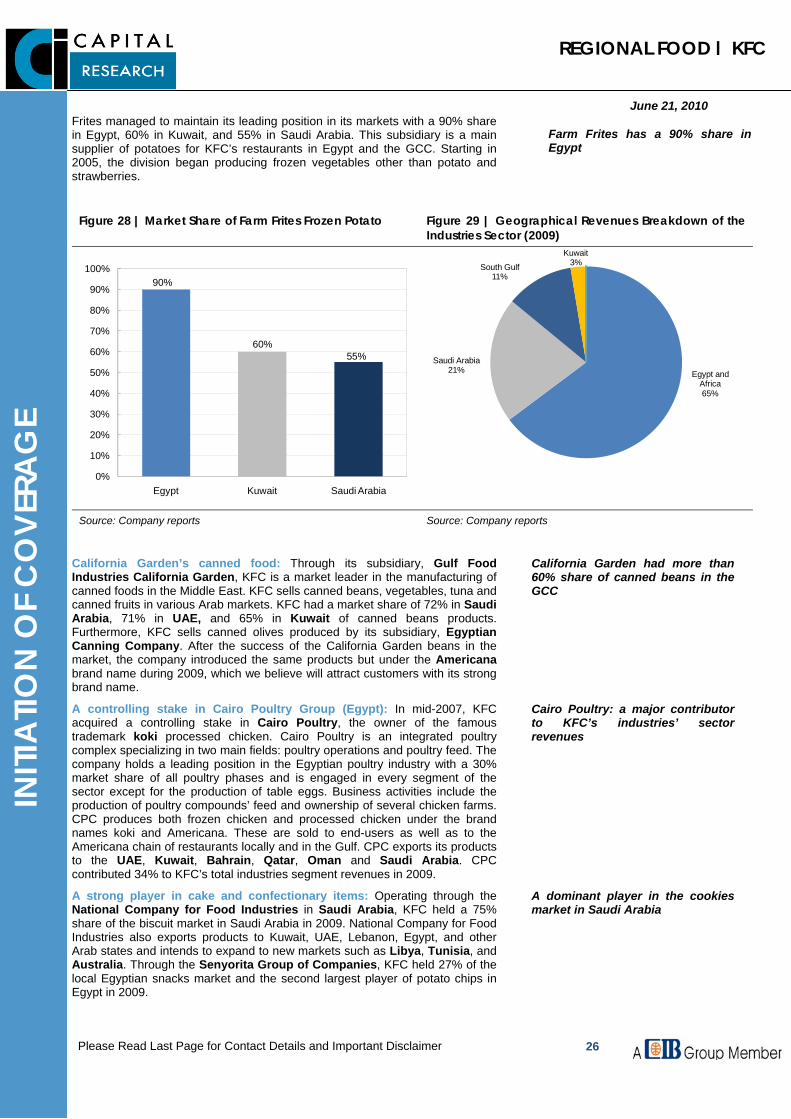
Frites managed to maintain its leading position in its markets with a 90% share in Egypt, 60% in Kuwait, and 55% in Saudi Arabia. This subsidiary is a main supplier of potatoes for KFC’s restaurants in Egypt and the GCC. Starting in 2005, the division began producing frozen vegetables other than potato and strawberries.
Figure 28 | Market Share of Farm Frites Frozen Potato Figure 29 | Geographical Revenues Breakdown of the Industries Sector (2009)
90%
60%55%
0%
10%
20%
30%
40%
50%
60%
70%
80%
90%
100%
Egypt Kuwait Saudi Arabia
Egypt and Africa65%
Saudi Arabia21%
South Gulf11%
Kuwait3%
Source: Company reports Source: Company reports
California Garden’s canned food: Through its subsidiary, Gulf Food Industries California Garden, KFC is a market leader in the manufacturing of canned foods in the Middle East. KFC sells canned beans, vegetables, tuna and canned fruits in various Arab markets. KFC had a market share of 72% in Saudi Arabia, 71% in UAE, and 65% in Kuwait of canned beans products. Furthermore, KFC sells canned olives produced by its subsidiary, Egyptian Canning Company. After the success of the California Garden beans in the market, the company introduced the same products but under the Americana brand name during 2009, which we believe will attract customers with its strong brand name.
A controlling stake in Cairo Poultry Group (Egypt): In mid-2007, KFC acquired a controlling stake in Cairo Poultry, the owner of the famous trademark koki processed chicken. Cairo Poultry is an integrated poultry complex specializing in two main fields: poultry operations and poultry feed. The company holds a leading position in the Egyptian poultry industry with a 30% market share of all poultry phases and is engaged in every segment of the sector except for the production of table eggs. Business activities include the production of poultry compounds’ feed and ownership of several chicken farms. CPC produces both frozen chicken and processed chicken under the brand names koki and Americana. These are sold to end-users as well as to the Americana chain of restaurants locally and in the Gulf. CPC exports its products to the UAE, Kuwait, Bahrain, Qatar, Oman and Saudi Arabia. CPC contributed 34% to KFC’s total industries segment revenues in 2009.
A strong player in cake and confectionary items: Operating through the National Company for Food Industries in Saudi Arabia, KFC held a 75% share of the biscuit market in Saudi Arabia in 2009. National Company for Food Industries also exports products to Kuwait, UAE, Lebanon, Egypt, and other Arab states and intends to expand to new markets such as Libya, Tunisia, and Australia. Through the Senyorita Group of Companies, KFC held 27% of the local Egyptian snacks market and the second largest player of potato chips in Egypt in 2009.
Farm Frites has a 90% share in Egypt
California Garden had more than 60% share of canned beans in the GCC
Cairo Poultry: a major contributor to KFC’s industries’ sector revenues
A dominant player in the cookies market in Saudi Arabia

REGIONAL FOOD | KFC
June 21, 2010
27
INITI
ATIO
N O
F C
OVE
RAG
E
Please Read Last Page for Contact Details and Important Disclaimer
Water bottling in the UAE: KFC also has presence in UAE’s water bottling sector through its subsidiary Gulfa Mineral Water and Processing Industries.
Commercial and Retail Sectors
Heinz for Processed Tomato and Cadbury chocolates: This segment handles distribution agencies in Kuwait. These agencies distribute Heinz ketchup, Cadbury chocolates, California Garden for canned foods, and Americana-branded products such as tuna, canned foods, and cheese. In 2009, the sector covered 35% of the croissant market in Kuwait.
C. Recent Developments
In December 2009, it was announced that Kuwait Food Company and its two subsidiaries had sold their 49% combined stake in Cairo for Food Industrial Company (Heinz) in a deal worth USD61.8mn. KFC recorded a capital gain of KWD16.8mn (equivalent to USD56mn) from the transaction.
KFC distributed a DPS of 60% of par value (equivalent to KWD0.06/share) on March 21st, 2010.
Distributes Heinz, Cadbury, and California Garden canned food in Kuwait
Divesting its stake in Heinz in a deal worth USD61.8mn

REGIONAL FOOD | KFC
June 21, 2010
28
INITI
ATIO
N O
F C
OVE
RAG
E
Please Read Last Page for Contact Details and Important Disclaimer
V. Operational and Financial Analysis
A. Operational Analysis
i. A partial backward integration business model
KFC adopts partially a backward integration strategy in its production process in order to control raw material costs and provide a cushion against supply shocks by reducing the company’s dependence on external suppliers.
Figure 30 | KFC’s Business Model
Source: CICR analysis
Cultivation and land reclamation initiatives: The company strives to ensure the supply of basic raw materials and agricultural crops for its production process by reclaiming and cultivating around 2000 acres of land (half of it being olive trees) through its two subsidiaries, Americana Company for Reclaiming and Cultivating Land and Americana Company for Agricultural Development.
Furthermore, KFC’s subsidiary Farm Frites Company also enjoys the advantage of backward integration through the International Company for Agricultural Processing and Production, which cultivates potatoes and strawberries necessary for the production process. KFC plans to cultivate around 30k acres during the next few years. Cairo poultry enhances the backward integration strategy: CPC products are sold to end-users as well as to Americana chain of restaurants locally and in the Gulf.
ii. Penetrating new markets
In addition to maintaining its presence in 14 countries in MENA, KFC plans to penetrate new markets, such as Korea, Thailand, and parts of northern and southern Africa. The company also seeks to expand in a greater number of cities in the countries in which it operates. In 2009, KFC opened two new restaurants in Kazakhstan and six new restaurants in Iran. Moreover, KFC seeks to open 150 new restaurants in 2010.
Penetrating the Far East
Backward Integration (cultivating crops and
poultry business) Industries sector
Restaurants sector
REGIONAL FOOD | KFC
June 21, 2010
29
INITI
ATIO
N O
F C
OVE
RAG
E
Please Read Last Page for Contact Details and Important Disclaimer
B. Financial Analysis i. Dec 2005–Dec 2009
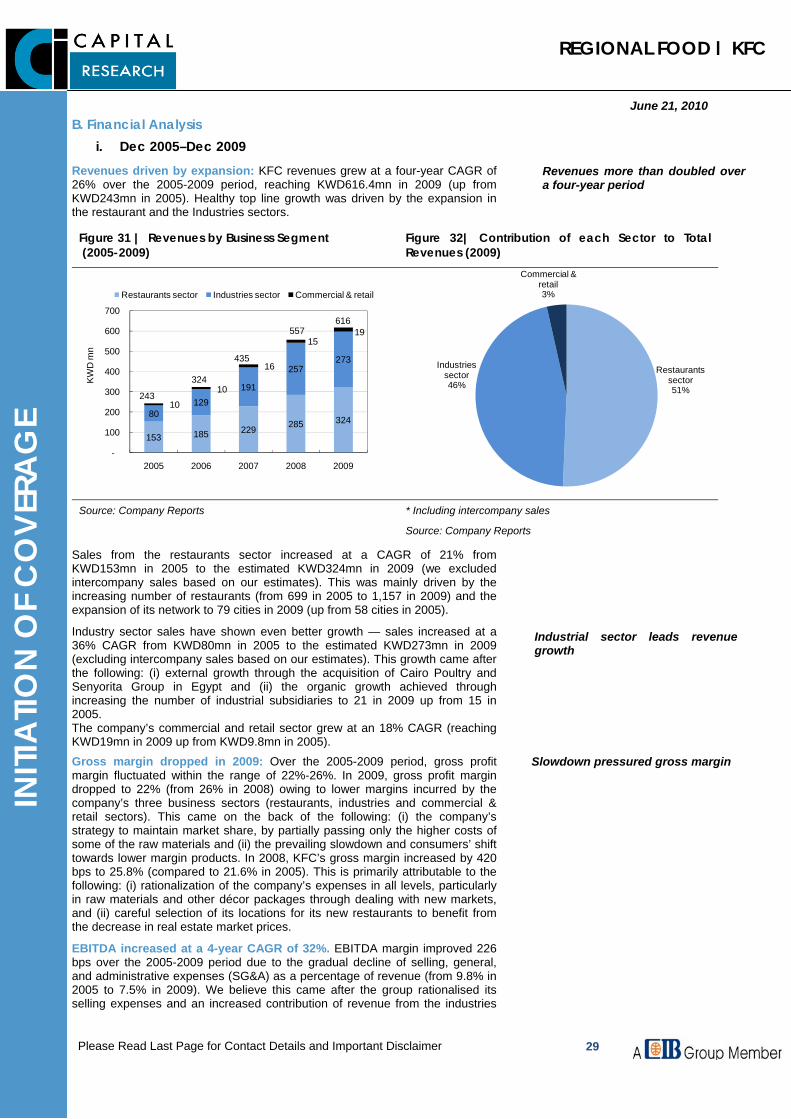
Revenues driven by expansion: KFC revenues grew at a four-year CAGR of 26% over the 2005-2009 period, reaching KWD616.4mn in 2009 (up from KWD243mn in 2005). Healthy top line growth was driven by the expansion in the restaurant and the Industries sectors.
Figure 31 | Revenues by Business Segment (2005-2009)
Figure 32| Contribution of each Sector to Total Revenues (2009)
153 185 229 285 32480
129191
257273
10
10
16
1519
243
324
435
557 616
-
100
200
300
400
500
600
700
2005 2006 2007 2008 2009
KW
D m
n
Restaurants sector Industries sector Commercial & retail
Restaurants sector51%
Industries sector46%
Commercial & retail3%
Source: Company Reports * Including intercompany sales
Source: Company Reports
Sales from the restaurants sector increased at a CAGR of 21% from KWD153mn in 2005 to the estimated KWD324mn in 2009 (we excluded intercompany sales based on our estimates). This was mainly driven by the increasing number of restaurants (from 699 in 2005 to 1,157 in 2009) and the expansion of its network to 79 cities in 2009 (up from 58 cities in 2005).
Industry sector sales have shown even better growth — sales increased at a 36% CAGR from KWD80mn in 2005 to the estimated KWD273mn in 2009 (excluding intercompany sales based on our estimates). This growth came after the following: (i) external growth through the acquisition of Cairo Poultry and Senyorita Group in Egypt and (ii) the organic growth achieved through increasing the number of industrial subsidiaries to 21 in 2009 up from 15 in 2005. The company’s commercial and retail sector grew at an 18% CAGR (reaching KWD19mn in 2009 up from KWD9.8mn in 2005).
Gross margin dropped in 2009: Over the 2005-2009 period, gross profit margin fluctuated within the range of 22%-26%. In 2009, gross profit margin dropped to 22% (from 26% in 2008) owing to lower margins incurred by the company’s three business sectors (restaurants, industries and commercial & retail sectors). This came on the back of the following: (i) the company’s strategy to maintain market share, by partially passing only the higher costs of some of the raw materials and (ii) the prevailing slowdown and consumers’ shift towards lower margin products. In 2008, KFC’s gross margin increased by 420 bps to 25.8% (compared to 21.6% in 2005). This is primarily attributable to the following: (i) rationalization of the company’s expenses in all levels, particularly in raw materials and other décor packages through dealing with new markets, and (ii) careful selection of its locations for its new restaurants to benefit from the decrease in real estate market prices.
EBITDA increased at a 4-year CAGR of 32%. EBITDA margin improved 226 bps over the 2005-2009 period due to the gradual decline of selling, general, and administrative expenses (SG&A) as a percentage of revenue (from 9.8% in 2005 to 7.5% in 2009). We believe this came after the group rationalised its selling expenses and an increased contribution of revenue from the industries
Revenues more than doubled over a four-year period
Industrial sector leads revenue growth
Slowdown pressured gross margin
REGIONAL FOOD | KFC
June 21, 2010
30
INITI
ATIO
N O
F C
OVE
RAG
E
Please Read Last Page for Contact Details and Important Disclaimer
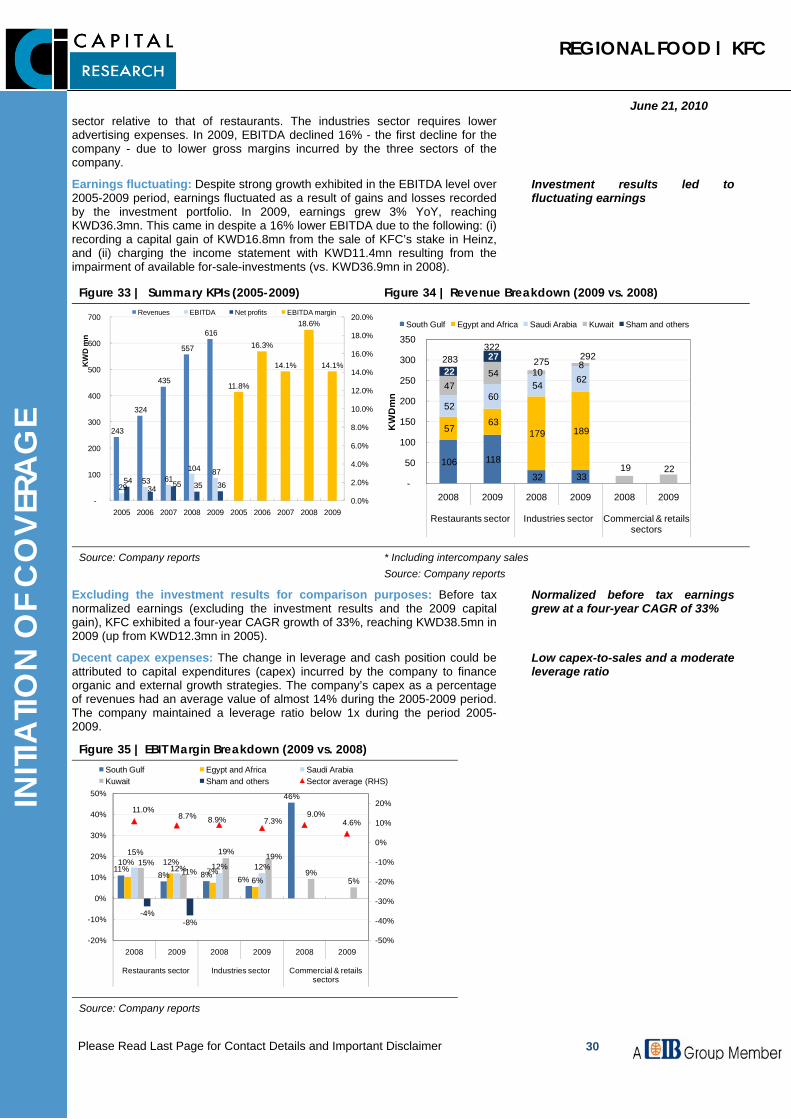
sector relative to that of restaurants. The industries sector requires lower advertising expenses. In 2009, EBITDA declined 16% - the first decline for the company - due to lower gross margins incurred by the three sectors of the company.
Earnings fluctuating: Despite strong growth exhibited in the EBITDA level over 2005-2009 period, earnings fluctuated as a result of gains and losses recorded by the investment portfolio. In 2009, earnings grew 3% YoY, reaching KWD36.3mn. This came in despite a 16% lower EBITDA due to the following: (i) recording a capital gain of KWD16.8mn from the sale of KFC’s stake in Heinz, and (ii) charging the income statement with KWD11.4mn resulting from the impairment of available for-sale-investments (vs. KWD36.9mn in 2008).
Figure 33 | Summary KPIs (2005-2009) Figure 34 | Revenue Breakdown (2009 vs. 2008)
243
324
435
557
616
29 53 61
104 87 54
34 55 35 36
11.8%
16.3%
14.1%
18.6%
14.1%
0.0%
2.0%
4.0%
6.0%
8.0%
10.0%
12.0%
14.0%
16.0%
18.0%
20.0%
-
100
200
300
400
500
600
700
2005 2006 2007 2008 2009 2005 2006 2007 2008 2009
KW
D m
n
Revenues EBITDA Net profits EBITDA margin
106 118
32 33
57 63
179 189
52 60
54 62 47
54 10 8
19 22
22 27 283
322 275 292
-
50
100
150
200
250
300
350
2008 2009 2008 2009 2008 2009
Restaurants sector Industries sector Commercial & retails sectors
KW
Dm
n
South Gulf Egypt and Africa Saudi Arabia Kuwait Sham and others
Source: Company reports * Including intercompany sales Source: Company reports
Excluding the investment results for comparison purposes: Before tax normalized earnings (excluding the investment results and the 2009 capital gain), KFC exhibited a four-year CAGR growth of 33%, reaching KWD38.5mn in 2009 (up from KWD12.3mn in 2005).
Decent capex expenses: The change in leverage and cash position could be attributed to capital expenditures (capex) incurred by the company to finance organic and external growth strategies. The company’s capex as a percentage of revenues had an average value of almost 14% during the 2005-2009 period. The company maintained a leverage ratio below 1x during the period 2005-2009.
Figure 35 | EBIT Margin Breakdown (2009 vs. 2008)
11%8% 8% 6%
46%
10% 12%7%
6%
15%
12% 12% 12%15%11%
19% 19%
9%5%
-4%-8%
11.0%8.7% 8.9% 7.3%
9.0%4.6%
-50%
-40%
-30%
-20%
-10%
0%
10%
20%
-20%
-10%
0%
10%
20%
30%
40%
50%
2008 2009 2008 2009 2008 2009
Restaurants sector Industries sector Commercial & retails sectors
South Gulf Egypt and Africa Saudi ArabiaKuwait Sham and others Sector average (RHS)
Source: Company reports
Investment results led to fluctuating earnings
Normalized before tax earnings grew at a four-year CAGR of 33%
Low capex-to-sales and a moderate leverage ratio
REGIONAL FOOD | KFC
June 21, 2010
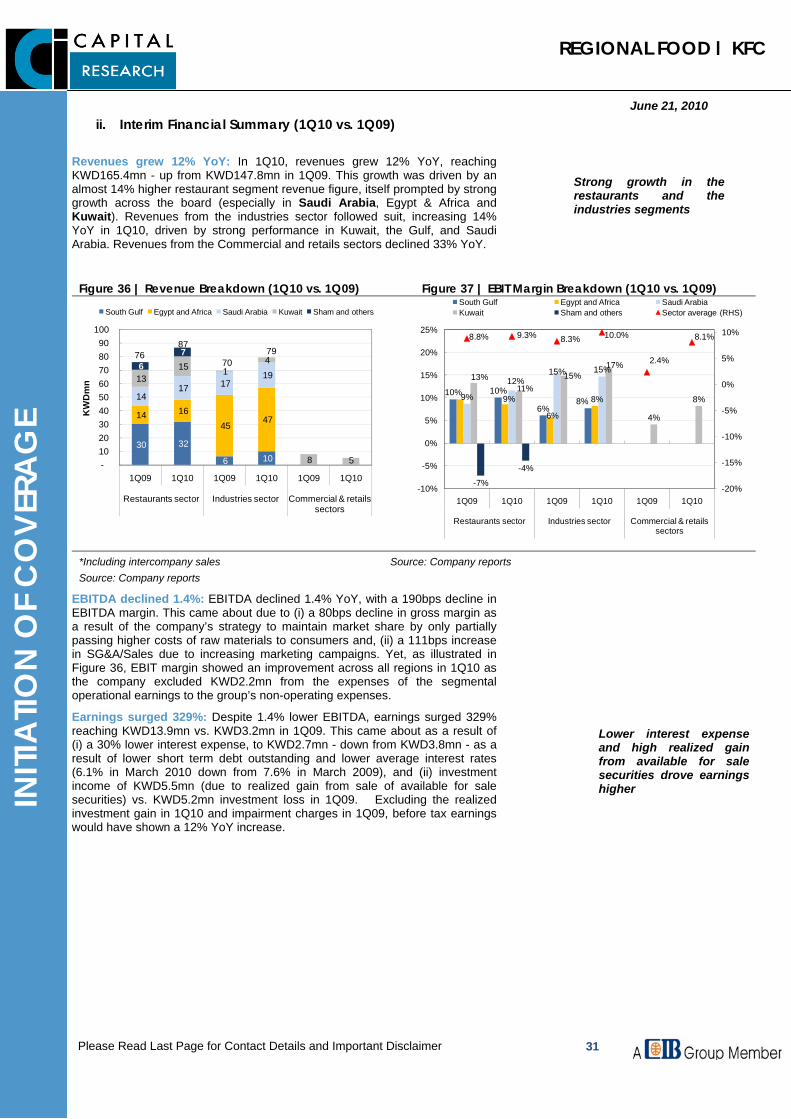
31
INITI
ATIO
N O
F C
OVE
RAG
E
Please Read Last Page for Contact Details and Important Disclaimer
ii. Interim Financial Summary (1Q10 vs. 1Q09)
Revenues grew 12% YoY: In 1Q10, revenues grew 12% YoY, reaching KWD165.4mn - up from KWD147.8mn in 1Q09. This growth was driven by an almost 14% higher restaurant segment revenue figure, itself prompted by strong growth across the board (especially in Saudi Arabia, Egypt & Africa and Kuwait). Revenues from the industries sector followed suit, increasing 14% YoY in 1Q10, driven by strong performance in Kuwait, the Gulf, and Saudi Arabia. Revenues from the Commercial and retails sectors declined 33% YoY.
Figure 36 | Revenue Breakdown (1Q10 vs. 1Q09) Figure 37 | EBIT Margin Breakdown (1Q10 vs. 1Q09)
30 32
6 10
14 16 45
47
14 17 17
19 13 15 1
4
8 5
6 7
-
76 87
70 79
-10 20 30 40 50 60 70 80 90
100
1Q09 1Q10 1Q09 1Q10 1Q09 1Q10
Restaurants sector Industries sector Commercial & retails sectors
KW
Dm
n
South Gulf Egypt and Africa Saudi Arabia Kuwait Sham and others
10% 10%
6%8%9%
6%
8%9%
12%15% 15%
13%11%
15%17%
4%
8%
-7%
-4%
8.8% 9.3% 8.3% 10.0%
2.4%
8.1%
-20%
-15%
-10%
-5%
0%
5%
10%
-10%
-5%
0%
5%
10%
15%
20%
25%
1Q09 1Q10 1Q09 1Q10 1Q09 1Q10
Restaurants sector Industries sector Commercial & retails sectors
South Gulf Egypt and Africa Saudi ArabiaKuwait Sham and others Sector average (RHS)
*Including intercompany sales Source: Company reports
Source: Company reports
EBITDA declined 1.4%: EBITDA declined 1.4% YoY, with a 190bps decline in EBITDA margin. This came about due to (i) a 80bps decline in gross margin as a result of the company’s strategy to maintain market share by only partially passing higher costs of raw materials to consumers and, (ii) a 111bps increase in SG&A/Sales due to increasing marketing campaigns. Yet, as illustrated in Figure 36, EBIT margin showed an improvement across all regions in 1Q10 as the company excluded KWD2.2mn from the expenses of the segmental operational earnings to the group’s non-operating expenses.
Earnings surged 329%: Despite 1.4% lower EBITDA, earnings surged 329% reaching KWD13.9mn vs. KWD3.2mn in 1Q09. This came about as a result of (i) a 30% lower interest expense, to KWD2.7mn - down from KWD3.8mn - as a result of lower short term debt outstanding and lower average interest rates (6.1% in March 2010 down from 7.6% in March 2009), and (ii) investment income of KWD5.5mn (due to realized gain from sale of available for sale securities) vs. KWD5.2mn investment loss in 1Q09. Excluding the realized investment gain in 1Q10 and impairment charges in 1Q09, before tax earnings would have shown a 12% YoY increase.
Strong growth in the restaurants and the industries segments
Lower interest expense and high realized gain from available for sale securities drove earnings higher
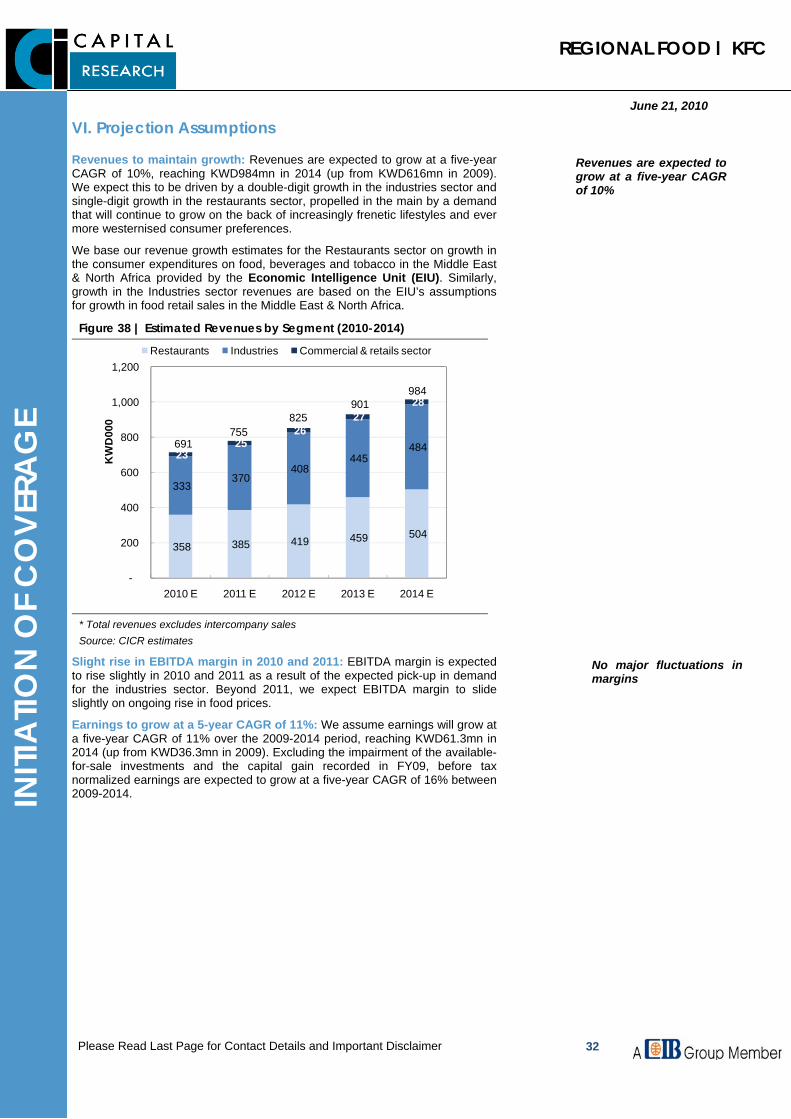
REGIONAL FOOD | KFC
June 21, 2010
32
INITI
ATIO
N O
F C
OVE
RAG
E
Please Read Last Page for Contact Details and Important Disclaimer
VI. Projection Assumptions
Revenues to maintain growth: Revenues are expected to grow at a five-year CAGR of 10%, reaching KWD984mn in 2014 (up from KWD616mn in 2009). We expect this to be driven by a double-digit growth in the industries sector and single-digit growth in the restaurants sector, propelled in the main by a demand that will continue to grow on the back of increasingly frenetic lifestyles and ever more westernised consumer preferences.
We base our revenue growth estimates for the Restaurants sector on growth in the consumer expenditures on food, beverages and tobacco in the Middle East & North Africa provided by the Economic Intelligence Unit (EIU). Similarly, growth in the Industries sector revenues are based on the EIU’s assumptions for growth in food retail sales in the Middle East & North Africa.
Figure 38 | Estimated Revenues by Segment (2010-2014)
358 385 419 459 504
333 370
408 445
484 23
25 26
27 28
691 755
825 901
984
-
200
400
600
800
1,000
1,200
2010 E 2011 E 2012 E 2013 E 2014 E
KW
D00
0
Restaurants Industries Commercial & retails sector
* Total revenues excludes intercompany sales Source: CICR estimates
Slight rise in EBITDA margin in 2010 and 2011: EBITDA margin is expected to rise slightly in 2010 and 2011 as a result of the expected pick-up in demand for the industries sector. Beyond 2011, we expect EBITDA margin to slide slightly on ongoing rise in food prices.
Earnings to grow at a 5-year CAGR of 11%: We assume earnings will grow at a five-year CAGR of 11% over the 2009-2014 period, reaching KWD61.3mn in 2014 (up from KWD36.3mn in 2009). Excluding the impairment of the available-for-sale investments and the capital gain recorded in FY09, before tax normalized earnings are expected to grow at a five-year CAGR of 16% between 2009-2014.
Revenues are expected to grow at a five-year CAGR of 10%
No major fluctuations in margins

REGIONAL FOOD | KFC
June 21, 2010
33
INITI
ATIO
N O
F C
OVE
RAG
E
Please Read Last Page for Contact Details and Important Disclaimer
Company Financials (2007-2014F)
Balance Sheet (KWD mn) 2007A 2008A 2009A 2010F 2011F 2012F 2013F 2014FAssetsCash & Cash Equivalent 35 22 37 42 46 50 55 60Net Receivables 35 41 43 51 55 60 66 72Total Inventory 68 91 74 96 104 114 125 137Advance Payment 0 0 0 0 0 0 0 0Other Trading Assets 53 0 0 0 0 0 0 0Other Current Assets 0 0 0 0 0 0 0 0Total Current Assets 190 154 155 189 206 225 246 269Net Plant 168 224 233 242 252 261 270 279Long-Term Investments 187 127 150 177 177 177 177 177Other Non-Current Assets 26 34 34 39 41 44 46 49Other Non-current Assets 2 2 4 3 3 3 3 3Intangibles 11 14 14 13 13 12 12 12Total Assets 584 555 590 663 692 721 755 788
Liabilities & Shareholders' EquityShort-Term Debt 77 74 43 68 99 130 149 141CP of Long Term Debt 0 36 28 35 35 23 0 0Accounts Payable 44 47 59 60 65 71 78 85Accrued Expenses 15 18 23 23 25 28 30 33Down Payments 0 0 0 0 0 0 0 0Taxes Payable 1 1 0 0 0 0 0 0Dividends Payable 1 3 3 30 36 38 42 47Other Current Liabilities 35 20 15 15 17 18 20 22Total Current Liabilities 174 198 170 232 276 308 319 327Total Long-Term Debt 42 56 63 58 23 0 0 0Other Non-Current Liabilities 0 0 0 0 0 0 0 0Total Liabilities 216 254 233 290 299 308 319 327Other Provisions 14 17 32 32 32 32 32 32Minority Interest 35 37 42 49 57 66 76 87Shareholders' Equity 319 246 283 292 303 315 328 342Total Liab. & Equity 584 555 590 663 692 721 755 788
0.00 0.00 0.00 -0.17 0.42 0.11 -0.48 1.06Income Statement (KWD mn) 2007A 2008A 2009A 2010F 2011F 2012F 2013F 2014FRevenues 435 557 616 691 755 825 901 984Cost of Revenues (339) (413) (483) (531) (577) (632) (692) (756)Gross Profit 96 144 133 160 177 193 209 228SG&A (35) (40) (46) (58) (63) (68) (75) (82)EBITDA 61 104 87 102 115 124 135 146Depreciation & Amortization (19) (28) (35) (37) (41) (46) (51) (57)EBIT 42 76 52 64 73 78 83 90Interest Expense (8) (10) (13) (10) (13) (13) (12) (10)Interest Income 0 0 0 0 0 0 0 0Investment Income 29 (20) (5) (3) 0 0 0 0Other Non-Operating Income 1 (1) 17 1 1 1 1 1Other Non-Operating Expenses 0 0 0 0 0 0 0 0EBT 64 45 50 52 61 66 72 80Taxes (5) (4) (7) (5) (6) (7) (7) (8)NPAT 59 41 43 47 55 59 65 72Minority Interest (4) (6) (6) (7) (8) (9) (10) (11)Extraordinary Items 0 0 0 0 0 0 0 0Attributable Profits 55 35 36 40 47 50 55 61
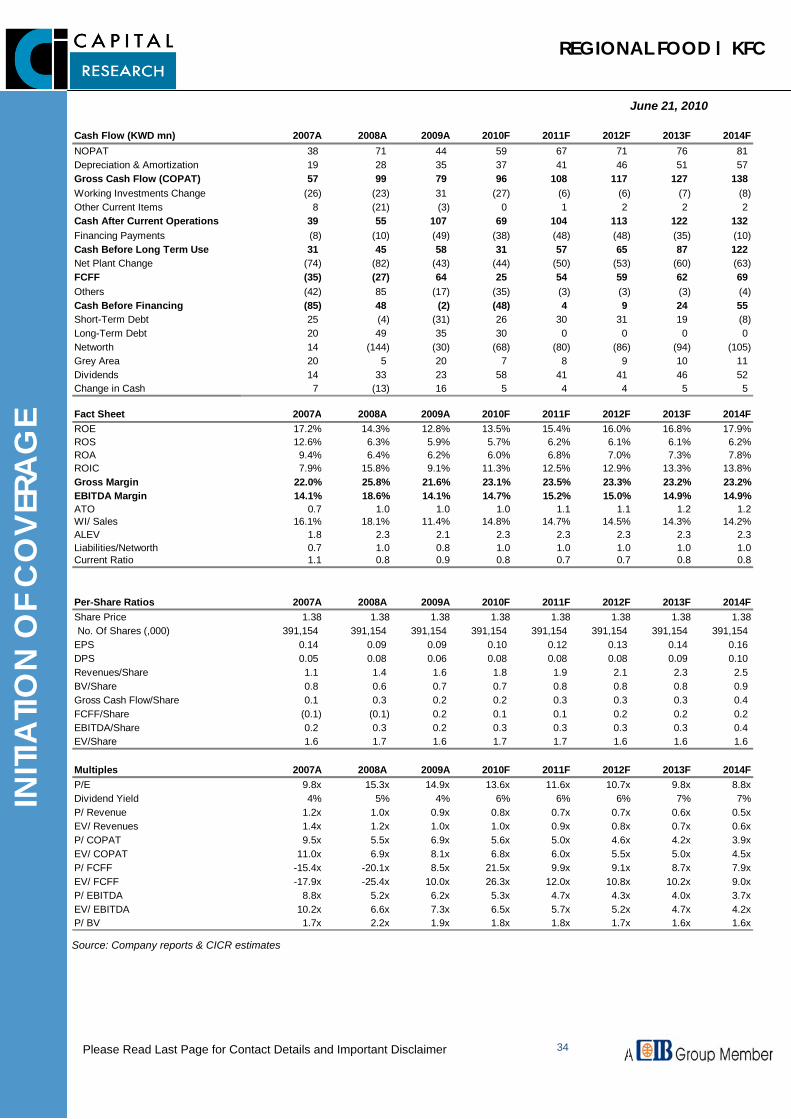
REGIONAL FOOD | KFC
June 21, 2010
34
INITI
ATIO
N O
F C
OVE
RAG
E
Please Read Last Page for Contact Details and Important Disclaimer
Cash Flow (KWD mn) 2007A 2008A 2009A 2010F 2011F 2012F 2013F 2014FNOPAT 38 71 44 59 67 71 76 81Depreciation & Amortization 19 28 35 37 41 46 51 57Gross Cash Flow (COPAT) 57 99 79 96 108 117 127 138Working Investments Change (26) (23) 31 (27) (6) (6) (7) (8)Other Current Items 8 (21) (3) 0 1 2 2 2Cash After Current Operations 39 55 107 69 104 113 122 132Financing Payments (8) (10) (49) (38) (48) (48) (35) (10)Cash Before Long Term Use 31 45 58 31 57 65 87 122Net Plant Change (74) (82) (43) (44) (50) (53) (60) (63)FCFF (35) (27) 64 25 54 59 62 69Others (42) 85 (17) (35) (3) (3) (3) (4)Cash Before Financing (85) 48 (2) (48) 4 9 24 55Short-Term Debt 25 (4) (31) 26 30 31 19 (8)Long-Term Debt 20 49 35 30 0 0 0 0Networth 14 (144) (30) (68) (80) (86) (94) (105)Grey Area 20 5 20 7 8 9 10 11Dividends 14 33 23 58 41 41 46 52Change in Cash 7 (13) 16 5 4 4 5 5
Fact Sheet 2007A 2008A 2009A 2010F 2011F 2012F 2013F 2014FROE 17.2% 14.3% 12.8% 13.5% 15.4% 16.0% 16.8% 17.9%ROS 12.6% 6.3% 5.9% 5.7% 6.2% 6.1% 6.1% 6.2%ROA 9.4% 6.4% 6.2% 6.0% 6.8% 7.0% 7.3% 7.8%ROIC 7.9% 15.8% 9.1% 11.3% 12.5% 12.9% 13.3% 13.8%Gross Margin 22.0% 25.8% 21.6% 23.1% 23.5% 23.3% 23.2% 23.2%EBITDA Margin 14.1% 18.6% 14.1% 14.7% 15.2% 15.0% 14.9% 14.9%ATO 0.7 1.0 1.0 1.0 1.1 1.1 1.2 1.2WI/ Sales 16.1% 18.1% 11.4% 14.8% 14.7% 14.5% 14.3% 14.2%ALEV 1.8 2.3 2.1 2.3 2.3 2.3 2.3 2.3Liabilities/Networth 0.7 1.0 0.8 1.0 1.0 1.0 1.0 1.0Current Ratio 1.1 0.8 0.9 0.8 0.7 0.7 0.8 0.8
Per-Share Ratios 2007A 2008A 2009A 2010F 2011F 2012F 2013F 2014FShare Price 1.38 1.38 1.38 1.38 1.38 1.38 1.38 1.38No. Of Shares (,000) 391,154 391,154 391,154 391,154 391,154 391,154 391,154 391,154
EPS 0.14 0.09 0.09 0.10 0.12 0.13 0.14 0.16DPS 0.05 0.08 0.06 0.08 0.08 0.08 0.09 0.10 Revenues/Share 1.1 1.4 1.6 1.8 1.9 2.1 2.3 2.5 BV/Share 0.8 0.6 0.7 0.7 0.8 0.8 0.8 0.9 Gross Cash Flow/Share 0.1 0.3 0.2 0.2 0.3 0.3 0.3 0.4 FCFF/Share (0.1) (0.1) 0.2 0.1 0.1 0.2 0.2 0.2 EBITDA/Share 0.2 0.3 0.2 0.3 0.3 0.3 0.3 0.4 EV/Share 1.6 1.7 1.6 1.7 1.7 1.6 1.6 1.6
Multiples 2007A 2008A 2009A 2010F 2011F 2012F 2013F 2014FP/E 9.8x 15.3x 14.9x 13.6x 11.6x 10.7x 9.8x 8.8xDividend Yield 4% 5% 4% 6% 6% 6% 7% 7%P/ Revenue 1.2x 1.0x 0.9x 0.8x 0.7x 0.7x 0.6x 0.5xEV/ Revenues 1.4x 1.2x 1.0x 1.0x 0.9x 0.8x 0.7x 0.6xP/ COPAT 9.5x 5.5x 6.9x 5.6x 5.0x 4.6x 4.2x 3.9xEV/ COPAT 11.0x 6.9x 8.1x 6.8x 6.0x 5.5x 5.0x 4.5xP/ FCFF -15.4x -20.1x 8.5x 21.5x 9.9x 9.1x 8.7x 7.9xEV/ FCFF -17.9x -25.4x 10.0x 26.3x 12.0x 10.8x 10.2x 9.0xP/ EBITDA 8.8x 5.2x 6.2x 5.3x 4.7x 4.3x 4.0x 3.7xEV/ EBITDA 10.2x 6.6x 7.3x 6.5x 5.7x 5.2x 4.7x 4.2xP/ BV 1.7x 2.2x 1.9x 1.8x 1.8x 1.7x 1.6x 1.6x Source: Company reports & CICR estimates

Contacts and Disclaimer:
CI CAPITAL RESEARCH
Mark Rorison | Group Director, Head of Research [email protected]
Amr Hussein Elalfy, CFA | Director
[email protected] Mona Mansour | Director
■■
CI CAPITAL SECURITIES BROKERAGE (EGYPT & UAE)
Amr Mostafa | Managing Director
DYNAMIC SECURITIES
Ahmed Roushdy | Managing Director [email protected]
DISCLAIMER
The information used to produce this market commentary is based on sources that CI Capital Research (CICR) believes to be reliable and accu-rate. This information has not been independently verif ied and may be condensed or incomplete. CICR does not make any guarantee, representa-tion or warranty and accepts no responsibility or liability to the accuracy and completeness of such information. Expression of opinion contained herein is based on certain assumptions and w ith the use of specif ic f inancial techniques that ref lect the personal opinion of the authors of the com-mentary and is subject to change without notice. It is acknowledged that different assumptions can always be made and that there is a wide choice of techniques that can be adopted each of which can lead to a different conclusion. Therefore, all that is stated herein is of an indicative and infor-mative nature as forward-looking statements, projections, and fair values quoted may not be realized. Accordingly, CICR does not take any re-sponsibility for decisions made on the basis on the content of this commentary. This commentary is made for the sole use of CICR’s customers and no part or excerpt of its content may be redistributed, reproduced or conveyed in any form, w ritten or oral, to any third party without the prior written consent of CICR. This commentary does not constitute a solicitation or an offer to buy or sell securities.
CI CAPITAL HOLDING
8, Nadi El-Seid Street, Third Floor Dokki, Giza
Egypt
Reuters pages: COIW, COIX, COIY, and COIZ
Bloomberg page: COIB <GO>
For more information, please contact CI Capital Research on +2
(02) 33 38 62 59, send e-mail to [email protected] or visit our website at www.cich.com.eg
RATING SYSTEM In February 2009, CI Capital Research (CICR) launched a new rating system to give analysts more freedom to be market responsive. This is to make one element of our research more dynamic, namely the advertising of target prices and recommendations. What we did not change is our assessment of the Long Term Fair Value (LTFV), nor have we stopped our detailed industry and company research. What we did is changing the target price to trade in the balance of where a share should trade and where we think it w ill trade. LTFV: As before we continue to estimate a fundamental valuation, largely DCF and/or NAV based. Target Price: The target price, which is not necessarily the LTFV, is where the analyst, given all (qualitative as well as f inancial) information avail-able, thinks the share price can get to within the next 3-12 months. This can be changed at any time on changing facts, and perceptions. Recommendations: Our new rating system falls out from the total return relating to the share price performance to the target price, and including any distributions as may not be included in the target price calculation. This is shown in the table below, and to be BUY must return over 19%, an arbitrary hurdle rate we think reasonable given prevailing interest rates and risks. (Please see table below.) Recommendation structure: Change to Target Price
Strong BUY > 30% Strong Conviction BUY > 20% < 30% Hold > 10% < 20% Underw eight > 0% < 10% SELL < 0%