Keijiro Otsuka Kaoru Sugihara Editors Paths to the ...
304
Paths to the Emerging State in Asia and Africa Keijiro Otsuka Kaoru Sugihara Editors Emerging-Economy State and International Policy Studies
Transcript of Keijiro Otsuka Kaoru Sugihara Editors Paths to the ...
Paths to the Emerging State in Asia and Africa
Keijiro OtsukaKaoru Sugihara Editors
Emerging-Economy State and International Policy Studies

Emerging-Economy State and InternationalPolicy Studies
Series editors
Tetsushi Sonobe, National Graduate Institute for Policy Studies, Tokyo, JapanTakashi Shiraishi, Prefectural University of Kumamoto, Kumamoto, JapanAkihiko Tanaka, National Graduate Institute for Policy Studies, Tokyo, JapanKeiichi Tsunekawa, National Graduate Institute for Policy Studies, Tokyo, JapanAkio Takahara, Graduate School of Public Policy, The University of Tokyo,Tokyo, Japan
This is the first series to highlight research into the processes and impacts of thestate building and economic development of developing countries in thenon-Western World that have recently come to influence global economy andgovernance. It offers a broad and interactive forum for discussions about thechallenges of these countries and the responses of other countries to their rise. Theterm ‘emerging-economy state,’ a part of the series title, or its shorthand ‘emergingstates,’ is intended to promote dialogues between economists who have discussedpolicy problems faced by ‘emerging-market economies’ and scholars in politicalscience and international relations who have discussed ‘modern state formation.’Many emerging states are still in the middle-income status and not immune fromthe risk of falling into the middle-income trap. The manner of their externalengagement is different from that of the high-income countries. Their rise hasincreased the uncertainty surrounding the world. To reduce the uncertainty, goodunderstanding of their purpose of politics and state capacity as well as theireconomies and societies would be required. Although the emerging states are farfrom homogenous, viewing them as a type of countries would force us intounderstand better the similarity and differences among the emerging states andthose between them and the high-income countries, which would in turn to helpcountries to ensure peace and prosperity. The series welcomes policy studies ofempirical, historical, or theoretical nature from a micro, macro, or global point ofview. It accepts, but does not call for, interdisciplinary studies. Instead, it aims topromote transdisciplinary dialogues among a variety of disciplines, including butnot limited to area studies, economics, history, international relations, and politicalscience. Relevant topics include emerging states’ economic policies, social policies,and politics, their external engagement, ensuing policy reactions of other countries,ensuing social changes in different parts of the world, and cooperation between theemerging states and other countries to achieve the Sustainable Development Goals(SDGs). The series welcomes both monographs and edited volumes that areaccessible to academics and interested general readers.
More information about this series at http://www.springer.com/series/16114

Keijiro Otsuka • Kaoru SugiharaEditors
Paths to the Emerging Statein Asia and Africa
EditorsKeijiro OtsukaGraduate School of EconomicsKobe UniversityKobe, Hyogo, Japan
Kaoru SugiharaResearch Institute for Humanity and NatureKyoto, Japan
ISSN 2524-5015 ISSN 2524-5031 (electronic)Emerging-Economy State and International Policy StudiesISBN 978-981-13-3130-5 ISBN 978-981-13-3131-2 (eBook)https://doi.org/10.1007/978-981-13-3131-2
Library of Congress Control Number: 2018961696
© The Editor(s) (if applicable) and The Author(s) 2019. This book is an open access publication.Open Access This book is licensed under the terms of the Creative Commons Attribution-NonCommercial-NoDerivatives 4.0 International License (http://creativecommons.org/licenses/by-nc-nd/4.0/), which permits any noncommercial use, sharing, distribution and reproduction in any medium orformat, as long as you give appropriate credit to the original author(s) and the source, provide a link tothe Creative Commons licence and indicate if you modified the licensed material. You do not havepermission under this licence to share adapted material derived from this book or parts of it.The images or other third party material in this book are included in the book’s Creative Commonslicence, unless indicated otherwise in a credit line to the material. If material is not included in the book’sCreative Commons licence and your intended use is not permitted by statutory regulation or exceeds thepermitted use, you will need to obtain permission directly from the copyright holder.This work is subject to copyright. All commercial rights are reserved by the author(s), whether the wholeor part of the material is concerned, specifically the rights of translation, reprinting, reuse of illustrations,recitation, broadcasting, reproduction on microfilms or in any other physical way, and transmissionor information storage and retrieval, electronic adaptation, computer software, or by similar or dissimilarmethodology now known or hereafter developed. Regarding these commercial rights a non-exclusivelicense has been granted to the publisher.The use of general descriptive names, registered names, trademarks, service marks, etc. in this publi-cation does not imply, even in the absence of a specific statement, that such names are exempt from therelevant protective laws and regulations and therefore free for general use.The publisher, the authors, and the editors are safe to assume that the advice and information in thisbook are believed to be true and accurate at the date of publication. Neither the publisher nor theauthors or the editors give a warranty, express or implied, with respect to the material contained herein orfor any errors or omissions that may have been made. The publisher remains neutral with regard tojurisdictional claims in published maps and institutional affiliations.
This Springer imprint is published by the registered company Springer Nature Singapore Pte Ltd.The registered company address is: 152 Beach Road, #21-01/04 Gateway East, Singapore 189721,Singapore
Preface
Economic history and development economics are both interested in the develop-ment of economy from poor agrarian society to emerging state through agriculturaldevelopment and industrialization. While historical studies are concerned with thelong-term development of specific countries, regions, and the world, developmentstudies are mainly interested in the short-term development of low-income andmiddle-income economies across the world. The former generally adopt descriptiveand interpretative approach because detailed statistical data suitable for econometricanalyses are usually unavailable, whereas the latter often use econometric tech-niques based on survey data which are available only for a short period of time incertain locations. Yet, it is clear that the issues addressed by these two strands ofeconomics discipline are no different and that the two types of analyses are highlycomplementary. Nonetheless, economic historians and development economistshave seldom collaborated in the past. This study is a unique attempt to synthesizestudies of economic histories and development economics.
Authors of this volume strongly believe that in order to grasp the evolutionaryprocess of economic development towards the emerging state, which is the maintheme of the entire project leading to four volumes including this one, a synthesis ofhistorical and development studies is indispensable. Why did Meiji Japan succeedin economic development through fairly rapid industrialization to become anemerging state, while India and China followed different paths of economicdevelopment and took longer to emerge as powerful emerging states? What was therole of agriculture in the development of prewar Japanese economy as well ashigh-performing Asian countries in the postwar period? Why has sub-SaharanAfrica (SSA) largely failed in both agricultural development and industrializationso far? What are the lessons to be learned from the Asian experiences for the futuredevelopment path of SSA towards the emerging state? Considering that interna-tional trade was surprisingly active in the economic history of East, Southeast, andSouth Asia, it is highly relevant for this volume to inquire exactly how and whylocal, regional, and long-distance trade played such crucial roles in the historicaldevelopment of Asian economies, while it did much less in the recent developmentof the economies of SSA. These are the questions that authors of this book
v
collectively address. Some chapters were written by economic historians whileothers by development economists. All of them collaborated through repeatedworkshops in the course of preparing this volume for the last 5 years. We believethat the questions raised above are pertinent for proper understanding of the issue ofemerging economy and state.
A large number of people have contributed to the preparation of this book. Inparticular, we would like to thank Gareth Austin, Chris Baker, Linda Grove, TetsujiOkazaki, Tirthankar Roy, Osamu Saito, Takashi Shiraishi, Tetsushi Sonobe, KeiichiTsunekawa, and Bin Wong for useful comments during the workshops and on theearlier versions of various chapters. We are also grateful to GRIPS staff, Yu Ito,Eriko Kimura, and Yasuko Takano for their dedicated assistance for organizing theseminars and workshops, and to Fumiyo Aburatani, Yumiko Iwasaki, and AyaYamamoto for editorial assistance.
Funding for our project leading to this book publication was provided by JapanSociety for Promotion of Science (JSPS) KAKENHI Grant numbers 25101001,25101002, 25101003, and 15K2178. We highly appreciate the financial support ofJSPS.
Kobe, Japan Keijiro OtsukaKyoto, Japan Kaoru Sugihara
vi Preface
Contents
1 Multiple Paths to Industrialization: A Global Contextof the Rise of Emerging States . . . . . . . . . . . . . . . . . . . . . . . . . . . . 1Kaoru Sugihara
2 Technology Transfer and Agricultural Development:A Comparative Study of Asia and Africa . . . . . . . . . . . . . . . . . . . . 35Keijiro Otsuka
3 Southeast Asia and International Trade: Continuity and Changein Historical Perspective . . . . . . . . . . . . . . . . . . . . . . . . . . . . . . . . . 55Ryuto Shimada
4 Role of State and Non-state Networks in Early-Modern SoutheastAsian Trade . . . . . . . . . . . . . . . . . . . . . . . . . . . . . . . . . . . . . . . . . . 73Atsushi Ota
5 Growth of Regional Trade in Modern Southeast Asia:The Rise of Singapore, 1819–1913 . . . . . . . . . . . . . . . . . . . . . . . . . 95Atsushi Kobayashi
6 Labour-Intensive Industrialization and the Emerging Statein Pre-war Japan . . . . . . . . . . . . . . . . . . . . . . . . . . . . . . . . . . . . . . 115Masayuki Tanimoto
7 Changing Patterns of Industrialization and Emerging Statesin Twentieth Century China . . . . . . . . . . . . . . . . . . . . . . . . . . . . . . 141Toru Kubo
8 Historical Roots of Industrialisation and the Emerging Statein Colonial India . . . . . . . . . . . . . . . . . . . . . . . . . . . . . . . . . . . . . . . 169Chikayoshi Nomura
vii

9 Industrial Policy, Industrial Development, and StructuralTransformation in Asia and Africa . . . . . . . . . . . . . . . . . . . . . . . . . 195Yuki Higuchi and Go Shimada
10 Transformation of Rural Economies in Asia and Africa . . . . . . . . . 219Jonna P. Estudillo, Elyzabeth F. Cureg and Keijiro Otsuka
11 Agricultural Market Intervention and Emerging Statesin Africa . . . . . . . . . . . . . . . . . . . . . . . . . . . . . . . . . . . . . . . . . . . . . 253Masayoshi Honma
12 Role of Community and Government in IrrigationManagement in Emerging States: Lessons from Japan,China, and India . . . . . . . . . . . . . . . . . . . . . . . . . . . . . . . . . . . . . . . 273Kei Kajisa
viii Contents
Contributors
Elyzabeth F. Cureg Center for Local and Regional Governance(CLRG-NCPAG), University of the Philippines, Quezon City, Philippines
Jonna P. Estudillo National Graduate Institute for Policy Studies, Minato-ku,Tokyo, Japan
Yuki Higuchi Graduate School of Economics, Nagoya City University, Nagoya,Japan
Masayoshi Honma Department of Economics, Division of InternationalEconomics, Seinan Gakuin University, Fukuoka, Japan
Kei Kajisa Aoyama Gakuin University, Tokyo, Japan
Atsushi Kobayashi Osaka Sangyo University, Osaka, Japan
Toru Kubo Shinshu University, Matsumoto, Japan
Chikayoshi Nomura Graduate School of Literature and Human Science, OsakaCity University, Osaka, Japan
Atsushi Ota Keio University, Tokyo, Japan
Keijiro Otsuka Graduate School of Economics, Kobe University, Nada, Kobe,Hyogo, Japan
Go Shimada Meiji University, Tokyo, Japan
Ryuto Shimada Graduate School of Humanities and Sociology, The University ofTokyo, Tokyo, Japan
Kaoru Sugihara Research Institute for Humanity and Nature, Kyoto, Japan
Masayuki Tanimoto Graduate School of Economics, Faculty of Economics, TheUniversity of Tokyo, Tokyo, Japan
ix
List of Figures
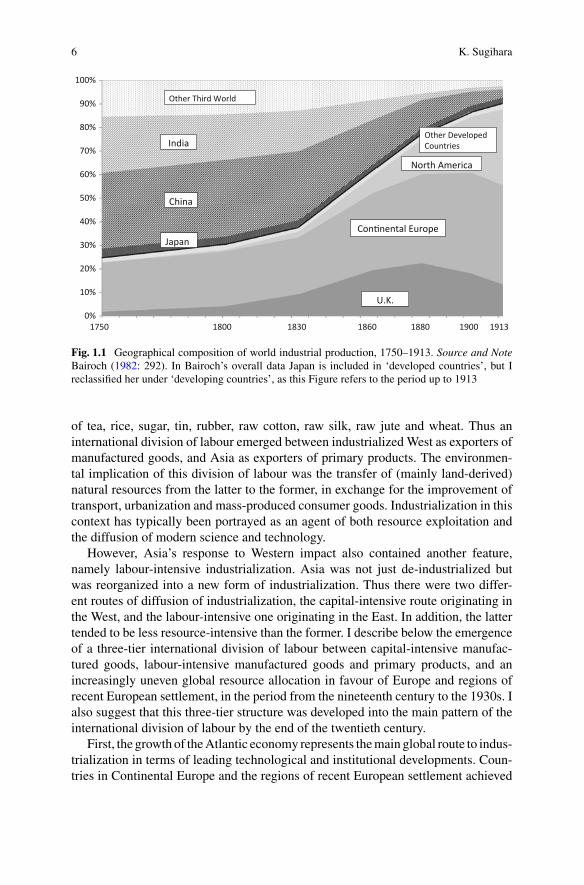
Fig. 1.1 Geographical composition of world industrial production,1750–1913. Source and Note Bairoch (1982: 292). InBairoch’s overall data Japan is included in ‘developedcountries’, but I reclassified her under ‘developing countries’,as this Figure refers to the period up to 1913 . . . . . . . . . . . . . . . 6
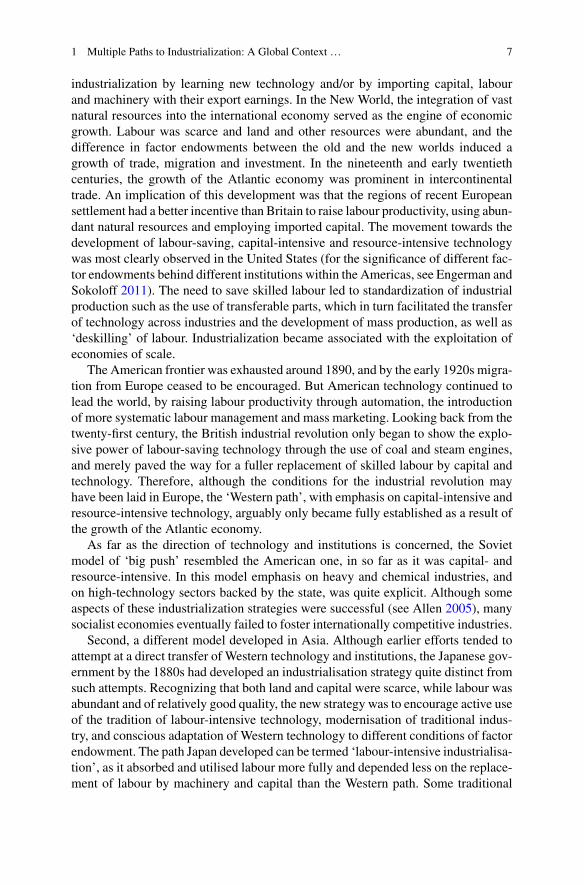
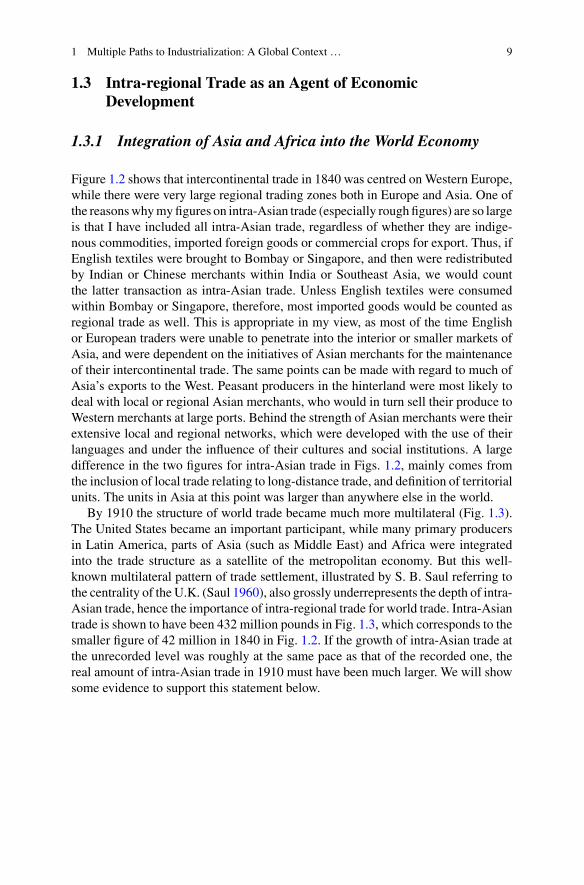
Fig. 1.2 Structure of world trade, 1840. Sources and Notes Sugihara(2015c, 29). Trade data include original estimates. Figures foreach region are intra-regional trade. Those in brackets are veryrough estimates. The size of the circle expresses the relativeproportion of each region in world GDP (Maddison 2009). . . . . 10
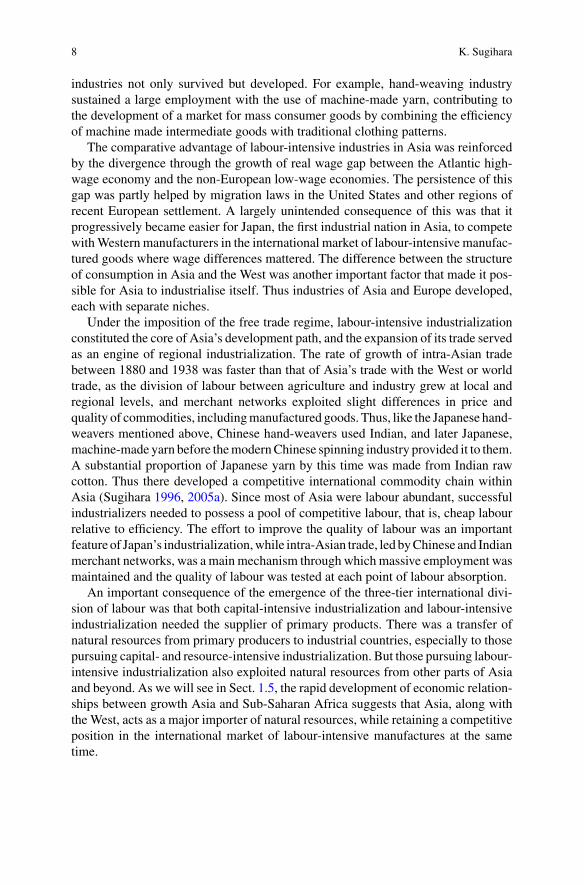
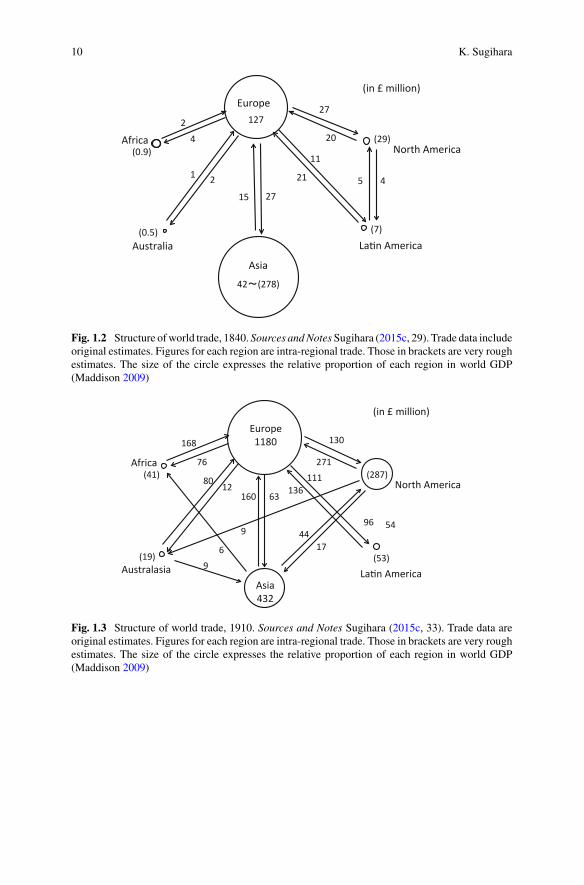
Fig. 1.3 Structure of world trade, 1910. Sources and Notes Sugihara(2015c, 33). Trade data are original estimates. Figures for eachregion are intra-regional trade. Those in brackets are veryrough estimates. The size of the circle expresses the relativeproportion of each region in world GDP (Maddison 2009). . . . . 10
Fig. 1.4 Rail- and river-borne trade in India, 1888. Source and NotesRail- and River-borne Trade, 1888/89–1892/93. Figures aresums of exports and imports. Thin arrows represent a millionrupees and above, while thick arrow 10 million and above . . . . 12
Fig. 1.5 Trade of Calcutta and its environs, 1877/78. Source Report onthe Administration of Bengal (1877/78) . . . . . . . . . . . . . . . . . . . 13
Fig. 1.6 Long distance trade and regional trade, 1910. Sources andNotes Sugihara (2013). Circles show major trading countriesand regions. Figures indicated within the circle shows thevalue of exports to Asian and African regions over that of totalexports. Figures for the Presidencies and the Provinces of Indiaand Aden are derived from the references originally used inSugihara (1996) (186) and Sugihara (2002) (28). Figures referto sea-borne trade only. As coastal trade in British India isincluded here, the ratio of intra-regional trade is greater than
xi
the usual calculation made from the geographical compositionof foreign trade. Figures for Hong Kong was estimated fromthose in 1913. See Sugihara (1996) (107). . . . . . . . . . . . . . . . . . 15
Fig. 1.7 Import tariff rates in India, China and Japan, 1864–1940. Notesand Sources India: Sugihara (2002, 30–31), China: Hsiao(1974, 22–24, 132–33), Japan: Okurasho (1948). Rates refer tothe share of total import revenue divided by total value ofimports. The Japanese data exclude colonial importsafter 1919 . . . . . . . . . . . . . . . . . . . . . . . . . . . . . . . . . . . . . . . . . . 21
Fig. 1.8 Commodity composition of exports from 4 ASEAN countriesand Singapore, 1950–1997. Source Takanaka (2000) . . . . . . . . . 25
Fig. 1.9 Commodity composition of imports to 4 ASEAN countriesand Singapore, 1950–1997. Source As per Fig. 1.8 . . . . . . . . . . 25
Fig. 1.10 Geographical composition of exports from Sub-SaharanAfrica, 1990–2017. Source As per Table 1.2 . . . . . . . . . . . . . . . 29
Fig. 1.11 Geographical composition of imports from Sub-SaharanAfrica, 1990-2017. Source As per Table 1.2. . . . . . . . . . . . . . . . 30
Fig. 2.1 Changes in grain production, cultivation area, population,and grain yield in Prewar Japan (Index: 1880 = 100).Source Umemura et al. (1966) . . . . . . . . . . . . . . . . . . . . . . . . . . 37
Fig. 2.2 Changes in rice yield per hectare in Prewar Japan, Taiwan, andKorea, and Postwar Philippines, Five-Year Moving averages(reproduced from Hayami and Godo 2005, p. 101) . . . . . . . . . . 38
Fig. 2.3 Changes in grain production, harvested area, population, andgrain yield in tropical Asia (Index: 1961 = 100). SourceFAOSTAT (2016). . . . . . . . . . . . . . . . . . . . . . . . . . . . . . . . . . . . 40
Fig. 2.4 Changes in rice yield in Northeast, Southeast, and South Asia.Source FAOSTAT (2016) . . . . . . . . . . . . . . . . . . . . . . . . . . . . . . 41
Fig. 2.5 World production and real prices for rice and maize,1961–2016. Source United States Department of Agriculturedatabase . . . . . . . . . . . . . . . . . . . . . . . . . . . . . . . . . . . . . . . . . . . 42
Fig. 2.6 Arable land per rural population in tropical Asia and SSA,1961–2013. Source FAOSTAT (2016) . . . . . . . . . . . . . . . . . . . . 44
Fig. 2.7 Changes in grain production, harvested area, population,and grain yield in SSA (Index: 1961 = 100). SourceFAOSTAT (2016). . . . . . . . . . . . . . . . . . . . . . . . . . . . . . . . . . . . 44
Fig. 2.8 Changes in aggregate harvested area in SSA by majorcrop. Source FAOSTAT (2016) . . . . . . . . . . . . . . . . . . . . . . . . . 45
Fig. 2.9 Changes in average rice yield in SSA, top 10 and bottom 10countries, and India. Source FAOSTAT (2016) . . . . . . . . . . . . . 46
Fig. 2.10 Changes in average maize yields in SSA, top 10 and bottom 10countries, and India. Source FAOSTAT (2015) . . . . . . . . . . . . . 48
Fig. 2.11 Linkages between agricultural developmentand industrialization . . . . . . . . . . . . . . . . . . . . . . . . . . . . . . . . . . 50
xii List of Figures
Fig. 3.1 International trade and socio-economic changesin Southeast Asia . . . . . . . . . . . . . . . . . . . . . . . . . . . . . . . . . . . . 56
Fig. 4.1 Export from the Dutch ports in the Outer Islands, 1846–69(Dutch guilders). Sources Direkteur der Middelen enDomeinen 1851–70. . . . . . . . . . . . . . . . . . . . . . . . . . . . . . . . . . . 87
Fig. 4.2 Imports into the Dutch Outer-Islands Ports, 1846–1869(1,000 Dutch guilders). Sources Direkteur der Middelen enDomeinen 1851–70. . . . . . . . . . . . . . . . . . . . . . . . . . . . . . . . . . . 88
Fig. 4.3 Destinations of items exported from the Dutch ports in theOuter Island, 1846–69 (Dutch guilders). Sources Direkteur derMiddelen en Domeinen 1851–70 . . . . . . . . . . . . . . . . . . . . . . . . 89
Fig. 5.1 Singapore’s regional export index, 1831–1913. SourceTabular Statements, 1839–1865; Blue Book, 1868–1913. NoteThe export index is expressed in real terms and estimated bydeflating the nominal export value by the export price index.The price index is adopted from Kobayashi (2017) . . . . . . . . . . 97
Fig. 5.2 Singapore’s regional import index, 1831–1913. SourceTabular Statements, 1839–1865; Blue Book, 1868–1913. NoteThe import index is estimated using the same meanas that in Fig. 5.1 . . . . . . . . . . . . . . . . . . . . . . . . . . . . . . . . . . . . 98
Fig. 5.3 Foreign trade and coasting trade in Kuching, 1860–1917.Source Sarawak Gazette, Sarawak Trade Returns; SarawakGovernment Gazette, Sarawak Trade Returns. Note The unitsare expressed in Straits dollars . . . . . . . . . . . . . . . . . . . . . . . . . . 107
Fig. 5.4 Coastal rice exports and imports in Kuching, 1881–1930.Source Sarawak Gazette, Sarawak Trade Returns; SarawakGovernment Gazette, Sarawak Trade Returns; Sarawak AnnualReport. Notes The values are measured in piculs . . . . . . . . . . . . 109
Fig. 6.1 GDP per capita in comparison with Japan . . . . . . . . . . . . . . . . . 117Fig. 6.2 Japan’s export, import and trade balance against GNP. Source
Ohkawa et al. (1974) . . . . . . . . . . . . . . . . . . . . . . . . . . . . . . . . . 118Fig. 6.3 Export of miscellaneous goods. Source Toyokeizai Shinposha
(1935) . . . . . . . . . . . . . . . . . . . . . . . . . . . . . . . . . . . . . . . . . . . . . 126Fig. 6.4 Production organization of the toy manufacturing industry
in Tokyo . . . . . . . . . . . . . . . . . . . . . . . . . . . . . . . . . . . . . . . . . . . 129Fig. 6.5 Japan’s export trades after World War II. Source
Tsushosangyoseisakushi Hensaniinkai (1992) . . . . . . . . . . . . . . . 136Fig. 7.1 Industrial production index, 1912–1949. Source Table 7.5 . . . . . 148Fig. 7.2 Ratio of paid-in capital of governmental and private companies
in free China, 1936–1944. Source Kubo (2004: 183) . . . . . . . . . 149Fig. 7.3 a Proportion of spindles in Chinese and foreign cotton mills,
1894–1936, b proportion of weaving machines in Chineseand foreign cotton mills, 1894–1936 Source Kubo et al.(2016 :25) . . . . . . . . . . . . . . . . . . . . . . . . . . . . . . . . . . . . . . . . . . 152
List of Figures xiii
Fig. 7.4 Profit rates of Chinese cotton mills and Japanese cotton millsin China, 1922–36. Source Kubo et al. (2016: 28) . . . . . . . . . . . 154
Fig. 8.1 Sector shares in NDP in India. Source Sivasubramonian(2000) . . . . . . . . . . . . . . . . . . . . . . . . . . . . . . . . . . . . . . . . . . . . . 173
Fig. 8.2 Sector shares in GDP in Japan. Source Okawa et al. (1974). . . . 174Fig. 8.3 Nominal short term interest rates (%). Sources Nomura (2018).
Note 1 India’s bank rates from Jan. to June were generallyhigher than those from July to Dec. Note 2 India’s hundi ratesin June were generally equivalent to the averageannual rates. . . . . . . . . . . . . . . . . . . . . . . . . . . . . . . . . . . . . . . . . 177
Fig. 8.4 Nominal daily wages for manufacturing labours (in Indianrupee). Sources Nomura (2018) Note 1 The sharp drop inwages in Japan during the 1930s was due to a marked declinein yen-based nominal wages and a sudden depreciation of theyen against the rupee after 1931 (Rs./Yen decreased from 1.47in 1931 to 1.05 in 1932 and 0.79 in 1933) . . . . . . . . . . . . . . . . . 179
Fig. 8.5 India’s share of government revenue against NDP. SourceData of NDP from Sivasubramonian (2000). Data of BritishIndia’s government revenue from Reserve Bank of India(1954). Data of population size of British India and princelystates from Government of India. Statistical Abstract of BritishIndia. New Delhi: Department of Commercial Intelligence andStatistics. Note 1 The government revenue includes revenuesof both British India’s central and local government of, whichwas separated from the central government after an enactmentof the Government of India Act 1919. Note 2 Original dataof the government revenue in Banking and Monetary Statisticsincludes only central and local government revenue of BritishIndia, while excluding data on revenue of princely states. Weestimate the government revenue of the princely state based ontheir relative size of population. According to StatisticalAbstract of British India, total population in British India andprincely states are as follows. 231 million and 63 million in1901, 244 million and 70 million in 1911, 247 million and 71million in 1921, and 271 million and 81 million in 1931. Basedon these figures, we assume that the government revenue of theprincely states were 22% of the government revenue of BritishIndia throughout the period of the figure. On the assumption,we firstly estimated total government revenue of India. Andthen, to figure out the India’s revenue share in NDP, theestimated government revenue of India was divided bySivasubramonian’s total India’s NDP, which includes NDPdata of both British India and princely states . . . . . . . . . . . . . . . 182
xiv List of Figures
Fig. 8.6 Japan and the UK’s share of government revenue againstGDP. Source Data of Japan’s government revenue from Emiand Shionoya (1966). Data of Japan’s GDP from Okawa et al.(1974). Data of the UK from Mitchell (1988). Note 1 Thegovernment revenues include revenues of both central andlocal government in the respective countries. . . . . . . . . . . . . . . . 183
Fig. 8.7 Government revenue (absolute figure in million rupee). SourceData of exchange rate from same source with Fig. 8.4. Otherdata are from same sources with Figs. 8.5 and 8.6 . . . . . . . . . . . 183
Fig. 8.8 Shares of central government’s public debt against GDP/NDP.Source Data of India’s NDP from Sivasubramonian (2000).Data of British India’s central government debt from ReserveBank of India (1954). Data of Japan’s GDP from Okawa et al.(1974). Data of Japan’s central government debt from Emiet al. (1988); Toyo Keizai Shinposha, The Oriental economist(Toyo Keizai Shinposha), Tokyo: Toyo Keizai Shinposha.Data of the UK from Mitchell (1988). Note 1 As was the caseof Fig. 8.5, original data of the government revenue in Bankingand Monetary Statistics includes only central government debtof British India, excluding data on princely states’ debt. Again,using the population size, we assume that the princely states’government debt were 22% of the government debt of BritishIndia. On the assumption, we estimated total centralgovernment debt of India. And then, to figure out the India’scentral government debt share in NDP, the estimated centralgovernment debt of India was divided by Sivasubramonian’stotal India’s NDP, which includes NDP data of both BritishIndia and princely states . . . . . . . . . . . . . . . . . . . . . . . . . . . . . . . 185
Fig. 8.9 Exchange rate of Indian rupee and Japanese yen againstSterling pound. Source Indian rupee data before 1918/19 fromShirras (1920). Indian rupee data after 1919/20 fromGovernment of India. Statistical Abstract of British India. NewDelhi: Department of Commercial Intelligence and Statistics.Japanese yen data from Government of Japan (1949) . . . . . . . . . 186
Fig. 8.10 Import tariff rate and custom revenue share among totalgovernment revenue in India (%). Source Tariff rate data fromMitchell (1995). Custom revenue and total revenue data fromsame sources with Fig. 8.5. Note 1 Tariff rate is estimated bycustom revenue. divided by total imports . . . . . . . . . . . . . . . . . . 187
Fig. 8.11 Percentage of rings and mules: India. Source Otsuka et al.(1988, p. 9). . . . . . . . . . . . . . . . . . . . . . . . . . . . . . . . . . . . . . . . . 189
Fig. 8.12 Percentage of rings and mules: Japan. Source Otsuka et al.(1988, p. 10). . . . . . . . . . . . . . . . . . . . . . . . . . . . . . . . . . . . . . . . 190
List of Figures xv
Fig. 9.1 Changes in sectoral GDP per capita in Asia and Sub-SaharanAfrica. Source Penn World Table, World DevelopmentIndicators. Note GDP per capita is in USD (in PPP-adjusted2011 constant price) and is presented in log scale. Panel Apresents weighted averages (weight by population) of BGD,CHN, IDN, IND, KOR, LKA, MYS, NPL, PAK, PHL, andTHA and Panel B presents numbers in JPN. Similarly, Panel Cpresents weighted averages of BDI, BEN, BFA, CAF, CIV,CMR, COG, GHA, GNB, KEN, LSO, MDG, MLI, MRT,MWI, NER, RWA, SDN, SLE, SWZ, TCD, TGO, UGA,ZMB, and ZWE and Panel D presents numbers in ZAF. . . . . . . 200
Fig. 9.2 Changes in GDP per capita in all Sub-Saharan Africancountries. Source Penn World Table, World DevelopmentIndicators. GDP per capita is in USD (in PPP-adjusted 2011constant price) and is presented in log scale. All Sub-Saharancountries, whose GDP data is available are included . . . . . . . . . 212
Fig. 10.1 Sectoral composition of gross domestic product in selectedcountries in Asia and Africa, 1985–2015. Drawn using datafrom World Development Indicators database. . . . . . . . . . . . . . . 222
Fig. 10.2 Arable land per rural population in tropical Asia andsub-Saharan Africa, 1961–2013. Figure was drawn using datafrom FAOStat and World Population Prospects (UnitedNations, Department of Economic and Social Affairs,Population Division 2015); “Tropical Asia”refers to SoutheastAsia and South Asia . . . . . . . . . . . . . . . . . . . . . . . . . . . . . . . . . . 225
Fig. 10.3 Total area equipped for irrigation in selected countries in Asiaand Africa, 1961–2013. Drawn using data from FAOStat;“Tropical Asia” refers to Southeast Asia and South Asia . . . . . . 228
Fig. 10.4 Area planted with modern rice varieties in selected countriesin Asia, 1966–2012. Drawn using data from World RiceStatistics . . . . . . . . . . . . . . . . . . . . . . . . . . . . . . . . . . . . . . . . . . . 229
Fig. 10.5 Average crop yield in tropical Asia and sub-Saharan Africa,1961–2014 . . . . . . . . . . . . . . . . . . . . . . . . . . . . . . . . . . . . . . . . . 230
Fig. 10.6 Gross primary enrolment ratio (%) in selected countries in Asiaand Africa, 1970–2014 . . . . . . . . . . . . . . . . . . . . . . . . . . . . . . . . 231
Fig. 10.7 Gross secondary enrolment ratio (%) in selected countriesin Asia and Africa, 1970–2014 . . . . . . . . . . . . . . . . . . . . . . . . . . 232
Fig. 10.8 Interrelationship between population pressure, GreenRevolution, and the development of nonfarm sector . . . . . . . . . . 233
Fig. 10.9 Location of Central Luzon, the Philippines. . . . . . . . . . . . . . . . . 244Fig. 11.1 Nominal rates of assistance to agriculture, by regions, 1980–84
and 2000–04 (percent). Source Anderson (ed.) (2009). NoteLAC is Latin America and Caribbean, ECA is Europe and
xvi List of Figures
Central Asia, ANZ is Australia and New Zealand, and WE isWestern Europe . . . . . . . . . . . . . . . . . . . . . . . . . . . . . . . . . . . . . 255
Fig. 11.2 Nominal rate of assistance (NRA) in Africa and Asia,1955–2010. Source World Bank, National and GlobalEstimates of Distortions to Agricultural Incentives1955–2011 . . . . . . . . . . . . . . . . . . . . . . . . . . . . . . . . . . . . . . . . . 256
Fig. 11.3 Rerationship between GDP per capita and NRA in Africa,1961–2010. Source World Bank, National and GlobalEstimates of Distortions to Agricultural Incentives1955–2011 . . . . . . . . . . . . . . . . . . . . . . . . . . . . . . . . . . . . . . . . . 257
Fig. 11.4 Relationship between rural population share and NRA inAfrica, 1961–2010. Source World Bank, National and GlobalEstimates of Distortions to Agricultural Incentives1955–2011 . . . . . . . . . . . . . . . . . . . . . . . . . . . . . . . . . . . . . . . . . 258
Fig. 11.5 Political determination of agricultural protection level . . . . . . . . 262Fig. 12.1 Population and employment by sector in Japan, China,
and India from 1950 to 2015. Source FAOSTAT. . . . . . . . . . . . 275Fig. 12.2 Proportion of financial support for land improvement
investment by the central and local government in Japan from1910 to 2004. Sources National Research Institute ofAgricultural Economics (1967) and Ministry of Agriculture,Forestry and Fisheries (various years) . . . . . . . . . . . . . . . . . . . . . 279
Fig. 12.3 Japan’s land improvement investment, rice production value,and rice income from 1960 to 2015. Source Data are from thehome page of Ministry of Agriculture, Forestry, and Fisheries(Accessed November 2017). The sources of each series are asfollows. Land improvement investment: Nougyou shokuryoukanren no keizai keisan. Rice production value:Seisannnougyou syotoku toukei. Rice income: Nousanbutuseisanhi toukei. Note Rice income is computed as rice incomeper 10 are times rice cultivated area in 10 acre. Rice cultivatedarea was taken form Skumotu toukei at the homepage above.The definition of rice income per 10 are is as follows.Income = revenue – (total production cost – (imputed familylabor cost + imputed capital payment + imputed land rent)).Subsidies are not included in the revenue . . . . . . . . . . . . . . . . . . 281
Fig. 12.4 The proportion of sample farmers in the four types of irrigationinstitutions by the volumetric price of reservoir water, ZhangheIrrigation System, Hubei, China in 2008. Source Kajisa andDong (2017) . . . . . . . . . . . . . . . . . . . . . . . . . . . . . . . . . . . . . . . . 284
Fig. 12.5 Percentage share of well-irrigated and tank-irrigated area intotal irrigated area in Tamil Nadu from 1960 to 2005. SourceKajisa et al. (2007) . . . . . . . . . . . . . . . . . . . . . . . . . . . . . . . . . . . 287
List of Figures xvii
List of Tables
Table 1.1 Growth of intra-Asian trade, 1950–2014(in billion US dollars) . . . . . . . . . . . . . . . . . . . . . . . . . . . . . . . 20
Table 1.2 The growth of intra-regional trade in Sub-Saharan Africa,1950–2015 (in billion US dollars) . . . . . . . . . . . . . . . . . . . . . . 28
Table 3.1 Four spheres of the trade of Batavia . . . . . . . . . . . . . . . . . . . . 60Table 3.2 Merchandise Exports at Current Price, 1870–1998
(million dollars at current exchange rates) . . . . . . . . . . . . . . . . 65Table 3.3 Trading Partners of International Trade in Southeast Asia,
1883–1938 (million pounds sterling) . . . . . . . . . . . . . . . . . . . . 65Table 5.1 Imports and exports in Singapore’s trade, 1822–1913 . . . . . . . 99Table 5.2 Imports and exports in Singapore’s regional trade,
1828–1913 . . . . . . . . . . . . . . . . . . . . . . . . . . . . . . . . . . . . . . . . 103Table 5.3 Commodities of foreign exports and coasting imports
in Kuching, 1870–1904 . . . . . . . . . . . . . . . . . . . . . . . . . . . . . . 108Table 6.1 Distribution of working population of manufacturing
industries in 1909. . . . . . . . . . . . . . . . . . . . . . . . . . . . . . . . . . . 117Table 6.2 Trade and production of cotton goods in the late 19th century
Japan (unit: 10,000 kin) . . . . . . . . . . . . . . . . . . . . . . . . . . . . . . 120Table 6.3 Distribution of businesses and workers by production forms
of weaving industry in 1905. . . . . . . . . . . . . . . . . . . . . . . . . . . 121Table 6.4 Japan’s export trade in 1937 . . . . . . . . . . . . . . . . . . . . . . . . . . 127Table 6.5 Content of workshops classified by the size of capital
in Tokyo 1932 . . . . . . . . . . . . . . . . . . . . . . . . . . . . . . . . . . . . . 133Table 6.6 Proportion of commodities in export to US . . . . . . . . . . . . . . . 137Table 7.1 General trends of foreign trade, 1871–2013
(100 million US$) . . . . . . . . . . . . . . . . . . . . . . . . . . . . . . . . . . 142Table 7.2 General trends of foreign investment, 1902–2014.
Million US$ . . . . . . . . . . . . . . . . . . . . . . . . . . . . . . . . . . . . . . . 143Table 7.3 Sectoral composition of foreign investment,
1914 and 1931 (%) . . . . . . . . . . . . . . . . . . . . . . . . . . . . . . . . . 143Table 7.4 Railway construction, 1890–2014 (km) . . . . . . . . . . . . . . . . . . 144
xix
Table 7.5 Industrial development, 1912–1949 . . . . . . . . . . . . . . . . . . . . . 145Table 7.6 Ratio of domestic supply of Chinese industrial production,
1890–1936 (%) . . . . . . . . . . . . . . . . . . . . . . . . . . . . . . . . . . . . 148Table 7.7 Composition of production, 1933–2014
(value added) (%). . . . . . . . . . . . . . . . . . . . . . . . . . . . . . . . . . . 149Table 7.8 Composition of industrial production, 1933–1993 (%) . . . . . . . 150Table 7.9 Production and trade of machine-made cotton yarn and
cotton pieces, 1880–1990 . . . . . . . . . . . . . . . . . . . . . . . . . . . . . 152Table 7.10 Geographical distribution of spindles of Chinese and
Japanese cotton mills in China, 1922–36. Unit: 1,000spindles; () index (1930 = 100) . . . . . . . . . . . . . . . . . . . . . . . . 153
Table 7.11 Production of iron foundries, 1919–37 (1,000 tons) . . . . . . . . . 157Table 7.12 Sales of Anshan and Benxihu foundries (1,000 tons (%)) . . . . 158Table 8.1 Top seven cotton spindle holding countries (1,000) . . . . . . . . . 170Table 8.2 Top nine pig iron producers (1,000 metric tons) . . . . . . . . . . . 171Table 8.3 Manufacturing production 1926–28 . . . . . . . . . . . . . . . . . . . . . 172Table 9.1 GDP per capita and contribution of each sector in the
selected years . . . . . . . . . . . . . . . . . . . . . . . . . . . . . . . . . . . . . . 203Table 9.2 Sectoral share of labor in selected years. . . . . . . . . . . . . . . . . . 205Table 9.3 Sectoral GDP per capita and share of labor
in selected years . . . . . . . . . . . . . . . . . . . . . . . . . . . . . . . . . . . . 207Table 9.4 Decomposition of GDP per capita growth . . . . . . . . . . . . . . . . 210Table 9.5 Data availability . . . . . . . . . . . . . . . . . . . . . . . . . . . . . . . . . . . . 213Table 10.1 Growth rate of per capita gross domestic product (GDPPc)
in selected countries in Asia and Africa, 1980–2015 . . . . . . . . 222Table 10.2 Sectoral composition of total employment in selected
countries in Asia and Africa, 1980–2014 . . . . . . . . . . . . . . . . . 223Table 10.3 Poverty and inequality in selected countries in Asia and
Africa, 1983–2012 . . . . . . . . . . . . . . . . . . . . . . . . . . . . . . . . . . 224Table 10.4 Growth rates of arable land and population in selected
countries in Asia and Africa, 1961–2013 . . . . . . . . . . . . . . . . . 226Table 10.5 Sources of rural household income in selected countries
in Asia, 1985–2010 . . . . . . . . . . . . . . . . . . . . . . . . . . . . . . . . . 238Table 10.6 Technology adoption, demographic characteristics, and
income sources of sample households in Central Luzon,the Philippines, 1966–2011 . . . . . . . . . . . . . . . . . . . . . . . . . . . 245
Table 11.1 NRA and GDP per capita in 20 African countries . . . . . . . . . . 259Table 11.2 Results of regressions of nominal protection coefficient
(NPC) in Africa . . . . . . . . . . . . . . . . . . . . . . . . . . . . . . . . . . . . 267
xx List of Tables

Table 12.1 Water price and water use by water institution of samplefarmers, Zhanghe Irrigation System, Hubei,China in 2008 . . . . . . . . . . . . . . . . . . . . . . . . . . . . . . . . . . . . . 285
Table 12.2 Comparison of rice yield, income, poverty ratio, and riceprofit by irrigation status of sample farmers, Tamil Nadu,India, in 1999. . . . . . . . . . . . . . . . . . . . . . . . . . . . . . . . . . . . . . 288
List of Tables xxi
Chapter 1Multiple Paths to Industrialization:A Global Context of the Rise of EmergingStates
Kaoru Sugihara
1.1 Introduction
This volume addresses the issue of how a country, which was incorporated intothe world economy as a periphery, could create a path of economic developmentand industrialization as the ‘emerging state’ in Asia and Africa. We offer historicaland contemporary case studies of development paths, as well as the internationalbackground under which a transition to the emerging state was successfully made,delayed or failed.
In this chapter I describe how diverse paths of economic development emergedin various regions of the world, and show that interactions of such ‘multiple paths’,rather than the diffusion of modern technology and institutions fromWestern Europeto the rest of the world, determined the timing and pace of global industrializationover the last two centuries. The industrial revolution in England, which began in thelate eighteenth century, was first transmitted to Continental Europe, the United Statesand Japan in the ‘long’ nineteenth century. During the period of interwar instabilityand after World War II, a variety of state-led industrialization programs, includingsocialist models, were implemented, which had varying degrees of success. Thediffusion of industrialization has been often interpreted along the Gerschenkroneanframework of ‘advantage of backwardness’ and late development (Gerschenkron1962; Austin 2013, 288–90). In a broad sense, any state engaged in ‘catching-up’industrialization qualifies the emerging state. Thus the first type of the emerging stateexploits its respective factor endowment advantages in relation to the more advancedcountries. If an Asian country such as Japan is labour abundant and capital scarce,she might focus on the development of labour-intensive industries, in addition tofostering capital-intensive ones for political and military reasons.
K. Sugihara (B)Research Institute for Humanity and Nature, Kyoto, Japane-mail: [email protected]
© The Author(s) 2019K. Otsuka and K. Sugihara (eds.), Paths to the Emerging State in Asia and Africa,Emerging-Economy State and International Policy Studies,https://doi.org/10.1007/978-981-13-3131-2_1
1
2 K. Sugihara
Meanwhile, as early development economists such as W. A. Lewis pointed out,many countries of Asia and Africa under colonial rule or domination were not giventhe chance to industrialize, either because industrializedWest sought an internationaldivisionof labourwhere the latter specialized inmanufacturedgoodswhile the formerwas encouraged to specialize in primary products, or, perhaps more fundamentally,because resource and environmental constraints in Asia and Africa, especially theirtropical parts, made it difficult for their people to raise agricultural productivity, thusdepressing the chance to increase the real wage and the opportunity to train labour(Lewis 1954, 1970).
Another, somewhat related line of development was the state-led, import-substitution industrialization strategy, pursued in India and China among others,which aimed at political and economic independence at the cost of seeking gainsfrom international trade and technological transfer from advanced countries, espe-cially the United States. The idea of ‘import-substitution’ was widely shared amongthe leaders of newly independent states, crossing over the political division betweennon-allied and socialist countries, which reflected their experiences as a ‘periphery’and the impact of ‘forced’ free trade. In general, this form of ‘third world industrial-ization’ and ‘state-led development’ did not successfully close the gap between the‘North’ and the ‘South’ in terms of per capita GDP or living standards. Nor was itoften associated with democracy. But in all cases the state played a powerful rolein determining the type of industrialization with varied implications for economicgrowth and living standards. Industrialization of China in the Mao period, in spite ofits stormy politics, left a particularly lasting impression for the study of the role ofthe state in economic development, not least because it contributed to the improve-ment of health and education of a very large number of people. Thus the secondtype of the emerging state as a driver of industrialization came out of the ideologyof politico-economic independence and import-substitution, rather than as a resultof the exploitation of factor endowment advantages.
A major change came from the western rim of the Pacific in the post-war period.In contrast to Japan’s late development since theMeiji period, which we term labour-intensive industrialization and categorize as the first type of the emerging state, theJapanese high economic growth in the 1950s and the 1960s resulted in a rapid con-vergence of per capita GDP to advanced western countries. This could be seen as anextensionof pre-war labour-intensive industrialization to a large extent in that its com-parative advantage remained firmly in relatively cheap, competitive labour. NewlyIndustrializing Economies (NIEs) and some Southeast Asian countries adopted thestrategy of export-oriented industrialization also by taking advantage of cheap, com-petitive labour and by meeting the demand from the mass-consumer markets ofadvanced countries (Sugihara 2013). Then, some states, such as Japan, South Koreaand Taiwan, also began to take on the task of creating competitive capital- andresource-intensive industries, and successfully pursued them. This is ‘developmen-talism’, which relies the legitimacy of its existence on growth, willing to go beyondthe simple pursuit for exploiting its factor endowment advantages. The state couldexercise power to promote industrial technology, build infrastructure and mobilizehuman and natural resources by prioritizing growth over democracy, equality and
1 Multiple Paths to Industrialization: A Global Context … 3
environmental concerns.1 The ‘developmental state’ with commitment to interna-tional trade and growth ideology thus constitutes the third type of the emerging state.It is worth noting that this regional development occurred when mainland China andIndia were largely outside the orbit of the international economy.
Set against the high economic growth at the western rim of the Pacific, China andIndia made policy changes around 1979 and 1991 respectively, to re-enter the inter-national economy. There too a fusion between capital-intensive and labour-intensivepaths took place, that is, emphasis on capital-intensive, heavy industries (representedby steel and machinery sectors) was eventually replaced by or absorbed into theindustrialization strategy with attention to a greater range of industries, includingthose which were more employment-generating and human-capital-intensive. Thusthe growth of the Asia-Pacific economy and regional integration accelerated, andled global industrialization. By the end of the twentieth century the majority ofworld population lived in industrialized or rapidly industrializing countries, espe-cially in Asia. It is now spreading to the rest of the world. Some emerging economieshave built their economy on resource exports and trade, while some states lack theexperience of centralized administration. But global industrialization emerged as aformidable force, both as an economic competition and as an ideology, regardless ofthe preparedness of each developing country. It is this global process of transitionthat provides the economic context of the rise of emerging states today.
Is there any theory that can explain the timing, pace and underlying causes ofthis process? This chapter suggests that the key to answering this question lies in theexamination of the ways in which regional trade, long distance trade and technol-ogy transfer successively released local and regional resource constraints in variousparts of the world. Local and regional resource constraints, such as shortage of land,scarcity of water and the lack of access to biomass energy, would reduce the chancefor securing food and other necessities, hence a sustainable path of economic devel-opment. Intercontinental trade may provide export outlets, while advanced countriescould provide technology, capital and human resources, to build an infrastructureand offer advice on policy. From the point of view of a developing country, however,imported resources had to find matching local ones to make economic sense. Earn-ings from primary exports had to be translated into securing livelihood goods, whichnormally meant securing supplies locally or through regional trade. Intra-regionaltrade couldmitigate local resource constraints at a criticalmoment (think of famines).Likewise, modern technology and institutions had to be adapted to the local contextof production and consumption. Machinery and means of transport had to adapt tolocal factor endowment conditions and the effective use of traditional technology andresources (When necessary, the material for the frame of the power-loom, made bysteel, temporarilywent back towood,whilemodern factories and railways resorted tothe use of timber, instead of coal, for fuel). Above all, the industrialization drive hadto be supported by (thus ‘embedded’ in) the agricultural economy and population;There technology and institutions would change only very slowly. It is the nature and
1For discussion on the effects of developmentalism and the developmental state on the environment,see Sugihara (2017).
4 K. Sugihara
mechanism of these ‘multiple paths’ to industrialization and the role various kindsof emerging states played in them that need to be understood.
In the next section we describe the emergence of a three-tier international divisionof labour where capital-intensive industrialization, labour-intensive industrializationand exports of primary products characterized each region, mainly referring to theperiod up to World War II. In the third section we focus on the growth of intra-Asiantrade, to show local and regional agencies for the growth of world economy and trade.It contributed to labour-intensive industrialization, as well as the growth of the exporteconomy of primary products. The fourth section extends the discussion from thepre-war to the post-war period, and comments on the industrialization experiences ofEastAsia, and SoutheastAsia, from the perspective of the region’s respective positionin the world economy. The final section discusses the role of the emerging state inrelation to industrialization and economic development of Sub-Saharan Africa.
1.2 Emergence of a Three-Tier International Divisionof Labour
1.2.1 The Beginning
Before 1800, most local agricultural societies in Asia and Europe developed a systemof production and reproduction by accepting local resource constraints, imposedby nature. Reflecting a large ‘population-carrying capacity’ of monsoon Asia (seeSugihara 2017), 66% of world population is thought to have lived in Asia, and22% in Europe in 1820 (Maddison 2009). The fate of many societies was onlypartially altered or complemented by regional or intercontinental trade, althoughsome societies were affected by the more drastic interventions such as epidemicsand violence. In Asia the arrival of knowledge from outside was often not takenadvantage of, unless enlightened rulers made it compatible with the technologiesand institutions governing local and regional systems. Thus the Malthusian logicprevailed, even in the early modern period when a gradual but sustained expansionof the market occurred in several core regions of the world (Richards 2003). Thebalance between population and food had to be retained in the long run.
In what ways was this Malthusian trap overcome? In the “European miracle” nar-rative, technological breakthroughs during the period from the scientific revolutionto the industrial revolution have been highlighted, and accompanying institutionaldevelopments, especially emergence of the nation state and the regime of privateproperty rights, have been identified as essential conditions for industrialization andeconomic growth (Jones 1981). Once agricultural productivity rose and coal becameavailable in some places, major resource constraints such as shortage of land and dan-ger of deforestation began to be significantly eased. Cheap coal helped the diffusionof steam engines inmodern factories and transport sectors. Overseas expansion aidedby the development of navigation andmilitary technologies also helped ease regional
1 Multiple Paths to Industrialization: A Global Context … 5
resource constraints, through the imports of rawmaterials and food. Pomeranz calledsuch a resource bonanza ‘coal and North America’ (Pomeranz 2000). By the earlynineteenth century the environmental conditions of Western Europe largely ceasedto constrain economic growth. By the second half of the nineteenth century intercon-tinental trade centering on the Atlantic but also involving Asia grew, and formed aninternational division of labour whereWestern Europe exported manufactured goodsto, and imported primary products from, the rest of the world.
However, this was a solution specific to Western Europe. The ways in whichresource constraints were eased in the subsequent process of global industrializationdiffered region by region (Sugihara 2015a). The level of constraints in the UnitedStates and other regions of recent European settlement (such as Canada, Australiaand New Zealand) was much lower than that inWestern Europe in some crucial mea-sures (such as land and biomass stock), making room for them, especially the UnitedStates, to pursue an even more capital- and resource-intensive path than countries inWesternEurope. InEastAsia,meanwhile, landwasmuchmore scarce relative to pop-ulation, and people were fed, clothed and organized quite differently, mainly throughrice farming and associated proto-industry and social institutions. It created the morelabour-intensive and eventually resource-saving path (for the socio-ecological foun-dations for this path, see Oshima 1987). In other words, neither the United Statesnor East Asia followed the pathWestern Europe had created. The critical importanceof the availability of water, and the frequency of epidemics and natural disasters,especially in the tropical parts of Asia, Africa and Latin America, further signaledthe difference of resource endowments of various regions of the world, hence theimpossibility of conceptualizing the relationship between industrialization and theenvironment on the basis of the experience of Western Europe.
1.2.2 The Western Supremacy and Reorganization of AsianIndustries
Between 1750 and 1840 an overwhelming proportion of world industrial produc-tion, mostly un-mechanized, was located in Asia, especially in China and India (seeFig. 1.1). Even in 1840 the impact ofmechanized industrieswas limited. In industrial-izing Europe a half of textile production was still un-mechanized. By 1910 the worldmarket of textiles was dominated by the modern English cotton textile industry. Thedecline of traditional industries, especially cotton textile industry in India (and to alesser extent China), was a serious global event that involved a loss of employmenton an unprecedented scale (Bagchi 1976; Roy 2005: 106–15). Asia’s share in worldGDP declined from 60% in 1820 to 25% in 1913, while that of Western Europe rosefrom 20 to 31%, and North America from 2 to 20% in these years (Maddison 2009).This mainly reflected the widening gap in real wages between Asia and the West,although the growth of GDP in North America reflected the rapid growth of migrantpopulation as well. Asia became an importer of English textiles and an exporter
6 K. Sugihara
0%
10%
20%
30%
40%
50%
60%
70%
80%
90%
100%
India
Japan
China
Con nental Europe
North America
U.K.
Other Third World
1750 1800 1830 1860 1880 1900 1913
Other Developed Countries
Fig. 1.1 Geographical composition of world industrial production, 1750–1913. Source and NoteBairoch (1982: 292). In Bairoch’s overall data Japan is included in ‘developed countries’, but Ireclassified her under ‘developing countries’, as this Figure refers to the period up to 1913
of tea, rice, sugar, tin, rubber, raw cotton, raw silk, raw jute and wheat. Thus aninternational division of labour emerged between industrialized West as exporters ofmanufactured goods, and Asia as exporters of primary products. The environmen-tal implication of this division of labour was the transfer of (mainly land-derived)natural resources from the latter to the former, in exchange for the improvement oftransport, urbanization and mass-produced consumer goods. Industrialization in thiscontext has typically been portrayed as an agent of both resource exploitation andthe diffusion of modern science and technology.
However, Asia’s response to Western impact also contained another feature,namely labour-intensive industrialization. Asia was not just de-industrialized butwas reorganized into a new form of industrialization. Thus there were two differ-ent routes of diffusion of industrialization, the capital-intensive route originating inthe West, and the labour-intensive one originating in the East. In addition, the lattertended to be less resource-intensive than the former. I describe below the emergenceof a three-tier international division of labour between capital-intensive manufac-tured goods, labour-intensive manufactured goods and primary products, and anincreasingly uneven global resource allocation in favour of Europe and regions ofrecent European settlement, in the period from the nineteenth century to the 1930s. Ialso suggest that this three-tier structure was developed into the main pattern of theinternational division of labour by the end of the twentieth century.
First, the growth of theAtlantic economy represents themain global route to indus-trialization in terms of leading technological and institutional developments. Coun-tries in Continental Europe and the regions of recent European settlement achieved
1 Multiple Paths to Industrialization: A Global Context … 7
industrialization by learning new technology and/or by importing capital, labourand machinery with their export earnings. In the New World, the integration of vastnatural resources into the international economy served as the engine of economicgrowth. Labour was scarce and land and other resources were abundant, and thedifference in factor endowments between the old and the new worlds induced agrowth of trade, migration and investment. In the nineteenth and early twentiethcenturies, the growth of the Atlantic economy was prominent in intercontinentaltrade. An implication of this development was that the regions of recent Europeansettlement had a better incentive than Britain to raise labour productivity, using abun-dant natural resources and employing imported capital. The movement towards thedevelopment of labour-saving, capital-intensive and resource-intensive technologywas most clearly observed in the United States (for the significance of different fac-tor endowments behind different institutions within the Americas, see Engerman andSokoloff 2011). The need to save skilled labour led to standardization of industrialproduction such as the use of transferable parts, which in turn facilitated the transferof technology across industries and the development of mass production, as well as‘deskilling’ of labour. Industrialization became associated with the exploitation ofeconomies of scale.
The American frontier was exhausted around 1890, and by the early 1920s migra-tion from Europe ceased to be encouraged. But American technology continued tolead the world, by raising labour productivity through automation, the introductionof more systematic labour management and mass marketing. Looking back from thetwenty-first century, the British industrial revolution only began to show the explo-sive power of labour-saving technology through the use of coal and steam engines,and merely paved the way for a fuller replacement of skilled labour by capital andtechnology. Therefore, although the conditions for the industrial revolution mayhave been laid in Europe, the ‘Western path’, with emphasis on capital-intensive andresource-intensive technology, arguably only became fully established as a result ofthe growth of the Atlantic economy.
As far as the direction of technology and institutions is concerned, the Sovietmodel of ‘big push’ resembled the American one, in so far as it was capital- andresource-intensive. In this model emphasis on heavy and chemical industries, andon high-technology sectors backed by the state, was quite explicit. Although someaspects of these industrialization strategies were successful (see Allen 2005), manysocialist economies eventually failed to foster internationally competitive industries.
Second, a different model developed in Asia. Although earlier efforts tended toattempt at a direct transfer of Western technology and institutions, the Japanese gov-ernment by the 1880s had developed an industrialisation strategy quite distinct fromsuch attempts. Recognizing that both land and capital were scarce, while labour wasabundant and of relatively good quality, the new strategy was to encourage active useof the tradition of labour-intensive technology, modernisation of traditional indus-try, and conscious adaptation of Western technology to different conditions of factorendowment. The path Japan developed can be termed ‘labour-intensive industrialisa-tion’, as it absorbed and utilised labour more fully and depended less on the replace-ment of labour by machinery and capital than the Western path. Some traditional
8 K. Sugihara
industries not only survived but developed. For example, hand-weaving industrysustained a large employment with the use of machine-made yarn, contributing tothe development of a market for mass consumer goods by combining the efficiencyof machine made intermediate goods with traditional clothing patterns.
The comparative advantage of labour-intensive industries in Asia was reinforcedby the divergence through the growth of real wage gap between the Atlantic high-wage economy and the non-European low-wage economies. The persistence of thisgap was partly helped by migration laws in the United States and other regions ofrecent European settlement. A largely unintended consequence of this was that itprogressively became easier for Japan, the first industrial nation in Asia, to competewithWestern manufacturers in the international market of labour-intensive manufac-tured goods where wage differences mattered. The difference between the structureof consumption in Asia and the West was another important factor that made it pos-sible for Asia to industrialise itself. Thus industries of Asia and Europe developed,each with separate niches.
Under the imposition of the free trade regime, labour-intensive industrializationconstituted the core of Asia’s development path, and the expansion of its trade servedas an engine of regional industrialization. The rate of growth of intra-Asian tradebetween 1880 and 1938 was faster than that of Asia’s trade with the West or worldtrade, as the division of labour between agriculture and industry grew at local andregional levels, and merchant networks exploited slight differences in price andquality of commodities, includingmanufactured goods. Thus, like the Japanese hand-weavers mentioned above, Chinese hand-weavers used Indian, and later Japanese,machine-made yarn before themodernChinese spinning industry provided it to them.A substantial proportion of Japanese yarn by this time was made from Indian rawcotton. Thus there developed a competitive international commodity chain withinAsia (Sugihara 1996, 2005a). Since most of Asia were labour abundant, successfulindustrializers needed to possess a pool of competitive labour, that is, cheap labourrelative to efficiency. The effort to improve the quality of labour was an importantfeature of Japan’s industrialization,while intra-Asian trade, led byChinese and Indianmerchant networks, was a main mechanism through whichmassive employment wasmaintained and the quality of labour was tested at each point of labour absorption.
An important consequence of the emergence of the three-tier international divi-sion of labour was that both capital-intensive industrialization and labour-intensiveindustrialization needed the supplier of primary products. There was a transfer ofnatural resources from primary producers to industrial countries, especially to thosepursuing capital- and resource-intensive industrialization. But those pursuing labour-intensive industrialization also exploited natural resources from other parts of Asiaand beyond. As we will see in Sect. 1.5, the rapid development of economic relation-ships between growth Asia and Sub-Saharan Africa suggests that Asia, along withthe West, acts as a major importer of natural resources, while retaining a competitiveposition in the international market of labour-intensive manufactures at the sametime.
1 Multiple Paths to Industrialization: A Global Context … 9
1.3 Intra-regional Trade as an Agent of EconomicDevelopment
1.3.1 Integration of Asia and Africa into the World Economy
Figure 1.2 shows that intercontinental trade in 1840 was centred onWestern Europe,while there were very large regional trading zones both in Europe and Asia. One ofthe reasonswhymyfigures on intra-Asian trade (especially roughfigures) are so largeis that I have included all intra-Asian trade, regardless of whether they are indige-nous commodities, imported foreign goods or commercial crops for export. Thus, ifEnglish textiles were brought to Bombay or Singapore, and then were redistributedby Indian or Chinese merchants within India or Southeast Asia, we would countthe latter transaction as intra-Asian trade. Unless English textiles were consumedwithin Bombay or Singapore, therefore, most imported goods would be counted asregional trade as well. This is appropriate in my view, as most of the time Englishor European traders were unable to penetrate into the interior or smaller markets ofAsia, and were dependent on the initiatives of Asian merchants for the maintenanceof their intercontinental trade. The same points can be made with regard to much ofAsia’s exports to the West. Peasant producers in the hinterland were most likely todeal with local or regional Asian merchants, who would in turn sell their produce toWestern merchants at large ports. Behind the strength of Asian merchants were theirextensive local and regional networks, which were developed with the use of theirlanguages and under the influence of their cultures and social institutions. A largedifference in the two figures for intra-Asian trade in Figs. 1.2, mainly comes fromthe inclusion of local trade relating to long-distance trade, and definition of territorialunits. The units in Asia at this point was larger than anywhere else in the world.
By 1910 the structure of world trade became much more multilateral (Fig. 1.3).The United States became an important participant, while many primary producersin Latin America, parts of Asia (such as Middle East) and Africa were integratedinto the trade structure as a satellite of the metropolitan economy. But this well-known multilateral pattern of trade settlement, illustrated by S. B. Saul referring tothe centrality of the U.K. (Saul 1960), also grossly underrepresents the depth of intra-Asian trade, hence the importance of intra-regional trade for world trade. Intra-Asiantrade is shown to have been 432 million pounds in Fig. 1.3, which corresponds to thesmaller figure of 42 million in 1840 in Fig. 1.2. If the growth of intra-Asian trade atthe unrecorded level was roughly at the same pace as that of the recorded one, thereal amount of intra-Asian trade in 1910 must have been much larger. We will showsome evidence to support this statement below.
10 K. Sugihara
Asia
Europe
La n America
AfricaNorth America
Australia
(in £ million)
27
11
27
2
2 20
21 5 4
127
42 (278)
(7)
(29)
(0.5)
(0.9) 4
1
15
Fig. 1.2 Structure ofworld trade, 1840. Sources and NotesSugihara (2015c, 29). Trade data includeoriginal estimates. Figures for each region are intra-regional trade. Those in brackets are very roughestimates. The size of the circle expresses the relative proportion of each region in world GDP(Maddison 2009)
Asia432
Europe 1180
La n America
Africa
North America
Australasia
76
12 63
111
271
9
17
54 96
136
44
160
6
9
80
130 168
(287)
(53)
(41)
(19)
(in £ million)
Fig. 1.3 Structure of world trade, 1910. Sources and Notes Sugihara (2015c, 33). Trade data areoriginal estimates. Figures for each region are intra-regional trade. Those in brackets are very roughestimates. The size of the circle expresses the relative proportion of each region in world GDP(Maddison 2009)
1 Multiple Paths to Industrialization: A Global Context … 11
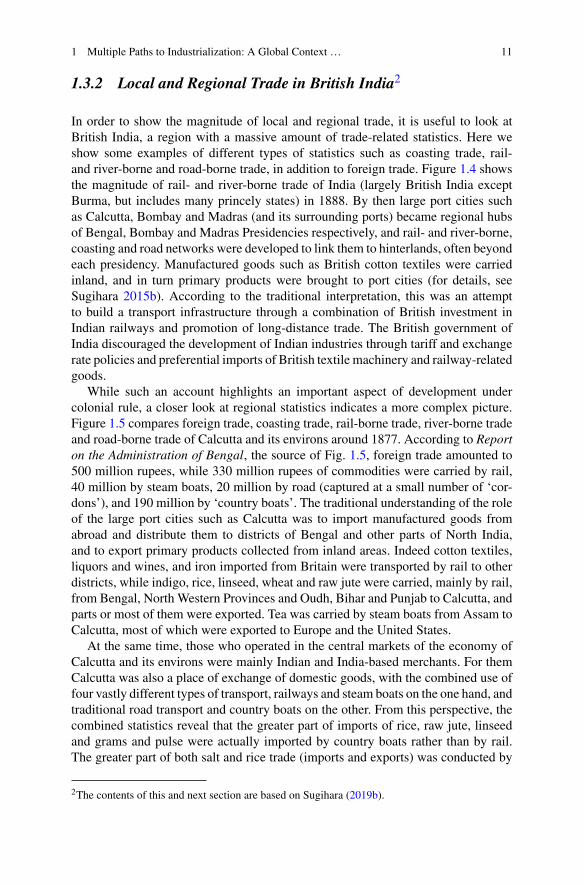
1.3.2 Local and Regional Trade in British India2
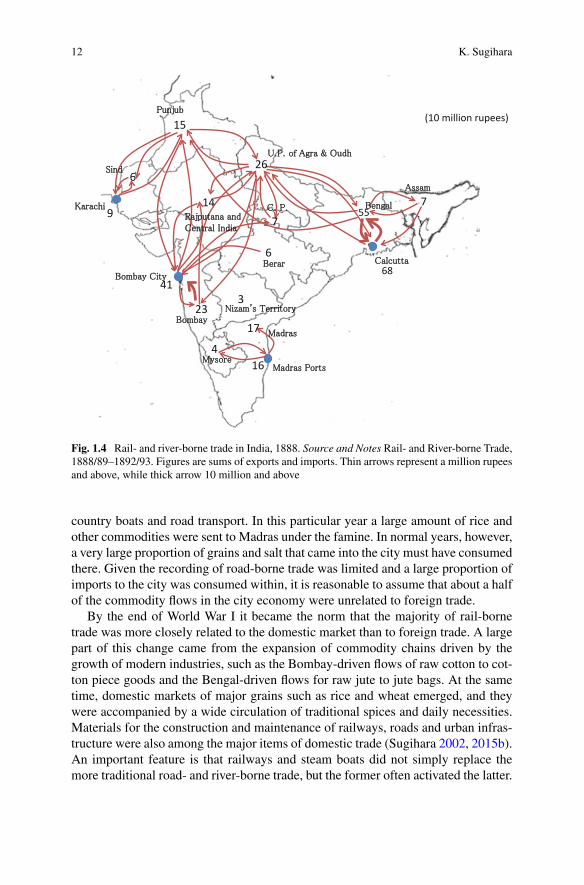
In order to show the magnitude of local and regional trade, it is useful to look atBritish India, a region with a massive amount of trade-related statistics. Here weshow some examples of different types of statistics such as coasting trade, rail-and river-borne and road-borne trade, in addition to foreign trade. Figure 1.4 showsthe magnitude of rail- and river-borne trade of India (largely British India exceptBurma, but includes many princely states) in 1888. By then large port cities suchas Calcutta, Bombay and Madras (and its surrounding ports) became regional hubsof Bengal, Bombay and Madras Presidencies respectively, and rail- and river-borne,coasting and road networks were developed to link them to hinterlands, often beyondeach presidency. Manufactured goods such as British cotton textiles were carriedinland, and in turn primary products were brought to port cities (for details, seeSugihara 2015b). According to the traditional interpretation, this was an attemptto build a transport infrastructure through a combination of British investment inIndian railways and promotion of long-distance trade. The British government ofIndia discouraged the development of Indian industries through tariff and exchangerate policies and preferential imports of British textile machinery and railway-relatedgoods.
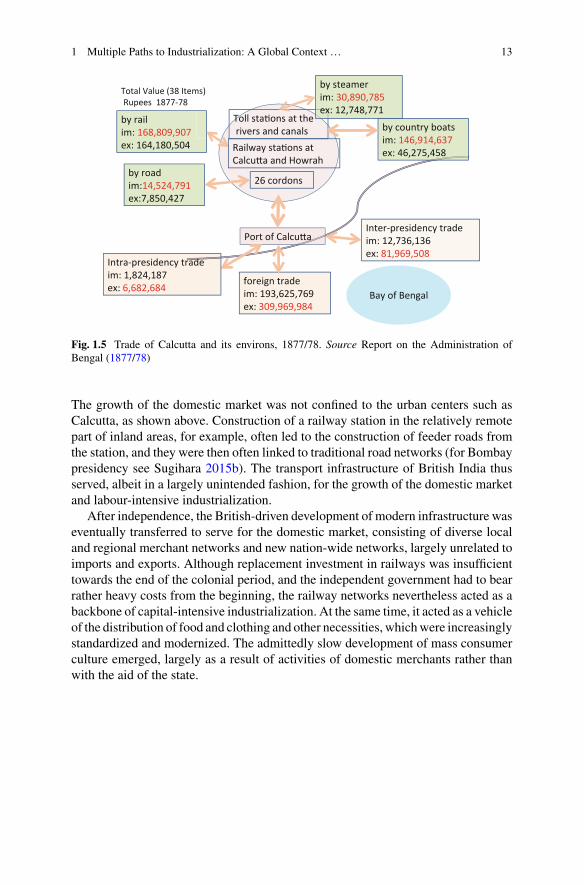
While such an account highlights an important aspect of development undercolonial rule, a closer look at regional statistics indicates a more complex picture.Figure 1.5 compares foreign trade, coasting trade, rail-borne trade, river-borne tradeand road-borne trade of Calcutta and its environs around 1877. According to Reporton the Administration of Bengal, the source of Fig. 1.5, foreign trade amounted to500 million rupees, while 330 million rupees of commodities were carried by rail,40 million by steam boats, 20 million by road (captured at a small number of ‘cor-dons’), and 190 million by ‘country boats’. The traditional understanding of the roleof the large port cities such as Calcutta was to import manufactured goods fromabroad and distribute them to districts of Bengal and other parts of North India,and to export primary products collected from inland areas. Indeed cotton textiles,liquors and wines, and iron imported from Britain were transported by rail to otherdistricts, while indigo, rice, linseed, wheat and raw jute were carried, mainly by rail,from Bengal, North Western Provinces and Oudh, Bihar and Punjab to Calcutta, andparts or most of them were exported. Tea was carried by steam boats from Assam toCalcutta, most of which were exported to Europe and the United States.
At the same time, those who operated in the central markets of the economy ofCalcutta and its environs were mainly Indian and India-based merchants. For themCalcutta was also a place of exchange of domestic goods, with the combined use offour vastly different types of transport, railways and steam boats on the one hand, andtraditional road transport and country boats on the other. From this perspective, thecombined statistics reveal that the greater part of imports of rice, raw jute, linseedand grams and pulse were actually imported by country boats rather than by rail.The greater part of both salt and rice trade (imports and exports) was conducted by
2The contents of this and next section are based on Sugihara (2019b).
12 K. Sugihara
557
68
26
15
14
4
6
41
6
9
16
17
3 23
7
(10 million rupees)
Fig. 1.4 Rail- and river-borne trade in India, 1888. Source and Notes Rail- and River-borne Trade,1888/89–1892/93. Figures are sums of exports and imports. Thin arrows represent a million rupeesand above, while thick arrow 10 million and above
country boats and road transport. In this particular year a large amount of rice andother commodities were sent to Madras under the famine. In normal years, however,a very large proportion of grains and salt that came into the city must have consumedthere. Given the recording of road-borne trade was limited and a large proportion ofimports to the city was consumed within, it is reasonable to assume that about a halfof the commodity flows in the city economy were unrelated to foreign trade.
By the end of World War I it became the norm that the majority of rail-bornetrade was more closely related to the domestic market than to foreign trade. A largepart of this change came from the expansion of commodity chains driven by thegrowth of modern industries, such as the Bombay-driven flows of raw cotton to cot-ton piece goods and the Bengal-driven flows for raw jute to jute bags. At the sametime, domestic markets of major grains such as rice and wheat emerged, and theywere accompanied by a wide circulation of traditional spices and daily necessities.Materials for the construction and maintenance of railways, roads and urban infras-tructure were also among the major items of domestic trade (Sugihara 2002, 2015b).An important feature is that railways and steam boats did not simply replace themore traditional road- and river-borne trade, but the former often activated the latter.
1 Multiple Paths to Industrialization: A Global Context … 13
Bay of Bengal
26 cordons
Toll sta ons at therivers and canals by country boats
im: 146,914,637ex: 46,275,458
by steamerim: 30,890,785ex: 12,748,771
by railim: 168,809,907ex: 164,180,504
by roadim:14,524,791ex:7,850,427
foreign tradeim: 193,625,769 ex: 309,969,984
Port of Calcu a
Total Value (38 Items)Rupees 1877-78
Inter-presidency tradeim: 12,736,136 ex: 81,969,508
Railway sta ons at Calcu a and Howrah
Intra-presidency tradeim: 1,824,187ex: 6,682,684
Fig. 1.5 Trade of Calcutta and its environs, 1877/78. Source Report on the Administration ofBengal (1877/78)
The growth of the domestic market was not confined to the urban centers such asCalcutta, as shown above. Construction of a railway station in the relatively remotepart of inland areas, for example, often led to the construction of feeder roads fromthe station, and they were then often linked to traditional road networks (for Bombaypresidency see Sugihara 2015b). The transport infrastructure of British India thusserved, albeit in a largely unintended fashion, for the growth of the domestic marketand labour-intensive industrialization.
After independence, the British-driven development of modern infrastructure waseventually transferred to serve for the domestic market, consisting of diverse localand regional merchant networks and new nation-wide networks, largely unrelated toimports and exports. Although replacement investment in railways was insufficienttowards the end of the colonial period, and the independent government had to bearrather heavy costs from the beginning, the railway networks nevertheless acted as abackbone of capital-intensive industrialization. At the same time, it acted as a vehicleof the distribution of food and clothing and other necessities, whichwere increasinglystandardized and modernized. The admittedly slow development of mass consumerculture emerged, largely as a result of activities of domestic merchants rather thanwith the aid of the state.
14 K. Sugihara
1.3.3 Indian Ocean Trade
The scale of local and regional trade in India was already quite large by the time ofthe development of the territorial rule by the English East India Company. Even inBengal where long-distance trade grew fast from the end of the eighteenth century,the sum of Calcutta’s intra-Asian trade, trade with other parts of India, and tradewithin the Bengal Presidency in 1811 was still greater than Calcutta’s long-distancetrade. Local and regional trade was much greater than long-distance trade in Bombayand Madras for that year (Sugihara 2009).
This picture changes dramatically by 1840.These three port cities greatly strength-ened links with Britain. A large part of traditional Indian Ocean trade declined, whileEuropeanmanufactures penetrated into the domesticmarket. Even so, the distributionof European goods and the transport of primary products to port cities were largelyconducted by Indian and India-based merchants. For example, sea-borne trade statis-tics of the city of Bombay records a large increase of both foreign trade and coastingtrade. Most of raw cotton was imported to the city of Bombay from other ports ofBombay Presidency before being exported mostly to Britain (Bombay PresidencyReport of the Commerce of Bombay; Bombay Trade and Navigation Annual State-ments). This means that even the most typical ‘long-distance trade’ was not underthe full control of Britain, but was dependent on the traditional trade networks. Forlocal merchants this was a new business. Available statistics alone does not tell us aclear overall decline of local and regional networks.
Did regional trade really decline in themid-nineteenth century onwards? It is clearthat there was a strong and sustained surge of long-distance trade of British Indiaafter the 1860s, led by the sudden increase of raw cotton from Bombay in the 1860s(against the ‘cotton famine’) and the opening of the Suez Canal. On the other hand, asharp decline of coasting trade only reflects the change of the recording methods oftrade statistics (intra-Presidency trade statistics largely disappear from the BombayPresidency data, for example). In reality, the establishment of the Suez Canal routeled to the reorganization of both India’s domestic trade and the Indian Ocean trade,involving Southeast Asia, East Asia, the Middle East, East Africa and South Africa.The rate of growth differed region by region and was not as rapid as long-distancetrade, but an increase of the absolute amount of regional trade seems clear.
Figure 1.6 shows the composition of geographical distribution of trade of eachcountry or region of the Indian Ocean and East Asia in 1910. The numbers referto the proportion of exports to Asia and Sub-Saharan Africa to the total amountof exports. The statistics come from the presidency data of British India and theBritish parliamentary papers. I have included the amount of coasting trade for BritishIndia trade statistics in this calculation, on the ground that they are trades betweendifferent regional economies, and are closer to other components of intra-Asian trade(such as the trade between the Straits Settlements and Siam). The Figure howeverexcludes all land trade (and, for that matter, all domestic trade in China), so it grosslyunderestimates the magnitude of local and regional trade. Nevertheless, it is clearthat many major ports were oriented towards regional trade rather than long-distance
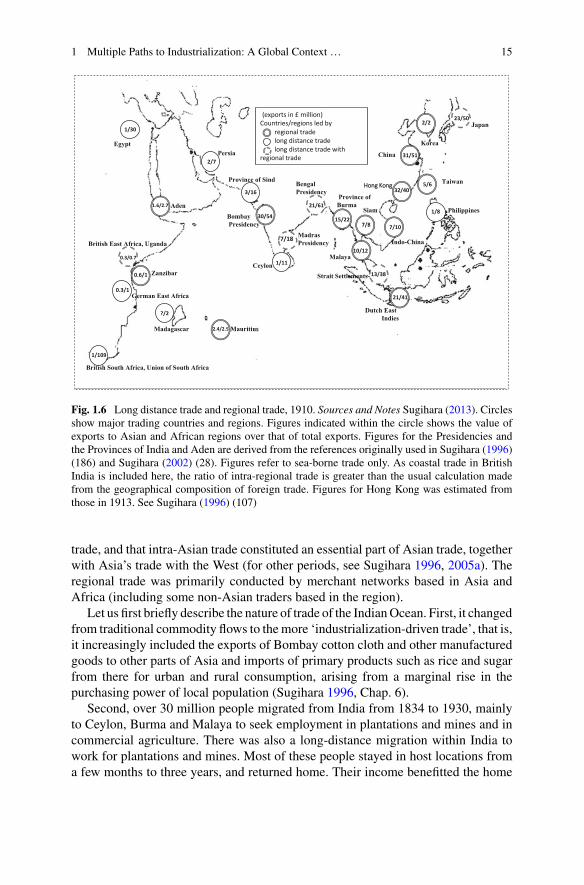
1 Multiple Paths to Industrialization: A Global Context … 15
(exports in £ million)Countries/regions led by
regional tradelong distance tradelong distance trade with
regional trade
BengalPresidency
BombayPresidency
MadrasPresidency
Mauritius
German East Africa
Zanzibar
British East Africa, Uganda
British South Africa, Union of South Africa
Hong Kong
China
Japan
Dutch EastIndies
Ceylon
Korea
Philippines
Strait Settlements
Indo-China
Province of Sind
Province of Burma
Siam
Malaya
2.4/2.5
0.3/1
0.6/1
0.3/0.7 10/12
21/41
7/8 7/10
1/8
31/51
2/2
Taiwan
PersiaEgypt
Madagascar
Aden
1/30
2/7
?/2
5/632/403/16
30/54 15/22
1.6/2.7
13/38
21/61
23/50
1/109
1/11
7/18
Fig. 1.6 Long distance trade and regional trade, 1910. Sources and Notes Sugihara (2013). Circlesshow major trading countries and regions. Figures indicated within the circle shows the value ofexports to Asian and African regions over that of total exports. Figures for the Presidencies andthe Provinces of India and Aden are derived from the references originally used in Sugihara (1996)(186) and Sugihara (2002) (28). Figures refer to sea-borne trade only. As coastal trade in BritishIndia is included here, the ratio of intra-regional trade is greater than the usual calculation madefrom the geographical composition of foreign trade. Figures for Hong Kong was estimated fromthose in 1913. See Sugihara (1996) (107)
trade, and that intra-Asian trade constituted an essential part of Asian trade, togetherwith Asia’s trade with the West (for other periods, see Sugihara 1996, 2005a). Theregional trade was primarily conducted by merchant networks based in Asia andAfrica (including some non-Asian traders based in the region).
Let us first briefly describe the nature of trade of the IndianOcean. First, it changedfrom traditional commodity flows to themore ‘industrialization-driven trade’, that is,it increasingly included the exports of Bombay cotton cloth and other manufacturedgoods to other parts of Asia and imports of primary products such as rice and sugarfrom there for urban and rural consumption, arising from a marginal rise in thepurchasing power of local population (Sugihara 1996, Chap. 6).
Second, over 30 million people migrated from India from 1834 to 1930, mainlyto Ceylon, Burma and Malaya to seek employment in plantations and mines and incommercial agriculture. There was also a long-distance migration within India towork for plantations and mines. Most of these people stayed in host locations froma few months to three years, and returned home. Their income benefitted the home
16 K. Sugihara
village, sometimes resulting in the improvement of the farmers’ status through thepurchase of cattle or land (Yanagisawa 1996). A large amount of intra-Asian trade inthis period is related to such temporarymigration, consisting of food and other neces-sities the migrants used. Indian merchant networks (and sometimes moneylenders aswell) followed the migration. Indian migrants were also seen in East Africa, SouthAfrica and the Caribbean, but an overwhelming proportion of themmoved within theBritish Empire. Migration to regions of recent settlement (such as Canada, Australiaand New Zealand) where high wages were on offer was extremely limited (Sugihara1996, Chap. 9, 1999).
Third, activities of merchant networks based in India expanded to Southeast andEast Asia.With the opening of ports to foreign trade in East Asia, Sassoons, for exam-ple, extended their networks to China and Japan, to deal with opium and other Asianproduce. Given the significance of India’s cotton yarn in the 1870s to the 1890s, Indiaclearly acted as an exporter of manufactured goods to East Asia at this stage. How-ever, Indian merchant networks soon faced a competition from Chinese networks.Also, with the more successful industrialization of Japan, India-based merchantsincreasingly handled imports of Japanese manufactured goods and exports of pri-mary products. Japan’s labour-intensive industries were competitive in the relativelycheap range of cotton textiles and sundries, and penetrated into diverse consumermarkets of the Indian Ocean. Japanese goods were often interpreted in local culturalcontexts (for example, Japanese matches were sold in Chinese or Indian labels),and in some areas import substitution of Japanese manufactured goods took place(Sugihara 1996, Chaps. 1 and 2; Oishi 2015).
The Indian Ocean trade as an arena possessed a high level of merchant abilitiesof organizing trade and production. Merchant networks did not necessarily bringmajor innovation in production, but were capable of organizing production networksand easing local resource constraints. Thus they connected cotton producing areasto modern spinning to hand-weaving, and created commodity chains. They alsocreated networks of grain trade, easing local food shortages and enabling peasantsto specialize in commercial production. In addition to Hindu and Muslim people,Parsis, a Zoroastrian community, and Jewish merchants originally from Baghdadwere among those who exploited cultural and ecological diversities in their ownways. Their presence reinforced the diverse nature of Indian Ocean trade, and helpedmake changes in commodity production and consumption compatible with religiousand linguistic characteristics.
To put this into the longer term perspective, early modern South Asia was at thecenter of a large regional trading world (Chaudhuri 1985). The South Asian path ofeconomic development was capable of coexisting with long-distance trade, a qualityabsent in the European path of economic development which pursued its own long-distance trade and territorial expansion, and in the East Asian path which severelyrestricted it. The Indian Ocean was the only large trading area that embraced regionaland global commodity flows in this period. The British rulers took advantage of thisquality for the economic integration of both the subcontinent and the Indian Ocean.
1 Multiple Paths to Industrialization: A Global Context … 17
1.3.4 The Wider Contexts
Figure 1.6 also charts East Asian countries and ports to show the relative significanceof Intra-Asian trade in 1910. As indicated above, the numbers refer to the proportionof exports to Asia and Sub-Saharan Africa to the total amount of exports. At thispoint the bulk of trade for East Asian ports was with East Asian and Southeast Asianports, with some crucial links with Indian ports.
We have already referred to intra-Asian cotton trade in relation to labour-intensiveindustrialization in Sect. 1.2. In addition, Japan imported rice and sugar from South-east Asia before Korea and Taiwan under Japanese rule became providers of theseitems. By the interwar period the Chinese position shifted from an importer of cottonyarn from India and Japan to exporters of a small amount of cotton cloth to SoutheastAsia, reflecting import-substitution industrialization. Perhaps more important was alarge amount of remittances of overseas Chinese from Southeast Asia. Between 1891and 1938 at least 14 million people migrated to Southeast Asia, mostly for a shortperiod. Unlike Indian counterparts, it was relatively easy to move from labourersto merchants, and within merchant communities from small shop keepers to whole-salers to foreign traders. Dialect-based groups constituted powerful migration net-works across Southern China and Southeast Asia, to freely move labourers around,often via Hong Kong and Singapore (Sugihara 2005b).
Hong Kong and Singapore also played as a hub of intra-Asian trade, linkingit to both long-distance trade and intra-Southeast-Asian trade. Three chapters ofthis volume discuss aspects of the path dependency of Southeast Asia as a pivotalregion of Asia’s trade. It not only acted as a region of active trading at all levels, butplayed a vital role in linking economies surrounding the Indian Ocean and countriesunder the tributary trade system in East Asia. In early modern Asia, China andIndia fed the bulk of population, while first serious European contacts with EastAsia were likely to be made in or through Southeast Asia. In Chap. 3 Shimadaoutlines Southeast Asia’s long-term path of economic development, and argues forthe fundamental importance of intra-Asian trade in shaping it. InChap. 4Ota capturesthe persistence and development of ‘China-oriented trade’ from the eighteenth to thenineteenth century, and describes the changing relationships between trade and thestate. Commerce was often as important as production for state formation. At onepoint, part of the state functions was performed by commercial groups and theirmilitary wings. Examination of the distinct trajectory of trade-sensitive regionalgovernance goes a longway towards explaining how it was possible for agriculturallyfragile and environmentally and politically unstable parts of maritime Asia to handlean intra-regional trade of this magnitude. In Chap. 5 Kobayashi describes the growthof Singapore by examining the period from the early nineteenth to the early twentiethcentury, and locates it in the context of the region’s path of economic development.TheWestern impact, colonialismandglobalizationdidnot destroy the long-termpath.Development of Singapore as a trading and information hub shows that an originallycolonial port city exhibited an extraordinary capacity to embrace environmental,technological and institutional diversities within the region.
18 K. Sugihara
By the end of the nineteenth century Southeast Asia’s imports of Indian textilesbecame small, and gradually shifted towards a higher value added range. By contrastexports of lower value added range of Indian cloth to East Africa remained important,and competed with European textiles to some extent. In other words, intra-regionaltrade sought complementarity with long-distance trade, and expanded its geographi-cal scope by connecting to new markets on the one hand, and by upgrading the rangeof manufactured goods on the other.
Finally, intra-East-Asian trade grew very fast after WorldWar I, mainly as a resultof the growth of trade of Korea and Taiwan with Japan. By the late 1930s intra-yen-bloc trade numerically dominated intra-Asian trade. The composition of this tradealso changed to include exports of machinery, reflecting industrialization in Korea(Hori 2009). While these developments are important for the economic developmentof Korea and Taiwan under colonial rule, their trade was severely confined to tradewith Japan. The Japanese strategy for trade expansion in Asia increasingly soughtautarchy, ignoring the position of Asia inworld trade. For example, the bulk of rubberexports from Malaya to the United States and Europe could not possibly have beenabsorbed within the imagined Japanese ‘co-prosperity sphere’. Neither would Japanhave survived without the imports of oil and minerals, as well as raw cotton, fromoutside the Japanese sphere of influence. In these respects the mechanism of pre-warintra-Asian trade was destroyed as a result of Japanese aggression. A post-war orderwas built on the new trend of decolonization and the Cold War divide, as well as theexperiences of the war-time controlled economy.
1.4 Paths to Industrialization
1.4.1 Regional Industrialization
The previous section addressed the question of why the growth of intra-Asian tradewas important for the emergence of the international division of labour, includinglabour-intensive industrialization. To recapture, the world economy in the long nine-teenth century was not entirely generated by the dynamics of Atlantic economy,nor was it ‘bipolarised’ by the development of the ‘enclave economies’. Lookingat the period from 1820 to 1950 as a whole, the intra-regional trading sphere ofAsia showed a common tendency to expand by commercializing its agriculture andreorganizing its traditional industries, and by linking modern manufacturing to thisexpansion, which resulted in the evolution of the system comprising the divisionof labour between agriculture and industry within the region. The period saw thatWestern powers (and regions of recent settlement) and Asia (and the tropical regionsto which Asian workers emigrated) simultaneously developed high-wage and low-wage economies (see Lewis 1978: especially 194–224 for a similar formulation; forcriticism see Sugihara 2013: 21, 22, 27). The former used more resources, while thelatter fed more people. Uneven allocation of resources underpinned two different
1 Multiple Paths to Industrialization: A Global Context … 19
paths to industrialization. Together, they fuelled and sustained the expansion of theworld economy.
During the interwar period labour-intensive industrialization was more systemati-cally extended from Japan to China andKorea, with state and colonial reinforcement,and the ‘flying geese pattern of economic development’ (Akamatsu 1962) emergedbetween Japan and China (see Abe 2005). By 1938 intra-Asian trade, by then dom-inated by the Yen bloc, was the second largest area of intra-regional trade, nextto intra-European trade, consisting of 9% of world trade at the level of recordedstatistics.
After a heavy intervention of the emergence, development and abrupt collapse ofthe Yen bloc in the 1930s and the first half of the 1940s, intra-Asian trade recoveredfast among a smaller number of countries. By 1950, India, China, many SoutheastAsian countries, and North Korea withdrew from the regime of free trade, whilethe countries along the western Pacific coast (Japan, South Korea, Taiwan, HongKong and Malaya-Singapore among others) were integrated into the U.S.-led worldeconomy.
Table 1.1 summarizes the growth of Asia’s trade and intra-Asian trade in relationto world trade. In the early post-war period, the share of the U.S. (and other Westerncountries) in Asia’s trade was large, and its influence was dominant. However, theU.S. share rapidly declined, and was replaced by the growth of regionally-driventrade. In 1965 the share of ten major Asian countries in world exports was 14%, butthis share increased to 23% in 2000, and to 31% in 2015. More important, the shareof intra-Asian trade in Asia ten’s exports increased from 35% in 1965 to 51% in2000, and to 70% in 2015, a figure comparable to intra-E.U. trade.
The post-war diffusion of industrialization, beginning in Japan and spreadingto other Asian countries, followed the same interactive path between intra-regionaltrade and industrialization as in the prewar years, first among a small number ofcountries under the regime of free trade, and gradually embracing others. For exam-ple, think of the ‘Asian textile complex’ in the 1970s, in which Japan produced rayonyarn, Taiwan wove rayon cloth, and Hong Kong made the cloth into an apparel andexported the apparel to the United States (Arpan et al. 1984: 112–7, 136–49, 159).New intermediate goods included cheap plastics, man-made fibres, machine parts,and eventually IC chips. As in the pre-war period, we do not see such a dynamic rela-tionship between regions in Africa, Middle East or Latin America. South Africa andBrazil proceeded with industrialization without accompanying regional integration.It is only in Asia that economic nationalism has embraced regional integration.
Generally speaking, therefore, the labour-intensive path of economic developmentwas suited to Asia’s factor endowment in relation to the rest of the world. In practice,each industrialization was country-specific (or rather the modern nation state wasoften created to realize industrialization and modernization). This volume offersthree chapters on industrialization experiences of Japan, China and India.
Themost obvious country that benefitted fromboth transfer ofWestern technologyand institutions, and availability of a very largemarket for cheapmanufactured goodsin Asia was Japan. In Chap. 6 Tanimoto discusses the nature of Japan’s pre-warindustrialization, in which to locate labour-intensive industrialization, with special
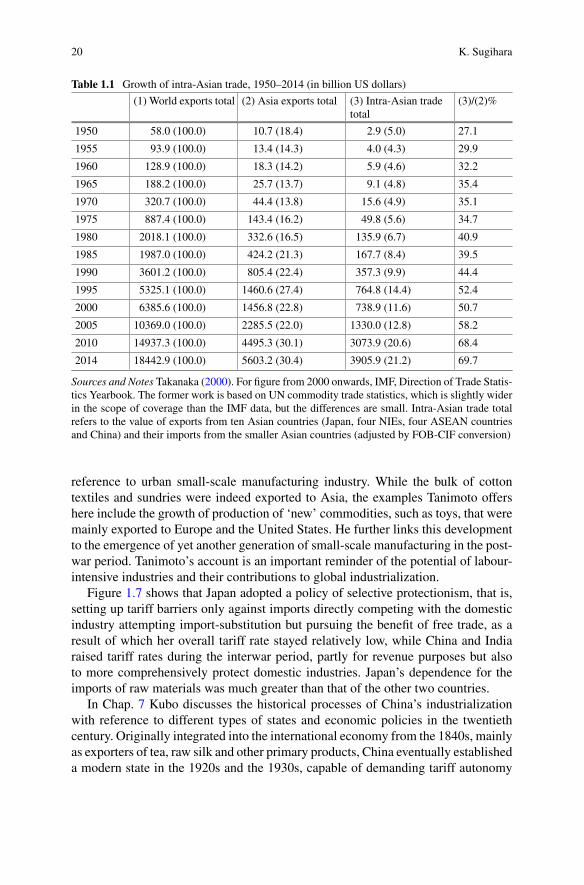
20 K. Sugihara
Table 1.1 Growth of intra-Asian trade, 1950–2014 (in billion US dollars)
(1) World exports total (2) Asia exports total (3) Intra-Asian tradetotal
(3)/(2)%
1950 58.0 (100.0) 10.7 (18.4) 2.9 (5.0) 27.1
1955 93.9 (100.0) 13.4 (14.3) 4.0 (4.3) 29.9
1960 128.9 (100.0) 18.3 (14.2) 5.9 (4.6) 32.2
1965 188.2 (100.0) 25.7 (13.7) 9.1 (4.8) 35.4
1970 320.7 (100.0) 44.4 (13.8) 15.6 (4.9) 35.1
1975 887.4 (100.0) 143.4 (16.2) 49.8 (5.6) 34.7
1980 2018.1 (100.0) 332.6 (16.5) 135.9 (6.7) 40.9
1985 1987.0 (100.0) 424.2 (21.3) 167.7 (8.4) 39.5
1990 3601.2 (100.0) 805.4 (22.4) 357.3 (9.9) 44.4
1995 5325.1 (100.0) 1460.6 (27.4) 764.8 (14.4) 52.4
2000 6385.6 (100.0) 1456.8 (22.8) 738.9 (11.6) 50.7
2005 10369.0 (100.0) 2285.5 (22.0) 1330.0 (12.8) 58.2
2010 14937.3 (100.0) 4495.3 (30.1) 3073.9 (20.6) 68.4
2014 18442.9 (100.0) 5603.2 (30.4) 3905.9 (21.2) 69.7
Sources and Notes Takanaka (2000). For figure from 2000 onwards, IMF, Direction of Trade Statis-tics Yearbook. The former work is based on UN commodity trade statistics, which is slightly widerin the scope of coverage than the IMF data, but the differences are small. Intra-Asian trade totalrefers to the value of exports from ten Asian countries (Japan, four NIEs, four ASEAN countriesand China) and their imports from the smaller Asian countries (adjusted by FOB-CIF conversion)
reference to urban small-scale manufacturing industry. While the bulk of cottontextiles and sundries were indeed exported to Asia, the examples Tanimoto offershere include the growth of production of ‘new’ commodities, such as toys, that weremainly exported to Europe and the United States. He further links this developmentto the emergence of yet another generation of small-scale manufacturing in the post-war period. Tanimoto’s account is an important reminder of the potential of labour-intensive industries and their contributions to global industrialization.
Figure 1.7 shows that Japan adopted a policy of selective protectionism, that is,setting up tariff barriers only against imports directly competing with the domesticindustry attempting import-substitution but pursuing the benefit of free trade, as aresult of which her overall tariff rate stayed relatively low, while China and Indiaraised tariff rates during the interwar period, partly for revenue purposes but alsoto more comprehensively protect domestic industries. Japan’s dependence for theimports of raw materials was much greater than that of the other two countries.
In Chap. 7 Kubo discusses the historical processes of China’s industrializationwith reference to different types of states and economic policies in the twentiethcentury. Originally integrated into the international economy from the 1840s, mainlyas exporters of tea, raw silk and other primary products, China eventually establisheda modern state in the 1920s and the 1930s, capable of demanding tariff autonomy
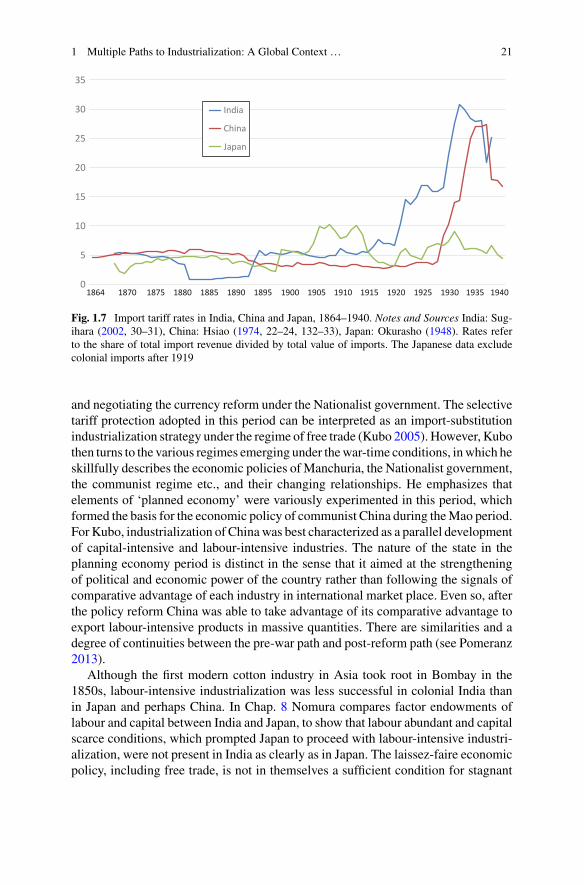
1 Multiple Paths to Industrialization: A Global Context … 21
0
5
10
15
20
25
30
35
India
China
Japan
1864 1870 1875 1880 1885 1890 1895 1900 1905 1910 1915 1920 1925 1930 1935 1940
Fig. 1.7 Import tariff rates in India, China and Japan, 1864–1940. Notes and Sources India: Sug-ihara (2002, 30–31), China: Hsiao (1974, 22–24, 132–33), Japan: Okurasho (1948). Rates referto the share of total import revenue divided by total value of imports. The Japanese data excludecolonial imports after 1919
and negotiating the currency reform under the Nationalist government. The selectivetariff protection adopted in this period can be interpreted as an import-substitutionindustrialization strategy under the regime of free trade (Kubo 2005). However, Kubothen turns to the various regimes emerging under thewar-time conditions, inwhich heskillfully describes the economic policies ofManchuria, the Nationalist government,the communist regime etc., and their changing relationships. He emphasizes thatelements of ‘planned economy’ were variously experimented in this period, whichformed the basis for the economic policy of communist China during theMao period.For Kubo, industrialization of Chinawas best characterized as a parallel developmentof capital-intensive and labour-intensive industries. The nature of the state in theplanning economy period is distinct in the sense that it aimed at the strengtheningof political and economic power of the country rather than following the signals ofcomparative advantage of each industry in international market place. Even so, afterthe policy reform China was able to take advantage of its comparative advantage toexport labour-intensive products in massive quantities. There are similarities and adegree of continuities between the pre-war path and post-reform path (see Pomeranz2013).
Although the first modern cotton industry in Asia took root in Bombay in the1850s, labour-intensive industrialization was less successful in colonial India thanin Japan and perhaps China. In Chap. 8 Nomura compares factor endowments oflabour and capital between India and Japan, to show that labour abundant and capitalscarce conditions, which prompted Japan to proceed with labour-intensive industri-alization, were not present in India as clearly as in Japan. The laissez-faire economicpolicy, including free trade, is not in themselves a sufficient condition for stagnant
22 K. Sugihara
industrialization, although it may have affected the potentiality of industrializationthrough the fiscal stringency of the British government of India, leading to the lackof encouragement of education, for example. It also argues that other factors suchas the slow technological transfer arising from the nature of Indian organization andmanagement must be taken into account.
In independent India, import-substitution industrialization strategy made it dif-ficult to pursue labour-intensive industrialization, in spite of the fact that it hadlong historical roots (Roy 2005, Chap. 6). There was the heritage of the nationalistmovement, which advocated the protection and development of traditional cottageindustries, including economically inefficient sectors like khadi and handloom seg-ments. Partly inheriting the Gandhian tradition and partly in a more explicit effort tocreate employment, these sectors had been isolated from international competition.Meanwhile, the government protected the large-scale modern cotton textile industry,which in turn provided the traditional weaving industries with cheap machine-madeyarn. Labour in the organized sector was legally protected, whichmade it difficult forany factory to lay off its workers. Furthermore, because of the virtual prohibition ofthe imports of textile machinery and the installation of new machinery in the factory,there was little chance of raising productivity or improving the quality of yarn. As aresult, the Indian cotton textile industry went through a long period of isolation fromthe rapid technological advance in Asian countries, led by Japan. More generally,the ideology for the political and economic autonomy remained powerful in India.
In India several attempts were made to liberalize the economy after 1965 withoutmuch success. The policy shift of 1991 realized a degree of liberalization of tradeand capital flows, and was a step towards deregulation, but it did not represent amajor ideological change in economic policy among the Indian elites. In particular,the rate of increase in the expenditure on education and welfare for the ordinarypeople, relative to that for elites, has been slow. Yet a high level of capability basedon primary and secondary education (the literacy rate remains a major problem) andhygiene (especially low infant mortality) is clearly a necessary, though not sufficient,condition for economic development. In this respect the Chinese achievement duringthe pre-reform period (1949–1979) was far more impressive (Dreze and Sen 1995,1997).
Nevertheless, the economic reforms of 1991 sharply corrected India’s bias towardsstrong economic ties with the Soviet Union and other socialist countries. Exportgrowth in the 1990s mainly came from labour-intensive industrial goods, includ-ing woven cloth, knitwear, garments, leather, machine components and software.Primarily through exports of textiles and apparel, India became progressively inte-grated into the international economy during the 1990s (Sugihara 2001). By 2000India was trading more with the Asia-Pacific countries than with Western Europe,the Middle East, the former socialist countries and Africa combined.
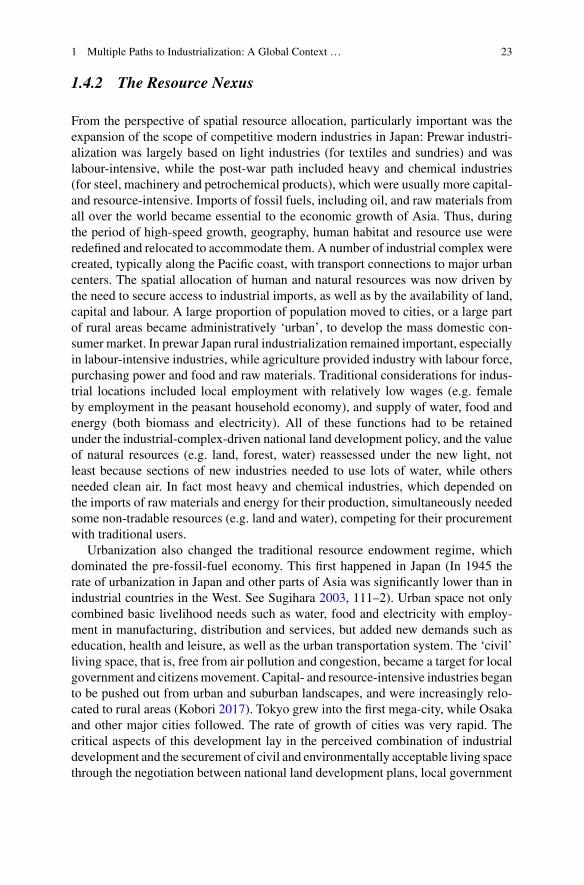
1 Multiple Paths to Industrialization: A Global Context … 23
1.4.2 The Resource Nexus
From the perspective of spatial resource allocation, particularly important was theexpansion of the scope of competitive modern industries in Japan: Prewar industri-alization was largely based on light industries (for textiles and sundries) and waslabour-intensive, while the post-war path included heavy and chemical industries(for steel, machinery and petrochemical products), which were usually more capital-and resource-intensive. Imports of fossil fuels, including oil, and raw materials fromall over the world became essential to the economic growth of Asia. Thus, duringthe period of high-speed growth, geography, human habitat and resource use wereredefined and relocated to accommodate them. A number of industrial complex werecreated, typically along the Pacific coast, with transport connections to major urbancenters. The spatial allocation of human and natural resources was now driven bythe need to secure access to industrial imports, as well as by the availability of land,capital and labour. A large proportion of population moved to cities, or a large partof rural areas became administratively ‘urban’, to develop the mass domestic con-sumer market. In prewar Japan rural industrialization remained important, especiallyin labour-intensive industries, while agriculture provided industry with labour force,purchasing power and food and raw materials. Traditional considerations for indus-trial locations included local employment with relatively low wages (e.g. femaleby employment in the peasant household economy), and supply of water, food andenergy (both biomass and electricity). All of these functions had to be retainedunder the industrial-complex-driven national land development policy, and the valueof natural resources (e.g. land, forest, water) reassessed under the new light, notleast because sections of new industries needed to use lots of water, while othersneeded clean air. In fact most heavy and chemical industries, which depended onthe imports of raw materials and energy for their production, simultaneously neededsome non-tradable resources (e.g. land and water), competing for their procurementwith traditional users.
Urbanization also changed the traditional resource endowment regime, whichdominated the pre-fossil-fuel economy. This first happened in Japan (In 1945 therate of urbanization in Japan and other parts of Asia was significantly lower than inindustrial countries in the West. See Sugihara 2003, 111–2). Urban space not onlycombined basic livelihood needs such as water, food and electricity with employ-ment in manufacturing, distribution and services, but added new demands such aseducation, health and leisure, as well as the urban transportation system. The ‘civil’living space, that is, free from air pollution and congestion, became a target for localgovernment and citizensmovement. Capital- and resource-intensive industries beganto be pushed out from urban and suburban landscapes, and were increasingly relo-cated to rural areas (Kobori 2017). Tokyo grew into the first mega-city, while Osakaand other major cities followed. The rate of growth of cities was very rapid. Thecritical aspects of this development lay in the perceived combination of industrialdevelopment and the securement of civil and environmentally acceptable living spacethrough the negotiation between national land development plans, local government
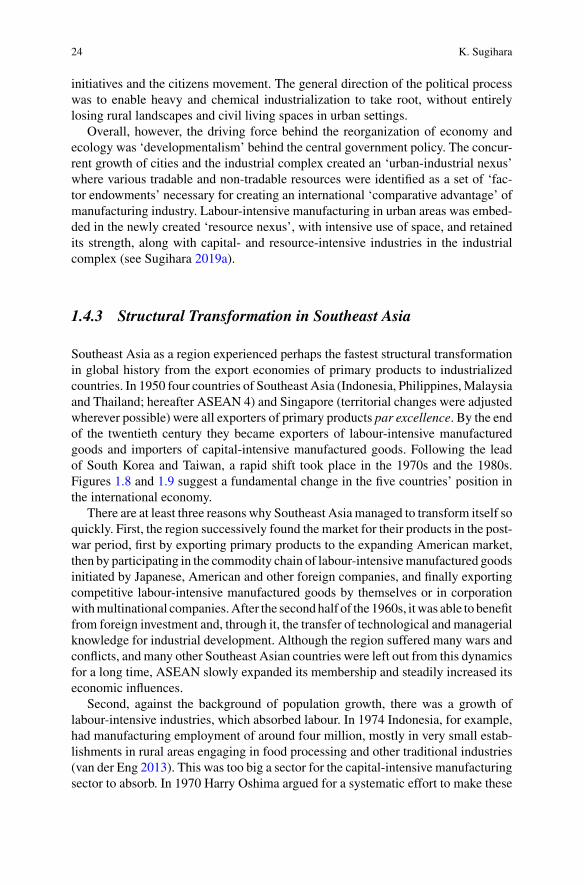
24 K. Sugihara
initiatives and the citizens movement. The general direction of the political processwas to enable heavy and chemical industrialization to take root, without entirelylosing rural landscapes and civil living spaces in urban settings.
Overall, however, the driving force behind the reorganization of economy andecology was ‘developmentalism’ behind the central government policy. The concur-rent growth of cities and the industrial complex created an ‘urban-industrial nexus’where various tradable and non-tradable resources were identified as a set of ‘fac-tor endowments’ necessary for creating an international ‘comparative advantage’ ofmanufacturing industry. Labour-intensive manufacturing in urban areas was embed-ded in the newly created ‘resource nexus’, with intensive use of space, and retainedits strength, along with capital- and resource-intensive industries in the industrialcomplex (see Sugihara 2019a).
1.4.3 Structural Transformation in Southeast Asia
Southeast Asia as a region experienced perhaps the fastest structural transformationin global history from the export economies of primary products to industrializedcountries. In 1950 four countries of Southeast Asia (Indonesia, Philippines,Malaysiaand Thailand; hereafter ASEAN 4) and Singapore (territorial changes were adjustedwherever possible) were all exporters of primary products par excellence. By the endof the twentieth century they became exporters of labour-intensive manufacturedgoods and importers of capital-intensive manufactured goods. Following the leadof South Korea and Taiwan, a rapid shift took place in the 1970s and the 1980s.Figures 1.8 and 1.9 suggest a fundamental change in the five countries’ position inthe international economy.
There are at least three reasons why Southeast Asia managed to transform itself soquickly. First, the region successively found the market for their products in the post-war period, first by exporting primary products to the expanding American market,then by participating in the commodity chain of labour-intensivemanufactured goodsinitiated by Japanese, American and other foreign companies, and finally exportingcompetitive labour-intensive manufactured goods by themselves or in corporationwithmultinational companies.After the secondhalf of the 1960s, itwas able to benefitfrom foreign investment and, through it, the transfer of technological and managerialknowledge for industrial development. Although the region suffered many wars andconflicts, and many other Southeast Asian countries were left out from this dynamicsfor a long time, ASEAN slowly expanded its membership and steadily increased itseconomic influences.
Second, against the background of population growth, there was a growth oflabour-intensive industries, which absorbed labour. In 1974 Indonesia, for example,had manufacturing employment of around four million, mostly in very small estab-lishments in rural areas engaging in food processing and other traditional industries(van der Eng 2013). This was too big a sector for the capital-intensive manufacturingsector to absorb. In 1970 Harry Oshima argued for a systematic effort to make these
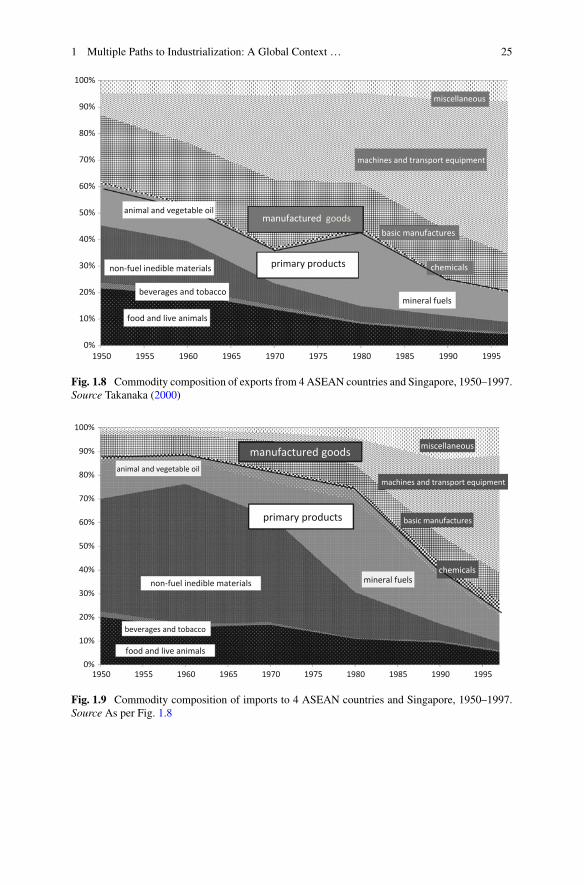
1 Multiple Paths to Industrialization: A Global Context … 25
0%
10%
20%
30%
40%
50%
60%
70%
80%
90%
100%
1950 1955 1960 1965 1970 1975 1980 1985 1990 1995
food and live animals
beverages and tobacco
non-fuel inedible materials
miscellaneous
machines and transport equipment
basic manufactures
chemicalsprimary products
manufactured goodsanimal and vegetable oil
mineral fuels
Fig. 1.8 Commodity composition of exports from 4 ASEAN countries and Singapore, 1950–1997.Source Takanaka (2000)
0%
10%
20%
30%
40%
50%
60%
70%
80%
90%
100%
1950 1955 1960 1965 1970 1975 1980 1985 1990 1995
machines and transport equipment
miscellaneous
basic manufactures
chemicalsmineral fuels
animal and vegetable oil
beverages and tobacco
non-fuel inedible materials
food and live animals
manufactured goods
primary products
Fig. 1.9 Commodity composition of imports to 4 ASEAN countries and Singapore, 1950–1997.Source As per Fig. 1.8
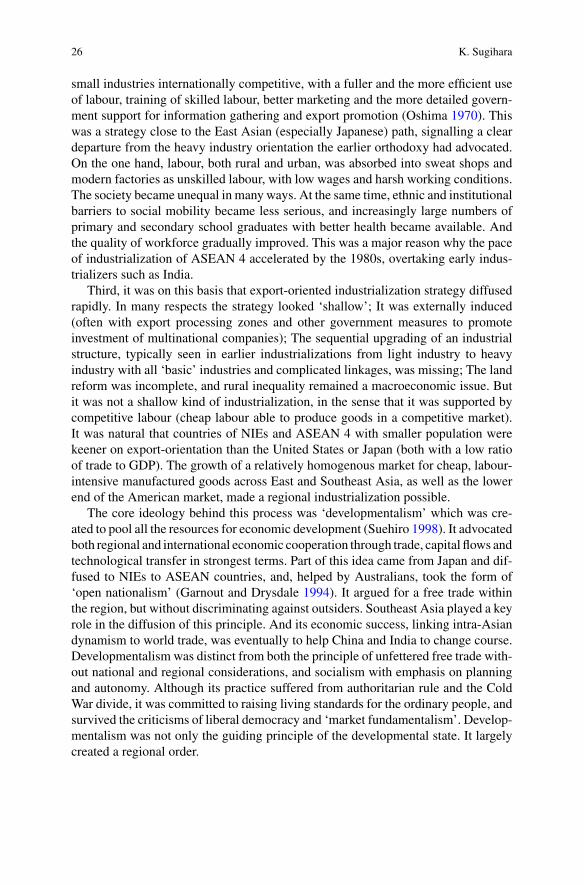
26 K. Sugihara
small industries internationally competitive, with a fuller and the more efficient useof labour, training of skilled labour, better marketing and the more detailed govern-ment support for information gathering and export promotion (Oshima 1970). Thiswas a strategy close to the East Asian (especially Japanese) path, signalling a cleardeparture from the heavy industry orientation the earlier orthodoxy had advocated.On the one hand, labour, both rural and urban, was absorbed into sweat shops andmodern factories as unskilled labour, with low wages and harsh working conditions.The society became unequal in many ways. At the same time, ethnic and institutionalbarriers to social mobility became less serious, and increasingly large numbers ofprimary and secondary school graduates with better health became available. Andthe quality of workforce gradually improved. This was a major reason why the paceof industrialization of ASEAN 4 accelerated by the 1980s, overtaking early indus-trializers such as India.
Third, it was on this basis that export-oriented industrialization strategy diffusedrapidly. In many respects the strategy looked ‘shallow’; It was externally induced(often with export processing zones and other government measures to promoteinvestment of multinational companies); The sequential upgrading of an industrialstructure, typically seen in earlier industrializations from light industry to heavyindustry with all ‘basic’ industries and complicated linkages, was missing; The landreform was incomplete, and rural inequality remained a macroeconomic issue. Butit was not a shallow kind of industrialization, in the sense that it was supported bycompetitive labour (cheap labour able to produce goods in a competitive market).It was natural that countries of NIEs and ASEAN 4 with smaller population werekeener on export-orientation than the United States or Japan (both with a low ratioof trade to GDP). The growth of a relatively homogenous market for cheap, labour-intensive manufactured goods across East and Southeast Asia, as well as the lowerend of the American market, made a regional industrialization possible.
The core ideology behind this process was ‘developmentalism’ which was cre-ated to pool all the resources for economic development (Suehiro 1998). It advocatedboth regional and international economic cooperation through trade, capital flows andtechnological transfer in strongest terms. Part of this idea came from Japan and dif-fused to NIEs to ASEAN countries, and, helped by Australians, took the form of‘open nationalism’ (Garnout and Drysdale 1994). It argued for a free trade withinthe region, but without discriminating against outsiders. Southeast Asia played a keyrole in the diffusion of this principle. And its economic success, linking intra-Asiandynamism to world trade, was eventually to help China and India to change course.Developmentalism was distinct from both the principle of unfettered free trade with-out national and regional considerations, and socialism with emphasis on planningand autonomy. Although its practice suffered from authoritarian rule and the ColdWar divide, it was committed to raising living standards for the ordinary people, andsurvived the criticisms of liberal democracy and ‘market fundamentalism’. Develop-mentalism was not only the guiding principle of the developmental state. It largelycreated a regional order.
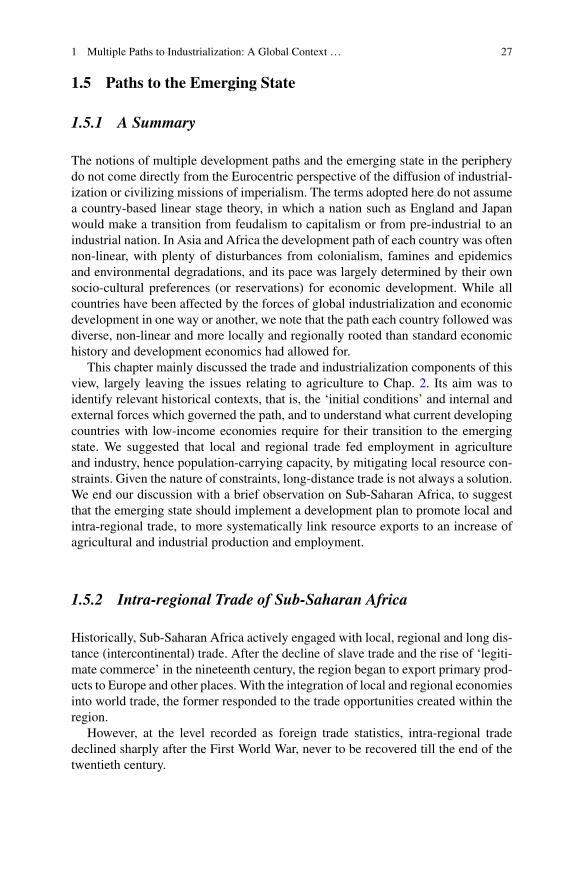
1 Multiple Paths to Industrialization: A Global Context … 27
1.5 Paths to the Emerging State
1.5.1 A Summary
The notions of multiple development paths and the emerging state in the peripherydo not come directly from the Eurocentric perspective of the diffusion of industrial-ization or civilizing missions of imperialism. The terms adopted here do not assumea country-based linear stage theory, in which a nation such as England and Japanwould make a transition from feudalism to capitalism or from pre-industrial to anindustrial nation. In Asia and Africa the development path of each country was oftennon-linear, with plenty of disturbances from colonialism, famines and epidemicsand environmental degradations, and its pace was largely determined by their ownsocio-cultural preferences (or reservations) for economic development. While allcountries have been affected by the forces of global industrialization and economicdevelopment in one way or another, we note that the path each country followed wasdiverse, non-linear and more locally and regionally rooted than standard economichistory and development economics had allowed for.
This chapter mainly discussed the trade and industrialization components of thisview, largely leaving the issues relating to agriculture to Chap. 2. Its aim was toidentify relevant historical contexts, that is, the ‘initial conditions’ and internal andexternal forces which governed the path, and to understand what current developingcountries with low-income economies require for their transition to the emergingstate. We suggested that local and regional trade fed employment in agricultureand industry, hence population-carrying capacity, by mitigating local resource con-straints. Given the nature of constraints, long-distance trade is not always a solution.We end our discussion with a brief observation on Sub-Saharan Africa, to suggestthat the emerging state should implement a development plan to promote local andintra-regional trade, to more systematically link resource exports to an increase ofagricultural and industrial production and employment.
1.5.2 Intra-regional Trade of Sub-Saharan Africa
Historically, Sub-Saharan Africa actively engaged with local, regional and long dis-tance (intercontinental) trade. After the decline of slave trade and the rise of ‘legiti-mate commerce’ in the nineteenth century, the region began to export primary prod-ucts to Europe and other places. With the integration of local and regional economiesinto world trade, the former responded to the trade opportunities created within theregion.
However, at the level recorded as foreign trade statistics, intra-regional tradedeclined sharply after the First World War, never to be recovered till the end of thetwentieth century.
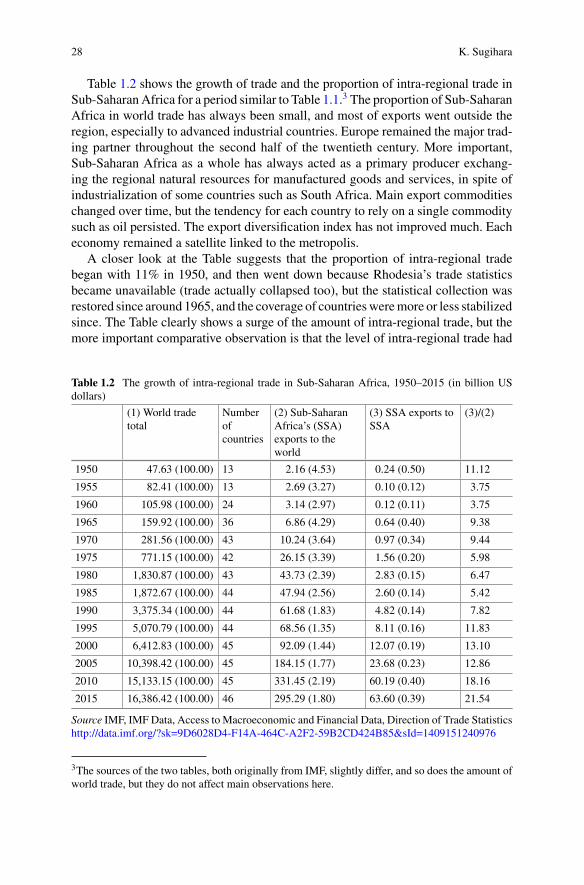
28 K. Sugihara
Table 1.2 shows the growth of trade and the proportion of intra-regional trade inSub-SaharanAfrica for a period similar to Table 1.1.3 The proportion of Sub-SaharanAfrica in world trade has always been small, and most of exports went outside theregion, especially to advanced industrial countries. Europe remained the major trad-ing partner throughout the second half of the twentieth century. More important,Sub-Saharan Africa as a whole has always acted as a primary producer exchang-ing the regional natural resources for manufactured goods and services, in spite ofindustrialization of some countries such as South Africa. Main export commoditieschanged over time, but the tendency for each country to rely on a single commoditysuch as oil persisted. The export diversification index has not improved much. Eacheconomy remained a satellite linked to the metropolis.
A closer look at the Table suggests that the proportion of intra-regional tradebegan with 11% in 1950, and then went down because Rhodesia’s trade statisticsbecame unavailable (trade actually collapsed too), but the statistical collection wasrestored since around 1965, and the coverage of countriesweremore or less stabilizedsince. The Table clearly shows a surge of the amount of intra-regional trade, but themore important comparative observation is that the level of intra-regional trade had
Table 1.2 The growth of intra-regional trade in Sub-Saharan Africa, 1950–2015 (in billion USdollars)
(1) World tradetotal
Numberofcountries
(2) Sub-SaharanAfrica’s (SSA)exports to theworld
(3) SSA exports toSSA
(3)/(2)
1950 47.63 (100.00) 13 2.16 (4.53) 0.24 (0.50) 11.12
1955 82.41 (100.00) 13 2.69 (3.27) 0.10 (0.12) 3.75
1960 105.98 (100.00) 24 3.14 (2.97) 0.12 (0.11) 3.75
1965 159.92 (100.00) 36 6.86 (4.29) 0.64 (0.40) 9.38
1970 281.56 (100.00) 43 10.24 (3.64) 0.97 (0.34) 9.44
1975 771.15 (100.00) 42 26.15 (3.39) 1.56 (0.20) 5.98
1980 1,830.87 (100.00) 43 43.73 (2.39) 2.83 (0.15) 6.47
1985 1,872.67 (100.00) 44 47.94 (2.56) 2.60 (0.14) 5.42
1990 3,375.34 (100.00) 44 61.68 (1.83) 4.82 (0.14) 7.82
1995 5,070.79 (100.00) 44 68.56 (1.35) 8.11 (0.16) 11.83
2000 6,412.83 (100.00) 45 92.09 (1.44) 12.07 (0.19) 13.10
2005 10,398.42 (100.00) 45 184.15 (1.77) 23.68 (0.23) 12.86
2010 15,133.15 (100.00) 45 331.45 (2.19) 60.19 (0.40) 18.16
2015 16,386.42 (100.00) 46 295.29 (1.80) 63.60 (0.39) 21.54
Source IMF, IMF Data, Access to Macroeconomic and Financial Data, Direction of Trade Statisticshttp://data.imf.org/?sk=9D6028D4-F14A-464C-A2F2-59B2CD424B85&sId=1409151240976
3The sources of the two tables, both originally from IMF, slightly differ, and so does the amount ofworld trade, but they do not affect main observations here.
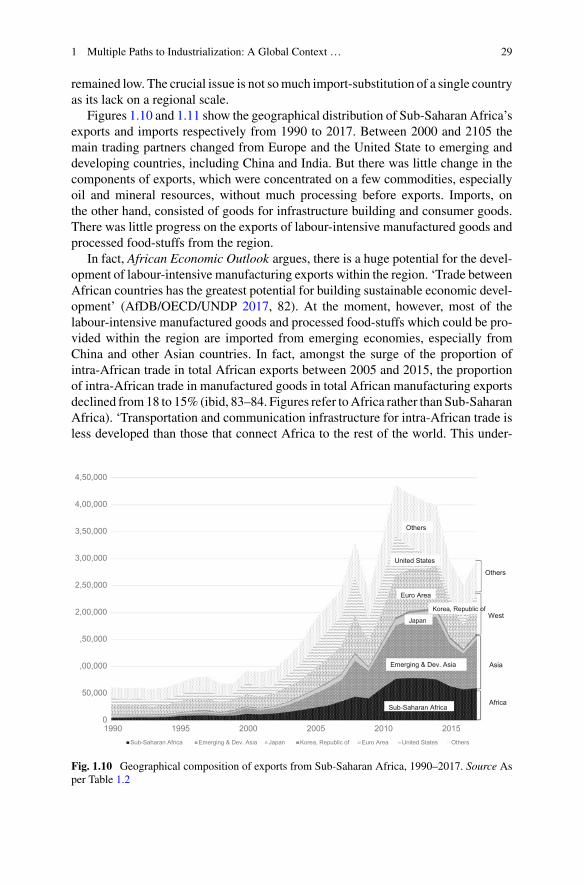
1 Multiple Paths to Industrialization: A Global Context … 29
remained low. The crucial issue is not somuch import-substitution of a single countryas its lack on a regional scale.
Figures 1.10 and 1.11 show the geographical distribution of Sub-Saharan Africa’sexports and imports respectively from 1990 to 2017. Between 2000 and 2105 themain trading partners changed from Europe and the United State to emerging anddeveloping countries, including China and India. But there was little change in thecomponents of exports, which were concentrated on a few commodities, especiallyoil and mineral resources, without much processing before exports. Imports, onthe other hand, consisted of goods for infrastructure building and consumer goods.There was little progress on the exports of labour-intensive manufactured goods andprocessed food-stuffs from the region.
In fact, African Economic Outlook argues, there is a huge potential for the devel-opment of labour-intensive manufacturing exports within the region. ‘Trade betweenAfrican countries has the greatest potential for building sustainable economic devel-opment’ (AfDB/OECD/UNDP 2017, 82). At the moment, however, most of thelabour-intensive manufactured goods and processed food-stuffs which could be pro-vided within the region are imported from emerging economies, especially fromChina and other Asian countries. In fact, amongst the surge of the proportion ofintra-African trade in total African exports between 2005 and 2015, the proportionof intra-African trade in manufactured goods in total African manufacturing exportsdeclined from18 to 15% (ibid, 83–84. Figures refer toAfrica rather than Sub-SaharanAfrica). ‘Transportation and communication infrastructure for intra-African trade isless developed than those that connect Africa to the rest of the world. This under-
0
50,000
,00,000
,50,000
2,00,000
2,50,000
3,00,000
3,50,000
4,00,000
4,50,000
1990 1995 2000 2005 2010 2015Sub-Saharan Africa Emerging & Dev. Asia Japan Korea, Republic of Euro Area United States Others
Sub-Saharan Africa
Emerging & Dev. Asia
Euro Area
United States
Others
Korea, Republic of
Japan
Africa
Asia
West
Others
Fig. 1.10 Geographical composition of exports from Sub-Saharan Africa, 1990–2017. Source Asper Table 1.2
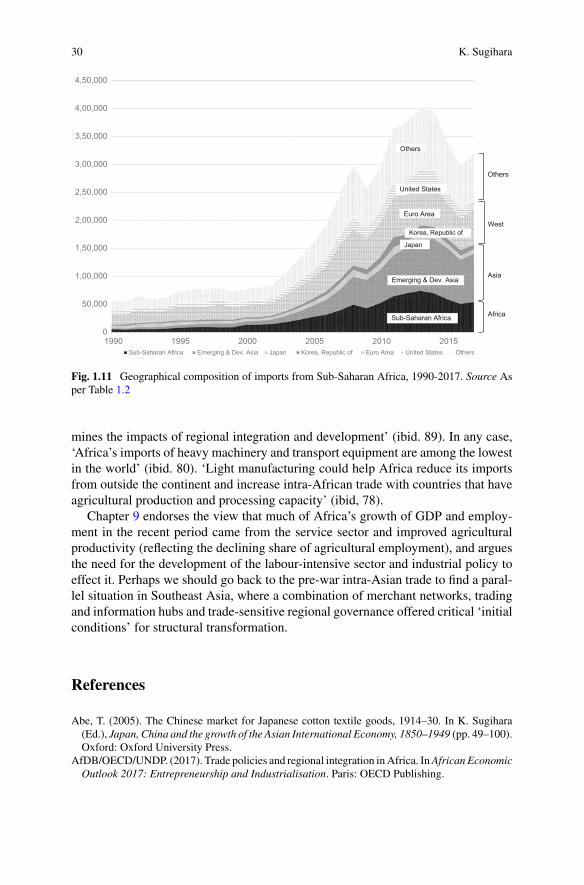
30 K. Sugihara
0
50,000
1,00,000
1,50,000
2,00,000
2,50,000
3,00,000
3,50,000
4,00,000
4,50,000
1990 1995 2000 2005 2010 2015Sub-Saharan Africa Emerging & Dev. Asia Japan Korea, Republic of Euro Area United States Others
Sub-Saharan Africa
Emerging & Dev. Asia
Japan
Korea, Republic of
Euro Area
United States
Others
Africa
Asia
West
Others
Fig. 1.11 Geographical composition of imports from Sub-Saharan Africa, 1990-2017. Source Asper Table 1.2
mines the impacts of regional integration and development’ (ibid. 89). In any case,‘Africa’s imports of heavy machinery and transport equipment are among the lowestin the world’ (ibid. 80). ‘Light manufacturing could help Africa reduce its importsfrom outside the continent and increase intra-African trade with countries that haveagricultural production and processing capacity’ (ibid, 78).
Chapter 9 endorses the view that much of Africa’s growth of GDP and employ-ment in the recent period came from the service sector and improved agriculturalproductivity (reflecting the declining share of agricultural employment), and arguesthe need for the development of the labour-intensive sector and industrial policy toeffect it. Perhaps we should go back to the pre-war intra-Asian trade to find a paral-lel situation in Southeast Asia, where a combination of merchant networks, tradingand information hubs and trade-sensitive regional governance offered critical ‘initialconditions’ for structural transformation.
References
Abe, T. (2005). The Chinese market for Japanese cotton textile goods, 1914–30. In K. Sugihara(Ed.), Japan, China and the growth of the Asian International Economy, 1850–1949 (pp. 49–100).Oxford: Oxford University Press.
AfDB/OECD/UNDP. (2017). Trade policies and regional integration inAfrica. InAfrican EconomicOutlook 2017: Entrepreneurship and Industrialisation. Paris: OECD Publishing.
1 Multiple Paths to Industrialization: A Global Context … 31
Akamatsu, K. (1962). A historical pattern of economic growth in developing countries. DevelopingEconomies, Preliminary Issue, 3–25.
Allen, R. C. (2005). Farm to factory: A reinterpretation of the Soviet Industrial Revolution. Prince-ton: Princeton University Press.
Arpan, J. S., Barry, M., & Van Tho, T. (1984). The textile complex in the Asia-Pacific region: Thepatterns and textures of competition and the shape of things to come. Research in InternationalBusiness and Finance, 4-B, 101–164.
Austin, G. (2013). Labour-intensive industrialization and global economic development: Reflec-tions. In G. Austin & K. Sugihara (Eds.), Labour-intensive industrialization in global history(pp. 280–302). London: Routledge.
Bagchi, A. K. (1976). Deindustrialization in India in the nineteenth century: Some theoreticalimplications. Journal of Development Studies, 12(2), 135–164.
Bairoch, P. (1982). International industrialization levels from 1750 to 1980. Journal of EconomicHistory, 11(2), 269–333.
Bombay Presidency Report of the Commerce of Bombay, Bombay.Bombay Trade and Navigation Annual Statements, Bombay.Chaudhuri, K. N. (1985). Trade and civilisation in the Indian Ocean: An economic history from the
rise of Islam to 1750. Cambridge: Cambridge University Press.Dreze, J., & Sen, A. (1995). India: Economic development and social opportunity. Delhi: OxfordUniversity Press.
Dreze, J., & Sen, A. (1997). Indian development: Selected regional perspectives. Delhi: OxfordUniversity Press.
Engerman, S. L., & Sokoloff, K. L. (2011). Economic development in the Americas since 1500:Endowments and institutions. Cambridge: Cambridge University Press.
Garnout, R.,&Drysdale, P. (1994).Asia Pacific regionalism:The issues. InR.Garnout&P.Drysdale(Eds.), Asia Pacific regionalism: Readings in international economic relations (pp. 1–7). Pymble,Australia: Harper Educational.
Gerschenkron, A. (1962). Economic backwardness in historical perspective: A book of essays.Cambridge, MA: Belknap Press of Harvard University Press.
Hori, K. (2009). Higashi-Ajia Shihonshugishi-ron 1 (Treatise on the history of East Asian Capital-ism, Part 1). Kyoto: Mienruva Shobo.
Hsiao, L. (1974). China’s foreign trade statistics, 1864–1949. Cambridge, MA: Harvard UniversityPress.
India Annual Rail- and River-borne Trade Returns, 1888/89–1892/93, Calcutta.International Monetary Fund (IMF) (various years), Direction of Trade Statistics Yearbook.International Monetary Fund (IMF), Direction of Trade Statistics. http://data.imf.org/?sk=9D6028D4-F14A-464C-A2F2-59B2CD424B85&sId=1409151240976. Accessed August 24,2018.
Jones, E. L. (1981). The European miracle: Environments, economies and geopolitics in the historyof Europe and Asia. Cambridge: Cambridge University Press.
Kobori, S. (2017). Rinkai kaihatsu, kogai taisaku, shizen hogo: Kodo seicho-ki Yokohama nokankyoshi (Seafront development, anti-pollution policy and nature conservation: An environ-mental history of Yokohama in the period of high-speed growth). In S. Shoji (Ed.), Sengo Nihonno Kaihatsu to Minshushugi: Chiiki ni Miru Sokoku (Development and democracy of Japan inthe post war era: The conflicts seen from the region) (pp. 71–104). Kyoto: Showado.
Kubo, T. (2005). The tariff policy of the nationalist government, 1926–36: A historical assessment.InK.Sugihara (Ed.), Japan, China and the growth of the Asian International Economy, 1850–1949(pp. 145–176). Oxford: Oxford University Press.
Lewis, W. A. (1954). The economic development with unlimited supplies of labour. ManchesterSchool of Economic and Social Studies, 22(2), 139–191.
Lewis, W. A. (Ed.). (1970). Tropical development, 1880–1913: Studies in economic progress.Evanston: Northwestern University Press.
Lewis, W. A. (1978). Growth and fluctuations, 1870–1913. London: George Allen and Unwin.
32 K. Sugihara
Maddison, A. (2009). Statistics on world population, GDP and per capita GDP, 1-2008 AD. http://www.ggdc.net/maddison/.
Oishi, T. (2015). Kan-indoyo sekai to indojin shonin, kigyoka no nettowaku: Shokuminchi-ki niokeru fukugosei, tayosei (The world of Indian Ocean Rim and Indian merchant-entrepreneur net-works: Plurality and diversity in the colonial period). In A. Tanabe, K. Sugihara, & K. Wakimura(Eds.), Shirizu Gendai Indo 1: Tayosei Shakai no Chosen (Challenges for a diversity-drivensociety: Contemporary India Series 1) (pp. 169–196). Tokyo: Tokyo Daigaku Shuppankai.
Okurasho Shuzeikyoku [Japanese Ministry of Finance Government Bureau of Taxation]. (1948).Dai-15-kai Kokkai Kanzei Sankosho (Reference material on customs tariff for the 15th Parlia-ment). Tokyo: Okurasho.
Oshima, H. (1970). The role of small industries in the acceleration of Asian growth. In EconomicCommission for Asia and the Far East (ECAFE), Small industry bulletin for Asia and the FarEast (Vol. 7, pp. 134–136). New York: U. N.
Oshima, H. (1987). Economic development in Monsoon Asia: A comparative study. Tokyo: Uni-versity of Tokyo Press.
Pomeranz, K. (2000). The great divergence: China, Europe, and the making of the modern worldeconomy. Princeton: Princeton University Press.
Pomeranz, K. (2013). Labour-intensive industrialization in the rural Yangzi Delta: Late imperialpatterns and their modern fates. In G. Austin & K. Sugihara (Eds.), Labour-intensive industrial-ization in global history (pp. 122–143). London: Routledge.
Report on the Administration of Bengal, 1877/78, Calcutta.Richards, J. (2003). The unending frontier: An environmental history of the early modern world.Berkeley: University of California Press.
Roy, T. (2005). Rethinking economic change in India: Labour and livelihood. London: Routledge.Saul, S. B. (1960). Studies in British overseas trade, 1870–1914. Liverpool: Liverpool UniversityPress.
Suehiro, K. (1998). Hatten tojokoku no kaihatsu-shugi (Developmentalism in developing countries).In Tokyo Daigaku Shakai Kagaku Kenkyusho (Ed.), 20-seiki Sekai Shisutemu 4: Kaihatsu-shugi(The World System of the twentieth century 4: Developmentalism) (pp. 13–46). Tokyo: TokyoDaigaku Shuppankai.
Sugihara, K. (1996). Ajia-kan Boeki no Keisei to Kozo (Patterns and development of intra-Asiantrade). Kyoto: Mineruva Shobo.
Sugihara, K. (1999). Kindai sekai shisutemu to ningen no ido (Themodern world system and humanmigration). In Iwanami Koza Sekai Rekishi 19: Chiiki o Musubu Dainamizumu (Iwanami lecturesof the World History 19: Dynamic forces that connect regions) (pp. 3–64). Tokyo: IwanamaiShoten.
Sugihara, K. (2001). India and the rise of the Asia-Pacific economy, c. 1947–1997. In N. Kondo(Ed.), The ‘Nation-State’ and Transnational Forces in South Asia. Research project ‘Institutions,Networks and Forces of Change in Contemporary South Asia’ (pp. 43–67), Tokyo, March 2001,Conference Proceedings.
Sugihara, K. (2002). Indo kindaishi ni okeru enkakuchi boeki to chiiki koeki, 1868-1938-nen (Thelong-distance trade and regional trade in modern Indian history, 1868–1938). Toyo Bunka, 82,1–46.
Sugihara, K. (2003). The East Asian path of economic development: A long-term perspective. InG. Arrighi, T. Hamashita, &M. Selden (Eds.), The resurgence of East Asia: 500, 150 and 50 yearperspectives (pp. 78–123). London: Routledge.
Sugihara, K. (2005a). An introduction. In K. Sugihara (Ed.), Japan, China and the growth of theAsian International Economy, 1850–1949 (pp. 1–19). Oxford: Oxford University Press.
Sugihara, K. (2005b). Patterns of Chinese emigration to Southeast Asia, 1869–1939. In K. Sug-ihara (Ed.), Japan, China and the growth of the Asian International Economy, 1850–1949(pp. 244–274). Oxford: Oxford University Press.
Sugihara, K. (2009). The resurgence of intra-Asian trade, 1800–1850. In G. Riello & T. Roy (Eds.),How India clothed the world: The world of South Asian textiles (pp. 1500–1850). Leiden: Brill.
1 Multiple Paths to Industrialization: A Global Context … 33
Sugihara, K. (2013). Labour-intensive industrialization in global history: An interpretation of EastAsian experiences. In G. Austin & K. Sugihara (Eds.), Labour-intensive industrialization inglobal history (pp. 20–64). London: Routledge.
Sugihara, K. (2015a). Global industrialization: A multipolar perspective. In J. R. McNeill & K.Pomeranz (Eds.), Cambridge world history. Volume 8: Production, connection and destruction,1750-Present (1, pp. 106–35). Cambridge: Cambridge University Press.
Sugihara, K. (2015b). Shokuminchiki ni okeru kokunai shijo no keisei (Formation of a domesticmarket in the colonial period). In A. Tanabe, K. Sugihara & K. Wakimura (Eds.), Shirizu GendaiIndo 1: Tayosei Shakai no Chosen (Challenges for a diversity-driven society: Contemporary IndiaSeries 1) (pp. 197–221). Tokyo: Tokyo Daigaku Shuppankai.
Sugihara, K. (2015c). Asia in the growth of world trade: A re-interpretation of the ‘long nineteenthcentury’. In U. Bosma & A. Webster (Eds.), Commodities, ports and Asian maritime trade c.1750–1950 (pp. 17–58). Basingstoke: Palgrave Macmillan.
Sugihara, K. (2017). Monsoon Asia, intra-regional trade and fossil-fuel-driven industrialization. InG. Austin (Ed.), Economic development and environmental history in the anthropocene: Perspec-tives on Asia and Africa (pp. 119–144). London: Bloomsbury Academic.
Sugihara. K. (2019a). Varieties of industrialization: An Asian regional perspective. In G. Riello &T. Roy (Eds.), Global economic history (pp. 195–214). London: Bloomsbury Academic.
Sugihara, K. (2019b). Guro-baru hisutori no nakano minami ajia (South Asia in global history). InN. Nagasaki (Ed.), Taikei Minami Ajia-shi 4: Kingendai (Outline of South Asian history 4: Themodern and contemporary period). Tokyo: Yamakawa Shuppansha.
Takanaka, K. (2000). Higashi-ajia Choki Keizai Tokei 9: Gaikoku Boeki to Keizai Hatten (Long-term economic statistics of East Asia. Volume 9: Foreign trade and economic development).Tokyo: Keiso Shobo.
van der Eng, P. (2013). Government promotion of labour-intensive industrialization in Indonesia,1930–1975. In G. Austin & K. Sugihara (Eds.), Labour-intensive industrialization in globalhistory (pp. 176–200). London: Routledge.
Yanagisawa, H. (1996). A century of change: Caste and irrigated lands in Tamilnadu, 1860s–1970s.New Delhi: Manohar.
Open Access This chapter is licensed under the terms of the Creative Commons Attribution-NonCommercial-NoDerivatives 4.0 International License (http://creativecommons.org/licenses/by-nc-nd/4.0/), which permits any noncommercial use, sharing, distribution and reproduction in anymedium or format, as long as you give appropriate credit to the original author(s) and the source,provide a link to the Creative Commons licence and indicate if you modified the licensed material.You do not have permission under this licence to share adapted material derived from this chapteror parts of it.
The images or other third party material in this chapter are included in the chapter’s CreativeCommons licence, unless indicated otherwise in a credit line to the material. If material is notincluded in the chapter’s Creative Commons licence and your intended use is not permitted bystatutory regulation or exceeds the permitted use, you will need to obtain permission directly fromthe copyright holder.
Chapter 2Technology Transfer and AgriculturalDevelopment: A Comparative Studyof Asia and Africa
Keijiro Otsuka
2.1 Introduction
Afewcenturies ago,Malthus predicted that faminewill inevitably take place because,while the population grows exponentially, food production increases only arithmeti-cally. Following the Malthusian argument, the Club of Rome predicted in the early1970s that famine cannot be avoided in tropical Asia (Meadows et al. 1972).
1How-
ever, serious famine has never taken place in this region for the past half centuryand, hence, Malthus’ prediction may appear questionable. However, by reviewingthe history of growth of population and food production, his prediction turns out tobe almost correct (Otsuka 2013). What he failed to predict was the technologicalchange induced by population pressure (Hayami and Ruttan 1985), which resultedin the rapid growth of food production, thereby restoring or more than restoring thebalance between population and food production. In other words, the fear of Malthu-sian hardship, or severe food insecurity, begot efforts to overcome it by means oftechnological changes based on international technology transfer.
Indeed, the Green Revolution for rice as well as wheat, defined as the developmentand diffusion of high-yielding varieties, took place in tropical Asia in the 1970sand 1980s, when the population pressure on the limited land became severe enough(David and Otsuka 1994). However, the Green Revolution for major grains has failedto hitherto take place in sub-Saharan Africa (SSA), although current populationpressure is as severe as in tropical Asia in the 1960s (Otsuka and Larson 2013, 2016).Unless a sufficient food supply is secured, the economy can unlikely evolve from apoor agrarian state to an emerging state with decent development of manufacturingindustries and service sectors. Indeed, as agriculture is a dominant industry at the early
1Tropical Asia refers to Southeast and South Asia.
K. Otsuka (B)Graduate School of Economics, Kobe University, Kobe, Hyogo, Japane-mail: [email protected]
© The Author(s) 2019K. Otsuka and K. Sugihara (eds.), Paths to the Emerging State in Asia and Africa,Emerging-Economy State and International Policy Studies,https://doi.org/10.1007/978-981-13-3131-2_2
35
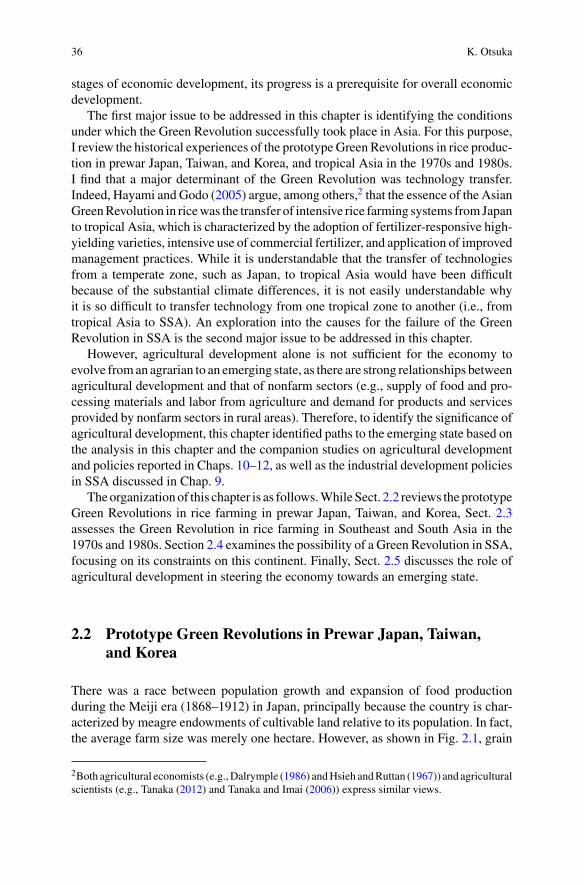
36 K. Otsuka
stages of economic development, its progress is a prerequisite for overall economicdevelopment.
The first major issue to be addressed in this chapter is identifying the conditionsunder which the Green Revolution successfully took place in Asia. For this purpose,I review the historical experiences of the prototype Green Revolutions in rice produc-tion in prewar Japan, Taiwan, and Korea, and tropical Asia in the 1970s and 1980s.I find that a major determinant of the Green Revolution was technology transfer.Indeed, Hayami and Godo (2005) argue, among others,2 that the essence of the AsianGreenRevolution in ricewas the transfer of intensive rice farming systems fromJapanto tropical Asia, which is characterized by the adoption of fertilizer-responsive high-yielding varieties, intensive use of commercial fertilizer, and application of improvedmanagement practices. While it is understandable that the transfer of technologiesfrom a temperate zone, such as Japan, to tropical Asia would have been difficultbecause of the substantial climate differences, it is not easily understandable whyit is so difficult to transfer technology from one tropical zone to another (i.e., fromtropical Asia to SSA). An exploration into the causes for the failure of the GreenRevolution in SSA is the second major issue to be addressed in this chapter.
However, agricultural development alone is not sufficient for the economy toevolve froman agrarian to an emerging state, as there are strong relationships betweenagricultural development and that of nonfarm sectors (e.g., supply of food and pro-cessing materials and labor from agriculture and demand for products and servicesprovided by nonfarm sectors in rural areas). Therefore, to identify the significance ofagricultural development, this chapter identified paths to the emerging state based onthe analysis in this chapter and the companion studies on agricultural developmentand policies reported in Chaps. 10–12, as well as the industrial development policiesin SSA discussed in Chap. 9.
Theorganizationof this chapter is as follows.WhileSect. 2.2 reviews theprototypeGreen Revolutions in rice farming in prewar Japan, Taiwan, and Korea, Sect. 2.3assesses the Green Revolution in rice farming in Southeast and South Asia in the1970s and 1980s. Section 2.4 examines the possibility of a Green Revolution in SSA,focusing on its constraints on this continent. Finally, Sect. 2.5 discusses the role ofagricultural development in steering the economy towards an emerging state.
2.2 Prototype Green Revolutions in Prewar Japan, Taiwan,and Korea
There was a race between population growth and expansion of food productionduring the Meiji era (1868–1912) in Japan, principally because the country is char-acterized by meagre endowments of cultivable land relative to its population. In fact,the average farm size was merely one hectare. However, as shown in Fig. 2.1, grain
2Both agricultural economists (e.g.,Dalrymple (1986) andHsieh andRuttan (1967)) and agriculturalscientists (e.g., Tanaka (2012) and Tanaka and Imai (2006)) express similar views.
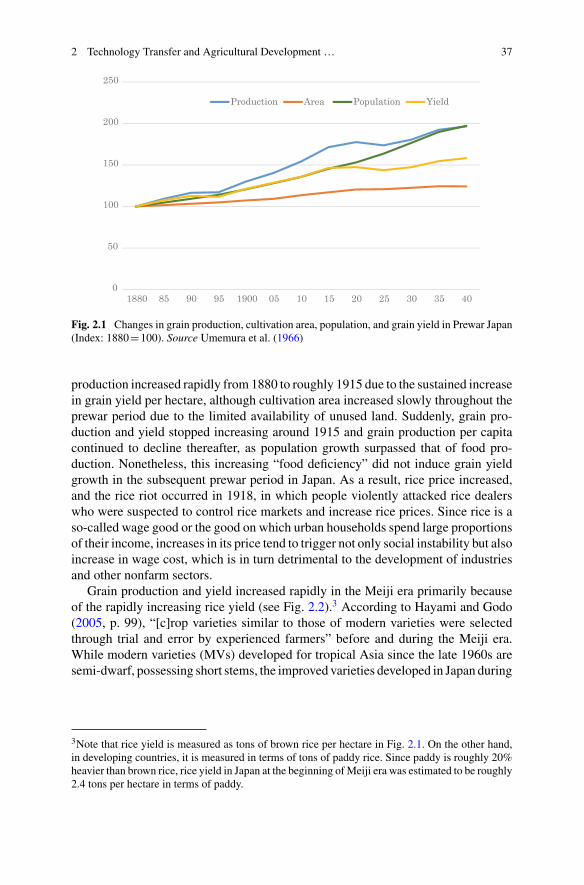
2 Technology Transfer and Agricultural Development … 37
0
50
100
150
200
250
1880 85 90 95 1900 05 10 15 20 25 30 35 40
Production Area Population Yield
Fig. 2.1 Changes in grain production, cultivation area, population, and grain yield in Prewar Japan(Index: 1880�100). Source Umemura et al. (1966)
production increased rapidly from 1880 to roughly 1915 due to the sustained increasein grain yield per hectare, although cultivation area increased slowly throughout theprewar period due to the limited availability of unused land. Suddenly, grain pro-duction and yield stopped increasing around 1915 and grain production per capitacontinued to decline thereafter, as population growth surpassed that of food pro-duction. Nonetheless, this increasing “food deficiency” did not induce grain yieldgrowth in the subsequent prewar period in Japan. As a result, rice price increased,and the rice riot occurred in 1918, in which people violently attacked rice dealerswho were suspected to control rice markets and increase rice prices. Since rice is aso-called wage good or the good on which urban households spend large proportionsof their income, increases in its price tend to trigger not only social instability but alsoincrease in wage cost, which is in turn detrimental to the development of industriesand other nonfarm sectors.
Grain production and yield increased rapidly in the Meiji era primarily becauseof the rapidly increasing rice yield (see Fig. 2.2).3 According to Hayami and Godo(2005, p. 99), “[c]rop varieties similar to those of modern varieties were selectedthrough trial and error by experienced farmers” before and during the Meiji era.While modern varieties (MVs) developed for tropical Asia since the late 1960s aresemi-dwarf, possessing short stems, the improved varieties developed in Japan during
3Note that rice yield is measured as tons of brown rice per hectare in Fig. 2.1. On the other hand,in developing countries, it is measured in terms of tons of paddy rice. Since paddy is roughly 20%heavier than brown rice, rice yield in Japan at the beginning ofMeiji era was estimated to be roughly2.4 tons per hectare in terms of paddy.
38 K. Otsuka
Fig. 2.2 Changes in riceyield per hectare in PrewarJapan, Taiwan, and Korea,and Postwar Philippines,Five-Year Moving averages(reproduced from Hayamiand Godo 2005, p. 101)
the Meiji period were not necessarily semi-dwarf.4 Similar to MVs, those improvedrice varieties in Japan were resistant against lodging, so that a heavier applicationof fertilizers leads to higher yield. Such fertilizer-responsive varieties were initiallyselected in the western region and their diffusion boosted registered yield growthfrom 1895 to 1910. Such superior varieties in the western region served as parentalvarieties to developing improved varieties suitable for the ecologies of the east-ern region by leading farmers and experiment-station workers. Consequently, yieldgrowth took place five to ten years later in this region. However, once new varietieswere completely diffused, yield became stagnant throughout Japan by themid-1910s.
Facing the risk of high rice prices and drain on scarce foreign exchange by large-scale rice imports, the Japanese government decided to increase rice production andimports from the overseas territories of Korea and Taiwan. Further, the governmentactively invested in irrigation and water control and in research and extension todevelop and diffuse high-yielding Japanese varieties adapted to the local ecologiesof Korea and Taiwan and transfer improved agronomic practices (Hayami and Ruttan1985). As a result, fertilizer-responsive, high-yielding ponlai varieties were devel-oped in Taiwan, which were cross-bred between Japonica and Indica rice varietiesand also between improved Japonica varieties. Tanaka and Imai state (2006) thatthe expansion of rice production in Taiwan was made possible by the transfer of
4However, Dalrymple (1986) points out that the first efforts to develop semi-dwarf rice varietiesoccurred in Japan in the late 19th century, leading to the development of an improved variety calledShinriki.
2 Technology Transfer and Agricultural Development … 39
the Japanese farming system, based on improved seeds, application of fertilizer, andirrigation. Hayami and Ruttan (1985) conclude that “the economic implication of theponlai varieties for Taiwan in the 1920s were essentially equivalent to those of themodern rice varieties in the tropics today.”5 Similarly, Hsieh and Ruttan (1967) arguethat new rice varieties now being developed in tropical Asia in the 1960s resemble, interms of fertilizer responsiveness and yield potential, the ponlai varieties introducedto Taiwan in the mid-1920s.
As per Fig. 2.2, rice yield increased slowly during the 1910s and dramatically inthe 1920s in Taiwan. This coincides with the development of ponlai varieties, thefirst one being Taiching 65, developed in 1924 from a cross of two Japanese varieties(Tanaka 2012). Rice production in Korea was less successful than in Taiwan becauseof the lower levels of irrigation and water control, but rice yield in this countrynonetheless accelerated in the 1930s.6 Theyield growth in bothTaiwan andKoreawasobviously the result of technology transfer from Japan, where adaptive agriculturalresearch, irrigation investment, and technological extension played critical roles. Astable supply of rice to Japan from Taiwan and Korea undoubtedly contributed torice price stability and increased its availability in Japan, thereby contributing to thesustainable growth of nonfarm sectors in prewar Japan.
2.3 Green Revolution in Tropical Asia
Not only the Club of Rome (Meadows et al. 1972) but also the majority of thoseinterested in the development of agriculture in tropical Asia were worried about thefuture balance between rice supply and demand in the 1960s and early 1970s in thisregion, because population was increasing, rice yield had stagnated, and uncultivatedland had been largely exhausted (Barker and Herdt 1985). As is shown in Fig. 2.3,population grew in parallel with grain production in the 1960s in Tropical Asia.However, grain production fluctuated widely, which means that food shortages tookplace occasionally during poor crop years (e.g., in 1965–1966 in West Bengal).Without exaggeration, it can be argued that tropical Asia was on the verge of faminedue to increasing population pressure, as predicted by Malthus.
As per Fig. 2.3, grain production began increasing since the mid-1960s and itsgrowth rate accelerated in the 1970s and 1980s, thereby surpassing the populationgrowth by awidemargin. Grain production increased not because of the expansion ofland area, but largely because of yield growth. This is a result of theGreenRevolution,primarily for rice but also for wheat in tropical Asia.
For rice, the first semi-dwarf, fertilizer-responsive, high-yielding MV, IR8, wasreleased in 1966 by the International Rice Research Institute (IRRI) in the Philip-pines, which was established in 1960 by support of the Rockefeller and Ford Founda-
5Dalrymple (1986) points out that early ponlai varieties were not semi-dwarfs.6It is also worth noting that rice yield in Japan began increasing in the 1930s due to the laggedeffect of establishing modern agricultural research and extension systems during the Meiji era.
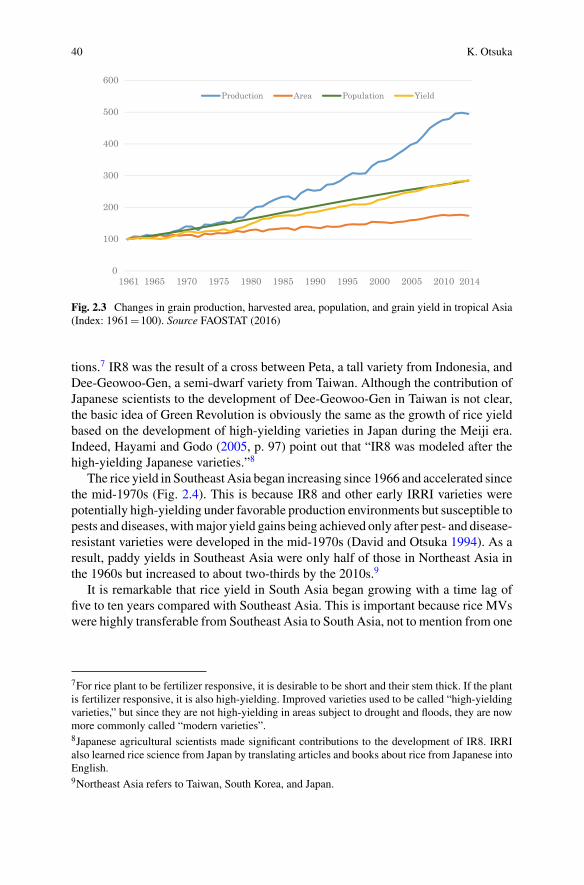
40 K. Otsuka
0
100
200
300
400
500
600
1961 1965 1970 1975 1980 1985 1990 1995 2000 2005 2010 2014
Production Area Population Yield
Fig. 2.3 Changes in grain production, harvested area, population, and grain yield in tropical Asia(Index: 1961�100). Source FAOSTAT (2016)
tions.7 IR8 was the result of a cross between Peta, a tall variety from Indonesia, andDee-Geowoo-Gen, a semi-dwarf variety from Taiwan. Although the contribution ofJapanese scientists to the development of Dee-Geowoo-Gen in Taiwan is not clear,the basic idea of Green Revolution is obviously the same as the growth of rice yieldbased on the development of high-yielding varieties in Japan during the Meiji era.Indeed, Hayami and Godo (2005, p. 97) point out that “IR8 was modeled after thehigh-yielding Japanese varieties.”8
The rice yield in Southeast Asia began increasing since 1966 and accelerated sincethe mid-1970s (Fig. 2.4). This is because IR8 and other early IRRI varieties werepotentially high-yielding under favorable production environments but susceptible topests and diseases, withmajor yield gains being achieved only after pest- and disease-resistant varieties were developed in the mid-1970s (David and Otsuka 1994). As aresult, paddy yields in Southeast Asia were only half of those in Northeast Asia inthe 1960s but increased to about two-thirds by the 2010s.9
It is remarkable that rice yield in South Asia began growing with a time lag offive to ten years compared with Southeast Asia. This is important because rice MVswere highly transferable from Southeast Asia to South Asia, not to mention from one
7For rice plant to be fertilizer responsive, it is desirable to be short and their stem thick. If the plantis fertilizer responsive, it is also high-yielding. Improved varieties used to be called “high-yieldingvarieties,” but since they are not high-yielding in areas subject to drought and floods, they are nowmore commonly called “modern varieties”.8Japanese agricultural scientists made significant contributions to the development of IR8. IRRIalso learned rice science from Japan by translating articles and books about rice from Japanese intoEnglish.9Northeast Asia refers to Taiwan, South Korea, and Japan.
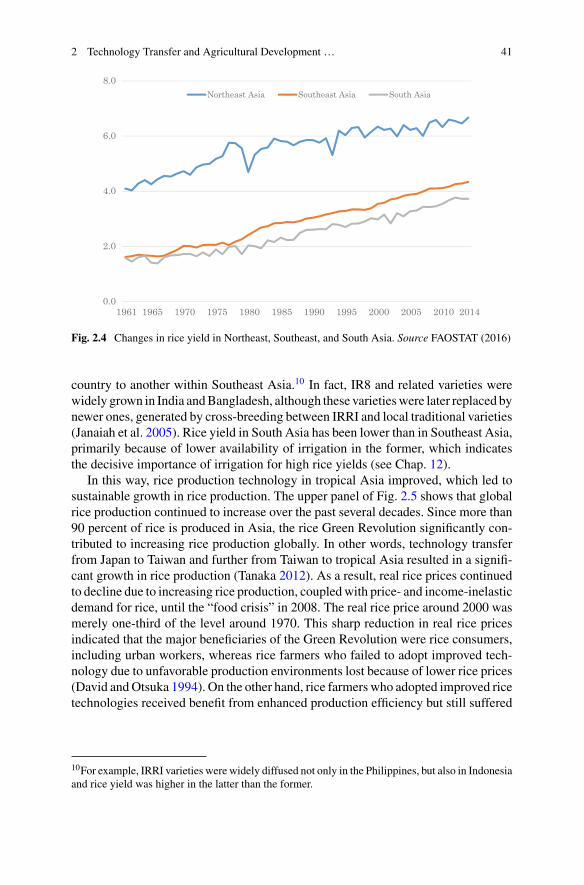
2 Technology Transfer and Agricultural Development … 41
0.0
2.0
4.0
6.0
8.0
1961 1965 1970 1975 1980 1985 1990 1995 2000 2005 2010 2014
Northeast Asia Southeast Asia South Asia
Fig. 2.4 Changes in rice yield in Northeast, Southeast, and South Asia. Source FAOSTAT (2016)
country to another within Southeast Asia.10 In fact, IR8 and related varieties werewidely grown in India andBangladesh, although these varietieswere later replaced bynewer ones, generated by cross-breeding between IRRI and local traditional varieties(Janaiah et al. 2005). Rice yield in South Asia has been lower than in Southeast Asia,primarily because of lower availability of irrigation in the former, which indicatesthe decisive importance of irrigation for high rice yields (see Chap. 12).
In this way, rice production technology in tropical Asia improved, which led tosustainable growth in rice production. The upper panel of Fig. 2.5 shows that globalrice production continued to increase over the past several decades. Since more than90 percent of rice is produced in Asia, the rice Green Revolution significantly con-tributed to increasing rice production globally. In other words, technology transferfrom Japan to Taiwan and further from Taiwan to tropical Asia resulted in a signifi-cant growth in rice production (Tanaka 2012). As a result, real rice prices continuedto decline due to increasing rice production, coupledwith price- and income-inelasticdemand for rice, until the “food crisis” in 2008. The real rice price around 2000 wasmerely one-third of the level around 1970. This sharp reduction in real rice pricesindicated that the major beneficiaries of the Green Revolution were rice consumers,including urban workers, whereas rice farmers who failed to adopt improved tech-nology due to unfavorable production environments lost because of lower rice prices(David andOtsuka 1994). On the other hand, rice farmers who adopted improved ricetechnologies received benefit from enhanced production efficiency but still suffered
10For example, IRRI varieties were widely diffused not only in the Philippines, but also in Indonesiaand rice yield was higher in the latter than the former.
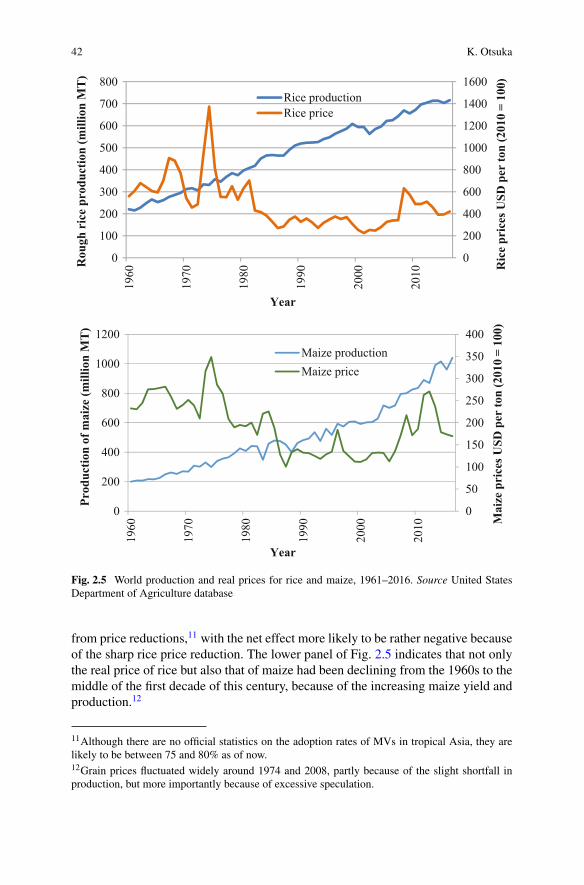
42 K. Otsuka
0
200
400
600
800
1000
1200
1400
1600
0
100
200
300
400
500
600
700
800
1960
1970
1980
1990
2000
2010 R
ice
pric
es U
SD p
er to
n (2
010
= 10
0)
Rou
gh r
ice
prod
uctio
n (m
illio
n M
T)
Year
Rice productionRice price
0
50
100
150
200
250
300
350
400
0
200
400
600
800
1000
1200
1960
1970
1980
1990
2000
2010 M
aize
pri
ces U
SD p
er to
n (2
010
= 10
0)
Prod
uctio
n of
mai
ze (m
illio
n M
T)
Year
Maize productionMaize price
Fig. 2.5 World production and real prices for rice and maize, 1961–2016. Source United StatesDepartment of Agriculture database
from price reductions,11 with the net effect more likely to be rather negative becauseof the sharp rice price reduction. The lower panel of Fig. 2.5 indicates that not onlythe real price of rice but also that of maize had been declining from the 1960s to themiddle of the first decade of this century, because of the increasing maize yield andproduction.12
11Although there are no official statistics on the adoption rates of MVs in tropical Asia, they arelikely to be between 75 and 80% as of now.12Grain prices fluctuated widely around 1974 and 2008, partly because of the slight shortfall inproduction, but more importantly because of excessive speculation.
2 Technology Transfer and Agricultural Development … 43
Although there is no direct evidence that the Green Revolution in tropical Asiacontributed to building emerging states in this region, it would not be unrealistic toargue that a sufficient supply of such an important staple crop as rice contributedsignificantly to the stability of Asian societies by improving the well-being of riceconsumerswithout excessively sacrificing thewelfare ofmost rice farmers. Since riceis a wage good, the reduction in rice prices must have stimulated the development ofindustries and other nonfarm sectors by reducing the cost of living for urban workers.If there had been no Green Revolution, people in tropical Asia would have beenadversely affected by the high rice prices, persistent food insecurity, and occasionalfamines in theworst-case scenario and the import of expensive grains from elsewherein the world in the best-case scenario.
2.4 Possibility of a Green Revolution in SSA
Boserup (1965) argues that population pressure on limited land areas stimulatesthe spontaneous adoption of land-saving and labor-using production methods byfarmers,which leads to an increase in crop yield.However, this view is not necessarilyconsistent with the reviewed historical experience. Even when population pressureincreased in prewar Japan, rice yield did not increase without technological changes.Similarly, rice yield increased significantly in tropical Asia only after MVs weredeveloped. Hayami and Ruttan (1985) argue that population pressure induces notonly technological innovations but also institutional innovations, which supports thedevelopment and diffusion of innovations. As such, theAsian experience seemsmoreconsistent with this latter view than the Boserupian one.
Although there are a few land abundant countries in SSA, the ratio of arable landto rural population, on average, has been steadily declining (see Fig. 2.6). As a result,the land-population ratio in SSA now is similar to that in tropical Asia on the eve ofthe Green Revolution. However, since rainfall is lower in SSA, the quality-adjustedland-population ratio could be much lower than face value in SSA. Therefore, ifthe Hayami-Ruttan (1985) posited innovation hypothesis is relevant, it might beopportune for SSA to launch the Green Revolution.
From the trends of grain production,13 cultivation area, population, and grain yieldin SSA, it is clear that while population has been growing continuously, the growthof grain production was much slower from 1961 to around 2000 (Fig. 2.7). This issimilar to or worse than the situation in tropical Asia in the 1960s (see Fig. 2.3).The imbalance between the growth of population and grain production contributesto the food insecurity in SSA, particularly around the turn of the century, when thegap between the trends of population and grain production growth was maximum.However, it is remarkable that grain production growth became faster than populationgrowth over the past one and a half decades. Grain production increased not only
13Grain includes maize, sorghum millet, rice, and wheat, and production is the total quantity of thegrain production. Note that yams, cassava, and plantain are also important staple foods in SSA.
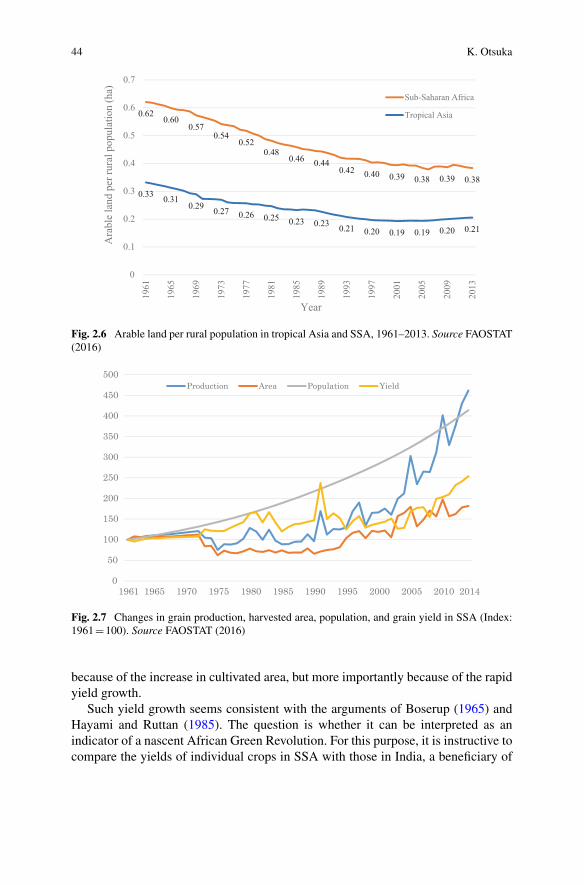
44 K. Otsuka
0.620.60
0.570.54
0.520.48
0.46 0.440.42 0.40 0.39 0.38 0.39 0.38
0.33 0.310.29 0.27 0.26 0.25 0.23 0.23 0.21 0.20 0.19 0.19 0.20 0.21
0
0.1
0.2
0.3
0.4
0.5
0.6
0.7
1961
1965
1969
1973
1977
1981
1985
1989
1993
1997
2001
2005
2009
2013
Ara
ble
land
per
rura
l pop
ulat
ion
(ha)
Year
Sub-Saharan Africa
Tropical Asia
Fig. 2.6 Arable land per rural population in tropical Asia and SSA, 1961–2013. Source FAOSTAT(2016)
0
50
100
150
200
250
300
350
400
450
500
1961 1965 1970 1975 1980 1985 1990 1995 2000 2005 2010 2014
Production Area Population Yield
Fig. 2.7 Changes in grain production, harvested area, population, and grain yield in SSA (Index:1961�100). Source FAOSTAT (2016)
because of the increase in cultivated area, but more importantly because of the rapidyield growth.
Such yield growth seems consistent with the arguments of Boserup (1965) andHayami and Ruttan (1985). The question is whether it can be interpreted as anindicator of a nascent African Green Revolution. For this purpose, it is instructive tocompare the yields of individual crops in SSA with those in India, a beneficiary of
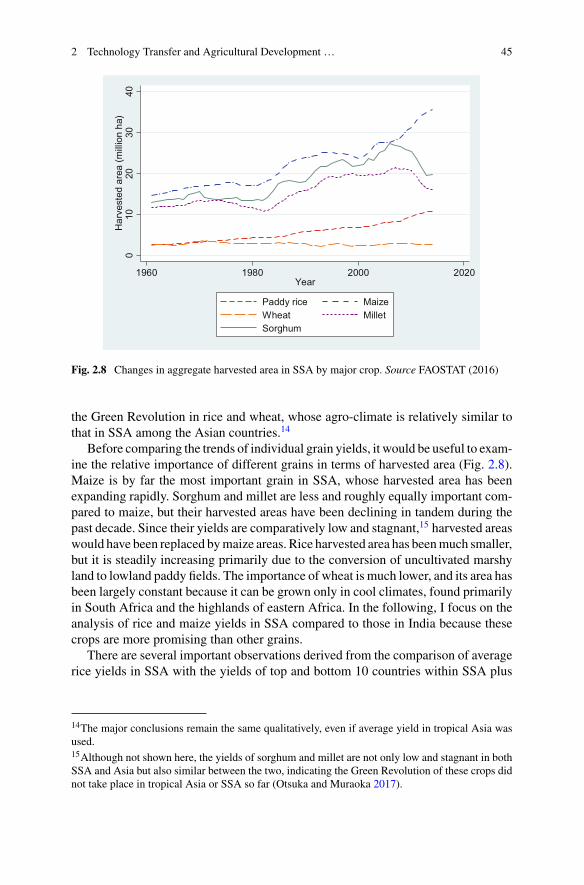
2 Technology Transfer and Agricultural Development … 45
010
2030
40H
arve
sted
are
a (m
illio
n ha
)
1960 1980 2000 2020Year
Paddy rice MaizeWheat MilletSorghum
Fig. 2.8 Changes in aggregate harvested area in SSA by major crop. Source FAOSTAT (2016)
the Green Revolution in rice and wheat, whose agro-climate is relatively similar tothat in SSA among the Asian countries.14
Before comparing the trends of individual grain yields, it would be useful to exam-ine the relative importance of different grains in terms of harvested area (Fig. 2.8).Maize is by far the most important grain in SSA, whose harvested area has beenexpanding rapidly. Sorghum and millet are less and roughly equally important com-pared to maize, but their harvested areas have been declining in tandem during thepast decade. Since their yields are comparatively low and stagnant,15 harvested areaswould have been replaced bymaize areas. Rice harvested area has beenmuch smaller,but it is steadily increasing primarily due to the conversion of uncultivated marshyland to lowland paddy fields. The importance of wheat is much lower, and its area hasbeen largely constant because it can be grown only in cool climates, found primarilyin South Africa and the highlands of eastern Africa. In the following, I focus on theanalysis of rice and maize yields in SSA compared to those in India because thesecrops are more promising than other grains.
There are several important observations derived from the comparison of averagerice yields in SSA with the yields of top and bottom 10 countries within SSA plus
14The major conclusions remain the same qualitatively, even if average yield in tropical Asia wasused.15Although not shown here, the yields of sorghum and millet are not only low and stagnant in bothSSA and Asia but also similar between the two, indicating the Green Revolution of these crops didnot take place in tropical Asia or SSA so far (Otsuka and Muraoka 2017).
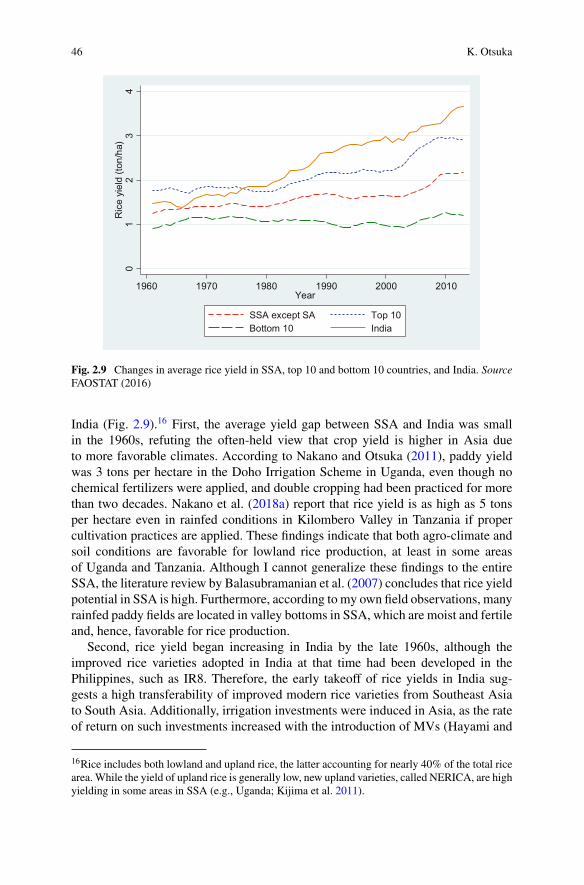
46 K. Otsuka
01
23
4R
ice
yiel
d (to
n/ha
)
1960 1970 1980 1990 2000 2010Year
SSA except SA Top 10Bottom 10 India
Fig. 2.9 Changes in average rice yield in SSA, top 10 and bottom 10 countries, and India. SourceFAOSTAT (2016)
India (Fig. 2.9).16 First, the average yield gap between SSA and India was smallin the 1960s, refuting the often-held view that crop yield is higher in Asia dueto more favorable climates. According to Nakano and Otsuka (2011), paddy yieldwas 3 tons per hectare in the Doho Irrigation Scheme in Uganda, even though nochemical fertilizers were applied, and double cropping had been practiced for morethan two decades. Nakano et al. (2018a) report that rice yield is as high as 5 tonsper hectare even in rainfed conditions in Kilombero Valley in Tanzania if propercultivation practices are applied. These findings indicate that both agro-climate andsoil conditions are favorable for lowland rice production, at least in some areasof Uganda and Tanzania. Although I cannot generalize these findings to the entireSSA, the literature review by Balasubramanian et al. (2007) concludes that rice yieldpotential in SSA is high. Furthermore, according to my own field observations, manyrainfed paddy fields are located in valley bottoms in SSA, which are moist and fertileand, hence, favorable for rice production.
Second, rice yield began increasing in India by the late 1960s, although theimproved rice varieties adopted in India at that time had been developed in thePhilippines, such as IR8. Therefore, the early takeoff of rice yields in India sug-gests a high transferability of improved modern rice varieties from Southeast Asiato South Asia. Additionally, irrigation investments were induced in Asia, as the rateof return on such investments increased with the introduction of MVs (Hayami and
16Rice includes both lowland and upland rice, the latter accounting for nearly 40% of the total ricearea. While the yield of upland rice is generally low, new upland varieties, called NERICA, are highyielding in some areas in SSA (e.g., Uganda; Kijima et al. 2011).
2 Technology Transfer and Agricultural Development … 47
Kikuchi 1978). Chapter 10 reports that the irrigation ratio in Asia increased from20% in 1965 to 45% in 2015 (see Fig. 10.3). According to my own observations,IRRI varieties and their offspring are widely grown in irrigation schemes across thecontinent, which also indicates the high transferability of Asian MVs to SSA. Third,the difference in yield between average and top 10 countries is large,17 which impliespaddy yield is considerably higher in the advanced regions in SSA. Indeed, the yieldgap between the top 10 countries and India was relatively small, which stronglysuggests that improved rice production systems have been successfully adopted atleast in advanced areas in SSA. In fact, rice yields are higher than 5 tons per hectarein several irrigated areas in SSA, where MVs and improved management practiceswere adopted (Otsuka and Larson 2016), and also far higher than average rice yieldsin tropical Asia (see Fig. 2.4).
Rice yield is significantly higher under irrigated than rainfed conditions in Asia(e.g., David and Otsuka 1994; Otsuka and Hayami 1994) because of the decisiveimpact of irrigation on rice yield (see Chap. 12). Njeru et al. (2016) point out,based on case-study evidence, that as far as irrigated areas are concerned, there isno significant difference in the relationship between fertilizer application and yieldper hectare between tropical Asia and SSA. This suggests that the properties ofyield functions are similar between tropical Asia and SSA. However, the fertilizerapplication per hectare tends to be lower in SSA because real fertilizer priced tendto be higher. Although the irrigated area accounts for only 15% of the paddy areain SSA (Balasubramanian et al. 2007), Asian rice Green Revolution technologiesfunction well in irrigated rice areas in SSA. Indeed, roughly 50% of paddy areas inthe top 10 countries in SSA are irrigated.
Finally, average rice yield began increasing around 2005, which may indicate thatthe rice sector in SSA is currently transitioning to the Green Revolution. Indeed,adaptive crop breeding research developed a large number of improved rice varietiesin SSA (Yamano et al. 2016).
For comparative purposes, Fig. 2.10 shows the yield trend of maize in SSA andIndia. First, similar to the case of rice, the yield gap between SSA and India wasnegligible in the 1960s and 1970s, which indicates either the difference in agro-climate between SSA and India is not a decisive determinant of maize yield or agro-climatic differences are small. Second, the maize yield in India began increasing inthe mid-1980s due to the Green Revolution, resulting in a yield gap of roughly 1ton per hectare between SSA and India in recent years. However, this gap is muchsmaller than for rice, where the yield gap amounts to two tons per hectare. Sinceimproved maize varieties are highly location specific (Smale et al. 2013), improvingthe maize yield in SSA seems more difficult than for rice. Third, the difference inyield between the average and top 10 countries in SSA is relatively small,18 whichindicates themaize yield is low even in themost advanced regions in SSA. Therefore,
17Note that, although yield in the bottom 10 countries is very low, their harvested areas are relativelysmall, so that average yield is not significantly affected by the overly low yield.18Note that, although yield in the bottom 10 countries is very low, harvested areas are small so thatthe average is not significantly affected by the low yield.
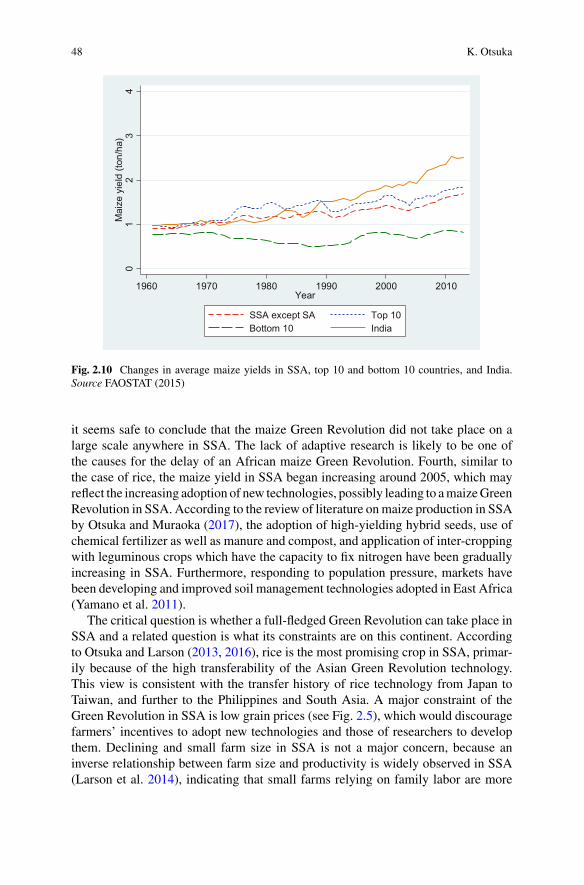
48 K. Otsuka
01
23
4M
aize
yie
ld (t
on/h
a)
1960 1970 1980 1990 2000 2010Year
SSA except SA Top 10Bottom 10 India
Fig. 2.10 Changes in average maize yields in SSA, top 10 and bottom 10 countries, and India.Source FAOSTAT (2015)
it seems safe to conclude that the maize Green Revolution did not take place on alarge scale anywhere in SSA. The lack of adaptive research is likely to be one ofthe causes for the delay of an African maize Green Revolution. Fourth, similar tothe case of rice, the maize yield in SSA began increasing around 2005, which mayreflect the increasing adoption of new technologies, possibly leading to amaizeGreenRevolution in SSA. According to the review of literature onmaize production in SSAby Otsuka and Muraoka (2017), the adoption of high-yielding hybrid seeds, use ofchemical fertilizer as well as manure and compost, and application of inter-croppingwith leguminous crops which have the capacity to fix nitrogen have been graduallyincreasing in SSA. Furthermore, responding to population pressure, markets havebeen developing and improved soil management technologies adopted in East Africa(Yamano et al. 2011).
The critical question is whether a full-fledged Green Revolution can take place inSSA and a related question is what its constraints are on this continent. Accordingto Otsuka and Larson (2013, 2016), rice is the most promising crop in SSA, primar-ily because of the high transferability of the Asian Green Revolution technology.This view is consistent with the transfer history of rice technology from Japan toTaiwan, and further to the Philippines and South Asia. A major constraint of theGreen Revolution in SSA is low grain prices (see Fig. 2.5), which would discouragefarmers’ incentives to adopt new technologies and those of researchers to developthem. Declining and small farm size in SSA is not a major concern, because aninverse relationship between farm size and productivity is widely observed in SSA(Larson et al. 2014), indicating that small farms relying on family labor are more
2 Technology Transfer and Agricultural Development … 49
productive than large farms relying on hired labor. Therefore, the Green Revolutionis compatible with smallholder agriculture in SSA (Larson et al. 2016), as was thecase in tropical Asia.
In my view, another and more serious constraint is the lack of recognition thatthe Green Revolution technology is “management intensive.” The Green Revolutionis alternatively called the “seed-fertilize” revolution in the literature (Johnston andCownie 1969), which indicates that if improved fertilizer-responsive seeds and chem-ical fertilizers are adopted, it will take place. However, I believe this is incorrect as notonly improved seeds and fertilizers, but also improved management practices, suchas seed selection, bunding, leveling, transplanting in row, and weeding are criticallyimportant to improving rice yields. This has been proven by assessing the impact ofimproved management training on rice yield, income, and profit per hectare underboth irrigated and rainfed conditions in SSA (deGraft-Johnson et al. 2014; Kijimaet al. 2012; Nakano et al. 2018b; Otsuka and Larson 2016; Takahashi et al. 2018).Rice yield seems to increase by 25–50% if proper management practices are adopted,even if improved seeds and chemical fertilizers are not used. The importance of theseimproved management practices would not have been emphasized in tropical Asiain the 1960s and 1970s partly because it was considered “trivially” true and alsobecause basic management practices had been adopted in Asia due primarily to itslong tradition of rice farming.19 The lack of recognition that that Green Revolutionis management intensive leads to a lack of effective extension systems.20 Conse-quently, the Green Revolution will not take place widely in SSA, unless and untilproper extension systems are built. The failure to accomplish the Green Revolutionwill delay the evolution of African countries towards an emerging state, as discussedin the next section.
2.5 Agricultural Development and Paths to an EmergingState
Following de Janvry and Sadoulet (2002), Otsuka et al. (2009), and Estudillo andOtsuka (2016), Fig. 2.11 illustrates how technological innovations in agriculture andirrigation investment, which lead to the Green Revolution, affect rural householdincome directly by increasing the efficiency and profitability of farming and indi-rectly through the growth linkage effects on nonfarm sectors and changes in theprices of agricultural products.21 The growth linkage effects of the Green Revolution
19I obtained this information from the former assistant of IRRI, Violy Cordova, who had workedfor IRRI since 1970, Dr. Chukichi Kaneda who worked for IRRI in the early 1970s, and ProfessorKoji Tanaka of Kyoto University who has researched the history of the development of rice famingin Asia.20This is true not only for rice but also for maize (Otsuka and Muraoka 2017).21For simplicity, Fig. 2.11 does not consider the consumption linkage effect of agricultural innova-tions on nonfarm sectors, which arises from increases in farm household income. Additionally, thepossible effect of human capital on the introduction of new technologies is ignored.
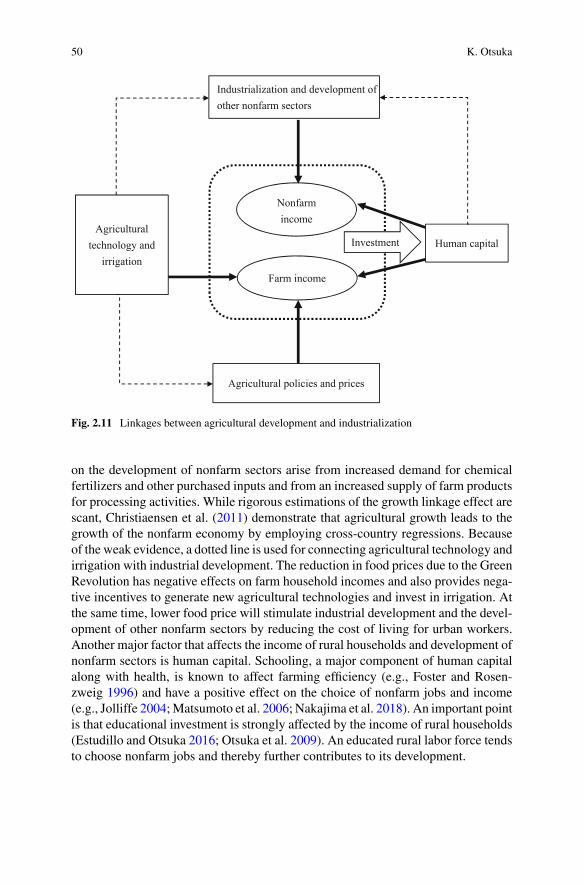
50 K. Otsuka
Industrialization and development of other nonfarm sectors
Nonfarm income
Human capital Agricultural
technology and irrigation
Investment
Farm income
Agricultural policies and prices
Fig. 2.11 Linkages between agricultural development and industrialization
on the development of nonfarm sectors arise from increased demand for chemicalfertilizers and other purchased inputs and from an increased supply of farm productsfor processing activities. While rigorous estimations of the growth linkage effect arescant, Christiaensen et al. (2011) demonstrate that agricultural growth leads to thegrowth of the nonfarm economy by employing cross-country regressions. Becauseof the weak evidence, a dotted line is used for connecting agricultural technology andirrigation with industrial development. The reduction in food prices due to the GreenRevolution has negative effects on farm household incomes and also provides nega-tive incentives to generate new agricultural technologies and invest in irrigation. Atthe same time, lower food price will stimulate industrial development and the devel-opment of other nonfarm sectors by reducing the cost of living for urban workers.Another major factor that affects the income of rural households and development ofnonfarm sectors is human capital. Schooling, a major component of human capitalalong with health, is known to affect farming efficiency (e.g., Foster and Rosen-zweig 1996) and have a positive effect on the choice of nonfarm jobs and income(e.g., Jolliffe 2004;Matsumoto et al. 2006; Nakajima et al. 2018). An important pointis that educational investment is strongly affected by the income of rural households(Estudillo and Otsuka 2016; Otsuka et al. 2009). An educated rural labor force tendsto choose nonfarm jobs and thereby further contributes to its development.
2 Technology Transfer and Agricultural Development … 51
In short, the Green Revolution aids the development of industries and other non-farm sectors by supplying wage goods and an educated labor force to the extent thatthe Green Revolution increases the income of rural households and, consequently,stimulates educational investment. The failure of the Green Revolution in SSA maywell be one of themajor causes for the failure of industrial development and the weakeffects of labor allocation from agriculture to other sectors on the labor productivityof African economies, as reported in Chap. 9.
Here, a critical question is the role of the state in promoting the Green Revolu-tion. Since improved varieties are public goods, particularly when they can be repro-duced by farmers, the government must play a major role in agricultural research.22
Knowledge of improved agronomic practices can thus be shared among farmers inthe locality and, hence, it is a local public good. Therefore, the government must takeresponsibility for agricultural extension. Furthermore, irrigation water is a commonpool resource and, thus, themarket fails to build irrigation facilities and allocatewaterefficiently (see Chap. 12 for details). Here too, the state must play a leading role.Therefore, whether the agrarian economy successfully evolves towards an emergingstate critically hinges on the government’s agricultural policy.
It is noteworthy that the income of a rural household is the major determinantof its investment in human capital (Otsuka et al. 2009). If a Green Revolution takesplace, thereby improving farm income and stimulating the development of nonfarmsectors, there can be a virtuous circle of income growth, increased investment inhuman capital, and the subsequent development of farm and nonfarm sectors. Theeffects of the Green Revolution and human capital, as well as those of nonfarm sectordevelopment on farm household income in Asia and Africa are analyzed in depth inChap. 10, using primary data.
Chapters 6–8 focus on industrialization in Asia, whereas Chap. 9 examines howindustrialization can be promoted by policy means in SSA. A common finding is theimportance of labor-intensive industrialization, particularly during the early stages ofeconomic development. Although agricultural development can contribute to indus-trialization by supplying an educated labor force and cheap foods, its contribution isoften curtailed by insufficient and inefficient extension systems, as pointed out in thischapter, and inappropriate irrigation policies, which will be discussed in Chap. 12.Particularly, the efficient management of ground water is extremely difficult becauseof the free access to this source of irrigation water. Practically, the most effectivesystem is community irrigation because people know each other very well within acommunity and punishment on deviating behavior from the communal agreementis feasible and possibly severe. Chapter 12, which concerns irrigation management,demonstrates that insufficient or improper recognition of the importance of com-munity irrigation systems by the government leads to mismanagement of irrigationwater, which in turn, deters agricultural development.
22To the extent that improved varieties can be diffused across country borders, they are “glob-al” or “regional” public goods. That is why international organizations, such as IRRI, undertakeagricultural research.
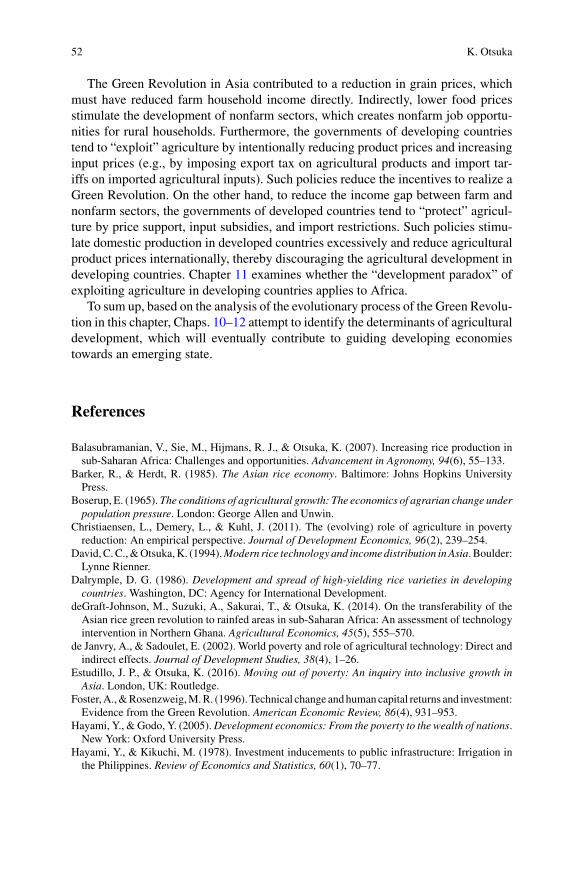
52 K. Otsuka
The Green Revolution in Asia contributed to a reduction in grain prices, whichmust have reduced farm household income directly. Indirectly, lower food pricesstimulate the development of nonfarm sectors, which creates nonfarm job opportu-nities for rural households. Furthermore, the governments of developing countriestend to “exploit” agriculture by intentionally reducing product prices and increasinginput prices (e.g., by imposing export tax on agricultural products and import tar-iffs on imported agricultural inputs). Such policies reduce the incentives to realize aGreen Revolution. On the other hand, to reduce the income gap between farm andnonfarm sectors, the governments of developed countries tend to “protect” agricul-ture by price support, input subsidies, and import restrictions. Such policies stimu-late domestic production in developed countries excessively and reduce agriculturalproduct prices internationally, thereby discouraging the agricultural development indeveloping countries. Chapter 11 examines whether the “development paradox” ofexploiting agriculture in developing countries applies to Africa.
To sum up, based on the analysis of the evolutionary process of the Green Revolu-tion in this chapter, Chaps. 10–12 attempt to identify the determinants of agriculturaldevelopment, which will eventually contribute to guiding developing economiestowards an emerging state.
References
Balasubramanian, V., Sie, M., Hijmans, R. J., & Otsuka, K. (2007). Increasing rice production insub-Saharan Africa: Challenges and opportunities. Advancement in Agronomy, 94(6), 55–133.
Barker, R., & Herdt, R. (1985). The Asian rice economy. Baltimore: Johns Hopkins UniversityPress.
Boserup, E. (1965). The conditions of agricultural growth: The economics of agrarian change underpopulation pressure. London: George Allen and Unwin.
Christiaensen, L., Demery, L., & Kuhl, J. (2011). The (evolving) role of agriculture in povertyreduction: An empirical perspective. Journal of Development Economics, 96(2), 239–254.
David,C.C.,&Otsuka,K. (1994).Modern rice technology and income distribution in Asia. Boulder:Lynne Rienner.
Dalrymple, D. G. (1986). Development and spread of high-yielding rice varieties in developingcountries. Washington, DC: Agency for International Development.
deGraft-Johnson, M., Suzuki, A., Sakurai, T., & Otsuka, K. (2014). On the transferability of theAsian rice green revolution to rainfed areas in sub-Saharan Africa: An assessment of technologyintervention in Northern Ghana. Agricultural Economics, 45(5), 555–570.
de Janvry, A., & Sadoulet, E. (2002). World poverty and role of agricultural technology: Direct andindirect effects. Journal of Development Studies, 38(4), 1–26.
Estudillo, J. P., & Otsuka, K. (2016). Moving out of poverty: An inquiry into inclusive growth inAsia. London, UK: Routledge.
Foster,A.,&Rosenzweig,M.R. (1996). Technical change andhumancapital returns and investment:Evidence from the Green Revolution. American Economic Review, 86(4), 931–953.
Hayami, Y., &Godo, Y. (2005). Development economics: From the poverty to the wealth of nations.New York: Oxford University Press.
Hayami, Y., & Kikuchi, M. (1978). Investment inducements to public infrastructure: Irrigation inthe Philippines. Review of Economics and Statistics, 60(1), 70–77.
2 Technology Transfer and Agricultural Development … 53
Hayami, Y., & Ruttan, V. W. (1985). Agricultural development: An international perspective. Bal-timore: Johns Hopkins University Press.
Hsieh, S. C., & Ruttan, V. W. (1967). Environmental, technological, and institutional factors in thegrowth of rice production: Philippines, Thailand, and Taiwan. Food Research Institute Studies,7, 307–341.
Janaiah, A., Hossain, M., & Otsuka, K. (2005). Is the productivity impact of the Green Revolutionin rice vanishing? Economic and Political Weekly, 40(53), 5596–5600.
Jolliffe, D. (2004). The impact of education in rural Ghana: Examining household labor allocationand returns on and off farm. Journal of Development Economics, 73(1), 287–314.
Johnston, B. F., & Cownie, J. (1969). The seed-fertilizer revolution and labor force absorption.American Economic Review, 59(4), 569–582.
Kijima,Y., Ito,N.,&Otsuka,K. (2012).Assessing the impact of trainingon lowland rice productivityin an African setting: Evidence from Uganda. World Development, 40(8), 1619–1633.
Kijima, Y., Otsuka, K., & Sserunkuuma, D. (2011). An inquiry into constraints on a green revolutionin sub-Saharan Africa: The case of NERICA rice in Uganda. World Development, 39(1), 77–86.
Larson, D., Otsuka, K., Matsumoto, T., &Kilic, T. (2014). Should African rural development strate-gies depend on small farms? An exploration of the inverse productivity Hypothesis. AgriculturalEconomics, 45(3), 355–367.
Larson, D., Muraoka, R., & Otsuka, K. (2016). Why African rural development strategies mustdepend on small farms. Global Food Security, 10, 39–51.
Matsumoto, T., Kijima, Y., & Yamano, T. (2006). The role of local nonfarm activities and migra-tion in reducing poverty: Evidence from Ethiopia, Kenya, and Uganda. Agricultural Economics,35(S3), 449–458.
Meadows, D. H., Meadows, D. L., Randes, J., & Behrens, W. W. (1972). The limits to growth. NewYork: Universe Books.
Nakajima, M., Yamano, T., & Otsuka, K. (2018). Jobs off the farm: Wealth, human capital, andsocial groups in rural eastern India. Journal of Development Studies, 54(1), 111–132.
Nakano, Y., & Otsuka, K. (2011). Determinants of household contributions to collective irriga-tion management: A case of the Doho rice scheme in Uganda. Environment and DevelopmentEconomics, 16(5), 521–551.
Nakano, Y., Tanaka, Y., & Otsuka, K. (2018a). Impact of training on the intensification of ricefarming: Evidence from rain-fed areas in Tanzania. Agricultural Economics, 49(2), 193–202.
Nakano, Y., Tsusaka, T. W., Aida, T., & Pede, V. O. (2018b, forthcoming). Is farmer-to-farmerextension effective? The impact of training on technology adoption and rice farming productivityin Tanzania. World Development, 105, 336–351.
Njeru, T., Mano, Y., & Otsuka, K. (2016). Role of access to credit in rice production in sub-SaharanAfrica: The case of Mwea irrigation scheme in Kenya. Journal of African Economies, 25(2),300–321.
Otsuka, K. (2013). Food insecurity, income inequality, and the changing comparative advantage inworld agriculture. Agricultural Economics, 44(S1), 7–18.
Otsuka, K., Estudillo, J. P., & Sawada, Y. (Eds.). (2009). Rural poverty and income dynamics inAsia and Africa. London, UK: Routledge.
Otsuka, K., & Hayami, Y. (1994). Beyond the green revolution: agricultural development strat-egy into the new century. In J. Anderson (Ed.), Agricultural technology: Policy issues for theinternational community (pp. 15–42). Wallingford: CAB International.
Otsuka, K., & Larson, D. (Eds.). (2013). An African Green Revolution: Finding ways to boostproductivity on small farms. Dordrecht: Springer.
Otsuka, K., & Larson, D. (Eds.). (2016). In pursuit of an African Green Revolution: Views from riceand maize farmers’ fields. Dordrecht: Springer.
Otsuka, K., & Muraoka, R. (2017). A green revolution for sub-Saharan Africa: Past failures andfuture prospects. Journal of African Economies, 26(S1), i73–i98.
54 K. Otsuka
Smale, M., Byerlee, D., & Jayne, T. (2013). Maize revolution in sub-Saharan Africa. In K. Otsuka& D. Larson (Eds.), An African Green Revolution: Finding ways to boost productivity on smallfarms (pp. 165–195). Dordrecht: Springer.
Tanaka, K. (2012). Seizon kiban jizokugara hatten keiro o motomete: Ajia inasakuken no keikenkara (In search of sustainable livelihood system: a view from the experience of rice growing areasin Asia). In K. Sugihara, K.Wakimura, K. Fujita, & A. Tanabe A (Eds.), Rekishi no nakano nettaiseizon ken (Livelihood space in history of tropics) (pp. 185–210). Kyoto: Kyoto University Press.
Tanaka, K., & Imai, R. (2006). Shokuminchi keiei to nogyo gujutu: Taiwan, Nanpo, Manshu (Man-agement of colonies and agricultural technology: Taiwan, Tropics, and Manchuria). In K. Tanaka(Ed.), Teikoku Nihon no Gakuchi (Wisdom of the Empire Japan) (pp. 100–137). Tokyo: IwanamiShoten.
Takahashi, K.,Mano,Y.,&Otsuka, K. (2018). Beyond the SUTVA:The dynamic impact ofmanage-ment training and subsequent information spillover on agricultural performance in Cote d’Ivoire.Mimeographed.
Umemura, M., Yamada, S., Hayami, Y., Takamatsu, M., & Kumazki, M. (1966). Estimates oflong-term statistics of Japan since 1868: Agriculture and forestry. Tokyo, Japan: Toyo KeizaiShinposha.
Yamano, T., Arouna, A., Labarta, R. A., Huelgas, Z. M., & Mohanty, S. (2016). Adoption andimpacts of international rice research technologies. Global Food Security, 8, 1–8.
Yamano, T., Otsuka, K., & Place, F. (Eds.). (2011). Emerging development of agriculture in EastAfrica: Markets, soil, and innovations. Amsterdam: Springer.
Open Access This chapter is licensed under the terms of the Creative Commons Attribution-NonCommercial-NoDerivatives 4.0 International License (http://creativecommons.org/licenses/by-nc-nd/4.0/), which permits any noncommercial use, sharing, distribution and reproduction in anymedium or format, as long as you give appropriate credit to the original author(s) and the source,provide a link to the Creative Commons licence and indicate if you modified the licensed material.You do not have permission under this licence to share adapted material derived from this chapteror parts of it.
The images or other third party material in this chapter are included in the chapter’s CreativeCommons licence, unless indicated otherwise in a credit line to the material. If material is notincluded in the chapter’s Creative Commons licence and your intended use is not permitted bystatutory regulation or exceeds the permitted use, you will need to obtain permission directly fromthe copyright holder.

Chapter 3Southeast Asia and International Trade:Continuity and Change in HistoricalPerspective
Ryuto Shimada
3.1 Introduction
International trade has been an essential element of the long-term economic devel-opment of Southeast Asia. Involvement in international trade has laid crucial foun-dations for the present-day economic growth of this region since the fourth quarterof the twentieth century.
This chapter aims to provide a general overview of the relations between interna-tional trade and the economy of Southeast Asia from a long-term perspective. First, ashort description is supplied about the relationships between natural endowments andinternational trade of Southeast Asia before the European arrival. The second sectionis devoted to an analysis of international trade of Southeast Asia from the beginningof the sixteenth century to the middle of the second half of the nineteenth century.This is then followed by a case study of Batavia’s trade. The third section focuses onthe economic influences of international trade on the Southeast Asian economy andsociety, including the change in the patterns of production, during the same period.The forth section returns to a survey of trade, to extend it to the high colonial periodand its aftermath roughly to 1975, identifying several characteristics of the modernSoutheast Asian economy along the way. Finally, the last section touches on themost recent period of industrialization, to show that the historically specific pathlaid by international trade has been critically important for the understanding of thelong-term economic development of Southeast Asia.
Figure 3.1 is an illustration of the structure of this chapter. It was drawn to sug-gest that, if we take a few centuries together, there was normally an intermediatelevel of trade, which might be called intra-Asian trade, that often linked and orga-nized other levels of trade. Intra-Asian trade is distinguished from both global long-distance trade, usually with Europe and the Americas, and local trade, including
R. Shimada (B)Graduate School of Humanities and Sociology, The University of Tokyo, Tokyo, Japane-mail: [email protected]
© The Author(s) 2019K. Otsuka and K. Sugihara (eds.), Paths to the Emerging State in Asia and Africa,Emerging-Economy State and International Policy Studies,https://doi.org/10.1007/978-981-13-3131-2_3
55
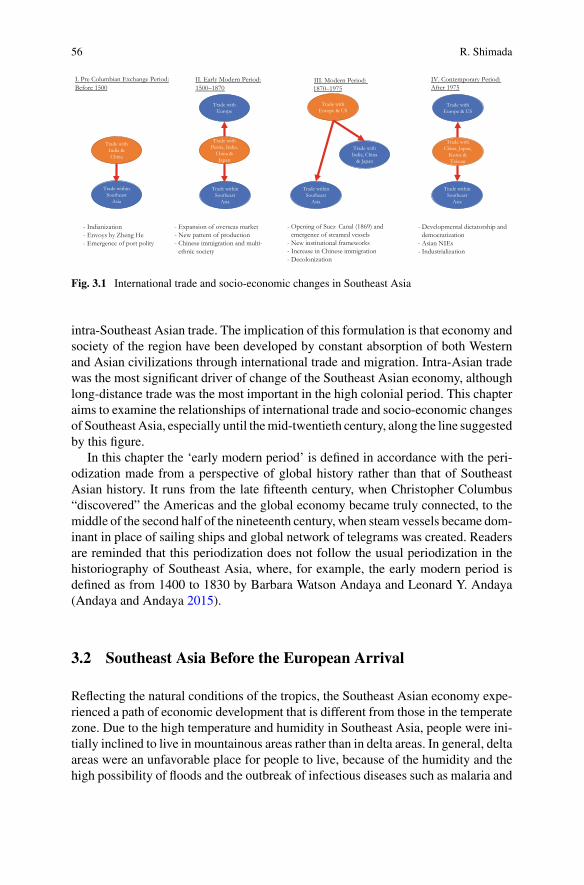
56 R. Shimada
Trade with India & China
Trade with Persia, India,
China & Japan
Trade within Southeast
Asia
Trade with Europe
Trade with India, China
& Japan
Trade within Southeast
Asia
Trade with Europe & US
Trade with China, Japan,
Korea & Taiwan
I. Pre Columbian Exchange Period:Before 1500
II. Early Modern Period:1500–1870
III. Modern Period: 1870–1975
Trade within Southeast
Asia
Trade with Europe & US
IV. Contemporary Period: After 1975
Trade within Southeast
Asia
- Opening of Suez Canal (1869) and emergence of steamed vessels
- New institutional frameworks- Increase in Chinese immigration- Decolonization
- Indianization- Envoys by Zheng He- Emergence of port polity
- Expansion of overseas market- New pattern of production- Chinese immigration and multi-
ethnic society
- Developmental dictatorship and democratization
- Asian NIEs- Industrialization
Fig. 3.1 International trade and socio-economic changes in Southeast Asia
intra-Southeast Asian trade. The implication of this formulation is that economy andsociety of the region have been developed by constant absorption of both Westernand Asian civilizations through international trade and migration. Intra-Asian tradewas the most significant driver of change of the Southeast Asian economy, althoughlong-distance trade was the most important in the high colonial period. This chapteraims to examine the relationships of international trade and socio-economic changesof SoutheastAsia, especially until themid-twentieth century, along the line suggestedby this figure.
In this chapter the ‘early modern period’ is defined in accordance with the peri-odization made from a perspective of global history rather than that of SoutheastAsian history. It runs from the late fifteenth century, when Christopher Columbus“discovered” the Americas and the global economy became truly connected, to themiddle of the second half of the nineteenth century, when steam vessels became dom-inant in place of sailing ships and global network of telegrams was created. Readersare reminded that this periodization does not follow the usual periodization in thehistoriography of Southeast Asia, where, for example, the early modern period isdefined as from 1400 to 1830 by Barbara Watson Andaya and Leonard Y. Andaya(Andaya and Andaya 2015).
3.2 Southeast Asia Before the European Arrival
Reflecting the natural conditions of the tropics, the Southeast Asian economy expe-rienced a path of economic development that is different from those in the temperatezone. Due to the high temperature and humidity in Southeast Asia, people were ini-tially inclined to live in mountainous areas rather than in delta areas. In general, deltaareas were an unfavorable place for people to live, because of the humidity and thehigh possibility of floods and the outbreak of infectious diseases such as malaria and
3 Southeast Asia and International Trade: Continuity … 57
dysentery. The difficulty of controlling large volumes of water was another reasonfor people’s unwillingness to live in the delta. Thus most people lived in the cool anddry mountainous areas, and therefore did not utilize the delta areas by the seaside,an environment potentially richly endowed. For these reasons, Southeast Asia wascomparatively sparsely populated during the pre-early modern period.
A major motivation for developing delta areas was to respond to the rise of prof-itable international maritime trade. High overseas demands for products suppliedfrom the hinterland as well as large profits from transit trade inspired people tomove and settle in lower areas from their mountainous dwellings. In this way, portcities such as Gresik in Java, Palembang in Sumatra and Ayutthaya in Thailandwere established to facilitate maritime trade. These port cities were transport hubswhere products from inlandwere gathered for export and overseas commodities wereimported for distribution into the hinterland.Moreover, strong political regimes wereoften formed in such port cities. These political regimes are now called port-polity(Kathirithamby-Wells and Villiers 1990). In fact, Palembang and Ayutthaya are goodexamples of this, even though these ports were located far from the sea. These twocities were established at the point just between the plateau and the delta areas, whichindicates that it was difficult to develop the delta areas at this time.
Historically, Southeast Asia engaged in two types of maritime trade. The first wasintra-Asian trade. This type of trade has a very long history, spanning more thantwo thousand years. Geographically, it was of a very large scale. Since SoutheastAsia is located between China and India, both of which had been powerful economicforces, Southeast Asia’s trade developed along with the development of maritimetrade of these Asian economic powers. Contacts with the Indian subcontinent hadbeen significant over a longer period of time, as is reflected in India’s strong culturalinfluence over Southeast Asia, which continues to this day. In addition, present-day Southeast Asia has Persian and Arabian imprints through the presence of theWest Asian merchants who came to the region via maritime routes (Hall 2011). Thekingdom of Champa is a good example to reveal the strong economic and culturalconnections with China, India, and even West Asia. This kingdom, located in whatis now mid-Vietnam, first had strong links with China around the third century, andsent tributary missions there. However, Champa began to be influenced by India andacceptedHindu culture, before the spread of Islamic influence began in the fourteenthcentury (Hardy et al. 2009).
Needless to say, Chinese influence has been as strong as Indian influence in South-east Asia. The naval expeditions of Ming China between 1405 and 1433 directed byZheng He, whowas aMuslim Chinese admiral, and the tributary trade betweenMingChina and Southeast Asian states marked a climax of the intra-Asian trade before theEuropean entry into Southeast Asia. The Ming imperial court sent large fleets seventimes. The fleets visited Southeast Asia as well as Sri Lanka, the Indian subcontinent,the Arabian Peninsula, and East Africa. Due to the arrival of powerful fleets directedby Zheng He, Southeast Asian states in particular came under the strong politicalinfluence of Ming China. They sent to tributary missions to China and conductedmaritime trade under the control of the Ming dynasty within the framework of thetributary system (Liu et al. 2014).
58 R. Shimada
The second type of maritime trade was a regional trade within Southeast Asia.Along with the development of intra-Asian trade, intra-regional maritime trade alsobegan to grow. Not only coastal trade such as that in Java and Vietnam, but also afairly long-distance trade was developed within Southeast Asia. The combination ofintra-Asian trade with India and China and regional trade created a path of economicdevelopment based on international maritime trade. The proto-type of this path isevidenced through the records of Srivijaya from the seventh to the tenth century.Srivijaya was a federation of Malay cities among the Malay Peninsula, SumatraIsland, and Java Island. Each port city reaped profits and benefits from maritimetrade and, in return, the unified kingdom was a recipient of Buddhism from theIndian subcontinent (Munoz 2006).
While Southeast Asia enjoyed the proto-type of trade-based economic devel-opment comprising intra-Asian and intra-regional trade by the fifteenth century(Fig. 3.1), its economy stepped into a new age of modernization at the beginningof the sixteenth century, when European traders began participating in economicactivities. It was the beginning of the age of economic globalization when the Euro-peans began to connect Eurasia, Africa, and the Americas.
3.3 Maritime Trade in the Early Modern Period
The global economy entered a new stage at the beginning of the so-called Columbianexchange in the late fifteenth century (Crosby 1972), when the Americas were con-nected by Christopher Columbus and his followers. International connections trulydeveloped on a global scale. As part of this global economic evolution, the SoutheastAsian economy witnessed several changes.
Goa was conquered by the Portuguese in 1510 and became a center for the Por-tuguese maritime empire in Asia. In the next year, the Portuguese attacked the king-dom ofMalacca (Melaka) gaining control of this key port in Southeast Asia. Soon thePortuguese also acquired the maritime lines to the Moluccas (Maluku Islands) andtoMacau fromMalacca. It is generally believed that gaining control of the Moluccaswas highly important for Portuguese global trade, as the islands were the only placein the world where the valuable spices of clove, nutmeg, and mace were produced.These spices were key commodities in the Euro-Asian trade by the Portuguese in thesixteenth century.
The spice trade was one of the main sources of profits for the Portuguese empire.Indeed, the Portuguese were also engaged in intra-Asian trade, which also broughtimpressive profits. They had several trading bases in maritime Asia, some of whichwere Portuguese colonial cities such as Goa, Hormuz, Colombo, Malacca, andMacau. On the other hand, they also had trading posts in port cities under the con-trol of Asian indigenous political regimes, such as Cambay (Khambhat) in Gujarat,Ayutthaya in Thailand and Nagasaki in Japan. Through their trading networks inmaritime Asia, the Portuguese obtained large profits (Souza 1986).
3 Southeast Asia and International Trade: Continuity … 59
The history of the Portuguese provides us with a unique insight. It is true that theEuropean arrival was a symbolic event in Southeast Asia during the early modernperiod. However, from the point of view of the region, the Portuguese were simplya new participant in Asia’s maritime trade. The Portuguese were engaged in bothintra-Asian trade and Euro-Asian trade, and these trading activities contributed toeconomic development of the region.
What the combination of Euro-Asian trade and intra-Asian trade could ultimatelyachieve were made much clearer by the Dutch East India Company (Verenigde Oost-indische Compagnie, hereafter VOC), which existed from 1602 to 1799. The initialaim of the VOC was to directly procure Asian products for the European market.Spices such as pepper, nutmeg, mace, clove, and cinnamon in maritime Asia werethe most desirable products for the VOC, although sugar, coffee, and tea emerged inthe seventeenth and eighteenth centuries as other important Asian products. In orderto acquire these products, the VOC brought American silver to Asia through Europeas a means of payment.
Besides Euro-Asian trade, the VOC attempted to participate in intra-Asian trade.Before the arrival of European traders tomaritimeAsia in the sixteenth century, intra-Asian trade was conducted by several indigenous traders such as Arabs, Persians andChinese. Through commercial negotiations and military actions, European traderscame to join this branch of trade. In the sixteenth century, local Portuguese traderswere one of the most powerful groups of traders, while in the seventeenth century,the VOC began engaging in intra-Asian trade on a much larger scale. The VOCwas a unique participant, as it was a single organization, which conducted both longdistance trade and intra-regional trade on a large scale. Other European companiessuch as English and French East India Companies were engaged in Euro-Asian tradewithout such a commitment in intra-regional trade (Shimada 2006).
It is impossible to disregard themagnitude of maritime trade conducted by indige-nous Asian merchants. Asian traders were clearly more important than Europeantraders in the early modern period. The most remarkable among them were Chi-nese merchants. Before the arrival of Europeans, Chinese merchants were activelyengaged in intra-Asian trade. Not only Chinese traders, but also overseas Chinesetraders conducted trade between Southeast Asia and China, while also participatingin regional trade within Southeast Asia.
Set against this background, we see the emergence of the Chinese maritime net-work in the eighteenth century as a natural course of development. When politicalpeace was realized in the late seventeenth century after the confusion caused by theMing-Qing transition, the Chinese economy expanded, which caused greater demandfor Southeast Asian products such as rice and tin. Some scholars refer to this periodas “the Chinese century” (Reid 1997; Blussé 1999), indicating the influence of theChinese economy, which grew in Southeast Asia through international trade withChina by Chinese traders (see Chap. 4 of this volume).
Muslim traders were also important in Southeast Asia. Bugis and Malay traderswere active in regional maritime trade in insular Southeast Asia from the second halfof the eighteenth century (Barnard 2003). Their trading networks were also highlyimportant in the context of the expansion of Islam. Through these networks, Arabian
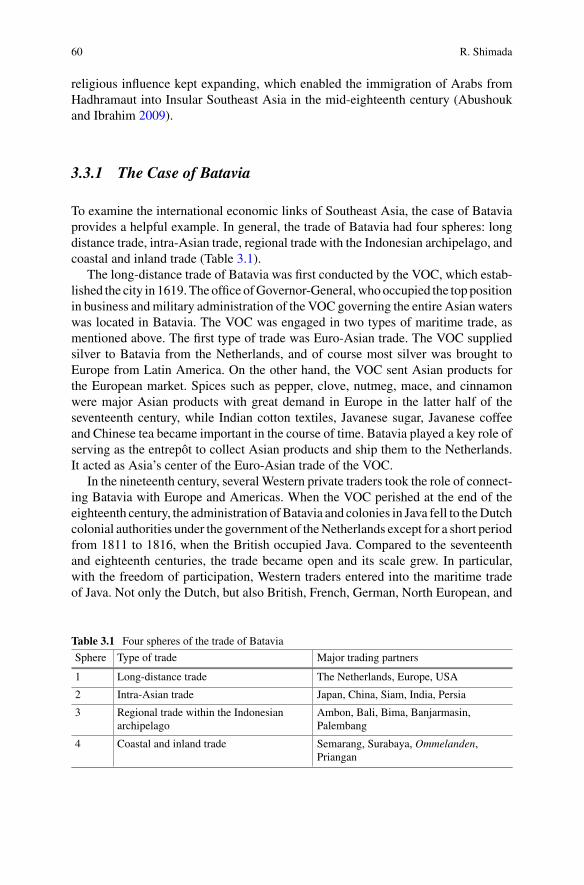
60 R. Shimada
religious influence kept expanding, which enabled the immigration of Arabs fromHadhramaut into Insular Southeast Asia in the mid-eighteenth century (Abushoukand Ibrahim 2009).
3.3.1 The Case of Batavia
To examine the international economic links of Southeast Asia, the case of Bataviaprovides a helpful example. In general, the trade of Batavia had four spheres: longdistance trade, intra-Asian trade, regional trade with the Indonesian archipelago, andcoastal and inland trade (Table 3.1).
The long-distance trade of Batavia was first conducted by the VOC, which estab-lished the city in 1619. The office ofGovernor-General,whooccupied the top positionin business andmilitary administration of the VOC governing the entire Asian waterswas located in Batavia. The VOC was engaged in two types of maritime trade, asmentioned above. The first type of trade was Euro-Asian trade. The VOC suppliedsilver to Batavia from the Netherlands, and of course most silver was brought toEurope from Latin America. On the other hand, the VOC sent Asian products forthe European market. Spices such as pepper, clove, nutmeg, mace, and cinnamonwere major Asian products with great demand in Europe in the latter half of theseventeenth century, while Indian cotton textiles, Javanese sugar, Javanese coffeeand Chinese tea became important in the course of time. Batavia played a key role ofserving as the entrepôt to collect Asian products and ship them to the Netherlands.It acted as Asia’s center of the Euro-Asian trade of the VOC.
In the nineteenth century, several Western private traders took the role of connect-ing Batavia with Europe and Americas. When the VOC perished at the end of theeighteenth century, the administration ofBatavia and colonies in Java fell to theDutchcolonial authorities under the government of theNetherlands except for a short periodfrom 1811 to 1816, when the British occupied Java. Compared to the seventeenthand eighteenth centuries, the trade became open and its scale grew. In particular,with the freedom of participation, Western traders entered into the maritime tradeof Java. Not only the Dutch, but also British, French, German, North European, and
Table 3.1 Four spheres of the trade of Batavia
Sphere Type of trade Major trading partners
1 Long-distance trade The Netherlands, Europe, USA
2 Intra-Asian trade Japan, China, Siam, India, Persia
3 Regional trade within the Indonesianarchipelago
Ambon, Bali, Bima, Banjarmasin,Palembang
4 Coastal and inland trade Semarang, Surabaya, Ommelanden,Priangan
3 Southeast Asia and International Trade: Continuity … 61
American traders called Javanese ports such as Batavia and Surabaya, and engagedin the business of Euro-Asian or American-Asian trade (Shimada 2013).
The sphere of intra-Asian trade in Batavia were also controlled mainly by theVOC. The VOC had several trading posts in maritime Asia from Japan to Arabia. Byconnecting these trading posts, it succeeded in developing several patterns of intra-Asian trade. One representative pattern is the triangular trade that emerged betweenJapan, India and Southeast Asia. Japan exported silver, gold and copper to India.India then exported cotton textiles to Southeast Asia, where primary products suchas sugar, sappanwood (a dye source), and deer hides were produced for the Japanesemarket. The VOC entered into this triangular trade with fierce force, and earned largeprofits. The profits from intra-Asian trade contributed to the success of the VOC,because the company was able to reduce the export of silver from the Netherlands toAsia and saved costs. For this intra-Asian trade Batavia was an important transit portin the VOC’s shipping network, which linked up maritime Asian countries such asJapan, China, Siam, Mughal India, and Persia. This contributed to Asian economicdevelopment by establishing a system of international division of labor in maritimeAsia, in which Batavia played a pivotal role in the VOC’s trading network.
In these two spheres of trade, the Javanese economy played the role of exportingprimary products. Sugar, coffee and later indigo were good examples. The hugedemand for Javanese primary products was a stimulus for the economic developmentof Java and contributed to the growth of the port of Batavia.
The third sphere of trade was concerned with regional trade within the Indonesianarchipelago. This trade was conducted mainly by Asian traders such as Chineseand Muslim traders, although it also involved the participation of the VOC in theseventeenth and eighteenth centuries and by privateWestern traders in the nineteenthcentury. The port of Batavia was not designed only for the Dutch vessels even in theseventeenth and eighteenth centuries. Indigenous Asian traders also utilized this port.Overseas Chinese traders in Batavia were the most significant customers of the port.While they accepted junk ships from mainland China and Chinese immigrants, theyconducted their own shipping business. They sent their ships not only to other ports inJava such as Semarang and Surabaya but also to ports in the Indonesian archipelagolike Bali and Banjarmasin (Shimada 2013). Their trading network formed a basisfor the development of overseas Chinese power in the Indonesian archipelago. Inthis regional trading world, Batavia was one of the trading centers accustomed toimporting and exporting regional products.
The fourth sphere was coastal trade and inland trade. Batavia was supplied withessential items like food products and timber through coastal trade. These productswere necessary for the urban people of Batavia. This trade was conducted by Asiantraders, the VOC and, later, Western private traders. In addition, the port of Bataviawas an important port to which primary products could be sent from the hinterland.Already in the early eighteenth century, Batavia exported sugar produced in its sub-urban areas (Ommelanden) and coffee produced in Priangan. In this way, it was asignificant trading port for the economic development of East Java (Jacobs 2006).
62 R. Shimada
3.4 Social Changes in the Early Modern Period
During the early modern period from the fifteenth century to the mid-nineteenthcentury, Southeast Asia experienced a change towards the formation of the moderneconomy and society (Fig. 3.1).
3.4.1 Expansion of the Overseas Market
European entry into Southeast Asia’s international trade expanded the market forprimary products from Southeast Asia. Simultaneously, tropical agricultural produc-tion was developed due to the large demand in the overseas market. In the sixteenthand seventeenth centuries, large volumes of spices were exported to Europe. Pepperwas exported from Sumatra and Java, while nutmeg, mace, and clove were exportedfrom the Moluccas. Besides spices, cane sugar and coffee bean were exported fromJava since the seventeenth and eighteenth centuries, respectively. Apart from theseagricultural products, tinwas also an important Southeast Asian product for the Euro-pean market. It was produced in southern Thailand, the Malay states of the peninsulaand, since the eighteenth century, Bangka Island.
In addition to the European market, Asian demand for Southeast Asian productsincreased as well. Highly connected links within maritime Asia were spurred by thecompetition among Asian as well as European traders. Southeast Asia maintainedand expanded their trade links with East Asia and South Asia. For example, Japanimported cane sugar from Java and sappanwood, rayskin, and animal hide fromThailand. China imported rice, tin and dried marine products such as sea cucumberfrom Southeast Asia. India imported cane sugar, spices and tin. In exchange for theseproducts SoutheastAsia obtained silver fromEastAsia and cotton textiles fromSouthAsia (Shimada 2018).
Ricewas themost important product for both intra-Asian trade and intra-SoutheastAsian trade. Even before the European entry, Thai rice was exported to many areasin Southeast Asia. In addition to Thai rice, Javanese rice was traded in both intra-Southeast Asian and coastal and inland trade. It was exported to other parts of theIndonesian archipelago, and through coastal trade within the island of Java. As thesurrounding zone of Batavia became specialized in the production of sugar cane,rice had to be imported into Batavia from northeast coastal area of the island. Inthe middle of the first half of the eighteenth century, Thailand began to export riceto China. This was because China was facing a shortage of rice due to the rapidpopulation increase during the eighteenth century. This Thai rice trade with Chinabecame the key trade for the Thai economy until the twentieth century.
Intra-Asian trade was conducted not only by Asian traders but also by Europeantraders. The latter, such as the VOC and English and Portuguese private merchants,as well as Chinese and Indo-Persian traders engaged in comparatively long-distancetrade. On the other hand, Asian traders such as overseas Chinese, overseas Arab, andBugis specialized in coastal trade and regional trade in Southeast Asia. Rice trade,interestingly, was not conducted by European traders but was left to Asian traders.
3 Southeast Asia and International Trade: Continuity … 63
3.4.2 A New Pattern of Production
Due to the growth of international trade, the mode of production changed over thecourse of time. One remarkable changewas the introduction of the plantation system.Early European powers in Southeast Asia introduced the plantation system for sugarcane production. In the middle of the seventeenth century, the VOC attempted it inTaiwan. Although it was unsuccessful because of the abandoning of theDutch colonyin Taiwan in 1662, the VOC again attempted the introduction in Java on a largescale (Yao 2003). The Company sold the lands around Batavia to private Europeancitizens, who in turn leased the land to Chinese entrepreneurs. These entrepreneursmanaged the sugar cane cultivation and the cane sugar production for export (Blussé1986). Laborers in this sugar industry were not only local Asians but also Chineseimmigrants. In fact, overseas Chinese laborers outnumbered local Asians.
The mining sector too witnessed a change. Formerly, tin mining operated as asmall-scale industry in southern Thailand and the Malay Peninsula. Tin was minedthere by indigenous people as side work, and they contributed their products to thestates as a sort of head tax. However, a new mode of production was introduced inthe first half of the eighteenth century in Bangka and in the late eighteenth century inthe Malay Peninsula. It involved a group of Chinese immigrant miners. Around fiftyminers formed a group with a Chinese head, who was in charge of all the processesof mining and refinery (Shimada 2015). In addition to the tin mining sector, goldmining was also developing in West Borneo during the eighteenth century. The so-called Lanfang Republic (1777–1884) was a sort of state founded by prominentoverseas merchants, who accumulated profits from gold mining in Borneo (SomersHeidhues 2003).
Without a doubt, the most predominant sector in Southeast Asia was the agricul-tural sector. It was traditional but was in transition. Recent research claims that in theearly modern period small-scale, family-based patterns of agricultural productionbecame widespread in the northern part of the mainland of Southeast Asia such asnorthern Vietnam and Burma (Lieberman 2003). This change in the unit of agricul-tural production was a similar phenomenon to that seen in East Asia, and resulted inan increase in living standards among small-scaled agricultural producers.
With regard to other parts of Southeast Asia, traditional patterns of small-scaleagricultural production seem to have continued in the greater part of the agriculturalsector. However, the fact that the traditional pattern evolved in response to the over-seas demand cannot be ignored. Under the framework of the traditional small-scalefamily farming system, peasants had to work for a fixed number of days, for examplea hundred days per year, to be submitted to the head of local community as tax. Thiscompulsory labor systemwas authorized and exploited by European colonial author-ities or local states, which could collect agricultural products for export through theheads of local community as efficiently as possible. The Dutch cultivation system ofthe nineteenth century is the best example (Elson 1994).
64 R. Shimada
3.4.3 Immigration and Multi-ethnic Society
The establishment of colonial cities in Southeast Asia was driven largely by theEuropeanmerchants desire to increase their efficiency in international trade.Malacca,which was originally the capital of the state of Malacca, is a good example of aEuropean colonial city. Yet, it was occupied by the Portuguese, followed by theDutch and the British. Spanish Manila and Dutch Batavia are also typical examplesof European colonial cities established in the early modern period. These two citieswere the centers of trading business for the Spanish and Dutch merchants in theinitial stage; they served as capitals of the Spanish/US Philippines and the DutchEast Indies in the nineteenth century and are currently two megacities in SoutheastAsia.
Even in European colonial cities, Europeans did not comprise the majority of thepopulation. It was made up of huge varieties of Asian ethnic groups. The populationof Batavia, for example, included a large number of Chinese immigrants with someMalay,Bugis,Balinese, Indo-Persians, and soon.TheseAsianpopulacesweremostlyimmigrants to the colonial city. Batavia in 1699 had a population of 21,911. Amongthem, European citizens accounted for only 8%, the Chinese 17%, Asian Portuguesefreed-slaves (mardijker) 11%, South Asians 2%, Malay and Javanese 1%, and theBalinese and Makassarese 1%, although Asian slaves, who were immigrants or theirdescendants, accounted for more than the half of the total population (Raben 1996).
Being composed of several ethnic immigrants, these colonial cities were literallymulti-ethnic societies. Through the long history of multi-ethnicity since the earlymodern period, the Southeast Asian society has accumulated the experiences of andbenefits from multi-ethnic culture. This provided a powerful socio-cultural basisfor the economy and society, which would willingly attract and accept immigrants,foreign products, overseas technology, and international trade.
3.5 The High Colonial Period and After
Throughout the nineteenth century, international trade rapidly increased in South-east Asia. Although Table 3.2 shows the steady rise of merchandise exports fromSoutheast Asia from the first half of the nineteenth century to the end of the twenti-eth century, the whole structure of international trade and the economy of SoutheastAsia changed drastically around 1870.
First, in terms of international trade, long-distance trade with Europe and USAexpanded, as seen in Table 3.3. It was because of the increase in exports of primaryproducts and imports of cotton textiles. Southeast Asia exported rubber, sugar, cof-fee, and tea while it imported manufactured goods from Europe and USA whereindustrialization was in progress. Moreover, the opening of the Suez Canal was aturning point not only in terms of shipping but also in terms of the impact on thewhole economy. The canal was opened in 1869 and a huge number ofWestern steam
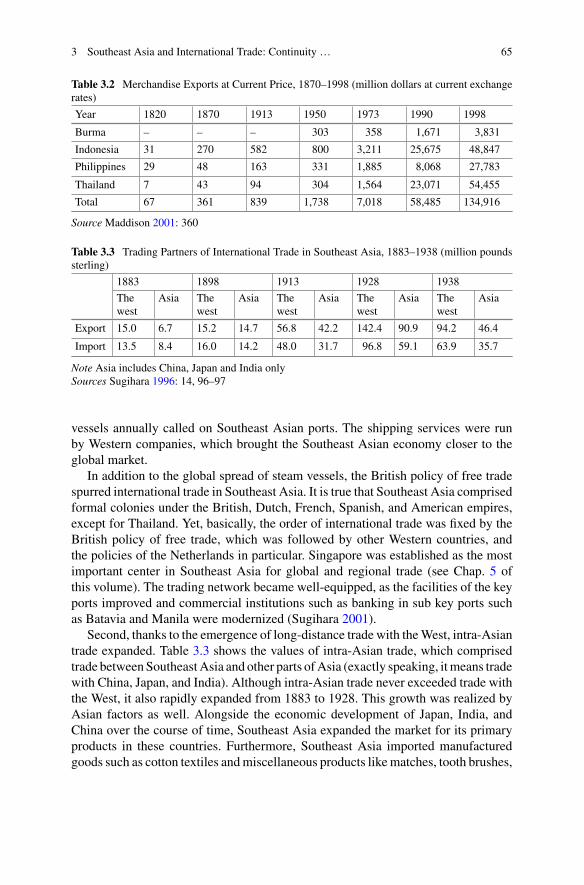
3 Southeast Asia and International Trade: Continuity … 65
Table 3.2 Merchandise Exports at Current Price, 1870–1998 (million dollars at current exchangerates)
Year 1820 1870 1913 1950 1973 1990 1998
Burma – – – 303 358 1,671 3,831
Indonesia 31 270 582 800 3,211 25,675 48,847
Philippines 29 48 163 331 1,885 8,068 27,783
Thailand 7 43 94 304 1,564 23,071 54,455
Total 67 361 839 1,738 7,018 58,485 134,916
Source Maddison 2001: 360
Table 3.3 Trading Partners of International Trade in Southeast Asia, 1883–1938 (million poundssterling)
1883 1898 1913 1928 1938
Thewest
Asia Thewest
Asia Thewest
Asia Thewest
Asia Thewest
Asia
Export 15.0 6.7 15.2 14.7 56.8 42.2 142.4 90.9 94.2 46.4
Import 13.5 8.4 16.0 14.2 48.0 31.7 96.8 59.1 63.9 35.7
Note Asia includes China, Japan and India onlySources Sugihara 1996: 14, 96–97
vessels annually called on Southeast Asian ports. The shipping services were runby Western companies, which brought the Southeast Asian economy closer to theglobal market.
In addition to the global spread of steam vessels, the British policy of free tradespurred international trade in Southeast Asia. It is true that Southeast Asia comprisedformal colonies under the British, Dutch, French, Spanish, and American empires,except for Thailand. Yet, basically, the order of international trade was fixed by theBritish policy of free trade, which was followed by other Western countries, andthe policies of the Netherlands in particular. Singapore was established as the mostimportant center in Southeast Asia for global and regional trade (see Chap. 5 ofthis volume). The trading network became well-equipped, as the facilities of the keyports improved and commercial institutions such as banking in sub key ports suchas Batavia and Manila were modernized (Sugihara 2001).
Second, thanks to the emergence of long-distance trade with theWest, intra-Asiantrade expanded. Table 3.3 shows the values of intra-Asian trade, which comprisedtrade betweenSoutheastAsia and other parts ofAsia (exactly speaking, itmeans tradewith China, Japan, and India). Although intra-Asian trade never exceeded trade withthe West, it also rapidly expanded from 1883 to 1928. This growth was realized byAsian factors as well. Alongside the economic development of Japan, India, andChina over the course of time, Southeast Asia expanded the market for its primaryproducts in these countries. Furthermore, Southeast Asia imported manufacturedgoods such as cotton textiles andmiscellaneous products likematches, tooth brushes,
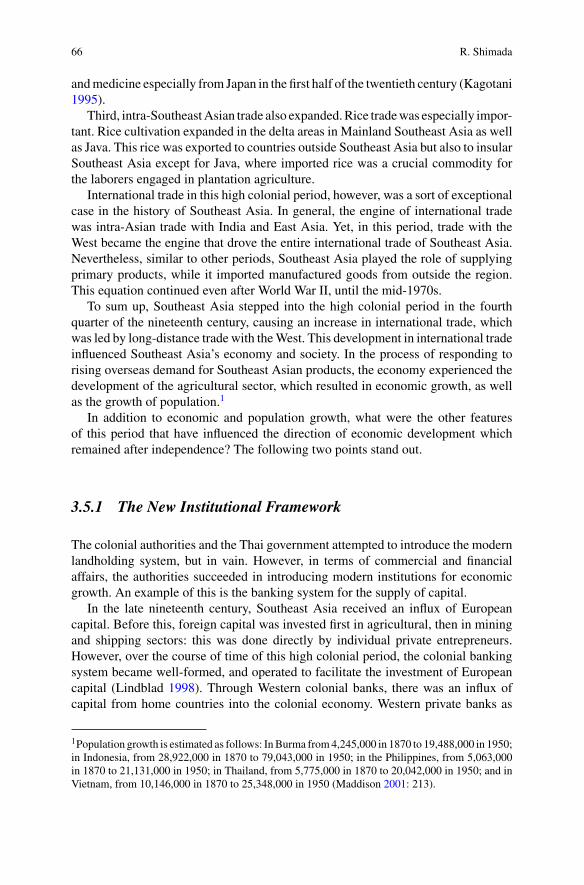
66 R. Shimada
andmedicine especially from Japan in the first half of the twentieth century (Kagotani1995).
Third, intra-SoutheastAsian trade also expanded.Rice tradewas especially impor-tant. Rice cultivation expanded in the delta areas in Mainland Southeast Asia as wellas Java. This rice was exported to countries outside Southeast Asia but also to insularSoutheast Asia except for Java, where imported rice was a crucial commodity forthe laborers engaged in plantation agriculture.
International trade in this high colonial period, however, was a sort of exceptionalcase in the history of Southeast Asia. In general, the engine of international tradewas intra-Asian trade with India and East Asia. Yet, in this period, trade with theWest became the engine that drove the entire international trade of Southeast Asia.Nevertheless, similar to other periods, Southeast Asia played the role of supplyingprimary products, while it imported manufactured goods from outside the region.This equation continued even after World War II, until the mid-1970s.
To sum up, Southeast Asia stepped into the high colonial period in the fourthquarter of the nineteenth century, causing an increase in international trade, whichwas led by long-distance trade with theWest. This development in international tradeinfluenced Southeast Asia’s economy and society. In the process of responding torising overseas demand for Southeast Asian products, the economy experienced thedevelopment of the agricultural sector, which resulted in economic growth, as wellas the growth of population.1
In addition to economic and population growth, what were the other featuresof this period that have influenced the direction of economic development whichremained after independence? The following two points stand out.
3.5.1 The New Institutional Framework
The colonial authorities and the Thai government attempted to introduce the modernlandholding system, but in vain. However, in terms of commercial and financialaffairs, the authorities succeeded in introducing modern institutions for economicgrowth. An example of this is the banking system for the supply of capital.
In the late nineteenth century, Southeast Asia received an influx of Europeancapital. Before this, foreign capital was invested first in agricultural, then in miningand shipping sectors: this was done directly by individual private entrepreneurs.However, over the course of time of this high colonial period, the colonial bankingsystem became well-formed, and operated to facilitate the investment of Europeancapital (Lindblad 1998). Through Western colonial banks, there was an influx ofcapital from home countries into the colonial economy. Western private banks as
1Population growth is estimated as follows: InBurma from4,245,000 in 1870 to 19,488,000 in 1950;in Indonesia, from 28,922,000 in 1870 to 79,043,000 in 1950; in the Philippines, from 5,063,000in 1870 to 21,131,000 in 1950; in Thailand, from 5,775,000 in 1870 to 20,042,000 in 1950; and inVietnam, from 10,146,000 in 1870 to 25,348,000 in 1950 (Maddison 2001: 213).
3 Southeast Asia and International Trade: Continuity … 67
well as colonial central banks were suppliers of capital for projects in SoutheastAsia.
Banking became a key business for wealthy Chinese merchants and replaced taxfarming developed in the nineteenth century. These merchants were engaged in theinternational transfer of money from Southeast Asia to mainland China. In addition,there were family bankers with their own capital, who lent money to small-scaleoverseas Chinese and indigenous Asian customers. Besides their own capital, someChinese merchants were provided with capital by Western colonial banks, and theylent Western capital as brokers to local merchants and entrepreneurs.
3.5.2 Increase of Chinese Immigrants
The second key characteristic concerns Chinese immigrants. Not only Westernimpacts but also other Asian impacts were significant for the economic develop-ment of Southeast Asia. Among several Asians, the influence of overseas Chinesestands out (Skinner 1957; Claver 2014).
Continuing from the pre-early modern period, a vast number of Chinese peopleimmigrated to Southeast Asia. While their geographical origins in mainland Chinawere mostly in Fujian in the early modern period, the Chinese origins expanded tothe provinces of Guangdong andHainan after themid-nineteenth century.When theyarrived in Southeast Asia they began to work as manual laborers in several sectorssuch as plantation and mining or as dockworkers. Chinese immigrants were mostlymale and although they eventually returned to China after several decades, some ofthem remained in Southeast Asia. Because Southeast Asia’s population was scarceat the initial stage, Chinese immigrants were a very important source of labor.
Besides manual laborers, Chinese merchants were also key contributors to theSoutheast Asian economy. They took on the role of entrepreneurs in several sectors.Mostly theywere engaged in the commercial business. Since the earlymodern periodoverseas Chinese merchants managed retail shops in port cities and organized ped-dlers in the hinterland. Moreover, some of them were engaged in maritime trade bymaking use of their network comprising Southeast Asia and the Chinese coastal area.From the late nineteenth century onwards, exports to Asian countries increased ingeneral, which would not have been realized without the Chinese network especiallyregarding exports to East Asia. When Western steam shipping companies emergedin Asian waters in the late nineteenth century, overseas Chinese merchants becamekey shippers. By and large, they functioned as maritime traders as well as mediatorsto connect international maritime trade with inland producers and consumers.
In addition to the commercial business, wealthy Chinese merchants extendedtheir business interests to other sectors. Some of them invested in and managed afew industrial ventures such as plantation, food processing and mining. Before thebeginning of large-scale European immigration in the twentieth century, overseasChinese were almost the only ethnicity that ran the industrial sectors in SoutheastAsia. On the other hand, tax farming was also a key business of wealthy overseas
68 R. Shimada
Chinese merchants. Several sorts of taxes such as market tax, gambling tax, andopium excises were collected mostly by these merchants, although tax farming wasabolished from the late nineteenth century to the early twentieth century.
In this way, while Western and Chinese influences flourished at the height ofcolonialism, Southeast Asia made efforts to decrease the influence of Western andChinese ethnic elements from the Great Depression of the 1930s and continued theseefforts during the period of decolonization after the region’s independence from colo-nial rule. The imaginary of the concept of nation-state building was useful for thispurpose, although the characteristic of multi-ethnicity, historically accumulated inSoutheast Asia remain in essence even today. In addition, in the context of inter-national trade, the Southeast Asian economy was still a typical supplier of primaryproducts to the West even after the region’s independence, until the mid-1970s.
3.6 The Contemporary Period and Conclusions
This chapter traced the role of international trade in Southeast Asia’s long-termpath to socio-economic development, by dividing the region’s history in accordancewith changing relationships between trade and the economy and society. The rela-tionships have been strong, and the economic development of Southeast Asia hasbeen influenced by the changing trend of international trade. The region is locatedbetween China and India, both of which had been powerful economic forces, and hasbeen economically and culturally influenced by the two civilizations. When Euro-peans participated in the trade of Southeast Asia in the early sixteenth century, theSoutheast Asian economy was faced with greater demand for primary products. Thehigh demand from outside Southeast Asia served as a strong motivation for socio-economic changes in the region.
From the arrival of the Europeans to the mid-nineteenth century, Southeast Asiaexperienced the following changes: The development of international trade and thelarge demand for Southeast Asian products from outside the region resulted in thedevelopment of agricultural and mining sectors. With regard to agriculture, the plan-tation system was introduced, while small-scale peasant agriculture also developed.In both cases, these changes were reflections of the high demand for Southeast Asia’sprimary products in international trade. In addition, the mining sector and the plan-tation system needed immigrants and technology from outside. Both of them weremanaged bywealthy overseas Chinesemerchants. On the other hand, European colo-nial cities gathered immigrants from Asia and Europe, which resulted in the generalacceptance of multi-ethnic societies in port cities.
During the high colonial period, the development of international trade broughtabout economic changes in Southeast Asia. With the introduction of modern institu-tions, foreign merchants received benefits when conducting their business in South-east Asia. These foreign merchants were not only European and American but alsoChinese. In particular, overseas Chinese merchants were successful in banking andtax farming as well as in trade and commerce. These changes brought about by the
3 Southeast Asia and International Trade: Continuity … 69
development of international trade became distinctive characteristics of the SoutheastAsian economy. They remain so today.
Large influences of international trade on the Southeast Asian economy continuesto this day as well. Throughout the process of decolonization after World War II,the Southeast Asian economy acted as a supplier of primary products to Europe andUSA. Rubber, rice, timber and sugar were the main items exported from SoutheastAsia. However, in the mid-1970s, the economic links with East Asia became moresignificant. While the Japan’s high-speed economic growth was put to an end inthe early 1970s due to the Nixon Shock in 1971 and the oil crisis in 1973, SouthKorea, Taiwan, Hong Kong and even Singapore began to enjoy economic growth asAsian Newly Industrializing Economies (Asian NIEs). This gave a momentum tomany Southeast Asian countries to treat economic links with Asian countries moreseriously rather than sticking to traditional links with Europe and USA. Thus theSoutheast Asian economy began to direct its path of economic development, withintra-Asian trade and the international division of labor in maritime Asia in mind.This meant that the region partly served as a supplier of resources (oil and naturalgas, as well as agricultural, forestry andmarine products) but also acted as a producerof manufactured goods, or at least of manufacturing parts as part of supply chains ofmanufactured goods, thus promoting industrialization. Of course, it is well-knownthat the process of the economic growth in the fourth quarter of the twentieth centurywas often accompanied by the developmental directorship, at least in the initialperiod.
To conclude, as seen in Fig. 3.1, the SoutheastAsian economyhas strong historicalroots and has obtained considerable benefits from international trade. Since the entryof theEuropeans in thebeginningof the sixteenth century in particular, SoutheastAsiahas been in touch with a wide range of overseas markets in Asia and Europe. Largedemands for Southeast Asian products have stimulated the economic development ofthe region. The economy was largely developed for the mass production of primaryproducts. Development of the delta areas, introduction of the plantation system, andthe acceptance of Chinese immigrants are good examples of the region’s capacityto respond to changes, before the production of manufactured goods became moreimportant in the late twentieth century.
References
Abushouk, A. I., & Ibrahim, H. A. (Eds.). (2009). The Hadhrami diaspora in Southeast Asia:Identity maintenance or assimilation?. Leiden and Boston: Brill Academic Publishers.
Andaya, B. W., & Andaya, L. Y. (2015). A history of early modern Southeast Asia, 1400–1830.Cambridge: Cambridge University Press.
Barnard, T. P. (2003). Multiple centres of authority: Society and environment in Siak and easternSumatra, 1674–1827. Leiden: KITLV Press.
Blussé, L. (1986). Strange company: Chinese settlers, mestizo women, and the Dutch in VOCBatavia. Dordrecht: Foris Publications.
70 R. Shimada
Blussé, L. (1999). Chinese century: The eighteenth century in the China Sea region. Archipel, 58(3),107–129.
Claver, A. (2014). Dutch commerce and Chinese merchants in Java: Colonial relationships in tradeand finance, 1800–1942. Leiden and Boston: Brill Academic Publishers.
Crosby, A.W., Jr. (1972). The Columbian exchange: Biological and cultural consequences of 1492.Westport: Greenwood Press.
Elson, R. E. (1994). Village Java under the cultivation system, 1830–1870. St Leonards: Allen andUnwin.
Hall, K. R. (2011). A history of early Southeast Asia: Maritime trade and societal development,100–1500. Lanham: Rowman & Littlefield.
Hardy, A., Cucarzi, M., & Zolese, P. (Eds.). (2009). Champa and the archaeology of My So,n(Vietnam). Singapore: NUS Press.
Jacobs, E. M. (2006). Merchants in Asia: The trade of the Dutch East India Company during theeighteenth century. Leiden: CNWS Publications.
Kagotani, N. (1995). The role of Chinese merchants in the development of the Japanese cottonindustry, 1880–1934. Zinbun: Annals of the institute for research in humanities, Kyoto University,30, 149–183.
Kathirithamby-Wells, J., & Villiers, J. (Eds.). (1990). The Southeast Asian port and polity: Rise anddemise. Singapore: Singapore University Press.
Lieberman, V. (2003). Strange parallels: Southeast Asia in global context, c. 800–1830, Vol. 1:Integration on the mainland. Cambridge: Cambridge University Press.
Lindblad, J. T. (1998). Foreign investment in Southeast Asia in the twentieth century. Basingstoke:Macmillan Press.
Liu, Y., Chen, Z., &Blue, G. (Eds.). (2014).Zheng He’s maritime Voyages (1405–1433) and China’srelations with the Indian Ocean world: A multilingual bibliography. Leiden and Boston: BrillAcademic Publishers.
Maddison, A. (2001). The world economy: A millennial perspective. Paris: OECD.Munoz, P. M. (2006). Early kingdoms of the Indonesian Archipelago and the Malay Peninsula.Singapore: Editions Didier Millet.
Raben, R. (1996). Batavia and Colombo: The ethnic and spatial order of two colonial cities,1600–1800. Unpublished PhD thesis, Leiden University.
Reid, A. (1997). Introduction. In A. Reid (Ed.), The last stand of Asian autonomies: Responses tomodernity in the diverse states of Southeast Asia and Korea, 1750–1900 (pp. 1–25). London:Macmillan Press.
Shimada, R. (2006). The intra-Asian Trade in Japanese copper by the Dutch East India Companyduring the eighteenth century. Leiden and Boston: Brill Academic Publishers.
Shimada, R. (2013). The long-term pattern ofmaritime trade in Java from the late eighteenth centuryto the mid-nineteenth century. Southeast Asian Studies, 2(3), 475–497.
Shimada, R. (2015). Hinterlands and port cities in Southeast Asia’s economic development in theeighteenth century: The case of tin production and its export trade. In T. Mizushima, G. B. Souza,&D.O. Flynn (Eds.),Hinterlands and commodities: Place, space, time and the political economicdevelopment of Asia over the long eighteenth century (pp. 197–214). Leiden and Boston: BrillAcademic Publishers.
Shimada, R. (2018). Invisible links: Maritime trade between Japan and South Asia in the earlymodern period. InA. J.H. Latham&H.Kawakatsu (Eds.),Asia and the history of the internationaleconomy: Essays in memory of Peter Mathias (pp. 57–71). London and New York: Routledge.
Skinner, G.W. (1957).Chinese society in Thailand: An analytical history. Ithaca: Cornell UniversityPress.
Somers Heidhues, M. (2003). Golddiggers, farmers, and traders in the “Chinese districts” of WestKalimantan, Indonesia. Ithaca: Southeast Asia Program Publications, Cornell University.
Souza, G. B. (1986). The survival of empire: Portuguese trade and society in China and the SouthChina Sea, 1630–1754. Cambridge: Cambridge University Press.
3 Southeast Asia and International Trade: Continuity … 71
Sugihara K. (1996). Ajia kan boeki no keisei to kozo (The Formation and structure of intra-Asiantrade). Kyoto: Minerva Shobo: 1996.
Sugihara, K. (2001.) Kokusai bungyo to tonan ajia shokuminchi keizai (The international divisionof labor and the Southeast Asian colonial economy). In H. Kano (Ed.), Shokuminchi keizai nohanei to choraku (Prosperity and decline of the colonial economy), Tonan ajiashi (SoutheastAsian history) (Vol. 6, pp. 249–272). Tokyo: Iwanami Shoten.
Yao, K. (2003). Two rivals on an island of sugar: The sugar trade of the VOC and overseasChinesein Formosa in the seventeenth century. In L. Blussé (Ed.), Around and about Formosa: Essays inhonor of Professor Ts’ao Yung-ho (pp. 129–140). Taipei: Ts’ao Yung-ho Foundation for Cultureand Education.
Open Access This chapter is licensed under the terms of the Creative Commons Attribution-NonCommercial-NoDerivatives 4.0 International License (http://creativecommons.org/licenses/by-nc-nd/4.0/), which permits any noncommercial use, sharing, distribution and reproduction in anymedium or format, as long as you give appropriate credit to the original author(s) and the source,provide a link to the Creative Commons licence and indicate if you modified the licensed material.You do not have permission under this licence to share adapted material derived from this chapteror parts of it.
The images or other third party material in this chapter are included in the chapter’s CreativeCommons licence, unless indicated otherwise in a credit line to the material. If material is notincluded in the chapter’s Creative Commons licence and your intended use is not permitted bystatutory regulation or exceeds the permitted use, you will need to obtain permission directly fromthe copyright holder.
Chapter 4Role of State and Non-state Networksin Early-Modern Southeast Asian Trade
Atsushi Ota
4.1 Introduction
An important characteristic in the history of economic growth of Southeast Asia isthat the region had developed brisk trade networks well before the launch of themodern colonial rule during the nineteenth century. The precolonial trade develop-ment is a common phenomenon in parts of Europe and West, South, and East Asia,but it is not always the case in other regions including many parts of Africa andSouth America. Its historical uniqueness therefore deserves scholarly attention, asthis can be considered one of the elements related to the recent economic growth ofthe region.
The precolonial trade in Southeast Asia had a long history, and its patterns werechanging throughout different phases of history. Among them “the Age of Com-merce” is a famous concept which highlights the trade boom in Southeast Asiafrom c. 1450 to 1680 (Reid 1993a). After a period of the VOC trade domination(c. 1680–1750), the late eighteenth century had been long considered as the periodof decline and fragmentation in Southeast Asia. More recently, however, scholarsproposed a concept of the “Chinese century,” indicating the trade recovery in areorganized form in the eighteenth century (Reid 1997; Blussé 1999). The Ageof Commerce and Chinese century can be labelled as the early-modern period inSoutheast Asia. In spite of the new understanding of the Chinese century, the tradepatterns and systems in the early-modern period are still assumed to be very differentfrom those in the following modern colonial period. We tend to consider that mod-ern technology, capital, and political systems dramatically changed Southeast Asianeconomy and trading patterns during the colonial period, and they were finally subju-gated to the West-dominated world economy. As a result, we tend to assume that the
A. Ota (B)Keio University, Minato-Ku, Tokyo, Japane-mail: [email protected]
© The Author(s) 2019K. Otsuka and K. Sugihara (eds.), Paths to the Emerging State in Asia and Africa,Emerging-Economy State and International Policy Studies,https://doi.org/10.1007/978-981-13-3131-2_4
73
74 A. Ota
modern colonial economic systems formed large parts of the basis of Southeast Asianeconomy today, disconnected from its early-modern past.
Against these assumptions, I argue in this chapter that the elements that char-acterizes in Southeast Asian trade were created and developed in the early-modernperiod, especially after the Age of Commerce. I rename the Chinese century as theAge of China-oriented trade, because what characterizes this period was not onlyChinese trade and migration, as was often assumed, but the fundamental change inthe state-commerce relationship, in which Southeast Asian actors played a crucialrole, as a result of the shift in the nature of trade. I also argue that the China-orientedtrade remained important until around 1870, buttressing the growing long-distancetrade with Europe during the so-called early colonial period (c. 1820–1870), andbeyond. Special focus is given not only to state politics on trade, but also to the roleof non-state networks, in which crucial actors were traders as well as commercial-military groups, which are sometimes also called pirates. Because of my specialty,the discussion of this chapter concentrates on insular Southeast Asia.
In this chapter state refers to any autonomous political body that claims to exercisesupreme authority over a certain territory and more strongly over people living there.This vague definition covers a wide range of political bodies from an early-modernpetit statelet to a colonial state with rigid legal and taxation structure. Neverthelesssuch awide coveragewill enable us to explore various elements in politico-commercerelationship in a single framework, and to discuss their diversity and developmenteffectively.
4.2 Age of Commerce
4.2.1 The Rise of the Trade and Its Basic Pattern
“TheAge of Commerce” is a concept raised by the historianAnthonyReid, to refer tothe trade boom from c. 1450 to 1680. In search of precious Southeast Asian productssuch as spices (e.g. nutmeg, mace, and clove), wood (sandalwood and aloeswoodetc.), pepper, and various kinds of forest products, traders from West, South, andEast Asia, and later those from Europe visited a number of trading ports in SoutheastAsia.1 These foreign traders brought their items either from their places of origin orfrom the transit ports that they passed by on the way. The most significant amongthem in Southeast Asian trade were Indian textiles, Japanese silver, and Chinesemanufactured products such as porcelain and metal works.
According to Reid, the important elements to trigger the boom are (1) the incor-poration of Southeast Asian states into the China-centered tributary system, (2) thearrival of Muslim traders fromWest Asia and Northwest India, and (3) the inflow ofAmerican and Japanese silver. First, in 1402 Yongle Emperor of the Ming dynasty
1Formore information of the external elements that affected Southeast Asian trade, such as Chinese,Indian, and European traders, see Chap. 3 of this volume.
4 Role of State and Non-state Networks in Early-Modern … 75
called for Asian rulers of independent states to participate in the Chinese tributarysystem, to expand his influence throughout maritime Asia. Under this system, south-ern “barbarian” rulers were requested to send their tributary missions to Nanjing,the Ming capital at that time, thereby accepting the authority of the Ming Emperor.In return they were granted the official permission to conduct trade with China, alucrative commercial opportunity amidst the strict trade ban of the Ming dynasty. Inaddition, as the Ming Emperor strictly forbade the rulers under the tributary systemfrom fighting with each other, the system also guaranteed peace among them.
Second, under the rule of the powerful empires such as the Abbasid Caliphate(750–1258, 1261–1517) and the Safavid dynasty (1501–1736), the activities ofMus-lim traders like the Arabs, Persians, and Gujaratis expanded to Southeast Asia, insearch of precious tropical products. Third, the Japanese and American silver, theproduction of which expanded in the sixteenth century, was brought into South-east Asia in large quantities, which facilitated the transactions of Southeast Asianproducts.
Southeast Asia was attractive for foreign traders, first of all because the regionproduced precious products available only in very limited areas, such as nutmegand mace grown only in Banda Islands and clove in Ternate and Tidore islands. Onthe other hand, the demand for these Southeast Asian products were very strong inAsia and Europe because they were not only used for flavoring but also for medicalpurposes.
The basic pattern of trade in the Age of Commerce was the exchange betweenprecious natural products from Southeast Asia (spices and woods etc.) and foreignmanufactured products (especially Indian textiles and Chinese porcelain). In termsof traders, Southeast Asians were most prominent in the local trade (trade betweenproducing areas and transit ports in Southeast Asia), while the regional trade (tradebetween transit ports in Southeast Asia) was conducted by Chinese, Indian andSoutheast Asian traders. In long-distance trade (trade between Southeast Asia andother parts of the world) Chinese, Indian, and European traders were most prominentin the respective routes from their places of origin. Main consumers of SoutheastAsian products in this period were a small number of rich and powerful people, suchas members of the royal families, nobles, and privileged merchants, and items thatthey demanded were small-volume, high-value products (Reid 1993a). This basictrade pattern significantly changed in the mid-eighteenth century, as I discuss later.
4.2.2 Southeast Asian Characteristics
Considering the fact that a similar trade boom did not take place in many other partsof theworld, such asAfrica and SouthAmerica, it is worth askingwhy the trade boomhappened particularly in Southeast Asia. The existence of the products available onlyin this region, and its location between the great civilizations of India and China arefrequently mentioned reasons, but they do not fully explain the trade boom. Outsidetraders would not have found these products, if there were not for local knowledge

76 A. Ota
of the usefulness of the products, and for the local trade, which brought the productsto the attention of outside traders. Local people created the network to bring thevaluable products from the producing areas to nearby markets and transit ports. Itwas the existence of active local trade that gave foreign traders access to the preciousproducts in Southeast Asia.
Why were the locals able to develop local trade in Southeast Asia? In fact, South-east Asians had a very long history of maritime activities. Austronesians migratedfrom Taiwan to most areas of maritime Southeast Asia before 1500 B.C., fully mak-ing use of their excellent knowledge of shipbuilding and maritime navigation. Localtrade in Southeast Asia must have been active before the first century B.C., as isknown in Chinese sources, perhaps with the knowledge of monsoon winds. Indiantraders were regularly dealing in spices grown only in small islands in East Indone-sia in the first century A.D., according to a Greek text, perhaps because SoutheastAsian traders brought them to transit ports. In addition, environmental elementswere also favorable for trade. The seas among numerous islands are relatively calm,and a number of rivers were navigable. Deep forests provided ample wood materi-als for shipbuilding. The combination of these trade-friendly environments and theancient knowledge of shipbuilding, long-distance navigation, and monsoon windswas unique in Southeast Asia, and this became the basis for the region to enjoy a tradeboom in the early-modern era, in addition to the precious natural products grown orcollected only in this region.
4.2.3 State Politics and Its Impact on Society
In order for foreign traders to obtain popular Southeast Asian products, it was neces-sary to find convenient transit ports, as the producing regions of these products wereoften very far from the main routes of maritime trade between China and India. Theyemerged in nodal points of traffic, such as the coast of theGulf of Thailand, both sidesof the Straits of Malacca, and the north coast of Java, and provided opportunities forforeign traders to exchange their goods they brought with them with the productsfrom remote areas of Southeast Asia (Reid 1993a).
The growth of the transit ports soon led to the emergence of a particular typeof state in Southeast Asia in the Age of Commerce—port state.2 Different from theolder agriculture-oriented states such asAngkor andMajapahit,3 the rulers of the portstates relied their wealth and power on maritime trade. Not only did they obtain largeparts of income from the customs and trade-related taxes from local and foreigntraders, but also they organized trade fleets by themselves. The typical examples
2This type of state has often been called port polity, probably in order to include small stateletstypical in Southeast Asia in discussion. However, for the purpose of simplifying discussion, I usethe term port state to mean any scale of political body, which relies its economic, political, andideological base on ports under its influence.3The Srivijaya Kingdom was also a sort of alliance of port states. See Chap. 3, Sect. 3.2.

4 Role of State and Non-state Networks in Early-Modern … 77
of port states include Ayutthaya, Pasai, Aceh, Perak, Palembang, Banten, Demak,Gresik, Makassar, and Brunei, although they rose and fell in different periods duringthe Age of Commerce.
The politics of port states focused on the promotion of trade. In order to protect theships laden with precious cargos from the attacks of pirates and gangsters, the rulersbuilt walls and bulwarks, and organized naval fleets. As traders naturally preferredwell protected ports, effective protection promised rulers more income from tradingships.
In order to effectively promote trade, however, military power was not enough.First, rulers attempted tomake use of the knowledge and skills of foreigners, to attracttheir compatriot traders. The rulers often created special quarters for particular ethnicgroups to reside in or immediately outside their capitals. These foreign communi-ties actively conducted trade within and beyond the host state, and the rulers oftenappointed the representatives of each community in an important position such as theharbor master (shahbandar). As a result, the multi-ethnic formation of major portcities became the tradition in Southeast Asia, far before the colonial rule. Second,rulers attempted to establish peace and order in their ports and nearby waters, byissuing rules and regulations in their state. The Malay law codes, a corpus of rulesand regulations first promulgated by the sultan of Malacca, was such an example.Many of the rules and regulations were concerned with smooth operation of tradeand commercial transactions. Third, some rulers attempted to attract Muslim traders,by creating places for worship, such as mosques. In insular Southeast Asia, somerulers also chose to convert themselves to Islam.
The conversion to Islam and the promulgation of law codes were also elaboratedstrategies on the part of rulers for their legitimacy. For example, in the north coastof Java, rulers of the newly emerging port states like Demak adopted Islam as anew source of legitimacy, in order to counter the land-based Hindu Kingdom ofMajapahit. Being the propagator of Islam in their states also meant that the rulerbecame a mediator between the local secular world and the (imagined) holy outsideworld. This must have attracted the awe and admiration from local people. Likewise,the rulers who established law codes were respected as the protector of peace andorder. The wide application of Malay law codes and the popular use of the Malaylanguage in commerce enhanced the position of the sultan of Malacca as the centerof the Malay World.
The state was also involved in trade. The rulers monopolized not only the tradeof important export items such as nutmeg and pepper, but also their production. Forexample, the rulers of Banda and Banten placed strict state control on the productionof nutmeg and pepper respectively, and forced the cultivators to sell the productsonly to the rulers.
Through these sorts of politics, states played a prominent role in the promotionof trade. This is a most important characteristic in the Age of Commerce. Staterulers protected their ports militarily, and they organized the systems for smoothtransactions by creating amicable environments for traders. As these features werenot necessarily the case after the eighteenth century, it is worth considering why ittook place in the Age of Commerce. First, it should be noted that important export

78 A. Ota
items in theAge of Commerce, such as nutmeg,mace, clove, pepper, and sandalwoodwere produced only in very limited areas, and therefore state control of the productionand trade of these items was relatively easy. The ships laden with these high-valueitemsmust have tended to anchor in ports under the powerful ruler, in the expectationof effective protection.As ships tended to concentrate on a small number of influentialports, powerful port states had a chance for further prosperity. Second, these powerfulstates tended to monopolize the import of weapons. When state rulers were powerfulenough to dominate trade, other influential members, either within or outside theroyal family, had less chances of obtaining weapons from foreign traders. Fromthese reasons, states were in a position to take an initiative in local and regional tradeduring the Age of Commerce.
What sort of impact did the trade boom during the Age of Commerce have onsociety in the history of Southeast Asia? First, the development of regional tradestrengthened common material culture in Southeast Asia, such as the custom ofbetel chewing, flavoring with fermented fish, and the use of cotton for clothing.Second, as local trade developed, some port cities and cash-crop producing areasabandoned food production, relying on the supply from food-producing areas. Thedivision of labor was considered to be a condition of economic development, andthis took place particularly in the Age of Commerce in Southeast Asia. Seen froma different angle, however, the intensified division of labor also meant that someareas lost economic self-sustenance. Some port cities and cash-crop producing areashad to depend on trade to obtain food and other necessities. Food-producing regionsalso increased the production of food such as rice, by importing necessities suchas textiles. This is how certain areas of Southeast Asia became a trade-dependentsociety during the Age of Commerce. This would explain the continuation of localtrade in the following centuries.
Although influential merchant elites emerged in several trade-oriented states, cap-ital did not accumulate among them. As Reid explained, this can be attributed to thestrong interests of state rulers in commerce. Because they enthusiastically attemptedto benefit from trade and production control, they were equally enthusiastic to pre-vent powerful merchants from becoming so rich and influential as to threaten theirwealth and power (Reid 1993a). Capital accumulation did not take place, in the waythat it did to prepare the birth of capitalism in Europe around the same time.
Reid explained that the Age of Commerce ended around 1680, when the DutchEast India Company (Verenigde Oostindisch Compagnie or VOC) had created theirtrade network centered on its Asian headquarters in Batavia. In return for militarysupports in internal conflicts in local states, the VOC forced the rulers to concludetreaties, which allowed monopoly rights for the VOC to trade their major exportitems. These items were first sent to Batavia, from which they were re-exported tomany places in Asia and Europe. Finally, defeating its major rivals, Macassar andBanten by the 1680s, the VOC reorganized the trade pattern from the decentralizedopen system in the Age of Commerce to their centralized monopolistic system. Inthe states under their influence, the Dutch often placed the production of importantcash crops under control. This usually resulted in production decline in many placesbecause cultivators disliked the enforcement and unfavorable prices that the VOC
4 Role of State and Non-state Networks in Early-Modern … 79
had set. Some influential states such as Mataram and Aceh, losing their interestin external trade, concentrated more on the agricultural production in the inland.According to Reid, regional and local trade in Southeast Asia thus fell into declinein the late seventeenth century (Reid 1993a).
4.3 Age of China-Oriented Trade
4.3.1 Rise of a New Trade Pattern
Several years later after the publication of The Age of Commerce in Southeast Asia,however, Reid revised his argument of the trade decline after the late seventeenthcentury. Now he has emphasized the trade recovery in the mid-eighteenth century,which he has called the “Chinese century.” He argues that Sino-Southeast Asiantrade and the Chinesemigration to Southeast Asia developed from themid eighteenthcentury, because of the newChinese interest in SoutheastAsian products (Reid 1997).My own research largely agrees with Reid’s view, while there are some differences inthe following points. First, the term “Chinese century” gives an impression that theChinese played a far more important role than others in the story of trade recovery.In fact Southeast Asians such as Bugis, Iranun, and Malays also took a crucial role.Second, the increase of trade in this period did not only mean the participation ofnew players and new trade items. It should be emphasized that it brought a totalreorganization of trade patterns and state formation in Southeast Asia. Third, the“Chinese century” did not endwith the fall of independent states during the nineteenthcentury, as Reid seems to imply, but it survived the colonial trade pattern. I call thenew trade pattern that emerged in mid-eighteenth century Southeast Asia the China-oriented trade, and I identify the period of this trade pattern as roughly from c. 1750to c. 1870. In this section I will explain the development and characteristics of thistrade pattern, and the typical local politics towards the trade.
It was the economic growth in China that triggered the boom of Sino-SoutheastAsian trade, as Reid has explained. First, in order to meet the food demand causedby the rapid population growth, the Qing government started to import rice fromSaigon and Ayutthaya by loosening its maritime ban. Second, the expanding middlestrata of the society in economically advanced areas, such as the South China coast,Beijing, and the middle- and downstream Yangzi basin, witnessed growing demandon exotic tropical products from Southeast Asia, such as marine products like seacucumber and shark’s fin, forest products like rattan and resin, and others such asbirds’ nests, pepper, and tin. Southeast Asian traders collected these products innumerous places in insular Southeast Asia, and brought them to regional trade hubs,from which Chinese traders brought them back to South China coast. This is howa new trade pattern, dealing with China-bound Southeast Asian natural products,emerged in the mid eighteenth century.
80 A. Ota
The demands on the abovementioned types of Southeast Asian products in Chinaseem to be related to the “middle-class luxury” (Pomerantz 2000) among those whoenjoyed growing purchasing power under the strong economyduring the long reign ofQianlong Emperor (1735–99). It was around this period that dining places increasedin large cities, and the royal cuisine spread to the wider circle of society. Thosewho newly obtained economic power wanted to have higher self-esteem and socialrecognition through the consumption of items that were consumed in the upper circleof society, among them imported items. Exotic edible items from Southeast Asia,such as sea cucumber, shark’s fin, and birds’ nests, were typical items for this type ofconsumption. These items were indeed rare and expensive, but they were still muchmore easily available than clove and sandalwood during theAge of Commerce. OtherSoutheast Asian items were also related to mass consumption. Tin was used for teacontainer and also for fake paper notes burnt in rituals, while rattan was processedinto various kinds of furniture. These were new types of mass consumption items,whichwere still considered luxurious butwidely used today across thewide spectrumof society.
4.3.2 Shifting Trade Hegemony
The Chinese traders headed for Southeast Asia in large numbers, especially afterthe lifting of maritime ban in 1727, and they tended to call at transit ports outsidethe Dutch sphere of influence. This is partly because they disliked the regulationsimposed in Dutch ports such as Batavia and Malacca, and also because the Dutchwere not interested in the China-bound items. Riau (South of Singapore), Saigon,Jolo (Sulu islands in the Southwest Philippines), and Spanish Manila were typicalports from which China-bound Southeast Asian items could be obtained.
Stimulated by the growing Chinese demand in Southeast Asian products, Britishtraders joined this new pattern of trade. After the opening of Canton (Guangzhou) toWestern traders in 1757, British, Dutch, and other European traders imported largeamounts of tea from China to Northwestern Europe such as Britain, France, and theNetherlands. Tea party became an important opportunity for socialization amongupper-class ladies in these states, and the custom of tea party expanded from theNetherlands to other countries, and also to wider strata of society. This is how thisgrowing demand on China tea was also related to the emerging mass consumptionculture in Northwest Europe. Europeans, however, did not have attractive items fromhome for the China market. In order to save precious silver drained in the purchaseof tea, the English East India Company (EIC) and British country traders (those whoconducted trade in Asia with the official permission from the government of BritishIndia) attempted to bring Asian products demanded in China. Large parts of theiritems brought to Guangzhou were Indian cotton and opium, but not small amounts ofSoutheast Asian tin, pepper, and other items were also imported (Ota 2006). In orderto obtain these SoutheastAsian items,British country traders also visited independentports outside the Dutch sphere of influence, for the same reasons as those of Chinese
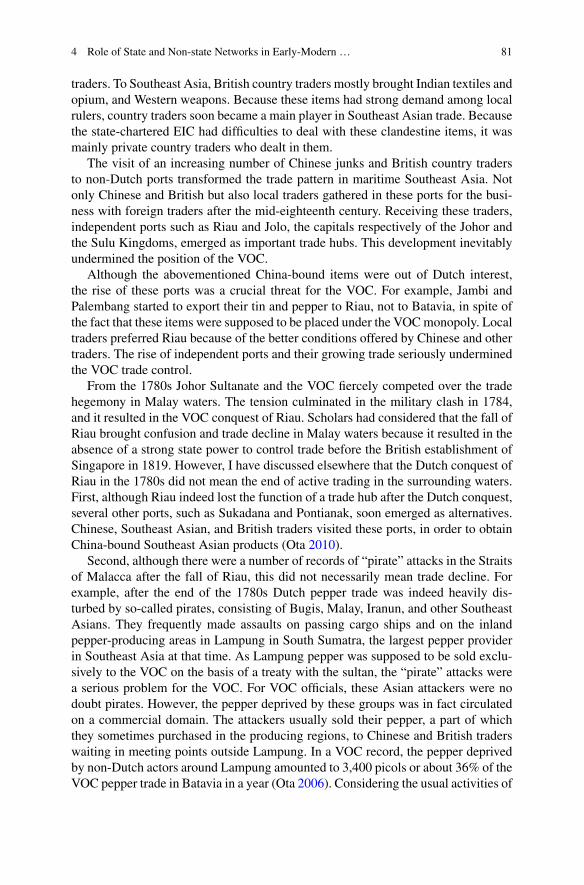
4 Role of State and Non-state Networks in Early-Modern … 81
traders. To Southeast Asia, British country traders mostly brought Indian textiles andopium, and Western weapons. Because these items had strong demand among localrulers, country traders soon became a main player in Southeast Asian trade. Becausethe state-chartered EIC had difficulties to deal with these clandestine items, it wasmainly private country traders who dealt in them.
The visit of an increasing number of Chinese junks and British country tradersto non-Dutch ports transformed the trade pattern in maritime Southeast Asia. Notonly Chinese and British but also local traders gathered in these ports for the busi-ness with foreign traders after the mid-eighteenth century. Receiving these traders,independent ports such as Riau and Jolo, the capitals respectively of the Johor andthe Sulu Kingdoms, emerged as important trade hubs. This development inevitablyundermined the position of the VOC.
Although the abovementioned China-bound items were out of Dutch interest,the rise of these ports was a crucial threat for the VOC. For example, Jambi andPalembang started to export their tin and pepper to Riau, not to Batavia, in spite ofthe fact that these items were supposed to be placed under the VOCmonopoly. Localtraders preferred Riau because of the better conditions offered by Chinese and othertraders. The rise of independent ports and their growing trade seriously underminedthe VOC trade control.
From the 1780s Johor Sultanate and the VOC fiercely competed over the tradehegemony in Malay waters. The tension culminated in the military clash in 1784,and it resulted in the VOC conquest of Riau. Scholars had considered that the fall ofRiau brought confusion and trade decline in Malay waters because it resulted in theabsence of a strong state power to control trade before the British establishment ofSingapore in 1819. However, I have discussed elsewhere that the Dutch conquest ofRiau in the 1780s did not mean the end of active trading in the surrounding waters.First, although Riau indeed lost the function of a trade hub after the Dutch conquest,several other ports, such as Sukadana and Pontianak, soon emerged as alternatives.Chinese, Southeast Asian, and British traders visited these ports, in order to obtainChina-bound Southeast Asian products (Ota 2010).
Second, although there were a number of records of “pirate” attacks in the Straitsof Malacca after the fall of Riau, this did not necessarily mean trade decline. Forexample, after the end of the 1780s Dutch pepper trade was indeed heavily dis-turbed by so-called pirates, consisting of Bugis, Malay, Iranun, and other SoutheastAsians. They frequently made assaults on passing cargo ships and on the inlandpepper-producing areas in Lampung in South Sumatra, the largest pepper providerin Southeast Asia at that time. As Lampung pepper was supposed to be sold exclu-sively to the VOC on the basis of a treaty with the sultan, the “pirate” attacks werea serious problem for the VOC. For VOC officials, these Asian attackers were nodoubt pirates. However, the pepper deprived by these groups was in fact circulatedon a commercial domain. The attackers usually sold their pepper, a part of whichthey sometimes purchased in the producing regions, to Chinese and British traderswaiting in meeting points outside Lampung. In a VOC record, the pepper deprivedby non-Dutch actors around Lampung amounted to 3,400 picols or about 36% of theVOC pepper trade in Batavia in a year (Ota 2006). Considering the usual activities of
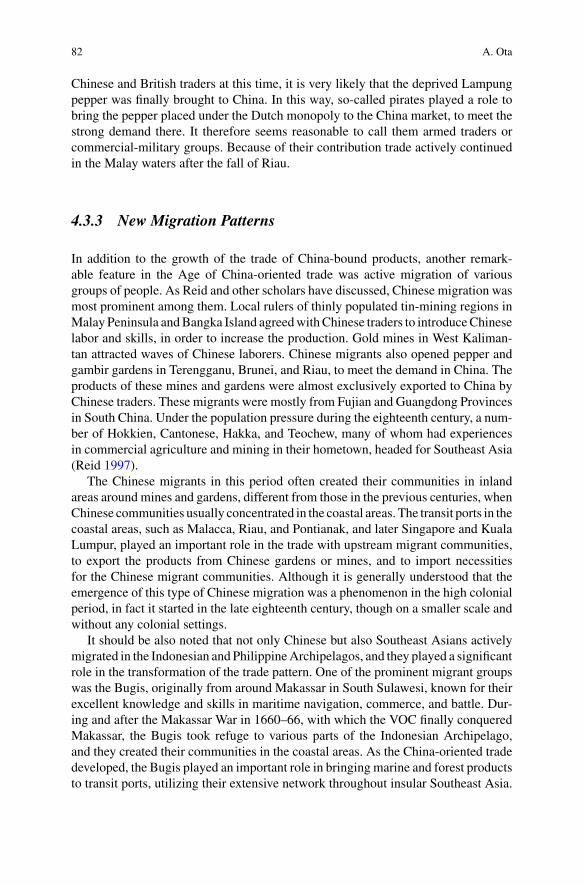
82 A. Ota
Chinese and British traders at this time, it is very likely that the deprived Lampungpepper was finally brought to China. In this way, so-called pirates played a role tobring the pepper placed under the Dutch monopoly to the China market, to meet thestrong demand there. It therefore seems reasonable to call them armed traders orcommercial-military groups. Because of their contribution trade actively continuedin the Malay waters after the fall of Riau.
4.3.3 New Migration Patterns
In addition to the growth of the trade of China-bound products, another remark-able feature in the Age of China-oriented trade was active migration of variousgroups of people. As Reid and other scholars have discussed, Chinese migration wasmost prominent among them. Local rulers of thinly populated tin-mining regions inMalay Peninsula andBangka Island agreedwithChinese traders to introduceChineselabor and skills, in order to increase the production. Gold mines in West Kaliman-tan attracted waves of Chinese laborers. Chinese migrants also opened pepper andgambir gardens in Terengganu, Brunei, and Riau, to meet the demand in China. Theproducts of these mines and gardens were almost exclusively exported to China byChinese traders. These migrants were mostly from Fujian and Guangdong Provincesin South China. Under the population pressure during the eighteenth century, a num-ber of Hokkien, Cantonese, Hakka, and Teochew, many of whom had experiencesin commercial agriculture and mining in their hometown, headed for Southeast Asia(Reid 1997).
The Chinese migrants in this period often created their communities in inlandareas around mines and gardens, different from those in the previous centuries, whenChinese communities usually concentrated in the coastal areas. The transit ports in thecoastal areas, such as Malacca, Riau, and Pontianak, and later Singapore and KualaLumpur, played an important role in the trade with upstream migrant communities,to export the products from Chinese gardens or mines, and to import necessitiesfor the Chinese migrant communities. Although it is generally understood that theemergence of this type of Chinese migration was a phenomenon in the high colonialperiod, in fact it started in the late eighteenth century, though on a smaller scale andwithout any colonial settings.
It should be also noted that not only Chinese but also Southeast Asians activelymigrated in the Indonesian and PhilippineArchipelagos, and they played a significantrole in the transformation of the trade pattern. One of the prominent migrant groupswas the Bugis, originally from around Makassar in South Sulawesi, known for theirexcellent knowledge and skills in maritime navigation, commerce, and battle. Dur-ing and after the Makassar War in 1660–66, with which the VOC finally conqueredMakassar, the Bugis took refuge to various parts of the Indonesian Archipelago,and they created their communities in the coastal areas. As the China-oriented tradedeveloped, the Bugis played an important role in bringing marine and forest productsto transit ports, utilizing their extensive network throughout insular Southeast Asia.
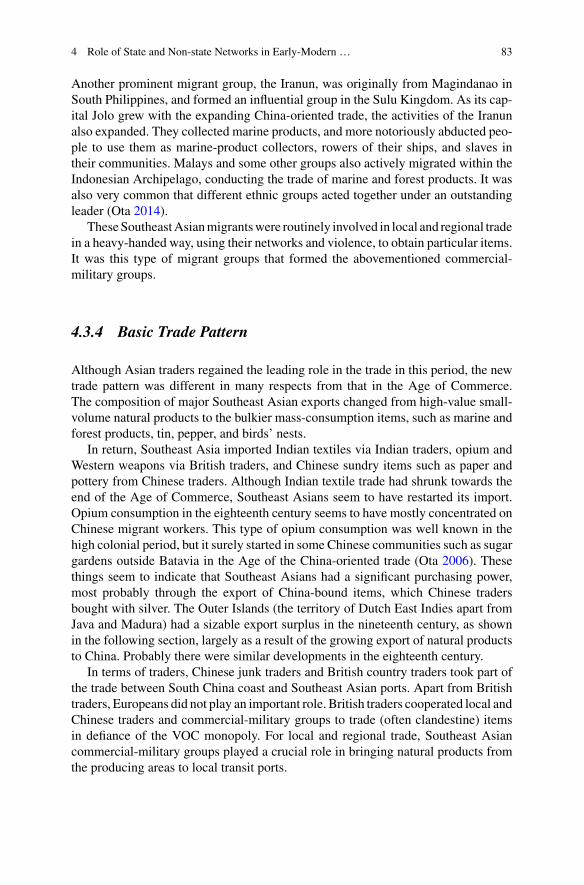
4 Role of State and Non-state Networks in Early-Modern … 83
Another prominent migrant group, the Iranun, was originally from Magindanao inSouth Philippines, and formed an influential group in the Sulu Kingdom. As its cap-ital Jolo grew with the expanding China-oriented trade, the activities of the Iranunalso expanded. They collected marine products, and more notoriously abducted peo-ple to use them as marine-product collectors, rowers of their ships, and slaves intheir communities. Malays and some other groups also actively migrated within theIndonesian Archipelago, conducting the trade of marine and forest products. It wasalso very common that different ethnic groups acted together under an outstandingleader (Ota 2014).
TheseSoutheastAsianmigrantswere routinely involved in local and regional tradein a heavy-handed way, using their networks and violence, to obtain particular items.It was this type of migrant groups that formed the abovementioned commercial-military groups.
4.3.4 Basic Trade Pattern
Although Asian traders regained the leading role in the trade in this period, the newtrade pattern was different in many respects from that in the Age of Commerce.The composition of major Southeast Asian exports changed from high-value small-volume natural products to the bulkier mass-consumption items, such as marine andforest products, tin, pepper, and birds’ nests.
In return, Southeast Asia imported Indian textiles via Indian traders, opium andWestern weapons via British traders, and Chinese sundry items such as paper andpottery from Chinese traders. Although Indian textile trade had shrunk towards theend of the Age of Commerce, Southeast Asians seem to have restarted its import.Opium consumption in the eighteenth century seems to have mostly concentrated onChinese migrant workers. This type of opium consumption was well known in thehigh colonial period, but it surely started in some Chinese communities such as sugargardens outside Batavia in the Age of the China-oriented trade (Ota 2006). Thesethings seem to indicate that Southeast Asians had a significant purchasing power,most probably through the export of China-bound items, which Chinese tradersbought with silver. The Outer Islands (the territory of Dutch East Indies apart fromJava and Madura) had a sizable export surplus in the nineteenth century, as shownin the following section, largely as a result of the growing export of natural productsto China. Probably there were similar developments in the eighteenth century.
In terms of traders, Chinese junk traders and British country traders took part ofthe trade between South China coast and Southeast Asian ports. Apart from Britishtraders, Europeans did not play an important role. British traders cooperated local andChinese traders and commercial-military groups to trade (often clandestine) itemsin defiance of the VOC monopoly. For local and regional trade, Southeast Asiancommercial-military groups played a crucial role in bringing natural products fromthe producing areas to local transit ports.
84 A. Ota
The shift inmajor Southeast Asian exports from small-volume high-value items tobulky mass-consumption items exerted powerful impacts on the producing regions.Different from the major exports in the previous centuries such as precious spicesand wood, marine and forest products were collected spanning much larger areas.This means that the state control of the collection and trade of export products, asattempted in the Age of Commerce, became much less effective and therefore it washardly conducted on the items such as rattan and shark’s fin.4 Without hardly anystate monopoly, a much larger number of people came to be involved in commercialactivities acrosswider areas. It seems very likely that local people becamemuchmoreaccustomed to commercial transactions, and became increasingly market-orientedthrough the collection of export items.
4.3.5 Commercial-Military Groups and States
The trade of forest and marine products made the role of the commercial-militarygroups more important. The producing and collecting areas of those products wereusually far from state centers and state protection. Traders therefore had to armthemselves to defend their cargos and ships against attackers on seas and rivers. Inorder to obtain human captives to sell as slaves, military power was essential, whileheavy armament was also advantageous to get an upper hand over commercial rivals.Maritime migrants such as the Bugis, Iranun, and Malay therefore tended to heavilyarm themselves and organized commercial-military groups. These non-state groupsobtained weapons, which were much more easily available than in the previouscenturies. As mentioned earlier, British country traders brought Western weaponsincluding firearms. Spanish and Dutch records tell that a number of commercial-military groups bought weapons from British traders in Sulu and the Malay waters(Warren 1981; Ota 2006).
The rise of commercial-military groups also had an impact on the state formation.States no longer played so prominent a role in the control of trade as they did inthe Age of Commerce. States in this period often attempted to promote trade byestablishing a strong connection with commercial-military groups. These groupswere useful for states not only to obtain China-bound products, but also to gainmilitary support for conflicts with their rivals. In return, states provided privilegessuch as a high official position and tax exemption. For example, Johor Kingdom,which had received waves of Bugis migrants after theMacassarWar, gave influentialBugis families a hereditary position of RajaMuda (viceroy). The Sultan of Sukadanaprovided migrant groups with a place to settle down and tax exemptions, and grantedtheir leader with a high official position (Trocki 1979; Ota 2010).
4There are records of state priority in the purchase of birds’ nests in West Kalimantan, but the samerecords also indicate that the attempt was not very successful. The local chiefs of the producingregion sold only a small part of the products to the state ruler, because of the weak state control(Ota 2010).
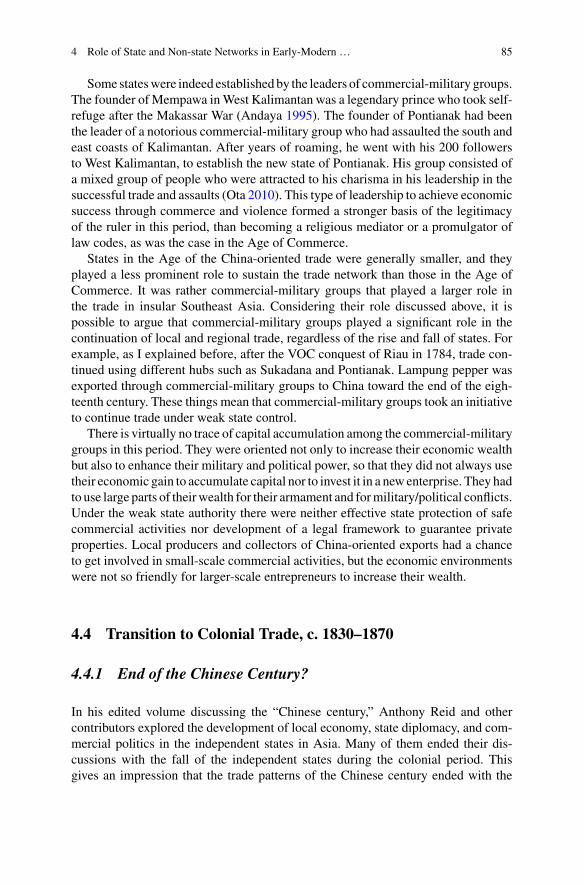
4 Role of State and Non-state Networks in Early-Modern … 85
Some stateswere indeed establishedby the leaders of commercial-military groups.The founder ofMempawa inWest Kalimantan was a legendary prince who took self-refuge after the Makassar War (Andaya 1995). The founder of Pontianak had beenthe leader of a notorious commercial-military group who had assaulted the south andeast coasts of Kalimantan. After years of roaming, he went with his 200 followersto West Kalimantan, to establish the new state of Pontianak. His group consisted ofa mixed group of people who were attracted to his charisma in his leadership in thesuccessful trade and assaults (Ota 2010). This type of leadership to achieve economicsuccess through commerce and violence formed a stronger basis of the legitimacyof the ruler in this period, than becoming a religious mediator or a promulgator oflaw codes, as was the case in the Age of Commerce.
States in the Age of the China-oriented trade were generally smaller, and theyplayed a less prominent role to sustain the trade network than those in the Age ofCommerce. It was rather commercial-military groups that played a larger role inthe trade in insular Southeast Asia. Considering their role discussed above, it ispossible to argue that commercial-military groups played a significant role in thecontinuation of local and regional trade, regardless of the rise and fall of states. Forexample, as I explained before, after the VOC conquest of Riau in 1784, trade con-tinued using different hubs such as Sukadana and Pontianak. Lampung pepper wasexported through commercial-military groups to China toward the end of the eigh-teenth century. These things mean that commercial-military groups took an initiativeto continue trade under weak state control.
There is virtually no trace of capital accumulation among the commercial-militarygroups in this period. They were oriented not only to increase their economic wealthbut also to enhance their military and political power, so that they did not always usetheir economic gain to accumulate capital nor to invest it in a newenterprise. They hadto use large parts of theirwealth for their armament and formilitary/political conflicts.Under the weak state authority there were neither effective state protection of safecommercial activities nor development of a legal framework to guarantee privateproperties. Local producers and collectors of China-oriented exports had a chanceto get involved in small-scale commercial activities, but the economic environmentswere not so friendly for larger-scale entrepreneurs to increase their wealth.
4.4 Transition to Colonial Trade, c. 1830–1870
4.4.1 End of the Chinese Century?
In his edited volume discussing the “Chinese century,” Anthony Reid and othercontributors explored the development of local economy, state diplomacy, and com-mercial politics in the independent states in Asia. Many of them ended their dis-cussions with the fall of the independent states during the colonial period. Thisgives an impression that the trade patterns of the Chinese century ended with the
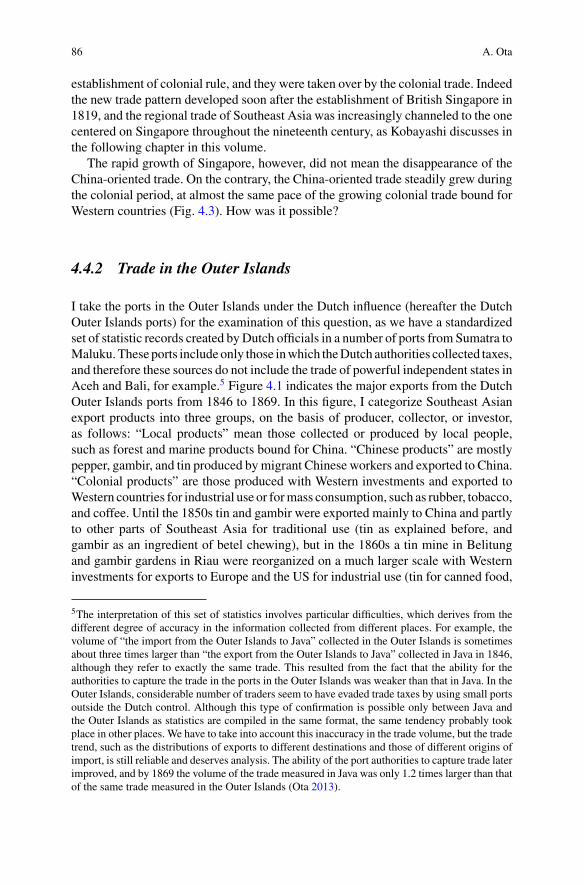
86 A. Ota
establishment of colonial rule, and they were taken over by the colonial trade. Indeedthe new trade pattern developed soon after the establishment of British Singapore in1819, and the regional trade of Southeast Asia was increasingly channeled to the onecentered on Singapore throughout the nineteenth century, as Kobayashi discusses inthe following chapter in this volume.
The rapid growth of Singapore, however, did not mean the disappearance of theChina-oriented trade. On the contrary, the China-oriented trade steadily grew duringthe colonial period, at almost the same pace of the growing colonial trade bound forWestern countries (Fig. 4.3). How was it possible?
4.4.2 Trade in the Outer Islands
I take the ports in the Outer Islands under the Dutch influence (hereafter the DutchOuter Islands ports) for the examination of this question, as we have a standardizedset of statistic records created byDutch officials in a number of ports from Sumatra toMaluku.These ports includeonly those inwhich theDutch authorities collected taxes,and therefore these sources do not include the trade of powerful independent states inAceh and Bali, for example.5 Figure 4.1 indicates the major exports from the DutchOuter Islands ports from 1846 to 1869. In this figure, I categorize Southeast Asianexport products into three groups, on the basis of producer, collector, or investor,as follows: “Local products” mean those collected or produced by local people,such as forest and marine products bound for China. “Chinese products” are mostlypepper, gambir, and tin produced bymigrant Chinese workers and exported to China.“Colonial products” are those produced with Western investments and exported toWestern countries for industrial use or formass consumption, such as rubber, tobacco,and coffee. Until the 1850s tin and gambir were exported mainly to China and partlyto other parts of Southeast Asia for traditional use (tin as explained before, andgambir as an ingredient of betel chewing), but in the 1860s a tin mine in Belitungand gambir gardens in Riau were reorganized on a much larger scale with Westerninvestments for exports to Europe and the US for industrial use (tin for canned food,
5The interpretation of this set of statistics involves particular difficulties, which derives from thedifferent degree of accuracy in the information collected from different places. For example, thevolume of “the import from the Outer Islands to Java” collected in the Outer Islands is sometimesabout three times larger than “the export from the Outer Islands to Java” collected in Java in 1846,although they refer to exactly the same trade. This resulted from the fact that the ability for theauthorities to capture the trade in the ports in the Outer Islands was weaker than that in Java. In theOuter Islands, considerable number of traders seem to have evaded trade taxes by using small portsoutside the Dutch control. Although this type of confirmation is possible only between Java andthe Outer Islands as statistics are compiled in the same format, the same tendency probably tookplace in other places. We have to take into account this inaccuracy in the trade volume, but the tradetrend, such as the distributions of exports to different destinations and those of different origins ofimport, is still reliable and deserves analysis. The ability of the port authorities to capture trade laterimproved, and by 1869 the volume of the trade measured in Java was only 1.2 times larger than thatof the same trade measured in the Outer Islands (Ota 2013).
4 Role of State and Non-state Networks in Early-Modern … 87
0
50,00,000
1,00,00,000
1,50,00,000
2,00,00,000
2,50,00,000
1846 1850 1859 1869
Local products
Chinese products
Colonial products
Fig. 4.1 Export from the Dutch ports in the Outer Islands, 1846–69 (Dutch guilders). SourcesDirekteur der Middelen en Domeinen 1851–70
and gambir for leather tanning). Therefore, the export of these products is includedin the “Colonial products” in 1869 of Fig. 4.1.
Local products and Chinese products in Fig. 4.1 were mostly exported to China,and these consists of various kinds of items such as tin, pepper, birds’ nests, seacucumber, and rattan, that is, typical items of mass consumption in China in theChina-oriented trade. This figure thus clearly indicates that the China-oriented tradewas growing from 1846 to 1869 as almost steadily as the export of colonial products,the great majority of which in this period was coffee from West Sumatra and NorthSulawesi. In fact the export of colonial products skyrocketed after the 1870s,when theDutch colonial government allowed private companies for more freedom in trade andproduction, and as a result the productionof tobacco, sugar, andother products rapidlyexpanded in East Sumatra and some other places. Unfortunately it is impossible toanalyze the trade trend in this phase in the same manner because of the significantchanges in the format of statistics after 1870. It is very clear, however, that theChina-oriented trade was still growing in the Outer Islands from 1846 to 1869, theperiod when the Singapore-centered regional trade was rapidly expanding and thusthe colonial trade structure was being established (Ota 2013).
Figure 4.2 shows the trend of imports from various regions to the Dutch OuterIslands ports from 1846 to 1869, based on the same sources used in Fig. 4.1. Thisfigure indicates that an increase of European products, among them textiles, wasmostremarkable. Most of them were British cotton textiles, the import of which expandedafter the Dutch authorities accepted the British request to lower their discriminativecustoms against British products in Dutch East Indies in the 1820s (Kobayashi 2013).Indian textiles occupied about 10.8% of the total import in 1846, but in the followingyears the trade considerably shrunk. The “household items”was explained in the orig-inal sources to have come from China, Manila, and Siam, but considering the tradevolume with these regions, most of them must have come from China. British cotton
88 A. Ota
-
2,000
4,000
6,000
8,000
10,000
12,000
14,000
16,000
18,000
1846 1850 1859 1869
Others
Household items
Other Indian products
Indian opium
Indian textiles
Other European products
European textiles
Fig. 4.2 Imports into the Dutch Outer-Islands Ports, 1846–1869 (1,000 Dutch guilders). SourcesDirekteur der Middelen en Domeinen 1851–70
textiles were distributed almost exclusively via Singapore, while other items camemostly either via Singapore or Javanese ports such as Batavia and Surabaya, and thesmall remaining part via Manila and other ports (Ota 2013). These observations sug-gest that in imports, the Singapore-centered trade pattern increasingly incorporatedthe Outer Islands. Chinese and Indian imports no longer played a crucial role, whileBritish cotton textiles seem to have taken over the demand for imported textiles.
The available statistical sources inform us, under the heading of “export destina-tions,” of only the first ports to which items were sent, even though large parts ofthemwere re-exported to other places. Nevertheless the “export destinations” deserveanalysis, as a first step, in order to grasp the pattern of regional trade. Figure 4.3 indi-cates that the export to Java and Madura was steadily growing from 1846 to 1869.This is a result of the Dutch efforts to create Java-centered trade networks, redirect-ing the Singapore-centered trade to ports in Java, by offering favorable conditionssuch as tax reductions. Many traders, however, still preferred Singapore, where theywere able to find items demanded in the Outer Islands, such as British cotton textiles,more easily. The result was almost the same pace of expansion of the trade to StraitsSettlements (mostly Singapore) and the trade to Java. Second, the figure indicatesthe increasing importance of the long-distance trade. The largest increase took placein the export to Europe and the U.S. This is a result of the Dutch attempts to increasethe direct export of coffee to the Netherlands first fromWest Sumatra, and then fromNorth Sulawesi, in order to reduce the dependence on Singapore. In terms of exportdestinations, therefore, the increasing importance of the colonial setting is obvious.The Singapore was a powerful colonial port equipped with modern facilities such as
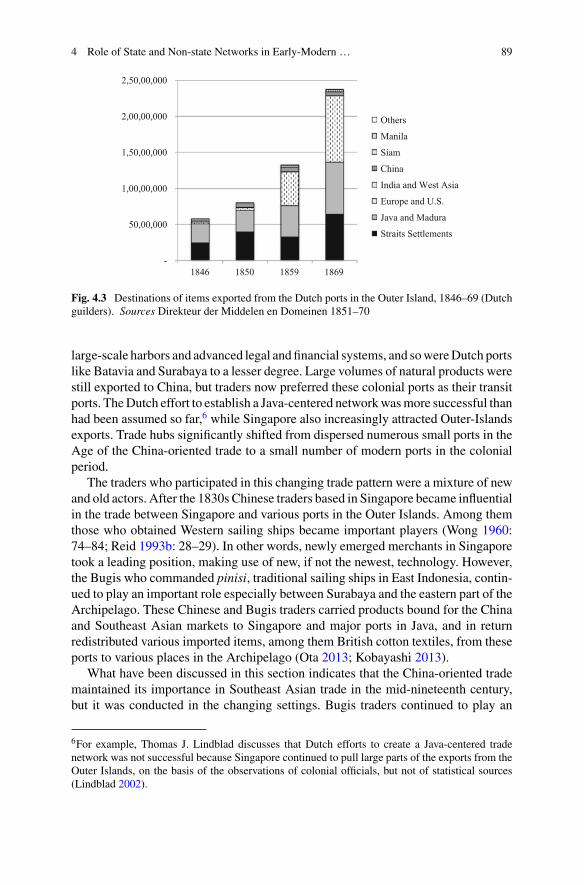
4 Role of State and Non-state Networks in Early-Modern … 89
-
50,00,000
1,00,00,000
1,50,00,000
2,00,00,000
2,50,00,000
1846 1850 1859 1869
Others
Manila
Siam
China
India and West Asia
Europe and U.S.
Java and Madura
Straits Settlements
Fig. 4.3 Destinations of items exported from the Dutch ports in the Outer Island, 1846–69 (Dutchguilders). Sources Direkteur der Middelen en Domeinen 1851–70
large-scale harbors and advanced legal andfinancial systems, and sowereDutch portslike Batavia and Surabaya to a lesser degree. Large volumes of natural products werestill exported to China, but traders now preferred these colonial ports as their transitports. TheDutch effort to establish a Java-centered networkwasmore successful thanhad been assumed so far,6 while Singapore also increasingly attracted Outer-Islandsexports. Trade hubs significantly shifted from dispersed numerous small ports in theAge of the China-oriented trade to a small number of modern ports in the colonialperiod.
The traders who participated in this changing trade pattern were a mixture of newand old actors. After the 1830s Chinese traders based in Singapore became influentialin the trade between Singapore and various ports in the Outer Islands. Among themthose who obtained Western sailing ships became important players (Wong 1960:74–84; Reid 1993b: 28–29). In other words, newly emerged merchants in Singaporetook a leading position, making use of new, if not the newest, technology. However,the Bugis who commanded pinisi, traditional sailing ships in East Indonesia, contin-ued to play an important role especially between Surabaya and the eastern part of theArchipelago. These Chinese and Bugis traders carried products bound for the Chinaand Southeast Asian markets to Singapore and major ports in Java, and in returnredistributed various imported items, among them British cotton textiles, from theseports to various places in the Archipelago (Ota 2013; Kobayashi 2013).
What have been discussed in this section indicates that the China-oriented trademaintained its importance in Southeast Asian trade in the mid-nineteenth century,but it was conducted in the changing settings. Bugis traders continued to play an
6For example, Thomas J. Lindblad discusses that Dutch efforts to create a Java-centered tradenetwork was not successful because Singapore continued to pull large parts of the exports from theOuter Islands, on the basis of the observations of colonial officials, but not of statistical sources(Lindblad 2002).
90 A. Ota
important role in the collection of early-modern types of Southeast Asian products,while they and the newly participated Singapore-based Chinese traders brought theproducts not to numerous small ports used in the previous decades but to Singaporeand themajor ports in Java. These traders distributed imported items to the producingregions of China-bound natural products, but the imported itemswere now not Indiantextiles but mostly European items. Asian traders preferred Singapore, which nowintegrated the role of numerous small ports in nearby waters in the previous decades,while theDutch authorities attempted to attract local traders to themajor ports in Java.Under the new setting of the colonial economic structure, the China-oriented tradewas maintained with some partial transformations. Some elements that facilitatedthe Chine-oriented trade, such as Chinese and Bugis traders and their networks, alsobuttressed the colonial trade structure.
Among the Singapore-based Chinese traders, some expanded the scale of theirbusiness and started to accumulate their capital, mainly through intermediationbetween British and Southeast Asian or Chinese traders (Kobayashi 2013). Someof them further expanded their wealth in the later decades. In this sense the continu-ing China-oriented trade provided the basis of the accumulation of Chinese capital inthe high colonial era, although it did not work well among Bugis and other SoutheastAsian entrepreneurs.
Why did the China-oriented trade continue to the colonial period? First, there wasstill strong Chinese demand on Southeast Asian natural products. Second, local peo-ple in the producing regions of China-bound items were market-oriented enough torespond to the demand on their products. Third, while these people had an increas-ing purchasing power through their export of natural products, they seem to haverelied necessities such as textiles on import. The colonial trade structure focused onthe producing regions of export products for the Western market, while the China-oriented trade continued to deal in the imports and exports in many other regions,where people had been well market-oriented and trade-dependent.
4.5 Conclusions
Asmentioned at the beginning of this chapter, it is an interesting feature that SoutheastAsia experienced brisk local and regional trade in the precolonial period. Althoughthe patterns of the precolonial trade were constantly changing, the general trend inthe early-modern era was the shift from state initiative to non-state initiative in thepromotion of the trade. During the Age of Commerce (c. 1450–1680) states playeda prominent role in the militarily protection of trade ports, creation of cosmopolitanport cities, promulgation of rules and regulations of commerce, and control of theproduction and trade of important export products. The state control of productionand trade was possible and effective because they mainly dealt in small-volume,high-value items such as precious spices and wood, which were produced in verylimited areas and traded in a small number of ports. After the Age of Commerce,the China-oriented trade started to develop in the mid-eighteenth century. During the
4 Role of State and Non-state Networks in Early-Modern … 91
Age of China-oriented trade (c. 1750–1870), non-state commercial-military groups,often called pirates, played an important role in local and regional trade. Their heavilyarmed fleets were effective to collect marine and forest products demanded in China,in remote areas under weak state control. State control of production was no longereffective on these products, which could be collected in numerous coasts and forests.Many states attempted to maintain a good relationship with commercial-militarygroups, providing privileges in return for their commercial and military support.
The colonial trade pattern rapidly made a shape in the 1820s after the Britishestablishment of Singapore (1819). The colonial trade patterns expanded to entireSoutheast Asia, especially intensively to its insular part, buttressed by the modernport, legal, and financial facilities in Singapore, and the import of British cottontextiles,which now took over the demand for Indian textiles.However, the Singapore-centered trade pattern neither completely brought an end to the China-oriented tradenor imposed totally new systems. On the contrary, old systems survived in the newsettings. It was existing Bugis trade network that distributed British cotton textilesto ports in the Outer Islands. People in these ports had purchasing power to consumeimported items because of their export of China-bound products. The Singapore-centered trade patterns expanded, on the basis of the elements that had developed inthe early-modern trade structure.
What sort of significance did the early-modern trade have in the economic historyof SoutheastAsia?First, large parts of SoutheastAsia came to heavily dependon tradeto obtain food and other necessities. In otherwords, they became trade-dependent andhad to continue trade for their survival. Second, itmade possible the gradual transitionto modern trade patterns. The colonial trade pattern relatively smoothly penetratedthe local society because it was able to make use of the existing trade structure.Third, during the Age of the China-oriented trade, the production/collection areasof major export items expanded to much wider areas in coastal and mountain areas.As a result, much larger areas of people were involved in commercial activities andthey becamemoremarket-oriented. Commercial-military groups, who connected theproducing areas to the transit ports were relatively independent from the states. As aresult, when independent states fell one by one under the colonial rule, their networkand commercial activities continued, because they chose alternative ports, eitherindependent or colonial. The China-oriented trade was maintained, now making useof modern elements, such as British manufactured products, modern port facilitiesin colonial ports, and shipbuilding technology. In this manner, the colonial tradedeveloped, by combining itself with the China-oriented trade, not by taking over thelatter.
Considering the continuity from the early-modern to modern eras as discussedabove, it is possible to argue that the basis of the Anglo-Dutch international order, inwhich free trade was pursued in colonial Asia (Sugihara 1996), had been created inthe early-modern era. Southeast Asian and Chinese traders and producers preferredfree trade, in which state intervention was minimum, to an increasing degree, fromthe Age of Commerce to the Age of the China-oriented trade. It was the tradition oftrade-dependent and market-oriented society that made possible the pursuit of freetrade without state protection.
92 A. Ota
The pursuit of free tradewithout state protection and legal framework to guaranteeprivate properties also had its drawbacks. Until the colonial regimes brought legalframework to protect their business and properties, there was virtually no capitalaccumulation in insular Southeast Asia. States did not have enough experiences topromote commerce and trade through appropriate economic policy.
All these experiences and lack of experiences seem to have created the basisof Southeast Asian economy in the following periods until today. Society is trade-dependent and market-oriented, while capital accumulation was extremely limiteduntil recent decades, except for those who were strongly connected to the state andoutside capital. States were not really capable to conduct appropriate economic pol-icy, and legal framework did not develop well to guarantee the safe and amicablebusiness environment. Because of this basis the regional division of labor (betweenexport item-producing regions and food-producing regions) developed in the highcolonial period, while capital-intensive industrialization did not fully develop in theperiod after independence in most parts of Southeast Asia until quite recent decades,although micro-scale commerce has relatively well developed. The lack of capitalaccumulation and effective state economic policy were bottleneck of the economicdevelopment in many Southeast Asian states for several decades after independence.In recent years, however, while manufacturing industry stands still, micro-scale ser-vice industry based on internet facilities without large capital is mushrooming inseveral states. Southeast Asia seems to follow its historical path of economic devel-opment, and its market-oriented tendency embedded in society, without heavilydepending on state protection, will perhaps have advantage in non-capital-intensiveindustries in the coming years.
References
Andaya, L. Y. (1995). The Bugis-Makassar diasporas. Journal of theMalaysian Branch of the RoyalAsiatic Society, 68(1), 119–138.
Blussé, L. (1999). The Chinese century: The eighteenth century in the China Sea Region. Archipel,58, 107–129.
Direkteur der Middelen en Domeinen. (1862–1870). Overzigt van den handel en de scheepvaart inde Nederlandsche bezittingen in Oost Indie, buiten Java en Madura, over de jaren … [Overviewof trade and shipping in the Dutch possessions in the East Indies, apart from Java and Madura,for the years …]. Batavia: Landsdrukkerij.
Kobayashi, A. (2013). The role of Singapore in the growth of intra-Southeast Asian trade, c.1820s–1852. Southeast Asian Studies, 2(3), 443–474.
Lindblad, J. T. (2002). The outer islands in the 19th century: Contest for the periphery. In H. Dick, V.J. H. Houben, J. T. Lindblad, & T. K. Wie, The emergence of a national economy: An economichistory of Indonesia, 1800–2000 (pp. 82–110). St Leonards: Allen & Unwin; Leiden: KITLVPress.
Ota, A. (2006). Changes of regime and social dynamics in West Java: Society, state, and the outerworld of Banten, 1750–1830. Leiden and Boston: Brill.
Ota, A. (2010). The business of violence: Piracy around Riau, Lingga, and Singapore, 1820–40. InR. J. Antony (Ed.), Elusive pirates, pervasive smugglers: Violence and clandestine trade in theGreater China Seas (pp. 127–141). Hong Kong: Hong Kong University Press.
4 Role of State and Non-state Networks in Early-Modern … 93
Ota, A. (2013). Tropical products out, British cotton in: Trade in the Dutch Outer Islands ports,1846–69. Southeast Asian Studies, 2(3), 499–526.
Ota, A. (2014). Toward cities, seas, and jungles:Migration in theMalay Archipelago, c. 1750–1850.In J. Lucassen & L. Lucassen (Eds.), Globalising migration history: The Eurasian experience(16th–21st centuries). (pp. 180–214). Leiden and Boston: Brill.
Pomerantz, K. (2000). The great divergence: China, Europe, and the making of the modern worldeconomy. Princeton: Princeton University Press.
Reid, A. (1993a). Southeast Asia in the age of commerce 1450–1680 Vol 2: Expansion and crisis.New Haven and London: Yale University Press.
Reid, A. (1993b). The unthreatening alternative: Chinese shipping in Southeast Asia 1675–1842.Review of Indonesian and Malaysian Affairs, 27, 13–32.
Reid, A. (1997). Introduction. In A. Reid (Ed.), The last stand of Asian autonomies: Responses tomodernity in the diverse states of Southeast Asia and Korea, 1750–1900 (pp. 1–25). Basingstokeand London: Macmillan Press.
Sugihara, K. (1996). Ajia kan boeki no keisei to kozo (The Formation and structure of intra-Asiantrade). Kyoto: Minerva Shobo.
Trocki, C. A. (1979). Prince of pirates: The Temenggongs and the development of Johor andSingapore, 1784–1885. Singapore: NUS Press.
Warren, J. F. (1981). The Sulu Zone, 1768–1898: The dynamics of external trade, slavery, and eth-nicity in the transformation of a Southeast AsianMaritime State. Singapore: Singapore UniversityPress.
Wong, L. K. (1960). The trade of Singapore, 1819–1869. Journal of the Malayan Branch of theRoyal Asiatic Society, 30(4), 1–315.
Open Access This chapter is licensed under the terms of the Creative Commons Attribution-NonCommercial-NoDerivatives 4.0 International License (http://creativecommons.org/licenses/by-nc-nd/4.0/), which permits any noncommercial use, sharing, distribution and reproduction in anymedium or format, as long as you give appropriate credit to the original author(s) and the source,provide a link to the Creative Commons licence and indicate if you modified the licensed material.You do not have permission under this licence to share adapted material derived from this chapteror parts of it.
The images or other third party material in this chapter are included in the chapter’s CreativeCommons licence, unless indicated otherwise in a credit line to the material. If material is notincluded in the chapter’s Creative Commons licence and your intended use is not permitted bystatutory regulation or exceeds the permitted use, you will need to obtain permission directly fromthe copyright holder.
Chapter 5Growth of Regional Trade in ModernSoutheast Asia: The Rise of Singapore,1819–1913
Atsushi Kobayashi
5.1 Introduction
During the nineteenth century, Southeast Asian countries were progressivelycolonised by the West; their economic relations with the Western capitalist econ-omy intensified through the expansion of long-distance trade. As a result, SoutheastAsia was incorporated into the international division of labour, exporting a largeamount of primary goods in exchange for capital investment and imports of man-ufactured goods (Cowan 1964; Drabble 2000; Maddison and Prince 1989). Whilelong-distance trade grew in Southeast Asia, Singapore—the British colonial empo-rium—prospered as a trade hub by providing industrial products to the neighbouringSoutheast Asian countries and re-exporting regional primary goods to industrialcountries (Huff 1994; Wong 1960). In addition to trade articles, money, Westerntrading firms, and Asian merchants accumulated in Singapore, leading to remark-able trade growth based on the trade relationships with Southeast Asian countries.Thus, Singapore became the centre of international trade for Southeast Asia, whichaccelerated its regional integration into theWest-led global economy. Singapore alsoplayed a pivotal role in connecting production and consumption within the regionthrough the development of regional trade (Chiang 1978; Wong 1978). Unveilingsuch multifaceted trade development in Southeast Asia, this chapter intends to shedlight on the growth of regional trade in Singapore during the nineteenth century.
Previous studies have stressed the significance of Singapore as a trading hub for thegrowth of Southeast Asian trade. However, it remains unclear how this port-city wassingled out to develop into such a prominent trade centre in the region, and what kindof mechanism operated for the growth of its regional trade. One bias in the literatureis that previous studies have considered the late nineteenth century as the watershedperiod for Singapore’s trade growth, specifically with the opening of Suez Canal
A. Kobayashi (B)Osaka Sangyo University, Osaka, Japane-mail: [email protected]
© The Author(s) 2019K. Otsuka and K. Sugihara (eds.), Paths to the Emerging State in Asia and Africa,Emerging-Economy State and International Policy Studies,https://doi.org/10.1007/978-981-13-3131-2_5
95
96 A. Kobayashi
in 1869. The primary research relating to Singapore’s economic history addressingbefore and after this period exists, but they have often been treated separately (Wong1960; Chiang 1978; Huff 1994). As a result, the remarkable growth of Singapore’strade after the 1870s tended to be associated with the effect of the revolution oftransport and communication driven byWestern colonialismand the growing demandfor raw material in Western industrial countries. The regionally specific mechanismof trade growth, running through the nineteenth century, has not been fully explored.
To reconsider the significance of Singapore’s regional trade, we must re-examineits progressive development beyond the periodic gap before and after 1870. Thepresent chapter tackles this assignment, and in so doing, we estimate the real growthrate of Singapore’s trade from 1831 to 1913, suggesting the steady growth of itstrade throughout the nineteenth century. In addition, we investigate the factors andmechanism for the long-term growth of this trade.
Singapore’s regional trade was closely connected with each country’s local trade.Manufactured goods transported into Singapore via long-distance trade were thencarried to rural port-cities by regional trade, and further supplied to local inhabitantsthrough internal local trade, such as coastwise and riverine trade (Warren 1981;Li 2004; Lindblad 2002). Therefore, the functional linkage of Singapore’s regionaltrade with local trade in each country was significant in integrating Southeast Asiawith the growing international economy. However, we are not familiar with howSingapore’s regional trade built its connections with each country’s local trade, andwhat sort of changes local trade underwent in response to the expansion of regionaltrade. Due to the lack of focus on local trade, we are not adequately able to assessthe significance of Singapore’s regional trade for the whole of nineteenth-centurySoutheast Asian economy. Therefore, we shed light on the process of consolidatingthe linkage between regional and local trade to comprehensively understand theregional trading system. Section 4 addresses this subject by focussing on the case ofSarawak.
The remainder of this chapter is organised as follows. Section 2 shows the long-term growth of Singapore’s trade, and analyses the trade structure during the nine-teenth century. It also discusses the factors that influenced the growth of regional tradewith focus on trade policy and merchants’ business. Section 3 highlights the emer-gence of the intra-regional circulation of consumer goods by analysing the changingcommodity composition. Section 4 focuses on the expansion of Sarawak’s trade toexplore the connectivity of regional trade with local trade. Section 5 concludes thechapter.
5.2 Rise of Singapore’s Regional Trade
Singapore was founded as a British colonial port in 1819 under the initiative ofThomas Stanford Raffles (Turnbull 1977; Trocki 1979). According to the Anglo—DutchTreaty of 1824, Singaporewas officially acknowledged as aBritish possession,and in 1826, it became one of the three colonial port-cities of the Straits Settlements.
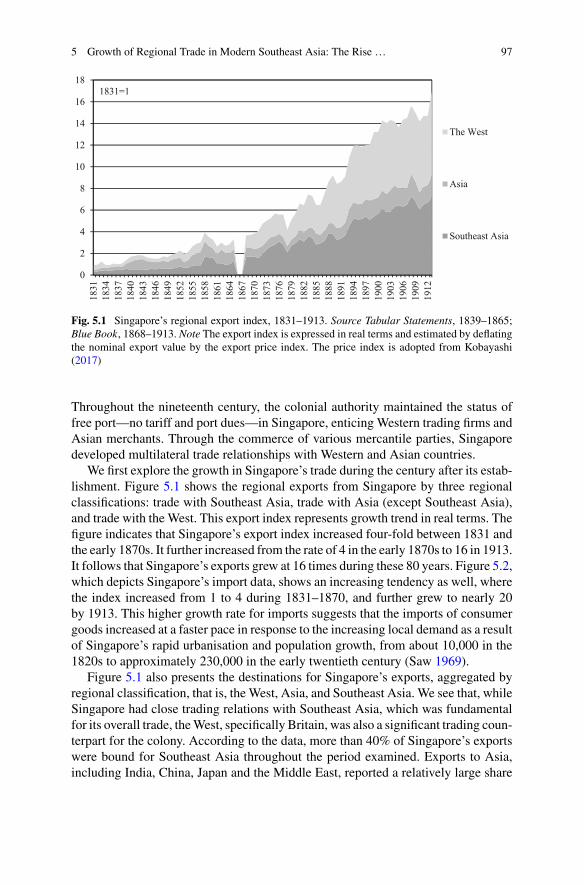
5 Growth of Regional Trade in Modern Southeast Asia: The Rise … 97
0
2
4
6
8
10
12
14
16
1818
3118
3418
3718
4018
4318
4618
4918
5218
5518
5818
6118
6418
6718
7018
7318
7618
7918
8218
8518
8818
9118
9418
9719
0019
0319
0619
0919
12
The West
Asia
Southeast Asia
1831=1
Fig. 5.1 Singapore’s regional export index, 1831–1913. Source Tabular Statements, 1839–1865;Blue Book, 1868–1913. Note The export index is expressed in real terms and estimated by deflatingthe nominal export value by the export price index. The price index is adopted from Kobayashi(2017)
Throughout the nineteenth century, the colonial authority maintained the status offree port—no tariff and port dues—in Singapore, enticing Western trading firms andAsian merchants. Through the commerce of various mercantile parties, Singaporedeveloped multilateral trade relationships with Western and Asian countries.
We first explore the growth in Singapore’s trade during the century after its estab-lishment. Figure 5.1 shows the regional exports from Singapore by three regionalclassifications: trade with Southeast Asia, trade with Asia (except Southeast Asia),and trade with theWest. This export index represents growth trend in real terms. Thefigure indicates that Singapore’s export index increased four-fold between 1831 andthe early 1870s. It further increased from the rate of 4 in the early 1870s to 16 in 1913.It follows that Singapore’s exports grew at 16 times during these 80 years. Figure 5.2,which depicts Singapore’s import data, shows an increasing tendency as well, wherethe index increased from 1 to 4 during 1831–1870, and further grew to nearly 20by 1913. This higher growth rate for imports suggests that the imports of consumergoods increased at a faster pace in response to the increasing local demand as a resultof Singapore’s rapid urbanisation and population growth, from about 10,000 in the1820s to approximately 230,000 in the early twentieth century (Saw 1969).
Figure 5.1 also presents the destinations for Singapore’s exports, aggregated byregional classification, that is, theWest, Asia, and Southeast Asia. We see that, whileSingapore had close trading relations with Southeast Asia, which was fundamentalfor its overall trade, theWest, specifically Britain, was also a significant trading coun-terpart for the colony. According to the data, more than 40% of Singapore’s exportswere bound for Southeast Asia throughout the period examined. Exports to Asia,including India, China, Japan and the Middle East, reported a relatively large share
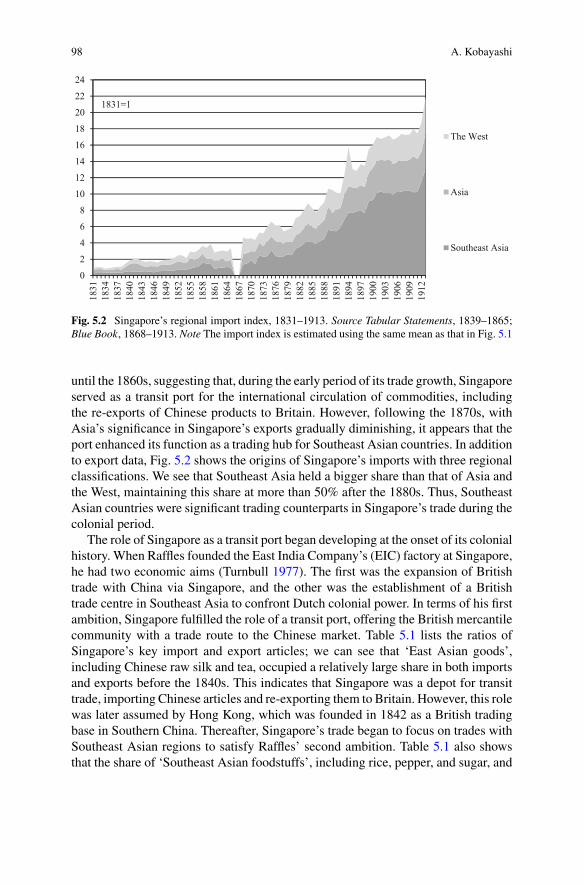
98 A. Kobayashi
0
2
4
6
8
10
12
14
16
18
20
22
2418
3118
3418
3718
4018
4318
4618
4918
5218
5518
5818
6118
6418
6718
7018
7318
7618
7918
8218
8518
8818
9118
9418
9719
0019
0319
0619
0919
12
The West
Asia
Southeast Asia
1831=1
Fig. 5.2 Singapore’s regional import index, 1831–1913. Source Tabular Statements, 1839–1865;Blue Book, 1868–1913. Note The import index is estimated using the same mean as that in Fig. 5.1
until the 1860s, suggesting that, during the early period of its trade growth, Singaporeserved as a transit port for the international circulation of commodities, includingthe re-exports of Chinese products to Britain. However, following the 1870s, withAsia’s significance in Singapore’s exports gradually diminishing, it appears that theport enhanced its function as a trading hub for Southeast Asian countries. In additionto export data, Fig. 5.2 shows the origins of Singapore’s imports with three regionalclassifications. We see that Southeast Asia held a bigger share than that of Asia andthe West, maintaining this share at more than 50% after the 1880s. Thus, SoutheastAsian countries were significant trading counterparts in Singapore’s trade during thecolonial period.
The role of Singapore as a transit port began developing at the onset of its colonialhistory. When Raffles founded the East India Company’s (EIC) factory at Singapore,he had two economic aims (Turnbull 1977). The first was the expansion of Britishtrade with China via Singapore, and the other was the establishment of a Britishtrade centre in Southeast Asia to confront Dutch colonial power. In terms of his firstambition, Singapore fulfilled the role of a transit port, offering the British mercantilecommunity with a trade route to the Chinese market. Table 5.1 lists the ratios ofSingapore’s key import and export articles; we can see that ‘East Asian goods’,including Chinese raw silk and tea, occupied a relatively large share in both importsand exports before the 1840s. This indicates that Singapore was a depot for transittrade, importing Chinese articles and re-exporting them to Britain. However, this rolewas later assumed by Hong Kong, which was founded in 1842 as a British tradingbase in Southern China. Thereafter, Singapore’s trade began to focus on trades withSoutheast Asian regions to satisfy Raffles’ second ambition. Table 5.1 also showsthat the share of ‘Southeast Asian foodstuffs’, including rice, pepper, and sugar, and
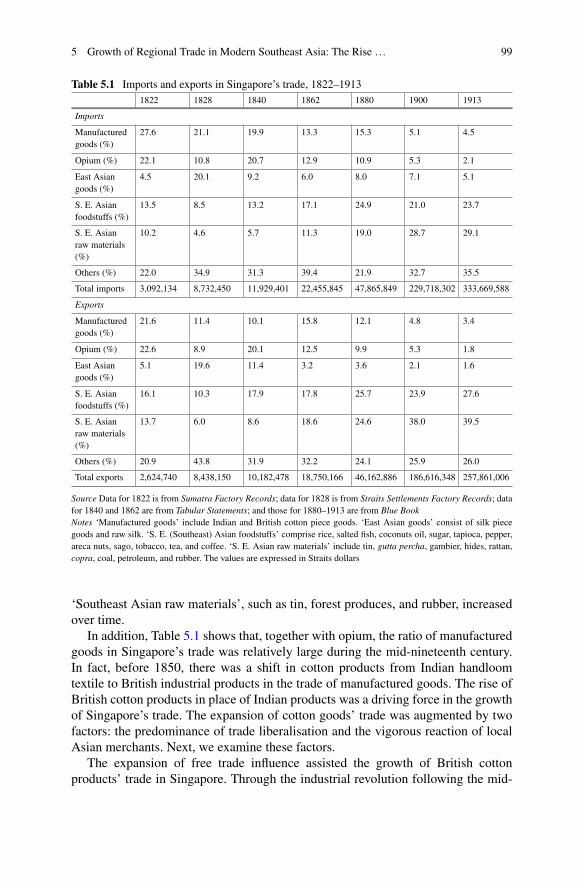
5 Growth of Regional Trade in Modern Southeast Asia: The Rise … 99
Table 5.1 Imports and exports in Singapore’s trade, 1822–19131822 1828 1840 1862 1880 1900 1913
Imports
Manufacturedgoods (%)
27.6 21.1 19.9 13.3 15.3 5.1 4.5
Opium (%) 22.1 10.8 20.7 12.9 10.9 5.3 2.1
East Asiangoods (%)
4.5 20.1 9.2 6.0 8.0 7.1 5.1
S. E. Asianfoodstuffs (%)
13.5 8.5 13.2 17.1 24.9 21.0 23.7
S. E. Asianraw materials(%)
10.2 4.6 5.7 11.3 19.0 28.7 29.1
Others (%) 22.0 34.9 31.3 39.4 21.9 32.7 35.5
Total imports 3,092,134 8,732,450 11,929,401 22,455,845 47,865,849 229,718,302 333,669,588
Exports
Manufacturedgoods (%)
21.6 11.4 10.1 15.8 12.1 4.8 3.4
Opium (%) 22.6 8.9 20.1 12.5 9.9 5.3 1.8
East Asiangoods (%)
5.1 19.6 11.4 3.2 3.6 2.1 1.6
S. E. Asianfoodstuffs (%)
16.1 10.3 17.9 17.8 25.7 23.9 27.6
S. E. Asianraw materials(%)
13.7 6.0 8.6 18.6 24.6 38.0 39.5
Others (%) 20.9 43.8 31.9 32.2 24.1 25.9 26.0
Total exports 2,624,740 8,438,150 10,182,478 18,750,166 46,162,886 186,616,348 257,861,006
Source Data for 1822 is from Sumatra Factory Records; data for 1828 is from Straits Settlements Factory Records; datafor 1840 and 1862 are from Tabular Statements; and those for 1880–1913 are from Blue BookNotes ‘Manufactured goods’ include Indian and British cotton piece goods. ‘East Asian goods’ consist of silk piecegoods and raw silk. ‘S. E. (Southeast) Asian foodstuffs’ comprise rice, salted fish, coconuts oil, sugar, tapioca, pepper,areca nuts, sago, tobacco, tea, and coffee. ‘S. E. Asian raw materials’ include tin, gutta percha, gambier, hides, rattan,copra, coal, petroleum, and rubber. The values are expressed in Straits dollars
‘Southeast Asian raw materials’, such as tin, forest produces, and rubber, increasedover time.
In addition, Table 5.1 shows that, together with opium, the ratio of manufacturedgoods in Singapore’s trade was relatively large during the mid-nineteenth century.In fact, before 1850, there was a shift in cotton products from Indian handloomtextile to British industrial products in the trade of manufactured goods. The rise ofBritish cotton products in place of Indian products was a driving force in the growthof Singapore’s trade. The expansion of cotton goods’ trade was augmented by twofactors: the predominance of trade liberalisation and the vigorous reaction of localAsian merchants. Next, we examine these factors.
The expansion of free trade influence assisted the growth of British cottonproducts’ trade in Singapore. Through the industrial revolution following the mid-
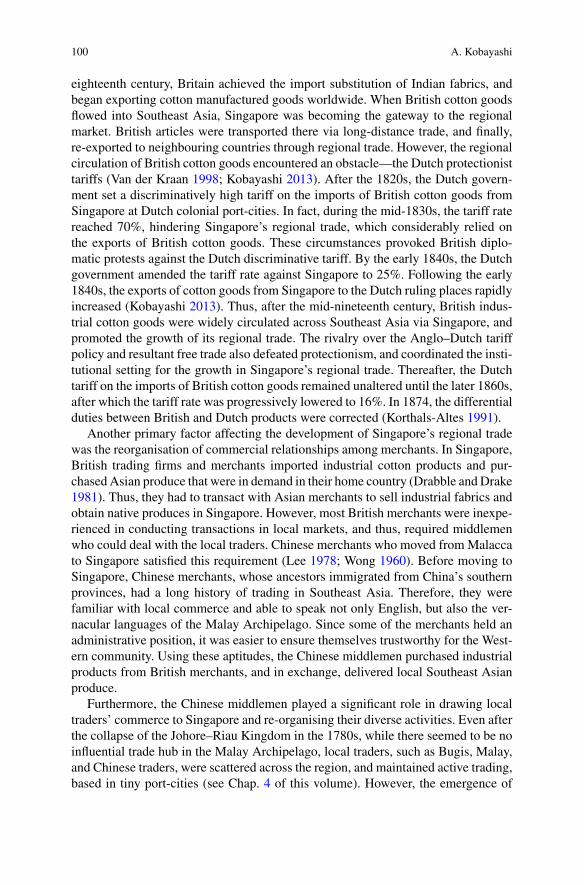
100 A. Kobayashi
eighteenth century, Britain achieved the import substitution of Indian fabrics, andbegan exporting cotton manufactured goods worldwide. When British cotton goodsflowed into Southeast Asia, Singapore was becoming the gateway to the regionalmarket. British articles were transported there via long-distance trade, and finally,re-exported to neighbouring countries through regional trade. However, the regionalcirculation of British cotton goods encountered an obstacle—the Dutch protectionisttariffs (Van der Kraan 1998; Kobayashi 2013). After the 1820s, the Dutch govern-ment set a discriminatively high tariff on the imports of British cotton goods fromSingapore at Dutch colonial port-cities. In fact, during the mid-1830s, the tariff ratereached 70%, hindering Singapore’s regional trade, which considerably relied onthe exports of British cotton goods. These circumstances provoked British diplo-matic protests against the Dutch discriminative tariff. By the early 1840s, the Dutchgovernment amended the tariff rate against Singapore to 25%. Following the early1840s, the exports of cotton goods from Singapore to the Dutch ruling places rapidlyincreased (Kobayashi 2013). Thus, after the mid-nineteenth century, British indus-trial cotton goods were widely circulated across Southeast Asia via Singapore, andpromoted the growth of its regional trade. The rivalry over the Anglo–Dutch tariffpolicy and resultant free trade also defeated protectionism, and coordinated the insti-tutional setting for the growth in Singapore’s regional trade. Thereafter, the Dutchtariff on the imports of British cotton goods remained unaltered until the later 1860s,after which the tariff rate was progressively lowered to 16%. In 1874, the differentialduties between British and Dutch products were corrected (Korthals-Altes 1991).
Another primary factor affecting the development of Singapore’s regional tradewas the reorganisation of commercial relationships among merchants. In Singapore,British trading firms and merchants imported industrial cotton products and pur-chased Asian produce that were in demand in their home country (Drabble andDrake1981). Thus, they had to transact with Asian merchants to sell industrial fabrics andobtain native produces in Singapore. However, most British merchants were inexpe-rienced in conducting transactions in local markets, and thus, required middlemenwho could deal with the local traders. Chinese merchants who moved fromMalaccato Singapore satisfied this requirement (Lee 1978; Wong 1960). Before moving toSingapore, Chinese merchants, whose ancestors immigrated from China’s southernprovinces, had a long history of trading in Southeast Asia. Therefore, they werefamiliar with local commerce and able to speak not only English, but also the ver-nacular languages of the Malay Archipelago. Since some of the merchants held anadministrative position, it was easier to ensure themselves trustworthy for the West-ern community. Using these aptitudes, the Chinese middlemen purchased industrialproducts from British merchants, and in exchange, delivered local Southeast Asianproduce.
Furthermore, the Chinese middlemen played a significant role in drawing localtraders’ commerce to Singapore and re-organising their diverse activities. Even afterthe collapse of the Johore–Riau Kingdom in the 1780s, while there seemed to be noinfluential trade hub in the Malay Archipelago, local traders, such as Bugis, Malay,and Chinese traders, were scattered across the region, and maintained active trading,based in tiny port-cities (see Chap. 4 of this volume). However, the emergence of
5 Growth of Regional Trade in Modern Southeast Asia: The Rise … 101
Singapore changed these circumstances. As Singapore began to function as a freeport that offered lucrative business opportunities, such as a deal for British industrialproducts, the port started to attract local traders from across Southeast Asia. Bugistraders came to Singapore with abundant regional produce, such as forest and marineproducts from the petty ports in Borneo and Celebes, and Malay traders broughtvarious agricultural and mineral produces from theMalay Peninsula and Sumatra. Inaddition, Chinese junks imported foodstuff, such as rice and sugar, from mainlandcountries like Siam and Cochin China. The local traders generally purchased theircommodities from Chinese middlemen, who could offer merchandise ranging fromBritish fabrics to regional foodstuffs (Kobayashi 2013). In other words, by tradingwith the Chinese middlemen, local traders who arrived at Singapore could acquireevery commodity that was demanded in their homelands. Under the circumstances,an efficient deal warranted the alleviation of high transaction costs, and this in turnwas likely to have enhanced the bargaining position of the Chinesemiddlemen. Thus,Chinese middlemen came to play a pivotal role in the circulation of commodities inSingapore at the onset of its trade growth.
Although Singapore was newly built in the early nineteenth century, its tradegrowth did not begin from nothing. For the development of Singapore’s regionaltrade, it was significant that Chinese merchants who had accommodated to localcommerce operated intermediary business not only between Western merchants andlocal traders, but also among the various local traders. The extra-regionally pro-duced commodities, such as cotton manufactured goods, Indian opium, and Chinesegoods, flowed into Southeast Asia via Singapore. In exchange for its exports, South-east Asian produces were brought and further transported to consuming countries.Consequently, through these reciprocal linkages between long-distance trade andregional trade in Singapore, Southeast Asian trade grew, and the regional tradingsystem was established by the mid-nineteenth century. This trade structure furtherdeveloped after the 1870s, and led to the overall growth of Southeast Asian trade, aswe see in the next section.
5.3 Mechanism of Demand Linkage in Southeast AsianTrade After the 1870s
Prior to the late nineteenth century, Singapore’s trade mostly comprised the generalpattern of transit trade. Extra-regional products brought into Singapore by long-distance trade were re-exported through regional trade, and regional products weretransported overseas through reverse flows. However, this pattern changed follow-ing the 1870s. In particular, the change took place in the regional trade, and thenew pattern of the regional commodity circulation fuelled the expansion of primarygoods’ exports from Southeast Asia. In this section, we discuss the development ofSingapore’s regional trade after the 1870s with focus on the mechanism of demandlinkage.
102 A. Kobayashi
After the 1850s, the expansion ofWestern economic influence further accelerated;regional economies were also affected by the movements of international trade. Inparticular, in Insular Southeast Asia, including Malay Peninsula, Dutch East Indies,and the Philippines, tin mines and plantations were developed under the surge ofWestern colonisation, and large exports of raw materials were initiated to the West.Exports of forest products, including resin, rattan, and oils, also expanded. In someinland regions, the livelihoodof the local populations shifted towardsmarket-orientedagricultural production and labour income at plantations (Lindblad 2002, 100–105;Murray 1980). However, because the population was relatively small in most islandcountries, immigrants became indispensable as labour in order to increase primarygoods production. Chinese and Indian immigrants met this requirement. Followingthe 1870s, a large number of Chinese began to immigrate to Southeast Asia fromChina’s southern provinces, such as Guangdong and Fujian; in fact, the average num-ber reached approximately 200,000 per annum (Sugihara 2005). While most of themreturned to China after saving a certain amount of income fromworking in the minesand plantations, some settled in Southeast Asia. Likewise, Indian immigrants workedin rubber plantations under the Kangani system in the Malay Peninsula (Sugihara1996; McKeown 2004). This international movement of labour force reinforced theproduction of rawmaterials in Insular Southeast Asia, and products were exported tothe West either directly or via Singapore. Table 5.2 shows that the ratio of SoutheastAsian raw materials in Singapore’s regional imports conspicuously increased afterthe 1860s, and the share of tin dramatically soared following the 1880s, suggestingthe increasing production of raw materials in the neighbouring countries. Finally,they were re-exported from Singapore to the West by long-distance trade.
In mainland Southeast Asia, the Western colonies, British Burma, and FrenchCochin China (Indochina after 1899), were established, and the Kingdom of Siambarely remained independent. In those countries, the production of primary goodsexpanded in response to the growth of international economy. Nevertheless, thenature of primary goods produced there somewhat differed from that of primarygoods in Insular Southeast Asia. Following the 1850s, the reclamation of the deltasin Burma, Siam, and Cochin China rapidly proceeded, and farmers began to settlethere. As a result, the yield of rice increased in those lands. Consequently, localfarmers began exporting surplus rice abroad on an unprecedented scale, and ricebecame themost significant export article from themainland countries (Owen 1971).Although Europe imported some of the Burmese rice, which was used as starch forpaper manufacturing, Asian countries imported most of the rice as a staple food item.Rice produced in the Burmese Irrawaddy Delta was shipped to vicinities, such asBritish India and the Straits Settlements, and rice reaped in the Chao Phraya Deltain Siam and the Mekong Delta in Cochin China was exported to Insular SoutheastAsia, China, and Japan. Siamese and Cochin Chinese rice was exported throughthe country’s emporiums, Bangkok and Saigon. The rice supply from the mainlandcountries facilitated the shift of labour force from the agricultural to export sector;in other words, it led to the rise of plantation and commercial agriculture in Asiancountries. Thus, the exports of primary goods from the mainland mainly comprisedfoodstuffs, which supported the enhancement of productivity in theAsian economies.
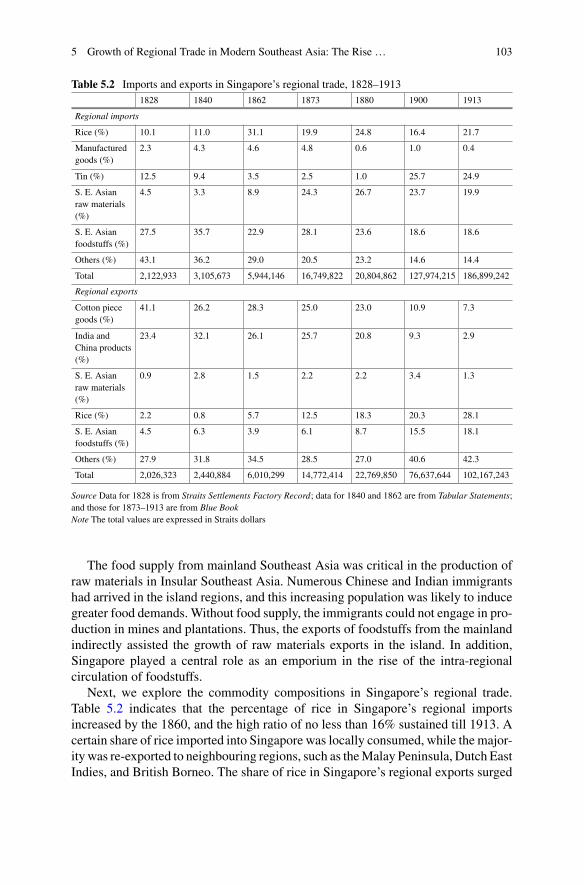
5 Growth of Regional Trade in Modern Southeast Asia: The Rise … 103
Table 5.2 Imports and exports in Singapore’s regional trade, 1828–19131828 1840 1862 1873 1880 1900 1913
Regional imports
Rice (%) 10.1 11.0 31.1 19.9 24.8 16.4 21.7
Manufacturedgoods (%)
2.3 4.3 4.6 4.8 0.6 1.0 0.4
Tin (%) 12.5 9.4 3.5 2.5 1.0 25.7 24.9
S. E. Asianraw materials(%)
4.5 3.3 8.9 24.3 26.7 23.7 19.9
S. E. Asianfoodstuffs (%)
27.5 35.7 22.9 28.1 23.6 18.6 18.6
Others (%) 43.1 36.2 29.0 20.5 23.2 14.6 14.4
Total 2,122,933 3,105,673 5,944,146 16,749,822 20,804,862 127,974,215 186,899,242
Regional exports
Cotton piecegoods (%)
41.1 26.2 28.3 25.0 23.0 10.9 7.3
India andChina products(%)
23.4 32.1 26.1 25.7 20.8 9.3 2.9
S. E. Asianraw materials(%)
0.9 2.8 1.5 2.2 2.2 3.4 1.3
Rice (%) 2.2 0.8 5.7 12.5 18.3 20.3 28.1
S. E. Asianfoodstuffs (%)
4.5 6.3 3.9 6.1 8.7 15.5 18.1
Others (%) 27.9 31.8 34.5 28.5 27.0 40.6 42.3
Total 2,026,323 2,440,884 6,010,299 14,772,414 22,769,850 76,637,644 102,167,243
Source Data for 1828 is from Straits Settlements Factory Record; data for 1840 and 1862 are from Tabular Statements;and those for 1873–1913 are from Blue BookNote The total values are expressed in Straits dollars
The food supply from mainland Southeast Asia was critical in the production ofraw materials in Insular Southeast Asia. Numerous Chinese and Indian immigrantshad arrived in the island regions, and this increasing population was likely to inducegreater food demands. Without food supply, the immigrants could not engage in pro-duction in mines and plantations. Thus, the exports of foodstuffs from the mainlandindirectly assisted the growth of raw materials exports in the island. In addition,Singapore played a central role as an emporium in the rise of the intra-regionalcirculation of foodstuffs.
Next, we explore the commodity compositions in Singapore’s regional trade.Table 5.2 indicates that the percentage of rice in Singapore’s regional importsincreased by the 1860, and the high ratio of no less than 16% sustained till 1913. Acertain share of rice imported into Singapore was locally consumed, while the major-ity was re-exported to neighbouring regions, such as theMalay Peninsula, Dutch EastIndies, and British Borneo. The share of rice in Singapore’s regional exports surged

104 A. Kobayashi
from less than 6% to more than 20% after the 1870s, replacing the commandingshares of cotton piece goods and Indian and Chinese products (Table 5.2). That is,a certain amount of mainland’s rice was transported to Singapore, and distributed tothe island regions, to satisfy the growing food demand by Chinese and Indian immi-grants, as well as local inhabitants. In addition, Table 5.2 shows that the percentageof Southeast Asian foodstuffs, including sugar, oil, and salted fish, increased afterthe 1880s, suggesting the expansion of food distribution across Southeast Asia withSingapore as its hub. Thus, after the late nineteenth century, Singapore transformedfrom a transit port for long-distance trade between the West and Asia to an empo-rium coordinating intra-regional trade, and connecting production and consumptionwithin Southeast Asia.
At the same time, there were several changes in Singapore’s mercantile activities.Until the mid-nineteenth century, local traders, such as Bugis, Malay, and Chinesetraders, carried regional produce from the neighbouring islands to Singapore, andtransacted the merchandise with Western merchants through Chinese middlemen.The establishment of such a transaction system between Asian and Western mer-chants smoothed the commodity circulations between regional and long-distancetrade in Singapore. However, within the realm of regional trade, newcomers fromChina were gradually expanding their businesses in place of native traders whowere visiting Singapore from remote islands. After 1850, the port of Singapore wasequipped with transport infrastructure: its harbour was upgraded to accommodatehuge steamships, and regular steamship lines were inaugurated, with Singapore as ahub of maritime traffic (Bogaars 1956; Boon 2013). The new transport infrastructurein Southeast Asia was vigorously used for commerce by not onlyWesternmerchants,but also Asian ones (Tan 1902; Huff 1989; Boon 2013). Furthermore, the telegraphsystem was constructed after the late nineteenth century to promote communicationamong staple cities across the globe, for which Singapore was one of the networkhubs (Latham and Neal 1983). The telegraph dramatically reduced the communi-cation time between Asia and Europe, and facilitated the exchange of commercialand political information. These technological innovations benefitted Singapore’smercantile community, particularly Chinese merchants, by enabling them to extendtheir trade to the remote islands. Until then, native traders, such as Bugis and Malaytraders, primarily conducted Singapore’s regional trade with the eastern islands,such as Borneo, Celebes, and Sumatra. Following the 1850s, however, new transportand communication tools reduced the physical and temporal distance to the east-ern islands, and alleviated hindrances faced by Singapore’s traders who wanted toadvance there in search of lucrative commerce.
In addition to improved trade infrastructure, social relationships were anotheradvantage for Chinese traders. Chinese immigrants who came to Southeast Asiaduring the high-colonial period built a society on the basis of each home province,such as Fujian, Guangdong, and Teochew, and the fellowship of each provincialgroup was close and strong (Lee 1978). We assume that the mutual trust amongthe members mitigated the risk of undertakings in Southeast Asia, and provided theopportunity of business success, even for the newcomers from China. To exploretrading operations by a Chinese petty trader, we cite an excerpt from a contemporary
5 Growth of Regional Trade in Modern Southeast Asia: The Rise … 105
article that describes trading by a Chinese peddler in the late nineteenth-centurySingapore (Tan 1902).
A new-comer from China, or a return immigrant, would scrape together from friends andother accommodating creditors sufficient means to buy a cart-load of such necessaries asrice, salt, salt-fish, tobacco, kerosene, matches, sugar, biscuits, manufactured cotton goods,umbrellas, etc., and proceed to a distant village some miles from the nearest trading centre,and at once commence operations by building a hut and planting a small vegetable gardenfor his own requirements, and opening a “kedai [shop]”. … His shop is soon the rendezvousof the natives, who resort thither on all occasions or when they have leisure. For such amongthem who possess jungle produce, such as gutta, garroo-wood, rattan, gum-damar, areca-nut, etc., the shopkeeper is ready to barter in exchange the goods of his shop. … The goodsthus obtained are carefully stored until, after a few years’ collection, the man finds he hassufficient to load two or three carts, when after first disposing of his shop, good-will, andstock-in-trade to a successor, he would start with his goods to the port of embarkation. Here[Singapore] he would dispose of them to the best advantage, pay off his creditors, and he isthen ready to take a trip to China to enjoy a holiday with his family.
The above description suggests thatChinese expatriateswho simply visited South-east Asia could start their own trading business by raising funds fromChinese fellowsand creditors without any collateral. We suppose that the trade-by-credit sale, whichwas based on the partnership amongChinese provincial groups,was aimed at expand-ing commerce from Singapore to the remote rural villages, although there may havebeen many defaults in the harsh milieu of business in Southeast Asia.
Thus, we suggest that the expansion of the geographical range of Chinese com-mercial activities through unique credit sale fuelled the circulation of merchandisebetween Singapore and Southeast Asian countries. In particular, Gregg Huff (1989)emphasises the significance of rice trade by Chinese mercantile groups in Singa-pore. According to Huff, Singapore’s Chinese merchants who imported rice fromSiam passed it to Chinese traders who exported consumer goods, including rice, toneighbouring islands in exchange for primary goods; the latter paid the former afterearning a profit from the transaction. For these Chinese merchants, it is assumedthat rice was a medium of exchange based on a solid partnership, and a way to copewith the deficiency of currency by providing liquidity for commerce. Such a chainof credit sales among the Chinese promoted the development of the intra-regionalcirculation of consumer goods centred on Singapore and raw materials exports. Insum, the formation of a transaction system for Chinese mercantile communities inSingapore and its expansion across the neighbouring countries accelerated the growthof regional trade in Southeast Asia.
5.4 Linkage with Local Trade: Pattern of Sarawak’s TradeDevelopment
In 1841, James Brooke, as Rajah appointed by the Sultan of Brunei, founded SarawakKingdom in North-Western Borneo. The ruling by the Brooke family lasted untilWorld War II. After the second half of the nineteenth century, Brooke’s Sarawak
106 A. Kobayashi
progressively took over the territory of Brunei, causing its trade to also grow (Ooi1997; Kaur 1998). Various types of primary goods were exported from Sarawak inexchange for overseas imports, such as manufactured goods, foodstuffs, and money.Amajority of Sarawak’s overseas exports were sent worldwide via Singapore, whichalso served as a route for imports. We can assume that Sarawak’s trade growthincreased through the strong connection with the regional trading system centred inSingapore. However, this close relation with Singapore was not sufficient to maintainSarawak’s trade growth. Its trade development also critically hinged on the linkagebetween overseas and local trades.
The structure of Sarawak’s trade was as follows. During its course of tradegrowth, Kuching—Sarawak’s capital—established close trade relations with Sin-gapore (Chew 1990; Kobayashi and Sugihara 2018). Manufactured goods and food-stuffs were imported into Kuching from Singapore, and in exchange, Sarawak’slocal primary goods were exported to the international market via Singapore. Asianmerchants primarily engaged in overseas trade in Kuching, and Chinese merchantsparticularly traded with Singapore. At the same time, while some imports were con-sumed by inhabitants in Kuching and its hinterlands, the rest were shipped to ruralcities through coastwise trade. Finally, these foreign products were transported toforest dwellers via a riverine from markets near an estuary to the inland villages. Inthe reverse commodity flow, forest and agricultural products delivered by local folkswere bound for Kuching via riverine and coastal trade, and finally, exported abroad.Although the coastwise and riverine trade had allegedly been controlled by Malaytraders, as Sarawak’s trade grew and strengthened the connection with Singapore,Chinese traders began to overpower native traders in terms of business, and domi-nated internal trade (Chew 1990). Most Chinese traders were small-scale peddlersand had long-term commercial relationships with Chinese merchants in Kuching,who provided funds or commodities through credit sales. Likewise, Kuching’s mer-chants were likely to hold business relations with Singapore’s Chinese merchants.Thus, consumer products imported from overseas were circulated across Sarawakthrough the chain of transactions by the Chinese traders, and Sarawak’s primarygoods were remitted to industrial countries via Singapore. Moreover, the systematiclinkage between foreign trade and domestic coastwise and riverine trade promotedtrade growth in Sarawak.
Figure 5.3 depicts the trends of foreign trade and coasting trade in Kuching from1860 to 1917. We see the synchronising growths between foreign and coasting trade;particularly, their volumesweremore or less the same before the 1890s. This suggeststhat the growth of foreign imports led to that of coasting exports through the provisionof external articles. The same relationship existed between coasting imports andforeign exports. Following the 1890s, however, a large amount of pepper producedon the outskirts of Kuching was exported without going through coasting trade, andfrom the 1910s, another commodity, a large amount of rubber was exported fromKuching and Sibu via direct steamship lines to Singapore. As a result, the growthof foreign trade left coasting trade behind, as seen in the widening gap in Fig. 5.3.
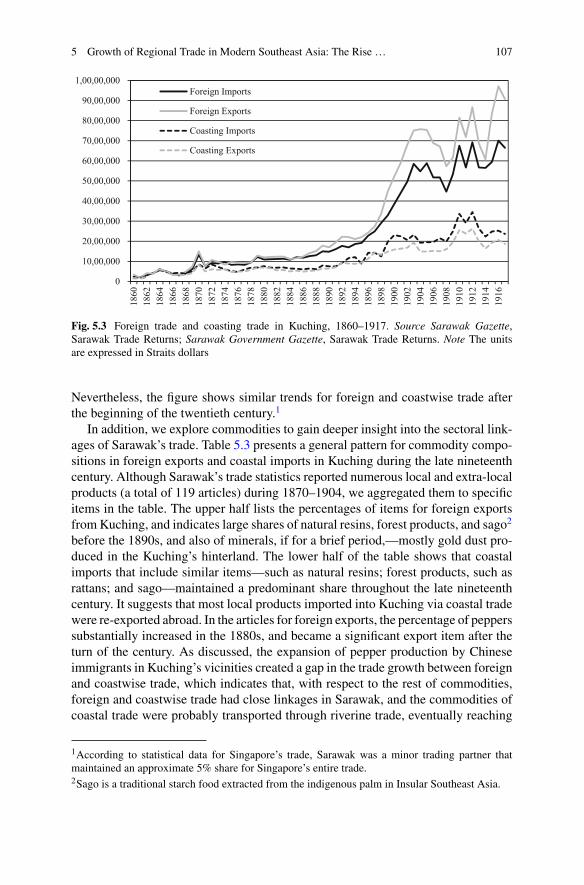
5 Growth of Regional Trade in Modern Southeast Asia: The Rise … 107
0
10,00,000
20,00,000
30,00,000
40,00,000
50,00,000
60,00,000
70,00,000
80,00,000
90,00,000
1,00,00,000
1860
1862
1864
1866
1868
1870
1872
1874
1876
1878
1880
1882
1884
1886
1888
1890
1892
1894
1896
1898
1900
1902
1904
1906
1908
1910
1912
1914
1916
Foreign Imports
Foreign Exports
Coasting Imports
Coasting Exports
Fig. 5.3 Foreign trade and coasting trade in Kuching, 1860–1917. Source Sarawak Gazette,Sarawak Trade Returns; Sarawak Government Gazette, Sarawak Trade Returns. Note The unitsare expressed in Straits dollars
Nevertheless, the figure shows similar trends for foreign and coastwise trade afterthe beginning of the twentieth century.1
In addition, we explore commodities to gain deeper insight into the sectoral link-ages of Sarawak’s trade. Table 5.3 presents a general pattern for commodity compo-sitions in foreign exports and coastal imports in Kuching during the late nineteenthcentury. Although Sarawak’s trade statistics reported numerous local and extra-localproducts (a total of 119 articles) during 1870–1904, we aggregated them to specificitems in the table. The upper half lists the percentages of items for foreign exportsfromKuching, and indicates large shares of natural resins, forest products, and sago2
before the 1890s, and also of minerals, if for a brief period,—mostly gold dust pro-duced in the Kuching’s hinterland. The lower half of the table shows that coastalimports that include similar items—such as natural resins; forest products, such asrattans; and sago—maintained a predominant share throughout the late nineteenthcentury. It suggests that most local products imported into Kuching via coastal tradewere re-exported abroad. In the articles for foreign exports, the percentage of pepperssubstantially increased in the 1880s, and became a significant export item after theturn of the century. As discussed, the expansion of pepper production by Chineseimmigrants in Kuching’s vicinities created a gap in the trade growth between foreignand coastwise trade, which indicates that, with respect to the rest of commodities,foreign and coastwise trade had close linkages in Sarawak, and the commodities ofcoastal trade were probably transported through riverine trade, eventually reaching
1According to statistical data for Singapore’s trade, Sarawak was a minor trading partner thatmaintained an approximate 5% share for Singapore’s entire trade.2Sago is a traditional starch food extracted from the indigenous palm in Insular Southeast Asia.
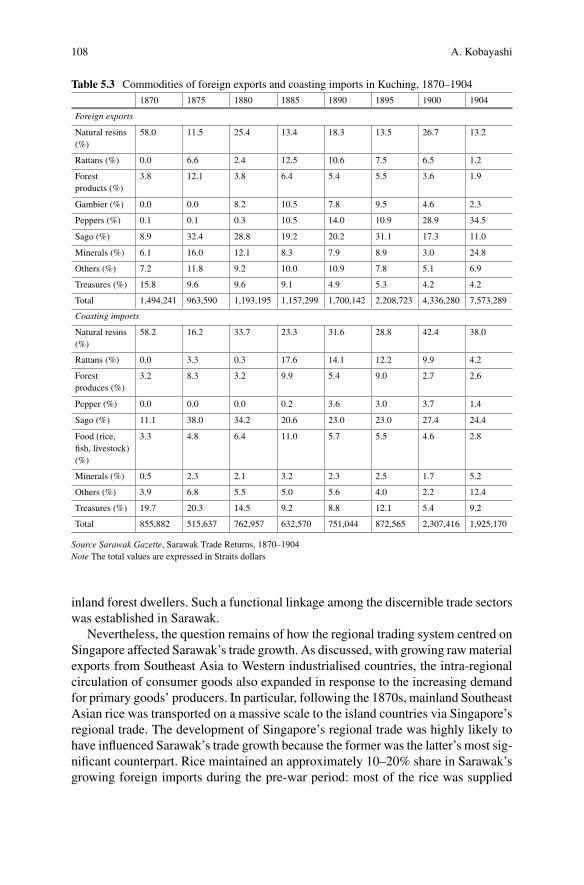
108 A. Kobayashi
Table 5.3 Commodities of foreign exports and coasting imports in Kuching, 1870–19041870 1875 1880 1885 1890 1895 1900 1904
Foreign exports
Natural resins(%)
58.0 11.5 25.4 13.4 18.3 13.5 26.7 13.2
Rattans (%) 0.0 6.6 2.4 12.5 10.6 7.5 6.5 1.2
Forestproducts (%)
3.8 12.1 3.8 6.4 5.4 5.5 3.6 1.9
Gambier (%) 0.0 0.0 8.2 10.5 7.8 9.5 4.6 2.3
Peppers (%) 0.1 0.1 0.3 10.5 14.0 10.9 28.9 34.5
Sago (%) 8.9 32.4 28.8 19.2 20.2 31.1 17.3 11.0
Minerals (%) 6.1 16.0 12.1 8.3 7.9 8.9 3.0 24.8
Others (%) 7.2 11.8 9.2 10.0 10.9 7.8 5.1 6.9
Treasures (%) 15.8 9.6 9.6 9.1 4.9 5.3 4.2 4.2
Total 1,494,241 963,590 1,193,195 1,157,299 1,700,142 2,208,723 4,336,280 7,573,289
Coasting imports
Natural resins(%)
58.2 16.2 33.7 23.3 31.6 28.8 42.4 38.0
Rattans (%) 0.0 3.3 0.3 17.6 14.1 12.2 9.9 4.2
Forestproduces (%)
3.2 8.3 3.2 9.9 5.4 9.0 2.7 2.6
Pepper (%) 0.0 0.0 0.0 0.2 3.6 3.0 3.7 1.4
Sago (%) 11.1 38.0 34.2 20.6 23.0 23.0 27.4 24.4
Food (rice,fish, livestock)(%)
3.3 4.8 6.4 11.0 5.7 5.5 4.6 2.8
Minerals (%) 0.5 2.3 2.1 3.2 2.3 2.5 1.7 5.2
Others (%) 3.9 6.8 5.5 5.0 5.6 4.0 2.2 12.4
Treasures (%) 19.7 20.3 14.5 9.2 8.8 12.1 5.4 9.2
Total 855,882 515,637 762,957 632,570 751,044 872,565 2,307,416 1,925,170
Source Sarawak Gazette, Sarawak Trade Returns, 1870–1904Note The total values are expressed in Straits dollars
inland forest dwellers. Such a functional linkage among the discernible trade sectorswas established in Sarawak.
Nevertheless, the question remains of how the regional trading system centred onSingapore affected Sarawak’s trade growth. As discussed, with growing rawmaterialexports from Southeast Asia to Western industrialised countries, the intra-regionalcirculation of consumer goods also expanded in response to the increasing demandfor primary goods’ producers. In particular, following the 1870s, mainland SoutheastAsian rice was transported on a massive scale to the island countries via Singapore’sregional trade. The development of Singapore’s regional trade was highly likely tohave influenced Sarawak’s trade growth because the former was the latter’s most sig-nificant counterpart. Rice maintained an approximately 10–20% share in Sarawak’sgrowing foreign imports during the pre-war period: most of the rice was supplied
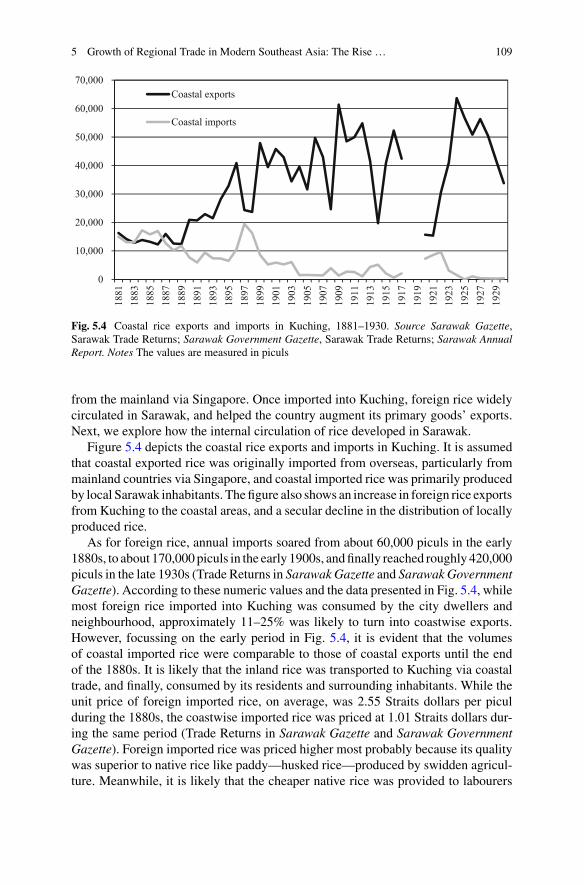
5 Growth of Regional Trade in Modern Southeast Asia: The Rise … 109
0
10,000
20,000
30,000
40,000
50,000
60,000
70,000
1881
1883
1885
1887
1889
1891
1893
1895
1897
1899
1901
1903
1905
1907
1909
1911
1913
1915
1917
1919
1921
1923
1925
1927
1929
Coastal exports
Coastal imports
Fig. 5.4 Coastal rice exports and imports in Kuching, 1881–1930. Source Sarawak Gazette,Sarawak Trade Returns; Sarawak Government Gazette, Sarawak Trade Returns; Sarawak AnnualReport. Notes The values are measured in piculs
from the mainland via Singapore. Once imported into Kuching, foreign rice widelycirculated in Sarawak, and helped the country augment its primary goods’ exports.Next, we explore how the internal circulation of rice developed in Sarawak.
Figure 5.4 depicts the coastal rice exports and imports in Kuching. It is assumedthat coastal exported rice was originally imported from overseas, particularly frommainland countries via Singapore, and coastal imported rice was primarily producedby local Sarawak inhabitants. The figure also shows an increase in foreign rice exportsfrom Kuching to the coastal areas, and a secular decline in the distribution of locallyproduced rice.
As for foreign rice, annual imports soared from about 60,000 piculs in the early1880s, to about 170,000piculs in the early 1900s, andfinally reached roughly 420,000piculs in the late 1930s (Trade Returns in SarawakGazette and SarawakGovernmentGazette). According to these numeric values and the data presented in Fig. 5.4, whilemost foreign rice imported into Kuching was consumed by the city dwellers andneighbourhood, approximately 11–25% was likely to turn into coastwise exports.However, focussing on the early period in Fig. 5.4, it is evident that the volumesof coastal imported rice were comparable to those of coastal exports until the endof the 1880s. It is likely that the inland rice was transported to Kuching via coastaltrade, and finally, consumed by its residents and surrounding inhabitants. While theunit price of foreign imported rice, on average, was 2.55 Straits dollars per piculduring the 1880s, the coastwise imported rice was priced at 1.01 Straits dollars dur-ing the same period (Trade Returns in Sarawak Gazette and Sarawak GovernmentGazette). Foreign imported rice was priced higher most probably because its qualitywas superior to native rice like paddy—husked rice—produced by swidden agricul-ture. Meanwhile, it is likely that the cheaper native rice was provided to labourers
110 A. Kobayashi
in the primary goods’ industry, and contributed to the competitiveness of export inSarawak. Thus, its circulation remained in the domestic trade until the 1880s.Accord-ingly, we can assume that the domestic trade did not just work for the dynamismof international trade as an extension that carried foreign products to natives, butalso exhibited sustained adaptability to regional demand. Until the 1880s, while theSarawak economy was responsive to the growing world economy, it maintained anautonomous system of local trade.
Nevertheless, after the 1890s, Sarawak’s economy eventually integrated into theSingapore-centred trading system. Figure 5.4 shows that the volume of coastalimported rice gradually decreased after the 1890s. Rice was scarcely imported viacoastwise trade after 1900, although around 1920, its imports temporarily increased,possibly to cope with the fall in coastal rice exports. By contrast, the volume ofcoastal exported rice from Kuching to rural cities was increasing at a rapid rate,and was expected to facilitate the expansion of the production of primary goods,such as pepper, rubber, and forest products. Due to the massive inflows of foreignrice from Singapore, local rice was no longer demanded, and thus, its domesticcirculation almost ceased. Therefore, a majority of the commercial productions inSarawak’s economy further focussed on industrial raw materials; the region inten-sively exported them to Western industrial nations in exchange for the imports ofmanufactured goods and regional foodstuffs. This was the effect of integration ofSarawak into the regional trading system centred on Singapore. Thus, Singaporeserved as an interface for Sarawak to connect with both long-distance trade with theWest and regional trade with Southeast Asia.
5.5 Conclusions
The previous sections discussed one of the trade growth patterns in nineteenth-century Southeast Asia by focussing on Singapore’s regional trade. This sectionsummarizes the above discussion.
Following its foundation in 1819, Singapore’s trade grew as a result of tran-sit trade connecting long-distance and regional trades. The initial driving force fortrade growth was the influx of British cotton goods. With Singapore at the centre,British cotton goods circulated across the region as reasonably priced consumergoods freely or even with the tariff barrier set by the Netherlands. The massiveimports of industrial products induced the growth of primary goods’ exports to theWest, thus moving the terms of trade in favour of Southeast Asia (Kobayashi 2017).In other words, by initiating the inflows of industrial products, while preserving themomentum of China-oriented trade since the eighteenth century (see Chap. 4 of thisvolume), Southeast Asian trade progressively consolidated its trade relationship withthe West in line with Singapore’s trade growth. In addition, the vigorous commerceby Asian merchants who managed Singapore’s regional trade was indispensable tothe circulation of industrial products at this time. Asian merchants’ reaction towardsthe emerging business opportunity, that is, the arrival of British industrial products,
5 Growth of Regional Trade in Modern Southeast Asia: The Rise … 111
drove the trade growth of Singapore as a new-born emporium, and the trading system,centred on Singapore, flourished by the end of the mid-nineteenth century.
Following the second half of the nineteenth century, owing to the improvementof transport infrastructure, the geographical range of Chinese mercantile activitiesexpanded to unexplored areas, such as theMalay Peninsula and Dutch ruling islands,where native traders dominated the commerce. Furthermore, after the 1870s, numer-ous Chinese and Indian immigrants began flowing into Insular Southeast Asia, andbegan to work in mines and on plantations.With the arrival of immigrants and expan-sion of raw materials production, the demand for consumer goods surged. To satisfythe rising demand for food, mainland Southeast Asia exported a large amount ofrice to the island countries via Singapore. In exchange for the supply of foodstuffs,industrial raw materials were imported into Singapore and re-exported to the West.
The final section discussed the linkage between Singapore’s regional trade andSarawak’s local trade. Sarawak’s trade grew as a result of the connectivity betweenforeign and local trades. At a glance, Sarawak’s local trade seemed to be a mereextension of the foreign trade. However, the internal circulation of rice, for example,indicates that local traders distributed the country’s commodity to fulfil local demand.Singapore’s regional trade could not exert a strong influence on Sarawak’s local tradesolely by providing industrial products. Eventually, after the 1890s, as the circulationof foreign imported rice expanded across Sarawak via local trade, the production ofraw materials for industrial economies was reinforced. Thus, the development ofSingapore’s regional trade consolidated the linkage with each country’s local trade,and as a result, the Southeast Asian economy strengthened the intra-regional tradingrelations and the connection with the West-led global economy.
References
Bogaars,G. (1956).TheTanjongPagarDockCompany, 1864–1905.Memoirs of theRafflesMuseum,3, 117–244.
Boon, G. C. (2013). Technology and entrepot colonialism in Singapore, 1819–1940. Singapore:Institute of Southeast Asian Studies.
Chew, D. (1990). Chinese pioneers on the Sarawak Frontier 1841–1941. Singapore: Oxford Uni-versity Press.
Cowan, D. C. (Ed.). (1964). The economic development of Southeast Asia: Studies in economichistory and political economy. New York: Frederick A. Praeger Publishers.
Chiang, H. D. (1978). A history of Straits Settlements foreign trade 1870–1915. Singapore: KoonWah Lithographers.
Drabble, J. H., & Drake, P. J. (1981). The British agency houses inMalaysia: Survival in a changingworld. Journal of Southeast Asian Studies, 12(2), 297–328.
Drabble, J. H. (2000). An economic history of Malaysia, c. 1800–1990: The transition to moderneconomic growth. London: Macmillan Press Ltd.
Huff, G. W. (1989). Bookkeeping barter, money, credit, and Singapore’s international rice trade,1870–1939. Explorations in Economic History, 26, 161–189.
Huff, G. W. (1994). The economic growth of Singapore: Trade and development in the twentiethcentury. New York: Cambridge University Press.
112 A. Kobayashi
Kaur, A. (1998). Economic change in East Malaysia: Sabah and Sarawak since 1850. London:Macmillan Press Ltd.
Kobayashi, A. (2013). The role of Singapore in the growth of intra-Southeast Asian trade, c.1820s–1852. Southeast Asian Studies, 2(3), 443–474.
Kobayashi, A. (2017). Price fluctuations and growth patterns in Singapore’s trade, 1831–1913.Australian Economic History Review, 57(1), 108–129.
Kobayashi, A., & Sugihara, K. (2018). Changing Patterns of Sarawak Exports, c. 1870–2013. InN. Ishikawa & R. Soda (Eds.), Anthropogenic tropical forest, Chapter 27. Singapore: SpringerNature.
Korthals-Altes, W. L. (1991). Changing economy in Indonesia, Vol. 12a, General trade statistics1822–1940. Amsterdam: Royal Tropical Institute.
Latham, A. J. H., & Neal, L. (1983). The international market in rice and wheat, 1868–1914.Economic History Review, 36, 260–280.
Lee, P. P. (1978).Chinese society in nineteenth century Singapore. KualaLumpur:OxfordUniversityPress.
Li, Tana. (2004). The late-eighteenth and early nineteenth-century Mekong Delta in the regionaltrade system. In N. Cooke & T. Li (Eds.),Water frontier, commerce and the Chinese in the LowerMekong Region, 1750–1880 (pp. 71–84). Singapore: Rowman & Littlefield Publishers Inc.
Lindblad, T. J. (2002). The outer islands in the 19th century: Contest for the periphery. In H. Dick,V. Houben, T. Lindblad, & T. Kian (Eds.), The emergence of a national economy: An economichistory of Indonesia, 1800–2000 (pp. 82–110). Honolulu: Allen & Unwin.
Maddison, A., & Prince, G. (Eds.). (1989). Economic growth in Indonesia, 1820–1940. Dordrecht:Foris Publications.
Mckeown, A. (2004). Global migration, 1846–1940. Journal of World History, 15(2), 155–189.Murray, M. J. (1980). The development of capitalism in colonial Indochina (1870–1940). Berkeley,Los Angeles, London: University of California Press.
Ooi,KeatGin. (1997).Of free trade and native interests: TheBrookes and the economic developmentof Sarawak, 1841–1941. Kuala Lumpur: Oxford University Press.
Owen, N. G. (1971). The rice industry of mainland South East Asia 1850–1914. The Journal of theSiam Society, 59(2), 75–143.
Sugihara, K. (1996). Ajiakan Boeki no Keisei to Kozo (patterns and development of Intra-AsianTrade). Kyoto: Minerva Shobo.
Sugihara, K. (2005). Patterns of Chinese Emigration to Southeast Asia, 1869–1939. In K. Sug-ihara (Ed.), Japan, China, and the Growth of the Asian International Economy, 1850–1949(pp. 244–274). Oxford: Oxford University Press.
Saw, S. H. (1969). Population trends in Singapore, 1819–1967. Journal of Southeast Asian History,10(1), 36–49.
Tan, T. S. (1902). Chinese local trade. The Straits Chinese Magazine, 6(23), 89–97.Trocki, C. A. (1979). Prince of pirates: The Temenggongs and the development of Johor andSingapore 1784–1885. Singapore: NUS Press.
Turnbull, M. C. (1977). A history of Singapore 1819–1975. London: Oxford University Press.Van der Kraan, A. (1998). Contest for the Java cotton trade, 1811–40: An episode in Anglo-Dutchrivalry. Occasional Paper No. 32, The University of Hull, Centre for South-East Asian Studies.
Warren, J. F. (1981).The Sulu Zone 186–1898: The dynamics of external trade, slavery, and ethnicityin the transformation of a Southeast Asian maritime state. Singapore: Singapore University Press.
Wong, L. K. (1960). The trade of Singapore 1819–69. Journal of Malaysian Branch of Royal AsiaticSociety, 33(4), 1–135.
Wong, L. K. (1978). Singapore: Its growth as an entrepot port, 1819–1941. Journal of SoutheastAsian Studies, 15(1), 50–84.
5 Growth of Regional Trade in Modern Southeast Asia: The Rise … 113
Statistical Sources
Bluebook for the colonyof the Straits Settlements, trade returns for the years, 1868–1913. Singapore:Government of the Straits Settlements.
Sarawak Gazette. Sarawak trade returns for the year, 1870–1907.Sarawak Government Gazette. Sarawak trade returns for the year, 1908–1917.Sarawak annual report of the Department of Trade and Customs for the year, 1920–1940.Straits Settlements Factory Records, record no. G/34/160.Sumatra Factory Records, record no. G/35/51.Tabular statements of the commerce and shipping of Singapore, 1839–1865. Calcutta: MilitaryOrphan Press.
Open Access This chapter is licensed under the terms of the Creative Commons Attribution-NonCommercial-NoDerivatives 4.0 International License (http://creativecommons.org/licenses/by-nc-nd/4.0/), which permits any noncommercial use, sharing, distribution and reproduction in anymedium or format, as long as you give appropriate credit to the original author(s) and the source,provide a link to the Creative Commons licence and indicate if you modified the licensed material.You do not have permission under this licence to share adapted material derived from this chapteror parts of it.
The images or other third party material in this chapter are included in the chapter’s CreativeCommons licence, unless indicated otherwise in a credit line to the material. If material is notincluded in the chapter’s Creative Commons licence and your intended use is not permitted bystatutory regulation or exceeds the permitted use, you will need to obtain permission directly fromthe copyright holder.
Chapter 6Labour-Intensive Industrializationand the Emerging State in Pre-war Japan
Masayuki Tanimoto
6.1 Introduction
It is widely asserted that the “success” of emerging states in Asia rested on the adop-tionof a development strategybasedon export-oriented insteadof import-substitutionindustrialization. In fact, the growth of export trade that started with labour-intensiveproducts seems to have played a significant role in fostering the emerging economiesand states beginning in the 1970s, especially in East and Southeast Asia.
On the other hand, it is also widely known that the Meiji government, establishedthrough the Meiji Restoration in 1868, adopted “Shokusan-kogyo seisaku”, or theeconomic policy of encouraging new industries as a means of catching up with the“advanced” states in the West. In fact, the government tried to transplant brand-newindustrial technologies and institutions, such as mechanized cotton spinning mills,iron works, shipyards, arsenals, and so on. It is clear that these newly transplantedand more or less capital-intensive industries targeted to promote import substitu-tion. If they played a central role for Japan’s economic development after the MeijiRestoration from 1868 onwards, how can we evaluate the role of export-orientedindustrialization in Japan’s development, a distinctive example of emerging stateprior to WWII?
Based on the recent literature discussing the multi-layered nature of Japan’s eco-nomic development,
1this chapter reconsiders the significant role of labour-intensive
industrialization in pre-war Japan. In doing so, the chapter specifically examines its
1 In regard with the term “multi-layered nature of Japan’s economic development”, see Sawai andTanimoto (2016), 148–149. I also keep the discussion about “balancedgrowth”, initiated byTakafusaNakamura, in mind. See Nakamura (1971/1983).
M. Tanimoto (B)Graduate School of Economics, Faculty of Economics, The University of Tokyo,Bunkyo-ku, Tokyo 113-0033, Japane-mail: [email protected]
© The Author(s) 2019K. Otsuka and K. Sugihara (eds.), Paths to the Emerging State in Asia and Africa,Emerging-Economy State and International Policy Studies,https://doi.org/10.1007/978-981-13-3131-2_6
115
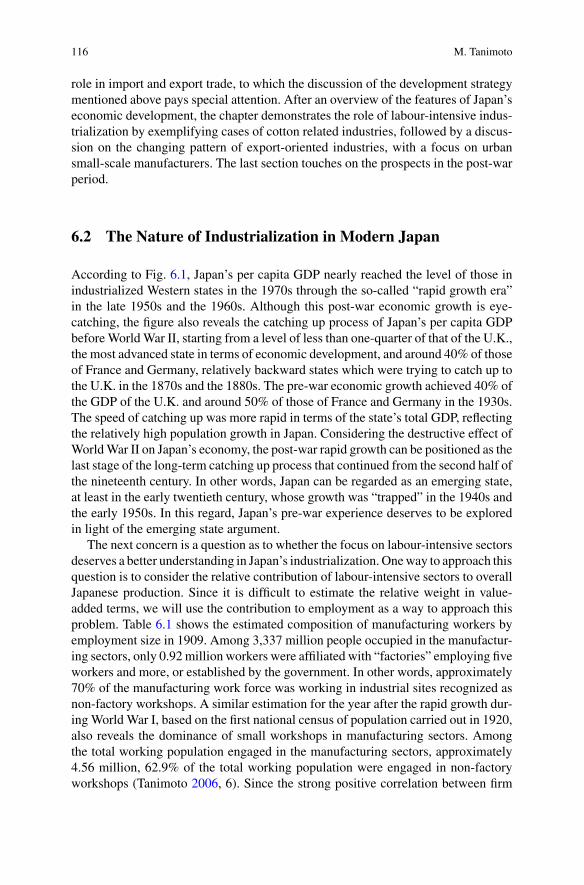
116 M. Tanimoto
role in import and export trade, to which the discussion of the development strategymentioned above pays special attention. After an overview of the features of Japan’seconomic development, the chapter demonstrates the role of labour-intensive indus-trialization by exemplifying cases of cotton related industries, followed by a discus-sion on the changing pattern of export-oriented industries, with a focus on urbansmall-scale manufacturers. The last section touches on the prospects in the post-warperiod.
6.2 The Nature of Industrialization in Modern Japan
According to Fig. 6.1, Japan’s per capita GDP nearly reached the level of those inindustrialized Western states in the 1970s through the so-called “rapid growth era”in the late 1950s and the 1960s. Although this post-war economic growth is eye-catching, the figure also reveals the catching up process of Japan’s per capita GDPbeforeWorldWar II, starting from a level of less than one-quarter of that of the U.K.,the most advanced state in terms of economic development, and around 40% of thoseof France and Germany, relatively backward states which were trying to catch up tothe U.K. in the 1870s and the 1880s. The pre-war economic growth achieved 40% ofthe GDP of the U.K. and around 50% of those of France and Germany in the 1930s.The speed of catching up was more rapid in terms of the state’s total GDP, reflectingthe relatively high population growth in Japan. Considering the destructive effect ofWorldWar II on Japan’s economy, the post-war rapid growth can be positioned as thelast stage of the long-term catching up process that continued from the second half ofthe nineteenth century. In other words, Japan can be regarded as an emerging state,at least in the early twentieth century, whose growth was “trapped” in the 1940s andthe early 1950s. In this regard, Japan’s pre-war experience deserves to be exploredin light of the emerging state argument.
The next concern is a question as to whether the focus on labour-intensive sectorsdeserves a better understanding in Japan’s industrialization. Oneway to approach thisquestion is to consider the relative contribution of labour-intensive sectors to overallJapanese production. Since it is difficult to estimate the relative weight in value-added terms, we will use the contribution to employment as a way to approach thisproblem. Table 6.1 shows the estimated composition of manufacturing workers byemployment size in 1909. Among 3,337 million people occupied in the manufactur-ing sectors, only 0.92million workers were affiliated with “factories” employing fiveworkers and more, or established by the government. In other words, approximately70% of the manufacturing work force was working in industrial sites recognized asnon-factory workshops. A similar estimation for the year after the rapid growth dur-ing World War I, based on the first national census of population carried out in 1920,also reveals the dominance of small workshops in manufacturing sectors. Amongthe total working population engaged in the manufacturing sectors, approximately4.56 million, 62.9% of the total working population were engaged in non-factoryworkshops (Tanimoto 2006, 6). Since the strong positive correlation between firm
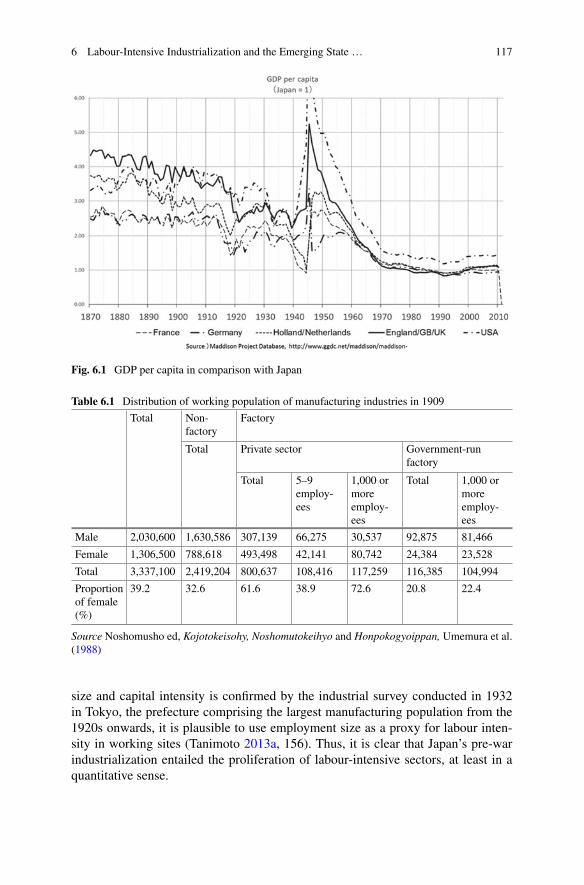
6 Labour-Intensive Industrialization and the Emerging State … 117
Fig. 6.1 GDP per capita in comparison with Japan
Table 6.1 Distribution of working population of manufacturing industries in 1909
Total Non-factory
Factory
Total Private sector Government-runfactory
Total 5–9employ-ees
1,000 ormoreemploy-ees
Total 1,000 ormoreemploy-ees
Male 2,030,600 1,630,586 307,139 66,275 30,537 92,875 81,466
Female 1,306,500 788,618 493,498 42,141 80,742 24,384 23,528
Total 3,337,100 2,419,204 800,637 108,416 117,259 116,385 104,994
Proportionof female(%)
39.2 32.6 61.6 38.9 72.6 20.8 22.4
Source Noshomusho ed, Kojotokeisohy, Noshomutokeihyo and Honpokogyoippan, Umemura et al.(1988)
size and capital intensity is confirmed by the industrial survey conducted in 1932in Tokyo, the prefecture comprising the largest manufacturing population from the1920s onwards, it is plausible to use employment size as a proxy for labour inten-sity in working sites (Tanimoto 2013a, 156). Thus, it is clear that Japan’s pre-warindustrialization entailed the proliferation of labour-intensive sectors, at least in aquantitative sense.
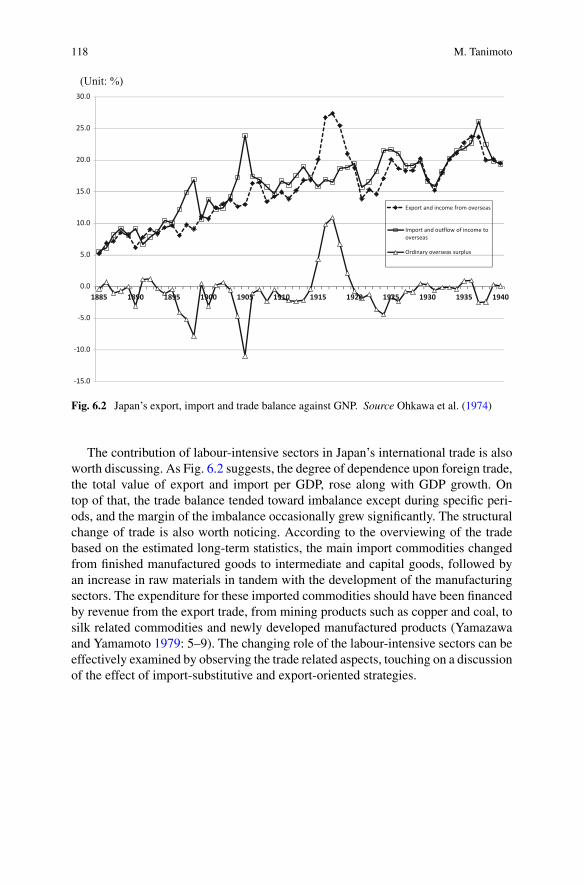
118 M. Tanimoto
(Unit: %)
-15.0
-10.0
-5.0
0.0
5.0
10.0
15.0
20.0
25.0
30.0
1885 1890 1895 1900 1905 1910 1915 1920 1925 1930 1935 1940
Export and income from overseas
Import and ou low of income tooverseas
Ordinary overseas surplus
Fig. 6.2 Japan’s export, import and trade balance against GNP. Source Ohkawa et al. (1974)
The contribution of labour-intensive sectors in Japan’s international trade is alsoworth discussing. As Fig. 6.2 suggests, the degree of dependence upon foreign trade,the total value of export and import per GDP, rose along with GDP growth. Ontop of that, the trade balance tended toward imbalance except during specific peri-ods, and the margin of the imbalance occasionally grew significantly. The structuralchange of trade is also worth noticing. According to the overviewing of the tradebased on the estimated long-term statistics, the main import commodities changedfrom finished manufactured goods to intermediate and capital goods, followed byan increase in raw materials in tandem with the development of the manufacturingsectors. The expenditure for these imported commodities should have been financedby revenue from the export trade, from mining products such as copper and coal, tosilk related commodities and newly developed manufactured products (Yamazawaand Yamamoto 1979: 5–9). The changing role of the labour-intensive sectors can beeffectively examined by observing the trade related aspects, touching on a discussionof the effect of import-substitutive and export-oriented strategies.
6 Labour-Intensive Industrialization and the Emerging State … 119
6.3 The Role of Labour-Intensive Sectors in Pre-war Japan
6.3.1 The Cotton Industry for Import Substitution2
It is well known that the Opening of the Ports in 1859, the end of the “seclusionpolicy” of Tokugawa Shogunate, had a great impact on the cotton industry in Japan’sarchipelago. In fact, the increase in English cotton cloth grew to occupy nearly 40%of the domestic market for cotton cloth in the early 1870s. However, the proportion ofimported cotton cloth to domestic cotton demand had begun to decrease in the mid-1870s, and fell to around 10% before 1880. On the other hand, as Table 6.2 shows,the volume of imported cotton yarn exceeded cotton cloth during the latter half of the1870s. This transformation, from importing finished goods to intermediate goods,suggests a structural change in the production aspects of cotton goods in Japan’sarchipelago.
What happened were drastic re-organizations of the industry. The importation ofcotton yarn almost eliminated domestic hand-spun yarn from the yarn market. Natu-rally, as it provided material for spinning, cotton cultivation also suffered. However,it was not before the late 1880s that cotton cultivation in Japan had clearly declined,since the self-use of cotton for spinning and weaving continued in a certain portionof peasant households. It was the penetration of ‘new’ cotton cloths produced in thedomestic weaving districts, which were relatively cheap as well as suitable to con-sumers in Japan, that ruled out the self-use production of cloth in the rural areas. Theappearance of these ‘new’ cloths showed the consequences of the re-organization ofthe cotton weaving districts, the other phase of re-organization of the cotton industry.
Unlike imported cloth, imported yarn that came from England at the early stage,followed by British Indian yarn in the next stage, provided weaving districts withthe opportunity to survive, or even develop. The relative low price of machine-madeimported yarn enabled theweaving districts to realize competitive prices compared toimported cloth, as well as to develop a new kind of cloth, whose quality was differentfrom those made of hand-spun yarn (Tamura 2004). The import substitution of thecloths can be accounted for by the response of these weaving districts, and thesedistricts could have been prosperous under the circumstances of themarket expansionfor cloth in the 1870s. Based on this transformation, Japan’s cotton industry starteddevelopment of both weaving and spinning sectors. The former provided the marketthat was indispensable for establishment of the latter. However, there was a hugedifference in terms of the production form within the industry. Regarding this as amulti-layered structure, we will see their development from the 1880s onwards inthe light of labour-intensive industrialization.
When it comes to the cotton weaving industry, producers were divided into twodifferent categories. One comprised weaving mills that were attached to the cottonspinning companies that emerged in the late 1880s, at the earliest. Such mills wereequippedwith British orNorthAmerican power looms, and they employed numerous
2The first half of this section is based on Tanimoto (2006, 2009).
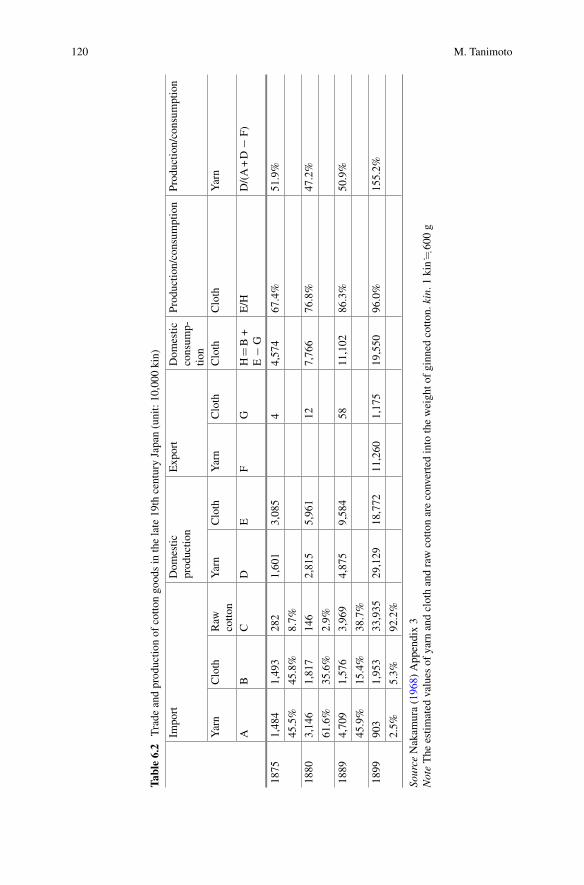
120 M. Tanimoto
Table6.2
Trade
andproductio
nof
cotto
ngoodsin
thelate19th
centuryJapan(unit:10,000
kin)
Import
Dom
estic
productio
nExport
Dom
estic
consum
p-tio
n
Productio
n/consum
ption
Productio
n/consum
ption
Yarn
Cloth
Raw
cotto
nYarn
Cloth
Yarn
Cloth
Cloth
Cloth
Yarn
AB
CD
EF
GH
�B+
E−
GE/H
D/(A+D
−F)
1875
1,484
1,493
282
1,601
3,085
44,574
67.4%
51.9%
45.5%
45.8%
8.7%
1880
3,146
1,817
146
2,815
5,961
127,766
76.8%
47.2%
61.6%
35.6%
2.9%
1889
4,709
1,576
3,969
4,875
9,584
5811,102
86.3%
50.9%
45.9%
15.4%
38.7%
1899
903
1,953
33,935
29,129
18,772
11,260
1,175
19,550
96.0%
155.2%
2.5%
5.3%
92.2%
Source
Nakam
ura(1968)
Appendix3
NoteThe
estim
ated
values
ofyarn
andclothandrawcotto
nareconvertedinto
theweighto
fginned
cotto
n.kin.
1kin�600g
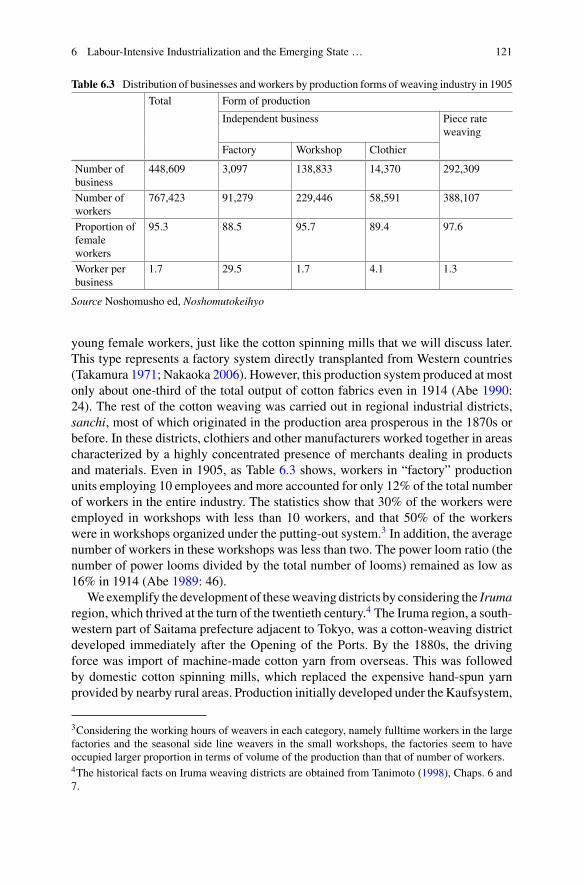
6 Labour-Intensive Industrialization and the Emerging State … 121
Table 6.3 Distribution of businesses and workers by production forms of weaving industry in 1905
Total Form of production
Independent business Piece rateweaving
Factory Workshop Clothier
Number ofbusiness
448,609 3,097 138,833 14,370 292,309
Number ofworkers
767,423 91,279 229,446 58,591 388,107
Proportion offemaleworkers
95.3 88.5 95.7 89.4 97.6
Worker perbusiness
1.7 29.5 1.7 4.1 1.3
Source Noshomusho ed, Noshomutokeihyo
young female workers, just like the cotton spinning mills that we will discuss later.This type represents a factory system directly transplanted from Western countries(Takamura 1971; Nakaoka 2006). However, this production system produced at mostonly about one-third of the total output of cotton fabrics even in 1914 (Abe 1990:24). The rest of the cotton weaving was carried out in regional industrial districts,sanchi, most of which originated in the production area prosperous in the 1870s orbefore. In these districts, clothiers and other manufacturers worked together in areascharacterized by a highly concentrated presence of merchants dealing in productsand materials. Even in 1905, as Table 6.3 shows, workers in “factory” productionunits employing 10 employees and more accounted for only 12% of the total numberof workers in the entire industry. The statistics show that 30% of the workers wereemployed in workshops with less than 10 workers, and that 50% of the workerswere in workshops organized under the putting-out system.3 In addition, the averagenumber of workers in these workshops was less than two. The power loom ratio (thenumber of power looms divided by the total number of looms) remained as low as16% in 1914 (Abe 1989: 46).
We exemplify the development of theseweaving districts by considering the Irumaregion, which thrived at the turn of the twentieth century.4 The Iruma region, a south-western part of Saitama prefecture adjacent to Tokyo, was a cotton-weaving districtdeveloped immediately after the Opening of the Ports. By the 1880s, the drivingforce was import of machine-made cotton yarn from overseas. This was followedby domestic cotton spinning mills, which replaced the expensive hand-spun yarnprovided by nearby rural areas. Production initially developed under the Kaufsystem,
3Considering the working hours of weavers in each category, namely fulltime workers in the largefactories and the seasonal side line weavers in the small workshops, the factories seem to haveoccupied larger proportion in terms of volume of the production than that of number of workers.4The historical facts on Iruma weaving districts are obtained from Tanimoto (1998), Chaps. 6 and7.
122 M. Tanimoto
where rural factors collected and purchased fabrics from weavers scattered aroundvillages. At the end of the 1880s, however, the putting-out system, then a new wayof organizing production in Japan, replaced the Kaufsystem. This was accompaniedby an increase in the total volume of production. Putting-out continued to be theprevalent form of production organization until the mid-1920s. In this form, thedirect producer, a Chin-ori (literally, a ‘piece rate wage weaver’) was supplied withdyed and warped yarn by the putting-out master, or clothier, and the producer wovefabrics according to a piece rate.
This transformation from the Kaufsystem to putting-out was triggered by compe-tition in themarket. Since cost reduction through the introduction of power loomswasnot a feasible choice because imported power looms were too expensive, it becamevital for clothiers to enhance their competitive edge through improving the quality oftheir products. Under these circumstances, the putting-out system based on the sup-ply of yarn served to improve the quality using standardized materials. Moreover, theclothier was able to provide wage-weavers with detailed market information, such astexture and design of fabrics, by supplying dyed, warped yarn, which played a pivotalrole in the evaluation of product quality. The introduction and implementation of theputting-out system should then be seen as an adaptation strategy to emerging marketconditions.
This case indicates that the newly introduced dispersed production system basedon labour-intensive technology, weaving with a hand-loom, worked as a promoter ofindustrial development in modern Japan. It is also noticeable that this type of indus-trial growth was accompanied by a concentration of related traders within a relativelynarrow area. The activities of clothiers were supported by merchants engaged in pro-viding materials or selling products, dyers, and financial institutions, as well as tradeassociations and institutions of vocational education. Indeed, in Iruma, we can con-firm the agglomeration of merchants and dyers in Tokorozawa town, a local centre inthis area, together with the establishment of two trade associations and a local bank.The association also ran a small training school for dying skills in the 1900s. Thiswas the formation of an industrial district, distinguished from a mere concentrationof producers.
Around 1910, clothiers trying to introduce power looms emerged in certain weav-ing districts such as Izumi (Osaka prefecture), Chita (Aichi prefecture), Enshu(Shizuoka prefecture) (Abe 1989). Although this trend worked to transform theproduction form from putting-out to a factory system, it is worthwhile noticingthat almost all power-looms introduced in these weaving districts were domesticallymanufactured machines whose prices were one third or less of imported Britishor North American power looms. Manufacturers near the leading weaving districtsexploited low costmachines, substitutingwooden staffs formetal parts to save expen-sive iron materials(Minami et al. 1982; Suzuki 1996). Since the relatively low priceof domestic power looms lowered the barrier for clothiers to establish a machineequipped weaving factory, small scale factories proliferated in certain weaving dis-tricts from the 1910s onwards. Therefore, the introduction of domestic power-loomsand establishment of small and medium sized factories in these cases, where thecapital equipment rate was still lower than in full scale weaving factories, can be
6 Labour-Intensive Industrialization and the Emerging State … 123
recognized as a continuous path of industrial development up to the 1930s, ratherthan a transformation from a labour-intensive to capital-intensive path.
In contrast, the Osaka Spinning Corporation was the first cotton spinning millequipped with British spinning machines, comprising tens of thousands of spindlesand employing several hundreds of spinners. Following its success, the proliferationof cotton spinning factories from the late 1880s onwards was apparently the capital-intensive path of industrialization, considering the amount of fixed capital requiredfor machines and the facilities of a mill. In fact, almost all the spinning firms of thistype adopted the newly introduced model of a joint stock company, rallying morethan a hundred investors to cover the fixed cost. However, it is alsoworth emphasizingthat the invested capital should have brought about high profits because the interestrate, or the price of capital, was relatively high in contemporary Japan, as is oftenthe case in an industrializing economy. Continuous operation of factories was thekey, and the assimilation of the technological knowledge by Japanese engineers,together with the provision of repair parts based on metal processing skills amongdomestic craftsmen, enabled the reduction of idle time caused by machine troubles(Nakaoka 2006, Chap. 5). On top of that, operation time was increased by adoptingday and night shifts. Even though the night shift was costly because of the extrawage and the deterioration of workers’ attentiveness, enhancing capital turnover wasessential for higher return on equity (ROE). In other words, the capital-labour ratioof spinning mills tended to be lowered by increasing labour input through the doubleshift system (Takamura 1971; Sugihara 2013). It is also worth mentioning that theadoption of ring spindles from the late 1880s, which contributed to enhance totalfactor productivity of the spinning firms, was accompanied by the introduction ofcotton mixing processes which required further labour inputs (Otsuka et al. 1988,Chap. 3). Thus, the labour-intensive nature can be discussed even in the case of exacttransplantation of the Western factory system.
It is also noticeable that both sectors of the cotton industry, weaving and spinning,commonly depended on rural farming households as their source of workers. Theorder list of Takizawa Kumakichi, a leading putting-out master in Iruma, revealsthat almost all the orders were directed to nearby farming villages, concentratingspecifically in the middle layer of farming households there. In other words, pieceweavers existed within the households that were inclined toward agriculture. In fact,the orders placedwith the piece weavers by Takizawas showed strong and continuousseasonal fluctuations that clearly reflected the nature of this source of labour. Indeed,orders in May and June accounted for less than 10% of the yearly totals in almost allthe years from 1896 to 1920. It is not surprising that the seasonal fluctuations in timedevoted to weaving were inversely related to the labour demand for farming withinpeasant households. The May–June period was harvest time in the region for wheatand tea, and peak season for silkworm breeding (for springtime).
In contrast, workers in cotton spinningmills came from the lower layer of farminghouseholds, whose cultivating lands were smaller than those in the middle layer.The well-known industrial report, Orimono Shokko Jijo (The Working Conditionsof Weaving Workers), published by the central government in 1903, pointed outa distinction between the ‘factory’ pattern of labour organizations and that of the
124 M. Tanimoto
“peasant’s side-line business”. The report stated that “It is more beneficial for localwomen to weave fabrics according to a piece rate at home than to work for thefactory that binds them for a long period of time. Therefore, in general, femaleworkers at weaving factories are looked down upon in villages”.5 The report alsorecognized two separate sources of labour in the following remark: “Today, mostof the local women employed at factories seem to come from financially-pressedfamilies” (ditto). In fact, spinningmills organized a recruiting systemseeking juvenilefemale workers with low opportunity costs, who were expected to exist in the lowerlayer of farming households scattered among rural villages that were usually far awayfrom the location of the spinningmills in urban areas. As factory statistics6 reveal, theages of female workers were highly concentrated under 25; in 1909, more than halfwere teenagers. The duration of their factory workwas limited to their younger years,followed by re-inclusion in either farming or urban households as a household head’sspouse, usually under the plural self-employment system. Although their workingsites differed from home to factory, the underlying logic of labour provision wascommon, determined by the labour allocation strategy formed in each household.
Thus, the development of the cotton industry in late nineteenth to early twentiethcentury Japan strongly entailed the nature of labour-intensive industrialization beingalso effective for import substitution of cotton manufactured goods from Britain,British India, and other Western states. On the other hand, it is important to recallthat the development of the cotton industry itself was a major factor in the growingtrade imbalance. The key factor was importation of raw cotton fromBritish India andthe US, as already suggested in Table 6.2. The balance of payments for cotton relatedtrade (the difference between the excess of exports in yarn and cloth and the excessof imports of raw cotton and cotton related machines) was apparently constantlynegative, forming themajor cause of the trade imbalance shown in Fig. 6.2 (Ushijimaand Abe 1996). Although the cotton industry in those years could meet the growingdomestic demand, it did not have a competitive edge in the rich market of Europeand North America. In this context, the significant role of export-oriented industriesin financing the payments created by the growth of the import trade comes up. Thenext section discusses the dynamism of labour-intensive sectors in export-relatedindustries.
6.3.2 Dynamism of Export-Oriented Industries7
It is well known that textiles constituted the largest part of Japan’s export tradeduring the pre-World War II period. Raw silk (silk thread) was continuously Japan’ssingle largest export until the early 1930s. The second largest export item shifted
5Cited from reprinted version; Noshomusho (1903/1998), vol. 2, p. 178.6Kojotokeihyo (Statistical Tables of Factories) edited by Noshomusho (Ministry of Agriculture andCommerce).7This section is mainly based on Tanimoto (2013a), 162–166.
6 Labour-Intensive Industrialization and the Emerging State … 125
from silk cloth to cotton yarn in the early 1890s, and then to cotton cloth afterWorld War I. Despite their significant role, textiles did not monopolize exports. Thesum of various consumer goods (hereafter, miscellaneous goods) other than textilescontributed a considerable proportion of manufactured exports, although individualcategories accounted for only small proportions. Indeed, by the 1930s, the combinedexport output of the following products made them joint contenders with cotton clothor yarn for the second biggest export position:matches, knitted goods, hats, footwear,buttons, accessories, ceramics, glassware, enamel ironware, straw plaits, fancy mats,Western-style umbrellas, brushes, trunks, and toys.8
Apart from the volume, the changing patterns in the composition of export-oriented miscellaneous industries were also noteworthy. We can roughly distinguishthree categories among the miscellaneous exports in Fig. 6.3, defined by the timingof their respective places in the export supply. Ceramics and lacquerware comprisedthe first category, with exports beginning soon after Japan’s opening of ports in 1859.The second category comprised goods whose exports surged in the 1880s, includingmatches, trunks, straw plaits, and fancy mats, and accounted for a significant part ofaggregate exports from the 1880s to the 1900s. It is notable that the export of thesegoods commonly decreased sharply in the 1920s, and were unable to recover theirposition in the export trade throughout the interwar period. The third category com-prised accessories, knitting goods, glassware, enamel ironware, and toys, exports ofwhich increased gradually from the 1880s, surged during World War I, and main-tained an almost constant level in the 1920s. In the 1930s, there was a rapid increasein the export of some of these goods; for instance, toys, which we will focus on later.
Behind the shifting composition of these sales, there was an evolutionary pro-cess in production, such as changes in technology or location. The miscellaneousgoods exported soon after the opening of the ports were characterized as traditionalcraft products, which attracted an overseas consumer market with a particular tastefor Japanese style. Their production system, including technologies, skills, and thenature ofworkers,must have been inherited largely from theTokugawaperiod.On theother hand, the straw plaits and fancymats that made up 40% ofmiscellaneous goodsexports during the late 19th century were inferior goods to those available in overseasmarkets, such as carpets in the US. In addition, Japanese matches were regarded inSouth and East Asia as inferior goods to those imported from Europe. With regardto the system of production, a large portion of the output of straw plaits and fancymats was produced as a side line by peasant households. Furthermore, even wherethe factory system had been adopted, it was established in the countryside and wasbased on handicraft technology with indigenous materials. In contrast, matches wereproduced mainly in urban settings, using imported technology. However, both typesof production systems commonly involved a widely available source of labour—un-skilled females—to produce relatively simple, uniform products. In this sense, theywere typical labour-intensive industries but entirely different from the traditionalcrafts industry that employed skilled male workers.
8For the sources of historical information on each commodity, see the footnotes of Tanimoto (1995).
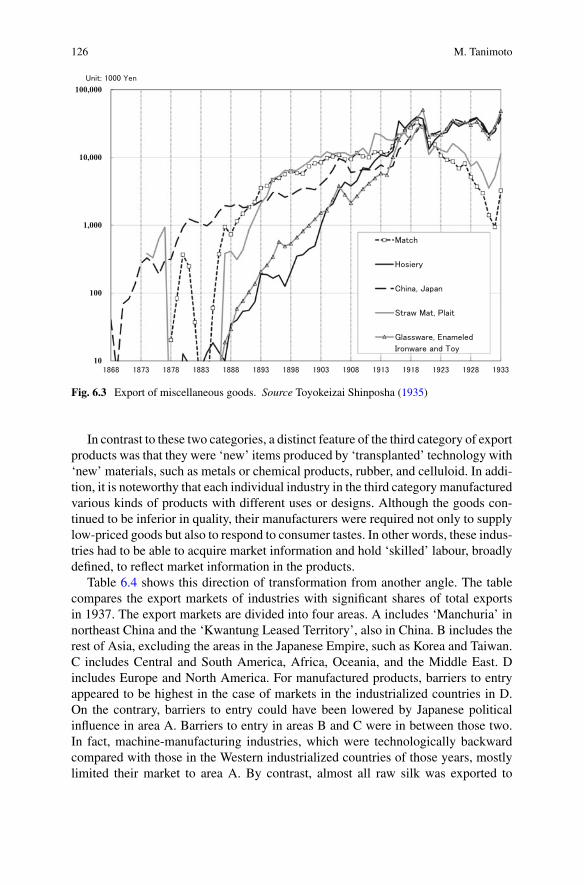
126 M. Tanimoto
10
100
1,000
10,000
100,000
Fig. 6.3 Export of miscellaneous goods. Source Toyokeizai Shinposha (1935)
In contrast to these two categories, a distinct feature of the third category of exportproducts was that they were ‘new’ items produced by ‘transplanted’ technology with‘new’ materials, such as metals or chemical products, rubber, and celluloid. In addi-tion, it is noteworthy that each individual industry in the third category manufacturedvarious kinds of products with different uses or designs. Although the goods con-tinued to be inferior in quality, their manufacturers were required not only to supplylow-priced goods but also to respond to consumer tastes. In other words, these indus-tries had to be able to acquire market information and hold ‘skilled’ labour, broadlydefined, to reflect market information in the products.
Table 6.4 shows this direction of transformation from another angle. The tablecompares the export markets of industries with significant shares of total exportsin 1937. The export markets are divided into four areas. A includes ‘Manchuria’ innortheast China and the ‘Kwantung Leased Territory’, also in China. B includes therest of Asia, excluding the areas in the Japanese Empire, such as Korea and Taiwan.C includes Central and South America, Africa, Oceania, and the Middle East. Dincludes Europe and North America. For manufactured products, barriers to entryappeared to be highest in the case of markets in the industrialized countries in D.On the contrary, barriers to entry could have been lowered by Japanese politicalinfluence in area A. Barriers to entry in areas B and C were in between those two.In fact, machine-manufacturing industries, which were technologically backwardcompared with those in the Western industrialized countries of those years, mostlylimited their market to area A. By contrast, almost all raw silk was exported to
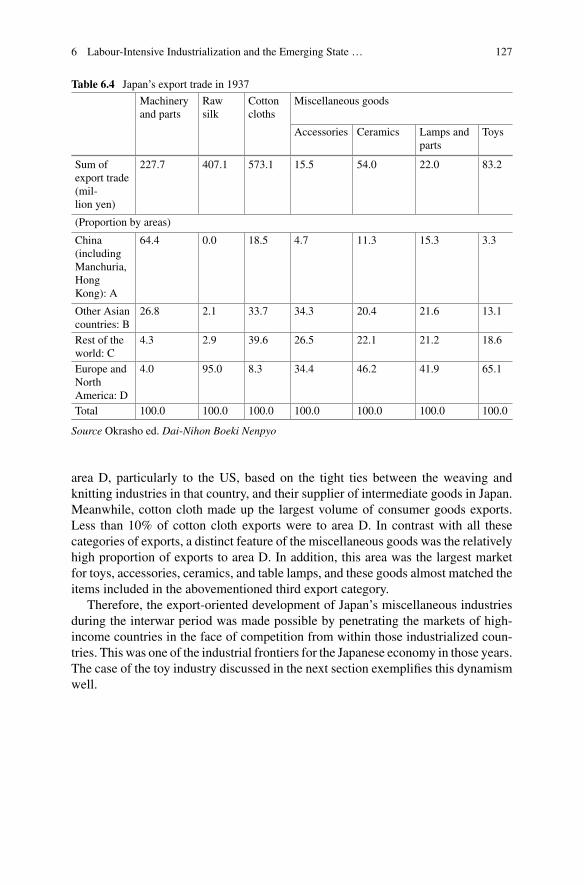
6 Labour-Intensive Industrialization and the Emerging State … 127
Table 6.4 Japan’s export trade in 1937
Machineryand parts
Rawsilk
Cottoncloths
Miscellaneous goods
Accessories Ceramics Lamps andparts
Toys
Sum ofexport trade(mil-lion yen)
227.7 407.1 573.1 15.5 54.0 22.0 83.2
(Proportion by areas)
China(includingManchuria,HongKong): A
64.4 0.0 18.5 4.7 11.3 15.3 3.3
Other Asiancountries: B
26.8 2.1 33.7 34.3 20.4 21.6 13.1
Rest of theworld: C
4.3 2.9 39.6 26.5 22.1 21.2 18.6
Europe andNorthAmerica: D
4.0 95.0 8.3 34.4 46.2 41.9 65.1
Total 100.0 100.0 100.0 100.0 100.0 100.0 100.0
Source Okrasho ed. Dai-Nihon Boeki Nenpyo
area D, particularly to the US, based on the tight ties between the weaving andknitting industries in that country, and their supplier of intermediate goods in Japan.Meanwhile, cotton cloth made up the largest volume of consumer goods exports.Less than 10% of cotton cloth exports were to area D. In contrast with all thesecategories of exports, a distinct feature of the miscellaneous goods was the relativelyhigh proportion of exports to area D. In addition, this area was the largest marketfor toys, accessories, ceramics, and table lamps, and these goods almost matched theitems included in the abovementioned third export category.
Therefore, the export-oriented development of Japan’s miscellaneous industriesduring the interwar period was made possible by penetrating the markets of high-income countries in the face of competition from within those industrialized coun-tries. This was one of the industrial frontiers for the Japanese economy in those years.The case of the toy industry discussed in the next section exemplifies this dynamismwell.
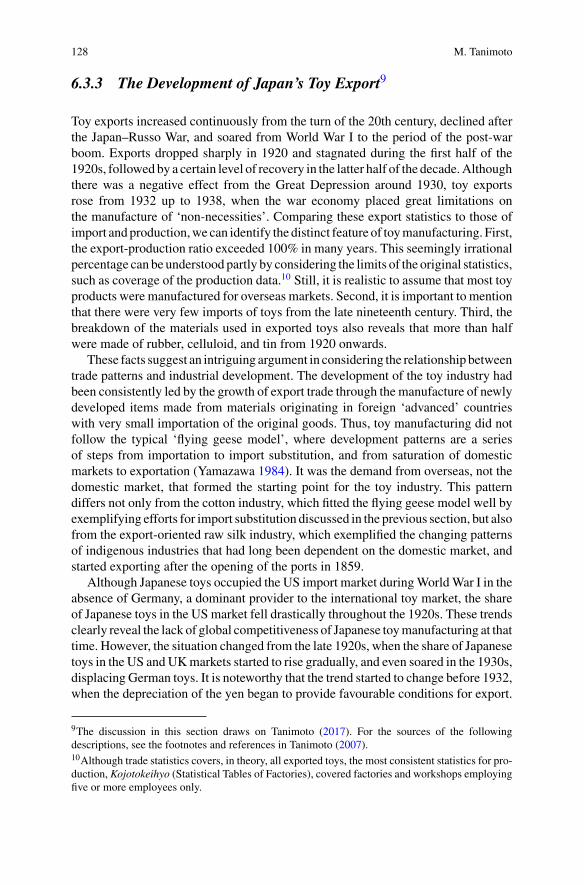
128 M. Tanimoto
6.3.3 The Development of Japan’s Toy Export9
Toy exports increased continuously from the turn of the 20th century, declined afterthe Japan–Russo War, and soared from World War I to the period of the post-warboom. Exports dropped sharply in 1920 and stagnated during the first half of the1920s, followed by a certain level of recovery in the latter half of the decade.Althoughthere was a negative effect from the Great Depression around 1930, toy exportsrose from 1932 up to 1938, when the war economy placed great limitations onthe manufacture of ‘non-necessities’. Comparing these export statistics to those ofimport andproduction,we can identify the distinct feature of toymanufacturing. First,the export-production ratio exceeded 100% in many years. This seemingly irrationalpercentage can be understood partly by considering the limits of the original statistics,such as coverage of the production data.10 Still, it is realistic to assume that most toyproducts were manufactured for overseas markets. Second, it is important to mentionthat there were very few imports of toys from the late nineteenth century. Third, thebreakdown of the materials used in exported toys also reveals that more than halfwere made of rubber, celluloid, and tin from 1920 onwards.
These facts suggest an intriguing argument in considering the relationship betweentrade patterns and industrial development. The development of the toy industry hadbeen consistently led by the growth of export trade through the manufacture of newlydeveloped items made from materials originating in foreign ‘advanced’ countrieswith very small importation of the original goods. Thus, toy manufacturing did notfollow the typical ‘flying geese model’, where development patterns are a seriesof steps from importation to import substitution, and from saturation of domesticmarkets to exportation (Yamazawa 1984). It was the demand from overseas, not thedomestic market, that formed the starting point for the toy industry. This patterndiffers not only from the cotton industry, which fitted the flying geese model well byexemplifying efforts for import substitution discussed in the previous section, but alsofrom the export-oriented raw silk industry, which exemplified the changing patternsof indigenous industries that had long been dependent on the domestic market, andstarted exporting after the opening of the ports in 1859.
Although Japanese toys occupied the US import market duringWorldWar I in theabsence of Germany, a dominant provider to the international toy market, the shareof Japanese toys in the USmarket fell drastically throughout the 1920s. These trendsclearly reveal the lack of global competitiveness of Japanese toymanufacturing at thattime. However, the situation changed from the late 1920s, when the share of Japanesetoys in the US andUKmarkets started to rise gradually, and even soared in the 1930s,displacing German toys. It is noteworthy that the trend started to change before 1932,when the depreciation of the yen began to provide favourable conditions for export.
9The discussion in this section draws on Tanimoto (2017). For the sources of the followingdescriptions, see the footnotes and references in Tanimoto (2007).10Although trade statistics covers, in theory, all exported toys, the most consistent statistics for pro-duction, Kojotokeihyo (Statistical Tables of Factories), covered factories and workshops employingfive or more employees only.
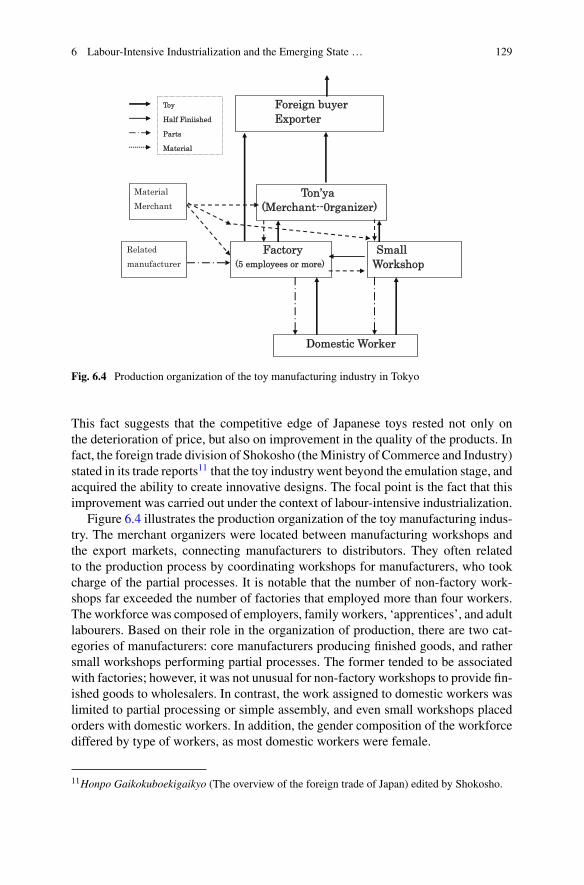
6 Labour-Intensive Industrialization and the Emerging State … 129
Fig. 6.4 Production organization of the toy manufacturing industry in Tokyo
This fact suggests that the competitive edge of Japanese toys rested not only onthe deterioration of price, but also on improvement in the quality of the products. Infact, the foreign trade division of Shokosho (theMinistry of Commerce and Industry)stated in its trade reports11 that the toy industry went beyond the emulation stage, andacquired the ability to create innovative designs. The focal point is the fact that thisimprovement was carried out under the context of labour-intensive industrialization.
Figure 6.4 illustrates the production organization of the toy manufacturing indus-try. The merchant organizers were located between manufacturing workshops andthe export markets, connecting manufacturers to distributors. They often relatedto the production process by coordinating workshops for manufacturers, who tookcharge of the partial processes. It is notable that the number of non-factory work-shops far exceeded the number of factories that employed more than four workers.The workforce was composed of employers, family workers, ‘apprentices’, and adultlabourers. Based on their role in the organization of production, there are two cat-egories of manufacturers: core manufacturers producing finished goods, and rathersmall workshops performing partial processes. The former tended to be associatedwith factories; however, it was not unusual for non-factory workshops to provide fin-ished goods to wholesalers. In contrast, the work assigned to domestic workers waslimited to partial processing or simple assembly, and even small workshops placedorders with domestic workers. In addition, the gender composition of the workforcediffered by type of workers, as most domestic workers were female.
11Honpo Gaikokuboekigaikyo (The overview of the foreign trade of Japan) edited by Shokosho.
130 M. Tanimoto
The origin of the competitive edge of the toy manufacturing industry lay in thisorganizational character. In fact, it was usual to economize labour cost by subcon-tracting to domestic workers. The employment of juvenile workers as ‘apprentices’might have also had a similar effect on the labour cost of small-scale workshops.However, toys were not the kind of goods whose demand was determined mostlyby price. They were subject to fashion, and supplier had to match or even developthe taste of consumers in order to increase their sales. In this context, it is rathernotable that each category of actor—merchant organizer, factory workshop, andnon-factory workshop—included firms that had the ability to design the goods. Therecords of the registration of designs and devices, held either at the National PatentOffice or by the trade association of toy manufacturing, reveal that firms in each ofthese three sometimes succeeded in registering theirs ideas. In other words, severalsmall workshops, as well as merchant organizers and “factories”, were capable ofcreating the original models of products. Therefore, we should not simply assumethat the relationship between merchant organizer and manufacturer, or between con-signer and consignee among manufacturers, was complementary or exploited thedivision of labour. While the influential merchant organizer vertically coordinatedthe production process under its own control, there were manufacturers, includingnon-factory workshops, who designed and produced finished goods on their ownaccounts. These manufacturers sometimes held relatively strong positions in thenegotiation processes with merchant organizers. The relationship between merchantorganizers and manufacturers included competition on the same grounds, as well astransactions based on the vertical division of labour. Thus, the production organiza-tion of the toy manufacturing industry was by no means static for the traders, andthis competitive nature among traders was maintained through vigorous new entriesthat resulted from the establishment of independent workshops, as a product of thelife course of the workers.
In addition to the endogenous factor of the organization, we can point out someother external factors that support the competitive edge of the industry. One of theconspicuous features of the toy manufacturing industry was the agglomeration ofthe traders within a relatively small area. For example, in Tokyo, the centre of toyproduction from the 1920s onwards, the location of more than 40 merchant organiz-ers in 1933 was almost entirely limited to only two blocks in the commercial area.Metal toy manufacturers were concentrated in three blocks, with 39 in one block(Umayabashi). The situation was almost the same for celluloid toy manufacturers.The highly concentrated location of traders suggests the positive effects of agglom-eration, reminding us of the arguments of Alfred Marshall and others regarding theeffects of external economies in industrial clusters (Marshall 1920). For instance,for merchant organizers, proximity to other traders engaged in the same industrymight have increased their opportunities to acquire market information, which wasindispensable for the sale of fashionable goods. The agglomeration also facilitateddevelopment of the division of labour among traders, which might have increasedthe productivity of the industry.
6 Labour-Intensive Industrialization and the Emerging State … 131
Moreover, it was noticeable that traders located within each cluster were notlimited to toy traders. In fact, as the directory of celluloid traders of 1939 indicates, itis better to say that celluloid toy workshops were located within the agglomeration oftraders of various celluloid goods. This appears to have been true of traders inmetal orrubber toys as well. These facts suggest that the traders might have moved in amongindustries that used the same material. Indeed, by matching the trade directories ofdifferent years, we can confirm that several celluloid toy manufacturers changedtheir product to other celluloid goods during the course of time and vice versa. Thisflexibility among traders appears to have relieved the blows of market fluctuations.Although this buffer function was probably limited, as market trends of the industrieswould not have been inversely correlated to compensate for the slump of the otherindustry, it might have provided more opportunities to survive, at least for traderswith a relatively high ability to respond to the unstable economic environment.
Meanwhile, the coexistence of related industries in the same area was impor-tant for the toy traders as well. Mould producers were a typical example. In order toacquire the fruits of product innovation, it was vital for traders to possess the moulds.However, a relatively high level of skills was required to produce the moulds, andit was rather difficult for the traders, particularly small workshops, to internalizethis process. In this situation, the mould ‘factories’ generated within the agglomer-ation of metal-processing workshops near the agglomeration of toy traders, or themould-processing workshops whose locations overlapped with those of celluloid toymanufacturers, played an important role in actualizing the originally generated ideasas real products. Similar roles were played in the areas of businesses that requiredrelatively high skills, such asmanufacturing springs and gears, and printing tin plates.The agglomeration of related industries provided complementary factors that wereindispensable to the development of the dispersed production organization based onsmall workshops. Thus, the competitive edge of toy production was largely rootedin its location in urban settings, specifically the metropolis of Tokyo. In fact, as isseen in the following section, Tokyo became the largest industrial city comprisingthe agglomeration of various kinds of small scale workshops in the interwar period.
6.3.4 The Structure of Small-Scale Industries in InterwarTokyo
Table 6.5 is based on data extracted from an industrial census conducted by theTokyo Municipal Office in 1932 (Kogyo Chosa-sho).12 It indicates the proportionof small workshops run on a self-employment basis in the manufacturing sector. Inlight of the number and composition of workers, workshops with 2,000–4,999 yenof capital appear to be the upper threshold for self-employment-based workshops.These workshops comprised 87.7% of all workshops and factories, and employed
12The following discussion on the structure of small-scale industries is a summary of Tanimoto(2013a), 154–162.
132 M. Tanimoto
49.3% of all workers. It is apparent that family workers, including employers, playedsignificant roles in theworkforce. Thehighproportion of ‘apprentices’ recorded in thecensus is also striking. There were more ‘apprentices’ than ‘labourers’. This impliesthat these workshops depended greatly on workers other than ‘labourers’, who werethe main work force of the large factories. On the other hand, we can estimate by theindustrial census thatmore than half of theworkshops belonging to the layer of capitalof 2,000–4,999 yen were equipped with prime movers. Although the difference inper capita fixed capital according to scale was clear, small workshops were notsimple equivalents of the traditional handicraft manufacturing industry. Thus, not afew small workshops were engaged in processing newly introduced materials withrelatively small fixed capital; in other words, resting their production more on labourthan on capital when compared with large factories. In this sense, we can certainlyregard small workshops as being labour-intensive. How then did labour-intensiveworkshops manage to survive or even develop in the face of the competition withcapital-intensive factories? To tackle this question, let us focus on the nature of theirworkforce.
As mentioned above, small workshops had three types of workers: ‘family work-ers’, ‘labourers’, and ‘apprentices’. With respect to gender, we should point out thehigh proportion of male workers, accounting for more than 70% in each type. Thisgender bias contrasts to that of the textile industries in both types of factories, aswell as in side-line jobs, and suggests the different nature of the workforce in urbansmall-scale industries. On the other hand, it is noteworthy that the age range clearlydiffered according to the composition of the workforce. The number of ‘apprentices’,which is the highest among the three main categories of workers, was greatest amongteenage workers, accounting for two-thirds of the workers in the same age group. Incontrast, ‘family workers’, including employers, accounted for more than 80% of theworkers over the age of 30. In between were the ‘labourers’, who accounted for thehighest number of workers in their twenties, but the smallest number of workers over-all. These facts enable us to suggest that a strong tendency existed to change one’sindustrial status from that of an ‘apprentice’ to ‘labourer’, and from ‘labourer’ to‘family worker (employer)’. The latter change implies the existing intention amongemployees to be independent by establishing their own workshops, and the formersuggests the importance of skill formation to become a full-fledged worker.
According to an industrial survey carried out in 1936 in Tokyo,13 more than70% of the manufacturers across 26 trades replied that they required more thantwo years of training. In the case of six of these trades, more than 40% of themanufacturers claimed that a period of five years of training was necessary. This isin sharp contrast to the case of “domestic workers” in the same survey. Half of thedomestic workers could work without any training, and another quarter could workwith trainingof less thanonemonth.These observationsmake it clear that aworkforcewith a certain level of skill was required for the small workshops, and this attribute ofthe workforce provided the foundation for an ‘apprentice’ being distinguished froma mere ‘juvenile labourer’. We do not possess any concrete evidence to confirm that
13Tokyo Municipal Office ed. (1937).
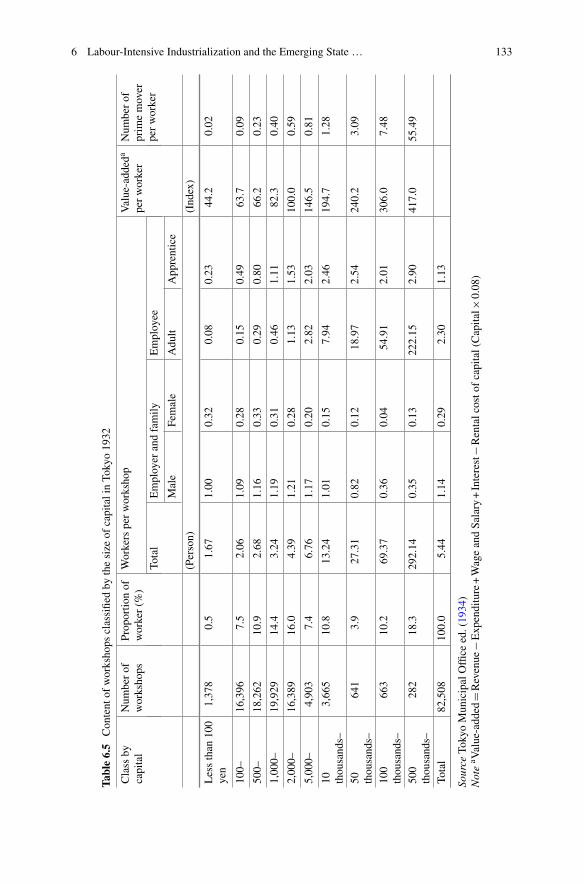
6 Labour-Intensive Industrialization and the Emerging State … 133
Table6.5
Content
ofworkshops
classifiedby
thesize
ofcapitalinTo
kyo1932
Class
bycapital
Num
berof
workshops
Proportio
nof
worker(%
)Workersperworkshop
Value-added
a
perworker
Num
berof
prim
emover
perworker
Total
Employer
andfamily
Employee
Male
Female
Adult
Apprentice
(Person)
(Index)
Lessthan
100
yen
1,378
0.5
1.67
1.00
0.32
0.08
0.23
44.2
0.02
100–
16,396
7.5
2.06
1.09
0.28
0.15
0.49
63.7
0.09
500–
18,262
10.9
2.68
1.16
0.33
0.29
0.80
66.2
0.23
1,000–
19,929
14.4
3.24
1.19
0.31
0.46
1.11
82.3
0.40
2,000–
16,389
16.0
4.39
1.21
0.28
1.13
1.53
100.0
0.59
5,000–
4,903
7.4
6.76
1.17
0.20
2.82
2.03
146.5
0.81
10 thousands–
3,665
10.8
13.24
1.01
0.15
7.94
2.46
194.7
1.28
50 thousands–
641
3.9
27.31
0.82
0.12
18.97
2.54
240.2
3.09
100
thousands–
663
10.2
69.37
0.36
0.04
54.91
2.01
306.0
7.48
500
thousands–
282
18.3
292.14
0.35
0.13
222.15
2.90
417.0
55.49
Total
82,508
100.0
5.44
1.14
0.29
2.30
1.13
Source
TokyoMunicipalOffice
ed.(1934)
Notea V
alue-added
�Revenue
−Expenditure+WageandSalary+Interest
−Rentalcosto
fcapital(Capita
l×0.08)
134 M. Tanimoto
an institutionalized apprenticeship with a formal training period or restriction of jobentry was effectively operating in these trades at that time. However, we can probablyassume that substantial needs existed for the training of workers, and it was naturalthat some system, though not a formal institution, emerged to meet the demand. Thefact that the word ‘apprentice’ was commonly used in the official investigation mightbe evidence that one existed.
An investigation of the “apprentices”, which was conducted around 1938 andbased on 3,768 samples, including 2,990 males, supports this speculation.14 Theinvestigation reveals that more than half of the male juveniles intended to undergotraining at the workplace. Judging from the data on age, working period, and theexperience of changing jobs, it appears that a majority of the male ‘apprentices’had worked at the same workshop for at least two years. These findings are almostconsistent with the data on the training period mentioned above. On the other hand,as we see in the following part of this section, the low wages of these juvenileworkers were profitable for the employers. The employers also needed ‘apprentices’for cheap labour. Though we do not possess any further information for analysingthe equilibrium between the cost of training and low wages, we can probably assumethat being trained as an ‘apprentice’ during their teens, albeit informally, was builtinto the early stage of the life course of the workers in the small-scale industries.
What was the outcome of these small workshops? Table 6.5 presents the averagevalue-added labour productivity of the workshops in each layer. Since income datatended to be underreported for fear of tax liability, the calculated value-added maybe understated. Despite this, great differences between the layers in value-addedproductivity are apparent. For example, the average productivity of theworkshops (orrather, factories) with the largest capital of 500 thousand yen or more, was recordedas four times higher than those with capital of 2,000–4,999 yen. Labour productivityincreased in accordance with the increase in capital employed. Therefore, the higherphysical productivity of labour achieved by utilizingmachines or primemoversmightaccount for most of the productivity differential. In other words, the market valueof the products of the small-scale workshops could not compensate fully for theirrelatively low physical productivity. Although some products might have realizedhigher market value based on unique technology or skills, in general, the small-scale workshops should be recognized as an industrial sector with relatively lowproductivity.
However, the difference in productivity was not the decisive factor underminingthe competitiveness of the small workshops. Their earnings, after deduction of costsincluding wages, can be caluculated from this industrial census. It is clear that scalegreatly influenced earnings, since the earnings of the small workshops were signifi-cantly below the wages of labourers employed in the large-scale factories. However,it should be noted that the earnings of workshops capitalized at 2,000–4,999 yen ormore apparently exceeded the highest wages of the labourers employed. Even theearnings of the next layer down, with capital of 1,000–1,999 yen, almost equalledthe second highest wage level of factory labourers. This level of earnings might not
14Tokyo Prefectural Office (1939).
6 Labour-Intensive Industrialization and the Emerging State … 135
have discouraged employed labourers from establishing their own workshops. Infact, the wages of employees in workshops whose capital were under 10,000 yen,and which employed more than half of the total employees, could not reach the levelof earnings mentioned above. This implied that employees with lower wages hadno chance of increasing their income as long as they remained employees, given thelow possibility for workers to move from small workshops to large ones. Therefore,establishing one’s ownworkshopmust have appeared as a promising option, althoughit involved considerable risks. The differential wages according to the scale of work-shops, which also reflected small workshops’ use of juvenileworkers as ‘apprentices’(as mentioned above), enabled small workshops to earn a certain amount, althoughtheir value-added labour productivity was considerably lower than that of large-scale factories. On the other hand, this motivated adult labourers to establish theirown workshops.
In summary, we may assume a particular life course of workers employed inurban industries. Teenaged males worked in small workshops, undergoing on-the-job training and acquiring a certain level of skills. After being employed in theirtwenties as adult labourers, some of them might succeed, possibly with some luck,in establishing their own workshops. It was this shared perspective of a certain lifecourse that enabled the skill formation and lowwage compatibility in urban industrialsettings.
6.3.5 Prospects to the Post-war Development
Thus, the development of urban small-scale industries represented the dynamicnature of labour-intensive industrialization in pre-war Japan. Specifically, export-oriented manufacturing sectors such as toy making showed distinctive growth inthe 1930s, driving the relatively faster recovery of the Japanese economy from theGreat Depression.
On the other hand, it is plausible that the “success” of these export-oriented indus-tries intrinsically entailed tension between Japan and its trading partners, or amongtrade rivals. In fact, it is well known that the expansion of cotton textiles exportsto South and Southeast Asia in the 1930s resulted in a bilateral trade negotiationbetween Japan and Britain, British India and the Netherlands, the colony and thesuzerain states. Regarding urban toys, the United States imposed more than 100%duties in 1930 (converted to an ad valorem tax). Even Britain, which had advocateda free trade regime, imposed 15–25% ad valorem duties on Japanese toys in the1930s.15 Furthermore, the progress of the controlled economy following the out-break of Sino-Japan war from 1937 onwards suppressed the manufacturing sectorsproducing consuming goods irrelevant to military needs. In fact, the production ofexport-oriented goods such as toys, textile goods and ceramics deteriorated signifi-cantly under the war-economy from the late 1930s to 1945.
15Regarding duties imposed on Japan’s exported toys, see Tanimoto (2013b), 61.
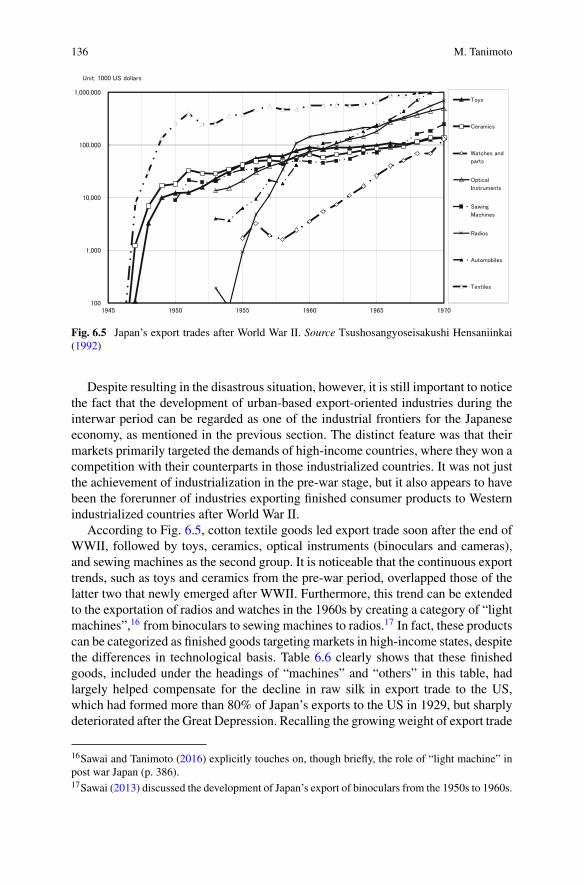
136 M. Tanimoto
Fig. 6.5 Japan’s export trades after World War II. Source Tsushosangyoseisakushi Hensaniinkai(1992)
Despite resulting in the disastrous situation, however, it is still important to noticethe fact that the development of urban-based export-oriented industries during theinterwar period can be regarded as one of the industrial frontiers for the Japaneseeconomy, as mentioned in the previous section. The distinct feature was that theirmarkets primarily targeted the demands of high-income countries, where they won acompetition with their counterparts in those industrialized countries. It was not justthe achievement of industrialization in the pre-war stage, but it also appears to havebeen the forerunner of industries exporting finished consumer products to Westernindustrialized countries after World War II.
According to Fig. 6.5, cotton textile goods led export trade soon after the end ofWWII, followed by toys, ceramics, optical instruments (binoculars and cameras),and sewing machines as the second group. It is noticeable that the continuous exporttrends, such as toys and ceramics from the pre-war period, overlapped those of thelatter two that newly emerged after WWII. Furthermore, this trend can be extendedto the exportation of radios and watches in the 1960s by creating a category of “lightmachines”,16 from binoculars to sewing machines to radios.17 In fact, these productscan be categorized as finished goods targeting markets in high-income states, despitethe differences in technological basis. Table 6.6 clearly shows that these finishedgoods, included under the headings of “machines” and “others” in this table, hadlargely helped compensate for the decline in raw silk in export trade to the US,which had formed more than 80% of Japan’s exports to the US in 1929, but sharplydeteriorated after the Great Depression. Recalling the growing weight of export trade
16Sawai and Tanimoto (2016) explicitly touches on, though briefly, the role of “light machine” inpost war Japan (p. 386).17Sawai (2013) discussed the development of Japan’s export of binoculars from the 1950s to 1960s.
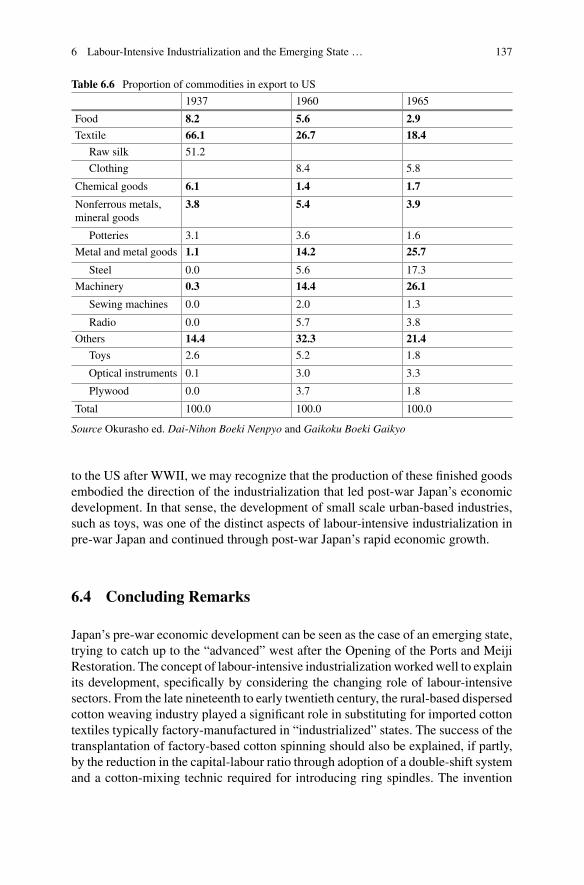
6 Labour-Intensive Industrialization and the Emerging State … 137
Table 6.6 Proportion of commodities in export to US
1937 1960 1965
Food 8.2 5.6 2.9
Textile 66.1 26.7 18.4
Raw silk 51.2
Clothing 8.4 5.8
Chemical goods 6.1 1.4 1.7
Nonferrous metals,mineral goods
3.8 5.4 3.9
Potteries 3.1 3.6 1.6
Metal and metal goods 1.1 14.2 25.7
Steel 0.0 5.6 17.3
Machinery 0.3 14.4 26.1
Sewing machines 0.0 2.0 1.3
Radio 0.0 5.7 3.8
Others 14.4 32.3 21.4
Toys 2.6 5.2 1.8
Optical instruments 0.1 3.0 3.3
Plywood 0.0 3.7 1.8
Total 100.0 100.0 100.0
Source Okurasho ed. Dai-Nihon Boeki Nenpyo and Gaikoku Boeki Gaikyo
to the US after WWII, we may recognize that the production of these finished goodsembodied the direction of the industrialization that led post-war Japan’s economicdevelopment. In that sense, the development of small scale urban-based industries,such as toys, was one of the distinct aspects of labour-intensive industrialization inpre-war Japan and continued through post-war Japan’s rapid economic growth.
6.4 Concluding Remarks
Japan’s pre-war economic development can be seen as the case of an emerging state,trying to catch up to the “advanced” west after the Opening of the Ports and MeijiRestoration. The concept of labour-intensive industrialization workedwell to explainits development, specifically by considering the changing role of labour-intensivesectors. From the late nineteenth to early twentieth century, the rural-based dispersedcotton weaving industry played a significant role in substituting for imported cottontextiles typically factory-manufactured in “industrialized” states. The success of thetransplantation of factory-based cotton spinning should also be explained, if partly,by the reduction in the capital-labour ratio through adoption of a double-shift systemand a cotton-mixing technic required for introducing ring spindles. The invention
138 M. Tanimoto
of narrow-sized power-looms made from a mixture of iron and wood, saving theexpensive iron parts, was another example of the capital-saving way of assimilatingimported technologies.
On the other hand, the development of import-substitutive industries, such ascotton related manufacturing, had to be complemented by export-oriented industriesto relax the trade imbalance caused by the increase in imports, consisting of rawmaterials and, in some cases, advanced machines; in the case of the cotton industry,these were raw cotton and spinning machines. The urban-based, export-orientedsmall-scale industries deserve special attention in this regard. Their growth in theinterwar period supported the expansion of export trade, particularly in the 1930s,compensating for the decline of raw silk, which was previously the major componentof exports. They based the labour force on male workers with a certain level ofskills acquired by being a kind of apprentice when they were young. The potentialpossibilities of moving from employees to employers through the establishment oftheir own workshops encouraged juvenile workers to invest in skill formation, andmade them tolerate relatively lowwage levels, both supporting the competitiveness inthe world market. Thus, the composition of the workforce was distinctively differentfrom the textile industry, which had been the major labour-intensive industry upto the interwar period, endowing Japan’s labour-intensive industrialization with itsdynamic nature.
In fact, it was in a new wave of export trade targeting mainly the demands ofhigh-income countries where they won a competition with their counterparts in thoseindustrialized countries. On one hand, this achievement might have resulted in caus-ing, at least partly, a rural-urban divide in domestic settings,18 and trade conflict inan international sphere. This can be seen as comparable to the concept of the “middleincome trap” in the contemporary emerging states argument, since Japan’s economybecame stagnant and even deteriorated from the late 1930s to 1940s because of thewar economy. At the same time, the achievement of the pre-war stage can be regardedas the basis for industries exporting finished consumer products to Western industri-alized countries afterWorldWar II, the emergence of new competitive products frombinoculars to watches, and probably to home electronics appliance and transportationmachines. In this sense, the perspective of labour-intensive industrialization is opento the post-war rapid economic growth, the last stage of the Japanese economy as anemerging state.
18There are quite a few discussions on this issue in diverse streams of literature from pre-war periodto the present. For brief overviewing of the discussions underlying the literature, see Minami et al.(1998).
6 Labour-Intensive Industrialization and the Emerging State … 139
References
Abe, T. (1989). Nihon niokeru Sanchi Menorimonogyo no Tenkai (The development of cottonweaving districts in Japan). Tokyo: Tokyodaigaku Shuppankai.
Abe, T. (1990). Menkogyo (Cotton manufacturing industry). In S. Nishikawa & T. Abe (Eds.),Nihonkeizaishi 4 Sangyoka no Jidai Jo. Iwanami Shoten: Tokyo.
Marshall, A. (1920). Principles of Economics (8th ed.). London: Macmillan.Minami, R., Ishii, T., & Makino, F. (1982). Gijyutsu fukyu no shojoken: rikishokki no baai (Theconditions of the diffusion of technology: In cases of power looms). Keizaikenkyu, HitotsubashiUniversity, 33(4), 334–359.
Minami, R., Nakamura, M., & Nishizawa, T. (Eds.). (1998). Demokurashi no Houkai to Saisei:Gakusaitekisekkin (The collapse and restoration of democracy: An inter-disciplinary approach).Tokyo: Nihonkeizai Hyoronsha.
Nakamura, S. (1968).Meijiishin no Kisokozo: Nihon Shihonshugi Keisei no Kiten (Basic structureof Meiji restoration: The starting point of the formation of the Japanese capitalism). Tokyo:Miraisha.
Nakamura, T. (1971/1983). Senzenki Nihon Keizaiseicho no Bunseki, Tokyo, Iwanami Shoten trans-lated into Economic Growth in Pre-war Japan. New Haven: Yale University Press.
Nakaoka, T. (2006). Nihon Kindaigijyutsu no Keisei: “Dento” to “Kindai” no Dainamizumu (Theformation of themodern technology in Japan: Dynamism of “tradition” and “modernity”). Tokyo:Asahi Shinbunsha.
Noshomusho. (1903/1998). Shokkojijo reprinted by Iwanami Shoten.Ohkawa, K. et al. (1974). Choki Keizaitokei 1 Kokuminshotoku (Estimates of long-term economicstatistics of Japan since 1868, vol. 1 National income). Tokyo: Toyokeizai Shinposha.
Otsuka, K., Ranis, G., & Saxonhouse, G. (1988). Comparative technology choice in development:The Indian and Japanese cotton textile industries. London: Macmillan Press.
Sawai, M. (2013). 1950, 60 nendai no sogankyo kogyo to amerika shijo (The binocular industry inthe 1950s & the 1960s and the US market). Osakadaigaku Keizaigaku, 63(1), 151–178.
Sawai,M., & Tanimoto,M. (2016).Nihonkeizaihi: Kinsei karaGendai made (The economic historyof Japan: From the early modern era to the present). Tokyo: Yuhikaku.
Sugihara, K. (2013). Labour-intensive industrialization in global history: An interpretation of EastAsian experience. In G. Austin & K. Sugihara (Eds.), Labour—intensive industrialization inglobal history (pp. 20–65). London: Routledge.
Suzuki, J. (1996). Meiji no Kikai Kogyo: Sono Seisei to Tenkai (Machinery industry in Meiji: Itsformation and development). Kyoto: Mineruva Shobo.
Takamura, N. (1971). Nihon Bosekigyoshi Josetsu Jo (The introduction to the history of cottonspinning industry in Japan, vol. 1). Tokyo: Hanawa Shobo.
Tamura, H. (2004). Fasshon no Shakaikeizaishi (The socio-economic history of fashion). Tokyo:Nihonkeizai Hyoronsha.
Tanimoto, M. (1995). Kindai nihon niokeru ‘zairaiteki’ keizaihatten to kogyoka: shonin, chushoki-gyo, meiboka (Industrialization and the “indigenous” economic development: Merchant, smalland medium size enterprises and notables). Rekisihyoron, 539, 92–109.
Tanimoto, M. (1998). Nihon niokeru Zairaiteki Keizaihatten to Orimonogyo: Shijokeisei toKazokukeizai (The indigenous economic development and the weaving industry: Market for-mation and household economy). Nagoya: Nagoyadaigaku Shuppankai.
Tanimoto, M. (2006). The role of tradition in Japan’s industrialization: Another path to industri-alization. In M. Tanimoto (Ed.), The role of tradition in Japan’s industrialization (pp. 3–44).Oxford and New York: Oxford University Press.
Tanimoto, M. (2007). The development of dispersed production organization in the interwar period:The case of the Japanese toy industry. In T. Okazaki (Ed.), Production organization in Japaneseeconomic development (pp. 167–208). London and New York: Routledge.
140 M. Tanimoto
Tanimoto, M. (2009). Cotton and the peasant economy: Foreign fibre in early modern Japan. In G.Riello & P. Prasannan (Eds.), The spinning world: A global history of cotton textile 1200–1850(pp. 367–385). Oxford and New York: Oxford University Press.
Tanimoto, M. (2013a). From peasant economy to urban agglomeration: The transformation oflabour-intensive industrialization in modern Japan. In G. Austin & K. Sugihara (Eds.), Labour-intensive industrialization in global history (pp. 144–175). London: Routledge.
Tanimoto, M. (2013b). Senkanki nihon no chushoshokogyo to kokusai shijo: Gangu yushutsu wojirei toshite (Japanese small-scale manufacturing in the international market: Export-oriented toybusiness in interwar period). Osakadaigaku Keizaigaku, 63(1), 51–73.
Tanimoto, M. (2017). From emulation to innovation: Japanese toy export to high-income countriesbefore World War II. In K. Furuta & L. Grove (Eds.), Imitation, counterfeiting and the quality ofgoods in modern Asian history (pp. 225–243). Singapore: Springer.
Tokyo Municipal Office (Ed.). (1934). Kogyo Chosa-sho (Census of Industry).Tokyo Municipal Office (Ed.). (1937). Tonyasei Shokogyo Chosa (Survey on small manufacturingand processing workshops under the putting-out system).
Tokyo Prefectural Office (Ed.). (1939).Chushokigyo no Keiei Jijo to Totei no Rodo Jijo (An investi-gation on themanagement of small andmedium firms and the working conditions of apprentices).
Toyokeizai Shinposha (Ed.). (1935).Nihon Boeki Seiran (Statistical book on Japan’s oversea trade).Tokyo: Toyokeizai Shinposha.
Tsushosangyoseisakushi Hensaniinkai (Ed.). (1992). Tsushosangyoseisakushi 16 Tokei Nenpyo hen(The history of trade and industrial policy vol. 16 Statistics and chronological tables). Tokyo:Tsushosangyo Chosakai.
Umemura, M., et al. (1988). Choki Keizaitokei 14 Rodoryoku (Estimates of long-term economicstatistics of Japan since 1868, vol. 2 Labour force). Tokyo: Toyokeizai Shinposha.
Ushijima, T., & Abe, T. (1996). Mengyo (Cotton industry). In S. Nishikawa, K. Odaka, & O. Saito(Eds.), Nihon Keizai no 200 nen. Tokyo: Nihon Hyoronsha.
Yamazawa, I. (1984). Nihon no Keizaihatten to Kokusaibungyo (Japan’s economic developmentunder the international division of labor). Tokyo: Toyokeizai Shinposha.
Yamazawa, I., & Yamamoto, Y. (1979). Choki Keizaitokei 2 Boeki to Kokusaishushi (Estimates oflong-term economic statistics of Japan since 1868, vol. 14 Foreign trade and balance of payments).Tokyo: Toyokeizai Shinposha.
Open Access This chapter is licensed under the terms of the Creative Commons Attribution-NonCommercial-NoDerivatives 4.0 International License (http://creativecommons.org/licenses/by-nc-nd/4.0/), which permits any noncommercial use, sharing, distribution and reproduction in anymedium or format, as long as you give appropriate credit to the original author(s) and the source,provide a link to the Creative Commons licence and indicate if you modified the licensed material.You do not have permission under this licence to share adapted material derived from this chapteror parts of it.
The images or other third party material in this chapter are included in the chapter’s CreativeCommons licence, unless indicated otherwise in a credit line to the material. If material is notincluded in the chapter’s Creative Commons licence and your intended use is not permitted bystatutory regulation or exceeds the permitted use, you will need to obtain permission directly fromthe copyright holder.
Chapter 7Changing Patterns of Industrializationand Emerging States in TwentiethCentury China
Toru Kubo
7.1 Introduction
Itmight be a problemwhetherwe should studyChina as an emerging country, becauseshe had her own history as a great empire. But it is obvious that after the middle ofthe 19th century, China started to struggle for industrial development and eventuallyachieved it. In particular, industrialization during Mao Zedong’s era in the middle ofthe 20th century left us with such a distinctive impression. So we expect the studyon the process of China’s industrialization will shed light on the study of the natureof emerging states.
This chapter distinguishes four periods of China’s industrialization, and discussesthem by referring to the three factors that have shaped the economic development ofmodern China, the global economy, private enterprises, and the government. Suchan understanding will help us to situate Mao’s era in the whole process of China’sindustrialization.Wewill also make it clear that China had two types of industrializa-tion with particular reference to the significance of the wartime controlled economyunder the Nationalist government.
The first factor, the global economy, is mainly reflected on the roles of foreigntrade and foreign investment. They include investments in railway construction andthe development of domestic river shipping industry and mining and manufacturingindustries, which have been beneficial for both the investor countries and China.The second factor, private enterprises, includes large enterprises in cities, smallerenterprises throughout the country, and lots of small-scale industrial activities in thecountryside. The third factor is the government, which provided the infrastructurenecessary for industrial development, managed state enterprises, and implemented
T. Kubo (B)Shinshu University, 3-1-1 Asahi, Matsumoto, Japane-mail: [email protected]
© The Author(s) 2019K. Otsuka and K. Sugihara (eds.), Paths to the Emerging State in Asia and Africa,Emerging-Economy State and International Policy Studies,https://doi.org/10.1007/978-981-13-3131-2_7
141
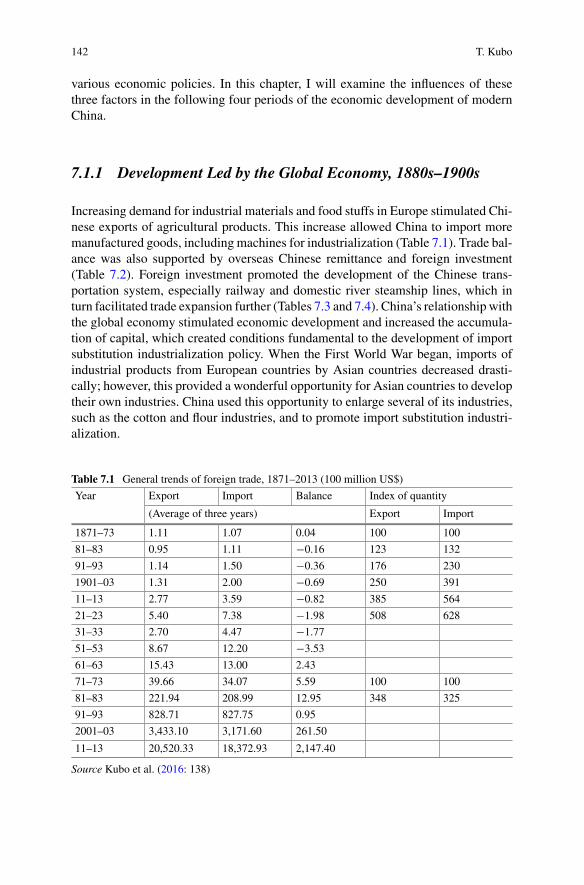
142 T. Kubo
various economic policies. In this chapter, I will examine the influences of thesethree factors in the following four periods of the economic development of modernChina.
7.1.1 Development Led by the Global Economy, 1880s–1900s
Increasing demand for industrial materials and food stuffs in Europe stimulated Chi-nese exports of agricultural products. This increase allowed China to import moremanufactured goods, including machines for industrialization (Table 7.1). Trade bal-ance was also supported by overseas Chinese remittance and foreign investment(Table 7.2). Foreign investment promoted the development of the Chinese trans-portation system, especially railway and domestic river steamship lines, which inturn facilitated trade expansion further (Tables 7.3 and 7.4). China’s relationship withthe global economy stimulated economic development and increased the accumula-tion of capital, which created conditions fundamental to the development of importsubstitution industrialization policy. When the First World War began, imports ofindustrial products from European countries by Asian countries decreased drasti-cally; however, this provided a wonderful opportunity for Asian countries to developtheir own industries. China used this opportunity to enlarge several of its industries,such as the cotton and flour industries, and to promote import substitution industri-alization.
Table 7.1 General trends of foreign trade, 1871–2013 (100 million US$)
Year Export Import Balance Index of quantity
(Average of three years) Export Import
1871–73 1.11 1.07 0.04 100 100
81–83 0.95 1.11 −0.16 123 132
91–93 1.14 1.50 −0.36 176 230
1901–03 1.31 2.00 −0.69 250 391
11–13 2.77 3.59 −0.82 385 564
21–23 5.40 7.38 −1.98 508 628
31–33 2.70 4.47 −1.77
51–53 8.67 12.20 −3.53
61–63 15.43 13.00 2.43
71–73 39.66 34.07 5.59 100 100
81–83 221.94 208.99 12.95 348 325
91–93 828.71 827.75 0.95
2001–03 3,433.10 3,171.60 261.50
11–13 20,520.33 18,372.93 2,147.40
Source Kubo et al. (2016: 138)
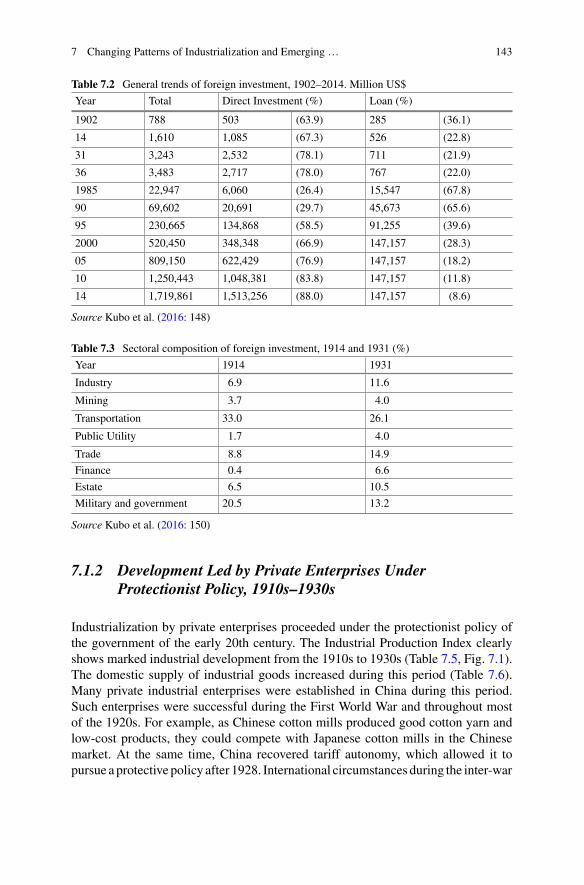
7 Changing Patterns of Industrialization and Emerging … 143
Table 7.2 General trends of foreign investment, 1902–2014. Million US$
Year Total Direct Investment (%) Loan (%)
1902 788 503 (63.9) 285 (36.1)
14 1,610 1,085 (67.3) 526 (22.8)
31 3,243 2,532 (78.1) 711 (21.9)
36 3,483 2,717 (78.0) 767 (22.0)
1985 22,947 6,060 (26.4) 15,547 (67.8)
90 69,602 20,691 (29.7) 45,673 (65.6)
95 230,665 134,868 (58.5) 91,255 (39.6)
2000 520,450 348,348 (66.9) 147,157 (28.3)
05 809,150 622,429 (76.9) 147,157 (18.2)
10 1,250,443 1,048,381 (83.8) 147,157 (11.8)
14 1,719,861 1,513,256 (88.0) 147,157 (8.6)
Source Kubo et al. (2016: 148)
Table 7.3 Sectoral composition of foreign investment, 1914 and 1931 (%)
Year 1914 1931
Industry 6.9 11.6
Mining 3.7 4.0
Transportation 33.0 26.1
Public Utility 1.7 4.0
Trade 8.8 14.9
Finance 0.4 6.6
Estate 6.5 10.5
Military and government 20.5 13.2
Source Kubo et al. (2016: 150)
7.1.2 Development Led by Private Enterprises UnderProtectionist Policy, 1910s–1930s
Industrialization by private enterprises proceeded under the protectionist policy ofthe government of the early 20th century. The Industrial Production Index clearlyshows marked industrial development from the 1910s to 1930s (Table 7.5, Fig. 7.1).The domestic supply of industrial goods increased during this period (Table 7.6).Many private industrial enterprises were established in China during this period.Such enterprises were successful during the First World War and throughout mostof the 1920s. For example, as Chinese cotton mills produced good cotton yarn andlow-cost products, they could compete with Japanese cotton mills in the Chinesemarket. At the same time, China recovered tariff autonomy, which allowed it topursue aprotective policy after 1928. International circumstances during the inter-war
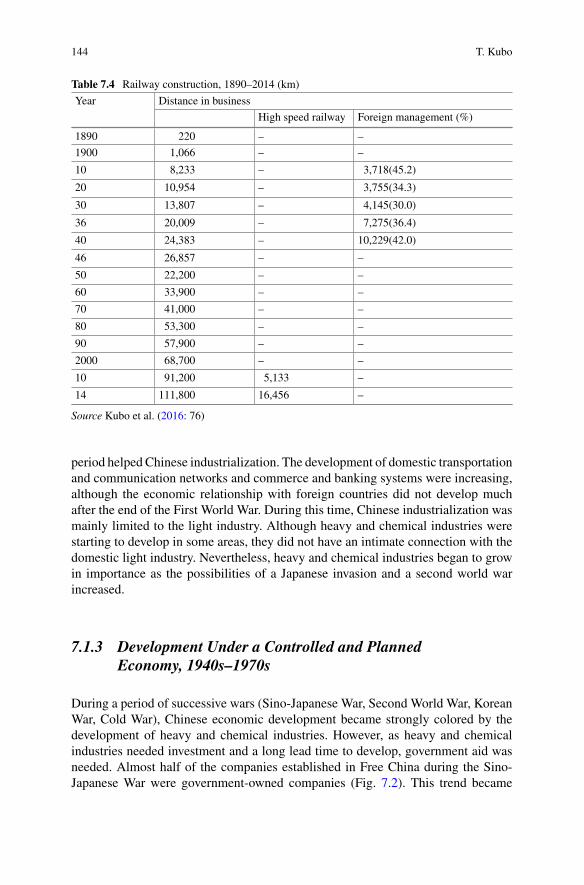
144 T. Kubo
Table 7.4 Railway construction, 1890–2014 (km)
Year Distance in business
High speed railway Foreign management (%)
1890 220 – –
1900 1,066 – –
10 8,233 – 3,718(45.2)
20 10,954 – 3,755(34.3)
30 13,807 – 4,145(30.0)
36 20,009 – 7,275(36.4)
40 24,383 – 10,229(42.0)
46 26,857 – –
50 22,200 – –
60 33,900 – –
70 41,000 – –
80 53,300 – –
90 57,900 – –
2000 68,700 – –
10 91,200 5,133 –
14 111,800 16,456 –
Source Kubo et al. (2016: 76)
period helped Chinese industrialization. The development of domestic transportationand communication networks and commerce and banking systems were increasing,although the economic relationship with foreign countries did not develop muchafter the end of the First World War. During this time, Chinese industrialization wasmainly limited to the light industry. Although heavy and chemical industries werestarting to develop in some areas, they did not have an intimate connection with thedomestic light industry. Nevertheless, heavy and chemical industries began to growin importance as the possibilities of a Japanese invasion and a second world warincreased.
7.1.3 Development Under a Controlled and PlannedEconomy, 1940s–1970s
During a period of successive wars (Sino-Japanese War, Second World War, KoreanWar, Cold War), Chinese economic development became strongly colored by thedevelopment of heavy and chemical industries. However, as heavy and chemicalindustries needed investment and a long lead time to develop, government aid wasneeded. Almost half of the companies established in Free China during the Sino-Japanese War were government-owned companies (Fig. 7.2). This trend became
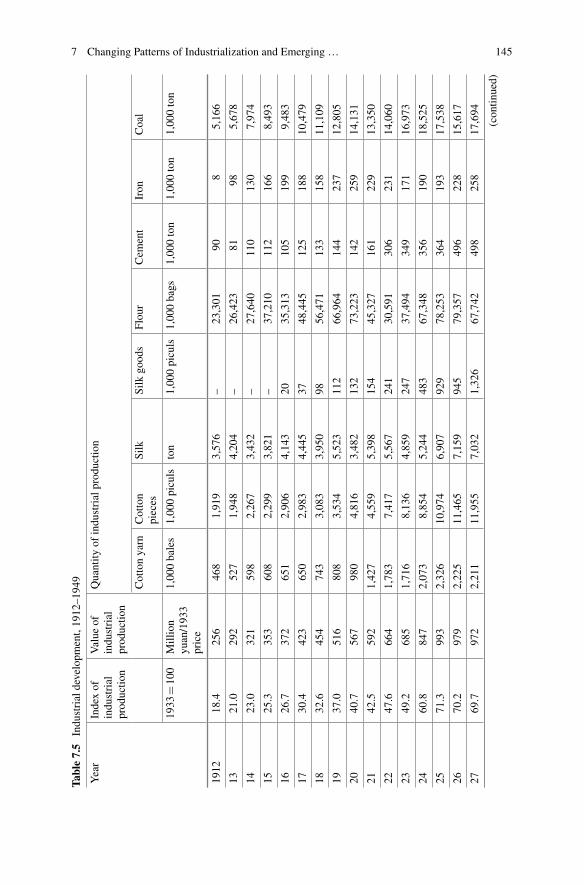
7 Changing Patterns of Industrialization and Emerging … 145
Table7.5
Industrialdevelopm
ent,1912–1949
Year
Indexof
indu
strial
productio
n
Value
ofindu
strial
productio
n
Quantity
ofindustrialproductio
n
Cottonyarn
Cotton
pieces
Silk
Silk
goods
Flour
Cem
ent
Iron
Coal
1933
�100
Million
yuan/1933
price
1,000bales
1,000piculs
ton
1,000piculs
1,000bags
1,000ton
1,000ton
1,000ton
1912
18.4
256
468
1,919
3,576
–23,301
908
5,166
1321.0
292
527
1,948
4,204
–26,423
8198
5,678
1423.0
321
598
2,267
3,432
–27,640
110
130
7,974
1525.3
353
608
2,299
3,821
–37,210
112
166
8,493
1626.7
372
651
2,906
4,143
2035,313
105
199
9,483
1730.4
423
650
2,983
4,445
3748,445
125
188
10,479
1832.6
454
743
3,083
3,950
9856,471
133
158
11,109
1937.0
516
808
3,534
5,523
112
66,964
144
237
12,805
2040.7
567
980
4,816
3,482
132
73,223
142
259
14,131
2142.5
592
1,427
4,559
5,398
154
45,327
161
229
13,350
2247.6
664
1,783
7,417
5,567
241
30,591
306
231
14,060
2349.2
685
1,716
8,136
4,859
247
37,494
349
171
16,973
2460.8
847
2,073
8,854
5,244
483
67,348
356
190
18,525
2571.3
993
2,326
10,974
6,907
929
78,253
364
193
17,538
2670.2
979
2,225
11,465
7,159
945
79,357
496
228
15,617
2769.7
972
2,211
11,955
7,032
1,326
67,742
498
258
17,694
(contin
ued)
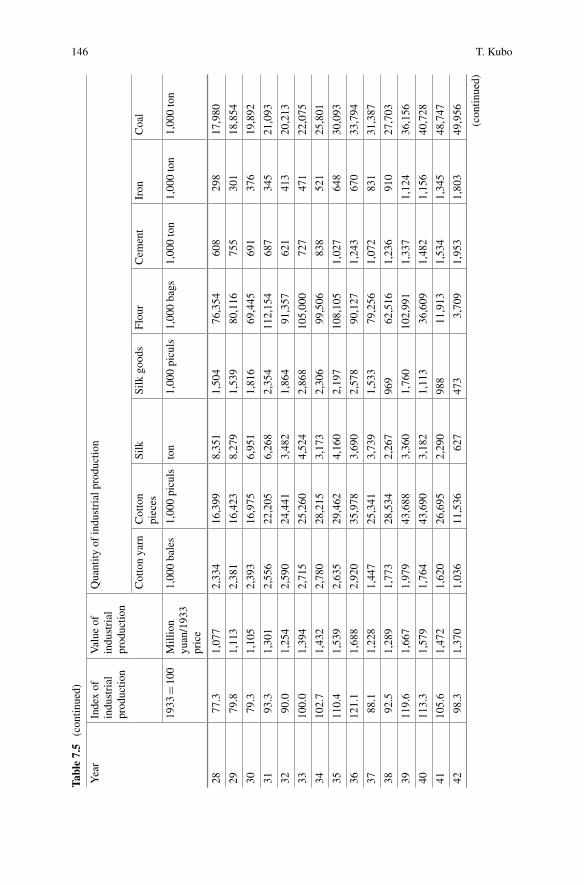
146 T. Kubo
Table7.5
(contin
ued)
Year
Indexof
indu
strial
productio
n
Value
ofindu
strial
productio
n
Quantity
ofindustrialproductio
n
Cottonyarn
Cotton
pieces
Silk
Silk
goods
Flour
Cem
ent
Iron
Coal
1933
�100
Million
yuan/1933
price
1,000bales
1,000piculs
ton
1,000piculs
1,000bags
1,000ton
1,000ton
1,000ton
2877.3
1,077
2,334
16,399
8,351
1,504
76,354
608
298
17,980
2979.8
1,113
2,381
16,423
8,279
1,539
80,116
755
301
18,854
3079.3
1,105
2,393
16,975
6,951
1,816
69,445
691
376
19,892
3193.3
1,301
2,556
22,205
6,268
2,354
112,154
687
345
21,093
3290.0
1,254
2,590
24,441
3,482
1,864
91,357
621
413
20,213
33100.0
1,394
2,715
25,260
4,524
2,868
105,000
727
471
22,075
34102.7
1,432
2,780
28,215
3,173
2,306
99,506
838
521
25,801
35110.4
1,539
2,635
29,462
4,160
2,197
108,105
1,027
648
30,093
36121.1
1,688
2,920
35,978
3,690
2,578
90,127
1,243
670
33,794
3788.1
1,228
1,447
25,341
3,739
1,533
79,256
1,072
831
31,387
3892.5
1,289
1,773
28,534
2,267
969
62,516
1,236
910
27,703
39119.6
1,667
1,979
43,688
3,360
1,760
102,991
1,337
1,124
36,156
40113.3
1,579
1,764
43,690
3,182
1,113
36,609
1,482
1,156
40,728
41105.6
1,472
1,620
26,695
2,290
988
11,913
1,534
1,345
48,747
4298.3
1,370
1,036
11,536
627
473
3,709
1,953
1,803
49,956
(contin
ued)
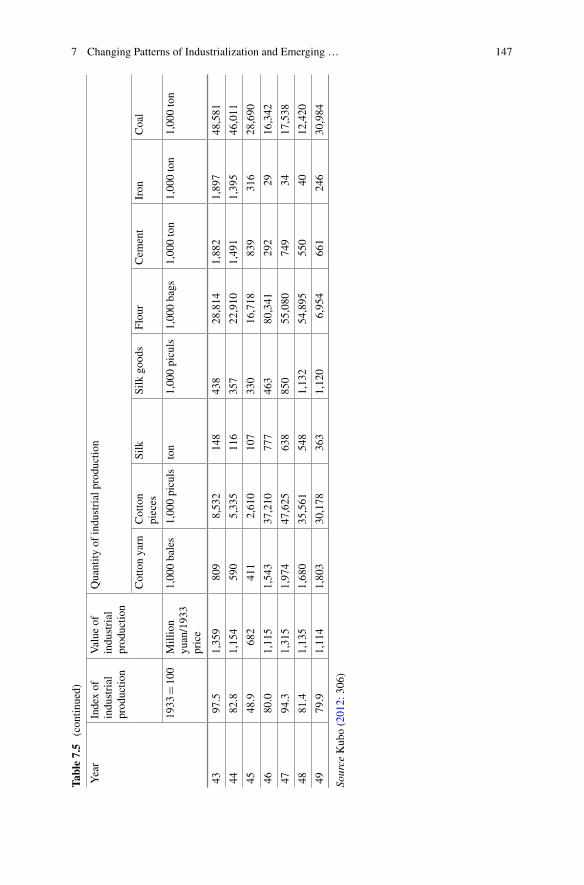
7 Changing Patterns of Industrialization and Emerging … 147
Table7.5
(contin
ued)
Year
Indexof
indu
strial
productio
n
Value
ofindu
strial
productio
n
Quantity
ofindustrialproductio
n
Cottonyarn
Cotton
pieces
Silk
Silk
goods
Flour
Cem
ent
Iron
Coal
1933
�100
Million
yuan/1933
price
1,000bales
1,000piculs
ton
1,000piculs
1,000bags
1,000ton
1,000ton
1,000ton
4397.5
1,359
809
8,532
148
438
28,814
1,882
1,897
48,581
4482.8
1,154
590
5,335
116
357
22,910
1,491
1,395
46,011
4548.9
682
411
2,610
107
330
16,718
839
316
28,690
4680.0
1,115
1,543
37,210
777
463
80,341
292
2916,342
4794.3
1,315
1,974
47,625
638
850
55,080
749
3417,538
4881.4
1,135
1,680
35,561
548
1,132
54,895
550
4012,420
4979.9
1,114
1,803
30,178
363
1,120
6,954
661
246
30,984
Source
Kubo(2012:
306)
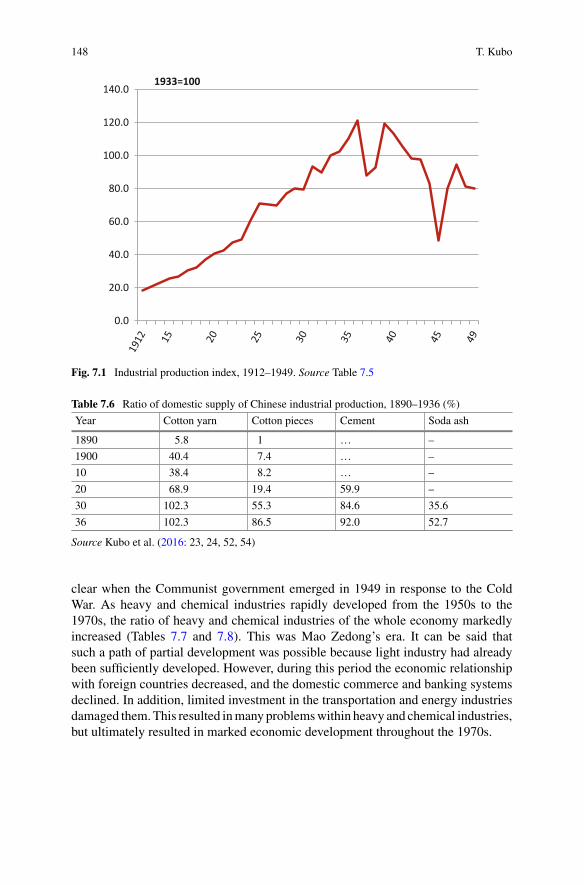
148 T. Kubo
0.0
20.0
40.0
60.0
80.0
100.0
120.0
140.0 1933=100
Fig. 7.1 Industrial production index, 1912–1949. Source Table 7.5
Table 7.6 Ratio of domestic supply of Chinese industrial production, 1890–1936 (%)
Year Cotton yarn Cotton pieces Cement Soda ash
1890 5.8 1 … –
1900 40.4 7.4 … –
10 38.4 8.2 … –
20 68.9 19.4 59.9 –
30 102.3 55.3 84.6 35.6
36 102.3 86.5 92.0 52.7
Source Kubo et al. (2016: 23, 24, 52, 54)
clear when the Communist government emerged in 1949 in response to the ColdWar. As heavy and chemical industries rapidly developed from the 1950s to the1970s, the ratio of heavy and chemical industries of the whole economy markedlyincreased (Tables 7.7 and 7.8). This was Mao Zedong’s era. It can be said thatsuch a path of partial development was possible because light industry had alreadybeen sufficiently developed. However, during this period the economic relationshipwith foreign countries decreased, and the domestic commerce and banking systemsdeclined. In addition, limited investment in the transportation and energy industriesdamaged them.This resulted inmanyproblemswithin heavy and chemical industries,but ultimately resulted in marked economic development throughout the 1970s.
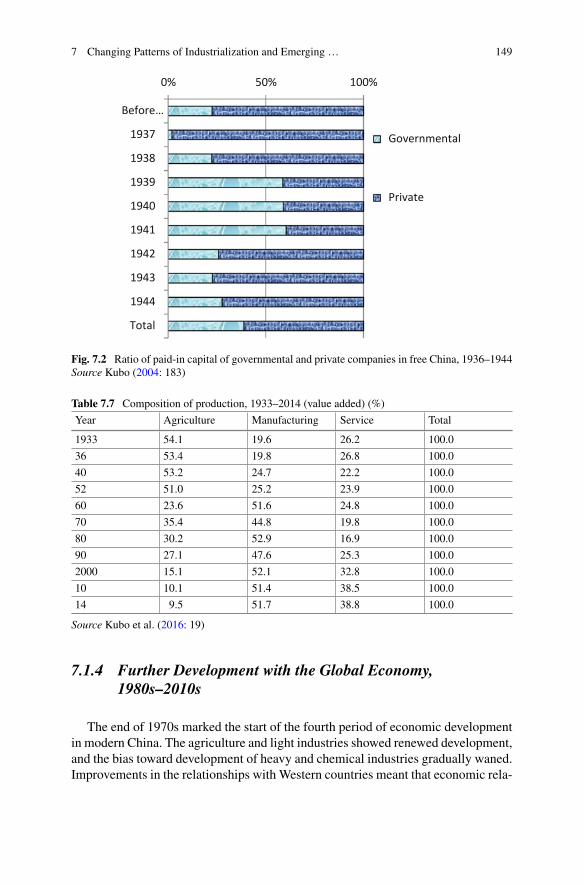
7 Changing Patterns of Industrialization and Emerging … 149
0% 50% 100%
Before …
1937
1938
1939
1940
1941
1942
1943
1944
Total
Governmental
Private
Fig. 7.2 Ratio of paid-in capital of governmental and private companies in free China, 1936–1944Source Kubo (2004: 183)
Table 7.7 Composition of production, 1933–2014 (value added) (%)
Year Agriculture Manufacturing Service Total
1933 54.1 19.6 26.2 100.0
36 53.4 19.8 26.8 100.0
40 53.2 24.7 22.2 100.0
52 51.0 25.2 23.9 100.0
60 23.6 51.6 24.8 100.0
70 35.4 44.8 19.8 100.0
80 30.2 52.9 16.9 100.0
90 27.1 47.6 25.3 100.0
2000 15.1 52.1 32.8 100.0
10 10.1 51.4 38.5 100.0
14 9.5 51.7 38.8 100.0
Source Kubo et al. (2016: 19)
7.1.4 Further Development with the Global Economy,1980s–2010s
The end of 1970s marked the start of the fourth period of economic developmentin modern China. The agriculture and light industries showed renewed development,and the bias toward development of heavy and chemical industries gradually waned.Improvements in the relationships with Western countries meant that economic rela-
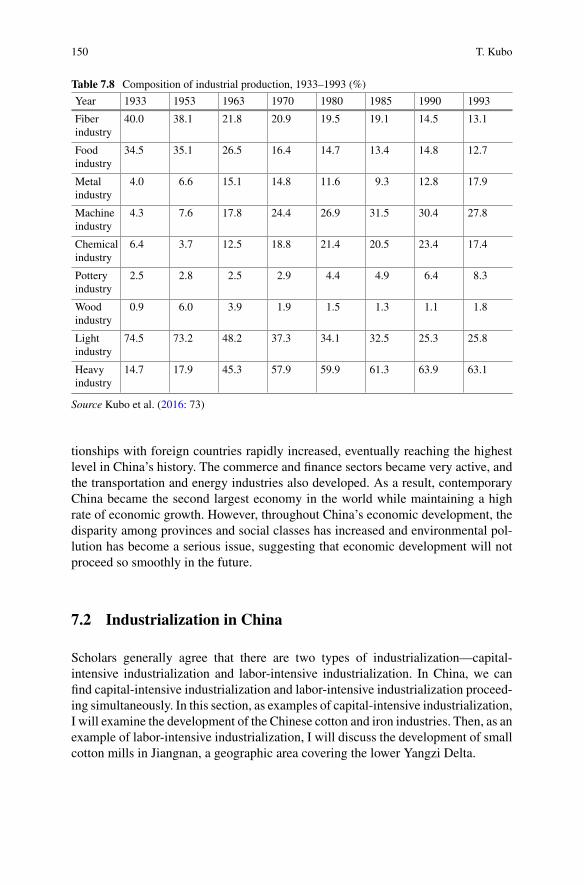
150 T. Kubo
Table 7.8 Composition of industrial production, 1933–1993 (%)
Year 1933 1953 1963 1970 1980 1985 1990 1993
Fiberindustry
40.0 38.1 21.8 20.9 19.5 19.1 14.5 13.1
Foodindustry
34.5 35.1 26.5 16.4 14.7 13.4 14.8 12.7
Metalindustry
4.0 6.6 15.1 14.8 11.6 9.3 12.8 17.9
Machineindustry
4.3 7.6 17.8 24.4 26.9 31.5 30.4 27.8
Chemicalindustry
6.4 3.7 12.5 18.8 21.4 20.5 23.4 17.4
Potteryindustry
2.5 2.8 2.5 2.9 4.4 4.9 6.4 8.3
Woodindustry
0.9 6.0 3.9 1.9 1.5 1.3 1.1 1.8
Lightindustry
74.5 73.2 48.2 37.3 34.1 32.5 25.3 25.8
Heavyindustry
14.7 17.9 45.3 57.9 59.9 61.3 63.9 63.1
Source Kubo et al. (2016: 73)
tionships with foreign countries rapidly increased, eventually reaching the highestlevel in China’s history. The commerce and finance sectors became very active, andthe transportation and energy industries also developed. As a result, contemporaryChina became the second largest economy in the world while maintaining a highrate of economic growth. However, throughout China’s economic development, thedisparity among provinces and social classes has increased and environmental pol-lution has become a serious issue, suggesting that economic development will notproceed so smoothly in the future.
7.2 Industrialization in China
Scholars generally agree that there are two types of industrialization—capital-intensive industrialization and labor-intensive industrialization. In China, we canfind capital-intensive industrialization and labor-intensive industrialization proceed-ing simultaneously. In this section, as examples of capital-intensive industrialization,I will examine the development of the Chinese cotton and iron industries. Then, as anexample of labor-intensive industrialization, I will discuss the development of smallcotton mills in Jiangnan, a geographic area covering the lower Yangzi Delta.
7 Changing Patterns of Industrialization and Emerging … 151
7.2.1 Development of Machine-Made Cotton Yarn Industryin Big Mills as an Example of Capital-IntensiveIndustrialization in China
Increasing imports of foreign machine-spun cotton yarn in the latter half of the 19thcentury led several western businessmen in China to consider building cottonmills inChinese open ports. For example, the business plan of British mercantile companiesin Shanghai from the 1860s to 1870s was to produce machine-spun cotton productsthat imitated domestic cotton pieces to sell alongside domestic products in the cottonmarket. However, Chinese cotton merchants protested the plan because it threatenedtheir interests. The Qing government ignored the plan because they were concernedfor the livelihoods of the farmers engaged in small-scale weaving and wanted toavoid the promulgation of foreign-managed mills. Thus, ultimately, the plan of theBritish mercantile companies failed (Suzuki 1992).
The famous comprador and merchant Zheng Guangying (1842–1922) and hiscolleagues established the first Chinese cotton mill, called the Shanghai Machine-made Cotton Pieces Mill (Shanghai Jiqi Zhibuju), in 1880 with the support of LiHongzhang (1823–1901), a high-class administrator of the Qing government. Themill began operation in 1890 producing machine-spun cotton yarn and woven prod-ucts for the domestic market. The plan for the mill did not face any opposition fromChinese merchants dealing in domestic cotton pieces, and received the support ofthe Qing government (Hatano 1961). It was considered that reducing the imports ofcotton products, which accounted for one-third of total imports, would improve the“red ink” in China’s trade finances.
After the signing of theSino-JapanesePeaceTreaty in 1895,which granted foreigninvestors the right to build mills in Chinese open ports, several new cotton mills wereestablished by western mercantile companies in Shanghai (Tanaka 1973). Chinesemerchants were able to follow suit and establish their own cotton mills, which costaround C$200,000 each (approx. US$150,000 at the 1900 rate), because conditionsby then had allowed them to accumulate sufficient capital. From the end of the 19thto the middle of the 20th century, the Chinese cotton industry developed rapidly,arriving at a level of self-supply. They could meet almost all of the domestic needsof machine-spun cotton yarn and about 80% of the domestic needs of cotton piecesin 1930s (Table 7.9). This kind of development was pursued mainly by Japanese andChinese cotton mills, rather than by Western cotton mills (Fig. 7.3). In fact, most ofthe cotton mills established by western mercantile companies failed because of thehigh costs of management and low profits, and they were ultimately sold to Chinesemerchants or Japanese companies (Nakai 1996).
There were several reasons that Japanese cottonmills were able to develop rapidlyinChina. For example,most Japanese cottonmills built inChina hadbeen competitivein the Chinese domestic market, because large Japanese cotton industrial companieshad directly invested their capital and technology in China. Also, Japanese cottoncompanies needed to invest in China because the Japanese domestic market wasshrinking. In addition, workers’ wages were rising in Japan, a 5% customs tariff
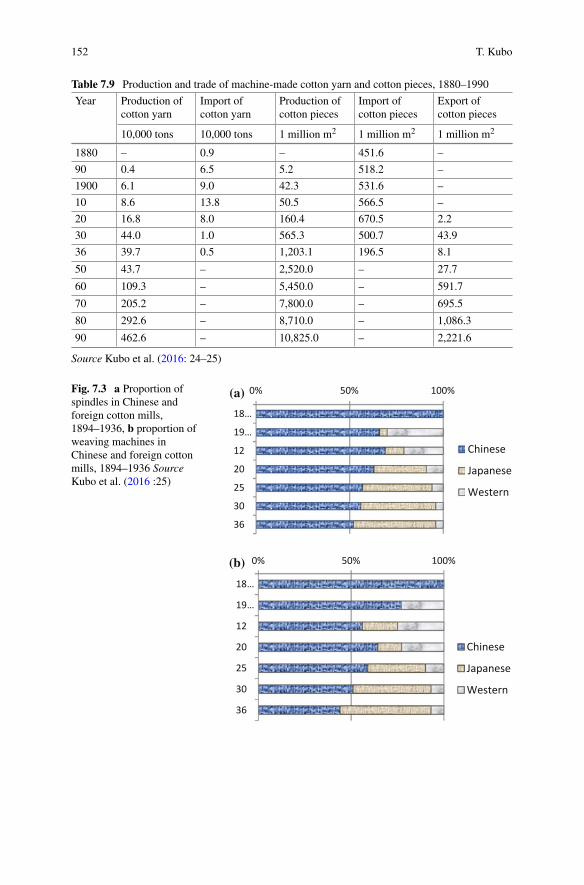
152 T. Kubo
Table 7.9 Production and trade of machine-made cotton yarn and cotton pieces, 1880–1990
Year Production ofcotton yarn
Import ofcotton yarn
Production ofcotton pieces
Import ofcotton pieces
Export ofcotton pieces
10,000 tons 10,000 tons 1 million m2 1 million m2 1 million m2
1880 – 0.9 – 451.6 –
90 0.4 6.5 5.2 518.2 –
1900 6.1 9.0 42.3 531.6 –
10 8.6 13.8 50.5 566.5 –
20 16.8 8.0 160.4 670.5 2.2
30 44.0 1.0 565.3 500.7 43.9
36 39.7 0.5 1,203.1 196.5 8.1
50 43.7 – 2,520.0 – 27.7
60 109.3 – 5,450.0 – 591.7
70 205.2 – 7,800.0 – 695.5
80 292.6 – 8,710.0 – 1,086.3
90 462.6 – 10,825.0 – 2,221.6
Source Kubo et al. (2016: 24–25)
Fig. 7.3 a Proportion ofspindles in Chinese andforeign cotton mills,1894–1936, b proportion ofweaving machines inChinese and foreign cottonmills, 1894–1936 SourceKubo et al. (2016 :25)
0% 50% 100%
18…
19…
12
20
25
30
36
Chinese
Japanese
Western
0% 50% 100%
18…
19…
12
20
25
30
36
Chinese
Japanese
Western
(a)
(b)
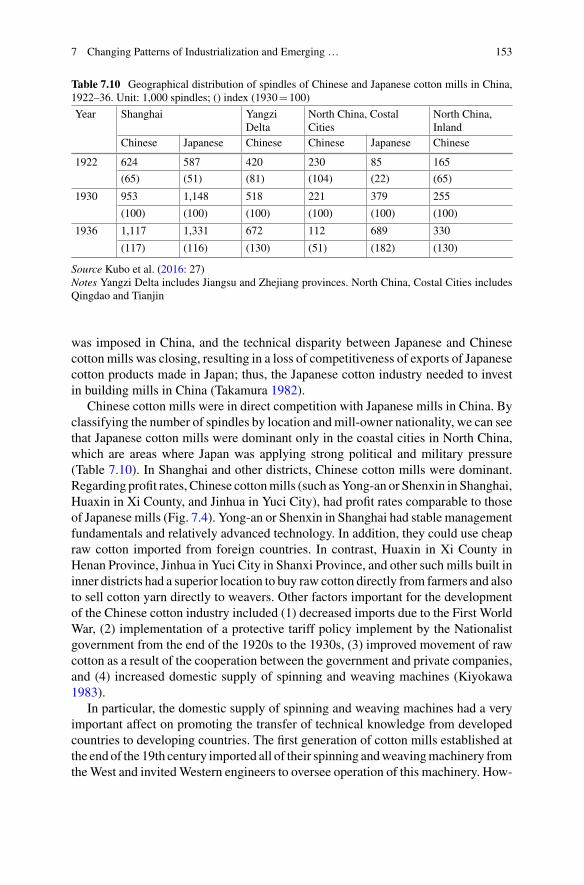
7 Changing Patterns of Industrialization and Emerging … 153
Table 7.10 Geographical distribution of spindles of Chinese and Japanese cotton mills in China,1922–36. Unit: 1,000 spindles; () index (1930�100)
Year Shanghai YangziDelta
North China, CostalCities
North China,Inland
Chinese Japanese Chinese Chinese Japanese Chinese
1922 624 587 420 230 85 165
(65) (51) (81) (104) (22) (65)
1930 953 1,148 518 221 379 255
(100) (100) (100) (100) (100) (100)
1936 1,117 1,331 672 112 689 330
(117) (116) (130) (51) (182) (130)
Source Kubo et al. (2016: 27)Notes Yangzi Delta includes Jiangsu and Zhejiang provinces. North China, Costal Cities includesQingdao and Tianjin
was imposed in China, and the technical disparity between Japanese and Chinesecotton mills was closing, resulting in a loss of competitiveness of exports of Japanesecotton products made in Japan; thus, the Japanese cotton industry needed to investin building mills in China (Takamura 1982).
Chinese cotton mills were in direct competition with Japanese mills in China. Byclassifying the number of spindles by location andmill-owner nationality, we can seethat Japanese cotton mills were dominant only in the coastal cities in North China,which are areas where Japan was applying strong political and military pressure(Table 7.10). In Shanghai and other districts, Chinese cotton mills were dominant.Regarding profit rates, Chinese cottonmills (such asYong-an or Shenxin in Shanghai,Huaxin in Xi County, and Jinhua in Yuci City), had profit rates comparable to thoseof Japanese mills (Fig. 7.4). Yong-an or Shenxin in Shanghai had stable managementfundamentals and relatively advanced technology. In addition, they could use cheapraw cotton imported from foreign countries. In contrast, Huaxin in Xi County inHenan Province, Jinhua in Yuci City in Shanxi Province, and other such mills built ininner districts had a superior location to buy raw cotton directly from farmers and alsoto sell cotton yarn directly to weavers. Other factors important for the developmentof the Chinese cotton industry included (1) decreased imports due to the First WorldWar, (2) implementation of a protective tariff policy implement by the Nationalistgovernment from the end of the 1920s to the 1930s, (3) improved movement of rawcotton as a result of the cooperation between the government and private companies,and (4) increased domestic supply of spinning and weaving machines (Kiyokawa1983).
In particular, the domestic supply of spinning and weaving machines had a veryimportant affect on promoting the transfer of technical knowledge from developedcountries to developing countries. The first generation of cotton mills established atthe end of the 19th century imported all of their spinning andweavingmachinery fromtheWest and invitedWestern engineers to oversee operation of this machinery. How-
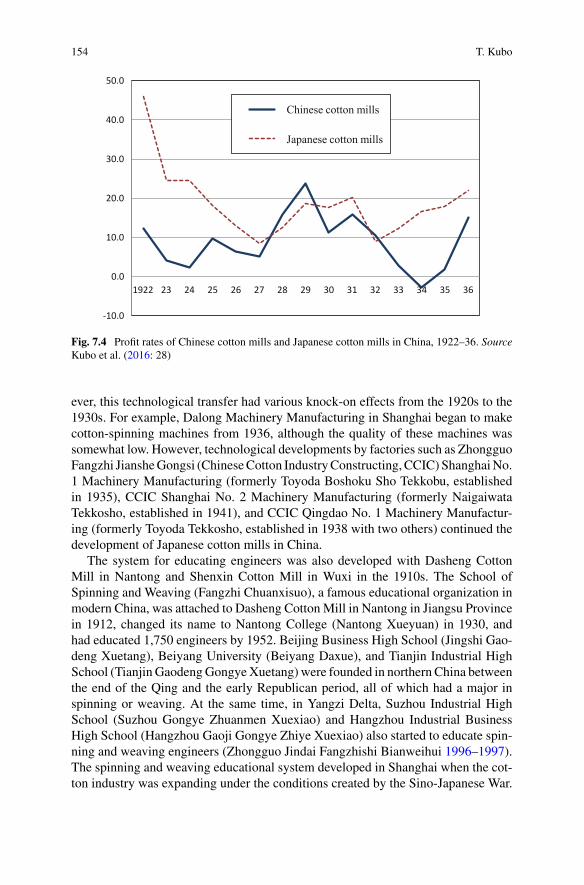
154 T. Kubo
-10.0
0.0
10.0
20.0
30.0
40.0
50.0
1922 23 24 25 26 27 28 29 30 31 32 33 34 35 36
Chinese cotton mills
Japanese cotton mills
Fig. 7.4 Profit rates of Chinese cotton mills and Japanese cotton mills in China, 1922–36. SourceKubo et al. (2016: 28)
ever, this technological transfer had various knock-on effects from the 1920s to the1930s. For example, Dalong Machinery Manufacturing in Shanghai began to makecotton-spinning machines from 1936, although the quality of these machines wassomewhat low. However, technological developments by factories such as ZhongguoFangzhi JiansheGongsi (ChineseCotton IndustryConstructing,CCIC) ShanghaiNo.1 Machinery Manufacturing (formerly Toyoda Boshoku Sho Tekkobu, establishedin 1935), CCIC Shanghai No. 2 Machinery Manufacturing (formerly NaigaiwataTekkosho, established in 1941), and CCIC Qingdao No. 1 Machinery Manufactur-ing (formerly Toyoda Tekkosho, established in 1938 with two others) continued thedevelopment of Japanese cotton mills in China.
The system for educating engineers was also developed with Dasheng CottonMill in Nantong and Shenxin Cotton Mill in Wuxi in the 1910s. The School ofSpinning and Weaving (Fangzhi Chuanxisuo), a famous educational organization inmodern China, was attached to Dasheng Cotton Mill in Nantong in Jiangsu Provincein 1912, changed its name to Nantong College (Nantong Xueyuan) in 1930, andhad educated 1,750 engineers by 1952. Beijing Business High School (Jingshi Gao-deng Xuetang), Beiyang University (Beiyang Daxue), and Tianjin Industrial HighSchool (Tianjin GaodengGongyeXuetang) were founded in northern China betweenthe end of the Qing and the early Republican period, all of which had a major inspinning or weaving. At the same time, in Yangzi Delta, Suzhou Industrial HighSchool (Suzhou Gongye Zhuanmen Xuexiao) and Hangzhou Industrial BusinessHigh School (Hangzhou Gaoji Gongye Zhiye Xuexiao) also started to educate spin-ning and weaving engineers (Zhongguo Jindai Fangzhishi Bianweihui 1996–1997).The spinning and weaving educational system developed in Shanghai when the cot-ton industry was expanding under the conditions created by the Sino-Japanese War.
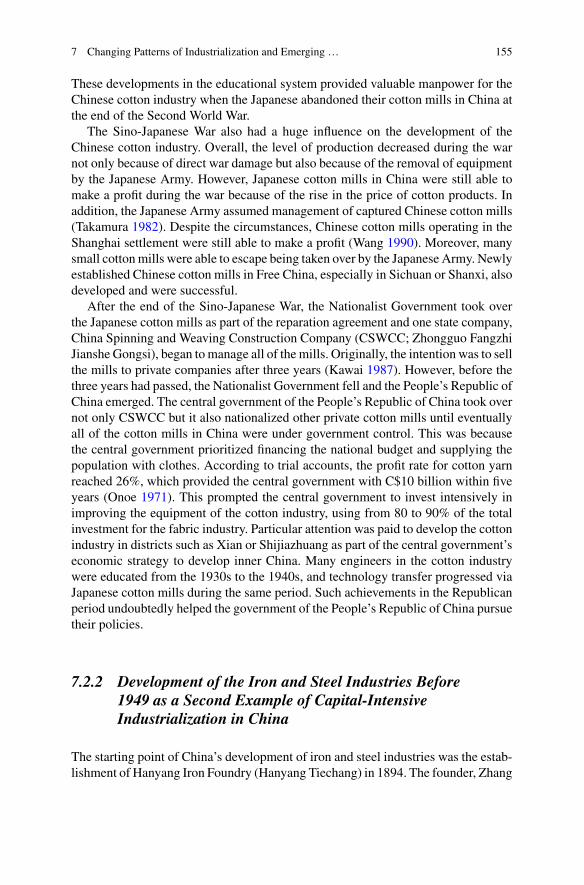
7 Changing Patterns of Industrialization and Emerging … 155
These developments in the educational system provided valuable manpower for theChinese cotton industry when the Japanese abandoned their cotton mills in China atthe end of the Second World War.
The Sino-Japanese War also had a huge influence on the development of theChinese cotton industry. Overall, the level of production decreased during the warnot only because of direct war damage but also because of the removal of equipmentby the Japanese Army. However, Japanese cotton mills in China were still able tomake a profit during the war because of the rise in the price of cotton products. Inaddition, the Japanese Army assumed management of captured Chinese cotton mills(Takamura 1982). Despite the circumstances, Chinese cotton mills operating in theShanghai settlement were still able to make a profit (Wang 1990). Moreover, manysmall cottonmills were able to escape being taken over by the Japanese Army. Newlyestablished Chinese cotton mills in Free China, especially in Sichuan or Shanxi, alsodeveloped and were successful.
After the end of the Sino-Japanese War, the Nationalist Government took overthe Japanese cotton mills as part of the reparation agreement and one state company,China Spinning and Weaving Construction Company (CSWCC; Zhongguo FangzhiJianshe Gongsi), began tomanage all of the mills. Originally, the intention was to sellthe mills to private companies after three years (Kawai 1987). However, before thethree years had passed, the Nationalist Government fell and the People’s Republic ofChina emerged. The central government of the People’s Republic of China took overnot only CSWCC but it also nationalized other private cotton mills until eventuallyall of the cotton mills in China were under government control. This was becausethe central government prioritized financing the national budget and supplying thepopulation with clothes. According to trial accounts, the profit rate for cotton yarnreached 26%, which provided the central government with C$10 billion within fiveyears (Onoe 1971). This prompted the central government to invest intensively inimproving the equipment of the cotton industry, using from 80 to 90% of the totalinvestment for the fabric industry. Particular attention was paid to develop the cottonindustry in districts such as Xian or Shijiazhuang as part of the central government’seconomic strategy to develop inner China. Many engineers in the cotton industrywere educated from the 1930s to the 1940s, and technology transfer progressed viaJapanese cotton mills during the same period. Such achievements in the Republicanperiod undoubtedly helped the government of the People’s Republic of China pursuetheir policies.
7.2.2 Development of the Iron and Steel Industries Before1949 as a Second Example of Capital-IntensiveIndustrialization in China
The starting point of China’s development of iron and steel industries was the estab-lishment of Hanyang Iron Foundry (Hanyang Tiechang) in 1894. The founder, Zhang
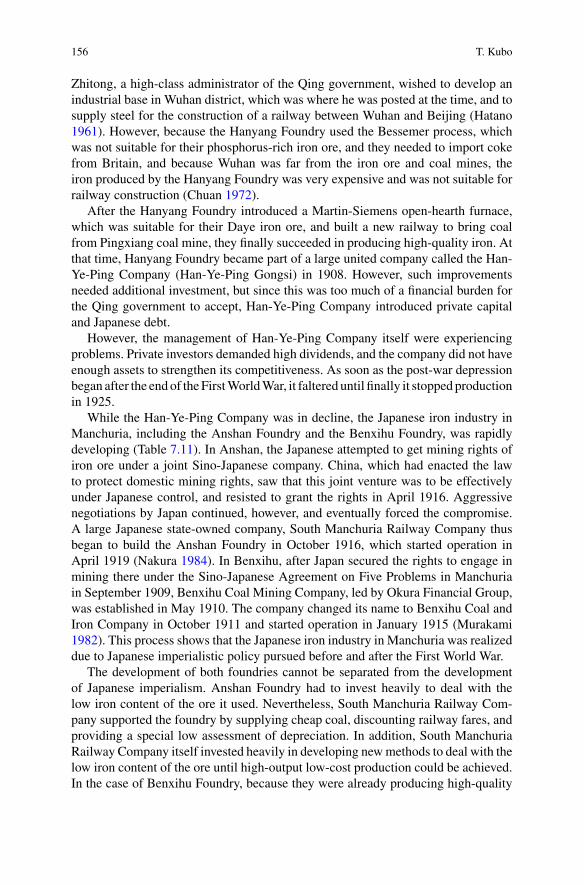
156 T. Kubo
Zhitong, a high-class administrator of the Qing government, wished to develop anindustrial base in Wuhan district, which was where he was posted at the time, and tosupply steel for the construction of a railway between Wuhan and Beijing (Hatano1961). However, because the Hanyang Foundry used the Bessemer process, whichwas not suitable for their phosphorus-rich iron ore, and they needed to import cokefrom Britain, and because Wuhan was far from the iron ore and coal mines, theiron produced by the Hanyang Foundry was very expensive and was not suitable forrailway construction (Chuan 1972).
After the Hanyang Foundry introduced a Martin-Siemens open-hearth furnace,which was suitable for their Daye iron ore, and built a new railway to bring coalfrom Pingxiang coal mine, they finally succeeded in producing high-quality iron. Atthat time, Hanyang Foundry became part of a large united company called the Han-Ye-Ping Company (Han-Ye-Ping Gongsi) in 1908. However, such improvementsneeded additional investment, but since this was too much of a financial burden forthe Qing government to accept, Han-Ye-Ping Company introduced private capitaland Japanese debt.
However, the management of Han-Ye-Ping Company itself were experiencingproblems. Private investors demanded high dividends, and the company did not haveenough assets to strengthen its competitiveness. As soon as the post-war depressionbegan after the end of theFirstWorldWar, it faltered until finally it stopped productionin 1925.
While the Han-Ye-Ping Company was in decline, the Japanese iron industry inManchuria, including the Anshan Foundry and the Benxihu Foundry, was rapidlydeveloping (Table 7.11). In Anshan, the Japanese attempted to get mining rights ofiron ore under a joint Sino-Japanese company. China, which had enacted the lawto protect domestic mining rights, saw that this joint venture was to be effectivelyunder Japanese control, and resisted to grant the rights in April 1916. Aggressivenegotiations by Japan continued, however, and eventually forced the compromise.A large Japanese state-owned company, South Manchuria Railway Company thusbegan to build the Anshan Foundry in October 1916, which started operation inApril 1919 (Nakura 1984). In Benxihu, after Japan secured the rights to engage inmining there under the Sino-Japanese Agreement on Five Problems in Manchuriain September 1909, Benxihu Coal Mining Company, led by Okura Financial Group,was established in May 1910. The company changed its name to Benxihu Coal andIron Company in October 1911 and started operation in January 1915 (Murakami1982). This process shows that the Japanese iron industry in Manchuria was realizeddue to Japanese imperialistic policy pursued before and after the First World War.
The development of both foundries cannot be separated from the developmentof Japanese imperialism. Anshan Foundry had to invest heavily to deal with thelow iron content of the ore it used. Nevertheless, South Manchuria Railway Com-pany supported the foundry by supplying cheap coal, discounting railway fares, andproviding a special low assessment of depreciation. In addition, South ManchuriaRailway Company itself invested heavily in developing newmethods to deal with thelow iron content of the ore until high-output low-cost production could be achieved.In the case of Benxihu Foundry, because they were already producing high-quality
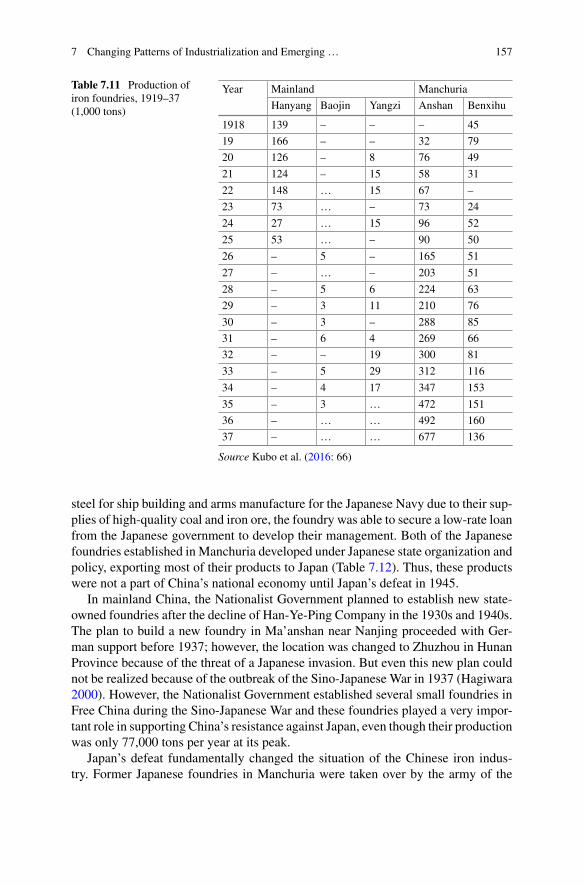
7 Changing Patterns of Industrialization and Emerging … 157
Table 7.11 Production ofiron foundries, 1919–37(1,000 tons)
Year Mainland Manchuria
Hanyang Baojin Yangzi Anshan Benxihu
1918 139 – – – 45
19 166 – – 32 79
20 126 – 8 76 49
21 124 – 15 58 31
22 148 … 15 67 –
23 73 … – 73 24
24 27 … 15 96 52
25 53 … – 90 50
26 – 5 – 165 51
27 – … – 203 51
28 – 5 6 224 63
29 – 3 11 210 76
30 – 3 – 288 85
31 – 6 4 269 66
32 – – 19 300 81
33 – 5 29 312 116
34 – 4 17 347 153
35 – 3 … 472 151
36 – … … 492 160
37 – … … 677 136
Source Kubo et al. (2016: 66)
steel for ship building and arms manufacture for the Japanese Navy due to their sup-plies of high-quality coal and iron ore, the foundry was able to secure a low-rate loanfrom the Japanese government to develop their management. Both of the Japanesefoundries established in Manchuria developed under Japanese state organization andpolicy, exporting most of their products to Japan (Table 7.12). Thus, these productswere not a part of China’s national economy until Japan’s defeat in 1945.
In mainland China, the Nationalist Government planned to establish new state-owned foundries after the decline of Han-Ye-Ping Company in the 1930s and 1940s.The plan to build a new foundry in Ma’anshan near Nanjing proceeded with Ger-man support before 1937; however, the location was changed to Zhuzhou in HunanProvince because of the threat of a Japanese invasion. But even this new plan couldnot be realized because of the outbreak of the Sino-Japanese War in 1937 (Hagiwara2000). However, the Nationalist Government established several small foundries inFree China during the Sino-Japanese War and these foundries played a very impor-tant role in supporting China’s resistance against Japan, even though their productionwas only 77,000 tons per year at its peak.
Japan’s defeat fundamentally changed the situation of the Chinese iron indus-try. Former Japanese foundries in Manchuria were taken over by the army of the
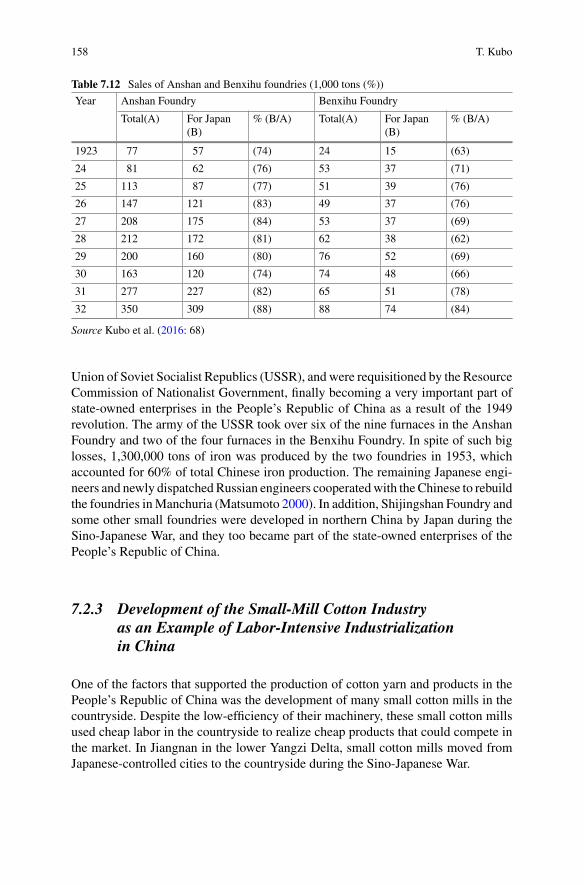
158 T. Kubo
Table 7.12 Sales of Anshan and Benxihu foundries (1,000 tons (%))
Year Anshan Foundry Benxihu Foundry
Total(A) For Japan(B)
% (B/A) Total(A) For Japan(B)
% (B/A)
1923 77 57 (74) 24 15 (63)
24 81 62 (76) 53 37 (71)
25 113 87 (77) 51 39 (76)
26 147 121 (83) 49 37 (76)
27 208 175 (84) 53 37 (69)
28 212 172 (81) 62 38 (62)
29 200 160 (80) 76 52 (69)
30 163 120 (74) 74 48 (66)
31 277 227 (82) 65 51 (78)
32 350 309 (88) 88 74 (84)
Source Kubo et al. (2016: 68)
Union of Soviet Socialist Republics (USSR), and were requisitioned by the ResourceCommission of Nationalist Government, finally becoming a very important part ofstate-owned enterprises in the People’s Republic of China as a result of the 1949revolution. The army of the USSR took over six of the nine furnaces in the AnshanFoundry and two of the four furnaces in the Benxihu Foundry. In spite of such biglosses, 1,300,000 tons of iron was produced by the two foundries in 1953, whichaccounted for 60% of total Chinese iron production. The remaining Japanese engi-neers and newly dispatchedRussian engineers cooperatedwith the Chinese to rebuildthe foundries inManchuria (Matsumoto 2000). In addition, Shijingshan Foundry andsome other small foundries were developed in northern China by Japan during theSino-Japanese War, and they too became part of the state-owned enterprises of thePeople’s Republic of China.
7.2.3 Development of the Small-Mill Cotton Industryas an Example of Labor-Intensive Industrializationin China
One of the factors that supported the production of cotton yarn and products in thePeople’s Republic of China was the development of many small cotton mills in thecountryside. Despite the low-efficiency of their machinery, these small cotton millsused cheap labor in the countryside to realize cheap products that could compete inthe market. In Jiangnan in the lower Yangzi Delta, small cotton mills moved fromJapanese-controlled cities to the countryside during the Sino-Japanese War.
7 Changing Patterns of Industrialization and Emerging … 159
In Wuxi, one area in which these small mills developed, there were seven bigmodern cotton mills with the total of 237,000 spindles. However, three mills burneddown and the other four mills were damaged in October 1937 in the midst of theSino-Japanese War. Only 45,000 spindles of the Qingfeng and Zhenxin Cotton Millswere in operation in the summer of 1939 (Koain 1940: 294). The first response tothis situation was to move the cotton mills to the foreign settlement in Shanghai,where they could continue to operate safely, using imported raw cotton and sellingtheir products in Shanghai’s large market. The second response was to reopen themills under Japanese control in occupied cities. However, both responses producedlimited results as foreign trade became difficult after the start of the Asia-PacificWarat the end of 1941. As a third response, some of the Chinese cotton mills moved theirequipment to the countryside, separating it among many small mills. According tostatistics published by the Preparatory Association of the Shanghai Cotton Industryin 1947, in Jiangnan district alone there were 16 large cotton mills each equippedwith an average of 31,031 average spindles and 57 small cotton mills equipped withan average of 2,979 spindles (Shanghai-shi Mianfangzhi Gongye TongyegonghuiChoubeihui 1950).
Among the semi-official books on local history one finds explanations such as thefollowing:
Cotton mills in Shanghai, Wuxi, and Suzhou, one after another, removed a large proportionof their spinning machines and brought them to cotton-growing areas such as ChangshuCounty to establish new small mills. Twenty small mills equipped with 41,092 spindles wereestablished in Changshu County in Jiangsu Province. (Changshu shi Difangzhi BiansuanWeiyuanhui 1991: 337)
In 1944, Litai Cotton Mill in Taicang County in Jiangsu Province used their equipment andcapital to establish more than 10 new mills in different places. These small mills were eachequipped with about 2,000 spindles. (Changshu shi Difangzhi Biansuan Weiyuanhui 1991:272)
Small mills built in cotton-growing areas could easily obtain cheap raw cottonand then supply cotton products during the wartime period, thereby securing largeprofits (Zhongguo Jindai Fangzhishi Bianweihui 1996–1997: II 34).With these smallmills increasing their demand for cotton yarn, small dye houses and weaving millsalso profited and were able to develop. These mills got good results because mostof them were located in old, cheap buildings and used simple equipment such ascharcoal engines (Zhongguo Jindai Fangzhishi Bianweihui 1996–1997: I 277–278).Most of them were equipped with cheap secondhand spinning machines, althoughsome of them introduced a new simplified spinning machine called a Xinnong shiFangjiji (Xinnong-typeSpinningMachine) (Zhongguo Jindai FangzhishiBianweihui1996–1997: I 43). It should be noted that appreciation for the significance of suchsmall mills was spreading among Chinese engineers. For example, when ZhangFangzuo, (1901–1980, graduate of Tokyo Technical High School), manager of XinyuCotton Mill in Shanghai, wrote a textbook to educate engineers, he recommendedestablishing a small mill equipped with 1,200 spindles. He pointed out that suchsmall mills were suitable for meeting contemporary demand, were easy to start a new
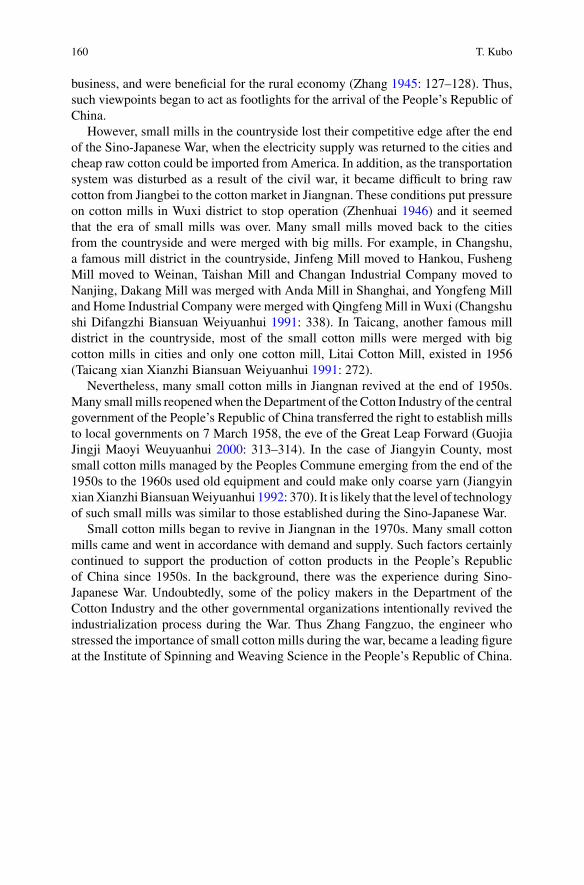
160 T. Kubo
business, and were beneficial for the rural economy (Zhang 1945: 127–128). Thus,such viewpoints began to act as footlights for the arrival of the People’s Republic ofChina.
However, small mills in the countryside lost their competitive edge after the endof the Sino-Japanese War, when the electricity supply was returned to the cities andcheap raw cotton could be imported from America. In addition, as the transportationsystem was disturbed as a result of the civil war, it became difficult to bring rawcotton from Jiangbei to the cotton market in Jiangnan. These conditions put pressureon cotton mills in Wuxi district to stop operation (Zhenhuai 1946) and it seemedthat the era of small mills was over. Many small mills moved back to the citiesfrom the countryside and were merged with big mills. For example, in Changshu,a famous mill district in the countryside, Jinfeng Mill moved to Hankou, FushengMill moved to Weinan, Taishan Mill and Changan Industrial Company moved toNanjing, Dakang Mill was merged with Anda Mill in Shanghai, and Yongfeng Milland Home Industrial Company were merged with QingfengMill inWuxi (Changshushi Difangzhi Biansuan Weiyuanhui 1991: 338). In Taicang, another famous milldistrict in the countryside, most of the small cotton mills were merged with bigcotton mills in cities and only one cotton mill, Litai Cotton Mill, existed in 1956(Taicang xian Xianzhi Biansuan Weiyuanhui 1991: 272).
Nevertheless, many small cotton mills in Jiangnan revived at the end of 1950s.Many smallmills reopenedwhen theDepartment of theCotton Industry of the centralgovernment of the People’s Republic of China transferred the right to establish millsto local governments on 7 March 1958, the eve of the Great Leap Forward (GuojiaJingji Maoyi Weuyuanhui 2000: 313–314). In the case of Jiangyin County, mostsmall cotton mills managed by the Peoples Commune emerging from the end of the1950s to the 1960s used old equipment and could make only coarse yarn (JiangyinxianXianzhi BiansuanWeiyuanhui 1992: 370). It is likely that the level of technologyof such small mills was similar to those established during the Sino-Japanese War.
Small cotton mills began to revive in Jiangnan in the 1970s. Many small cottonmills came and went in accordance with demand and supply. Such factors certainlycontinued to support the production of cotton products in the People’s Republicof China since 1950s. In the background, there was the experience during Sino-Japanese War. Undoubtedly, some of the policy makers in the Department of theCotton Industry and the other governmental organizations intentionally revived theindustrialization process during the War. Thus Zhang Fangzuo, the engineer whostressed the importance of small cotton mills during the war, became a leading figureat the Institute of Spinning and Weaving Science in the People’s Republic of China.
7 Changing Patterns of Industrialization and Emerging … 161
7.3 Wartime Controlled Economy Under the NationalistGovernment: The Controlled and Planned EconomyBefore Mao’s Era
Economic policy played a very important role in China’s economic development.With regard to a controlled economy, in particular, the attitudes of modern Chinesegovernments went through significant changes. Such changes could not be explainedaway by the difference between the Nationalist government and the Communistgovernment, as under the Nationalist government, there was a period of controlledeconomy and a period of open economy. After the Communist government emerged,the range of changes in economic policy became much wider than the period ofthe Nationalist government. In a controlled economy the state puts most economicactivities under its direct control. By contrast, in an open economy intervention ineconomic activities by the state is kept to a minimum and the open market playsan important role. Needless to say, there are various economic systems betweenthese two extremes. Furthermore, in a planned economy the state decides variouseconomic targets to ensure that the economy develops according to a predeterminedplan. A planned economy is closely related to a controlled economy and this was acharacteristic of the USSR type of socialism in the 20th century (Elleman 1979).
7.3.1 Economic Construction by the Nationalist Governmenton the Eve of War
As most western countries adopted controlled economy policies to defend againsteconomic depression and the Union of Soviet Socialist Republics spread propagandahailing the success of their planned economy, many countries began to consider theidea of a controlled and planned economy during 1930s. The idea of a controlled orplanned economyalso becameactive inChina under theNationalist regime.However,the economic policies of the Nationalist government originally proceeded along thelines of a protective tariff policy to promote domestic industries and currency reformto unite and stabilize the Chinese currency (Kubo 1999). No one was thinking ofa controlled and planned economy, including the former leader of the NationalistParty, Sun Yatsen, in his grand plan for economic construction written in 1910s. Asa result, in spite of many calls for implementing a controlled and planned economy,the Nationalist government refused.
The National Economic Committee established under the National Governmentin 1931 was very active from 1933 to 1938, when it was absorbed into the Depart-ment of Economy. The committee comprised officials in the relevant governmentdepartments, famous entrepreneurs in private enterprises, and specialists and engi-neers from industry. The NEC succeeded in improving the quality of the raw cotton,cocoon, and tea, constructing national highways, expanding the irrigation systemby using foreign aid, including American loans, and cooperating with the League
162 T. Kubo
of Nations (Kawai 1982). Thus, the NEC was instrumental in promoting economicdevelopment led by private enterprises in the light industry in the 1930s.
The vice-chairman of the NEC, Song Ziwen, in his address to the members ofthe committee, stressed that the state would help private enterprises. Although hespecifically mentioned a controlled economy, his position was far from supportinga true controlled economy. At that time, one of the economists criticized the NEC,saying that it was not the organization to implement a controlled economy and thatthis interest in a controlled economy was only a passing fad. In reality, although acontrolled economy was often mentioned, their real intentions were actually closerto an open economy (Kubo 1996).
In contrast, the Resource Commission, led by the many technocrats in the Nation-alist government, clearly announced their intention to promote development undera controlled and planned economy from the latter half of the 1930s to the 1940s. Atfirst, the Resource Commission was a secret commission, established as the DefensePlanning Committee under the General Staff of the Nationalist Army in 1932; how-ever, it was reorganized as the Resource Commission under the Military Committeeof theNationalist Government in 1935. In 1938, the Resource Commissionwas againreorganized and enlarged under theDepartment of the Economy. The Resource Com-mission promoted the establishment of a controlled and planned wartime economy,attaching importance to heavy and chemical industries, strengthening developmentof inner districts, and using barter trade comprising the export of strategic materi-als and import of machinery and equipment. This viewpoint helped the ResourceCommission achieve its aim (Zheng et al. 1991; Ishikawa 1991).
Weng Wenhao, the Head of the Resource Commission, was a respected geologistin China, receiving his doctoral degree from Ruben Catholic University in Belgium.He was appointed Secretary of Executive-Yuan by the Nationalist government in1935 and led Chinese economic policy during the very difficult period during andafter the Sino-Japanese War. In 1933, before his appointment, Weng already knewabout the five-year plan of the USSR and its economic system, and had criticized theeconomic policy of the Nationalist government saying that it did not have systematicplanning (Kubo 1996).
The leading organization of the economic policy of the Nationalist govern-ment changed from the NEC to the Resource Commission in the 1930s, and thebasic thought on economic development changed from an open economy to a con-trolled economy accordingly. The outbreak of the Sino-JapaneseWar accelerated thischange. TheNationalist government had other organizations related to economic pol-icy, including the Construction Committee, which mainly supervised power stations,and the Department of Industry, which promoted an export-orientated policy underChen Gongbo until 1937, but the basic trend was not influenced by the activities ofsuch organizations.
7 Changing Patterns of Industrialization and Emerging … 163
7.3.2 Wartime Economy Under the Nationalist Government
The Nationalist government moved from Nanjing to Chongqing, the preliminarycapital, to continue its resistance against Japan. The government promoted the estab-lishment of new factories in inner districts such as Sichuan or Yunnan to strengthenChinese economic power for the ResistanceWar, and some of the industrial factoriesin the coastal districts moved to inner districts. The Chongqing government investedstate funds to establish modern iron foundries, machine factories, electronic facto-ries, and chemical factories, which supported the state-owned munitions industry.The Resource Commission played a decisive role in these activities. According tostatistical data, industrial production in Free China increased more than 50% from1938 to 1942. However, in spite of such growth, the ratio of Free China’s industrialproduction of the total national industrial production reached only about 10% andthe quality of industrial products was poor (Kubo 2004). Nevertheless, the historicalperspective that China could resist invasion by developing a state-owned munitionsindustry in its inner districts seriously influenced the management of China’s econ-omy after the end of the Sino-Japanese War.
Policies for trade control were an important aspect of the controlled economy oftheNationalist government. First, the government tried to stop tradingwith Japanese-occupied areas after the Sino-Japanese War started. At the same time, it establishedthe Trade Adjustment Commission under the Military Committee in October 1937,conducting collective purchases and sales for exporting agricultural products andores through their three state-owned trade companies. The Trade Adjustment Com-mission was reorganized to become the Trade Commission under the Department ofFinance in February 1938. The Trade Commission aimed to maintain a trade balanceto continue importing munitions and securing foreign loans. Although several prob-lems occurred, such as corruption of officials, the controlled trade system allowedthe government to use transportation efficiently and adjust trading price adequately(Zheng 2004).
However, the situation changed after the outbreak of theAsia-PacificWar.Becausetrade routes between Free China and the outside world were almost stopped, thelack of various materials became more serious in Free China. So the Chongqinggovernment changed the aim of its trade policy to acquire materials, promulgating anew act on 11th May 1942. This loosened the control of trade to allow the importsof materials essential for the construction of defense base and the daily necessitiesof the population.
Another control policy concerned the control of price and production. As theamount of food and cotton goods in the market decreased, their price increased inFree China. The Chongqing government tried to limit the price of several foodstuffsand cotton goods in the largest cities. In addition, the government pursued collectivepurchase and sale of such materials; however, the results were limited. For example,in the case of raw cotton, as the supply decreased, the production of cotton yarnalso decreased. Cotton farmers did not want to sell their raw cotton for the low pricedecided by the government, and so a considerable amount of raw cotton flowed
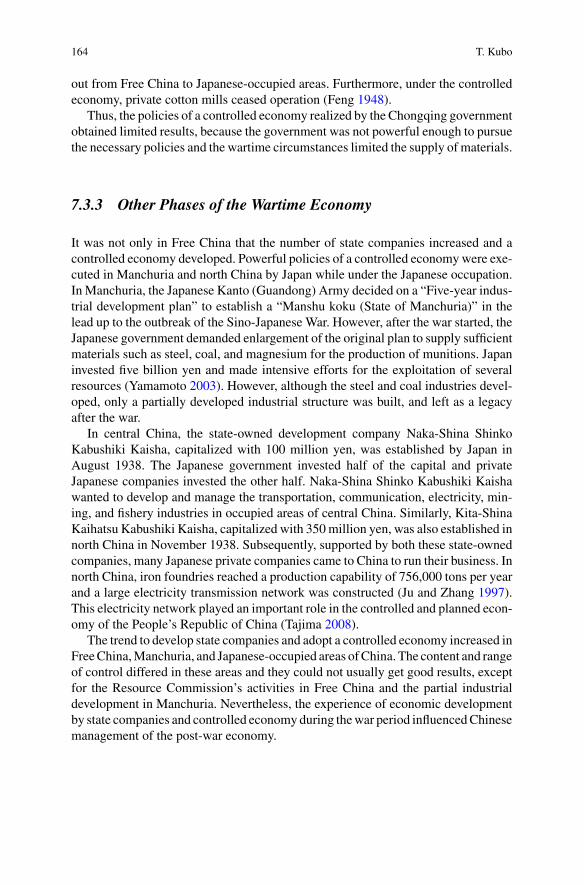
164 T. Kubo
out from Free China to Japanese-occupied areas. Furthermore, under the controlledeconomy, private cotton mills ceased operation (Feng 1948).
Thus, the policies of a controlled economy realized by the Chongqing governmentobtained limited results, because the government was not powerful enough to pursuethe necessary policies and the wartime circumstances limited the supply of materials.
7.3.3 Other Phases of the Wartime Economy
It was not only in Free China that the number of state companies increased and acontrolled economy developed. Powerful policies of a controlled economywere exe-cuted in Manchuria and north China by Japan while under the Japanese occupation.In Manchuria, the Japanese Kanto (Guandong) Army decided on a “Five-year indus-trial development plan” to establish a “Manshu koku (State of Manchuria)” in thelead up to the outbreak of the Sino-Japanese War. However, after the war started, theJapanese government demanded enlargement of the original plan to supply sufficientmaterials such as steel, coal, and magnesium for the production of munitions. Japaninvested five billion yen and made intensive efforts for the exploitation of severalresources (Yamamoto 2003). However, although the steel and coal industries devel-oped, only a partially developed industrial structure was built, and left as a legacyafter the war.
In central China, the state-owned development company Naka-Shina ShinkoKabushiki Kaisha, capitalized with 100 million yen, was established by Japan inAugust 1938. The Japanese government invested half of the capital and privateJapanese companies invested the other half. Naka-Shina Shinko Kabushiki Kaishawanted to develop and manage the transportation, communication, electricity, min-ing, and fishery industries in occupied areas of central China. Similarly, Kita-ShinaKaihatsu Kabushiki Kaisha, capitalized with 350million yen, was also established innorth China in November 1938. Subsequently, supported by both these state-ownedcompanies, many Japanese private companies came to China to run their business. Innorth China, iron foundries reached a production capability of 756,000 tons per yearand a large electricity transmission network was constructed (Ju and Zhang 1997).This electricity network played an important role in the controlled and planned econ-omy of the People’s Republic of China (Tajima 2008).
The trend to develop state companies and adopt a controlled economy increased inFreeChina,Manchuria, and Japanese-occupied areas ofChina. The content and rangeof control differed in these areas and they could not usually get good results, exceptfor the Resource Commission’s activities in Free China and the partial industrialdevelopment in Manchuria. Nevertheless, the experience of economic developmentby state companies and controlled economyduring thewar period influencedChinesemanagement of the post-war economy.
7 Changing Patterns of Industrialization and Emerging … 165
7.4 Concluding Remarks
One of the historical roots of industrialization in China was certainly the investmentsand various economic policies made by the state, but the role of the state was limitedin the 19th century. The influence of the global economy, including foreign trade andinvestment, strongly promoted Chinese industrialization in its early stage.
China’s struggle toward becoming a modern nation state started at the end of theQing dynasty and continued through the Republican period.Many private enterprisesdeveloped under the various protectionist policies pursued by the newly emergingnation state. In particular, the protective tariff and currency reform of the Nationalistgovernment played a decisive role.
Two kinds of industrialization can be seen in modern China from the 19th to the20th century—capital-intensive industrialization characterized by the developmentof the large cotton mills in Shanghai and the Japanese iron foundries in Manchuria,and labor-intensive industrialization characterized by the development of the smallcotton mills in Jiangnan, and both types of industrialization proceeded simultane-ously.
The sphere of the state’s economic activities widened from the 1940s to the 1970sunder a controlled and planned economy, as China adopted a wartime economy firstagainst the Japanese invasion and then against the United States of America andthe Union of Soviet Socialist Republics. The development of state companies andadoption of a controlled economy increased in Free China,Manchuria, and Japanese-occupied areas during the Sino-Japanese War, and this trend was continued andstrengthened during Mao Zedong’s era. As a result, although heavy industries andmunitions industry developed, the process of industrialization faced many problems.At the end of the 1970s, after China opened its door to the world again, industri-alization in China began to proceed under an intimate relationship with the globaleconomy. It also involved amuch greater number of private enterprises, ranging fromlarge enterprises in cities and smaller enterprises throughout the country to lots ofsmall-scale industrial activities in the countryside.
References
Changshu shi Difangzhi Biansuan Weiyuanhui. (1991). Changshu-shi Zhi (History of Changshu-city). Shanghai: Shanghai Renmin Chubanshe.
Chuan,H. (1972).Han-ye-pingGongsi Shilue (Abrief history theHan-ye-ping Iron andCoalMiningand Smelting Company 1890–1926). Hong Kong: The Chinese University of Hong Kong.
Elleman, M. (1979). Socialist Planning. Cambridge: Cambridge University Press.Feng, S. (1948). Minyuanlai woguo zhi mianfangzhi gongye (Cotton industry in China from 1912).In S. Zhu (Ed.)Minguo Jingjishi (The economic history of RepublicanChina). Shanghai: YinhangZhoubao She.
Guojia Jingji Maoyi Weuyuanhui (National Economic and Trade Committee). (2000). ZhongguoGongye wushi nian (The fifty years of China’s industry). Beijing: Jingji Chubanshe.
166 T. Kubo
Hagiwara, M. (2000). Chugoku no Keizaikensetsu to Nicchukankei: Tainichikosen heno Jokyoku1927–1937nen (China’s economic construction and Sino-Japanese relationship: a prelude for theresistance war against Japan, 1927–1937). Kyoto: Mineruva Shobo.
Hatano, Y. (1961).Chugoku Kindai Kogyoshi no Kenkyu (A study on the history of Chinese modernindustry). Kyoto: Toyoshi Kenkyukai.
Ishikawa, Y. (1991). Nankinseifu-jiki no gijutsu-kanryo no keisei to hatten: Kindai-Chugoku gijut-susha no keifu (The formation and development of technocrats in the Nanjing Government Era).Shirin, 7(2).
Jiangyin shi Xianzhi Biansuan Weiyuanhui. (1992). Jiangyin-shi Zhi (History of Jiangyin-city).Shanghai: Shanghai Renmin Chubanshe.
Ju, Z., & Zhang, L. (1997). Riben zai Huabei Jingji Tongzhi Luetuo-shi (The history of Japaneseplunder and economic control in North China). Tianjin: Tianjin Guji Chubanshe.
Kawai, S. (1982). Zenkokukeizaiiiinkai no seiritsu to sono kaiso o meguru ici-kosatsu (A surveyon the establishment and reorganization of the National Economic Committee). Toyoshi Kenkyu,40(4).
Kawai, S. (1987). Sengochugoku boshokugyo no keisei to Kokuminseifu: Chugoku boshoku konsuno seiritsukatei (The formation of China’s cotton industry and the National Government afterthe World War II: The process of the establishment of the Chinese cotton industry constructingCompany). Kokusaikankeiron Kenkyu, 6.
Kiyokawa, Y. (1983). Chugoku senyi-kikai kogyo no hatten to zaikabo no igi (The development ofChina’s fiber machine industry and the meaning of Japanese cotton mills in China).Keizaikenkyu,34(1).
Koain. (1940).Mushaku Kogyo Jittaichosa Hokoku-sho (A survey report of Wuxi Industry). Tokyo:Koain Seimubu. Chosashiryo 18.
Kubo, T. (1996). Kin-gendai Chugoku ni okeru kokka to keizai: Chuka minkoku-ki keizai seisaku-shiron (State and economy ofmodern and contemporary China: Understanding the history of eco-nomic policy of the Republican period). In T. Yamada (Ed.) Rekishi no nakano Gendai Chugoku(Contemporary China in the History). Tokyo: Keiso Shobo.
Kubo, T. (1999). Senkanki Chugoku<Jiritsu enoMosaku>:Kanzei Tsuka Seisaku toKeizaHhatten(China’s quest for sovereignty in the interwar period: Tariff policy and economic development).Tokyo: Tokyo Daigaku Shppankai.
Kubo, T. (2004). Senji no kogyo seisaku to kogyo hatten (Industrial policy and development duringthe war-time). In N. Ishijima & T. Kubo (Eds.) Jukei Kokuminseifushi no Kenkyu (History of theChongqing National Government). Tokyo: Tokyo Daigaku Shuppankai.
Kubo, T. (Ed.). (2012). Chugoku Keizaishi Nyumon (An introduction to China’s economic history).Tokyo: Tokyo Daigaku Shuppankai.
Kubo, T. et al. (2016). Tokei de Miru Chugoku Kin-gendai Keizaishi (Economic history of modernChina: An approach based on statistical data). Tokyo: Tokyo Daigaku Shuppankai.
Matsumoto, T. (2000). “Manshu-koku” kara Shin Chugoku e: Anzan Tekkogyo karamita Chugoku-tohoku no Saihenkatei, 1940–1954 (From “the state of Manchuria” to New China: Reorganizingprocess seen from the Anshan Steel Industry 1940–1954). Nagoya: Nagoya Daigaku Shuppankai.
Murakami, K. (1982). Okura Zaibatsu no Kenkyu: Okura to Tairiku (A study on Okura FinancialGroup: “Okura” and Mainland). Tokyo: Kondo Shuppansha.
Nakai, H. (1996). Choken to Chugoku Kindai Kigyo (Zhang Jian and Chinese Modern Enterprise).Hokkaido: Hokkaido Daigaku Tosho Kankokai.
Nakura, B. (1984).NihonTekkogyoshi noKenkyu (A study on the history of Japanese Steel Industry).Tokyo: Kondo Shuppansha.
Onoe, E. (1971). Chugoku Sangyoricchi no Kenkyu (A study on regional distribution of China’sIndustry). Tokyo: Institute of Developing Economies.
Shanghai-shi Mianfangzhi Gongye Tongyegonghui Choubeihui (Preparatory Association of theShanghai Cotton Industry). (1950). Zhongguo Mianfang Tongji Shiliao (Historical statistics ofChina’s Cotton Industry). Shanghai.
7 Changing Patterns of Industrialization and Emerging … 167
Suzuki, T. (1992). Yomu Undo no Kenkyu (A study of the westernization movement in China in thelatter half of the nineteenth century). Tokyo: Kyuko Shoin.
Taicang xian Xianzhi BiansuanWeiyuanhui. (1991). Taicang-xian Zhi (History of Taicang County).Nanjing: Jiangsu Renmin Chubanshe.
Tajima, T. (2008).Gendai Chugoku no Denryoku Sangyo (Electric power industry of contemporaryChina). Kyoto: Showado.
Takamura, N. (1982).Kindai NihonMengyo to Chugoku (The modern Japanese cotton industry andChina). Tokyo: Tokyo Daigaku Shuppankai.
Tanaka, M. (1973). Nisshin senso-go no Shanhai kindai “gaisho” boseki-gyo to Chugoku shijo(Shanghai foreign-owned modern cotton industry and Chinese market after Sino-Japanese Warof 1894). In H. Yamada (Ed.), Shokuminchi Keizaishi no Shomondai (Several problems in thehistory of colonial economies). Tokyo: Institute of Developing Economies.
Wang, Z. (1990). Gudao-shiqi de minzu mianfang gongye (National cotton industry in the so-calledsolitary island era). In Zhongguo Jindai Jingjishi Yanjiu Ziliao (Materials of Chinese moderneconomic history) 10. Shanghai: Shanghai Shehui Kexueyuan Chubanshe.
Yamamoto, Y. (2003). “Manshu-koku” Keizai-shi Kenkyu (A study on economic history of “TheState of Manchuria”). Nagoya: Nagoya Daigaku Shuppankai.
Zhang, F. (1945). Mianfangzhi Gongchang zhi Sheji yu Guanli (Plan and management of cottonmill). Shanghai: Kaiming Shudian.
Zhenhuai. (1946). Zuijin Wuxi fangzhiye de gaikuang (Recent outlook of cotton industry in Wuxi).Jingji Zhoubao, 2(2).
Zheng, H. (2004). Boeki tosei seisaku (The policy of controlled trade). In N. Ishijima & T. Kubo(Eds.) JukeiKokuminseifushi noKenkyu (History of theChongqingNationalGovernment). Tokyo:Tokyo Daigaku Shuppankai.
Zheng, Y., et al. (1991). Jiu-Zhongguo de Ziyuan Weiyuanhui (1932–1949): Shishi yu Pingjia (TheResource Commission in Old China, 1932–1949: Facts and estimation). Shanghai: ShanghaiShehuikexue Chubanshe.
Zhongguo Jindai Fangzhishi Bianweihui. (1996–1997). Zhongguo Jindai Fangzhishi (shang-ce,xia-ce) (History of Chinese modern fabric industry (1)–(2)). Beijing: Fangzhi Chubanshe.
Open Access This chapter is licensed under the terms of the Creative Commons Attribution-NonCommercial-NoDerivatives 4.0 International License (http://creativecommons.org/licenses/by-nc-nd/4.0/), which permits any noncommercial use, sharing, distribution and reproduction in anymedium or format, as long as you give appropriate credit to the original author(s) and the source,provide a link to the Creative Commons licence and indicate if you modified the licensed material.You do not have permission under this licence to share adapted material derived from this chapteror parts of it.
The images or other third party material in this chapter are included in the chapter’s CreativeCommons licence, unless indicated otherwise in a credit line to the material. If material is notincluded in the chapter’s Creative Commons licence and your intended use is not permitted bystatutory regulation or exceeds the permitted use, you will need to obtain permission directly fromthe copyright holder.
Chapter 8Historical Roots of Industrialisationand the Emerging State in Colonial India
Chikayoshi Nomura
8.1 Introduction
Following a clear shift towards economic liberalisation in economic policy in theearly 1980s, India’s economic growth rate rose from the notorious ‘Hindu growthrate’ of 3% to over 6%, helping improve the welfare standard of its one billionplus population, while providing market opportunities to producers and investorselsewhere in the world. The high growth rate resulted in the awakening of India,which has received worldwide attention.
One of the driving forces of the high growth rate is the expansion for 3 decades inthe activities of private industrial enterprises, whose origins date back to the colonialera. By the time of independence, India already had various ‘modern’ industrial sec-tors covering mining, textile, iron and steel, and chemical. Some had even reachedglobal standards in terms of production and employment, although the overall indus-trialisation level was far from sufficient. The history of active private industrial enter-prise has formed one of the important foundations of the current high rate growth ofIndian economy since the early 1980s. This chapter reviews India’s industrialisationin the colonial era, focusing on its stagnated nature and three known hypotheses onthe causes of the stagnation.
The chapter consists of six sections. Section 8.2 reviews the stagnated nature ofcolonial India’s industrialisation. The next three sections review three hypotheseson the possible causes of the stagnated industrial development in colonial India.Section 8.3 addresses the common hypothesis proposed by scholars such as
I cordially appreciate encouraging and illuminating comments I received from the editors andcontributors of this book for the past 2 years. Needless to say, all responsibility of any possibleerrors solely rest upon me.
C. Nomura (B)Graduate School of Literature and Human Science, Osaka City University, Osaka, Japane-mail: [email protected]
© The Author(s) 2019K. Otsuka and K. Sugihara (eds.), Paths to the Emerging State in Asia and Africa,Emerging-Economy State and International Policy Studies,https://doi.org/10.1007/978-981-13-3131-2_8
169
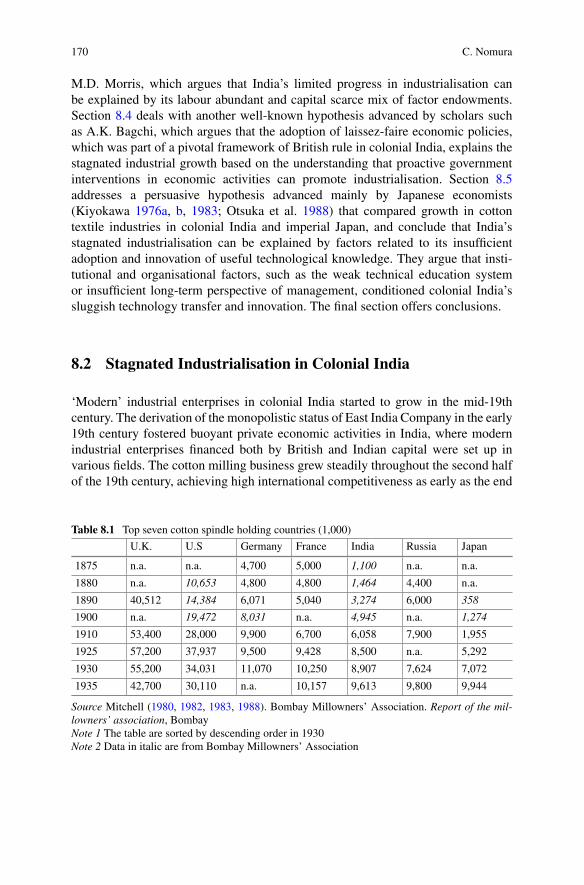
170 C. Nomura
M.D. Morris, which argues that India’s limited progress in industrialisation canbe explained by its labour abundant and capital scarce mix of factor endowments.Section 8.4 deals with another well-known hypothesis advanced by scholars suchas A.K. Bagchi, which argues that the adoption of laissez-faire economic policies,which was part of a pivotal framework of British rule in colonial India, explains thestagnated industrial growth based on the understanding that proactive governmentinterventions in economic activities can promote industrialisation. Section 8.5addresses a persuasive hypothesis advanced mainly by Japanese economists(Kiyokawa 1976a, b, 1983; Otsuka et al. 1988) that compared growth in cottontextile industries in colonial India and imperial Japan, and conclude that India’sstagnated industrialisation can be explained by factors related to its insufficientadoption and innovation of useful technological knowledge. They argue that insti-tutional and organisational factors, such as the weak technical education systemor insufficient long-term perspective of management, conditioned colonial India’ssluggish technology transfer and innovation. The final section offers conclusions.
8.2 Stagnated Industrialisation in Colonial India
‘Modern’ industrial enterprises in colonial India started to grow in the mid-19thcentury. The derivation of the monopolistic status of East India Company in the early19th century fostered buoyant private economic activities in India, where modernindustrial enterprises financed both by British and Indian capital were set up invarious fields. The cotton milling business grew steadily throughout the second halfof the 19th century, achieving high international competitiveness as early as the end
Table 8.1 Top seven cotton spindle holding countries (1,000)
U.K. U.S Germany France India Russia Japan
1875 n.a. n.a. 4,700 5,000 1,100 n.a. n.a.
1880 n.a. 10,653 4,800 4,800 1,464 4,400 n.a.
1890 40,512 14,384 6,071 5,040 3,274 6,000 358
1900 n.a. 19,472 8,031 n.a. 4,945 n.a. 1,274
1910 53,400 28,000 9,900 6,700 6,058 7,900 1,955
1925 57,200 37,937 9,500 9,428 8,500 n.a. 5,292
1930 55,200 34,031 11,070 10,250 8,907 7,624 7,072
1935 42,700 30,110 n.a. 10,157 9,613 9,800 9,944
Source Mitchell (1980, 1982, 1983, 1988). Bombay Millowners’ Association. Report of the mil-lowners’ association, BombayNote 1 The table are sorted by descending order in 1930Note 2 Data in italic are from Bombay Millowners’ Association
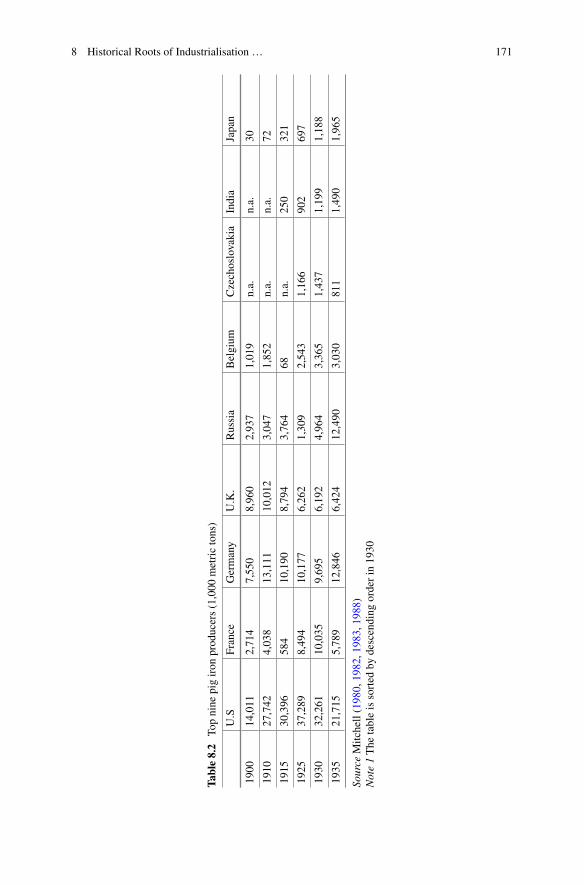
8 Historical Roots of Industrialisation … 171
Table8.2
Topnine
pigiron
producers(1,000
metrictons)
U.S
France
Germany
U.K.
Russia
Belgium
Czechoslovakia
India
Japan
1900
14,011
2,714
7,550
8,960
2,937
1,019
n.a.
n.a.
30
1910
27,742
4,038
13,111
10,012
3,047
1,852
n.a.
n.a.
72
1915
30,396
584
10,190
8,794
3,764
68n.a.
250
321
1925
37,289
8,494
10,177
6,262
1,309
2,543
1,166
902
697
1930
32,261
10,035
9,695
6,192
4,964
3,365
1,437
1,199
1,188
1935
21,715
5,789
12,846
6,424
12,490
3,030
811
1,490
1,965
Sour
ceMitc
hell(1980,
1982,1
983,
1988)
Not
e1The
tableissorted
bydescending
orderin
1930
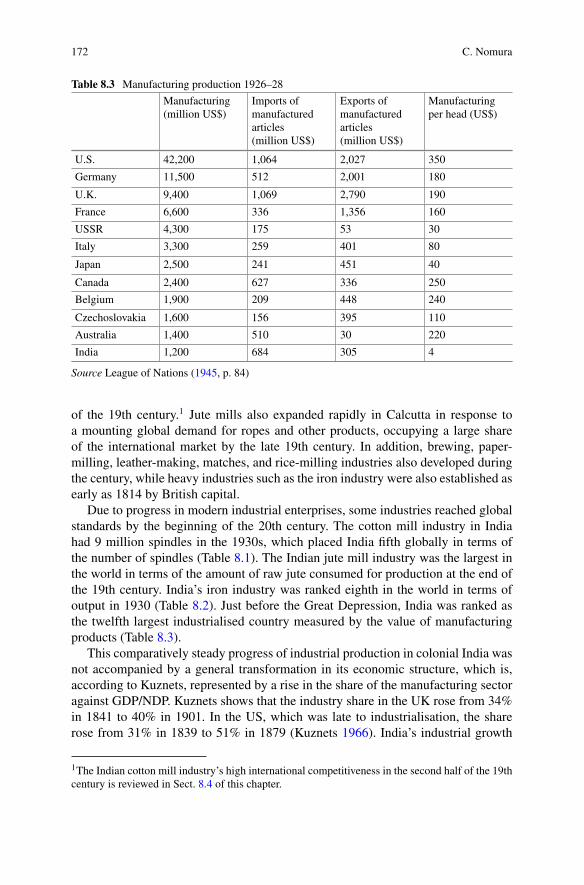
172 C. Nomura
Table 8.3 Manufacturing production 1926–28
Manufacturing(million US$)
Imports ofmanufacturedarticles(million US$)
Exports ofmanufacturedarticles(million US$)
Manufacturingper head (US$)
U.S. 42,200 1,064 2,027 350
Germany 11,500 512 2,001 180
U.K. 9,400 1,069 2,790 190
France 6,600 336 1,356 160
USSR 4,300 175 53 30
Italy 3,300 259 401 80
Japan 2,500 241 451 40
Canada 2,400 627 336 250
Belgium 1,900 209 448 240
Czechoslovakia 1,600 156 395 110
Australia 1,400 510 30 220
India 1,200 684 305 4
Source League of Nations (1945, p. 84)
of the 19th century.1 Jute mills also expanded rapidly in Calcutta in response toa mounting global demand for ropes and other products, occupying a large shareof the international market by the late 19th century. In addition, brewing, paper-milling, leather-making, matches, and rice-milling industries also developed duringthe century, while heavy industries such as the iron industry were also established asearly as 1814 by British capital.
Due to progress in modern industrial enterprises, some industries reached globalstandards by the beginning of the 20th century. The cotton mill industry in Indiahad 9 million spindles in the 1930s, which placed India fifth globally in terms ofthe number of spindles (Table 8.1). The Indian jute mill industry was the largest inthe world in terms of the amount of raw jute consumed for production at the end ofthe 19th century. India’s iron industry was ranked eighth in the world in terms ofoutput in 1930 (Table 8.2). Just before the Great Depression, India was ranked asthe twelfth largest industrialised country measured by the value of manufacturingproducts (Table 8.3).
This comparatively steady progress of industrial production in colonial India wasnot accompanied by a general transformation in its economic structure, which is,according to Kuznets, represented by a rise in the share of the manufacturing sectoragainst GDP/NDP. Kuznets shows that the industry share in the UK rose from 34%in 1841 to 40% in 1901. In the US, which was late to industrialisation, the sharerose from 31% in 1839 to 51% in 1879 (Kuznets 1966). India’s industrial growth
1The Indian cotton mill industry’s high international competitiveness in the second half of the 19thcentury is reviewed in Sect. 8.4 of this chapter.
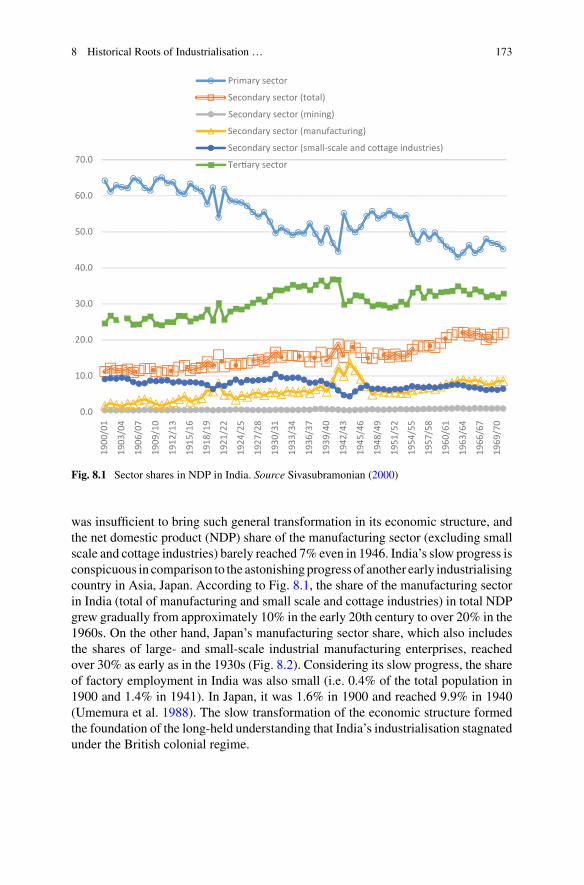
8 Historical Roots of Industrialisation … 173
0.0
10.0
20.0
30.0
40.0
50.0
60.0
70.0
Primary sector
Secondary sector (total)
Secondary sector (mining)
Secondary sector (manufacturing)
Secondary sector (small-scale and co age industries)
Ter ary sector
1900
/01
1903
/04
1906
/07
1909
/10
1912
/13
1915
/16
1918
/19
1921
/22
1924
/25
1927
/28
1930
/31
1933
/34
1936
/37
1939
/40
1942
/43
1945
/46
1948
/49
1951
/52
1954
/55
1957
/58
1960
/61
1963
/64
1966
/67
1969
/70
Fig. 8.1 Sector shares in NDP in India. Source Sivasubramonian (2000)
was insufficient to bring such general transformation in its economic structure, andthe net domestic product (NDP) share of the manufacturing sector (excluding smallscale and cottage industries) barely reached 7% even in 1946. India’s slow progress isconspicuous in comparison to the astonishingprogress of another early industrialisingcountry in Asia, Japan. According to Fig. 8.1, the share of the manufacturing sectorin India (total of manufacturing and small scale and cottage industries) in total NDPgrew gradually from approximately 10% in the early 20th century to over 20% in the1960s. On the other hand, Japan’s manufacturing sector share, which also includesthe shares of large- and small-scale industrial manufacturing enterprises, reachedover 30% as early as in the 1930s (Fig. 8.2). Considering its slow progress, the shareof factory employment in India was also small (i.e. 0.4% of the total population in1900 and 1.4% in 1941). In Japan, it was 1.6% in 1900 and reached 9.9% in 1940(Umemura et al. 1988). The slow transformation of the economic structure formedthe foundation of the long-held understanding that India’s industrialisation stagnatedunder the British colonial regime.
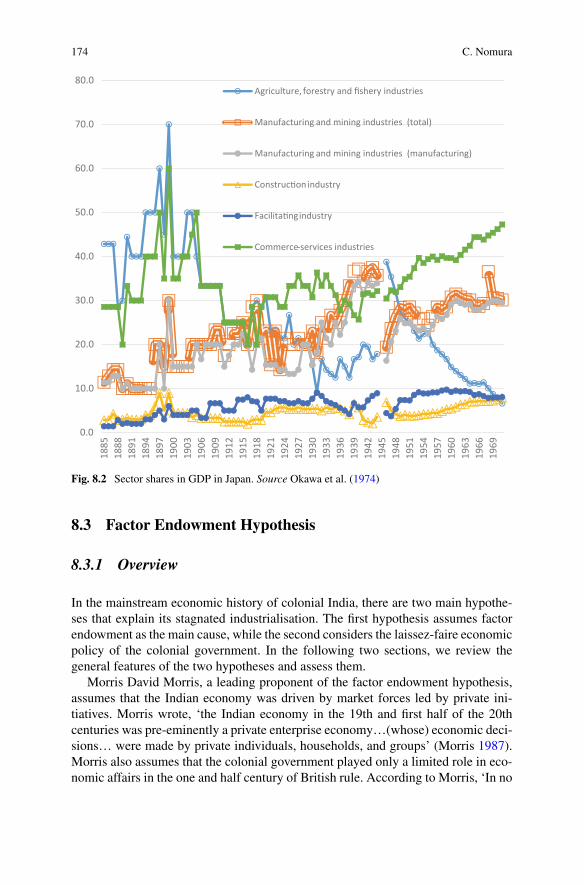
174 C. Nomura
0.0
10.0
20.0
30.0
40.0
50.0
60.0
70.0
80.0
1885
1888
1891
1894
1897
1900
1903
1906
1909
1912
1915
1918
1921
1924
1927
1930
1933
1936
1939
1942
1945
1948
1951
1954
1957
1960
1963
1966
1969
Agriculture, forestry and fishery industries
Manufacturing and mining industries (total)
Manufacturing and mining industries (manufacturing)
Construc on industry
Facilita ngindustry
Commerce-services industries
Fig. 8.2 Sector shares in GDP in Japan. Source Okawa et al. (1974)
8.3 Factor Endowment Hypothesis
8.3.1 Overview
In the mainstream economic history of colonial India, there are two main hypothe-ses that explain its stagnated industrialisation. The first hypothesis assumes factorendowment as the main cause, while the second considers the laissez-faire economicpolicy of the colonial government. In the following two sections, we review thegeneral features of the two hypotheses and assess them.
Morris David Morris, a leading proponent of the factor endowment hypothesis,assumes that the Indian economy was driven by market forces led by private ini-tiatives. Morris wrote, ‘the Indian economy in the 19th and first half of the 20thcenturies was pre-eminently a private enterprise economy…(whose) economic deci-sions… were made by private individuals, households, and groups’ (Morris 1987).Morris also assumes that the colonial government played only a limited role in eco-nomic affairs in the one and half century of British rule. According to Morris, ‘In no
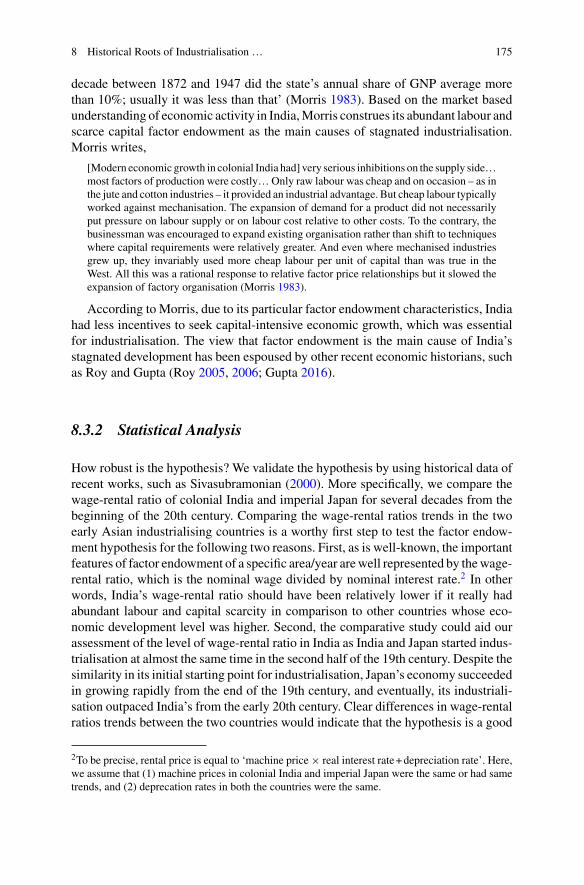
8 Historical Roots of Industrialisation … 175
decade between 1872 and 1947 did the state’s annual share of GNP average morethan 10%; usually it was less than that’ (Morris 1983). Based on the market basedunderstanding of economic activity in India,Morris construes its abundant labour andscarce capital factor endowment as the main causes of stagnated industrialisation.Morris writes,
[Modern economic growth in colonial India had] very serious inhibitions on the supply side…most factors of production were costly…Only raw labour was cheap and on occasion – as inthe jute and cotton industries – it provided an industrial advantage. But cheap labour typicallyworked against mechanisation. The expansion of demand for a product did not necessarilyput pressure on labour supply or on labour cost relative to other costs. To the contrary, thebusinessman was encouraged to expand existing organisation rather than shift to techniqueswhere capital requirements were relatively greater. And even where mechanised industriesgrew up, they invariably used more cheap labour per unit of capital than was true in theWest. All this was a rational response to relative factor price relationships but it slowed theexpansion of factory organisation (Morris 1983).
According to Morris, due to its particular factor endowment characteristics, Indiahad less incentives to seek capital-intensive economic growth, which was essentialfor industrialisation. The view that factor endowment is the main cause of India’sstagnated development has been espoused by other recent economic historians, suchas Roy and Gupta (Roy 2005, 2006; Gupta 2016).
8.3.2 Statistical Analysis
How robust is the hypothesis? We validate the hypothesis by using historical data ofrecent works, such as Sivasubramonian (2000). More specifically, we compare thewage-rental ratio of colonial India and imperial Japan for several decades from thebeginning of the 20th century. Comparing the wage-rental ratios trends in the twoearly Asian industrialising countries is a worthy first step to test the factor endow-ment hypothesis for the following two reasons. First, as is well-known, the importantfeatures of factor endowment of a specific area/year arewell represented by thewage-rental ratio, which is the nominal wage divided by nominal interest rate.2 In otherwords, India’s wage-rental ratio should have been relatively lower if it really hadabundant labour and capital scarcity in comparison to other countries whose eco-nomic development level was higher. Second, the comparative study could aid ourassessment of the level of wage-rental ratio in India as India and Japan started indus-trialisation at almost the same time in the second half of the 19th century. Despite thesimilarity in its initial starting point for industrialisation, Japan’s economy succeededin growing rapidly from the end of the 19th century, and eventually, its industriali-sation outpaced India’s from the early 20th century. Clear differences in wage-rentalratios trends between the two countries would indicate that the hypothesis is a good
2To be precise, rental price is equal to ‘machine price× real interest rate+depreciation rate’. Here,we assume that (1) machine prices in colonial India and imperial Japan were the same or had sametrends, and (2) deprecation rates in both the countries were the same.
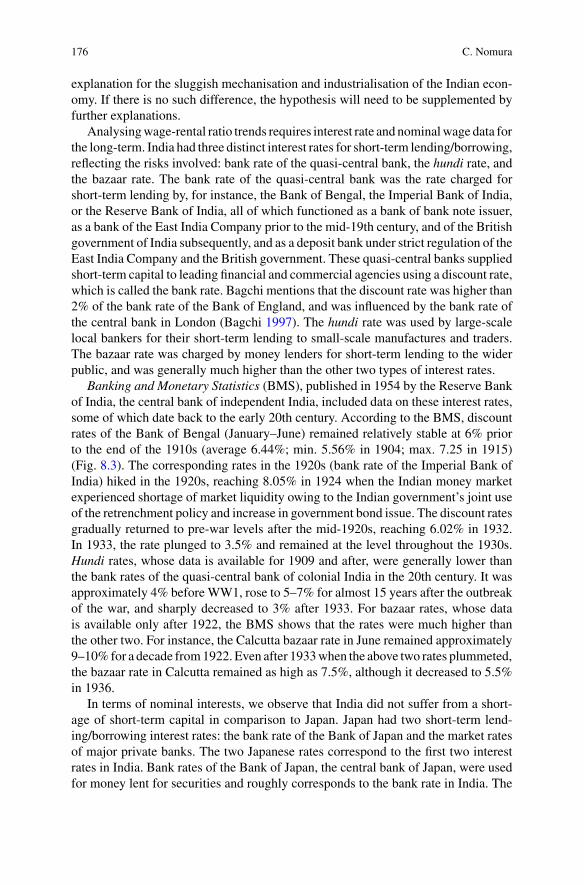
176 C. Nomura
explanation for the sluggish mechanisation and industrialisation of the Indian econ-omy. If there is no such difference, the hypothesis will need to be supplemented byfurther explanations.
Analysingwage-rental ratio trends requires interest rate and nominalwage data forthe long-term. India had three distinct interest rates for short-term lending/borrowing,reflecting the risks involved: bank rate of the quasi-central bank, the hundi rate, andthe bazaar rate. The bank rate of the quasi-central bank was the rate charged forshort-term lending by, for instance, the Bank of Bengal, the Imperial Bank of India,or the Reserve Bank of India, all of which functioned as a bank of bank note issuer,as a bank of the East India Company prior to the mid-19th century, and of the Britishgovernment of India subsequently, and as a deposit bank under strict regulation of theEast India Company and the British government. These quasi-central banks suppliedshort-term capital to leading financial and commercial agencies using a discount rate,which is called the bank rate. Bagchi mentions that the discount rate was higher than2% of the bank rate of the Bank of England, and was influenced by the bank rate ofthe central bank in London (Bagchi 1997). The hundi rate was used by large-scalelocal bankers for their short-term lending to small-scale manufactures and traders.The bazaar rate was charged by money lenders for short-term lending to the widerpublic, and was generally much higher than the other two types of interest rates.
Banking and Monetary Statistics (BMS), published in 1954 by the Reserve Bankof India, the central bank of independent India, included data on these interest rates,some of which date back to the early 20th century. According to the BMS, discountrates of the Bank of Bengal (January–June) remained relatively stable at 6% priorto the end of the 1910s (average 6.44%; min. 5.56% in 1904; max. 7.25 in 1915)(Fig. 8.3). The corresponding rates in the 1920s (bank rate of the Imperial Bank ofIndia) hiked in the 1920s, reaching 8.05% in 1924 when the Indian money marketexperienced shortage of market liquidity owing to the Indian government’s joint useof the retrenchment policy and increase in government bond issue. The discount ratesgradually returned to pre-war levels after the mid-1920s, reaching 6.02% in 1932.In 1933, the rate plunged to 3.5% and remained at the level throughout the 1930s.Hundi rates, whose data is available for 1909 and after, were generally lower thanthe bank rates of the quasi-central bank of colonial India in the 20th century. It wasapproximately 4% before WW1, rose to 5–7% for almost 15 years after the outbreakof the war, and sharply decreased to 3% after 1933. For bazaar rates, whose datais available only after 1922, the BMS shows that the rates were much higher thanthe other two. For instance, the Calcutta bazaar rate in June remained approximately9–10% for a decade from1922. Even after 1933when the above two rates plummeted,the bazaar rate in Calcutta remained as high as 7.5%, although it decreased to 5.5%in 1936.
In terms of nominal interests, we observe that India did not suffer from a short-age of short-term capital in comparison to Japan. Japan had two short-term lend-ing/borrowing interest rates: the bank rate of the Bank of Japan and the market ratesof major private banks. The two Japanese rates correspond to the first two interestrates in India. Bank rates of the Bank of Japan, the central bank of Japan, were usedfor money lent for securities and roughly corresponds to the bank rate in India. The
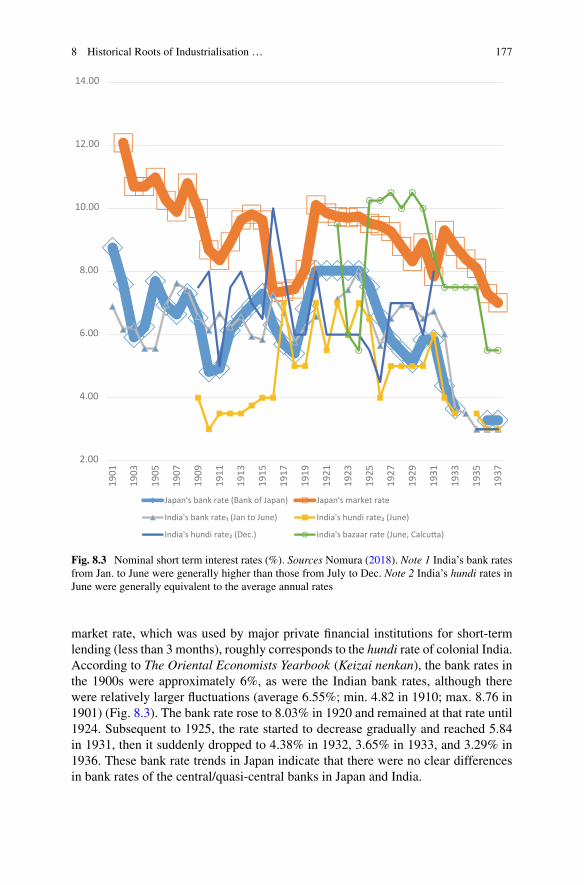
8 Historical Roots of Industrialisation … 177
2.00
4.00
6.00
8.00
10.00
12.00
14.00
1901
1903
1905
1907
1909
1911
1913
1915
1917
1919
1921
1923
1925
1927
1929
1931
1933
1935
1937
Japan's bank rate (Bank of Japan) Japan's market rate
India's bank rate₁ (Jan to June) India's hundi rate₂ (June)
India's hundi rate₂ (Dec.) India's bazaar rate (June, Calcu a)
Fig. 8.3 Nominal short term interest rates (%). Sources Nomura (2018). Note 1 India’s bank ratesfrom Jan. to June were generally higher than those from July to Dec. Note 2 India’s hundi rates inJune were generally equivalent to the average annual rates
market rate, which was used by major private financial institutions for short-termlending (less than 3 months), roughly corresponds to the hundi rate of colonial India.According to The Oriental Economists Yearbook (Keizai nenkan), the bank rates inthe 1900s were approximately 6%, as were the Indian bank rates, although therewere relatively larger fluctuations (average 6.55%; min. 4.82 in 1910; max. 8.76 in1901) (Fig. 8.3). The bank rate rose to 8.03% in 1920 and remained at that rate until1924. Subsequent to 1925, the rate started to decrease gradually and reached 5.84in 1931, then it suddenly dropped to 4.38% in 1932, 3.65% in 1933, and 3.29% in1936. These bank rate trends in Japan indicate that there were no clear differencesin bank rates of the central/quasi-central banks in Japan and India.
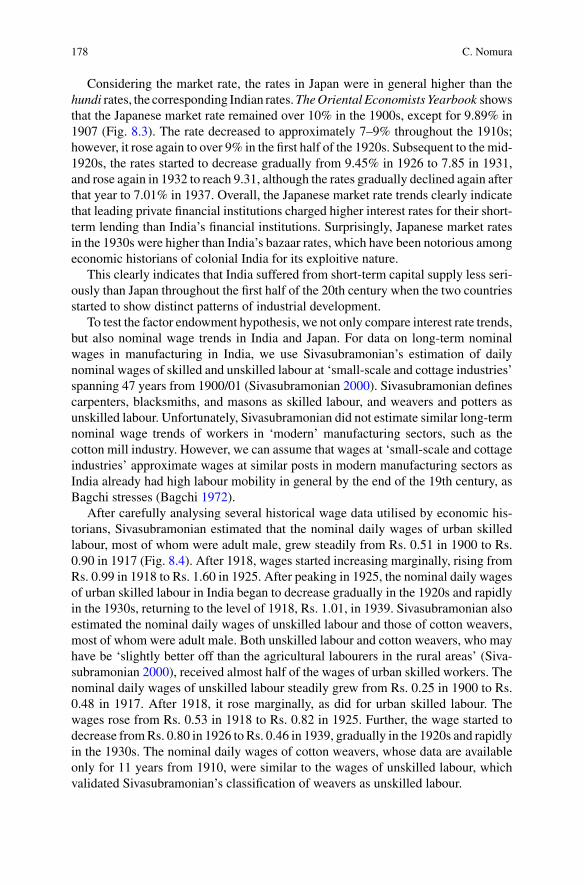
178 C. Nomura
Considering the market rate, the rates in Japan were in general higher than thehundi rates, the corresponding Indian rates.The Oriental Economists Yearbook showsthat the Japanese market rate remained over 10% in the 1900s, except for 9.89% in1907 (Fig. 8.3). The rate decreased to approximately 7–9% throughout the 1910s;however, it rose again to over 9% in the first half of the 1920s. Subsequent to the mid-1920s, the rates started to decrease gradually from 9.45% in 1926 to 7.85 in 1931,and rose again in 1932 to reach 9.31, although the rates gradually declined again afterthat year to 7.01% in 1937. Overall, the Japanese market rate trends clearly indicatethat leading private financial institutions charged higher interest rates for their short-term lending than India’s financial institutions. Surprisingly, Japanese market ratesin the 1930s were higher than India’s bazaar rates, which have been notorious amongeconomic historians of colonial India for its exploitive nature.
This clearly indicates that India suffered from short-term capital supply less seri-ously than Japan throughout the first half of the 20th century when the two countriesstarted to show distinct patterns of industrial development.
To test the factor endowment hypothesis, we not only compare interest rate trends,but also nominal wage trends in India and Japan. For data on long-term nominalwages in manufacturing in India, we use Sivasubramonian’s estimation of dailynominal wages of skilled and unskilled labour at ‘small-scale and cottage industries’spanning 47 years from 1900/01 (Sivasubramonian 2000). Sivasubramonian definescarpenters, blacksmiths, and masons as skilled labour, and weavers and potters asunskilled labour. Unfortunately, Sivasubramonian did not estimate similar long-termnominal wage trends of workers in ‘modern’ manufacturing sectors, such as thecotton mill industry. However, we can assume that wages at ‘small-scale and cottageindustries’ approximate wages at similar posts in modern manufacturing sectors asIndia already had high labour mobility in general by the end of the 19th century, asBagchi stresses (Bagchi 1972).
After carefully analysing several historical wage data utilised by economic his-torians, Sivasubramonian estimated that the nominal daily wages of urban skilledlabour, most of whom were adult male, grew steadily from Rs. 0.51 in 1900 to Rs.0.90 in 1917 (Fig. 8.4). After 1918, wages started increasing marginally, rising fromRs. 0.99 in 1918 to Rs. 1.60 in 1925. After peaking in 1925, the nominal daily wagesof urban skilled labour in India began to decrease gradually in the 1920s and rapidlyin the 1930s, returning to the level of 1918, Rs. 1.01, in 1939. Sivasubramonian alsoestimated the nominal daily wages of unskilled labour and those of cotton weavers,most of whom were adult male. Both unskilled labour and cotton weavers, who mayhave be ‘slightly better off than the agricultural labourers in the rural areas’ (Siva-subramonian 2000), received almost half of the wages of urban skilled workers. Thenominal daily wages of unskilled labour steadily grew from Rs. 0.25 in 1900 to Rs.0.48 in 1917. After 1918, it rose marginally, as did for urban skilled labour. Thewages rose from Rs. 0.53 in 1918 to Rs. 0.82 in 1925. Further, the wage started todecrease fromRs. 0.80 in 1926 to Rs. 0.46 in 1939, gradually in the 1920s and rapidlyin the 1930s. The nominal daily wages of cotton weavers, whose data are availableonly for 11 years from 1910, were similar to the wages of unskilled labour, whichvalidated Sivasubramonian’s classification of weavers as unskilled labour.
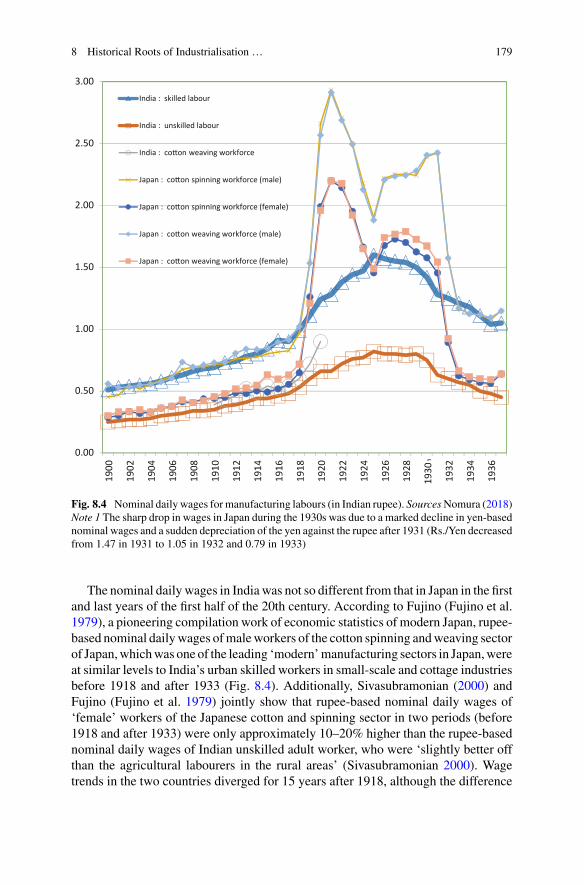
8 Historical Roots of Industrialisation … 179
0.00
0.50
1.00
1.50
2.00
2.50
3.00
1900
1902
1904
1906
1908
1910
1912
1914
1916
1918
1920
1922
1924
1926
1928
1930
₁
1932
1934
1936
India : skilled labour
India : unskilled labour
India : co on weaving workforce
Japan : co on spinning workforce (male)
Japan : co on spinning workforce (female)
Japan : co on weaving workforce (male)
Japan : co on weaving workforce (female)
Fig. 8.4 Nominal daily wages formanufacturing labours (in Indian rupee). SourcesNomura (2018)Note 1 The sharp drop in wages in Japan during the 1930s was due to a marked decline in yen-basednominal wages and a sudden depreciation of the yen against the rupee after 1931 (Rs./Yen decreasedfrom 1.47 in 1931 to 1.05 in 1932 and 0.79 in 1933)
The nominal daily wages in India was not so different from that in Japan in the firstand last years of the first half of the 20th century. According to Fujino (Fujino et al.1979), a pioneering compilation work of economic statistics of modern Japan, rupee-based nominal dailywages ofmaleworkers of the cotton spinning andweaving sectorof Japan,whichwas one of the leading ‘modern’manufacturing sectors in Japan,wereat similar levels to India’s urban skilled workers in small-scale and cottage industriesbefore 1918 and after 1933 (Fig. 8.4). Additionally, Sivasubramonian (2000) andFujino (Fujino et al. 1979) jointly show that rupee-based nominal daily wages of‘female’ workers of the Japanese cotton and spinning sector in two periods (before1918 and after 1933) were only approximately 10–20% higher than the rupee-basednominal daily wages of Indian unskilled adult worker, who were ‘slightly better offthan the agricultural labourers in the rural areas’ (Sivasubramonian 2000). Wagetrends in the two countries diverged for 15 years after 1918, although the difference
180 C. Nomura
disappeared completely in the early 1930s due to the sharp decline in Japanese yen-based nominal wages in Japan, and amarked depreciation of the Japanese yen againstthe Indian rupee after 1931 (Rs./Yen decreased from 1.47 in 1931 to 1.05 in 1932,and 0.79 in 1933).
We should pay special attention to two facts in assessing the above-mentionedwage trends in the two countries. First, female workers were the majority in someleading ‘modern’ manufacturing sectors in Japan, such as the cotton mill indus-try, while adult males constituted the majority in most of the ‘modern’ as well astraditional manufacturing sectors in India. Second, as was pointed out previously,Indian skilled and semi-skilled workers at ‘modern’ business enterprises and thoseat ‘small-scale and cottage industries’ could be construed to have received approxi-mately similar wages for the following reasons. Prices and Wages, one of the mostwell-known historical statistics of colonial India, indicates that both sizers in thesizing department and slubbers in the card-room department of India’s cotton millsreceived approximately similar wages to those of blacksmiths and carpenters work-ing at Indian railway companies in the early 20th century. Assuming that blacksmithsand carpenters working at railway companies and those working at small-scale orcottage industries received similar wages in a highly mobile labour market due tosimilarity in job specifications, Indian male adult workers at skilled or semi-skilledposts of ‘modern’ manufacturing sector, such as slubbers in the card-room depart-ment of cotton mills, may have received, at least, similar nominal wages to that ofskilled labour such as blacksmiths or carpenters as shown in Fig. 8.4. Based on thesetwo facts, we conclude that Indian workers in manufacturing received no less thanthe amount of nominal daily wages received by workers at ‘modern’ manufacturingsector in Japan in the two periods (before 1918 and after 1933).
Comparing interest rates and nominalwages in India and Japan does not lead to theconclusion that India was capital scarce and labour abundant at least in comparisonto Japan in the early 20th century. Rather, India’s factor endowment was similarto that of Japan in the time period. Despite the similarity, India failed in achievingsimilar pattern of ‘labour intensive’ industrialisation that Japan achieved since theend of the 19th century, during which time, the labour intensive industrialisation ledJapan’s modern economic growth in its early phase. What could explain the causesof the failure of colonial India’s labour intensive industrialisation? We will checkwith another hypothesis that has been proposed to answer the question.
8.4 Laissez-Faire Economic Policy Hypothesis
8.4.1 Overview
Based on the understanding that governments can lead industrialisation throughcomprehensive interventions in economic activities, scholars such as Amiya KumarBagchi stress that India could have developed its industries more robustly if the colo-
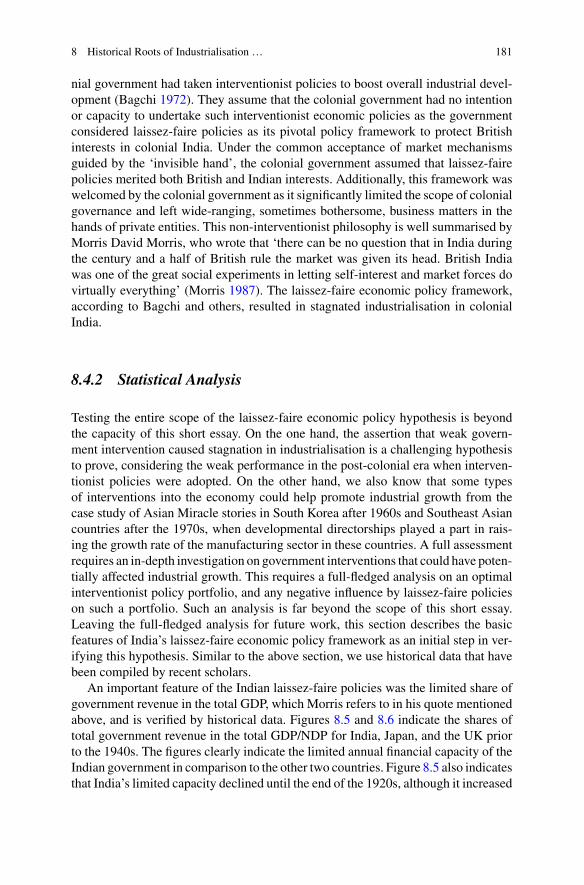
8 Historical Roots of Industrialisation … 181
nial government had taken interventionist policies to boost overall industrial devel-opment (Bagchi 1972). They assume that the colonial government had no intentionor capacity to undertake such interventionist economic policies as the governmentconsidered laissez-faire policies as its pivotal policy framework to protect Britishinterests in colonial India. Under the common acceptance of market mechanismsguided by the ‘invisible hand’, the colonial government assumed that laissez-fairepolicies merited both British and Indian interests. Additionally, this framework waswelcomed by the colonial government as it significantly limited the scope of colonialgovernance and left wide-ranging, sometimes bothersome, business matters in thehands of private entities. This non-interventionist philosophy is well summarised byMorris David Morris, who wrote that ‘there can be no question that in India duringthe century and a half of British rule the market was given its head. British Indiawas one of the great social experiments in letting self-interest and market forces dovirtually everything’ (Morris 1987). The laissez-faire economic policy framework,according to Bagchi and others, resulted in stagnated industrialisation in colonialIndia.
8.4.2 Statistical Analysis
Testing the entire scope of the laissez-faire economic policy hypothesis is beyondthe capacity of this short essay. On the one hand, the assertion that weak govern-ment intervention caused stagnation in industrialisation is a challenging hypothesisto prove, considering the weak performance in the post-colonial era when interven-tionist policies were adopted. On the other hand, we also know that some typesof interventions into the economy could help promote industrial growth from thecase study of Asian Miracle stories in South Korea after 1960s and Southeast Asiancountries after the 1970s, when developmental directorships played a part in rais-ing the growth rate of the manufacturing sector in these countries. A full assessmentrequires an in-depth investigation on government interventions that could have poten-tially affected industrial growth. This requires a full-fledged analysis on an optimalinterventionist policy portfolio, and any negative influence by laissez-faire policieson such a portfolio. Such an analysis is far beyond the scope of this short essay.Leaving the full-fledged analysis for future work, this section describes the basicfeatures of India’s laissez-faire economic policy framework as an initial step in ver-ifying this hypothesis. Similar to the above section, we use historical data that havebeen compiled by recent scholars.
An important feature of the Indian laissez-faire policies was the limited share ofgovernment revenue in the total GDP, which Morris refers to in his quote mentionedabove, and is verified by historical data. Figures 8.5 and 8.6 indicate the shares oftotal government revenue in the total GDP/NDP for India, Japan, and the UK priorto the 1940s. The figures clearly indicate the limited annual financial capacity of theIndian government in comparison to the other two countries. Figure 8.5 also indicatesthat India’s limited capacity declined until the end of the 1920s, although it increased
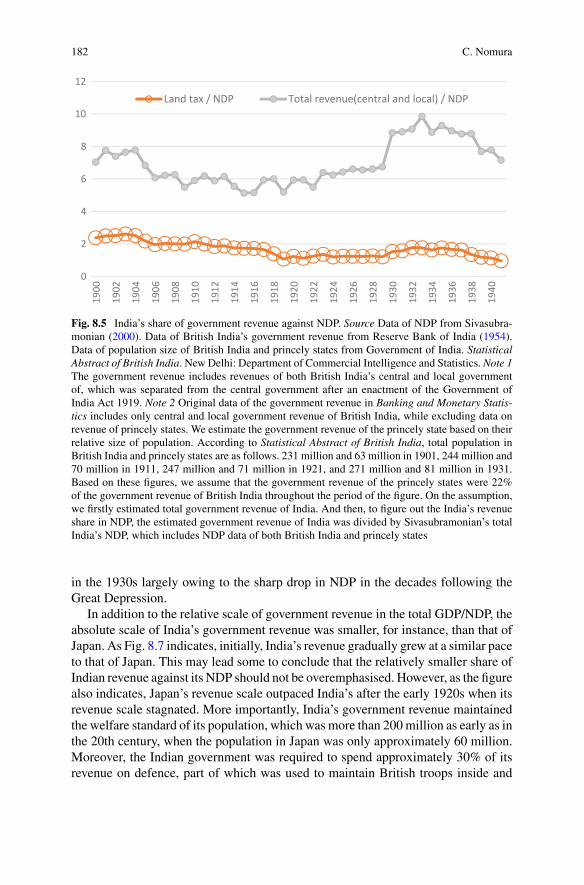
182 C. Nomura
0
2
4
6
8
10
1219
00
1902
1904
1906
1908
1910
1912
1914
1916
1918
1920
1922
1924
1926
1928
1930
1932
1934
1936
1938
1940
Land tax / NDP Total revenue(central and local) / NDP
Fig. 8.5 India’s share of government revenue against NDP. Source Data of NDP from Sivasubra-monian (2000). Data of British India’s government revenue from Reserve Bank of India (1954).Data of population size of British India and princely states from Government of India. StatisticalAbstract of British India. New Delhi: Department of Commercial Intelligence and Statistics. Note 1The government revenue includes revenues of both British India’s central and local governmentof, which was separated from the central government after an enactment of the Government ofIndia Act 1919. Note 2 Original data of the government revenue in Banking and Monetary Statis-tics includes only central and local government revenue of British India, while excluding data onrevenue of princely states. We estimate the government revenue of the princely state based on theirrelative size of population. According to Statistical Abstract of British India, total population inBritish India and princely states are as follows. 231 million and 63 million in 1901, 244 million and70 million in 1911, 247 million and 71 million in 1921, and 271 million and 81 million in 1931.Based on these figures, we assume that the government revenue of the princely states were 22%of the government revenue of British India throughout the period of the figure. On the assumption,we firstly estimated total government revenue of India. And then, to figure out the India’s revenueshare in NDP, the estimated government revenue of India was divided by Sivasubramonian’s totalIndia’s NDP, which includes NDP data of both British India and princely states
in the 1930s largely owing to the sharp drop in NDP in the decades following theGreat Depression.
In addition to the relative scale of government revenue in the total GDP/NDP, theabsolute scale of India’s government revenue was smaller, for instance, than that ofJapan. As Fig. 8.7 indicates, initially, India’s revenue gradually grew at a similar paceto that of Japan. This may lead some to conclude that the relatively smaller share ofIndian revenue against its NDP should not be overemphasised. However, as the figurealso indicates, Japan’s revenue scale outpaced India’s after the early 1920s when itsrevenue scale stagnated. More importantly, India’s government revenue maintainedthe welfare standard of its population, which was more than 200million as early as inthe 20th century, when the population in Japan was only approximately 60 million.Moreover, the Indian government was required to spend approximately 30% of itsrevenue on defence, part of which was used to maintain British troops inside and
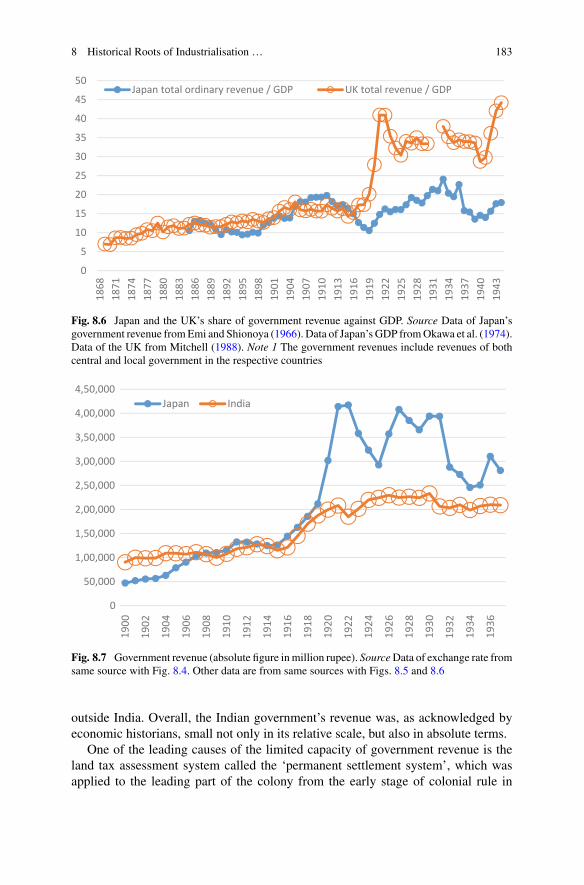
8 Historical Roots of Industrialisation … 183
0
5
10
15
20
25
30
35
40
45
50
1868
1871
1874
1877
1880
1883
1886
1889
1892
1895
1898
1901
1904
1907
1910
1913
1916
1919
1922
1925
1928
1931
1934
1937
1940
1943
Japan total ordinary revenue / GDP UK total revenue / GDP
Fig. 8.6 Japan and the UK’s share of government revenue against GDP. Source Data of Japan’sgovernment revenue fromEmi and Shionoya (1966). Data of Japan’s GDP fromOkawa et al. (1974).Data of the UK from Mitchell (1988). Note 1 The government revenues include revenues of bothcentral and local government in the respective countries
0
50,000
1,00,000
1,50,000
2,00,000
2,50,000
3,00,000
3,50,000
4,00,000
4,50,000Japan India
Fig. 8.7 Government revenue (absolute figure inmillion rupee). SourceData of exchange rate fromsame source with Fig. 8.4. Other data are from same sources with Figs. 8.5 and 8.6
outside India. Overall, the Indian government’s revenue was, as acknowledged byeconomic historians, small not only in its relative scale, but also in absolute terms.
One of the leading causes of the limited capacity of government revenue is theland tax assessment system called the ‘permanent settlement system’, which wasapplied to the leading part of the colony from the early stage of colonial rule in
184 C. Nomura
the late 18th century. Under the system, land tax per acre was fixed at the initialstage of colonial governance in the late 18th century. It was fixed to avoid costsrelated to reassessment of the rates, as well as insurgency risks by taxpayers againstany reassessments. As a result, government revenue, as is clearly shown in Fig. 8.5,suffered from a gradual decline in real terms owing to the steady rise in generalprices throughout the colonial period (Kumar 1983). The inability to raise revenuefrom lands through a reassessment may imply limited legitimacy of the colonialgovernment to govern its subjects.
The Indian government’s limited financial capacity is also observed in Fig. 8.8,which shows the shares of the central government’s public debt against GDP/NDP ofIndia, Japan, and the UK until the 1940s. According to the figure, India’s share (totalof debt in rupees and in sterling) was higher than its counterparts in the early 1900s.This is owing to the UK’s strict observance of liberalisation economic policies, aswell as Japan’s weak capacity to borrow from abroad at that time. However, theIndian government strengthened its conservative debt policy throughout the period,while its counterparts expanded their debt, particularly after WW1.
Attempts by the Indian government to limit its public debt to a ‘necessary min-imum’ are well-known among economic historians as an important feature of its‘imperial commitment’. For instance, Brian Tomlinson, a well-known economic his-torian of colonial India, explained it as follows. ‘[as a colonial state forming a partof British empire], irreducible minimum’ for Government of India were ‘to providea market for British goods, to pay interest on the sterling debt and other chargesthat fell due in London, and to maintain a large number of British troops fromlocal revenues and make a part of the Indian army available for imperial garrisons’(Tomlinson 2013). Tomlinson called this irreducible minimum an ‘imperial commit-ment’, which shaped British policy foundation in India. Tomlinson argues that theIndian government adopted an automatic, self-regulating system of currency man-agement to protect British investor interests. Imperial commitment resulted in Indianofficials not playing an active role in matters important to the domestic economy, asseen in the limited public debt during the colonial period, which in other words, indi-cates India’s strict observance of conservative fiscal policy throughout the colonialperiod.
The significance of the imperial commitment is also observed in India’s exchangerate policy, which has also received wide scholarly attention. Before the end of the19th century, India employed the silver standard, while the UK employed the goldstandard. Subsequent to the early 1870s, when silver prices began to decline due tothe decisions of leading European countries to employ the gold standard, the rupeeexchange rate declined abruptly against the sterling pound. To tackle the decreasingvalue of the rupee against the sterling pound and to stabilise international finance,the Indian government decided to introduce the gold exchange standard by the early20th century. Figure 8.9 shows that the rupee exchange rate against the sterling poundremained stable for over a century since the early 19th century, despite the differencein the economic growth rate between India and theUK in the period. On the one hand,the stable exchange rate trend helped British investments by reducing the exchangerate risk in India, which occupied a large part of British overseas investment since
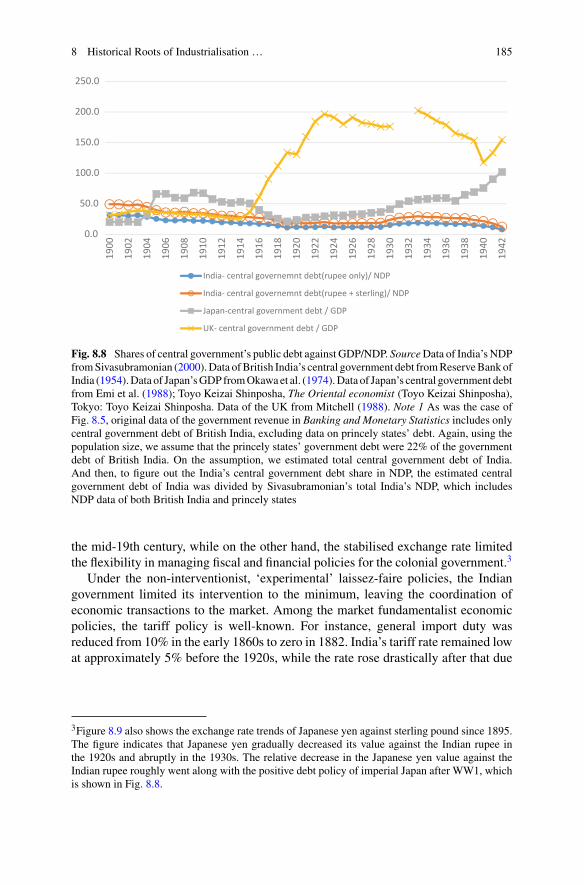
8 Historical Roots of Industrialisation … 185
0.0
50.0
100.0
150.0
200.0
250.0
1900
1902
1904
1906
1908
1910
1912
1914
1916
1918
1920
1922
1924
1926
1928
1930
1932
1934
1936
1938
1940
1942
India- central governemnt debt(rupee only)/ NDP
India- central governemnt debt(rupee + sterling)/ NDP
Japan-central government debt / GDP
UK- central government debt / GDP
Fig. 8.8 Shares of central government’s public debt against GDP/NDP. SourceData of India’s NDPfromSivasubramonian (2000).Data ofBritish India’s central government debt fromReserveBank ofIndia (1954).Data of Japan’sGDP fromOkawaet al. (1974).Data of Japan’s central government debtfrom Emi et al. (1988); Toyo Keizai Shinposha, The Oriental economist (Toyo Keizai Shinposha),Tokyo: Toyo Keizai Shinposha. Data of the UK from Mitchell (1988). Note 1 As was the case ofFig. 8.5, original data of the government revenue in Banking and Monetary Statistics includes onlycentral government debt of British India, excluding data on princely states’ debt. Again, using thepopulation size, we assume that the princely states’ government debt were 22% of the governmentdebt of British India. On the assumption, we estimated total central government debt of India.And then, to figure out the India’s central government debt share in NDP, the estimated centralgovernment debt of India was divided by Sivasubramonian’s total India’s NDP, which includesNDP data of both British India and princely states
the mid-19th century, while on the other hand, the stabilised exchange rate limitedthe flexibility in managing fiscal and financial policies for the colonial government.3
Under the non-interventionist, ‘experimental’ laissez-faire policies, the Indiangovernment limited its intervention to the minimum, leaving the coordination ofeconomic transactions to the market. Among the market fundamentalist economicpolicies, the tariff policy is well-known. For instance, general import duty wasreduced from 10% in the early 1860s to zero in 1882. India’s tariff rate remained lowat approximately 5% before the 1920s, while the rate rose drastically after that due
3Figure 8.9 also shows the exchange rate trends of Japanese yen against sterling pound since 1895.The figure indicates that Japanese yen gradually decreased its value against the Indian rupee inthe 1920s and abruptly in the 1930s. The relative decrease in the Japanese yen value against theIndian rupee roughly went along with the positive debt policy of imperial Japan after WW1, whichis shown in Fig. 8.8.

186 C. Nomura
0.02.04.06.08.0
10.012.014.016.018.020.0
1840
/118
44/5
1848
/918
52/3
1856
/718
60/1
1864
/518
68/9
1872
/318
76/7
1880
/118
84/5
1888
/918
92/3
1896
/7Indian rupee/ Japanese yen/
1900
/119
04/5
1908
/919
12/3
1916
/719
20/2
119
24/2
519
28/2
919
32/3
319
36/3
7
Fig. 8.9 Exchange rate of Indian rupee and Japanese yen against Sterling pound. Source Indianrupee data before 1918/19 from Shirras (1920). Indian rupee data after 1919/20 from Governmentof India. Statistical Abstract of British India. New Delhi: Department of Commercial Intelligenceand Statistics. Japanese yen data from Government of Japan (1949)
to various reasons, one of which was the fiscal stringency of the colonial government(Fig. 8.10).4
Another significant policy under the laissez-faire policy frameworkwas the policyto invest in transportation facilities to promote free trade. One of the most influentialtransportation facilities was the railway network. An initial attempt to constructrailway networks dates back to the 1840s, when the then Governor-General of Indiaproposed the construction of a railway network to promote trade, administrative, andmilitary efficiency. Under his leadership, the first railway company was incorporatedin 1849, which was followed by additional networks, and resulted in the Indianrailway networks ranking fourth in operated lines globally in 1913.
The historical data based test on Indian policy choices validate the hypothesis thatit operated under a strict laissez-faire policy framework. The colonial governmentlimited its commitment to the economy to a lesser extent than the Japanese or Britishgovernments, while the private sector thrived under this framework.
The free rein given to private business entities formed a foundation for the growthof modern industrial enterprises in India. However, it is also clear that these policiesled to limited industrial development. This recognition may have led to the adoptionof proactive government interventionist policies after independence. As we havealready mentioned, fully addressing the impact of the laissez-faire economic policyframework on stagnated industrialisation is left for future work.
4Figures 8.5 and 8.10 jointly indicate that custom revenue helped the government to maintain itsrevenue share among NDP, particularly after WW1.
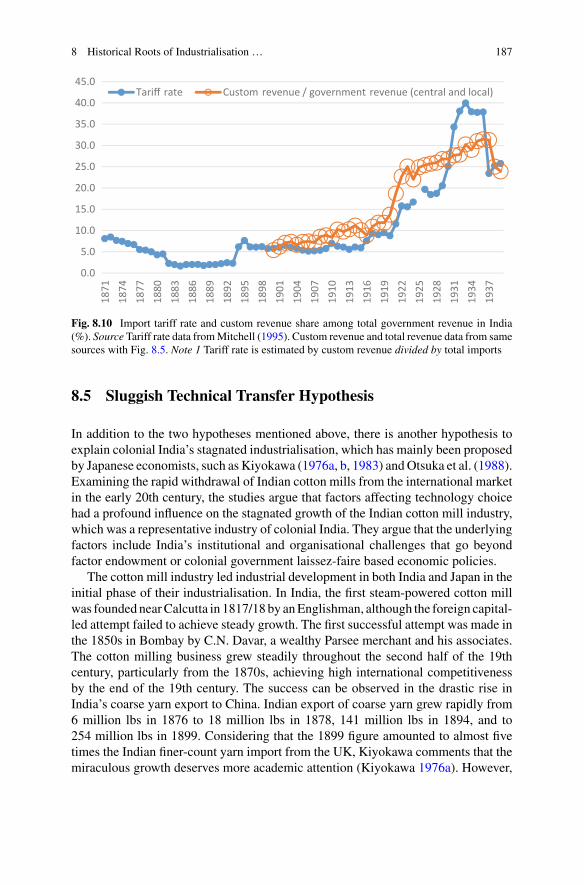
8 Historical Roots of Industrialisation … 187
0.0
5.0
10.0
15.0
20.0
25.0
30.0
35.0
40.0
45.0
1871
1874
1877
1880
1883
1886
1889
1892
1895
1898
1901
1904
1907
1910
1913
1916
1919
1922
1925
1928
1931
1934
1937
Tariff rate Custom revenue / government revenue (central and local)
Fig. 8.10 Import tariff rate and custom revenue share among total government revenue in India(%). Source Tariff rate data fromMitchell (1995). Custom revenue and total revenue data from samesources with Fig. 8.5. Note 1 Tariff rate is estimated by custom revenue divided by total imports
8.5 Sluggish Technical Transfer Hypothesis
In addition to the two hypotheses mentioned above, there is another hypothesis toexplain colonial India’s stagnated industrialisation, which has mainly been proposedby Japanese economists, such as Kiyokawa (1976a, b, 1983) andOtsuka et al. (1988).Examining the rapid withdrawal of Indian cotton mills from the international marketin the early 20th century, the studies argue that factors affecting technology choicehad a profound influence on the stagnated growth of the Indian cotton mill industry,which was a representative industry of colonial India. They argue that the underlyingfactors include India’s institutional and organisational challenges that go beyondfactor endowment or colonial government laissez-faire based economic policies.
The cotton mill industry led industrial development in both India and Japan in theinitial phase of their industrialisation. In India, the first steam-powered cotton millwas founded nearCalcutta in 1817/18 by anEnglishman, although the foreign capital-led attempt failed to achieve steady growth. The first successful attempt was made inthe 1850s in Bombay by C.N. Davar, a wealthy Parsee merchant and his associates.The cotton milling business grew steadily throughout the second half of the 19thcentury, particularly from the 1870s, achieving high international competitivenessby the end of the 19th century. The success can be observed in the drastic rise inIndia’s coarse yarn export to China. Indian export of coarse yarn grew rapidly from6 million lbs in 1876 to 18 million lbs in 1878, 141 million lbs in 1894, and to254 million lbs in 1899. Considering that the 1899 figure amounted to almost fivetimes the Indian finer-count yarn import from the UK, Kiyokawa comments that themiraculous growth deserves more academic attention (Kiyokawa 1976a). However,
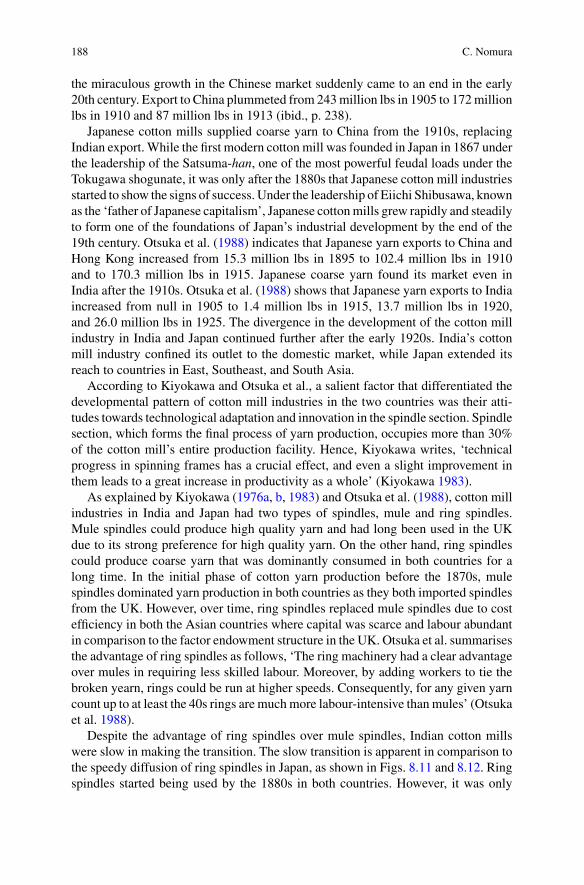
188 C. Nomura
the miraculous growth in the Chinese market suddenly came to an end in the early20th century. Export to China plummeted from 243million lbs in 1905 to 172millionlbs in 1910 and 87 million lbs in 1913 (ibid., p. 238).
Japanese cotton mills supplied coarse yarn to China from the 1910s, replacingIndian export. While the first modern cotton mill was founded in Japan in 1867 underthe leadership of the Satsuma-han, one of the most powerful feudal loads under theTokugawa shogunate, it was only after the 1880s that Japanese cotton mill industriesstarted to show the signs of success. Under the leadership of Eiichi Shibusawa, knownas the ‘father of Japanese capitalism’, Japanese cottonmills grew rapidly and steadilyto form one of the foundations of Japan’s industrial development by the end of the19th century. Otsuka et al. (1988) indicates that Japanese yarn exports to China andHong Kong increased from 15.3 million lbs in 1895 to 102.4 million lbs in 1910and to 170.3 million lbs in 1915. Japanese coarse yarn found its market even inIndia after the 1910s. Otsuka et al. (1988) shows that Japanese yarn exports to Indiaincreased from null in 1905 to 1.4 million lbs in 1915, 13.7 million lbs in 1920,and 26.0 million lbs in 1925. The divergence in the development of the cotton millindustry in India and Japan continued further after the early 1920s. India’s cottonmill industry confined its outlet to the domestic market, while Japan extended itsreach to countries in East, Southeast, and South Asia.
According to Kiyokawa and Otsuka et al., a salient factor that differentiated thedevelopmental pattern of cotton mill industries in the two countries was their atti-tudes towards technological adaptation and innovation in the spindle section. Spindlesection, which forms the final process of yarn production, occupies more than 30%of the cotton mill’s entire production facility. Hence, Kiyokawa writes, ‘technicalprogress in spinning frames has a crucial effect, and even a slight improvement inthem leads to a great increase in productivity as a whole’ (Kiyokawa 1983).
As explained by Kiyokawa (1976a, b, 1983) and Otsuka et al. (1988), cotton millindustries in India and Japan had two types of spindles, mule and ring spindles.Mule spindles could produce high quality yarn and had long been used in the UKdue to its strong preference for high quality yarn. On the other hand, ring spindlescould produce coarse yarn that was dominantly consumed in both countries for along time. In the initial phase of cotton yarn production before the 1870s, mulespindles dominated yarn production in both countries as they both imported spindlesfrom the UK. However, over time, ring spindles replaced mule spindles due to costefficiency in both the Asian countries where capital was scarce and labour abundantin comparison to the factor endowment structure in the UK. Otsuka et al. summarisesthe advantage of ring spindles as follows, ‘The ring machinery had a clear advantageover mules in requiring less skilled labour. Moreover, by adding workers to tie thebroken yearn, rings could be run at higher speeds. Consequently, for any given yarncount up to at least the 40s rings are muchmore labour-intensive thanmules’ (Otsukaet al. 1988).
Despite the advantage of ring spindles over mule spindles, Indian cotton millswere slow in making the transition. The slow transition is apparent in comparison tothe speedy diffusion of ring spindles in Japan, as shown in Figs. 8.11 and 8.12. Ringspindles started being used by the 1880s in both countries. However, it was only
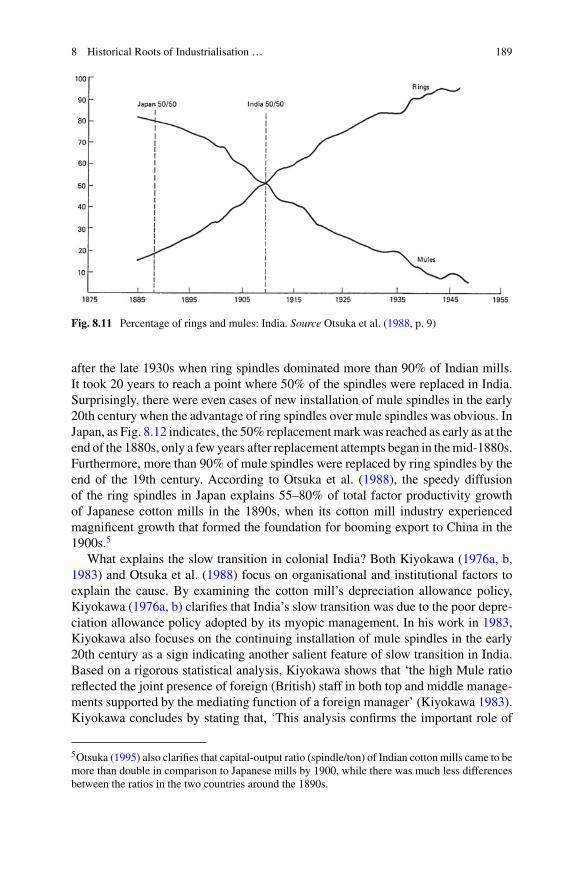
8 Historical Roots of Industrialisation … 189
Fig. 8.11 Percentage of rings and mules: India. Source Otsuka et al. (1988, p. 9)
after the late 1930s when ring spindles dominated more than 90% of Indian mills.It took 20 years to reach a point where 50% of the spindles were replaced in India.Surprisingly, there were even cases of new installation of mule spindles in the early20th century when the advantage of ring spindles over mule spindles was obvious. InJapan, as Fig. 8.12 indicates, the 50% replacementmarkwas reached as early as at theend of the 1880s, only a few years after replacement attempts began in themid-1880s.Furthermore, more than 90% of mule spindles were replaced by ring spindles by theend of the 19th century. According to Otsuka et al. (1988), the speedy diffusionof the ring spindles in Japan explains 55–80% of total factor productivity growthof Japanese cotton mills in the 1890s, when its cotton mill industry experiencedmagnificent growth that formed the foundation for booming export to China in the1900s.5
What explains the slow transition in colonial India? Both Kiyokawa (1976a, b,1983) and Otsuka et al. (1988) focus on organisational and institutional factors toexplain the cause. By examining the cotton mill’s depreciation allowance policy,Kiyokawa (1976a, b) clarifies that India’s slow transition was due to the poor depre-ciation allowance policy adopted by its myopic management. In his work in 1983,Kiyokawa also focuses on the continuing installation of mule spindles in the early20th century as a sign indicating another salient feature of slow transition in India.Based on a rigorous statistical analysis, Kiyokawa shows that ‘the high Mule ratioreflected the joint presence of foreign (British) staff in both top and middle manage-ments supported by the mediating function of a foreign manager’ (Kiyokawa 1983).Kiyokawa concludes by stating that, ‘This analysis confirms the important role of
5Otsuka (1995) also clarifies that capital-output ratio (spindle/ton) of Indian cotton mills came to bemore than double in comparison to Japanese mills by 1900, while there was much less differencesbetween the ratios in the two countries around the 1890s.
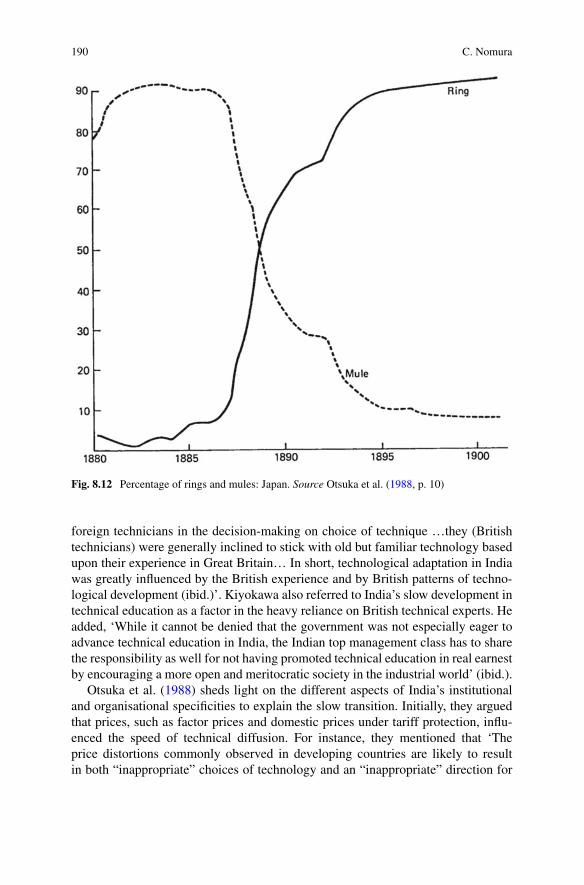
190 C. Nomura
Fig. 8.12 Percentage of rings and mules: Japan. Source Otsuka et al. (1988, p. 10)
foreign technicians in the decision-making on choice of technique …they (Britishtechnicians) were generally inclined to stick with old but familiar technology basedupon their experience in Great Britain… In short, technological adaptation in Indiawas greatly influenced by the British experience and by British patterns of techno-logical development (ibid.)’. Kiyokawa also referred to India’s slow development intechnical education as a factor in the heavy reliance on British technical experts. Headded, ‘While it cannot be denied that the government was not especially eager toadvance technical education in India, the Indian top management class has to sharethe responsibility as well for not having promoted technical education in real earnestby encouraging a more open and meritocratic society in the industrial world’ (ibid.).
Otsuka et al. (1988) sheds light on the different aspects of India’s institutionaland organisational specificities to explain the slow transition. Initially, they arguedthat prices, such as factor prices and domestic prices under tariff protection, influ-enced the speed of technical diffusion. For instance, they mentioned that ‘Theprice distortions commonly observed in developing countries are likely to resultin both “inappropriate” choices of technology and an “inappropriate” direction for
8 Historical Roots of Industrialisation … 191
technology change’ (Otsuka et al. 1988). However, they assert that rigorous statis-tical examination ‘permit us, moreover, to proceed beyond the simple factor pricedistortion story in explaining comparative technological performance’. After point-ing out the importance of Japan’s innovative activities in fields such as cotton mixingprocedures for the efficient adaptation of ring spindles to the lower average staplelength, they point out that ‘the choices made by an individual Japanese entrepreneur[of cotton mills], in contrast to his Indian counterpart, illuminate the importance ofdifferences in institutional and organisational environments (ibid.)’. In terms of theinstitutional and organisational environment in Japan, they focus on the existenceof competitive pressure in the domestic market influenced by business associations,the availability of ‘formal education and learning by opportunity’, and ‘the legalconvenience of a petty patent system’ (ibid.), none of which sufficiently existed inIndia.
Overall, Kiyokawa (1976a, b, 1983) andOtsuka et al. (1988) focus on the influenceof institutional and organisation factors that were established both by private andpublic initiatives to explain the divergence of cotton mill industries in India andJapan, which were leading sectors of modern industrial growth in both countries.
8.6 Conclusions
After surveying the stagnated industrialisation nature of colonial India, this chapterreviewed three hypotheses to explain this phenomenon: the factor endowmenthypothesis; the laissez-faire economic policy hypothesis; and the sluggish technicaltransfer hypothesis. In the review, we also briefly examined the first two hypothe-ses using historical data compiled by recent scholars. This chapter reveals that thefactor endowment hypothesis needs to be supplemented by further investigations,while the laissez-faire economic policy hypothesis requires further analysis on howlaissez-faire policies negatively affected India’s industrialisation. Augmenting thetwo hypothesesmay require further analysis, for instance, on the effects of fiscal strin-gency under laissez-faire policies on India’s institutional and organisational devel-opment for mass and vocational education, patent system, or industrial financingsystem as it could have affected the performance of industrial enterprises throughraising efficiency in labour or capital transactions. Further clarification on India’sinstitutional and organisation development, on which Kiyokawa (1976a, b, 1983)and Otsuka et al. (1988) strongly focused, would help us deepen our understand-ing on factors underlying the stagnated nature of industrialisation in colonial India.However, this is an agenda for future work.
192 C. Nomura
References
Bagchi, A. (1972). Private investment in India, 1900–1939. Cambridge: Cambridge UniversityPress.
Bagchi, A. (1997). The evolution of the state bank of India: The era of the presidency banks,1876–1920. New Delhi: Sage Publications.
BombayMillowners’ Association. (various years). Report of the millowners’ association. Bombay:Bombay Millowners’ Association.
Emi, K., Ito, M., & Eguchi, H. (1988). Estimates of Japan long term economic statistics seriesvolume 5 savings and currency. Tokyo: Toyo Keizai Shinposha.
Emi, K. & Shionoya U. (1966). Estimates of Japan long term economic statistics series volume 7government expenditure. Tokyo: Toyo Keizai Shinposha.
Fujino, S., Fujino, S., & Ono, A. (1979). Estimates of Japan long term economic statistics seriesvolume 11 textiles. Tokyo: Toyo Keizai Shinposha.
Government of India. (various years). Prices and wages in India. Calcutta: Superintendent Gov-ernment Printing.
Government of India. (various years). Statistical abstract of British India. New Delhi: Departmentof Commercial Intelligence and Statistics.
Government of Japan. (various years). Statistical abstract of imperial Japan. Tokyo: Toyo Shorin.Government of Japan (1949) Japan statistical year-book. Tokyo: Executive Office of StatisticsCommission, Statistics Bureau of the Prime Minister’s Office.
Gupta, B. (2016). The rise of modern industry in colonial India. In L. Chaudhary, B. Gupta, T. Roy,& A. Swamy (Eds.), A new economic history of colonial India. London: Routledge.
Kiyokawa, Y. (1976a). Indo menkogyo ni okeru gijyutsu to shijyo no keisei ni tsuite (1) (Technologyandmarket formation in the cottonmill industry of India: A comparison with the cotton industriesof Japan and China). Keizai kenku, 27(3), 234–249.
Kiyokawa, Y. (1976b). Indo menkogyo ni okeru gijyutsu to shijyo no keisei ni tsuite (2) (Technologyandmarket formation in the cottonmill industry of India: A comparison with the cotton industriesof Japan and China). Keizai kenku, 27(4), 307–322.
Kiyokawa, Y. (1983). Technical adaptations and managerial resources in India: a study of the expe-rience of the cotton textile industry from a comparative viewpoint. The Developing Economies,21(2), 97–133.
Kumar, D. (1983). The fiscal system. In D. Kumar (Ed.), The Cambridge economic history of India(Vol. 2, p. c.1757–c.1970). Cambridge: Cambridge University Press.
Kuznets, S. (1966). Modern economic growth. New Haven: Yale University Press.League of Nations. (1945). Industrialization and foreign trade. Geneva: League of Nations.Mitchell, B. R. (1980). European historical statistics, 1750–1975. London: Macmillan.Mitchell, B. R. (1982). International historical statistics: Africa and Asia. London: Macmillan.Mitchell, B. R. (1983). International historical statistics: The Americas and Australasia. London:Macmillan.
Mitchell, B. R. (1988). British historical statistics. Cambridge: Cambridge University Press.Mitchell, B. R. (1995). International historical statistics: Africa, Asia & Oceania 1750-1988 (2nded.). New York: Macmillan.
Morris,M.D. (1983). The growth of large-scale industry to 1947. InD.Kumar (Ed.),The Cambridgeeconomic history of India, 2, c.1757–c.1970. Cambridge: Cambridge University Press.
Morris, M. D. (1987). Indian industry and business in the age of laissez faire. In D. Tripathi (Ed.),State and business in India: A historical perspective. Manohar: New Delhi.
Nomura, C. (2018). The house of Tata meets the second industrial revolution: An institutionalanalysis of Tata Iron and Steel Co. in colonial India. Singapore: Springer.
Okawa, K., Takamatsu, N., & Yamamoto, K. (1974). Estimates of Japan long term economicstatistics series volume 1: National income. Tokyo: Toyo Keizai Shinposha.
Otsuka, K. (1995). Technology choice, employment, and development. Asian Development Review,13(2), 105–137.
8 Historical Roots of Industrialisation … 193
Otsuka, K., Ranis, G., & Saxonhouse, G. (1988). Comparative technology choice in development:The Indian and Japanese cotton textile industries. Basingstoke: Macmillan.
Reserve Bank of India. (1954). Banking and monetary statistics of India. Bombay: The ReserveBank of India.
Reserve Bank of India. (various years). Report on currency and finance. Bombay: Reserve Bank ofIndia.
Roy, T. (2005). Rethinking economic change in India: Labour and livelihood. London: Routledge.Roy, T. (2006). The economic history of India 1857–1947 (2nd ed.). New Delhi: Oxford UniversityPress.
Shirras, G. F. (1920). Indian finance and banking. London: Macmillan.Sivasubramonian, S. (2000). The national income of India in the twentieth century. New Delhi:Oxford University Press.
Tomlinson, B. (2013). The economy of modern India: From 1860 to the twenty-first century (2nded.). Cambridge: Cambridge University Press.
Toyo Keizai. (various years). The Oriental economist year book (Keizai nenkan). Tokyo: ToyoKeizai Shinposha.
Umemura, M., Akasaka, K., Minami, R., Nii, G., Ito, S., & Takamatsu, N. (1988). Estimates ofJapan long term economic statistics series volume 2 manpower. Tokyo: Toyo Keizai Shinposha.
Open Access This chapter is licensed under the terms of the Creative Commons Attribution-NonCommercial-NoDerivatives 4.0 International License (http://creativecommons.org/licenses/by-nc-nd/4.0/), which permits any noncommercial use, sharing, distribution and reproduction in anymedium or format, as long as you give appropriate credit to the original author(s) and the source,provide a link to the Creative Commons licence and indicate if you modified the licensed material.You do not have permission under this licence to share adapted material derived from this chapteror parts of it.
The images or other third party material in this chapter are included in the chapter’s CreativeCommons licence, unless indicated otherwise in a credit line to the material. If material is notincluded in the chapter’s Creative Commons licence and your intended use is not permitted bystatutory regulation or exceeds the permitted use, you will need to obtain permission directly fromthe copyright holder.
Chapter 9Industrial Policy, IndustrialDevelopment, and StructuralTransformation in Asia and Africa
Yuki Higuchi and Go Shimada
9.1 Introduction
Industrial policy has long been a controversial issue among researchers and poli-cymakers. Proponents of industrial policy, including early development economistslike Hirschman (1958), Nurkse (1953), and Rosenstein-Rodan (1943), argue that bigpush-type policy to promote industrial development is central to economic develop-ment. Opponents argue that such interventionist policy will distort markets, and havea deleterious effect on economic growth (e.g., Baldwin 1969; Krueger and Tuncer1982; Lal 1983). According to Newman et al. (2016, Chap. 2), the international trendof industrial policy can be divided into three phases. The first phase took place inthe 1960s and 1970s, when the industrial policy was favorably accepted in the post-independence countries. In this period, import substitution industrialization (ISI)policies were adopted to promote certain domestic industries by means of tariffsand subsidies in many African countries under socialist regimes, such as, Ghana,Tanzania, and Zimbabwe. The ISI policies, however, failed to promote industrialdevelopment because these policies lacked linkages with markets and ignored thecomparative advantage of the economy.
1
1The failure of African industrial policy in the 1960s and 1970s is similar to the experience of post-independence India, briefly discussed by Nomura (2018) in this volume. In both post-independenceIndia and Africa, the government did not support labor-intensive industries, in which the countryhad comparative advantage.
Y. Higuchi (B)Graduate School of Economics, Nagoya City University, Nagoya, Japane-mail: [email protected]
G. ShimadaMeiji University, Tokyo, Japane-mail: [email protected]
© The Author(s) 2019K. Otsuka and K. Sugihara (eds.), Paths to the Emerging State in Asia and Africa,Emerging-Economy State and International Policy Studies,https://doi.org/10.1007/978-981-13-3131-2_9
195
196 Y. Higuchi and G. Shimada
The second phase took place in the 1980s and the 1990s, when the WashingtonConsensus became an international norm, and structural adjustment programs (SAP)were adopted by the Bretton Woods Institutions, including the World Bank and theInternational Monetary Fund (IMF).2 In this second phase, the failure of ISI policiesprovoked harsh backlash against governmental intervention in industries, and theSAPprogramwas favorably accepted, partially because of thewidespreadworldwidesupport for neoliberal regimes. The proponents of SAP policies emphasized the riskof government failure and political capture.
The third phase began in the 2000s when industrial policies were reconsideredas an important policy tool for economic development, as the rise of emergingeconomies like China, India, Brazil, and South Korea was observed. In this phase, theimportance of narrowly defined industrial policy, in the form of previously failed ISIpolicies, has been muted, but the importance of policy to promote industrialization ingeneral and to reform investment climate has been recognized. Although there is nouniversally accepted definition of industrial policy, the scope of industrial policy hasexpanded to include the selection and promotion of an industry in which a countryhas comparative advantage (e.g., Hausmann et al. 2005; Lin 2012) and even broadermeasures to correct market failures, including information asymmetry, externality,and coordination failure. The latter includes infrastructure development, job training,and research and development support to promote the industrial sector as a whole,not just specific industries (Harrison and Rodríguez-Clare 2010; Stiglitz et al. 2013).In this chapter, we do not formally define industrial policy, but we discuss the generalimportance of industrial policy and its potential in Africa.
The renewed attention to industrial policy in recent years has been called “thereturn of industrial policy” by Rodrik (2010), and a series of influential books havebeen published by Noman and Stiglitz (2015, 2016). The reasons behind the ris-ing interest in industrial policy include the general recognition of the importance ofjob creation in the developing world, particularly after the Arab Spring, when unem-ployed educated youths started an economically motivated riot that ignited a politicalmovement (World Bank 2012). In addition, a recent sign of successful industrializa-tion in Ethiopia and Rwanda illustrated that industrial policy can promote structuraltransformation from the agricultural to the non-agricultural sector in Africa (Oqubay2015; Noman and Stiglitz 2015; Dinh et al. 2012).
Furthermore, the importance of industrial policy in the history of the U.S. andEurope was rediscovered in recent studies (e.g., Chang 2007; Reinert 2007), andnascent literature empirically investigates the effect of industrial policies (Aghionet al. 2017; Criscuolo et al. 2012). Admitting that the literature is still emerging andnot yet conclusive, Nunn and Trefler (2010) run a cross-country growth regression,and find that subsidies targeted to skill-intensive sectors promote economic growth,suggesting the ubiquitous role of industrial policy both in developed and developingcountries. Lane (2017) attempts to establish causal impacts on industrial policy by
2The only international donor against the SAP was Japan. In 1993, the Overseas Economic Coop-eration Fund (OECF, now JICA) published a paper in favor of industrial policy (OECF 1993). Itcaused controversy between the OECF and the World Bank (Mosley et al. 1995; Wade 1996).
9 Industrial Policy, Industrial Development … 197
examining the case of Korea’s big-push industrial policy from the 1970s. Usingnewly digitized data, and exploiting the unexpected beginning and sector-choice ofthe policy, Lane (2017) finds that industries targeted by the policy had significantlyhigher growth rates even after the termination of the policy, which also had a positivespillover effect on downstream industries.
In this chapter, we first discuss how industrial policy can help industrial devel-opment and economic growth using a simple conceptual framework. Based on ourframework, we illustrate that industrial policy contributes to economic growth byenhancing labor productivity and reallocating labor from low productivity to highproductivity sectors. Second, we use macroeconomic data from Asian and sub-Saharan African countries to present a sharp contrast between the two economies.Asian economies successfully achieved economic growth, which was led by theindustrial development, particularly in labor-intensive sectors, whereas Africaneconomies have long been stagnant since independence, which can be attributedto the failure of industrialization. We also conduct decomposition analysis to showthat the degree of labor reallocation is particularly limited in Africa. Lastly, we arguethat managerial capacity is missing in Africa, and introduce a feasible strategy thathas potential to stimulate African economic growth.
9.2 Conceptual Framework
We denote Y as the real GDP and L as the population of a country so that Y /Lindicates the country’s GDP per capita.3 Furthermore, we denote Yk as the real GDPin sector k, where k �agriculture (agr), industry (ind), or service (ser), and Lk asthe employment in sector k. Now, we obtain the following equation:
Y/L � (Yagr + Yind + Yser
)/L � Σ(Yk/L) � Σ{(Yk/Lk) ∗ (Lk/L)} (9.1)
In the last expression, Yk /Lk represents intra-industry labor productivity and Lk/Lrepresents sectoral share of labor. Assuming the standard production function whereoutput is a function of labor and capital with a given level of technology, the intra-industry labor productivity is a function of capital per capita (that is, capital deepen-ing) and technology.
In this framework, industrial policies can enhance the intra-industry labor produc-tivity or reallocate labor from a low productivity to a high productivity sector. Theintra-industry productivity will be enhanced by infrastructure investment, institu-tional reform, and technology borrowing. In the agricultural sector, the land endow-ment is fixed, and thus, an increase in agricultural share of labor (Lagr /L) reduces
3We assume that the whole population is employed, but the main discussion remains the same if wedefine GDP per capita as Y /N , where N is the total population. Then, Y /N is the product of Y /L andL/N , where the latter term represents the employment share of population. Under our assumption,we hold L/N constant at one because the availability of the employment share data is limited.
198 Y. Higuchi and G. Shimada
agricultural labor productivity (Yagr /Lagr) because of diminishing marginal productof labor. Although agricultural productivity may be improved by irrigation, landreform, or the use of improved agricultural technology and inputs, the value-addedof share of agriculture (Yagr /L) does not dramatically increase because of these off-setting effects.
In contrast, an increase in industrial share of labor (Lind /L) does not necessarilyreduce industrial labor productivity (Yind /Lind) because the industrial sector is notconstrained by land endowment. In particular, development of labor-intensive indus-tries will increase both industrial productivity and industrial share of labor, so thatthe value-added of share of industry (Yind /L) will dramatically increase. In addition,holding the service sector constant, the increase in industrial share of labor reducesagricultural share of labor, which in turn, increases agricultural labor productivityby reallocating surplus labor from the agriculture to industrial sector.
Indeed, the importance of the labor reallocation, or it can be stated as structuraltransformation, has received increasing attention both by researchers (e.g., Diaoet al. 2017; Herrendorf et al. 2014; Hsieh and Klenow 2009; McMillan et al. 2014)and policymakers. A leading example is the Nairobi Declaration adopted after theSixth Tokyo International Conference onAfricanDevelopment (TICADVI) in 2016,where the heads of 54 African countries assembled. One of the three pillars ofthe declaration for future African economic development is “promoting structuraleconomic transformation through economic diversification and industrialization.4”Hence, Eq. (9.1) illustrates the role of industrial policy in productivity improvementand labor reallocation.5
The service sector has traditional sub-sectors, mostly consisting of non-tradablegoods and services, and modern sub-sectors, including finance and ICT-based ser-vices (Jensen 2011). An improvement in productivity in the former sub-sector islimited because of fixed local demand for non-tradable goods and services, whereasthe latter sub-sector has potential for productivity increase. The modern sector, how-ever, employs a small number of educated and highly skilled workers, and thus, thelabor absorption capacity is limited (Goswami et al. 2011). Although the servicesector is not constrained by land endowment, it is difficult to increase both serviceshare of labor (Lser /L) and service productivity (Yser /Lser). Taken together, the devel-opment of the industrial sector, particularly the labor-intensive industrial sector, isthe most important channel for economic growth, particularly for countries that havecomparative advantage in labor-intensive industry with abundant unskilled labor.
The wage structure in Africa is characterized as dual, in which a small numberof highly skilled and educated workers earn high wage, whereas the rest earn low(Hino and Ranis 2013). In addition, fertility rates are still high in African countries sothat they can take advantage of the population bonus. Hence, Africa has comparative
4http://www.mofa.go.jp/af/af1/page3e_000543.html (retrieved on November 23, 2018).5Estudillo et al. (2018) in this volume discuss the labor allocation from agriculture to non-agriculture(i.e., industry and service sectors taken together) inAsia andAfrica. They argue that the developmentof the non-agricultural sectorwas a key component ofAsian economic growth andpoverty reduction,whereas the majority of Africans are still engaged in the agricultural sector, and the structuraltransformation was slow.
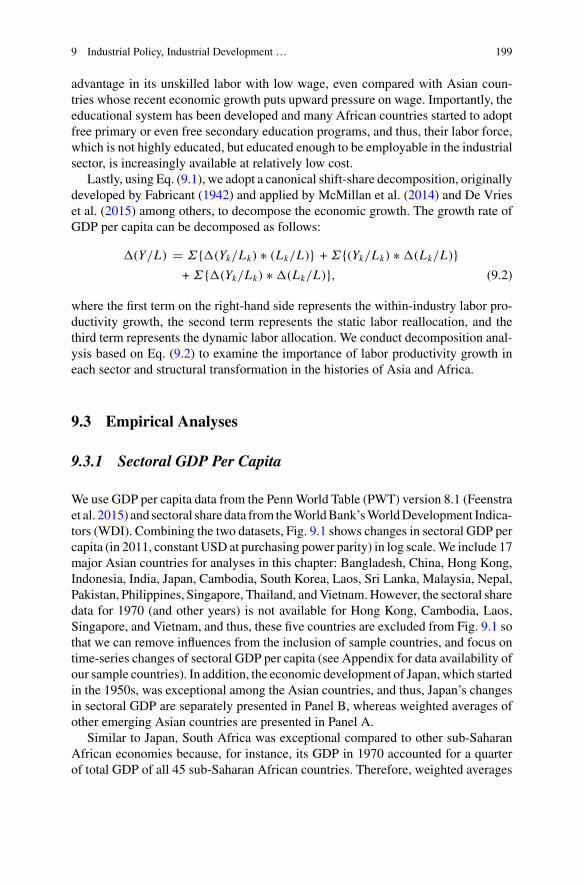
9 Industrial Policy, Industrial Development … 199
advantage in its unskilled labor with low wage, even compared with Asian coun-tries whose recent economic growth puts upward pressure on wage. Importantly, theeducational system has been developed and many African countries started to adoptfree primary or even free secondary education programs, and thus, their labor force,which is not highly educated, but educated enough to be employable in the industrialsector, is increasingly available at relatively low cost.
Lastly, using Eq. (9.1), we adopt a canonical shift-share decomposition, originallydeveloped by Fabricant (1942) and applied by McMillan et al. (2014) and De Vrieset al. (2015) among others, to decompose the economic growth. The growth rate ofGDP per capita can be decomposed as follows:
�(Y/L) � Σ{�(Yk/Lk) ∗ (Lk/L)} + Σ{(Yk/Lk) ∗ �(Lk/L)}+ Σ{�(Yk/Lk) ∗ �(Lk/L)}, (9.2)
where the first term on the right-hand side represents the within-industry labor pro-ductivity growth, the second term represents the static labor reallocation, and thethird term represents the dynamic labor allocation. We conduct decomposition anal-ysis based on Eq. (9.2) to examine the importance of labor productivity growth ineach sector and structural transformation in the histories of Asia and Africa.
9.3 Empirical Analyses
9.3.1 Sectoral GDP Per Capita
We use GDP per capita data from the PennWorld Table (PWT) version 8.1 (Feenstraet al. 2015) and sectoral share data from theWorldBank’sWorldDevelopment Indica-tors (WDI). Combining the two datasets, Fig. 9.1 shows changes in sectoral GDP percapita (in 2011, constant USD at purchasing power parity) in log scale.We include 17major Asian countries for analyses in this chapter: Bangladesh, China, Hong Kong,Indonesia, India, Japan, Cambodia, South Korea, Laos, Sri Lanka, Malaysia, Nepal,Pakistan, Philippines, Singapore, Thailand, andVietnam.However, the sectoral sharedata for 1970 (and other years) is not available for Hong Kong, Cambodia, Laos,Singapore, and Vietnam, and thus, these five countries are excluded from Fig. 9.1 sothat we can remove influences from the inclusion of sample countries, and focus ontime-series changes of sectoral GDP per capita (see Appendix for data availability ofour sample countries). In addition, the economic development of Japan, which startedin the 1950s, was exceptional among the Asian countries, and thus, Japan’s changesin sectoral GDP are separately presented in Panel B, whereas weighted averages ofother emerging Asian countries are presented in Panel A.
Similar to Japan, South Africa was exceptional compared to other sub-SaharanAfrican economies because, for instance, its GDP in 1970 accounted for a quarterof total GDP of all 45 sub-Saharan African countries. Therefore, weighted averages
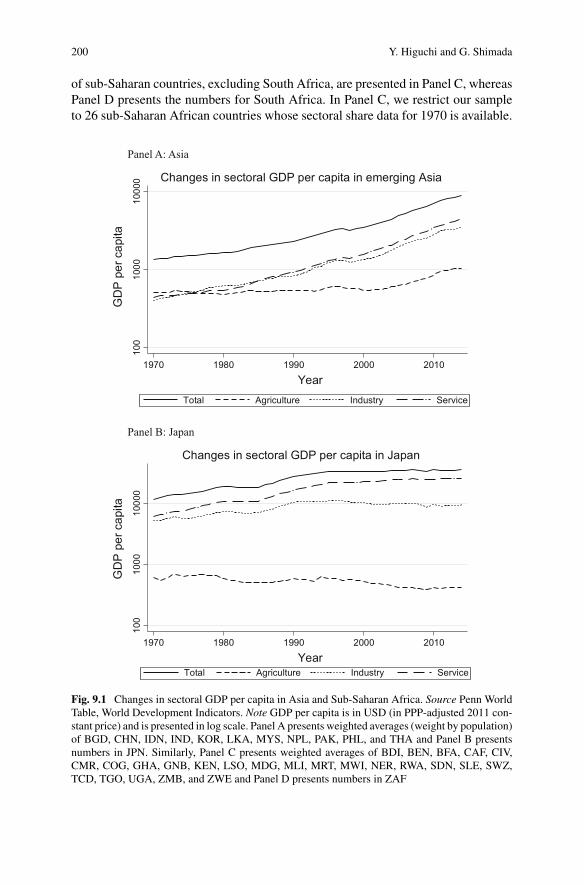
200 Y. Higuchi and G. Shimada
of sub-Saharan countries, excluding South Africa, are presented in Panel C, whereasPanel D presents the numbers for South Africa. In Panel C, we restrict our sampleto 26 sub-Saharan African countries whose sectoral share data for 1970 is available.
Panel A: Asia
Panel B: Japan
100
1000
1000
0
GD
P pe
r cap
ita
1970 1980 1990 2000 2010
YearTotal Agriculture Industry Service
Changes in sectoral GDP per capita in emerging Asia
100
1000
1000
0
GD
P pe
r cap
ita
1970 1980 1990 2000 2010
Year
Changes in sectoral GDP per capita in Japan
Total Agriculture Industry Service
Fig. 9.1 Changes in sectoral GDP per capita in Asia and Sub-Saharan Africa. Source Penn WorldTable, World Development Indicators. Note GDP per capita is in USD (in PPP-adjusted 2011 con-stant price) and is presented in log scale. Panel A presents weighted averages (weight by population)of BGD, CHN, IDN, IND, KOR, LKA, MYS, NPL, PAK, PHL, and THA and Panel B presentsnumbers in JPN. Similarly, Panel C presents weighted averages of BDI, BEN, BFA, CAF, CIV,CMR, COG, GHA, GNB, KEN, LSO, MDG, MLI, MRT, MWI, NER, RWA, SDN, SLE, SWZ,TCD, TGO, UGA, ZMB, and ZWE and Panel D presents numbers in ZAF
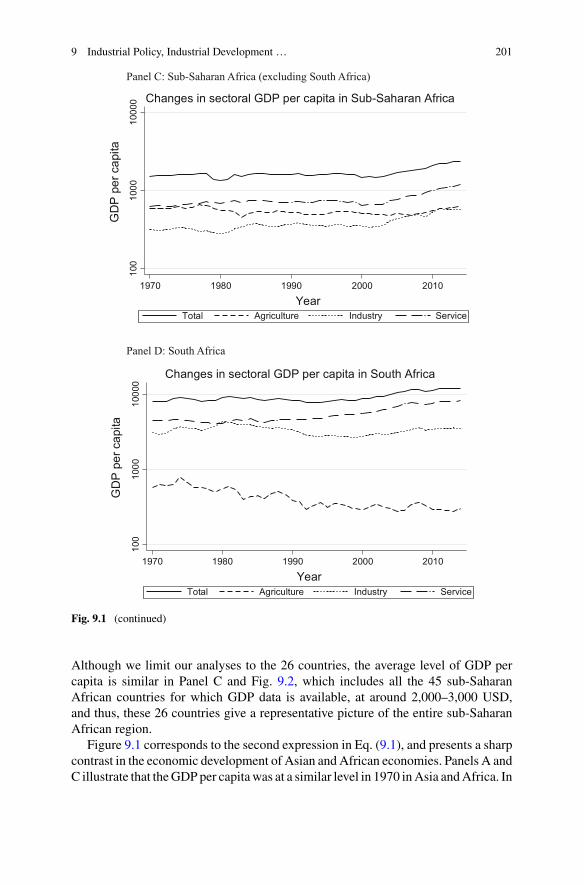
9 Industrial Policy, Industrial Development … 201
Panel C: Sub-Saharan Africa (excluding South Africa)
Panel D: South Africa
100
1000
1000
0
GD
P pe
r cap
ita
1970 1980 1990 2000 2010
Year
Changes in sectoral GDP per capita in Sub-Saharan Africa
100
1000
1000
0
GD
P pe
r cap
ita
1970 1980 1990 2000 2010
Year
Changes in sectoral GDP per capita in South Africa
Total Agriculture Industry Service
Total Agriculture Industry Service
Fig. 9.1 (continued)
Although we limit our analyses to the 26 countries, the average level of GDP percapita is similar in Panel C and Fig. 9.2, which includes all the 45 sub-SaharanAfrican countries for which GDP data is available, at around 2,000–3,000 USD,and thus, these 26 countries give a representative picture of the entire sub-SaharanAfrican region.
Figure 9.1 corresponds to the second expression in Eq. (9.1), and presents a sharpcontrast in the economic development of Asian andAfrican economies. Panels A andC illustrate that theGDPper capitawas at a similar level in 1970 inAsia andAfrica. In
202 Y. Higuchi and G. Shimada
1970, for instance, Korea’s GDP per capita was 2,088 USD, which was comparableto that of Congo (2,281 USD) or that of Tanzania (1,750 USD), and was much lowerthan that of Ghana (2,843 USD). The two regions’ economies have diverged, and thestagnation of African economies in the 1970s and 1980s, as discussed by Easterlyand Levine (1997) among others, is evident in Panel C. The increase in Asia’s GDPper capita seems to be a result of the increase in industrial GDP per capita and serviceGDP per capita, whereas the industrial GDP remained stagnant in Africa.
Using the same data as Fig. 9.1, Table 9.1 presents sectoral GDP per capita and thecontribution of each sector in selected years. There are three major points to note.First, the agricultural GDP per capita is almost constant in the last four decades,particularly in Africa. As Gollin et al. (2014) find, the increase in agricultural pro-ductivity is cancelled out by the decrease in the labor share in agriculture, and thus, theagricultural GDP per capita did not increase despite the productivity improvement.This supports our argument in the previous section that economic growth cannot beachieved only by developing the agricultural sector.
Secondly, similar to the agricultural sector, the industrial GDP per capita has beenstagnant at a low level over the past four decades in Africa. This suggests that neitherthe ISI policies adopted in the post-independent era of the 1960s and 1970s nor theSAP policies in the 1980s and 1990s helped industrialization in Africa. The SAPcomprised market-oriented policies without governmental intervention, which canbe considered an absence of industrial policy. The absence of industrial policy andsubsequent failure in industrialization in Africa in the 1980s and 1990s is reminiscentof India’s experiences as discussed byNomura (2018) in this volume.Using data fromNigeria, Austin (2014) argues that the failure, as well as the absence, of industrialpolicies resulted in the failure of labor-intensive industrialization despite its potentialfor offering ample employment opportunities.6
In contrast, Asian economies experienced a rapid increase in industrial GDPper capita, which led to Asian economic growth. Otsuka et al. (2017a) discussthat industrial development played a critical role in Asian economies by increas-ing income without expanding inequality because labor-intensive industrial sectorscreated ample job opportunities. Similarly, Tanimoto (2018) and Kubo (2018) in thisvolume illustrate that labor-intensive industrialization took place in the early stage ofeconomic development, which was followed by the development of capital-intensiveindustries in Japan and China, respectively. Stiglitz and Uy (1996) and Wade (1990)argue that such economic “miracle” of Asia, led by Japan and followed by AsianTigers (Hong Kong, South Korea, Singapore, and Taiwan), was a consequence ofindustrial policies not in the form of ISI policies that ignored the comparative advan-tage but in the form of export-oriented policies that was friendly with markets andtook advantage of the comparative advantage.
6We admit that there are other factors, other than industrial policy, that hampered African industri-alization. For instance, Frazer (2008) empirically finds that influx of used-clothing donation, whichended up being sold in Africa, had large negative impacts on apparel production. Discussing allpossible factors that affected a specific industry is beyond the scope of this chapter, and we focusour discussion on industrial policy.
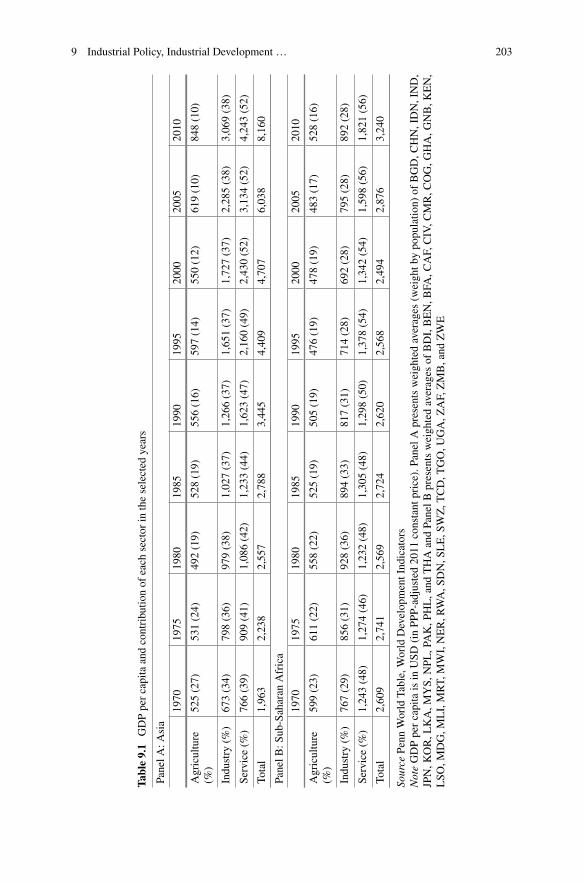
9 Industrial Policy, Industrial Development … 203
Table9.1
GDPpercapitaandcontributio
nof
each
sector
intheselected
years
PanelA
:Asia
1970
1975
1980
1985
1990
1995
2000
2005
2010
Agriculture
(%)
525(27)
531(24)
492(19)
528(19)
556(16)
597(14)
550(12)
619(10)
848(10)
Industry
(%)
673(34)
798(36)
979(38)
1,027(37)
1,266(37)
1,651(37)
1,727(37)
2,285(38)
3,069(38)
Service(%
)766(39)
909(41)
1,086(42)
1,233(44)
1,623(47)
2,160(49)
2,430(52)
3,134(52)
4,243(52)
Total
1,963
2,238
2,557
2,788
3,445
4,409
4,707
6,038
8,160
PanelB
:Sub-Saharan
Africa
1970
1975
1980
1985
1990
1995
2000
2005
2010
Agriculture
(%)
599(23)
611(22)
558(22)
525(19)
505(19)
476(19)
478(19)
483(17)
528(16)
Industry
(%)
767(29)
856(31)
928(36)
894(33)
817(31)
714(28)
692(28)
795(28)
892(28)
Service(%
)1,243(48)
1,274(46)
1,232(48)
1,305(48)
1,298(50)
1,378(54)
1,342(54)
1,598(56)
1,821(56)
Total
2,609
2,741
2,569
2,724
2,620
2,568
2,494
2,876
3,240
Sour
cePenn
World
Table,World
DevelopmentIndicators
Not
eGDPpercapitaisin
USD
(inPP
P-adjusted
2011
constant
price).P
anelApresentsweightedaverages
(weightb
ypopulatio
n)of
BGD,C
HN,IDN,IND,
JPN,K
OR,L
KA,M
YS,
NPL
,PAK,P
HL,and
THAandPanelB
presentsweightedaverages
ofBDI,BEN,B
FA,C
AF,CIV,C
MR,C
OG,G
HA,G
NB,K
EN,
LSO
,MDG,M
LI,MRT,
MWI,NER,R
WA,S
DN,S
LE,S
WZ,T
CD,T
GO,U
GA,Z
AF,ZMB,and
ZWE
204 Y. Higuchi and G. Shimada
Third, the service GDP per capita increased both in Asia and Africa. In particular,the modest growth of GDP per capita after 2000 in Africa has been led by servicesector growth. The GDP per capita increased from 2,494 USD in 2000 to 3,240 USDin 2010, and most of the increase can be attributed to the service sector growth.This phenomenon is known as premature deindustrialization (Haraguchi et al. 2017;Rodrik 2016) and premature shift to service industries (Page 2012). In Asia, Philip-pines and India are examples of economic growth driven by service sector growth,and a similar pattern is observed in Rwanda and Senegal. The labor absorption capac-ity, however, is limited in the service sector, particularly in modern service sectorslike finance and ICT without backward and forward linkages in industries. Thesecountries experience widening inequality within each country, and thus, this patternof economic development seems to be unsustainable.
9.3.2 Sectoral Employment
Next, we show the sectoral share of employment in Table 9.2. As the data availabilityis severely limited, we replace a missing observation with the nearest observationof the same country within the four-year interval.7 We must note, however, that thenumber of observations is still small, particularly in the early period in our analyses.Our data shows that the agricultural share of employment has continuously decreasedboth in Asia and Africa, whereas the service sector share has continuously increased.
Admitting that sample countries do not overlap, Tables 9.1 and 9.2 suggest thatindustrial productivity has increased in Asia, but decreased in Africa, where theincrease in employment share exceeds the increase in industrial GDP per capita. Thisstands in contrast to Duarte and Restuccia (2010) and Rodrik (2013), who find thatmanufacturing labor productivity unconditionally converges all over the world. Suchexceptional absence of industrial productivity growth in Africa illustrates the failureof industrial development. At the same time, however, the low industrial productivityand global convergence suggests that there is potential room for increasing industriallabor productivity through industrial policies.
9.3.3 Finer Sectoral Classification
In order to analyze the contribution of specific industries to economic growth, wealternatively denote k in Eq. (9.1) as narrowly defined industries, such as mining,manufacturing, trade, and finance, rather than the broadly defined industrial sectorvis-à-vis agriculture and service sectors. We use data taken from the GroningenGrowth and Development Centre (GGDC) 10-Sector Database (Timmer et al. 2014),which categorizes economic activities into ten groups, which are comparable across
7For instance, the employment share data of Burkina Faso is replaced with its 1994 value for years1990 and 1995, but the observations are missing for 1985 and earlier (see columns toward right inTable 9.5 in Appendix).
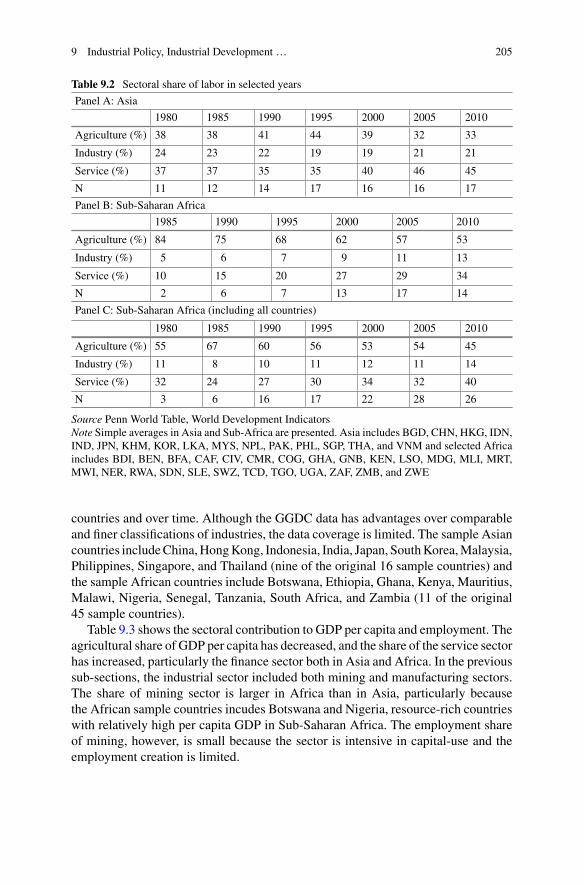
9 Industrial Policy, Industrial Development … 205
Table 9.2 Sectoral share of labor in selected years
Panel A: Asia
1980 1985 1990 1995 2000 2005 2010
Agriculture (%) 38 38 41 44 39 32 33
Industry (%) 24 23 22 19 19 21 21
Service (%) 37 37 35 35 40 46 45
N 11 12 14 17 16 16 17
Panel B: Sub-Saharan Africa
1985 1990 1995 2000 2005 2010
Agriculture (%) 84 75 68 62 57 53
Industry (%) 5 6 7 9 11 13
Service (%) 10 15 20 27 29 34
N 2 6 7 13 17 14
Panel C: Sub-Saharan Africa (including all countries)
1980 1985 1990 1995 2000 2005 2010
Agriculture (%) 55 67 60 56 53 54 45
Industry (%) 11 8 10 11 12 11 14
Service (%) 32 24 27 30 34 32 40
N 3 6 16 17 22 28 26
Source Penn World Table, World Development IndicatorsNote Simple averages in Asia and Sub-Africa are presented. Asia includes BGD, CHN, HKG, IDN,IND, JPN, KHM, KOR, LKA, MYS, NPL, PAK, PHL, SGP, THA, and VNM and selected Africaincludes BDI, BEN, BFA, CAF, CIV, CMR, COG, GHA, GNB, KEN, LSO, MDG, MLI, MRT,MWI, NER, RWA, SDN, SLE, SWZ, TCD, TGO, UGA, ZAF, ZMB, and ZWE
countries and over time. Although the GGDC data has advantages over comparableand finer classifications of industries, the data coverage is limited. The sample Asiancountries includeChina,HongKong, Indonesia, India, Japan, SouthKorea,Malaysia,Philippines, Singapore, and Thailand (nine of the original 16 sample countries) andthe sample African countries include Botswana, Ethiopia, Ghana, Kenya, Mauritius,Malawi, Nigeria, Senegal, Tanzania, South Africa, and Zambia (11 of the original45 sample countries).
Table 9.3 shows the sectoral contribution to GDP per capita and employment. Theagricultural share of GDP per capita has decreased, and the share of the service sectorhas increased, particularly the finance sector both in Asia and Africa. In the previoussub-sections, the industrial sector included both mining and manufacturing sectors.The share of mining sector is larger in Africa than in Asia, particularly becausethe African sample countries incudes Botswana and Nigeria, resource-rich countrieswith relatively high per capita GDP in Sub-Saharan Africa. The employment shareof mining, however, is small because the sector is intensive in capital-use and theemployment creation is limited.
206 Y. Higuchi and G. Shimada
The manufacturing sector, which is represented by labor-intensive industries andabsorbs large amounts of labor, presents clear contrast in the two regions. The man-ufacturing share of value added in Asia was already much higher than in Africaat 18.9% in 1970, and further increased to 23.3% in 2010 so that almost a quarterof Asian value-added is from the manufacturing sector today whereas the share inAfrica has been stagnant at around 10%.Moreover, the value-added share of theman-ufacturing sector has increased more than the employment share in Asia, indicatingthat the labor productivity in the manufacturing sector has increased. Therefore, themanufacturing sector creates numerous high value-adding jobs, and contributes toAsian economic growth.
9.3.4 Decomposition Analysis
Table 9.4 shows the results of decomposition analyses based on Eq. (9.2). Row (A)corresponds to the first term on the right-hand side, and represents within-industrylabor productivity growth. Both in Asia and Africa, this accounts for a large pro-portion of labor productivity growth. Row (B) represents static labor reallocation,whereas row (C) represents dynamic labor allocation. In Africa, the latter is nega-tive and large in magnitude. Africa is experiencing urbanization and expansion ofurban slums, and the urban service sector, mostly in informal economy, absorbslabor from rural areas. The productivity of such sector, however, remains low. Onthe other hand, the reduction of surplus agricultural labor increases agricultural laborproductivity. Therefore, the contribution of dynamic labor reallocation is negativebecause the labor shifts away from agriculture, whose productivity increases, to othersectors—mostly the service sector, where the productivity does not increase.
We combine rows (B) and (C) to examine the total effect of labor reallocation. InAsia, the contribution is positive. Between both 1990–2000 and 2000–2010, laborreallocation contributes to about 1% of annual productivity growth. However, thecontribution of labor reallocation is negative in Africa. In other words, the structuraltransformation does not account for economic development.Although the labor shiftsfrom agricultural sector to other sectors, the productivity is low in these sectors.
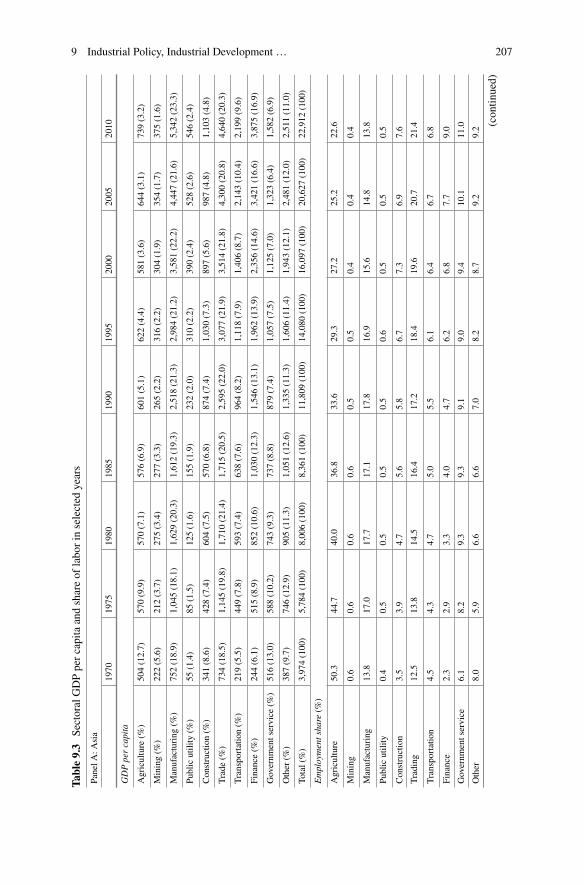
9 Industrial Policy, Industrial Development … 207
Table9.3
SectoralGDPpercapitaandshareof
labo
rin
selected
years
PanelA
:Asia
1970
1975
1980
1985
1990
1995
2000
2005
2010
GD
Ppe
rca
pita
Agriculture
(%)
504(12.7)
570(9.9)
570(7.1)
576(6.9)
601(5.1)
622(4.4)
581(3.6)
644(3.1)
739(3.2)
Mining(%
)222(5.6)
212(3.7)
275(3.4)
277(3.3)
265(2.2)
316(2.2)
304(1.9)
354(1.7)
375(1.6)
Manufacturing
(%)
752(18.9)
1,045(18.1)
1,629(20.3)
1,612(19.3)
2,518(21.3)
2,984(21.2)
3,581(22.2)
4,447(21.6)
5,342(23.3)
Publicutility
(%)
55(1.4)
85(1.5)
125(1.6)
155(1.9)
232(2.0)
310(2.2)
390(2.4)
528(2.6)
546(2.4)
Construction(%
)341(8.6)
428(7.4)
604(7.5)
570(6.8)
874(7.4)
1,030(7.3)
897(5.6)
987(4.8)
1,103(4.8)
Trade
(%)
734(18.5)
1,145(19.8)
1,710(21.4)
1,715(20.5)
2,595(22.0)
3,077(21.9)
3,514(21.8)
4,300(20.8)
4,640(20.3)
Transportation(%
)219(5.5)
449(7.8)
593(7.4)
638(7.6)
964(8.2)
1,118(7.9)
1,406(8.7)
2,143(10.4)
2,199(9.6)
Finance(%
)244(6.1)
515(8.9)
852(10.6)
1,030(12.3)
1,546(13.1)
1,962(13.9)
2,356(14.6)
3,421(16.6)
3,875(16.9)
Governm
entservice
(%)
516(13.0)
588(10.2)
743(9.3)
737(8.8)
879(7.4)
1,057(7.5)
1,125(7.0)
1,323(6.4)
1,582(6.9)
Other
(%)
387(9.7)
746(12.9)
905(11.3)
1,051(12.6)
1,335(11.3)
1,606(11.4)
1,943(12.1)
2,481(12.0)
2,511(11.0)
Total(%)
3,974(100)
5,784(100)
8,006(100)
8,361(100)
11,809
(100)
14,080
(100)
16,097
(100)
20,627
(100)
22,912
(100)
Em
ploy
men
tsha
re(%
)
Agriculture
50.3
44.7
40.0
36.8
33.6
29.3
27.2
25.2
22.6
Mining
0.6
0.6
0.6
0.6
0.5
0.5
0.4
0.4
0.4
Manufacturing
13.8
17.0
17.7
17.1
17.8
16.9
15.6
14.8
13.8
Publicutility
0.4
0.5
0.5
0.5
0.5
0.6
0.5
0.5
0.5
Construction
3.5
3.9
4.7
5.6
5.8
6.7
7.3
6.9
7.6
Trading
12.5
13.8
14.5
16.4
17.2
18.4
19.6
20.7
21.4
Transportation
4.5
4.3
4.7
5.0
5.5
6.1
6.4
6.7
6.8
Finance
2.3
2.9
3.3
4.0
4.7
6.2
6.8
7.7
9.0
Governm
entservice
6.1
8.2
9.3
9.3
9.1
9.0
9.4
10.1
11.0
Other
8.0
5.9
6.6
6.6
7.0
8.2
8.7
9.2
9.2 (c
ontin
ued)
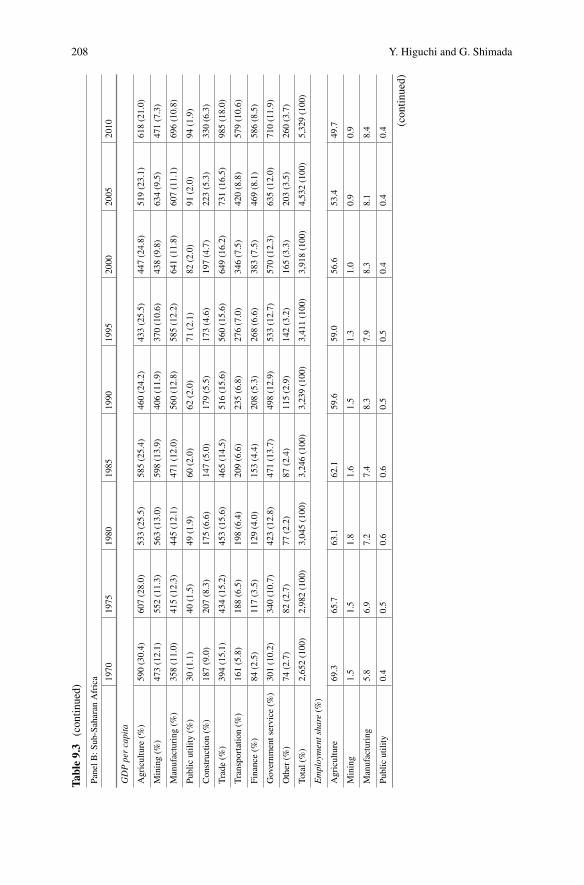
208 Y. Higuchi and G. Shimada
Table9.3
(contin
ued)
PanelB
:Sub-Saharan
Africa 1970
1975
1980
1985
1990
1995
2000
2005
2010
GD
Ppe
rca
pita
Agriculture
(%)
590(30.4)
607(28.0)
533(25.5)
585(25.4)
460(24.2)
433(25.5)
447(24.8)
519(23.1)
618(21.0)
Mining(%
)473(12.1)
552(11.3)
563(13.0)
598(13.9)
406(11.9)
370(10.6)
438(9.8)
634(9.5)
471(7.3)
Manufacturing
(%)
358(11.0)
415(12.3)
445(12.1)
471(12.0)
560(12.8)
585(12.2)
641(11.8)
607(11.1)
696(10.8)
Publicutility
(%)
30(1.1)
40(1.5)
49(1.9)
60(2.0)
62(2.0)
71(2.1)
82(2.0)
91(2.0)
94(1.9)
Construction(%
)187(9.0)
207(8.3)
175(6.6)
147(5.0)
179(5.5)
173(4.6)
197(4.7)
223(5.3)
330(6.3)
Trade
(%)
394(15.1)
434(15.2)
453(15.6)
465(14.5)
516(15.6)
560(15.6)
649(16.2)
731(16.5)
985(18.0)
Transportation(%
)161(5.8)
188(6.5)
198(6.4)
209(6.6)
235(6.8)
276(7.0)
346(7.5)
420(8.8)
579(10.6)
Finance(%
)84
(2.5)
117(3.5)
129(4.0)
153(4.4)
208(5.3)
268(6.6)
383(7.5)
469(8.1)
586(8.5)
Governm
entservice
(%)
301(10.2)
340(10.7)
423(12.8)
471(13.7)
498(12.9)
533(12.7)
570(12.3)
635(12.0)
710(11.9)
Other
(%)
74(2.7)
82(2.7)
77(2.2)
87(2.4)
115(2.9)
142(3.2)
165(3.3)
203(3.5)
260(3.7)
Total(%)
2,652(100)
2,982(100)
3,045(100)
3,246(100)
3,239(100)
3,411(100)
3,918(100)
4,532(100)
5,329(100)
Em
ploy
men
tsha
re(%
)
Agriculture
69.3
65.7
63.1
62.1
59.6
59.0
56.6
53.4
49.7
Mining
1.5
1.5
1.8
1.6
1.5
1.3
1.0
0.9
0.9
Manufacturing
5.8
6.9
7.2
7.4
8.3
7.9
8.3
8.1
8.4
Publicutility
0.4
0.5
0.6
0.6
0.5
0.5
0.4
0.4
0.4 (c
ontin
ued)
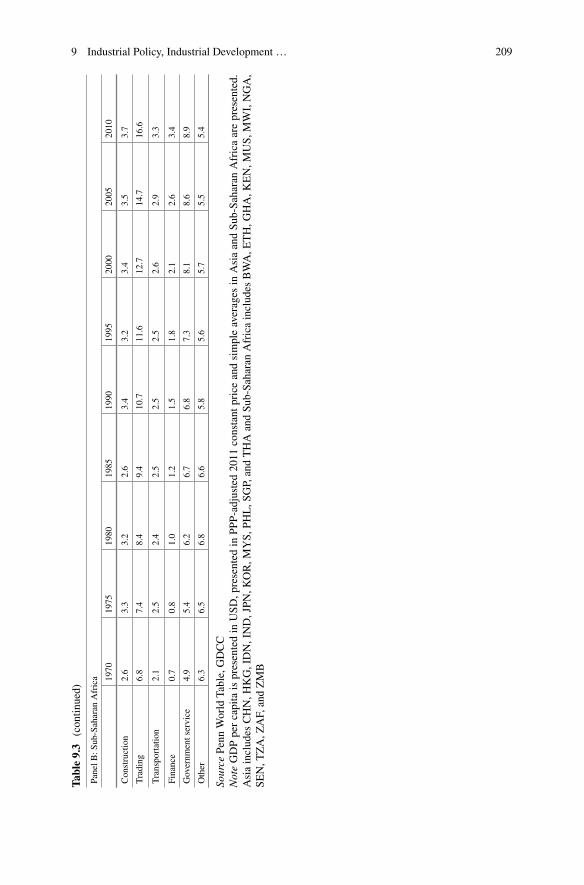
9 Industrial Policy, Industrial Development … 209
Table9.3
(contin
ued)
PanelB
:Sub-Saharan
Africa 1970
1975
1980
1985
1990
1995
2000
2005
2010
Construction
2.6
3.3
3.2
2.6
3.4
3.2
3.4
3.5
3.7
Trading
6.8
7.4
8.4
9.4
10.7
11.6
12.7
14.7
16.6
Transportation
2.1
2.5
2.4
2.5
2.5
2.5
2.6
2.9
3.3
Finance
0.7
0.8
1.0
1.2
1.5
1.8
2.1
2.6
3.4
Governm
entservice
4.9
5.4
6.2
6.7
6.8
7.3
8.1
8.6
8.9
Other
6.3
6.5
6.8
6.6
5.8
5.6
5.7
5.5
5.4
Sour
cePenn
World
Table,GDCC
Not
eGDPpercapitaispresentedin
USD
,presented
inPP
P-adjusted
2011
constant
priceandsimpleaverages
inAsiaandSu
b-SaharanAfricaarepresented.
Asiaincludes
CHN,H
KG,IDN,IND,JPN
,KOR,M
YS,
PHL,S
GP,andTHAandSu
b-SaharanAfricaincludes
BWA,E
TH,G
HA,K
EN,M
US,
MWI,NGA,
SEN,T
ZA,Z
AF,andZMB
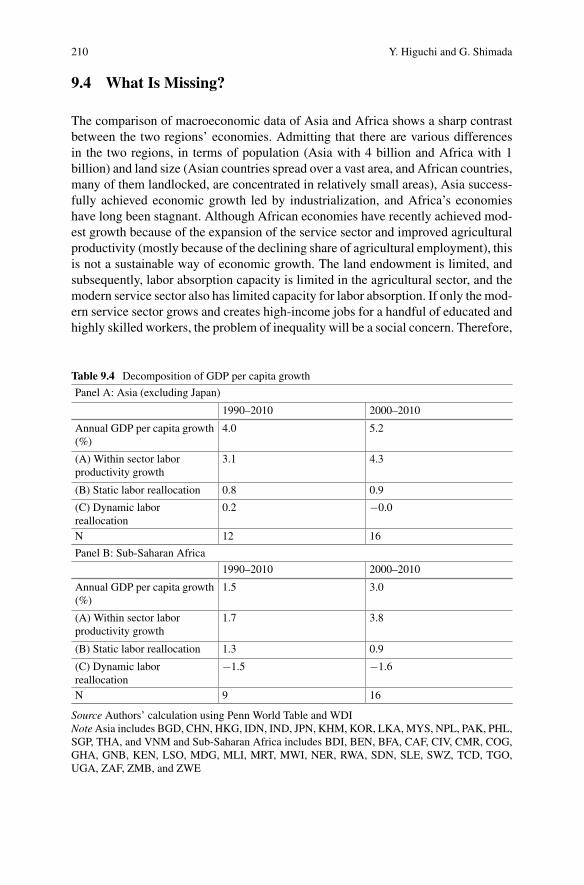
210 Y. Higuchi and G. Shimada
9.4 What Is Missing?
The comparison of macroeconomic data of Asia and Africa shows a sharp contrastbetween the two regions’ economies. Admitting that there are various differencesin the two regions, in terms of population (Asia with 4 billion and Africa with 1billion) and land size (Asian countries spread over a vast area, and African countries,many of them landlocked, are concentrated in relatively small areas), Asia success-fully achieved economic growth led by industrialization, and Africa’s economieshave long been stagnant. Although African economies have recently achieved mod-est growth because of the expansion of the service sector and improved agriculturalproductivity (mostly because of the declining share of agricultural employment), thisis not a sustainable way of economic growth. The land endowment is limited, andsubsequently, labor absorption capacity is limited in the agricultural sector, and themodern service sector also has limited capacity for labor absorption. If only the mod-ern service sector grows and creates high-income jobs for a handful of educated andhighly skilled workers, the problem of inequality will be a social concern. Therefore,
Table 9.4 Decomposition of GDP per capita growth
Panel A: Asia (excluding Japan)
1990–2010 2000–2010
Annual GDP per capita growth(%)
4.0 5.2
(A) Within sector laborproductivity growth
3.1 4.3
(B) Static labor reallocation 0.8 0.9
(C) Dynamic laborreallocation
0.2 −0.0
N 12 16
Panel B: Sub-Saharan Africa
1990–2010 2000–2010
Annual GDP per capita growth(%)
1.5 3.0
(A) Within sector laborproductivity growth
1.7 3.8
(B) Static labor reallocation 1.3 0.9
(C) Dynamic laborreallocation
−1.5 −1.6
N 9 16
Source Authors’ calculation using Penn World Table and WDINote Asia includes BGD, CHN, HKG, IDN, IND, JPN, KHM, KOR, LKA,MYS, NPL, PAK, PHL,SGP, THA, and VNM and Sub-Saharan Africa includes BDI, BEN, BFA, CAF, CIV, CMR, COG,GHA, GNB, KEN, LSO, MDG, MLI, MRT, MWI, NER, RWA, SDN, SLE, SWZ, TCD, TGO,UGA, ZAF, ZMB, and ZWE
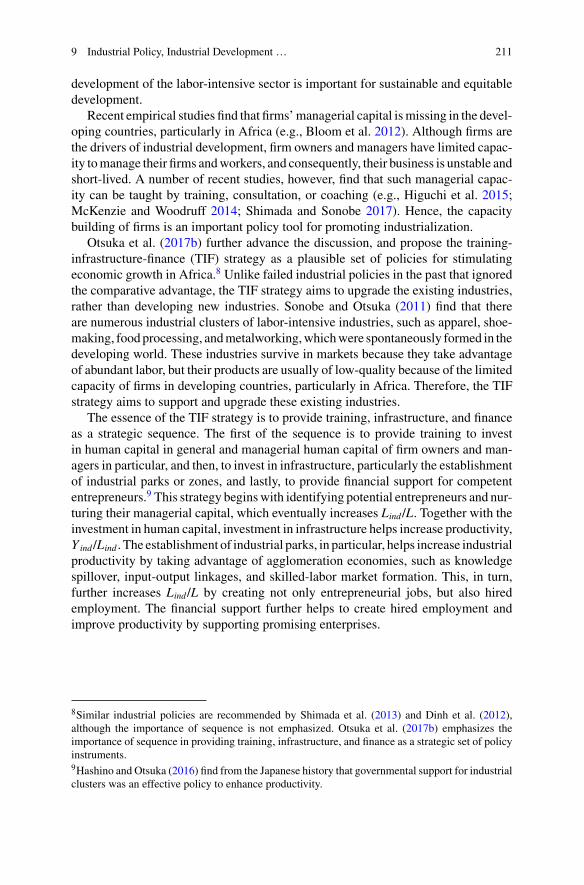
9 Industrial Policy, Industrial Development … 211
development of the labor-intensive sector is important for sustainable and equitabledevelopment.
Recent empirical studies find that firms’managerial capital ismissing in the devel-oping countries, particularly in Africa (e.g., Bloom et al. 2012). Although firms arethe drivers of industrial development, firm owners and managers have limited capac-ity tomanage their firms andworkers, and consequently, their business is unstable andshort-lived. A number of recent studies, however, find that such managerial capac-ity can be taught by training, consultation, or coaching (e.g., Higuchi et al. 2015;McKenzie and Woodruff 2014; Shimada and Sonobe 2017). Hence, the capacitybuilding of firms is an important policy tool for promoting industrialization.
Otsuka et al. (2017b) further advance the discussion, and propose the training-infrastructure-finance (TIF) strategy as a plausible set of policies for stimulatingeconomic growth in Africa.8 Unlike failed industrial policies in the past that ignoredthe comparative advantage, the TIF strategy aims to upgrade the existing industries,rather than developing new industries. Sonobe and Otsuka (2011) find that thereare numerous industrial clusters of labor-intensive industries, such as apparel, shoe-making, foodprocessing, andmetalworking,whichwere spontaneously formed in thedeveloping world. These industries survive in markets because they take advantageof abundant labor, but their products are usually of low-quality because of the limitedcapacity of firms in developing countries, particularly in Africa. Therefore, the TIFstrategy aims to support and upgrade these existing industries.
The essence of the TIF strategy is to provide training, infrastructure, and financeas a strategic sequence. The first of the sequence is to provide training to investin human capital in general and managerial human capital of firm owners and man-agers in particular, and then, to invest in infrastructure, particularly the establishmentof industrial parks or zones, and lastly, to provide financial support for competententrepreneurs.9 This strategy beginswith identifying potential entrepreneurs and nur-turing their managerial capital, which eventually increases Lind /L. Together with theinvestment in human capital, investment in infrastructure helps increase productivity,Yind /Lind . The establishment of industrial parks, in particular, helps increase industrialproductivity by taking advantage of agglomeration economies, such as knowledgespillover, input-output linkages, and skilled-labor market formation. This, in turn,further increases Lind /L by creating not only entrepreneurial jobs, but also hiredemployment. The financial support further helps to create hired employment andimprove productivity by supporting promising enterprises.
8Similar industrial policies are recommended by Shimada et al. (2013) and Dinh et al. (2012),although the importance of sequence is not emphasized. Otsuka et al. (2017b) emphasizes theimportance of sequence in providing training, infrastructure, and finance as a strategic set of policyinstruments.9Hashino and Otsuka (2016) find from the Japanese history that governmental support for industrialclusters was an effective policy to enhance productivity.
212 Y. Higuchi and G. Shimada
9.5 Conclusion
This chapter compares the performance of Asian and African economies in thepast half century. Starting with almost similar levels of GDP per capita at around2,000 USD in 1970, the Asian economies experienced rapid economic growth andGDP per capita increased almost to 10,000 USD in 2015. On the other hand, theAfrican economies had long been stagnant, and GDP per capita in 2015 was about3,500USD.Weargue thatAsia’s economic success can, at least partially, be attributedto the industrial development, which increased the industrial productivity and theshare of employment in the industrial sector.
Africa largely lacks industrial productivity growth and structural shift to the indus-trial sector. Now that Asian countries are losing comparative advantage in labor-intensive industries because of the increasing wage rates, Africa has a chance forindustrialization. In particular, China, which used to be theworld’s factory, is shiftingaway from labor-intensive industries. Hence, decent industrial policies, including theTIF strategy, are expected to stimulate African industrial development so that Africacan be a next production base of labor-intensive products.
100
1000
1000
0G
DP
per c
apita
1970 1980 1990 2000 2010Year
Fig. 9.2 Changes in GDP per capita in all Sub-Saharan African countries. Source Penn WorldTable, World Development Indicators. GDP per capita is in USD (in PPP-adjusted 2011 constantprice) and is presented in log scale. All Sub-Saharan countries, whose GDP data is available areincluded
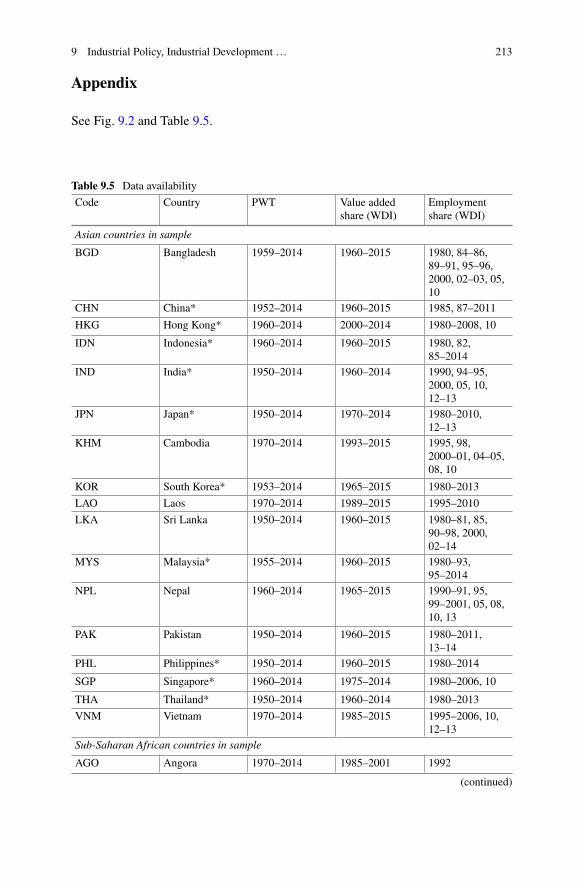
9 Industrial Policy, Industrial Development … 213
Appendix
See Fig. 9.2 and Table 9.5.
Table 9.5 Data availability
Code Country PWT Value addedshare (WDI)
Employmentshare (WDI)
Asian countries in sample
BGD Bangladesh 1959–2014 1960–2015 1980, 84–86,89–91, 95–96,2000, 02–03, 05,10
CHN China* 1952–2014 1960–2015 1985, 87–2011
HKG Hong Kong* 1960–2014 2000–2014 1980–2008, 10
IDN Indonesia* 1960–2014 1960–2015 1980, 82,85–2014
IND India* 1950–2014 1960–2014 1990, 94–95,2000, 05, 10,12–13
JPN Japan* 1950–2014 1970–2014 1980–2010,12–13
KHM Cambodia 1970–2014 1993–2015 1995, 98,2000–01, 04–05,08, 10
KOR South Korea* 1953–2014 1965–2015 1980–2013
LAO Laos 1970–2014 1989–2015 1995–2010
LKA Sri Lanka 1950–2014 1960–2015 1980–81, 85,90–98, 2000,02–14
MYS Malaysia* 1955–2014 1960–2015 1980–93,95–2014
NPL Nepal 1960–2014 1965–2015 1990–91, 95,99–2001, 05, 08,10, 13
PAK Pakistan 1950–2014 1960–2015 1980–2011,13–14
PHL Philippines* 1950–2014 1960–2015 1980–2014
SGP Singapore* 1960–2014 1975–2014 1980–2006, 10
THA Thailand* 1950–2014 1960–2014 1980–2013
VNM Vietnam 1970–2014 1985–2015 1995–2006, 10,12–13
Sub-Saharan African countries in sample
AGO Angora 1970–2014 1985–2001 1992
(continued)
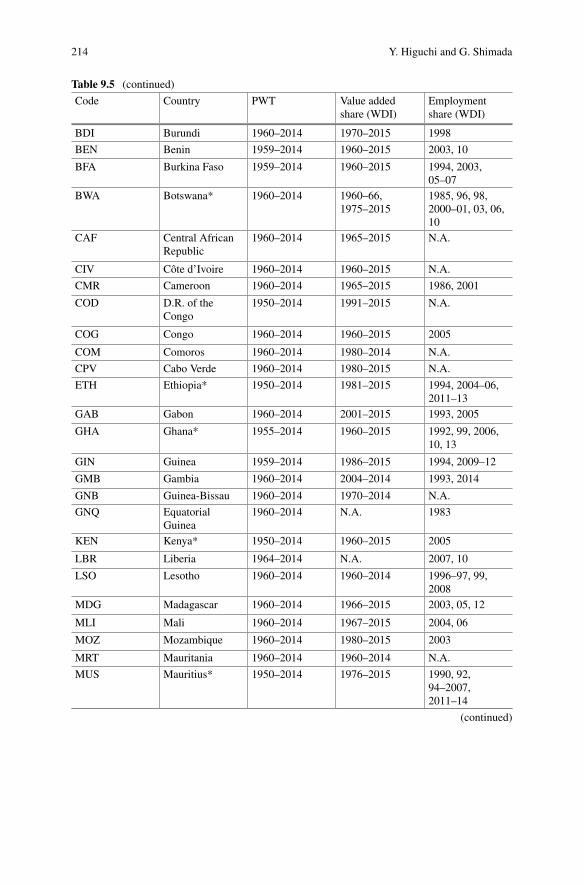
214 Y. Higuchi and G. Shimada
Table 9.5 (continued)
Code Country PWT Value addedshare (WDI)
Employmentshare (WDI)
BDI Burundi 1960–2014 1970–2015 1998
BEN Benin 1959–2014 1960–2015 2003, 10
BFA Burkina Faso 1959–2014 1960–2015 1994, 2003,05–07
BWA Botswana* 1960–2014 1960–66,1975–2015
1985, 96, 98,2000–01, 03, 06,10
CAF Central AfricanRepublic
1960–2014 1965–2015 N.A.
CIV Côte d’Ivoire 1960–2014 1960–2015 N.A.
CMR Cameroon 1960–2014 1965–2015 1986, 2001
COD D.R. of theCongo
1950–2014 1991–2015 N.A.
COG Congo 1960–2014 1960–2015 2005
COM Comoros 1960–2014 1980–2014 N.A.
CPV Cabo Verde 1960–2014 1980–2015 N.A.
ETH Ethiopia* 1950–2014 1981–2015 1994, 2004–06,2011–13
GAB Gabon 1960–2014 2001–2015 1993, 2005
GHA Ghana* 1955–2014 1960–2015 1992, 99, 2006,10, 13
GIN Guinea 1959–2014 1986–2015 1994, 2009–12
GMB Gambia 1960–2014 2004–2014 1993, 2014
GNB Guinea-Bissau 1960–2014 1970–2014 N.A.
GNQ EquatorialGuinea
1960–2014 N.A. 1983
KEN Kenya* 1950–2014 1960–2015 2005
LBR Liberia 1964–2014 N.A. 2007, 10
LSO Lesotho 1960–2014 1960–2014 1996–97, 99,2008
MDG Madagascar 1960–2014 1966–2015 2003, 05, 12
MLI Mali 1960–2014 1967–2015 2004, 06
MOZ Mozambique 1960–2014 1980–2015 2003
MRT Mauritania 1960–2014 1960–2014 N.A.
MUS Mauritius* 1950–2014 1976–2015 1990, 92,94–2007,2011–14
(continued)
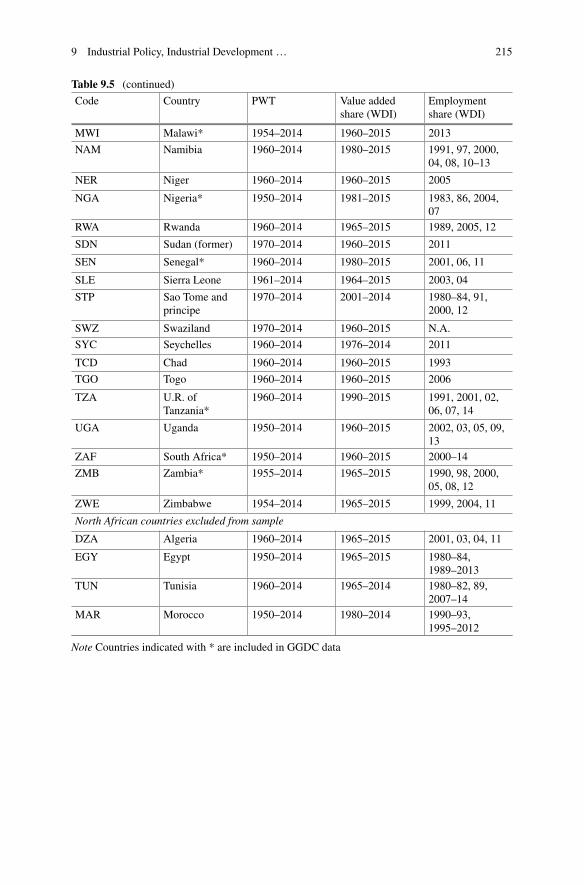
9 Industrial Policy, Industrial Development … 215
Table 9.5 (continued)
Code Country PWT Value addedshare (WDI)
Employmentshare (WDI)
MWI Malawi* 1954–2014 1960–2015 2013
NAM Namibia 1960–2014 1980–2015 1991, 97, 2000,04, 08, 10–13
NER Niger 1960–2014 1960–2015 2005
NGA Nigeria* 1950–2014 1981–2015 1983, 86, 2004,07
RWA Rwanda 1960–2014 1965–2015 1989, 2005, 12
SDN Sudan (former) 1970–2014 1960–2015 2011
SEN Senegal* 1960–2014 1980–2015 2001, 06, 11
SLE Sierra Leone 1961–2014 1964–2015 2003, 04
STP Sao Tome andprincipe
1970–2014 2001–2014 1980–84, 91,2000, 12
SWZ Swaziland 1970–2014 1960–2015 N.A.
SYC Seychelles 1960–2014 1976–2014 2011
TCD Chad 1960–2014 1960–2015 1993
TGO Togo 1960–2014 1960–2015 2006
TZA U.R. ofTanzania*
1960–2014 1990–2015 1991, 2001, 02,06, 07, 14
UGA Uganda 1950–2014 1960–2015 2002, 03, 05, 09,13
ZAF South Africa* 1950–2014 1960–2015 2000–14
ZMB Zambia* 1955–2014 1965–2015 1990, 98, 2000,05, 08, 12
ZWE Zimbabwe 1954–2014 1965–2015 1999, 2004, 11
North African countries excluded from sample
DZA Algeria 1960–2014 1965–2015 2001, 03, 04, 11
EGY Egypt 1950–2014 1965–2015 1980–84,1989–2013
TUN Tunisia 1960–2014 1965–2014 1980–82, 89,2007–14
MAR Morocco 1950–2014 1980–2014 1990–93,1995–2012
Note Countries indicated with * are included in GGDC data
216 Y. Higuchi and G. Shimada
References
Aghion, P., Cai, J., Dewatripont, M., Du, L., Harrison, A., & Legros, P. (2017). Industrial policyand competition. American Economic Journal: Macroeconomics, 7(4), 1–32.
Austin, G. (2014). Labour-intensity and manufacturing inWest Africa, c.1450–c.2000. In G. Austin& K. Sugihara (Eds.), Labour-intensive industrialization in global history (pp. 201–230). NewYork: Routledge.
Baldwin, R. E. (1969). The case against infant industry tariff protection. Journal of Political Econ-omy, 77, 295–305.
Bloom, N., Genakos, C., Sadun, R., & van Reenen, J. (2012). Management practices across firmsand countries. Academy of Management Perspective, 26(1), 12–33.
Chang, H. J. (2007). Bad Samaritans: The myth of free trade and the secret history of capitalism.New York: Bloomsbury.
Criscuolo, C., Martin, R., Overman, H. G., & van Reenen, J. (2012). The causal effects of anindustrial policy. Working paper 17842, National Bureau of Economic Research.
De Vries, G., Timmer, M., & De Vries, K. (2015). Structural transformation in Africa: Static gains,dynamic losses. Journal of Development Studies, 51, 674–688.
Diao, X., McMillan, M., & Rodrik, D. (2017). The recent growth boom in developing economies:A structural change perspective. Working paper 23132, National Bureau of Economic Research.
Dinh, H. T., Palmade, V., Chandra, V., & Cossar, F. (2012). Light manufacturing in Africa: Targetedpolicies to enhance private investment and create jobs. Washington, DC: World Bank.
Duarte, M., & Restuccia, D. (2010). The role of the structural transformation in aggregate produc-tivity. Quarterly Journal of Economics, 125, 129–173.
Easterly, W., & Levine, R. (1997). Africa’s growth tragedy: Policies and ethnic divisions. QuarterlyJournal of Economics, 112, 1203–1250.
Estudillo, J. P., Cureg, E. F., & Otsuka, K. (2018). Transformation of rural economies in Asia andAfrica. In K. Otsuka & K. Sugihara (Eds.) Paths to the Emerging State in Asia and Africa. (ThisVolume).
Fabricant, S. (1942). Employment in manufacturing, 1899–1939. National Bureau of EconomicResearch.
Feenstra, R. C., Inklaar, R., & Timmer, M. P. (2015). The next generation of the Penn World Table.American Economic Review, 105, 3082–3150.
Frazer, G. (2008). Used-clothing donations and apparel production in Africa. Economic Journal,118, 1764–1784.
Gollin, D., Lagakos, D., & Waugh, M. E. (2014). The agricultural productivity gap. QuarterlyJournal of Economics, 129, 939–993.
Goswami, A. G., Mattoo, A., & Sáez, S. (2011). Exporting services: A developing country perspec-tive. Washington, DC: World Bank.
Haraguchi, N., Cheng, C. F. C., & Smeets, E. (2017). The importance of manufacturing in economicdevelopment: Has this changed? World Development, 93, 293–315.
Harrison, A., & Rodríguez-Clare, A. (2010). Trade, foreign investment, and industrial policy fordeveloping countries. In D. Rodrik & M. R. Rosenzweig (Eds.), Handbook of development eco-nomics (Vol. 5, pp. 4039–4214). Amsterdam: Elsevier.
Hashino,T.,&Otsuka,K. (2016). Industrial districts in history and the developing world. Singapore:Springer.
Hausmann,R.,Rodrik,D.,&Velasco,A. (2005).Growth diagnosis. Cambridge:HarvardUniversity.Herrendorf, B., Rogerson, R., & Valentinyi, A. (2014). Growth and structural transformation. In P.Aghion& S. N. Durlauf (Eds.),Handbook of economic growth, Volume 2B. Amsterdam: Elsevier.
Higuchi, Y., Nam, V. H., & Sonobe, T. (2015). Sustained impacts of kaizen training. Journal ofEconomic Behavior & Organization, 120, 189–206.
Hino, H., & Ranis, G. (2013). Youth and employment in Sub-Saharan Africa: Working but poor.Washington, DC: World Bank.
9 Industrial Policy, Industrial Development … 217
Hirschman, A. O. (1958). The strategy of economic development. New Haven: Yale UniversityPress.
Hsieh, C. T., & Klenow, P. J. (2009). Misallocation and manufacturing TFP in China and India.Quarterly Journal of Economics, 124, 1403–1448.
Jensen, J. B. (2011). Global trade in services. Washington, DC: Peter G. Peterson Institute Inter-national Economics.
Krueger, A. O., & Tuncer, B. (1982). An empirical test of the infant industry argument. AmericanEconomic Review, 72, 1142–1152.
Kubo, T. (2018). Changing patterns of industrialization and emerging states in twentieth centuryChina. In K. Otsuka & K. Sugihara (Eds.) Paths to the Emerging State in Asia and Africa. (ThisVolume).
Lal, D. (1983). The poverty of development economics. London: Institute of Economics Affairs.Lane, N. (2017). Manufacturing revolutions: Industrial policy and networks in South Korea. JobMarket Paper.
Lin, J. (2012). New structural economics: A framework for rethinking development and policy.Washington, DC: World Bank.
McKenzie, D., & Woodruff, C. (2014). What are we learning from business training andentrepreneurship evaluations around the developingworld?World Bank Research Observer, 29(1),48–82.
McMillan, M., Rodrik, D., & Verduzco-Gallo, I. (2014). Globalization, structural change, andproductivity growth. World Development, 63, 11–32.
Mosley, P., Harrigan, J., & Toye, J. (1995). Aid and power: The World Bank and policy-basedlending, Volume 1: Analysis and policy proposals. New York: Routledge.
Newman, C., Page, J., Rand, J., Shimeles, A., Söderbom, M., & Tarp, F. (2016). Made in Africa:Learning to compete in industry. Washington, DC: Brookings Institution Press.
Noman, A., & Stiglitz, J. E. (2015). Industrial policy and economic transformation in Africa. NewYork: Columbia University Press.
Noman, A., & Stiglitz, J. E. (2016). Efficiency, finance, and varieties of industrial policy: Guidingresources, learning, and technology for sustained growth. NewYork: Columbia University Press.
Nomura, C. (2018). Historical roots of industrialisation and the emerging state in Colonial India.In K. Otsuka &K. Sugihara (Eds.) Paths to the Emerging State in Asia and Africa. (This volume).
Nurkse, R. (1953). Problems of capital formation in underdeveloped countries. Oxford: OxfordUniversity Press.
Nunn, N., & Trefler, D. (2010). The structure of tariffs and long-term growth. American EconomicJournal: Macroeconomics, 2(4), 158–194.
Oqubay, A. (2015). Made in Africa: Industrial policy in Ethiopia. Oxford: Oxford University Press.Overseas Economic Cooperation Fund (OECF, now JICA). (1993). Issues related to The WorldBank’s approach to structural adjustment: Proposals from a major partner. Occasional Paper No.1, OECF.
Otsuka, K., Higuchi, Y., & Sonobe, T. (2017a). Middle-income traps in East Asia: An inquiry intocauses for slowdown in income growth. China Economic Review, 46, s3–1s16.
Otsuka, K., Mieno, F., Sonobe, T., Kurosaki, T., Shimada, G., Kitano, N., et al. (2017b). Training-infrastructure-finance (TIF) strategy for industrial development in Sub-Saharan Africa. Tokyo,Japan: International Cooperation Agency (JICA) Research Institute.
Page, J. (2012). Can Africa industrialise? Journal of African Economies, 21, 86–124.Reinert, E. S. (2007). How rich countries got rich and why poor countries stay poor. London:Constable.
Rodrik, D. (2010). The return of industrial policy. Project Syndicate, 12.Rodrik, D. (2013). Unconditional convergence in manufacturing. Quarterly Journal of Economics,
128, 165–204.Rodrik, D. (2016). Premature deindustrialization. Journal of Economic Growth, 21, 1–33.Rosenstein-Rodan, P. N. (1943). Problems of industrialisation of Eastern and South-Eastern Europe.
Economic Journal, 53, 202–211.
218 Y. Higuchi and G. Shimada
Shimada, G., Homma, T., & Murakami, H. (2013). Industrial development of Africa. In JapanInternational Cooperation Agency (Ed.), For inclusive and dynamic development in Sub-SaharanAfrica. Tokyo: JICA Research Institute.
Shimada, G., & Sonobe, T. (2017). Impacts of Kaizen management on workers: Evidence from theCentral America and Caribbean Region. Working Paper. Tokyo: JICA Research Institute.
Sonobe, T., & Otsuka, K. (2011). Cluster-based industrial development: A comparative study ofAsia and Africa. New York: Palgrave Macmillan.
Stiglitz, J. E., Lin, J. Y., & Patel, E. (2013). The industrial policy revolution II: Africa in thetwenty-first century. New York: Palgrave Macmillan.
Stiglitz, J. E., & Uy, M. (1996). Financial markets, public policy and the East Asian miracle. WorldBank Research Observer, 11, 249–276.
Tanimoto, M. (2018). Labour-intensive industrialization and the emerging state in pre-war Japan.In K. Otsuka &K. Sugihara (Eds.) Paths to the Emerging State in Asia and Africa. (This Volume).
Timmer, M. P., De Vries, G. J., & De Vries, K. (2014). Patterns of structural change in developingcountries. GGDC Research Memorandum 149.
Wade, R. (1990). Governing the market: Economic theory and the role of government in East Asianindustrialization. Princeton: Princeton University Press.
Wade, R. (1996). Japan, The World Bank, and the art of paradigm maintenance: The East Asianmiracle in political perspective. New Left Review (May–June).
World Bank. (2012). World development report 2013: Jobs. Washington, DC: World Bank.
Open Access This chapter is licensed under the terms of the Creative Commons Attribution-NonCommercial-NoDerivatives 4.0 International License (http://creativecommons.org/licenses/by-nc-nd/4.0/), which permits any noncommercial use, sharing, distribution and reproduction in anymedium or format, as long as you give appropriate credit to the original author(s) and the source,provide a link to the Creative Commons licence and indicate if you modified the licensed material.You do not have permission under this licence to share adapted material derived from this chapteror parts of it.
The images or other third party material in this chapter are included in the chapter’s CreativeCommons licence, unless indicated otherwise in a credit line to the material. If material is notincluded in the chapter’s Creative Commons licence and your intended use is not permitted bystatutory regulation or exceeds the permitted use, you will need to obtain permission directly fromthe copyright holder.
Chapter 10Transformation of Rural Economiesin Asia and Africa
Jonna P. Estudillo, Elyzabeth F. Cureg and Keijiro Otsuka
10.1 Introduction
Economic transformation, rapid growth, and improvements in living standards arecentral features of emerging economies, which are characterized by a shift away fromheavy reliance on agriculture and raw materials exports towards an emphasis on themanufacturing and service sectors. Escaping from low incomes and poverty is themain motivation driving emerging states to venture into rapid industrialization andservice sector development as a strategy to achieve rapid aggregate income growth.
Emerging economies are undergoing the so-called “economic transformation,”which is defined broadly as a process in which the foci of economic activities shiftaway from the farm and toward the manufacturing and service sectors. Economictransformation is always accompanied by aggregate economic growth, which servesas the main driver of household income growth and poverty reduction (Dollar andKraay 2002; Zhuang and Ali 2010). Rapid economic growth is the main reason whyAsia was able to reduce its proportion of poor people to less than one-half muchearlier than in other regions of the world, in line with the Millennium DevelopmentGoals (United Nations 2015).
J. P. Estudillo (B)National Graduate Institute for Policy Studies, 7-22-1 Roppongi, Minato-ku,Tokyo 106-8677, Japane-mail: [email protected]
E. F. CuregCenter for Local and Regional Governance (CLRG-NCPAG),University of the Philippines, Diliman, Quezon City 1101, Philippinese-mail: [email protected]
K. OtsukaGraduate School of Economics, Kobe University, 2-1 Rokkodai, Nada, Kobe,Hyogo 657-8501, Japane-mail: [email protected]
© The Author(s) 2019K. Otsuka and K. Sugihara (eds.), Paths to the Emerging State in Asia and Africa,Emerging-Economy State and International Policy Studies,https://doi.org/10.1007/978-981-13-3131-2_10
219
220 J. P. Estudillo et al.
This chapter explores the causes and consequences of the long-term process ofeconomic transformation that triggered the evolution of emerging economies inAsia.This chapter also assesses to what extent the Asian experience is being replicated inAfrica. By “evolution,” we mean sustained household income growth and povertyreduction.Weexplore the role of three drivers—populationpressure, the developmentof modern agricultural technology, and human capital formation—in the process ofeconomic transformation.1 Our hypothesis is that, while human capital is a funda-mental determinant of economic growth (Otsuka et al. 2017), population pressureon limited cultivable land is a major factor in the deteriorating economic wellbeingof rural populations in the early stage of economic development, which can be over-come through the development of land-saving and labor-using modern agriculturaltechnology (Hayami and Ruttan 1985; Otsuka and Runge 2011).
We examine the Philippines, Vietnam, Myanmar, the Lao People’s DemocraticRepublic (Lao PDR), Bangladesh, and Sri Lanka in Asia and Mozambique, Kenya,Uganda, and Ethiopia in Africa because we have a compilation of panel datasetsdrawn from repeated surveys of households in Asia beginning in the mid-1980s andin Africa beginning in the early 2000s. Bangladesh, the Philippines, and Vietnamare among the so-called “Next Eleven” (N-11) countries that could exert a BRIC-like impact and rival the G7 due to their large populations (Goldman Sachs 2007).2
While it is difficult to identify emerging economies or states (Tsunekawa 2017), weconsider all our focus countries in this chapter as emerging economies by virtue oftheir rapid income growth and population size. Finally, we present a special casestudy of Central Luzon in the Philippines before and after the Green Revolutionfor a period encompassing nearly half of a century to demonstrate that agriculturaldevelopment is a necessary condition for take-off into a rapid-growth era.
The rest of this chapter has four sections. Section 10.2 describes the nature andconsequences of economic transformation, while Sect. 10.3 explores the role ofthe three drivers of economic transformation. Section 10.4 presents a comparativecase study of the transformation of rural villages in our focus countries in Asia andAfrica and illustrates how households in Central Luzon have changed their sourcesof livelihood. Finally, Sect. 10.5 presents a summary and conclusion.
1We consider infrastructure to be another important driver. However, reliable data on infrastruc-ture such as electricity, roads, and telephones remain scanty in our focus countries. This issue isparticularly serious in the case of roads.2The gross domestic product (GDP) of these three countries accounted for more than 1% of theGDP of the United States in 2015.
10 Transformation of Rural Economies in Asia and Africa 221
10.2 Economic Transformation
10.2.1 Characteristic Features
Here, we discuss the size, composition, and growth rate of gross domestic prod-uct per capita (GDPPc) and labor force composition from the 1980s onward. Wechose the 1980s as our benchmark because of the emergence during that period ofnewly industrializing economies (NIEs) in East Asia, such as Singapore, Taiwan,Hong Kong, and South Korea, which helped trigger the evolution of today’s newlyemerging economies. During the 1980s, the NIEs began a major shift toward theproduction of more sophisticated, high-value products using capital-using methodscorresponding to their sharp wage increases while shifting labor-intensive industrialsectors to Southeast Asian countries, where wages were relatively low at that time.
Emerging economies are characterized by high economic growth rates, as is evi-dent in the five focus Asian countries. The annual growth rate of real GDPPc from2010 to 2015 is close to 5% in the Philippines, Vietnam, and Bangladesh and greaterthan 5% in Sri Lanka and Lao PDR (see Table 10.1). These economies started toboom in the 1990s, and many of them peaked between 2010 and 2015. Sri Lankaand the Philippines have the highest GDPPc, although Vietnam showed the greatestincrease, of more than four times between 1985 and 2015 (see Table 10.1, Cols. A,B, and C), likely due to Vietnam’s Doi Moi (or liberalization policy) implementedin 1986. Ethiopia, Mozambique, and Uganda have GDPPc rates that are only aboutone-sixth that of Sri Lanka. Annual real GDPPc growth rates are high in Ethiopia(7.69% from 2010 to 2015) and Mozambique (4.02%). Sustained high economicgrowth appears to have started in our focus Asian countries in the 1990s and in ourAfrican countries about 10 years later, in the 2000s.
A rapid transformation away from agriculture and toward industry and services isoccurring, except in Myanmar, where the agricultural share of total gross domesticproduct (GDP) rose (see Fig. 10.1). The GDP of the Philippines and Sri Lankaare increasingly made up of services, while manufacturing dominates in Vietnam.The agricultural share of GDP has declined furthest in Lao PDR. Similar to thesituation in Asia, Africa has experienced rapid economic transformation, except inKenya, where the GDP composition remained the same between 1985 and 2005.Agricultural GDP declined furthest in Uganda and Mozambique and declined onlymodestly in Ethiopia. In our focus countries in both Asia and Africa, the GDP shareof the service sector is rising more than that of manufacturing.
Agriculture accounted for more than 70% of total employment in Lao PDR andclose to 50% in Bangladesh in 2010 (see Table 10.2). Labor is moving out of agricul-ture and into the service sector in the focus Asian countries. The increasing impor-tance of the service sector is also evident in Ethiopia, where manufacturing had ashare of only about 7% of total employment in the 2000s. The agricultural laborforce is expected to decline in the long run, primarily because of the low incomeelasticity of demand for food. To sum up, economic transformation and economicgrowth are faster in Asia than in Africa, though the importance of the service sectoris also increasing in African countries.
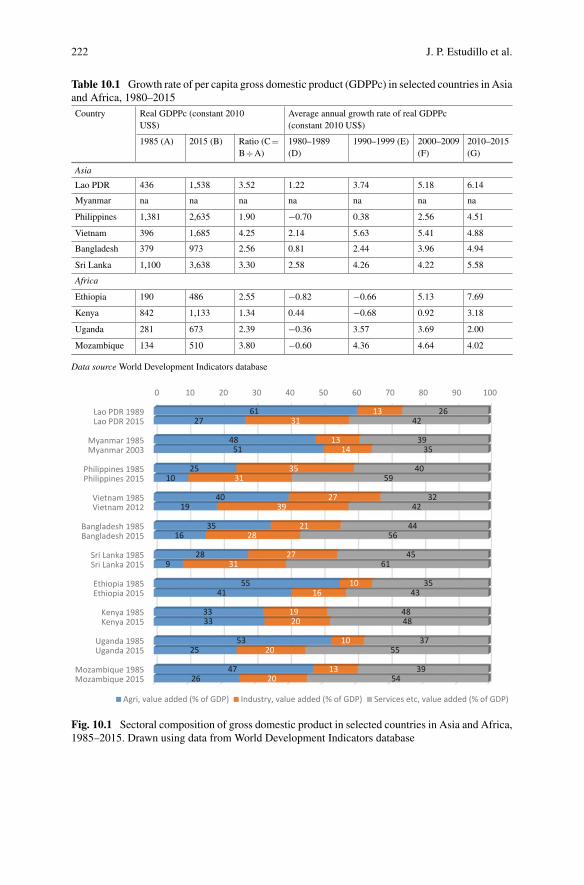
222 J. P. Estudillo et al.
Table 10.1 Growth rate of per capita gross domestic product (GDPPc) in selected countries in Asiaand Africa, 1980–2015Country Real GDPPc (constant 2010
US$)Average annual growth rate of real GDPPc(constant 2010 US$)
1985 (A) 2015 (B) Ratio (C�B÷A)
1980–1989(D)
1990–1999 (E) 2000–2009(F)
2010–2015(G)
Asia
Lao PDR 436 1,538 3.52 1.22 3.74 5.18 6.14
Myanmar na na na na na na na
Philippines 1,381 2,635 1.90 −0.70 0.38 2.56 4.51
Vietnam 396 1,685 4.25 2.14 5.63 5.41 4.88
Bangladesh 379 973 2.56 0.81 2.44 3.96 4.94
Sri Lanka 1,100 3,638 3.30 2.58 4.26 4.22 5.58
Africa
Ethiopia 190 486 2.55 −0.82 −0.66 5.13 7.69
Kenya 842 1,133 1.34 0.44 −0.68 0.92 3.18
Uganda 281 673 2.39 −0.36 3.57 3.69 2.00
Mozambique 134 510 3.80 −0.60 4.36 4.64 4.02
Data source World Development Indicators database
0 10 20 30 40 50 60 70 80 90 100
Lao PDR 1989Lao PDR 2015
Myanmar 1985Myanmar 2003
Philippines 1985Philippines 2015
Vietnam 1985Vietnam 2012
Bangladesh 1985Bangladesh 2015
Sri Lanka 1985Sri Lanka 2015
Ethiopia 1985Ethiopia 2015
Kenya 1985Kenya 2015
Uganda 1985Uganda 2015
Mozambique 1985Mozambique 2015
61 27
48 51
25 10
40 19
35 16
28 9
55 41
33 33
53 25
47 26
13 31
13 14
35 31
27 39
21 28
27 31
10 16
19 20
10 20
13 20
26 42
39 35
40 59
32 42
44 56
45 61
35 43
48 48
37 55
39 54
Agri, value added (% of GDP) Industry, value added (% of GDP) Services etc, value added (% of GDP)
Fig. 10.1 Sectoral composition of gross domestic product in selected countries in Asia and Africa,1985–2015. Drawn using data from World Development Indicators database
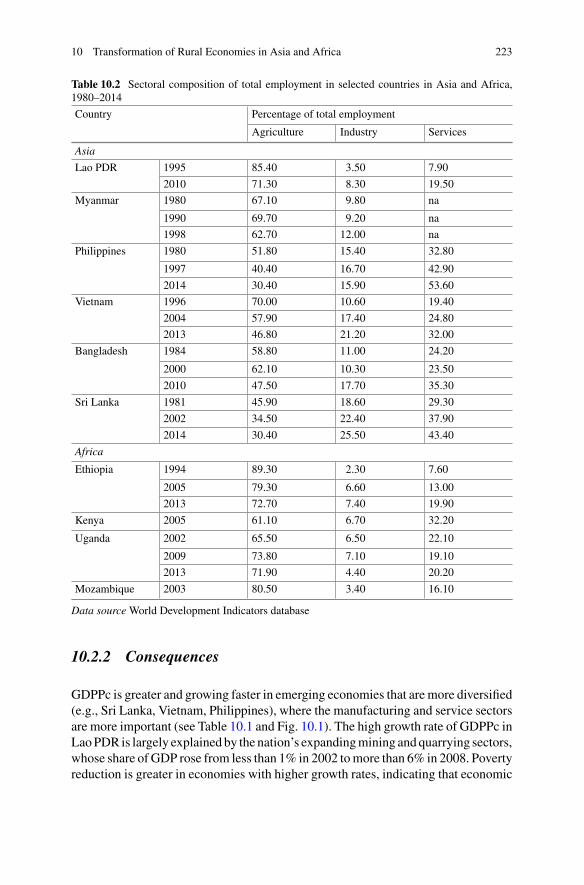
10 Transformation of Rural Economies in Asia and Africa 223
Table 10.2 Sectoral composition of total employment in selected countries in Asia and Africa,1980–2014
Country Percentage of total employment
Agriculture Industry Services
Asia
Lao PDR 1995 85.40 3.50 7.90
2010 71.30 8.30 19.50
Myanmar 1980 67.10 9.80 na
1990 69.70 9.20 na
1998 62.70 12.00 na
Philippines 1980 51.80 15.40 32.80
1997 40.40 16.70 42.90
2014 30.40 15.90 53.60
Vietnam 1996 70.00 10.60 19.40
2004 57.90 17.40 24.80
2013 46.80 21.20 32.00
Bangladesh 1984 58.80 11.00 24.20
2000 62.10 10.30 23.50
2010 47.50 17.70 35.30
Sri Lanka 1981 45.90 18.60 29.30
2002 34.50 22.40 37.90
2014 30.40 25.50 43.40
Africa
Ethiopia 1994 89.30 2.30 7.60
2005 79.30 6.60 13.00
2013 72.70 7.40 19.90
Kenya 2005 61.10 6.70 32.20
Uganda 2002 65.50 6.50 22.10
2009 73.80 7.10 19.10
2013 71.90 4.40 20.20
Mozambique 2003 80.50 3.40 16.10
Data source World Development Indicators database
10.2.2 Consequences
GDPPc is greater and growing faster in emerging economies that aremore diversified(e.g., Sri Lanka, Vietnam, Philippines), where the manufacturing and service sectorsare more important (see Table 10.1 and Fig. 10.1). The high growth rate of GDPPc inLaoPDR is largely explained by the nation’s expandingmining andquarrying sectors,whose share of GDP rose from less than 1% in 2002 tomore than 6% in 2008. Povertyreduction is greater in economies with higher growth rates, indicating that economic
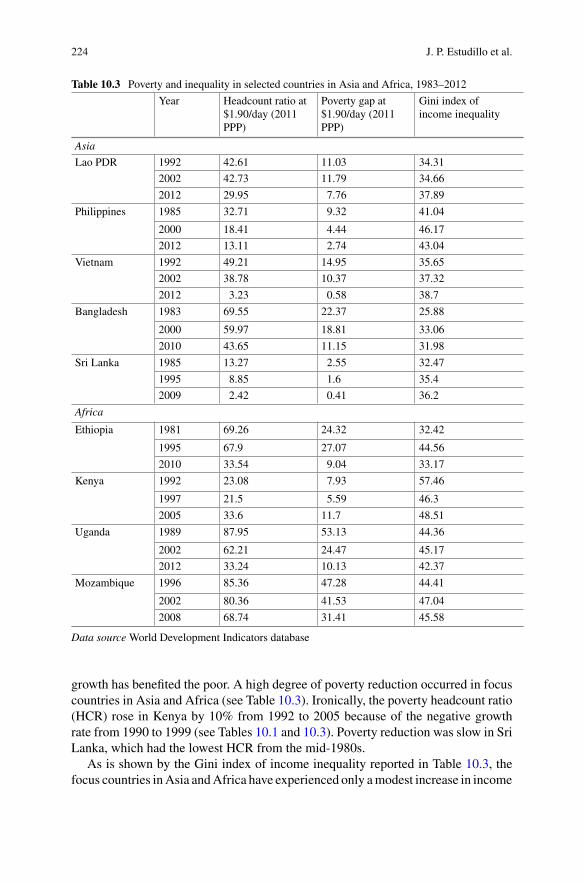
224 J. P. Estudillo et al.
Table 10.3 Poverty and inequality in selected countries in Asia and Africa, 1983–2012
Year Headcount ratio at$1.90/day (2011PPP)
Poverty gap at$1.90/day (2011PPP)
Gini index ofincome inequality
Asia
Lao PDR 1992 42.61 11.03 34.31
2002 42.73 11.79 34.66
2012 29.95 7.76 37.89
Philippines 1985 32.71 9.32 41.04
2000 18.41 4.44 46.17
2012 13.11 2.74 43.04
Vietnam 1992 49.21 14.95 35.65
2002 38.78 10.37 37.32
2012 3.23 0.58 38.7
Bangladesh 1983 69.55 22.37 25.88
2000 59.97 18.81 33.06
2010 43.65 11.15 31.98
Sri Lanka 1985 13.27 2.55 32.47
1995 8.85 1.6 35.4
2009 2.42 0.41 36.2
Africa
Ethiopia 1981 69.26 24.32 32.42
1995 67.9 27.07 44.56
2010 33.54 9.04 33.17
Kenya 1992 23.08 7.93 57.46
1997 21.5 5.59 46.3
2005 33.6 11.7 48.51
Uganda 1989 87.95 53.13 44.36
2002 62.21 24.47 45.17
2012 33.24 10.13 42.37
Mozambique 1996 85.36 47.28 44.41
2002 80.36 41.53 47.04
2008 68.74 31.41 45.58
Data source World Development Indicators database
growth has benefited the poor. A high degree of poverty reduction occurred in focuscountries in Asia and Africa (see Table 10.3). Ironically, the poverty headcount ratio(HCR) rose in Kenya by 10% from 1992 to 2005 because of the negative growthrate from 1990 to 1999 (see Tables 10.1 and 10.3). Poverty reduction was slow in SriLanka, which had the lowest HCR from the mid-1980s.
As is shown by the Gini index of income inequality reported in Table 10.3, thefocus countries inAsia andAfrica have experienced only amodest increase in income
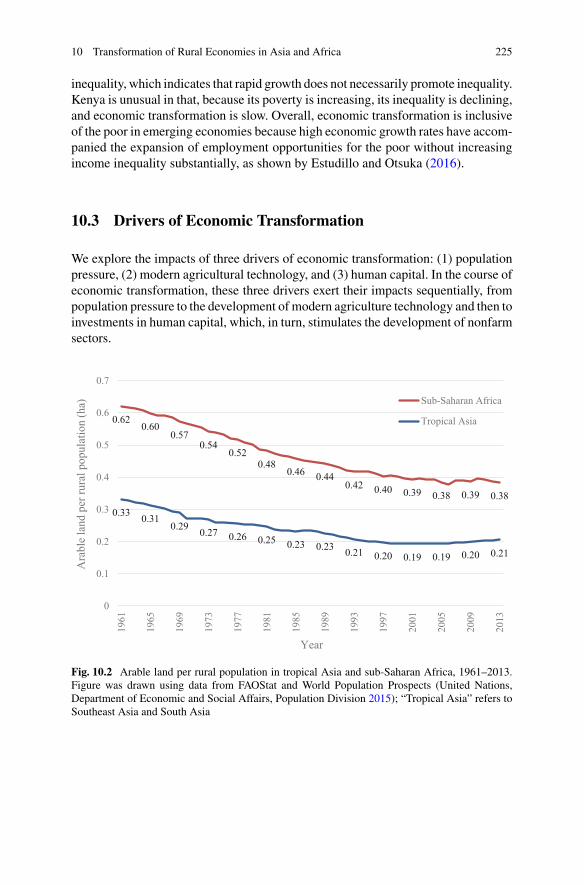
10 Transformation of Rural Economies in Asia and Africa 225
inequality, which indicates that rapid growth does not necessarily promote inequality.Kenya is unusual in that, because its poverty is increasing, its inequality is declining,and economic transformation is slow. Overall, economic transformation is inclusiveof the poor in emerging economies because high economic growth rates have accom-panied the expansion of employment opportunities for the poor without increasingincome inequality substantially, as shown by Estudillo and Otsuka (2016).
10.3 Drivers of Economic Transformation
We explore the impacts of three drivers of economic transformation: (1) populationpressure, (2) modern agricultural technology, and (3) human capital. In the course ofeconomic transformation, these three drivers exert their impacts sequentially, frompopulation pressure to the development of modern agriculture technology and then toinvestments in human capital, which, in turn, stimulates the development of nonfarmsectors.
0.620.60
0.570.54
0.520.48
0.46 0.440.42 0.40 0.39 0.38 0.39 0.38
0.33 0.310.29 0.27 0.26 0.25 0.23 0.23 0.21 0.20 0.19 0.19 0.20 0.21
0
0.1
0.2
0.3
0.4
0.5
0.6
0.7
1961
1965
1969
1973
1977
1981
1985
1989
1993
1997
2001
2005
2009
2013
Ara
ble
land
per
rura
l pop
ulat
ion
(ha)
Year
Sub-Saharan Africa
Tropical Asia
Fig. 10.2 Arable land per rural population in tropical Asia and sub-Saharan Africa, 1961–2013.Figure was drawn using data from FAOStat and World Population Prospects (United Nations,Department of Economic and Social Affairs, Population Division 2015); “Tropical Asia” refers toSoutheast Asia and South Asia
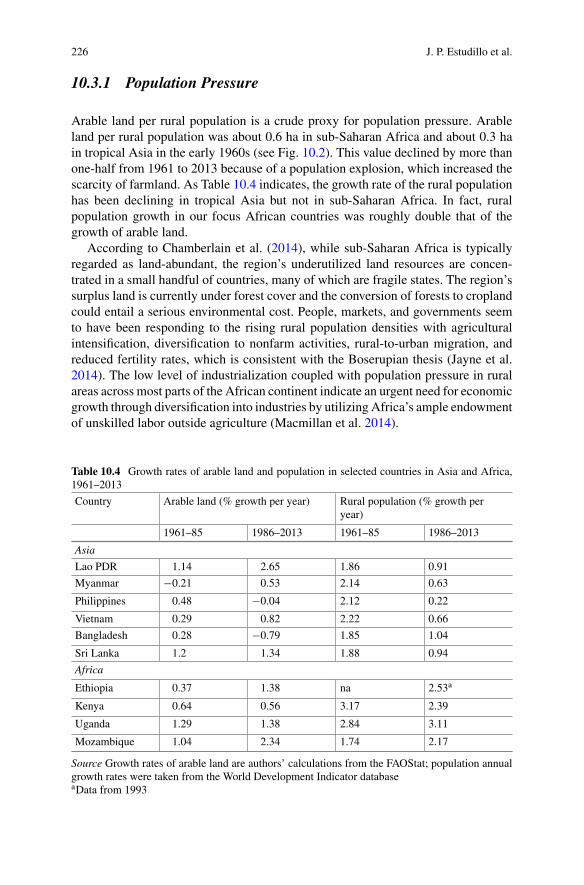
226 J. P. Estudillo et al.
10.3.1 Population Pressure
Arable land per rural population is a crude proxy for population pressure. Arableland per rural population was about 0.6 ha in sub-Saharan Africa and about 0.3 hain tropical Asia in the early 1960s (see Fig. 10.2). This value declined by more thanone-half from 1961 to 2013 because of a population explosion, which increased thescarcity of farmland. As Table 10.4 indicates, the growth rate of the rural populationhas been declining in tropical Asia but not in sub-Saharan Africa. In fact, ruralpopulation growth in our focus African countries was roughly double that of thegrowth of arable land.
According to Chamberlain et al. (2014), while sub-Saharan Africa is typicallyregarded as land-abundant, the region’s underutilized land resources are concen-trated in a small handful of countries, many of which are fragile states. The region’ssurplus land is currently under forest cover and the conversion of forests to croplandcould entail a serious environmental cost. People, markets, and governments seemto have been responding to the rising rural population densities with agriculturalintensification, diversification to nonfarm activities, rural-to-urban migration, andreduced fertility rates, which is consistent with the Boserupian thesis (Jayne et al.2014). The low level of industrialization coupled with population pressure in ruralareas across most parts of the African continent indicate an urgent need for economicgrowth through diversification into industries by utilizing Africa’s ample endowmentof unskilled labor outside agriculture (Macmillan et al. 2014).
Table 10.4 Growth rates of arable land and population in selected countries in Asia and Africa,1961–2013
Country Arable land (% growth per year) Rural population (% growth peryear)
1961–85 1986–2013 1961–85 1986–2013
Asia
Lao PDR 1.14 2.65 1.86 0.91
Myanmar −0.21 0.53 2.14 0.63
Philippines 0.48 −0.04 2.12 0.22
Vietnam 0.29 0.82 2.22 0.66
Bangladesh 0.28 −0.79 1.85 1.04
Sri Lanka 1.2 1.34 1.88 0.94
Africa
Ethiopia 0.37 1.38 na 2.53a
Kenya 0.64 0.56 3.17 2.39
Uganda 1.29 1.38 2.84 3.11
Mozambique 1.04 2.34 1.74 2.17
Source Growth rates of arable land are authors’ calculations from the FAOStat; population annualgrowth rates were taken from the World Development Indicator databaseaData from 1993
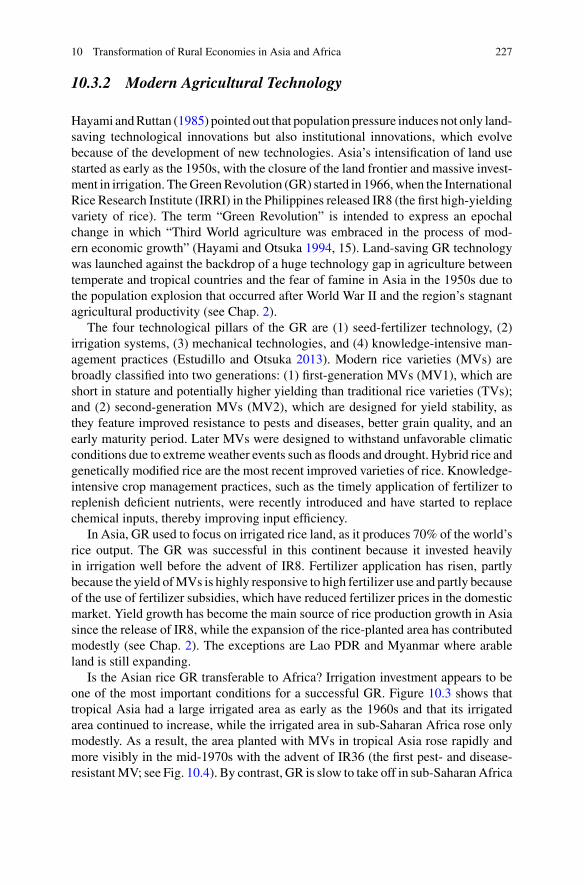
10 Transformation of Rural Economies in Asia and Africa 227
10.3.2 Modern Agricultural Technology
Hayami andRuttan (1985) pointed out that population pressure induces not only land-saving technological innovations but also institutional innovations, which evolvebecause of the development of new technologies. Asia’s intensification of land usestarted as early as the 1950s, with the closure of the land frontier and massive invest-ment in irrigation. TheGreenRevolution (GR) started in 1966,when the InternationalRice Research Institute (IRRI) in the Philippines released IR8 (the first high-yieldingvariety of rice). The term “Green Revolution” is intended to express an epochalchange in which “Third World agriculture was embraced in the process of mod-ern economic growth” (Hayami and Otsuka 1994, 15). Land-saving GR technologywas launched against the backdrop of a huge technology gap in agriculture betweentemperate and tropical countries and the fear of famine in Asia in the 1950s due tothe population explosion that occurred after World War II and the region’s stagnantagricultural productivity (see Chap. 2).
The four technological pillars of the GR are (1) seed-fertilizer technology, (2)irrigation systems, (3) mechanical technologies, and (4) knowledge-intensive man-agement practices (Estudillo and Otsuka 2013). Modern rice varieties (MVs) arebroadly classified into two generations: (1) first-generation MVs (MV1), which areshort in stature and potentially higher yielding than traditional rice varieties (TVs);and (2) second-generation MVs (MV2), which are designed for yield stability, asthey feature improved resistance to pests and diseases, better grain quality, and anearly maturity period. Later MVs were designed to withstand unfavorable climaticconditions due to extremeweather events such as floods and drought. Hybrid rice andgenetically modified rice are the most recent improved varieties of rice. Knowledge-intensive crop management practices, such as the timely application of fertilizer toreplenish deficient nutrients, were recently introduced and have started to replacechemical inputs, thereby improving input efficiency.
In Asia, GR used to focus on irrigated rice land, as it produces 70% of the world’srice output. The GR was successful in this continent because it invested heavilyin irrigation well before the advent of IR8. Fertilizer application has risen, partlybecause the yield ofMVs is highly responsive to high fertilizer use and partly becauseof the use of fertilizer subsidies, which have reduced fertilizer prices in the domesticmarket. Yield growth has become the main source of rice production growth in Asiasince the release of IR8, while the expansion of the rice-planted area has contributedmodestly (see Chap. 2). The exceptions are Lao PDR and Myanmar where arableland is still expanding.
Is the Asian rice GR transferable to Africa? Irrigation investment appears to beone of the most important conditions for a successful GR. Figure 10.3 shows thattropical Asia had a large irrigated area as early as the 1960s and that its irrigatedarea continued to increase, while the irrigated area in sub-Saharan Africa rose onlymodestly. As a result, the area planted with MVs in tropical Asia rose rapidly andmore visibly in the mid-1970s with the advent of IR36 (the first pest- and disease-resistantMV; see Fig. 10.4). By contrast, GR is slow to take off in sub-SaharanAfrica
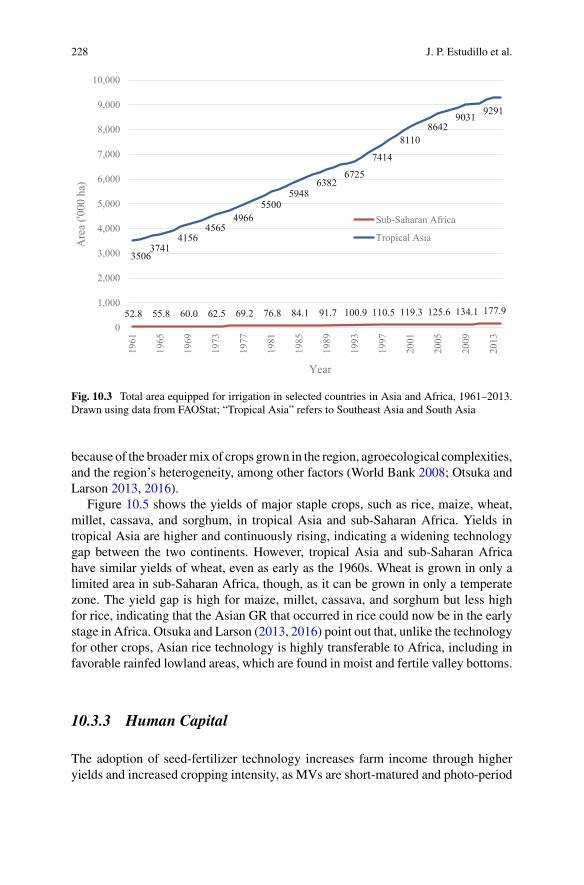
228 J. P. Estudillo et al.
52.8 55.8 60.0 62.5 69.2 76.8 84.1 91.7 100.9 110.5 119.3 125.6 134.1 177.9
35063741
41564565
49665500
59486382
6725
7414
81108642
9031 9291
0
1,000
2,000
3,000
4,000
5,000
6,000
7,000
8,000
9,000
10,000
1961
1965
1969
1973
1977
1981
1985
1989
1993
1997
2001
2005
2009
2013
Are
a ('0
00 h
a)
Year
Sub-Saharan Africa
Tropical Asia
Fig. 10.3 Total area equipped for irrigation in selected countries in Asia and Africa, 1961–2013.Drawn using data from FAOStat; “Tropical Asia” refers to Southeast Asia and South Asia
because of the broadermix of crops grown in the region, agroecological complexities,and the region’s heterogeneity, among other factors (World Bank 2008; Otsuka andLarson 2013, 2016).
Figure 10.5 shows the yields of major staple crops, such as rice, maize, wheat,millet, cassava, and sorghum, in tropical Asia and sub-Saharan Africa. Yields intropical Asia are higher and continuously rising, indicating a widening technologygap between the two continents. However, tropical Asia and sub-Saharan Africahave similar yields of wheat, even as early as the 1960s. Wheat is grown in only alimited area in sub-Saharan Africa, though, as it can be grown in only a temperatezone. The yield gap is high for maize, millet, cassava, and sorghum but less highfor rice, indicating that the Asian GR that occurred in rice could now be in the earlystage in Africa. Otsuka and Larson (2013, 2016) point out that, unlike the technologyfor other crops, Asian rice technology is highly transferable to Africa, including infavorable rainfed lowland areas, which are found in moist and fertile valley bottoms.
10.3.3 Human Capital
The adoption of seed-fertilizer technology increases farm income through higheryields and increased cropping intensity, as MVs are short-matured and photo-period
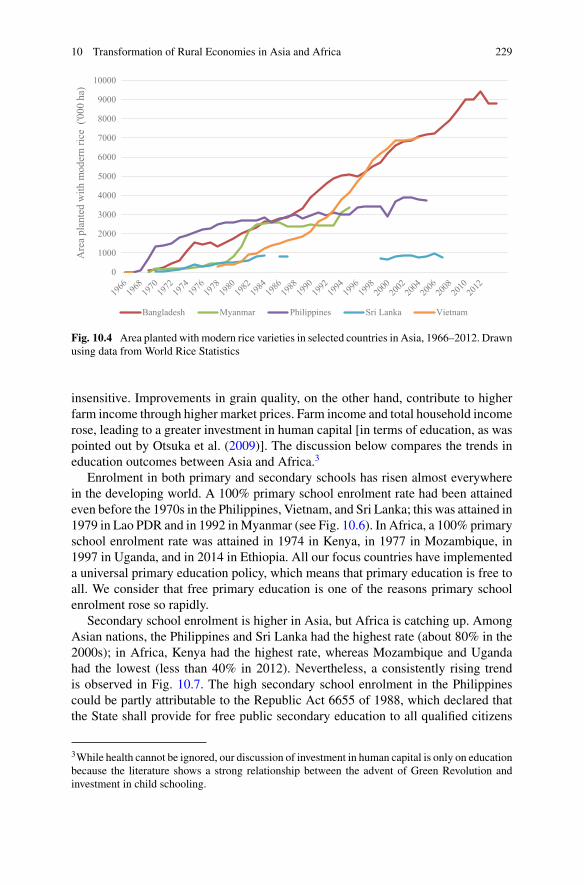
10 Transformation of Rural Economies in Asia and Africa 229
0
1000
2000
3000
4000
5000
6000
7000
8000
9000
10000A
rea
plan
ted
with
mod
ern
rice
('00
0 ha
)
Bangladesh Myanmar Philippines Sri Lanka Vietnam
Fig. 10.4 Area planted with modern rice varieties in selected countries in Asia, 1966–2012. Drawnusing data from World Rice Statistics
insensitive. Improvements in grain quality, on the other hand, contribute to higherfarm income through higher market prices. Farm income and total household incomerose, leading to a greater investment in human capital [in terms of education, as waspointed out by Otsuka et al. (2009)]. The discussion below compares the trends ineducation outcomes between Asia and Africa.3
Enrolment in both primary and secondary schools has risen almost everywherein the developing world. A 100% primary school enrolment rate had been attainedeven before the 1970s in the Philippines, Vietnam, and Sri Lanka; this was attained in1979 in Lao PDR and in 1992 inMyanmar (see Fig. 10.6). In Africa, a 100% primaryschool enrolment rate was attained in 1974 in Kenya, in 1977 in Mozambique, in1997 in Uganda, and in 2014 in Ethiopia. All our focus countries have implementeda universal primary education policy, which means that primary education is free toall. We consider that free primary education is one of the reasons primary schoolenrolment rose so rapidly.
Secondary school enrolment is higher in Asia, but Africa is catching up. AmongAsian nations, the Philippines and Sri Lanka had the highest rate (about 80% in the2000s); in Africa, Kenya had the highest rate, whereas Mozambique and Ugandahad the lowest (less than 40% in 2012). Nevertheless, a consistently rising trendis observed in Fig. 10.7. The high secondary school enrolment in the Philippinescould be partly attributable to the Republic Act 6655 of 1988, which declared thatthe State shall provide for free public secondary education to all qualified citizens
3While health cannot be ignored, our discussion of investment in human capital is only on educationbecause the literature shows a strong relationship between the advent of Green Revolution andinvestment in child schooling.
230 J. P. Estudillo et al.
1.5
2.0
2.5
3.0
3.5
4.0
4.5
1961
1965
1969
1973
1977
1981
1985
1989
1993
1997
2001
2005
2009
2013
Yie
ld (t
ons p
er h
a)Rice
Tropical Asia
Sub-SaharanAfrica
0.5
1.0
1.5
2.0
2.5
3.0
1961
1965
1969
1973
1977
1981
1985
1989
1993
1997
2001
2005
2009
2013
Yie
ld (t
ons p
er h
a)
Wheat
Tropical Asia
Sub-Saharan Africa
0.5
1.5
2.5
3.5
4.5
5.5
1961
1965
1969
1973
1977
1981
1985
1989
1993
1997
2001
2005
2009
2013
Yie
ld (t
ons p
er h
a)
Maize
Tropical Asia
Sub-Saharan Africa
0.5
0.6
0.7
0.8
0.9
1.0
1.1
1961
1965
1969
1973
1977
1981
1985
1989
1993
1997
2001
2005
2009
2013
Yie
ld (t
ons p
er h
a)
Millet
Tropical Asia
Sub-Saharan Africa
6.0
8.0
10.0
12.0
14.0
16.0
18.0
1961
1965
1969
1973
1977
1981
1985
1989
1993
1997
2001
2005
2009
2013
Yie
ld (t
ons p
er h
a)
Cassava
Tropical Asia
Sub-Saharan Africa
0.5
0.7
0.9
1.1
1.3
1.5
1.7
1.9
1961
1965
1969
1973
1977
1981
1985
1989
1993
1997
2001
2005
2009
2013
Yie
ld (t
ons p
er h
a)
Sorghum
Tropical Asia
Sub-Saharan Africa
Fig. 10.5 Average crop yield in tropical Asia and sub-Saharan Africa, 1961–2014
and promote quality education at all levels. Mozambique is expected to increase itssecondary school enrolment through the implementation of the first 12 years of publicschooling at no cost and its recent increased investment in classroom constructionand teachers. In 2007, Uganda’s government established a free universal secondaryeducation (USE) policy, the first among sub-Saharan nations.
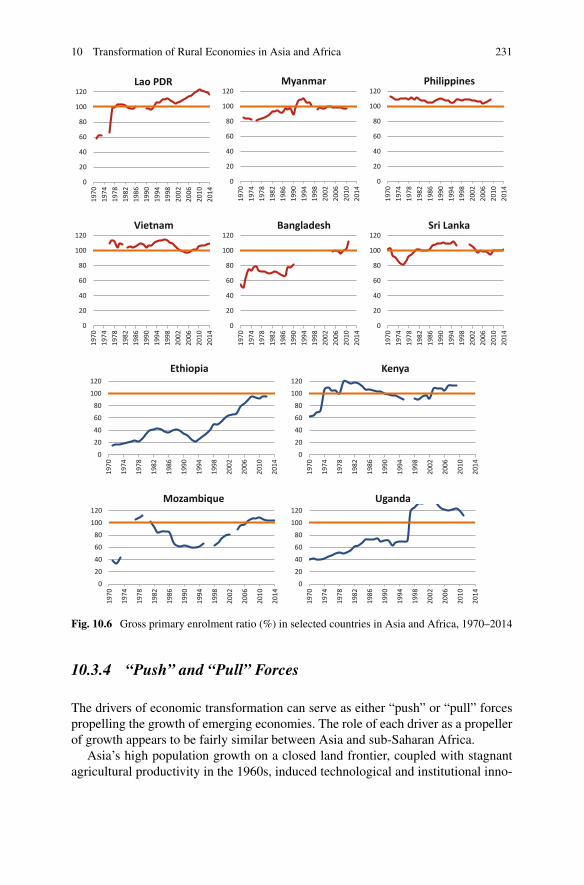
10 Transformation of Rural Economies in Asia and Africa 231
0
20
40
60
80
100
12019
7019
7419
7819
8219
8619
9019
9419
9820
0220
0620
1020
14
Lao PDR
0
20
40
60
80
100
120
1970
1974
1978
1982
1986
1990
1994
1998
2002
2006
2010
2014
Myanmar
0
20
40
60
80
100
120
1970
1974
1978
1982
1986
1990
1994
1998
2002
2006
2010
2014
Philippines
0
20
40
60
80
100
120
1970
1974
1978
1982
1986
1990
1994
1998
2002
2006
2010
2014
Vietnam
0
20
40
60
80
100
12019
7019
7419
7819
8219
8619
9019
9419
9820
0220
0620
1020
14
Bangladesh
0
20
40
60
80
100
120
1970
1974
1978
1982
1986
1990
1994
1998
2002
2006
2010
2014
Sri Lanka
0
20
40
60
80
100
120
1970
1974
1978
1982
1986
1990
1994
1998
2002
2006
2010
2014
Ethiopia
0
20
40
60
80
100
120
1970
1974
1978
1982
1986
1990
1994
1998
2002
2006
2010
2014
Kenya
0
20
40
60
80
100
120
1970
1974
1978
1982
1986
1990
1994
1998
2002
2006
2010
2014
Mozambique
0
20
40
60
80
100
120
1970
1974
1978
1982
1986
1990
1994
1998
2002
2006
2010
2014
Uganda
Fig. 10.6 Gross primary enrolment ratio (%) in selected countries in Asia and Africa, 1970–2014
10.3.4 “Push” and “Pull” Forces
The drivers of economic transformation can serve as either “push” or “pull” forcespropelling the growth of emerging economies. The role of each driver as a propellerof growth appears to be fairly similar between Asia and sub-Saharan Africa.
Asia’s high population growth on a closed land frontier, coupled with stagnantagricultural productivity in the 1960s, induced technological and institutional inno-
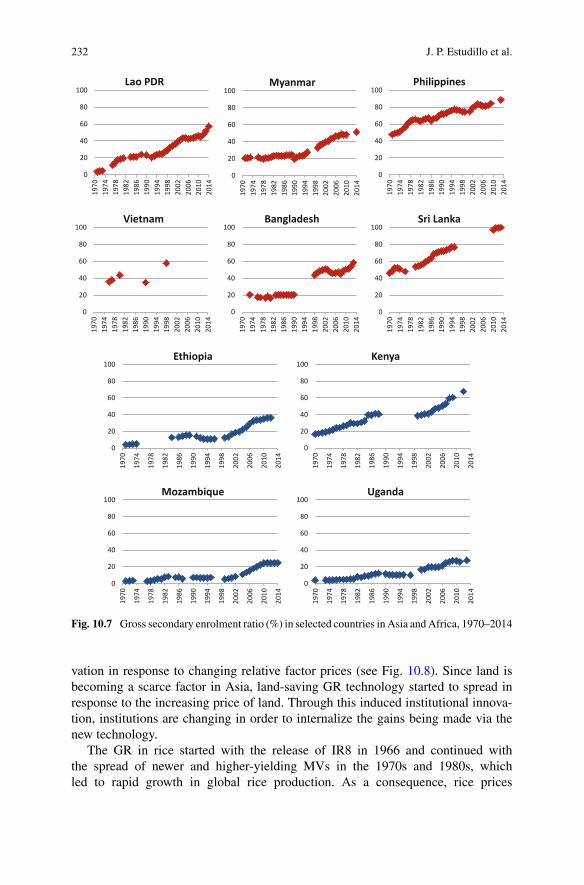
232 J. P. Estudillo et al.
0
20
40
60
80
100
1970
1974
1978
1982
1986
1990
1994
1998
2002
2006
2010
2014
Philippines
0
20
40
60
80
100
1970
1974
1978
1982
1986
1990
1994
1998
2002
2006
2010
2014
Myanmar
0
20
40
60
80
10019
7019
7419
7819
8219
8619
9019
9419
9820
0220
0620
1020
14
Lao PDR
0
20
40
60
80
100
1970
1974
1978
1982
1986
1990
1994
1998
2002
2006
2010
2014
Vietnam
0
20
40
60
80
100
1970
1974
1978
1982
1986
1990
1994
1998
2002
2006
2010
2014
Bangladesh
0
20
40
60
80
100
1970
1974
1978
1982
1986
1990
1994
1998
2002
2006
2010
2014
Sri Lanka
0
20
40
60
80
100
1970
1974
1978
1982
1986
1990
1994
1998
2002
2006
2010
2014
Ethiopia
0
20
40
60
80
100
1970
1974
1978
1982
1986
1990
1994
1998
2002
2006
2010
2014
Kenya
0
20
40
60
80
100
1970
1974
1978
1982
1986
1990
1994
1998
2002
2006
2010
2014
Mozambique
0
20
40
60
80
100
1970
1974
1978
1982
1986
1990
1994
1998
2002
2006
2010
2014
Uganda
Fig. 10.7 Gross secondary enrolment ratio (%) in selected countries inAsia andAfrica, 1970–2014
vation in response to changing relative factor prices (see Fig. 10.8). Since land isbecoming a scarce factor in Asia, land-saving GR technology started to spread inresponse to the increasing price of land. Through this induced institutional innova-tion, institutions are changing in order to internalize the gains being made via thenew technology.
The GR in rice started with the release of IR8 in 1966 and continued withthe spread of newer and higher-yielding MVs in the 1970s and 1980s, whichled to rapid growth in global rice production. As a consequence, rice prices
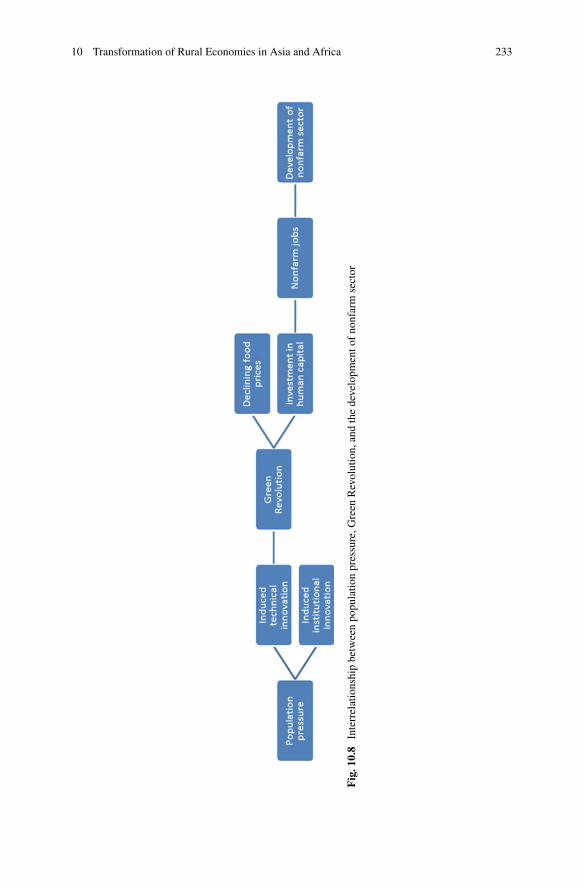
10 Transformation of Rural Economies in Asia and Africa 233
Fig.10.8
Interrelationshipbetweenpopulatio
npressure,G
reen
Revolution,
andthedevelopm
ento
fnonfarm
sector
234 J. P. Estudillo et al.
declined in the late 1970s after reaching an all-time high in the early to mid-1970s, as political conflict between the Soviet Union and the US led to chaosin the grain trade (see Fig. 2.5). Except for a one-time increase in 1980/81(due to an oil price increase), rice prices were generally lower from 1980to 2005 (hovering around US$400 per ton in 2010 US$) than in the 1960s and1970s. Because of the global food crises from 2006 to 2008, rice prices increased butremained substantially lower than their 1974 peak of US$1,374. The declining riceprices from1980 to 2005made rice farming less lucrative. Employment opportunitiesin agriculture declined, as did income from rice farming.
The decline in rice prices would have served as a push factor inducing people toexplore employment opportunities outside the rice industry in the nonfarm sector andto migrate to local towns and cities, or even overseas. Meanwhile, industrializationand the development of the service sector started in the mid-1970s, partly due toglobalization via business process outsourcing and trade in tasks and partly due tothe economic liberalization policies that began in the mid-1980s in Southeast Asiancountries such as the Philippines, Lao PDR, and Vietnam. The “push” of decliningrice prices and the “pull” of manufacturing and service sector development inducedfarmhouseholds to invest in the human capital represented by the younger generation,who prefer to work in the nonfarm sector and migrate to cities, strengthening thetransformation process (Otsuka et al. 2009; Estudillo andOtsuka 2016). It thus seemsreasonable to assume that population pressure and GR served as the early stimuli forthe growth of emerging economies in Asia through an outmigration of the educatedlabor force from agriculture to nonfarm sectors (see Fig. 10.8).
Compared with Asia, population pressure in Africa was weak from the 1960s tothemid-1990s (see Fig. 10.2), which coincides with a period of low grain prices (e.g.,rice and maize prices: see Fig. 2.5). In all likelihood, GR did not take off in sub-Saharan Africa primarily because of the disincentive effects of such low grain prices.Consequently, employment opportunities in agriculture declined because of stagnanttechnology as well as low grain prices. There was therefore a “push” to migrate fromrural to urban areas. Meanwhile, the industrial sector did not develop fast enough tocreate jobs for the urban migrants. Industrialization was slow on the continent for anumber of possible reasons: (1) a lack of human capital, (2) weak infrastructure (e.g.,poor roads, congested ports, lack of electricity), or (3) regional leaders’ failure topursue appropriate economic policies supporting the labor-intensive industry sector,which could have facilitated the transfer of advanced technology and managementpractices frommore advanced regions (see Chap. 9; Sonobe and Otsuka 2011, 2014).As a result, African countries have striven to industrialize in recent years.
Population pressure in sub-Saharan Africa appears to have become strong in theearly 2000s owing to the closure of the land frontier and high population growth.After the 2006–2008 world food crises, there was a “push” for GR as rising incomeand urbanization slowly and steadily increased the demand for food. A rising trendemerged in the share of African imports of rice from tropical Asia, which is expectedto continue and may affect world rice prices. Strong population pressure and urban-ization are creating a need for GR, which is expected to trigger investments in agri-cultural research and human capital, as in Asia (Otsuka and Larson 2016). Human
10 Transformation of Rural Economies in Asia and Africa 235
capital could, in turn, serve as the “fuel” for industrialization and service sectordevelopment. In brief, similar to the Asian story, population pressure and GR havethe potential to serve as a strong base for the emergence of African economies. Whatis also needed is an appropriate strategy for African industrialization (Otsuka et al.2018).
10.4 Economic Transformation in Rural Villages
We explore the features of economic transformation at the household level by analyz-ing the shift of household income structure away from farm toward nonfarm activi-ties. Such a shift involves a dynamic process of labor allocation, which, interestingly,shows similar patterns across emerging economies in Asia and Africa.
10.4.1 Changes in Household Income and Their Sourcesin Asia
We trace changes in the sources of livelihoods among rural households in Myanmar,the Philippines, Vietnam, and Bangladesh. The datasets drawn from the Philippines,Vietnam, and Bangladesh constitute panel data with the replacement of householdswhose heads have died with successor households. We exclude Lao PDR in thissection because its household income data were collected in 2010 only.4 Data forMyanmar are repeated cross-section data from households living in the same vil-lages. We divide the sample into farmer and landless household groups in Myanmarand the Philippines because the landless households, being the poorest in the villagecommunities, are more geographically mobile and are more likely to have respondedquickly to new employment opportunities. The sample villages in Asia were tra-ditional rice-producing areas, and thus particularly suitable for exploring the roleof modern agricultural technology during the process of “take-off” into emergingeconomies.
The sample villages inMyanmar are located inAyeyawadyDivision (the country’srice granary), south of the main city of Yangon. A total of 739 households wereinterviewed in 1996 (Garcia et al. 2000) and 900 were interviewed in 2012 (Estudilloand Otsuka 2016). Four villages were studied in the Philippines: two are located inCentral Luzon (the “rice bowl” of the country) and two are in Panay Island. Atotal of 632 sample households in the four villages (474 farmer households, 158landless households) were interviewed in the benchmark survey in 1985. Estudilloand Otsuka (2016) conducted a unique survey that traced the children of the original632 households in 1985; they were able to locate 527 married children from the
4Cross-border migration from Lao PDR to Thailand is an interesting issue (Estudillo and Otsuka2016, Chap. 2).
236 J. P. Estudillo et al.
original 474 farmer households and 129 married children from the original 158landless households. In Vietnam, the sample villages are located in Hanoi and ThaiNguyen in the north and in Long An and Can Tho in the south. We examined 376households in 1996 and 344 in 2009, which were divided almost equally betweenthe north and the south. Ut et al. (2000) conducted the benchmark survey in 1996,followed by a resurvey of the same households by Estudillo and Otsuka (2016) in2009.
The Bangladesh panel data cover most parts of the country and comprise infor-mation from 1,240 randomly selected households in 1988 and 2,010 households in2008 (Hossain and Bayes 2009). The first survey in 1988 was conducted by the IRRIwhen MVs had just started to spread in Bangladesh. Data for Sri Lanka come fromthe Household Income and Expenditure Survey (HIES), a nationally representativedataset collected by the Department of Census and Statistics of Sri Lanka. The earli-est round of surveys in 1990/91 consisted of 18,246 households, and the latest roundin 2006/07 consisted of 18,363 households (Kumanayake et al. 2014). The HIESclassified households into urban, rural, and estate. We used only the rural householdsfrom the HIES because of our focus on agriculture.
We divided household income into farm and nonfarm sources. Farm incomeis obtained from farming and agricultural wage employment. Wage employmentrefers to off-farm labor activities, primarily in transplanting, weeding, harvesting,and threshing in rice farming; these are characterized by low remuneration and highseasonality. The major share of farm income accrues from crop production (e.g.,rice, vegetables, and fruits), livestock and poultry propagation, and fishing. Non-farm income comes from four sources: (1) formal wage employment, (2) informalwage employment, (3) self-employment, and (4) remittances and othermiscellaneousincome.Nonfarm self-employment income is derived from retail and trade, transport,rural restaurants, the renting of self-owned equipment and vehicles, handicraft shops,and other sources. Remittances come mainly from family members (e.g., unmarriedchildren) working abroad or locally in big cities and towns. Other income sourcesinclude pensions, gifts, and other forms of transfer payments. In Africa, other incomesources include the wages from migrant workers. Poverty measures were estimatedusing the FGT index, with US$1.25 per capita per day in PPP 2005 based on privateconsumption used as the poverty line.
Myanmar Total household income (US$ PPP in 2005) rose by about 1.8 timesfor farmers and 2.0 times for the landless from 1996 to 2012 (see Table 10.5).Agricultural income is becoming less important: the share of agricultural incomeof farmer households declined from 91 to 82% and that of the landless from 68to 38%. The major sources of income growth were rice farming and formal wagework for farmers, as income from formal work became the dominant source ofnonfarm income in 2012. Income from rice farming rose because of the increase inrice yields (which rose from 1.8 to 2.8 tons per ha) and the abolition of governmentproduction quotas (mandatory selling of 0.5 tons of paddy to the government), whichincreased the prices received by farmers by about 50%. Recently, nonfarm incomehas increased in importance because the more educated children of farm households
10 Transformation of Rural Economies in Asia and Africa 237
prefer to work in the formal wage sector in Yangon. Nonfarm informal wage workand nonfarm self-employment activities were the main sources of income growth forthe landless. Landless households appear to have substituted informal wagework andself-employment activities for agricultural wage work in 2012, presumably becauseof the declining labor employment opportunities in rice farming due to decreasingfarm size coupled with low cropping intensity. Poverty decreased moderately amongboth landless and farmer households, although the headcount ratio remained highfor the landless (74% in 2012). Given the rising importance of nonfarm income,it is reasonable to surmise that the development of the nonfarm sector has becomean important driver of household income growth and poverty reduction in ruralMyanmar.
Philippines We have income data for two generations of households in the Philip-pines: respondents’ generation (G1) and the married children of respondents (G2).In 1985, a substantial portion of G1 household income (76% for the farmer, 49% forthe landless) came from agricultural sources (e.g., production of rice, nonrice crops,and livestock; see Table 10.5). The income of farmer households for G1 in 1985 wasabout twice that of landless households, and thus poverty was much higher amongthe landless (65%) than among the farmer households (42%). Interestingly, nonfarmincome has become the major source of income for G2 (83% for farmer children and92% for landless children in 2008). Income disparity between farmer and landlesschildren appears to have disappeared for G2when nonfarm income became themajordriver of income growth: the ratio of farmer to landless income is only 1.22 for G2compared with 2.10 for G1. While G2 incomes have largely equalized, poverty inci-dence among landless children remained higher but, with a mere eight percentagepoints difference, compared favorably with that of their parents, for whom povertystood at 23% points higher among the landless class. Landless childrenwhomigratedto local towns and big cities were able to increase their income more than farmerchildren could. Such migration was facilitated by the earlier decision of landless par-ents to invest in their children’s schooling. In brief, participation in the nonfarm labormarket and migration to local towns and big cities are major strategies for movingout of poverty for the landless poor in the Philippines.
Vietnam Wedivided our sample villages into “northern villages” (referring toHanoiand Thai Nguyen provinces) and “southern villages” (referring to Long An and CanTho). Household income (US$PPP in 2005) in the northern villages rose from$1,547in 1996 to $4,093 (2.64 times) in 2009, whereas, in the southern villages, incomerose from $2,896 to $11,748 (4.05 times; see Table 10.5). The most important sourceof income growth in the northern villages was nonfarm formal wage work (whichalmost doubled). An interesting gender specialization can be observed: women inthe northern villages are left on the farms producing high-value products (e.g., citrus,cut flowers, vegetables, tea, poultry, and pigs), whereas the men work in factoriesin the cities and local towns, returning home in the rural villages during weekends(Estudillo and Otsuka 2016). In the southern villages, the major source of incomegrowth was rice farming (which rose 4.8 times) because of the increase in riceyield and, importantly, because of high rice prices in 2009, which captured the rice
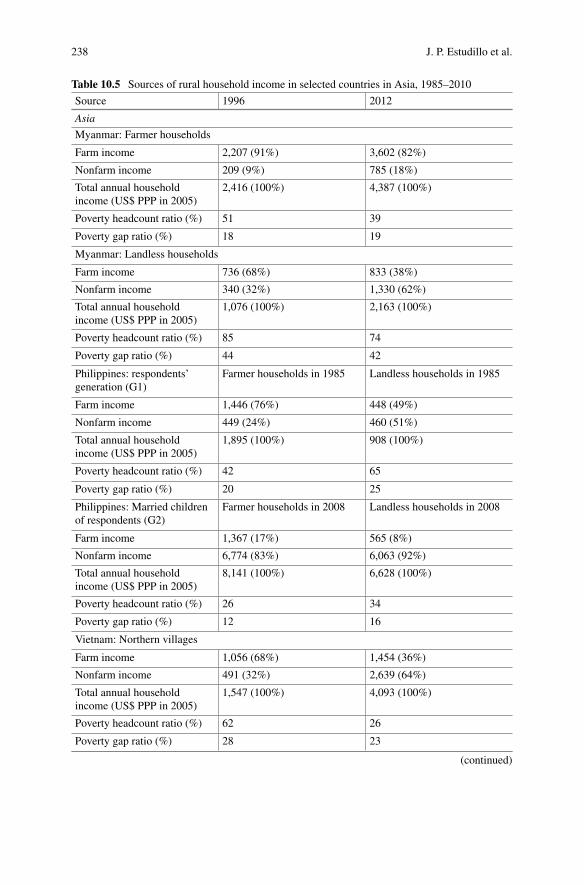
238 J. P. Estudillo et al.
Table 10.5 Sources of rural household income in selected countries in Asia, 1985–2010
Source 1996 2012
Asia
Myanmar: Farmer households
Farm income 2,207 (91%) 3,602 (82%)
Nonfarm income 209 (9%) 785 (18%)
Total annual householdincome (US$ PPP in 2005)
2,416 (100%) 4,387 (100%)
Poverty headcount ratio (%) 51 39
Poverty gap ratio (%) 18 19
Myanmar: Landless households
Farm income 736 (68%) 833 (38%)
Nonfarm income 340 (32%) 1,330 (62%)
Total annual householdincome (US$ PPP in 2005)
1,076 (100%) 2,163 (100%)
Poverty headcount ratio (%) 85 74
Poverty gap ratio (%) 44 42
Philippines: respondents’generation (G1)
Farmer households in 1985 Landless households in 1985
Farm income 1,446 (76%) 448 (49%)
Nonfarm income 449 (24%) 460 (51%)
Total annual householdincome (US$ PPP in 2005)
1,895 (100%) 908 (100%)
Poverty headcount ratio (%) 42 65
Poverty gap ratio (%) 20 25
Philippines: Married childrenof respondents (G2)
Farmer households in 2008 Landless households in 2008
Farm income 1,367 (17%) 565 (8%)
Nonfarm income 6,774 (83%) 6,063 (92%)
Total annual householdincome (US$ PPP in 2005)
8,141 (100%) 6,628 (100%)
Poverty headcount ratio (%) 26 34
Poverty gap ratio (%) 12 16
Vietnam: Northern villages
Farm income 1,056 (68%) 1,454 (36%)
Nonfarm income 491 (32%) 2,639 (64%)
Total annual householdincome (US$ PPP in 2005)
1,547 (100%) 4,093 (100%)
Poverty headcount ratio (%) 62 26
Poverty gap ratio (%) 28 23
(continued)
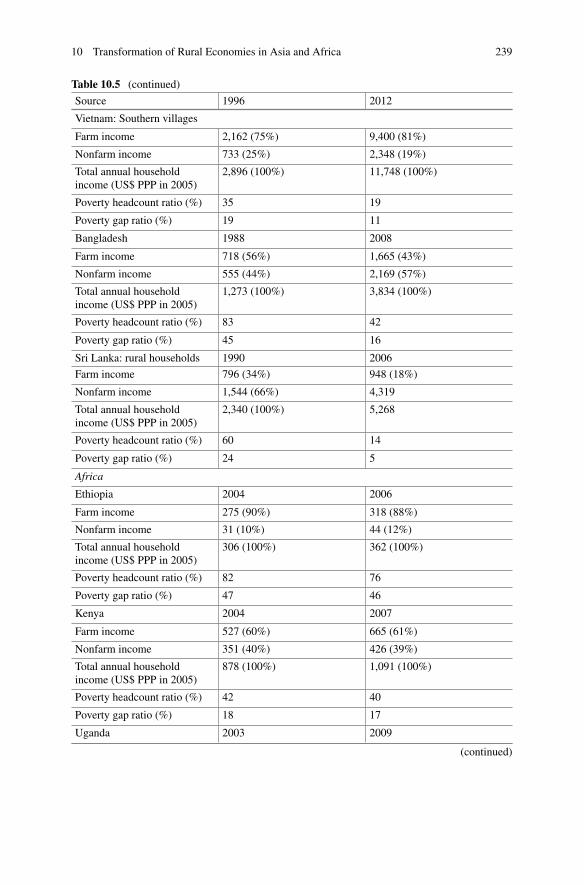
10 Transformation of Rural Economies in Asia and Africa 239
Table 10.5 (continued)
Source 1996 2012
Vietnam: Southern villages
Farm income 2,162 (75%) 9,400 (81%)
Nonfarm income 733 (25%) 2,348 (19%)
Total annual householdincome (US$ PPP in 2005)
2,896 (100%) 11,748 (100%)
Poverty headcount ratio (%) 35 19
Poverty gap ratio (%) 19 11
Bangladesh 1988 2008
Farm income 718 (56%) 1,665 (43%)
Nonfarm income 555 (44%) 2,169 (57%)
Total annual householdincome (US$ PPP in 2005)
1,273 (100%) 3,834 (100%)
Poverty headcount ratio (%) 83 42
Poverty gap ratio (%) 45 16
Sri Lanka: rural households 1990 2006
Farm income 796 (34%) 948 (18%)
Nonfarm income 1,544 (66%) 4,319
Total annual householdincome (US$ PPP in 2005)
2,340 (100%) 5,268
Poverty headcount ratio (%) 60 14
Poverty gap ratio (%) 24 5
Africa
Ethiopia 2004 2006
Farm income 275 (90%) 318 (88%)
Nonfarm income 31 (10%) 44 (12%)
Total annual householdincome (US$ PPP in 2005)
306 (100%) 362 (100%)
Poverty headcount ratio (%) 82 76
Poverty gap ratio (%) 47 46
Kenya 2004 2007
Farm income 527 (60%) 665 (61%)
Nonfarm income 351 (40%) 426 (39%)
Total annual householdincome (US$ PPP in 2005)
878 (100%) 1,091 (100%)
Poverty headcount ratio (%) 42 40
Poverty gap ratio (%) 18 17
Uganda 2003 2009
(continued)
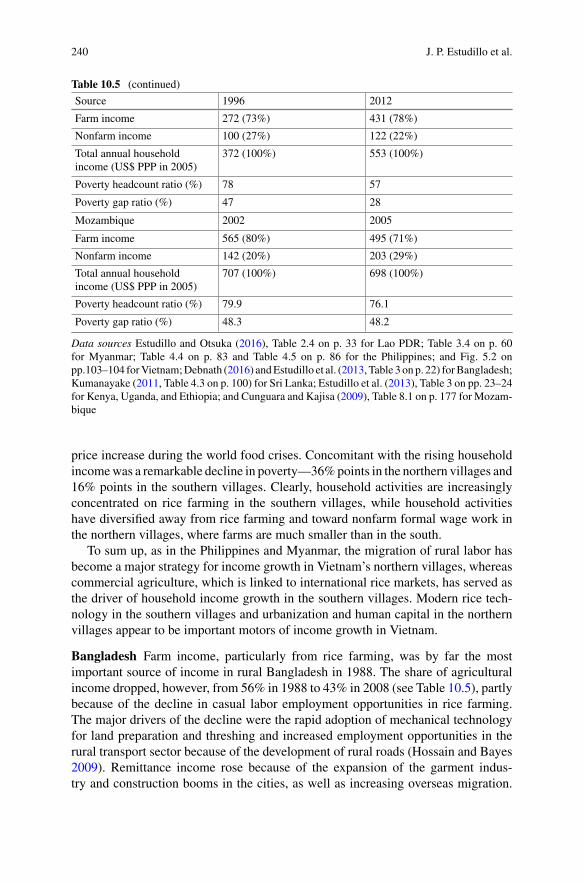
240 J. P. Estudillo et al.
Table 10.5 (continued)
Source 1996 2012
Farm income 272 (73%) 431 (78%)
Nonfarm income 100 (27%) 122 (22%)
Total annual householdincome (US$ PPP in 2005)
372 (100%) 553 (100%)
Poverty headcount ratio (%) 78 57
Poverty gap ratio (%) 47 28
Mozambique 2002 2005
Farm income 565 (80%) 495 (71%)
Nonfarm income 142 (20%) 203 (29%)
Total annual householdincome (US$ PPP in 2005)
707 (100%) 698 (100%)
Poverty headcount ratio (%) 79.9 76.1
Poverty gap ratio (%) 48.3 48.2
Data sources Estudillo and Otsuka (2016), Table 2.4 on p. 33 for Lao PDR; Table 3.4 on p. 60for Myanmar; Table 4.4 on p. 83 and Table 4.5 on p. 86 for the Philippines; and Fig. 5.2 onpp.103–104 forVietnam;Debnath (2016) andEstudillo et al. (2013,Table 3 onp. 22) forBangladesh;Kumanayake (2011, Table 4.3 on p. 100) for Sri Lanka; Estudillo et al. (2013), Table 3 on pp. 23–24for Kenya, Uganda, and Ethiopia; and Cunguara and Kajisa (2009), Table 8.1 on p. 177 for Mozam-bique
price increase during the world food crises. Concomitant with the rising householdincomewas a remarkable decline in poverty—36%points in the northern villages and16% points in the southern villages. Clearly, household activities are increasinglyconcentrated on rice farming in the southern villages, while household activitieshave diversified away from rice farming and toward nonfarm formal wage work inthe northern villages, where farms are much smaller than in the south.
To sum up, as in the Philippines and Myanmar, the migration of rural labor hasbecome a major strategy for income growth in Vietnam’s northern villages, whereascommercial agriculture, which is linked to international rice markets, has served asthe driver of household income growth in the southern villages. Modern rice tech-nology in the southern villages and urbanization and human capital in the northernvillages appear to be important motors of income growth in Vietnam.
Bangladesh Farm income, particularly from rice farming, was by far the mostimportant source of income in rural Bangladesh in 1988. The share of agriculturalincome dropped, however, from 56% in 1988 to 43% in 2008 (see Table 10.5), partlybecause of the decline in casual labor employment opportunities in rice farming.The major drivers of the decline were the rapid adoption of mechanical technologyfor land preparation and threshing and increased employment opportunities in therural transport sector because of the development of rural roads (Hossain and Bayes2009). Remittance income rose because of the expansion of the garment indus-try and construction booms in the cities, as well as increasing overseas migration.
10 Transformation of Rural Economies in Asia and Africa 241
Incomes almost tripled, and poverty declined from 83 to 42%. Taking up jobs in thenonfarm sector has been facilitated by the earlier decisions of parents to invest intheir children’s schooling, particularly for their girls, which was, in turn, induced byhousehold income increases and government policies favoring girls (e.g., food foreducation program, cash for education program, and scholarships for girls; EstudilloandOtsuka 2016). It seems clear that investment in human capital is an integral part ofthe long-term and dynamic process of household income growth in rural Bangladesh.
Sri Lanka Nonfarm wage income was the dominant source of rural householdincome as early as 1990, and its importance had increased by 2006 (see Table 10.5).This indicates that rural households are increasingly allocating labor away fromagricultural activities to nonfarm wage employment in the formal wage sector. Theeducated children of rural households are those involved in formal wage employ-ment, as returns to education are bound to be higher in the sector. As a result, theshare of farm income among the rural households declined significantly from 1990 to2006. Concomitant with the rise in the share of nonfarm wage income is the increasein the annual household incomes of rural households by more than 2.4 times and adecline in the poverty headcount ratio from 60% in 1990 to 14% in 2006.
Sri Lanka has households living in estates that continue to be poor, whereas ruralhouseholds experienced upper economic mobility when they participated in activi-ties that produce nonfarm formal wage income. Low and stagnant wage income inthe estate sector in the face of constant cost-of-living increases is the main factor pre-venting estate people from moving out of poverty (World Bank 2005). Kumanayakeet al. (2014) argue that remoteness is another factor, because basic infrastructurein the estates remains largely underdeveloped, preventing estate people from tak-ing advantage of emerging economic opportunities in the nonfarm sector. In otherwords, people in estates are examples of “hard-to-reach groups,” those left behind inthe course of the economic development of emerging economies.
To summarize, rural households in our focus countries in Asia have shifted theirmain livelihood sources away from farming to nonfarm work and, importantly, non-farm formal wage work, as well as to overseas migration, as in the Philippines andBangladesh; this shift is being accompanied by income growth and poverty reduc-tion. This story is fairly similar across our focus countries in Asia: the developmentof the nonfarm sector has served as a springboard for economic mobility in ruralcommunities.
10.4.2 Changes in Household Income and Their Sourcesin Africa
Rural household surveys in Ethiopia, Kenya¸ and Uganda were conducted as part ofa research project, the Research on Poverty, Environment, and Agricultural Tech-nology, or RePEAT (Matsumoto et al. 2009). The benchmark survey in Ethiopiawas conducted in 2004, covering 420 households from the central to the southern
242 J. P. Estudillo et al.
region. The first survey in Uganda covered 94 local councils 1 (LC1s), the smallestadministrative unit (comparable to a village in Asia), and 940 households in most ofthe country, except in the northern regions, where there were security concerns. Thebenchmark survey in Kenya was conducted in 2003 and covered 99 sub-locations,an administrative unit that may include a few villages, and 934 households in thecentral and western regions. Stratified random sampling of communities was usedin the target regions, and about 10 households for every selected community wererandomly chosen. Data on Mozambique were collected from the two rice-growingprovinces of Zambezia and Sofala, extracted from the National Agricultural Surveyin 2002 and 2005. There were 1,140 households in 2002 and 928 households in 2005;928 households were included in both surveys (620 from Zambezia and 308 fromSofala; Cunguara and Kajisa 2009).
Ethiopia In Ethiopia, agricultural income (crop farming and livestock income) in2006 accounted for as much as 88% of the total household income (see Table 10.5).Nonfarm income accounted for only 12% of total income, reflecting the low-returnand low-productivity activities in the nonfarm sectors in this predominantly agrarianeconomy. Total income rose by only 1.18 times, and the poverty headcount ratio washigh, declining only modestly from 82% in 2004 to 76% in 2006.
Kenya Farm income in Kenya accounted for 60% of the total household income in2004. The remittances and earnings of migrant workers were an important portionof nonfarm income, comprising 40% of total income, which reflects the relativelydeveloped nonfarm sectors in Kenya compared with other countries in Africa. Thisindicates the importance of migration as a strategy for increasing household income.There was a modest increase in total household income (from US$878 in PPP in2004 to US$1,091 in PPP in 2007). Household incomes in Kenya are comparableto the incomes of landless households in the Philippines and Sri Lanka and thoseof small farmers in northern Vietnam and Bangladesh. Both the poverty headcountratio and poverty gap ratio remained essentially the same from 2004 to 2007.
Uganda From 2003 to 2008, farm incomes in Uganda comprised about 70% oftotal household income (crop farming had a 60% share, livestock 10%), whereas non-farm income,mainly from self-employment, comprised 30%.Total annual householdincome rose about 1.5 times from 2003 to 2007, primarily due to crop farming. Non-farm wage employment was not very important, indicating that the nonfarm labormarkets are not yet well-developed. The poverty headcount ratio declined from 78 to59%. A more recent phenomenon is so-called “mobile money,” which, since emerg-ing in Uganda in 2009, has been used by more than 35% of the adult population.Its rate of penetration is rapidly increasing. Mobile money enables unbanked house-holds to have access to financial services (important for sending remittances) at areduced cost.
Mozambique Farm income (mainly from crop production) is by far the most impor-tant source of household income. Partly because of a drought during the 2002–2005
10 Transformation of Rural Economies in Asia and Africa 243
survey period, the share of farm income declined from 80% in 2002 to 71% in 2005(Cunguara andKajisa 2009). Surprisingly, poverty declinedmodestly when the shareof nonfarm income rose. It appears that engaging in nonfarm activities is an importantrisk-coping mechanism for households in this country. Migration is not common inthe study sites (remittance income comprised only about 3% of total income), andincome from livestock is small (only about 2%). In brief, diversification out of thefarm and into the nonfarm sector appears to enable people to avoid poverty, but thisopportunity is limited inMozambique to nonfarm activities that are undertaken whenagricultural labor demand is low.
To sum up, farm income remains the most important source of rural householdincome in Africa. Nonfarm income in Africa is increasingly made up of remittancesand the earnings of migrant workers, indicating the growing economic importanceof nonfarm income associated with migration. Nonfarm self-employment activitiesare largely informal and home-based, intricately tied up with agricultural production(e.g., brewing of homemade beverages in Mozambique). Although we found thatthe shift of livelihood away from farm to nonfarm activities has taken place in bothAsia and Africa, it is occurring much faster in Asia. The main driver in Asia isthe development of the formal nonfarm sector and migration, including overseasmigration. In Africa, the main driver appears to be domestic migration coupledwith employment in informal nonfarm sectors, as livelihood opportunities within thenonfarm sector are largely confined to the informal sector in urban areas, which tendto wane in the course of economic development.
10.4.3 Conditions for “Take-off:” A Retrospective Viewfrom Central Luzon in the Philippines
We discuss below the underlying mechanisms behind the rise of Central Luzon (CL)as an emerging region in the Philippines, in an analysis made possible thanks to theavailability of unusually long-term household data. We describe the socioeconomicconditions before and after the GR in CL, the most progressive rice-producing areaof the country. The dataset comes from periodic surveys performed at an averageinterval of four years beginning in 1966 conducted by the Social Sciences Divisionof the International Rice Research Institute. The main aim of the survey is to monitorchanges in the adoption of new rice technology, land tenure, mechanization, andlabor practices. The dataset is called the “Central Luzon Loop Survey” because therespondents are located along a loop of themajor highways stretching north ofManilathrough the provinces of Bulacan, Nueva Ecija, Pangasinan, Tarlac, and Pampanga(see Fig. 10.9). These provinces are frontrunners in the adoption of modern varietiesof rice in the country. CL, contiguous to the National Capital Region (where the cityof Manila is located), has become one of the fastest-growing regions in the nation.
This is the only dataset drawn from tropical Asia that offers information on house-hold socioeconomic conditions as far back as half a century ago. The original sam-
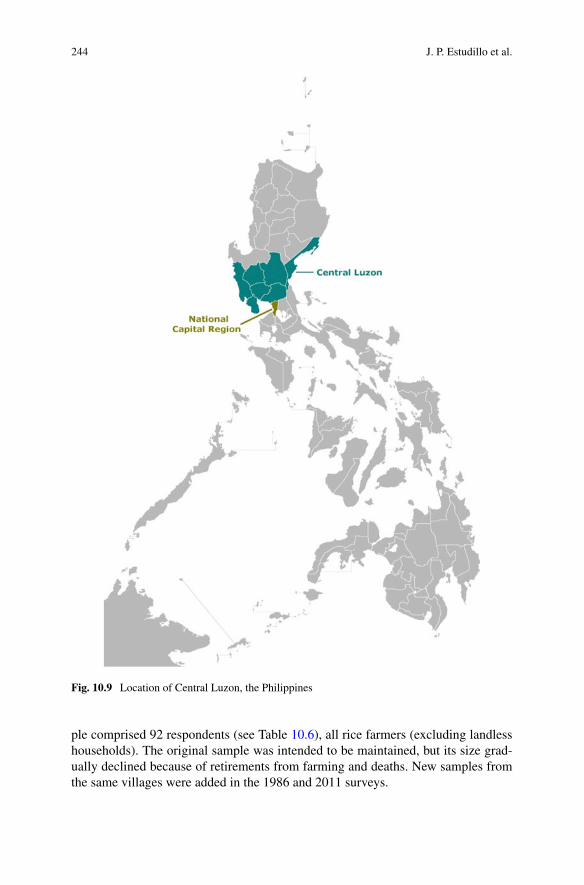
244 J. P. Estudillo et al.
Fig. 10.9 Location of Central Luzon, the Philippines
ple comprised 92 respondents (see Table 10.6), all rice farmers (excluding landlesshouseholds). The original sample was intended to be maintained, but its size grad-ually declined because of retirements from farming and deaths. New samples fromthe same villages were added in the 1986 and 2011 surveys.
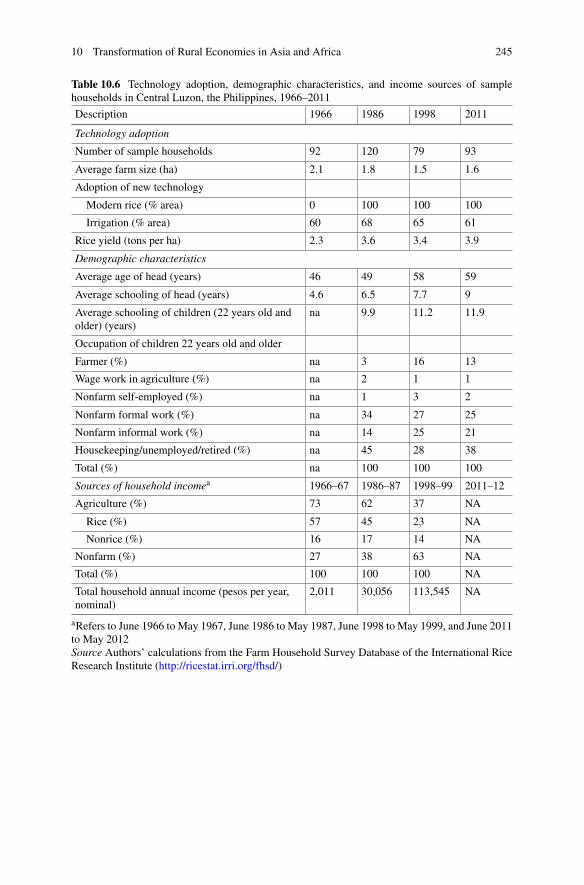
10 Transformation of Rural Economies in Asia and Africa 245
Table 10.6 Technology adoption, demographic characteristics, and income sources of samplehouseholds in Central Luzon, the Philippines, 1966–2011
Description 1966 1986 1998 2011
Technology adoption
Number of sample households 92 120 79 93
Average farm size (ha) 2.1 1.8 1.5 1.6
Adoption of new technology
Modern rice (% area) 0 100 100 100
Irrigation (% area) 60 68 65 61
Rice yield (tons per ha) 2.3 3.6 3.4 3.9
Demographic characteristics
Average age of head (years) 46 49 58 59
Average schooling of head (years) 4.6 6.5 7.7 9
Average schooling of children (22 years old andolder) (years)
na 9.9 11.2 11.9
Occupation of children 22 years old and older
Farmer (%) na 3 16 13
Wage work in agriculture (%) na 2 1 1
Nonfarm self-employed (%) na 1 3 2
Nonfarm formal work (%) na 34 27 25
Nonfarm informal work (%) na 14 25 21
Housekeeping/unemployed/retired (%) na 45 28 38
Total (%) na 100 100 100
Sources of household incomea 1966–67 1986–87 1998–99 2011–12
Agriculture (%) 73 62 37 NA
Rice (%) 57 45 23 NA
Nonrice (%) 16 17 14 NA
Nonfarm (%) 27 38 63 NA
Total (%) 100 100 100 NA
Total household annual income (pesos per year,nominal)
2,011 30,056 113,545 NA
aRefers to June 1966 to May 1967, June 1986 to May 1987, June 1998 to May 1999, and June 2011to May 2012Source Authors’ calculations from the Farm Household Survey Database of the International RiceResearch Institute (http://ricestat.irri.org/fhsd/)
246 J. P. Estudillo et al.
Our discussion on the emergence of CL revolves around a simple story that beginswith population pressure as a trigger for the adoption of modern rice technology. TheGR started in CL in 1966 with the release of IR8. The land reform (LR) programwas implemented in the mid-1970s, when the adoption of modern rice varieties hadreached high level. The LR program converted share tenants into owner cultivators orleasehold tenants while holding amortization fees and leasehold rents fixed at belowthe market return to land. Thus, farmers were able to internalize the gains from therice yield growth that occurred under LR, leading to an increase in farm income.Farmers then invested the increased farm income in children’s schooling inducedby the growing availability of jobs for skilled and semi-skilled workers when theNIEs delocalized and outsourced some of their production processes to the Philip-pines. Educated children moved out of the villages and obtained nonfarm work inlocal towns, cities, and even overseas, while sending remittances back home. House-hold income from nonfarm sources has become the main contributor to sustainedtotal household income growth and poverty reduction. The CL saga underscores theimportance of modern agricultural technology as a springboard of economic trans-formation in the early stage of development.
Population Pressure and Modern Agricultural Technology The average cultiva-tion size of farms has consistently declined from 2.1 ha in 1966 to 1.6 ha in 2011 (seeTable 10.6). The decline in farm size can be partly explained by the changes in thecomposition of sample farms but is more fundamentally due to population pressureon the closed land frontier in CL. Inheritance is an institutional mechanism for thetransfer of land across generations. It is common for parents in CL to divide the landequally among heirs or among male heirs only. Due to relatively large family sizesand, in some cases, secondary marriages, landholdings have become fragmented asan outcome of equal inheritance. When rice farming is the only source of income ina regime of small landholdings and stagnant technology, impoverishment becomescommon.
In 1966, all sample farmerswere planting only traditional varieties of rice. ThefirstMV, IR8, was released in CL in November 1966. Earlier MVs released prior to themid-1970s were the “first-generation” MVs (MV1), which are highly susceptibleto pests and diseases. By 1986, all sample farmers had shifted exclusively to the“second-generation” MVs (MV2), which have strong resistance to against multiplepests and diseases. Such a shift has been facilitated by the opening of PantabanganDam in 1977, which provides water for irrigation and electricity via hydroelectricpower generation. As a result, there was a significant increase in rice yield from2.3 tons/ha in 1966 to 3.6 tons/ha in 1986, partly because of the shift from MV1 toMV2 and partly because of increased fertilizer application. The total irrigated arearose from 60% to around 70% between 1966 and 1998.
Over the years, the adoption of labor-saving technologies such as the use of tractorsand threshers and direct seeding increased in response to increases in wages. Duringthe 1980s, the Asian NIEs ventured into delocalization and the outsourcing of labor-intensive production processes in Southeast Asian countries to take advantage of thelow wages. At the same time, there was a diversion of international division of labor
10 Transformation of Rural Economies in Asia and Africa 247
for low-technology and labor-intensive products from high-performing countriesin Southeast Asia to other low-wage countries in Asia, including the Philippines.These phenomena have created jobs for the semi-skilled and skilled workers in CL,raising the returns to schooling investments. Moreover, CL saw a growth of smallcities, namely Cabanatuan, San Jose, and the Science City of Munoz, and a growthin population in the so-called poblacion (town centers) in each municipality. Smallcities emerged partly because of the relocation of industries away fromMetroManila,which has become congested, thereby pushing up production costs.
History of Land Tenure System and Land Reform Implementation In the1800s, during the Spanish colonial period, three modes of land acquisition con-tributed to the pervasive landlordism in CL: royal grants, purchase of realengas,and pacto de retrovenda arrangements (McLennan 1969). Realengas is the outrightpurchase at a low price of real estate from a badly-in-need peasant or from the publicdomain. Royal grants and realengas resulted in the proliferation of huge privatehaciendas (large blocks of consolidated landholdings) in Nueva Ecija, Tarlac,eastern Pangasinan, and northern and western Pampanga. Pacto de retrovenda wasequivalent to today’s mortgage system (sangla), whereby amoneylender (commonlya Chinese mestizo or Chinese merchant) lent a peasant some money and securedprotection for his loan by taking immediate control of the land, allowing the peasantto remain but as a sharecropper under the Chinese mestizo. Seldom able to pay theloan at the appointed time, the peasant often relinquished his claim to the land dueto his debt. Pacto de retrovenda extended landlordism in the form of the kasamajan(sharecropping) system, which resulted in a pattern of land ownership characterizedby scattered, unconsolidated landholdings that was common throughout muchof Pampanga and Bulacan, central Pangasinan, and, in the nineteenth century, insouthern and central Nueva Ecija.
It was in the haciendas, in the growing depersonalized atmosphere of absenteelandlordism (landlords lived in Manila), where peasants became discontented andbegan to clamor for land reform. Ferdinand Marcos issued Presidential Decree No.27 in 1972 declaring the entire Philippines a land reform area, notwithstanding thefact that only rice and corn landwas included. Under the “land-to-the-tiller” program,landholdings of more than 7 ha were to be purchased by the government and soldto individual tenants (up to 3 ha for irrigated land or 5 ha for non-irrigated land).Tenants would amortize for the value of the land over a 15-year period. Under the“operation leasehold” program, sharecroppers on holdings of less than 7 ha were tobe converted to leaseholders, paying a fixed rent every cropping season.
Since the implementation of the LR program coincided with yield growth, due tothe spread ofmodern seed-fertilizer technology, amortization fees and leasehold rentsprescribed and fixed by law fell below the prevailing rental value of land, creatingan economic rent that accrued to the land reform beneficiary. Indeed, according toOtsuka (1991), the LR program in the Philippines (particularly in CL) succeededbecause of the heightened economic interest of tenants in land reform arising fromthe divergence of the rental value of land from leasehold rent and amortization feesprescribed by the LR law. Estudillo and Otsuka (1999) reported that the proportion
248 J. P. Estudillo et al.
of land area in the sample villages in the Central Luzon Loop survey under ownercultivation increased from12% in 1966 to 24% in 1994while that under share tenancydeclined from 75% in 1966 to only 9% in 1994, attesting to the successful conversionof share tenants to amortizing owners and leaseholders due to land reform in CL.
Investments in Human Capital Farm households appear anxious to invest in theschooling of their children. Household children 22 years old and above had obtainedsignificantly longer years of schooling than the household heads had (see Table 10.6).The proportion of adult children with tertiary schooling (more than 10 years ofschooling) increased from 40% in 1986 to 67% in 2011; this is an underestimationbecause the more educated children had migrated and were not included in the list ofchildren living in the households. Only 13% of adult children living in the householdin 2011 were engaged in rice farming, whereas 46% were engaged in nonfarm work,including work in the formal sector. The average age of household heads rose from46 in 1966 to 59 in 2011, which indicates that the heads of selected householdsremained the same for many years. Clearly, farming remains the main occupationof the household head, whereas the more educated children are engaged in nonfarmwork.
According to Estudillo et al. (2009), farm income in the early years of the GRwere used to finance investments in children’s schooling at a time when new jobsin the nonfarm sector were created in the Philippines. These new jobs raised thereturns to schooling, inducing land reform beneficiaries to invest in higher levels ofschooling for their children.
Sources of Household Income The CL respondents have shifted their main sourceof livelihood away from farm toward nonfarm activities, as shown by the decliningincome share of agriculture (from73% in1966 to 37% in 1998/99) and the subsequentgrowth in the share of nonfarm income (see Table 10.6). Remittance income is animportant component of nonfarm income; it has gained importance in recent yearsbecause of the increasing participation of the younger generation in nonfarm workin cities and overseas, made possible by earlier investments in schooling. Clearly,CL has experienced the same process of economic transformation as that seen inour focus countries, but this case highlights the importance of modern agriculturaltechnology as a force behind economic transformation in its early stage.
10.5 Summary and Conclusions
Emerging economies are in developing countries that are rapidly growing and gain-ing an increasing share of the global economy. However, little is known about theunderlying mechanisms of how these economies have actually evolved. This chapterexplored three drivers of the evolution of emerging economies: population pressure,modern agricultural technology, and human capital. We performed a comparisonbetween selected countries in Asia and sub-Saharan Africa; the former is the more
10 Transformation of Rural Economies in Asia and Africa 249
dynamic region, and the latter has the potential to follow suit. The three drivers aredistinct in their interaction yet define a common regional path for the emerging state,wherein agricultural development could serve as a strong stimulus for economictransformation (or the expansion of the nonfarm sector) through higher farm incomeand a subsequent growth in investments in human capital.
The CL case is clearly consistent with the Boserupian thesis that high populationpressure can induce the adoption of labor-intensive agricultural technology. The GRand the simultaneous implementation of land reform have led to growth in the farmincome of land reform beneficiaries. Meanwhile, rising wages in the newly indus-trializing economies in East Asia have induced the outsourcing and delocalizationof labor-intensive production processes to Southeast Asia, including the Philippines,creating jobs for skilled and semi-skilled workers and opportunities for profitableinvestments in human capital. Farmers used their farm income to finance investmentsin the schooling of their children, who, upon receiving higher education, migrated outof the villages to small towns, cities, and abroad, thereby contributing to the develop-ment of nonfarm sectors and improvements in farm households’ income (Estudilloet al. 2009). Nonfarm wage income and remittances became the main contributorsto sustained household income growth and poverty reduction in rural areas.
What lessons can Africa learn from Asia? Our analysis shows that, to stimulatethe development of the entire economy, it is necessary to first develop agricultureduring the early stage of development. Following the Asian path, a robust agricul-ture sector in Africa is expected to stimulate the development of the nonfarm sector,which can eventually lead the entire economy into rapid growth. The Asian path-way is represented by the advent of the GR, followed by profitable investments inhuman capital inspired by the rising demand for semi-skilled and skilled workersas globalization proceeds. Since Africa is still in an early stage of development andpopulation pressure has begun, agricultural development could serve as the criticalfirst step toward sustained income growth and poverty reduction, as occurred in Asiaabout half a century ago.
Acknowledgements This work was partially supported by JSPS KAKENHI Grant NumberJP25101002. The authors are grateful to Katrina Miradora for her excellent research assistance.
References
Chamberlain, J., Jayne, T. S., & Heady, D. (2014). Scarcity amidst abundance? Reassessing thepotential for cropland expansion in Africa. Food Policy, 48, 51–65.
Cunguara, B., &Kajisa, K. (2009). Determinants of household income and schooling investments inrice-growing provinces in Mozambique, 2002–5. In K. Otsuka, J. Estudillo, & Y. Sawada (Eds.),Rural poverty and income dynamics in Asia and Africa (pp. 174–195). London: Routledge Taylorand Francis Group.
250 J. P. Estudillo et al.
Debnath, D. (2016). Changing determinants of household income by source: Evidence from ruralhouseholds in Bangladesh, 1988–2008. Unpublished manuscript, National Graduate Institute forPolicy Studies, Tokyo, Japan.
Dollar, D., & Kraay, A. (2002). Growth is good for the poor. Journal of Economic Growth, 7,195–225.
Estudillo, J. P., & Otsuka, K. (1999). Green revolution, human capital, and off-farm employment:Changing sources of income among farm households in Central Luzon, 1966–94. EconomicDevelopment and Cultural Change, 47(3), 497–523.
Estudillo, J. P., Sawada, Y., & Otsuka, K. (2009). Income dynamics, schooling investment, andpoverty reduction in Philippine villages. In K. Otsuka, J. Estudillo, & Y. Sawada (Eds.), Ruralpoverty and income dynamics in Asia and Africa (pp. 1985–2004). London: Routledge Taylorand Francis Group.
Estudillo, J. P., & Otsuka, K. (2013). Lessons from the Asian green revolution. In K. Otsuka & D.Larson (Eds.), An African green revolution: Finding ways to boost productivity on small farms(pp. 17–42). New York: Springer.
Estudillo, J. P.,Matsumoto, T., Hayat, C. Z.U., Kumanayake,N. S.,&Otsuka,K. (2013). Labormar-kets, occupational choice and rural poverty in selected countries in Asia and Sub-Saharan Africa.Background paper for the World Development Report 2013 “Jobs,” World Bank, Washington,D.C.
Estudillo, J. P., & Otsuka, K. (2016). Moving out of poverty: An inquiry into the inclusive growthin Asia. London: Routledge Taylor and Francis Group.
Garcia, Y. T., Garcia, A. G., Oo, M., & Hossain, M. (2000). Income distribution and poverty inirrigated and rainfed ecosystems: the Myanmar case. Economic and Political Weekly, 35(52/53),4670–4676.
Goldman Sachs. (2007). The N-11: More than an acronym, Global Economics Paper no. 153.Goldman Sachs Economic Research. New York, NY.
Hayami, Y., & Otsuka, K. (1994). Beyond the green revolution: Agricultural development strat-egy into the new century. In J. Anderson (Ed.), Agricultural technology: Policy issues for theinternational community. Wallingford: CAB International.
Hayami, Y., & Ruttan, V. W. (1985). Agricultural development: An international perspective. Bal-timore: Johns Hopkins University Press.
Hossain,M.,&Bayes,A. (2009).Rural economy and livelihoods: Insights from Bangladesh. Dhaka:A. H. Development Publishing House.
Jayne, T. S., Chamberlain, J., &Heady, D. (2014). Land pressures, the evolution of farming systems,and development strategies in Africa: A synthesis. Food Policy, 48, 1–17.
Kumanayake, N. S. (2011). Structural transformation and poverty reduction: A view from threesectors in Sri Lanka. Unpublished Ph.D. dissertation, National Graduate Institute for PolicyStudies, Tokyo, Japan.
Kumanayake, N. S., Estudillo, J. P., & Otsuka, K. (2014). Changing sources of household income,poverty, and sectoral inequality in Sri Lanka, 1990–2006. Developing Economies, 52(1), 26–51.
McLennan, M. (1969). Land and tenancy in the Central Luzon Plain. Philippine Studies, 17(4),651–682.
Macmillan, M., Rodrik, D., & Verduzco-Gallo, I. (2014). Globalization, structural change, andproductivity growth. World Development, 63, 11–32.
Matsumoto, T., Kijima, Y., &Yamano, T. (2009). Role of nonfarm income and education in reducingpoverty: Evidence from Ethiopia, Kenya, and Uganda. In K. Otsuka, J. Estudillo, & Y. Sawada(Eds.), Rural poverty and income dynamics in Asia and Africa. London: Routledge Taylor andFrancis Group.
Otsuka, K. (1991). Determinants and consequences of land reform implementation in the Philip-pines. Journal of Development Economics, 35(2), 339–355.
10 Transformation of Rural Economies in Asia and Africa 251
Otsuka, K., Estudillo, J. P., & Sawada, Y. (2009). Rural poverty and income dynamics in Asia andAfrica. London: Routledge.
Otsuka, K., Higuchi, Y., & Sonobe, T. (2017). Middle-income traps in East Asia: An inquiry intocauses for slowdown in income growth. China Economic Review, 46(S), S3–S16.
Otsuka, K., Jin, K., & Sonobe, T. (2018). (forthcoming). Applying Kaizen in Africa: A new avenuefor industrial development. New York: Palgrave Macmillan.
Otsuka, K., &Runge, C. F. (Eds.). (2011).Can economic growth be sustained? The collected papersof Vernon W. Ruttan and Yujiro Hayami. Oxford: Oxford University Press.
Otsuka, K., & Larson, D. (2013). An African green revolution: Finding ways to boost productivityon small farms. Dordrecht: Springer.
Otsuka, K., & Larson, D. (2016). In pursuit of an African green revolution: Views from rice andmaize farmers’ fields. Dordrecht: Springer.
UnitedNations. (2015).The Millennium development goals report 2015. NewYork:UnitedNations.Sonobe, T., & Otsuka, K. (2011). Cluster-based industrial development: A comparative study of
Asia and Africa. Hampshire: Palgrave Macmillan.Sonobe, T., & Otsuka, K. (2014). Cluster-based industrial developments: Kaizen management for
MSE growth in developing countries. Hampshire: Palgrave Macmillan.Tsunekawa, K. (2017). Globalization and the emerging state: Past advance and future challenges.Paper prepared for the Emerging State Project Workshop held at the National Graduate Institutefor Policy Studies, Tokyo, Japan, January 21, 2017.
Ut, T. T., Hossain, M., & Janaiah, A. (2000). Modern farm technology and infrastructure in Viet-nam: Impact on income distribution and poverty. Economic and Political Weekly, 35(52–53),4638–4643.
World Bank. (2005). Moving out of poverty in the estate sector in Sri Lanka: Understanding growthand freedom from the bottom up. Sri Lanka: Centre for Poverty Analysis.
World Bank. (2008). World development report 2008: Agriculture for development. Washington,DC: World Bank.
Zhuang, J., & Ali, I. (2010). Poverty, inequality, and inclusive growth in Asia. In J. Zhuang (Ed.),Poverty, inequality, and inclusive growth: Measurement, policy issues, and country studies. Lon-don: Anthens Press.
Open Access This chapter is licensed under the terms of the Creative Commons Attribution-NonCommercial-NoDerivatives 4.0 International License (http://creativecommons.org/licenses/by-nc-nd/4.0/), which permits any noncommercial use, sharing, distribution and reproduction in anymedium or format, as long as you give appropriate credit to the original author(s) and the source,provide a link to the Creative Commons licence and indicate if you modified the licensed material.You do not have permission under this licence to share adapted material derived from this chapteror parts of it.
The images or other third party material in this chapter are included in the chapter’s CreativeCommons licence, unless indicated otherwise in a credit line to the material. If material is notincluded in the chapter’s Creative Commons licence and your intended use is not permitted bystatutory regulation or exceeds the permitted use, you will need to obtain permission directly fromthe copyright holder.
Chapter 11Agricultural Market Interventionand Emerging States in Africa
Masayoshi Honma
11.1 Introduction
Agricultural policies used to be regarded as determined by political institutions pecu-liar to each country. However, broad international comparisons of agricultural policyand economic performance reveal several common patterns. One is that countriestend to impose negative policies (taxation) on agriculture in the early stage of eco-nomic development while adopting positive policies (protection) for agriculture asthe economy develops.
In the early stages of economic development, agriculture is the biggest industryand employs a large workforce. If economic development is promoted, as Petty-Clark’s Law says, the agricultural sector shrinks in relative terms and the agriculturallabor force also decreases. Taxation is imposed on agriculture despite the fact thatit is the biggest industry with many workers. On the other hand, when developmentprogresses, the agricultural sector is protected despite the fact that it shrinks. Thisphenomenon is called the “developmental paradox” (De Gorter and Swinnen 2002).
Starting in the 1980s, various models have been proposed to explain agriculturalprotection levels.
1Furthermore, extensive research has been conducted to enable
international comparison of protection levels as well as analysis of the domesticpolitical economy of agricultural protection and international trade policies. Therehas been a rich accumulation of data in this area.
2
1See e.g. Anderson et al. (1986), Honma and Hayami (1986), Gardner (1987), Krueger et al. (1988,1991), Bates (1989), Tracy (1989), Lindert (1991), Swinnen et al. (2001), and Anderson (2009).2Also, there have been important developments on political economy in the economics profession.See e.g. Grossman and Helpman (1994, 2002), Shleifer (1997), Persson and Tabellini (2000), andAcemoglu et al. (2001).
M. Honma (B)Department of Economics, Division of International Economics, Seinan Gakuin University,Fukuoka, Japane-mail: [email protected]
© The Author(s) 2019K. Otsuka and K. Sugihara (eds.), Paths to the Emerging State in Asia and Africa,Emerging-Economy State and International Policy Studies,https://doi.org/10.1007/978-981-13-3131-2_11
253
254 M. Honma
The agricultural policies of African countries have been analyzed quantitativelyin a World Bank project published as a single volume (Anderson and Masters 2009).There are also a couple of comprehensive studies on the political economy of inter-vention in African agricultural trade (e.g. Bates and Block 2010).3 However, thereremains considerable scope to explore the determinants of agricultural policy inAfrica.
The “developmental paradox” ariseswhen politicians seek tomaximize their votesin the political market. The outcome is far from optimal from an economic viewpointand presents an obstacle to agricultural development. Correcting this paradox isindispensable for economic growth. The purpose of this chapter is to clarify whetherthe “developmental paradox” applies to African agricultural policy and to discussthe proper strategy of economic growth for Africa’s emerging economies.
11.2 Distortion of Agricultural Markets in Africa
Many agricultural policies intervene in the market, pushing down or pushing up theprices of agricultural products, which causes distortion in agricultural markets. Thegreatest distortion is caused by import duties and export taxes imposed by govern-ments at the border. Border measures have the effect of isolating the domestic marketfrom the international market and thus weaken the influence of changes in the inter-national market. Therefore, the difference between the domestic and internationalprices of agricultural products is an indicator of how much the market is distorted.
Various studies have been conducted tomeasure agricultural protection levels. Themost comprehensive is the National and Global Estimates of Distortions to Agricul-tural Incentives 1955–2011 by the World Bank. It measures agricultural protectionlevels in 75 countries over more than 50 years and creates protection indices not onlyfor distortions by border measures but also by domestic measures such as subsidiesand assistance in non-agricultural sectors.
What was observed was that, as expected, agricultural protection levels varieddepending on the stage of economic development. Agriculture was taxed in the earlystages of development, but as the economy developed, agriculture became subjectto protection. This trend was also found in African countries. However, it was notas readily apparent as in rapidly industrializing East Asian countries, especially inthose African countries where economic development remained low (Anderson andMasters 2009).
An important indicator showing the level of protection is the nominal rate ofassistance (NRA). The NRA is defined as the percentage by which governmentpolicies have raised gross returns to farmers above what they would be withoutgovernment intervention (or have lowered them, if the NRA is negative). The NRAis measured for individual agricultural products. In addition, in order to estimate thecountry level of protection, a weighted average of the NRA of individual agricultural
3See also Block and Bates (2011), Hoeffler (2011), and Poulton (2014).
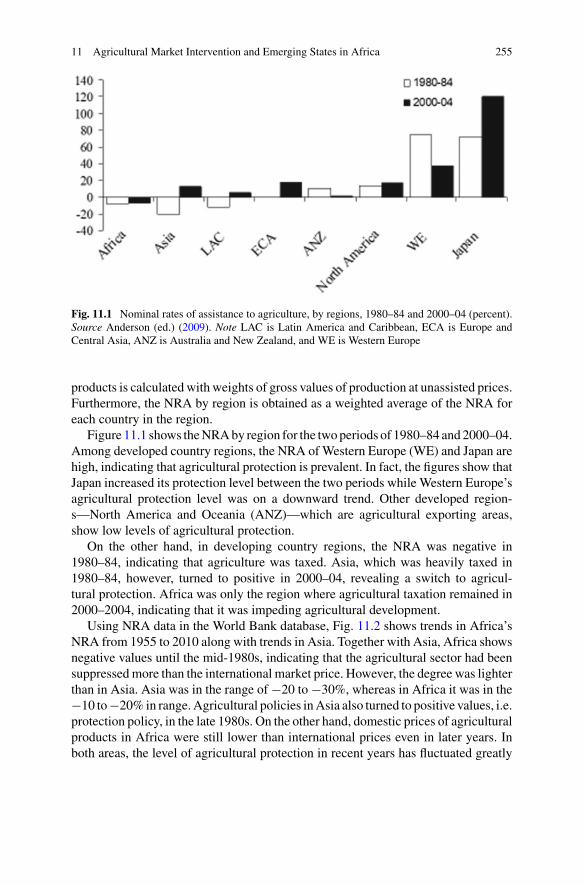
11 Agricultural Market Intervention and Emerging States in Africa 255
Fig. 11.1 Nominal rates of assistance to agriculture, by regions, 1980–84 and 2000–04 (percent).Source Anderson (ed.) (2009). Note LAC is Latin America and Caribbean, ECA is Europe andCentral Asia, ANZ is Australia and New Zealand, and WE is Western Europe
products is calculated with weights of gross values of production at unassisted prices.Furthermore, the NRA by region is obtained as a weighted average of the NRA foreach country in the region.
Figure 11.1 shows theNRAby region for the twoperiods of 1980–84 and2000–04.Among developed country regions, the NRA ofWestern Europe (WE) and Japan arehigh, indicating that agricultural protection is prevalent. In fact, the figures show thatJapan increased its protection level between the two periods while Western Europe’sagricultural protection level was on a downward trend. Other developed region-s—North America and Oceania (ANZ)—which are agricultural exporting areas,show low levels of agricultural protection.
On the other hand, in developing country regions, the NRA was negative in1980–84, indicating that agriculture was taxed. Asia, which was heavily taxed in1980–84, however, turned to positive in 2000–04, revealing a switch to agricul-tural protection. Africa was only the region where agricultural taxation remained in2000–2004, indicating that it was impeding agricultural development.
Using NRA data in the World Bank database, Fig. 11.2 shows trends in Africa’sNRA from 1955 to 2010 along with trends in Asia. Together with Asia, Africa showsnegative values until the mid-1980s, indicating that the agricultural sector had beensuppressedmore than the international market price. However, the degree was lighterthan in Asia. Asia was in the range of −20 to −30%, whereas in Africa it was in the−10 to−20% in range.Agricultural policies inAsia also turned to positive values, i.e.protection policy, in the late 1980s. On the other hand, domestic prices of agriculturalproducts in Africa were still lower than international prices even in later years. Inboth areas, the level of agricultural protection in recent years has fluctuated greatly
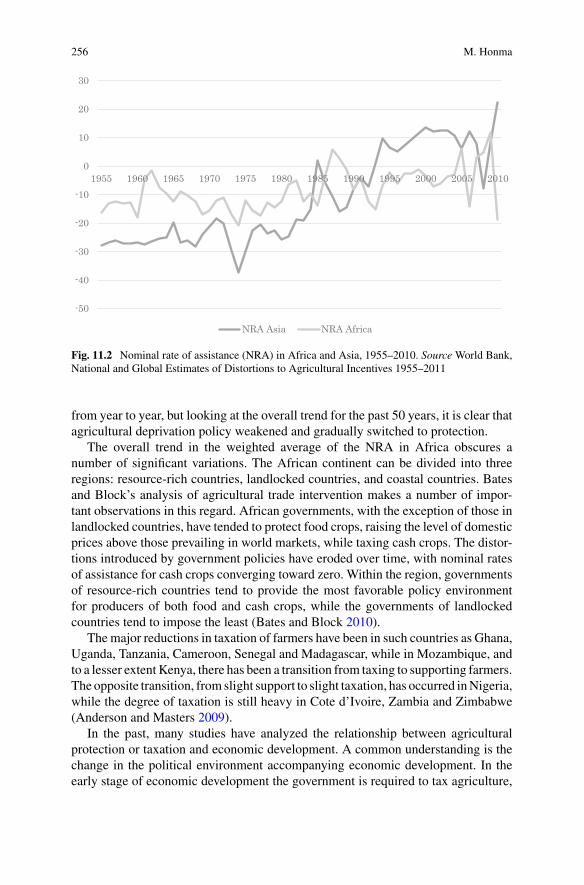
256 M. Honma
-50
-40
-30
-20
-10
0
10
20
30
1955 1960 1965 1970 1975 1980 1985 1990 1995 2000 2005 2010
NRA Asia NRA Africa
Fig. 11.2 Nominal rate of assistance (NRA) in Africa and Asia, 1955–2010. Source World Bank,National and Global Estimates of Distortions to Agricultural Incentives 1955–2011
from year to year, but looking at the overall trend for the past 50 years, it is clear thatagricultural deprivation policy weakened and gradually switched to protection.
The overall trend in the weighted average of the NRA in Africa obscures anumber of significant variations. The African continent can be divided into threeregions: resource-rich countries, landlocked countries, and coastal countries. Batesand Block’s analysis of agricultural trade intervention makes a number of impor-tant observations in this regard. African governments, with the exception of those inlandlocked countries, have tended to protect food crops, raising the level of domesticprices above those prevailing in world markets, while taxing cash crops. The distor-tions introduced by government policies have eroded over time, with nominal ratesof assistance for cash crops converging toward zero. Within the region, governmentsof resource-rich countries tend to provide the most favorable policy environmentfor producers of both food and cash crops, while the governments of landlockedcountries tend to impose the least (Bates and Block 2010).
The major reductions in taxation of farmers have been in such countries as Ghana,Uganda, Tanzania, Cameroon, Senegal and Madagascar, while in Mozambique, andto a lesser extent Kenya, there has been a transition from taxing to supporting farmers.The opposite transition, from slight support to slight taxation, has occurred inNigeria,while the degree of taxation is still heavy in Cote d’Ivoire, Zambia and Zimbabwe(Anderson and Masters 2009).
In the past, many studies have analyzed the relationship between agriculturalprotection or taxation and economic development. A common understanding is thechange in the political environment accompanying economic development. In theearly stage of economic development the government is required to tax agriculture,
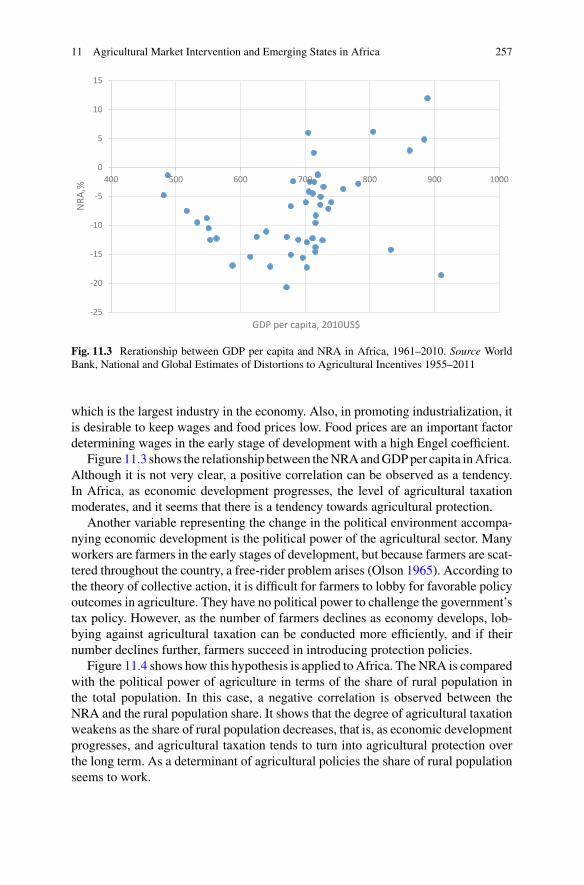
11 Agricultural Market Intervention and Emerging States in Africa 257
-25
-20
-15
-10
-5
0
5
10
15
400 500 600 700 800 900 1000
NRA
,%
GDP per capita, 2010US$
Fig. 11.3 Rerationship between GDP per capita and NRA in Africa, 1961–2010. Source WorldBank, National and Global Estimates of Distortions to Agricultural Incentives 1955–2011
which is the largest industry in the economy. Also, in promoting industrialization, itis desirable to keep wages and food prices low. Food prices are an important factordetermining wages in the early stage of development with a high Engel coefficient.
Figure 11.3 shows the relationship between theNRAandGDPper capita inAfrica.Although it is not very clear, a positive correlation can be observed as a tendency.In Africa, as economic development progresses, the level of agricultural taxationmoderates, and it seems that there is a tendency towards agricultural protection.
Another variable representing the change in the political environment accompa-nying economic development is the political power of the agricultural sector. Manyworkers are farmers in the early stages of development, but because farmers are scat-tered throughout the country, a free-rider problem arises (Olson 1965). According tothe theory of collective action, it is difficult for farmers to lobby for favorable policyoutcomes in agriculture. They have no political power to challenge the government’stax policy. However, as the number of farmers declines as economy develops, lob-bying against agricultural taxation can be conducted more efficiently, and if theirnumber declines further, farmers succeed in introducing protection policies.
Figure 11.4 shows how this hypothesis is applied to Africa. The NRA is comparedwith the political power of agriculture in terms of the share of rural population inthe total population. In this case, a negative correlation is observed between theNRA and the rural population share. It shows that the degree of agricultural taxationweakens as the share of rural population decreases, that is, as economic developmentprogresses, and agricultural taxation tends to turn into agricultural protection overthe long term. As a determinant of agricultural policies the share of rural populationseems to work.
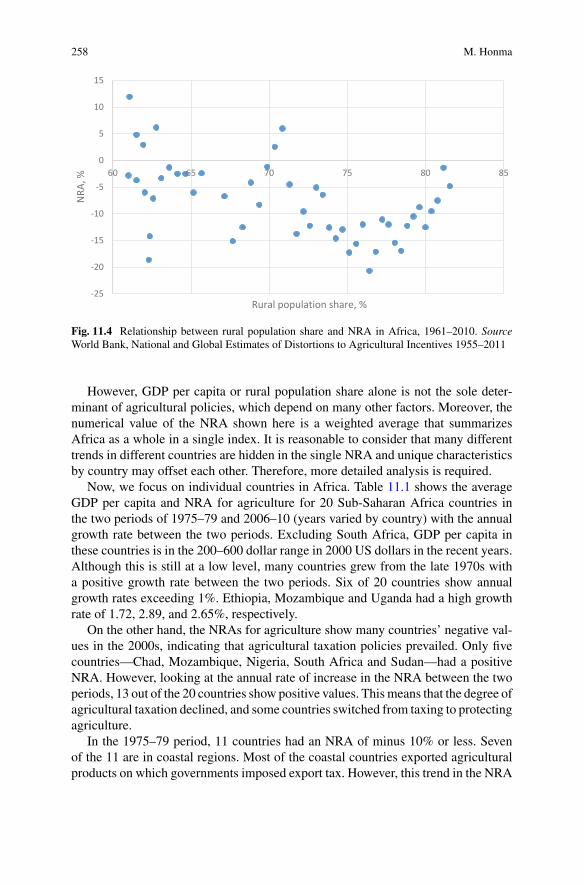
258 M. Honma
-25
-20
-15
-10
-5
0
5
10
15
60 65 70 75 80 85
NRA
, %
Rural population share, %
Fig. 11.4 Relationship between rural population share and NRA in Africa, 1961–2010. SourceWorld Bank, National and Global Estimates of Distortions to Agricultural Incentives 1955–2011
However, GDP per capita or rural population share alone is not the sole deter-minant of agricultural policies, which depend on many other factors. Moreover, thenumerical value of the NRA shown here is a weighted average that summarizesAfrica as a whole in a single index. It is reasonable to consider that many differenttrends in different countries are hidden in the single NRA and unique characteristicsby country may offset each other. Therefore, more detailed analysis is required.
Now, we focus on individual countries in Africa. Table 11.1 shows the averageGDP per capita and NRA for agriculture for 20 Sub-Saharan Africa countries inthe two periods of 1975–79 and 2006–10 (years varied by country) with the annualgrowth rate between the two periods. Excluding South Africa, GDP per capita inthese countries is in the 200–600 dollar range in 2000 US dollars in the recent years.Although this is still at a low level, many countries grew from the late 1970s witha positive growth rate between the two periods. Six of 20 countries show annualgrowth rates exceeding 1%. Ethiopia, Mozambique and Uganda had a high growthrate of 1.72, 2.89, and 2.65%, respectively.
On the other hand, the NRAs for agriculture show many countries’ negative val-ues in the 2000s, indicating that agricultural taxation policies prevailed. Only fivecountries—Chad, Mozambique, Nigeria, South Africa and Sudan—had a positiveNRA. However, looking at the annual rate of increase in the NRA between the twoperiods, 13 out of the 20 countries show positive values. Thismeans that the degree ofagricultural taxation declined, and some countries switched from taxing to protectingagriculture.
In the 1975–79 period, 11 countries had an NRA of minus 10% or less. Sevenof the 11 are in coastal regions. Most of the coastal countries exported agriculturalproducts on which governments imposed export tax. However, this trend in the NRA

11 Agricultural Market Intervention and Emerging States in Africa 259
Table 11.1 NRA and GDP per capita in 20 African countries
County (Regiona) Period GDP per capitab NRA (%)c
Benin (C) 1975–79 276 −0.50
2001–05 321 −0.12
Growth rate 0.58 0.01
Burkina Faso (L) 1975–79 159 −1.51
2006–10 263 −7.19
Growth rate 1.64 −0.18
Cameroon (R, C) 1975–79 638 −14.35
2005–09 695 −1.67
Growth rate 0.29 0.42
Chad (L) 1975–79 197 −4.70
2001–05 220 0.13
Growth rate 0.42 0.19
Cote d’ivoire (C) 1975–79 1051 −34.71
2005–09 565 −29.74
Growth rate −2.05 0.17
Ethiopia (L) 1981–85 123 −18.69
2006–10 188 −4.65
Growth rate 1.72 0.56
Ghana (C) 1975–79 238 −25.58
2006–10 328 −3.91
Growth rate 1.03 0.70
Kenya (C) 1975–79 402 −1.66
2006–10 455 −1.20
Growth rate 0.41 0.01
Madagascar (C) 1975–79 346 −27.06
2006–10 248 −2.37
Growth rate −1.08 0.80
Mali (L) 1975–79 251 −2.18
2006–10 276 −4.52
Growth rate 0.31 −0.08
Mozambique (C) 1981–85 176 −29.74
2006–10 359 7.33
Growth rate 2.89 1.48
Nigeria (R, C) 1975–79 439 6.34
2006–10 492 1.85
Growth rate 0.37 −0.14
(continued)
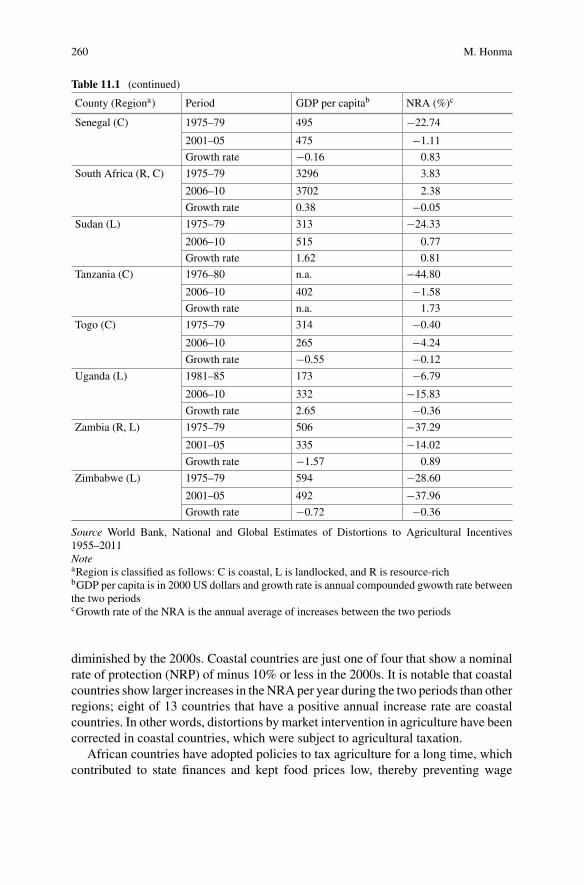
260 M. Honma
Table 11.1 (continued)
County (Regiona) Period GDP per capitab NRA (%)c
Senegal (C) 1975–79 495 −22.74
2001–05 475 −1.11
Growth rate −0.16 0.83
South Africa (R, C) 1975–79 3296 3.83
2006–10 3702 2.38
Growth rate 0.38 −0.05
Sudan (L) 1975–79 313 −24.33
2006–10 515 0.77
Growth rate 1.62 0.81
Tanzania (C) 1976–80 n.a. −44.80
2006–10 402 −1.58
Growth rate n.a. 1.73
Togo (C) 1975–79 314 −0.40
2006–10 265 −4.24
Growth rate −0.55 −0.12
Uganda (L) 1981–85 173 −6.79
2006–10 332 −15.83
Growth rate 2.65 −0.36
Zambia (R, L) 1975–79 506 −37.29
2001–05 335 −14.02
Growth rate −1.57 0.89
Zimbabwe (L) 1975–79 594 −28.60
2001–05 492 −37.96
Growth rate −0.72 −0.36
Source World Bank, National and Global Estimates of Distortions to Agricultural Incentives1955–2011NoteaRegion is classified as follows: C is coastal, L is landlocked, and R is resource-richbGDP per capita is in 2000 US dollars and growth rate is annual compounded gwowth rate betweenthe two periodscGrowth rate of the NRA is the annual average of increases between the two periods
diminished by the 2000s. Coastal countries are just one of four that show a nominalrate of protection (NRP) of minus 10% or less in the 2000s. It is notable that coastalcountries show larger increases in theNRAper year during the two periods than otherregions; eight of 13 countries that have a positive annual increase rate are coastalcountries. In other words, distortions by market intervention in agriculture have beencorrected in coastal countries, which were subject to agricultural taxation.
African countries have adopted policies to tax agriculture for a long time, whichcontributed to state finances and kept food prices low, thereby preventing wage
11 Agricultural Market Intervention and Emerging States in Africa 261
rises. However, in recent years the agricultural taxation trend weakened and theprice distortion was corrected to some degree. Furthermore, as seen from the Asianexperience of emerging economies, the income disparity between agriculture andindustry tends to expand and become a social and economic problem in someAfricancountries. Agricultural policy has to deal with that problem.
11.3 The Relationship Between Economic Developmentand Agricultural Protection Policy
A formal model showing the relationship between the NRA and economic devel-opment is presented in this section. First, it is assumed that politicians (or politicalparties) seek to maximize votes in elections.
The level of protection (taxation) desirable for politicians is, therefore, the levelthat maximizes their political power by maximizing the number of votes in elections.Even thosewhobenefit fromapolicy or thosewho suffer losses express their intentionby voting. Thus, it is necessary to examine the relationship between the costs andbenefits for politicians who set the level of agricultural protection.
Politicians calculate how many votes they will secure by raising the level ofagricultural protection. These votes will be cast by farmers. On the other hand, theyalso have to calculate howmany votes will be lost by choosing the same policy. Thosewho previously supported the politicians may change their minds and not vote forthem if they do not like an increase in the level of agricultural protection. They aremost likely consumers.
Politicians calculate votes earned and votes lost in order to maximize their totalvote. Maximizing votes then becomes a matter of setting the agricultural protectionlevel at the point where the marginal benefit coincides with the marginal cost of thepolicy. The marginal benefit is an increment in the votes gained by increasing a unitof agricultural protection level while the marginal cost is a decrement of votes lostby the same policy.
Figure 11.5 shows the marginal benefit curve (MB) and the marginal cost curve(MC), which change along the level of agricultural protection. MB is described as aline with a downward slope to the right because the marginal utility (gain) of farmersdeclines as the level of protection is raised. On the other hand, MC is a line withan upward slope to the right because the marginal dis-utility (pain) of consumersincreases as food prices are raised. Politicians can maximize votes by setting theprotection level at T at which point MB and MC are intersected shown at point E.
While the level of protection desirable for politicians is not necessarily the sociallydesirable level of protection, it is not easy to break this equilibrium because the deter-mination of the protection level is built into the structure of politics. Market failurecan be caused by monopolies, the provision of public goods, the existence of exter-nalities and information asymmetries, but not only the market but also governmentsand politics can fail.
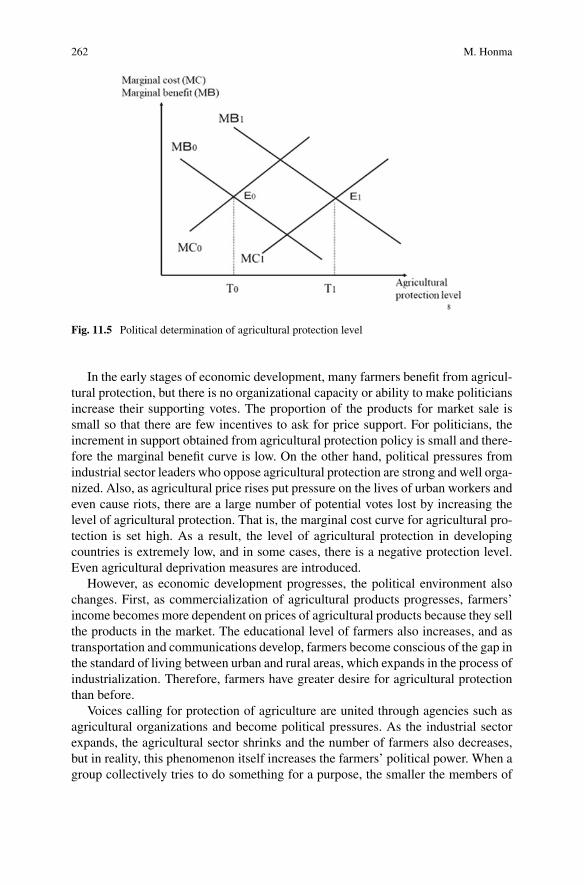
262 M. Honma
Fig. 11.5 Political determination of agricultural protection level
In the early stages of economic development, many farmers benefit from agricul-tural protection, but there is no organizational capacity or ability to make politiciansincrease their supporting votes. The proportion of the products for market sale issmall so that there are few incentives to ask for price support. For politicians, theincrement in support obtained from agricultural protection policy is small and there-fore the marginal benefit curve is low. On the other hand, political pressures fromindustrial sector leaders who oppose agricultural protection are strong and well orga-nized. Also, as agricultural price rises put pressure on the lives of urban workers andeven cause riots, there are a large number of potential votes lost by increasing thelevel of agricultural protection. That is, the marginal cost curve for agricultural pro-tection is set high. As a result, the level of agricultural protection in developingcountries is extremely low, and in some cases, there is a negative protection level.Even agricultural deprivation measures are introduced.
However, as economic development progresses, the political environment alsochanges. First, as commercialization of agricultural products progresses, farmers’income becomes more dependent on prices of agricultural products because they sellthe products in the market. The educational level of farmers also increases, and astransportation and communications develop, farmers become conscious of the gap inthe standard of living between urban and rural areas, which expands in the process ofindustrialization. Therefore, farmers have greater desire for agricultural protectionthan before.
Voices calling for protection of agriculture are united through agencies such asagricultural organizations and become political pressures. As the industrial sectorexpands, the agricultural sector shrinks and the number of farmers also decreases,but in reality, this phenomenon itself increases the farmers’ political power. When agroup collectively tries to do something for a purpose, the smaller the members of
11 Agricultural Market Intervention and Emerging States in Africa 263
that group, the higher the participation rate in that action and therefore the higher theefficiency. The reason is that if the number of people is large, the role of an individualis small, and there is a tendency to think that they have no influence on the whole.But if the group is smaller, this free rider problem can be prevented. This is whatOlson pointed out in Theory of Collective Action (Olson 1965).
In this way, farmers’ groups, which becomemore efficient at lobbying as the econ-omy develops, can promise politicians to gain larger numbers of supporting votes inexchange for stronger agricultural protection. Also, fertilizer and other agriculturalinput material industries that depend on agricultural production support agriculturalprotection. Therefore, as the economy develops, the marginal benefit curve to politi-cians for supplying agricultural protection shifts higher upwards.
How about opposition to agricultural protection? As per capita income increaseswith economic development, the proportion of food expenses in total consumptiondeclines. Rising grocery prices do not have as much impact on workers’ lives asbefore, and their resistance to agricultural protection diminishes. Also, since theindustrial structure itself shifts from labor-intensive to capital-intensive, the impor-tance of wages is small for management and capitalists. Thus, their consciousnessof prices of agricultural products diminishes. Furthermore, as the non-agriculturalsector expands, the number of enterprises also increases, and even if they try to actjointly, the free rider phenomenon described above occurs and cooperation cannotbe achieved at previous levels.
Most people engage in non-agricultural sectors in the developed-country stage.The cost of protecting agriculture is very small for non-agricultural people on a percapita basis. The costs necessary to provide the same protection to the small numberof farmers drop drastically so resistance is reduced accordingly. In addition, at thisstage, the importance of the non-economic value of agriculture such as conservationof green space and maintenance of country scenery in rural areas is increasinglyasserted. Thus, protection of agriculture tends to be easy to accept. These changesshift the marginal cost curve of agricultural protection for politicians downwards.
For politicians, themarginal benefits from agricultural protection are strengthenedand the marginal costs are reduced, resulting in both MR and MC curves shifting tothe right and agricultural protection levels at the developed-country stage rising.
11.4 Determinants of the Agricultural Protection Level
This section presents a mechanism to determine the agricultural protection levelbased on the above model. An important variable that directly affects the number ofvotes cast for a politician in terms of agricultural protection policy is the relative farmhousehold income in comparison with workers’ income of the industrial sector. Theincome disparity between the agricultural and industrial sectors is neglected in theearly stages of development. But, as development progresses, remediation of incomedisparity becomes a policy issue.
264 M. Honma
The labor wage rate is used as the most important variable representing income.The demand curve for labor is derived asmarginal labor productivity: that is, the phys-ical marginal labor productivity multiplied by the product price. The wage rate isdetermined at the level where the labor demand curve intersects with the labor supplycurve. If the labor market is competitive, the wage rate is the same in agriculture andindustry. However, production resources invested in the agricultural sector aremostlyspecific to agriculture and the migration and shifting of agricultural resources to theindustrial sector are difficult and impose a large transaction cost including psycho-logical costs. Therefore, the wage rate is determined differently between agricultureand industry equalizing it to the marginal value productivity of labor in each sectoras follows:
Wa � Pa MLa (11.1)
Wm � Pm MLm (11.2)
where Wa and Wm are the agricultural and industrial wage rates, respectively. Paand Pm are the price of agricultural and industrial products, respectively. MLa andMLmrepresent the physicalmarginal productivity of agricultural and industrial labor,respectively.
As economic development progresses, the income disparity between the agricul-tural and industrial sectors expands, and it becomes a policy issue to keep this gap ata certain level. Therefore, in order to balance the wage rate in agriculture with thatin industrial sector at a certain level politically, the following relationship must besatisfied.
Wa∗ � k Wm (11.3)
where Wa* is a politically desirable level of the wage rate in agriculture and k is aparameter indicating how much the government intends to rectify the income dis-parity. Politicians expect to increase the number of votes cast by strengthening theprotection of agriculture, namely raising k, while it decreases the number of votescast by groups who oppose agricultural protection such as consumer groups. Thevalue of k is determined so as to equalize the marginal benefit and the marginal costfor politicians.
Themarginal benefit curve,MB, shifts upward because of the strengthening polit-ical power of the agricultural sector as the economy develops. The share of ruralpopulation in total population (SA) is an indicator that shows the political power ofthe agricultural sector. On the other hand, the marginal cost curve, MC, shifts down-ward owing to the rising social tolerance of agricultural protection. As an indicatorof the marginal cost, GDP divided by rural population (GA) is used. The variableGA needs to be explained as follows.
The marginal cost of increasing the level of agricultural protection for politiciansis themarginal loss of votes from consumers. As income goes up, consumers tend notto be conscious of food prices because the Engel coefficient decreases. Also, if the

11 Agricultural Market Intervention and Emerging States in Africa 265
share of farmers in total population declines, the total cost of protecting agriculture isreduced. Thus, consumers’ tolerance of agricultural protection is a function of GDPper capita and the share of farmers who are protected. The variable GA is introducedas a proxy to indicate consumers’ tolerance, which is GDP per rural populationcalculated by GDP per capita (GDP/N) multiplied by the reciprocal of the share ofrural population in total population (N/Na), where N is total population and Na isrural population.
Then, MR and MC are expressed as follows.
MB � f(k,SA) (11.4)
MC � g(k,GA) (11.5)
Since the value of k is determined at the point where MB and MC are equalizedin equilibrium, k is expressed by the exogenous variables SA and GA.
k � k(SA,GA) (11.6)
The domestic price is the international price PW multiplied by the nominalprotection coefficient (NPC), which is the nominal rate of protection (NRP, thedifference between domestic and foreign prices divided by foreign price) plus 1.Therefore, Eq. (11.1) becomes as follows.
Wa � NPC PWa MLa (11.7)
If the NRP is politically manipulated by politicians who try to correct the incomedisparity between the agricultural and industrial sectors, the nominal protection coef-ficient of the domestic agricultural products can be expressed as follows, usingEqs. (11.2), (11.3), (11.6) and (11.7).
NPC � NRP + 1 � k(SA,GA)
(PWa
Pm
)−1( MLa
MLm
)−1
(11.8)
The level of agricultural protection depends on the share of rural population (SA),the GDP per capita of rural population (GA), the terms of trade of agricultural prod-ucts to industrial products in international trade (PWa/Pm), assuming no distortionsin industrial sector, and the marginal productivity ratio of the agricultural sector tothe industrial sector (MLa/MLm).
An important fact is that as long as the marginal labor productivity gap betweenagriculture and industry is expanding, the level of agricultural protection needs tocontinue to rise to correct it. If economic growth accompanies industrialization andproductivity in industrial sector continues to rise, agricultural protectionwill continueto be strengthened. In other words, even if the agricultural protection level is kepthigh, the political objective cannot be achieved unless the protection level is raisedcontinuously. Agricultural protection has to grow under this mechanism.
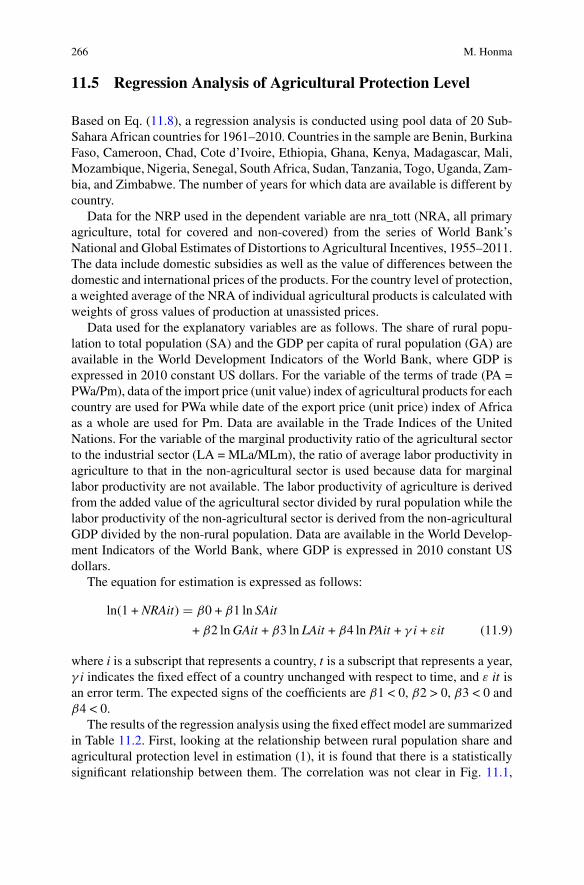
266 M. Honma
11.5 Regression Analysis of Agricultural Protection Level
Based on Eq. (11.8), a regression analysis is conducted using pool data of 20 Sub-Sahara African countries for 1961–2010. Countries in the sample are Benin, BurkinaFaso, Cameroon, Chad, Cote d’Ivoire, Ethiopia, Ghana, Kenya, Madagascar, Mali,Mozambique, Nigeria, Senegal, South Africa, Sudan, Tanzania, Togo, Uganda, Zam-bia, and Zimbabwe. The number of years for which data are available is different bycountry.
Data for the NRP used in the dependent variable are nra_tott (NRA, all primaryagriculture, total for covered and non-covered) from the series of World Bank’sNational and Global Estimates of Distortions to Agricultural Incentives, 1955–2011.The data include domestic subsidies as well as the value of differences between thedomestic and international prices of the products. For the country level of protection,a weighted average of the NRA of individual agricultural products is calculated withweights of gross values of production at unassisted prices.
Data used for the explanatory variables are as follows. The share of rural popu-lation to total population (SA) and the GDP per capita of rural population (GA) areavailable in the World Development Indicators of the World Bank, where GDP isexpressed in 2010 constant US dollars. For the variable of the terms of trade (PA =PWa/Pm), data of the import price (unit value) index of agricultural products for eachcountry are used for PWa while date of the export price (unit price) index of Africaas a whole are used for Pm. Data are available in the Trade Indices of the UnitedNations. For the variable of the marginal productivity ratio of the agricultural sectorto the industrial sector (LA = MLa/MLm), the ratio of average labor productivity inagriculture to that in the non-agricultural sector is used because data for marginallabor productivity are not available. The labor productivity of agriculture is derivedfrom the added value of the agricultural sector divided by rural population while thelabor productivity of the non-agricultural sector is derived from the non-agriculturalGDP divided by the non-rural population. Data are available in the World Develop-ment Indicators of the World Bank, where GDP is expressed in 2010 constant USdollars.
The equation for estimation is expressed as follows:
ln(1 + NRAit) � β0 + β1 ln SAit
+ β2 lnGAit + β3 ln LAit + β4 lnPAit + γ i + εit (11.9)
where i is a subscript that represents a country, t is a subscript that represents a year,γ i indicates the fixed effect of a country unchanged with respect to time, and ε it isan error term. The expected signs of the coefficients are β1 < 0, β2 > 0, β3 < 0 andβ4 < 0.
The results of the regression analysis using the fixed effect model are summarizedin Table 11.2. First, looking at the relationship between rural population share andagricultural protection level in estimation (1), it is found that there is a statisticallysignificant relationship between them. The correlation was not clear in Fig. 11.1,
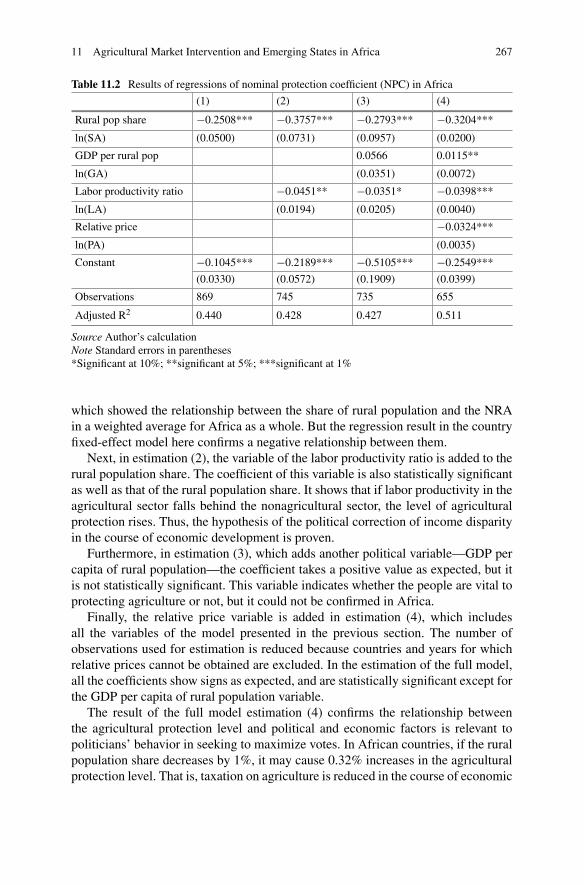
11 Agricultural Market Intervention and Emerging States in Africa 267
Table 11.2 Results of regressions of nominal protection coefficient (NPC) in Africa
(1) (2) (3) (4)
Rural pop share −0.2508*** −0.3757*** −0.2793*** −0.3204***
ln(SA) (0.0500) (0.0731) (0.0957) (0.0200)
GDP per rural pop 0.0566 0.0115**
ln(GA) (0.0351) (0.0072)
Labor productivity ratio −0.0451** −0.0351* −0.0398***
ln(LA) (0.0194) (0.0205) (0.0040)
Relative price −0.0324***
ln(PA) (0.0035)
Constant −0.1045*** −0.2189*** −0.5105*** −0.2549***
(0.0330) (0.0572) (0.1909) (0.0399)
Observations 869 745 735 655
Adjusted R2 0.440 0.428 0.427 0.511
Source Author’s calculationNote Standard errors in parentheses*Significant at 10%; **significant at 5%; ***significant at 1%
which showed the relationship between the share of rural population and the NRAin a weighted average for Africa as a whole. But the regression result in the countryfixed-effect model here confirms a negative relationship between them.
Next, in estimation (2), the variable of the labor productivity ratio is added to therural population share. The coefficient of this variable is also statistically significantas well as that of the rural population share. It shows that if labor productivity in theagricultural sector falls behind the nonagricultural sector, the level of agriculturalprotection rises. Thus, the hypothesis of the political correction of income disparityin the course of economic development is proven.
Furthermore, in estimation (3), which adds another political variable—GDP percapita of rural population—the coefficient takes a positive value as expected, but itis not statistically significant. This variable indicates whether the people are vital toprotecting agriculture or not, but it could not be confirmed in Africa.
Finally, the relative price variable is added in estimation (4), which includesall the variables of the model presented in the previous section. The number ofobservations used for estimation is reduced because countries and years for whichrelative prices cannot be obtained are excluded. In the estimation of the full model,all the coefficients show signs as expected, and are statistically significant except forthe GDP per capita of rural population variable.
The result of the full model estimation (4) confirms the relationship betweenthe agricultural protection level and political and economic factors is relevant topoliticians’ behavior in seeking to maximize votes. In African countries, if the ruralpopulation share decreases by 1%, it may cause 0.32% increases in the agriculturalprotection level. That is, taxation on agriculture is reduced in the course of economic
268 M. Honma
development. If the GDP per capita of the rural population increases by 1%, theprotection level may increase by 0.1%. However, this relationship is not statisticallysignificant. In other words, if other conditions are kept constant, it can be argued thatin Africa the economy is not growing sufficiently to become tolerant of agriculturalprotection. In other words, African consumers and governments have changed thelevel of agricultural taxation for other reasons.
An important variable in relation to economic development is the relative laborproductivity of agriculture. The source of economic development is often the growthin the industrial sector. The rapid growth of the industrial sector expands the disparityin labor productivity between agriculture and industry, resulting in income disparity.Although the value of the coefficient is small, the estimation result shows that theexpansion in this productivity gap lowered agricultural taxation and, as seen in recentyears, it turned into agricultural protection.
The variable of the relative price is also statistically significant, indicating that ifthe terms of trade become disadvantageous to agriculture, the agricultural protectionlevel rises slightly but clearly. However, in this estimation, the price of the industrialsector is represented by Africa’s total export unit value index. An analysis with datashowing more accurate terms of trade would be desirable.
There are a number of residual problems in the statistical estimations. First, theindependent variables of the estimated equations are not mutually independent. Theshare of rural population, GDP per capita of rural population, and relative laborproductivity are all indicators that show economic development and are related toeach other. Therefore, a problemofmultiple-collinearitymaybe involved.Changes inagricultural protection levels also affect the relative labor productivity of agricultureand even the rural population share. Therefore, the estimated results heremay containa simultaneous equation bias.
In the future, it would be desirable to analyze the levels of agricultural protectionin a general equilibrium framework together with growth in the non-agriculturalsector.
11.6 Conclusion
Research on agricultural protection has been very active and many studies havecontributed to clarification of the determinants of protection. Also, construction ofstatistical data sets including those of the World Bank made possible consistentcomparisons of levels agricultural protection and distortions internationally. Thischapter has benefited from the availability of data on agricultural protection levelsand has used the data to test the hypothesis called the “developmental paradox” inAfrica. A model to describe the “developmental paradox” has been proposed andtested by statistical estimations.
Rapid economic development makes the agricultural sector shrink, which maycause social and economic disorder in rural areas. It also becomes a factor encour-aging political unrest. Therefore, agricultural protection policies tend to be adopted
11 Agricultural Market Intervention and Emerging States in Africa 269
for the purpose of correcting income disparities between agriculture and industry.Indeed, the “developmental paradox” has been observed in Japan, Korea and Taiwanduring their rapid economic growth period (Honma and Hayami 1986, 2009).
It is somewhat challenging to apply thismodel toAfricawhere economic develop-ment is still underway. However, the logic of reducing taxation on agriculture is thesame as increasing agricultural protection. Further, it is meaningful to extract com-mon factors that determine agricultural policies taking into account the differencesin individual countries in a fixed effect model in Africa.
The “developmental paradox” is an empirical question and should be tested forthose countries that are in the course of economic development such as in Africa. Itis based on the behavior of politicians seeking to maximize votes. However, becauseof over-simplification, more complicated political and economic behaviors such asopposition parties’ actions and policy struggles are neglected in the model. Despitethe over-simplification, the statistical tests confirmed the significance of variablesderived from the model, which show common factors that determine the level ofagricultural protection among countries in Sub-Saharan Africa: the share of ruralpopulation, GDP per capita of rural population, relative labor productivity, and theterms of trade in international markets.
The government plays a major role in economic development. This chapter hasshown that agricultural taxation policy declines as economic development progressesand that evenAfrican countries have adopted agricultural protection policies.Africa’seconomic development may have been more advanced if agricultural taxation hadbeen eliminated earlier. If emerging countries in Africa had focused on improvinginfrastructure such as irrigation and drainage facilities and on investing in road andtransportation rather than on taxing agriculture in the early stage of development,they might have been able to achieve agriculture-based growth faster.
Today many African countries still continue to impose agricultural taxes whichneed to be eliminated as soon as possible. In addition, emerging countries in Africawhere further economic growth is expected in the future should not follow the experi-ence of emerging Asian countries, which mistakenly introduced agricultural protec-tion as an industrial adjustment policy to correct income disparity. Avoiding marketintervention and correcting distortions of farmer’s incentives are necessary evenif correcting income disparity is a political priority in Africa. So-called decoupledpolicies such as direct payments with public investment in agricultural infrastructureshould be introduced to promote agricultural growth.
270 M. Honma
References
Acemoglu, D., Johnson, S., & Robinson, J. A. (2001). The colonial origins of comparative devel-opment: An empirical investigation. American Economic Review, 91(5), 1369–1401.
Anderson,K. (Ed.). (2009).Distortions to agricultural incentives: A global perspective, 1955–2007.London/Washington, DC: Palgrave Macmillan/World Bank.
Anderson, K., Hayami, Y., et al. (1986). The political economy of agricultural protection: East Asiain international perspective. London and Boston: Allen and Unwin.
Anderson, K., &Masters, W. (Eds.). (2009).Distortions to agricultural incentives in Africa. Wash-ington, DC: World Bank.
Bates, R. H. (1989). Beyond the miracle of the market: The political economy of agrarian develop-ment in Rural Kenya. Cambridge and New York: Cambridge University Press.
Bates, R. H., & Block, S. (2010). Agricultural trade interventions in Africa (Chap. 12). In K.Anderson (Ed.), The political economy of agricultural price distortions. New York: CambridgeUniversity Press.
Block, S., & Bates, R. H. (2011). Political institutions and agricultural trade interventions in Africa.American Journal of Agricultural Economics, 93(2), 317–323.
De Gorter, H., & Swinnen, J. F. M. (2002). Political economy of agricultural policies. In B. Gardner& G. Rausser (Eds.), The handbook of agricultural economics (Vol. 2). Amsterdam: ElsevierScience.
Gardner, B. L. (1987). Causes of U.S. farm commodity programs. Journal of Political Economy,95(2), 290–310.
Grossman, G. M., & Helpman, E. (1994). Protection for sale. American Economic Review, 84(4),833–850.
Grossman, G.M., &Helpman, E. (2002). Interest groups and trade policy. Princeton, NJ: PrincetonUniversity Press.
Hoeffler, H. (2011). The political economy of agricultural policies in Africa: History, analyti-cal concepts and implications for development cooperation. Quarterly Journal of InternationalAgriculture, 50(1), 29–53.
Honma, M., & Hayami, Y. (1986). The determinants of agricultural protection levels: An econo-metric analysis (Chap. 4). In K. Anderson, Y. Hayami, et al. (Eds.), The political economy ofagricultural protection: East Asia in international perspective. London: Allen and Unwin.
Honma, M., & Hayami, Y. (2009). Japan, Republic Korea, and Taiwan, China (Chap. 2). In K.Anderson (Ed.), Distortions to agricultural incentives: A global perspective, 1955–2007. Lon-don/Washington, DC: Palgrave Macmillan/World Bank.
Krueger, A. O., Schiff, M., & Valdés, A. (1988). Agricultural incentives in developing countries:Measuring the effect of sectoral and economywide policies.World Bank Economic Review, 2(3),255–272.
Krueger, A. O., Schiff, M., & Valdés, A. (1991). The political economy of agricultural pricingpolicy. London: Johns Hopkins University Press for the World Bank.
Lindert, P. H. (1991). Historical patterns of agricultural policy. In C. Timmer (Ed.), Agriculture andthe state: Growth, employment, and poverty. Ithaca, NY: Cornell University Press.
Olson, M. (1965). The logic of collective action. New Haven: Yale University Press.Persson, T.,&Tabellini, G. E. (2000).Political economics: Explaining economic policy. Cambridge,MA: MIT Press.
Poulton, C. (2014). Democratisation and the political incentives for agricultural policy in Africa.Development Policy Review, 32(S2), s101–s122.
Shleifer, A. (1997). Government in transition. European Economic Review, 41(3–5), 385–410.Swinnen, J. F. M., Banerjee, A. N., & De Gorter, H. (2001). Economic development, institutionalchange, and the political economy of agricultural protection: An econometric study of Belgiumsince the 19th century. Agricultural Economics, 26(1), 25–43.
Tracy, M. (1989). Government and agriculture in Western Europe 1880–1988 (3rd ed.). New York:Harvester Wheatsheaf.
11 Agricultural Market Intervention and Emerging States in Africa 271
Open Access This chapter is licensed under the terms of the Creative Commons Attribution-NonCommercial-NoDerivatives 4.0 International License (http://creativecommons.org/licenses/by-nc-nd/4.0/), which permits any noncommercial use, sharing, distribution and reproduction in anymedium or format, as long as you give appropriate credit to the original author(s) and the source,provide a link to the Creative Commons licence and indicate if you modified the licensed material.You do not have permission under this licence to share adapted material derived from this chapteror parts of it.
The images or other third party material in this chapter are included in the chapter’s CreativeCommons licence, unless indicated otherwise in a credit line to the material. If material is notincluded in the chapter’s Creative Commons licence and your intended use is not permitted bystatutory regulation or exceeds the permitted use, you will need to obtain permission directly fromthe copyright holder.
Chapter 12Role of Community and Governmentin Irrigation Management in EmergingStates: Lessons from Japan, China,and India
Kei Kajisa
12.1 Introduction
Maintaining well-functioning irrigation systems is a crucial condition for sustain-able agricultural development, and many states have implemented different kinds ofpolicies for this aim. In the less-developed countries (LDCs), a conventional issuein this policy arena has been how to mobilize abundant local labor for successfulcollective management. From the academics, Ostrom’s group has made a signifi-cant contribution to this end by revealing and synthesizing the conditions for thesuccess, and then in the policy arena in the 1980s and 1990s, a boom of the com-munity participatory approach and the irrigation management transfer (to the localbodies) occurred. The international development society has realized that the use ofcommunity mechanism for local resource management is effective for labor surpluscountries at an early stage of development.
However, rather than abundant labor, a contemporary issue in the agricultural sec-tor among emerging states, is an increasing labor scarcity. These states have emergedin the global society with their success in labor-intensive industrialization in the areasof textiles, garments, and other light manufacturing. It is because of this success thatthe agricultural sector has been experiencing labor scarcity. Recent globalization hasbeen accelerating this process by providing rural people with lucrative job opportu-nities overseas. Facing this trend, an appropriate direction of change in agriculturalsector is the substitution of capital for labor. However, as we will explain later, thesubstitution process entails externalities in a very complicated manner. Therefore,under such a circumstance, the role of the government increases. Understanding therole the government for the achievement of a necessary substitution for sustainable,equitable, and efficient water use is an important contemporary issue of irrigationpolicies in the emerging states.
K. Kajisa (B)Aoyama Gakuin University, 4-4-25 Shibuya, Shibuya-Ku, Tokyo, Japane-mail: [email protected]
© The Author(s) 2019K. Otsuka and K. Sugihara (eds.), Paths to the Emerging State in Asia and Africa,Emerging-Economy State and International Policy Studies,https://doi.org/10.1007/978-981-13-3131-2_12
273
274 K. Kajisa
Two unique features of the emerging states make the policy issue more com-plicated than the time when the current DCs had dealt with their increasing laborscarcity. First, groundwater irrigation with private wells and pumps has been becom-ing rampant. The reduction in the cost of pumps and the excavation of wells haveaccelerated the exit of farmers from traditional irrigation systems, resulting in a fasterincrease in labor scarcity in traditional water management. Moreover, the privateuse of groundwater by individuals entails negative externalities to the neighboringusers who share the groundwater aquifer and thus tends to create the problem of“the tragedy of commons.” Therefore, an environmental issue comes into the policyarena more seriously than before.
Second, by a recommendation from international organizations or on its owninitiatives, some LDCs have introduced volumetric irrigation water pricing withthe aim of achieving water savings in their surface irrigation systems. Charginghigh prices on surface irrigation water may eventually induce farmers to switch toalternative sources for irrigation, which is another form of exit from the traditionalirrigation systems. Besides, the implementation of volumetric pricing needs moresophisticated or more capital-intensive irrigation systems as it requires water volumemeasurement and on-demand water volume control, more or less similar to domesticwater systems. Hence, under volumetric pricing system, both labor shortage and thenecessity for substituting capital for labor may increase.
Another important point is that we must explicitly incorporate the framework ofpolitical economy. Many studies have shown that governments tend to raise agricul-tural protection in the course of economic development, and the level of protectiontends to become excessive. As discussed by Honma in Chapter 10, this is closelyrelated with rent-seeking activities from a shrinking farm sector. Hence, we mustexplicitly take into account the possibility of protectionism and the government fail-ure as a side effect when the role of the government becomes more important.
In summary, the contemporary issues in irrigation policies of the emerging statesare characterized as the achievement of smooth substitution of capital for labor andthe achievement of optimal groundwater use under the existence of different kindsof externalities as well as under the pressure of protectionism. The aim of this articleis to examine what is the optimal role of the government and what kind of policiesare appropriate for the emerging states, using examples of rapidly industrializedor industrializing countries, namely, Japan, China, and India. First, using Japan as aforerunner, we summarize the historical experiences of Japan’s irrigation policies andshow their pros and cons. Then, using Japan’s experience as a benchmark,we evaluaterecent policies in China and in India, relying on the case studies of a particular placein each country, namely, Hubei in China and Tamil Nadu in India. Note that Japan’sexperience does not sufficiently cover the groundwater issue aswell as the experimentof volumetric water pricing. We discuss these issues when we analyze the cases ofChina and India for the sake of obtaining useful lessons for other emerging states.Note, however, that as we rely on the cases of a particular place, we had better refrainfrom generalizing the lessons excessively.
The rest of the paper is as follows. Section 12.2 shows data on the increasinglabor scarcity of our study countries. Section 12.3 explains key concepts such as
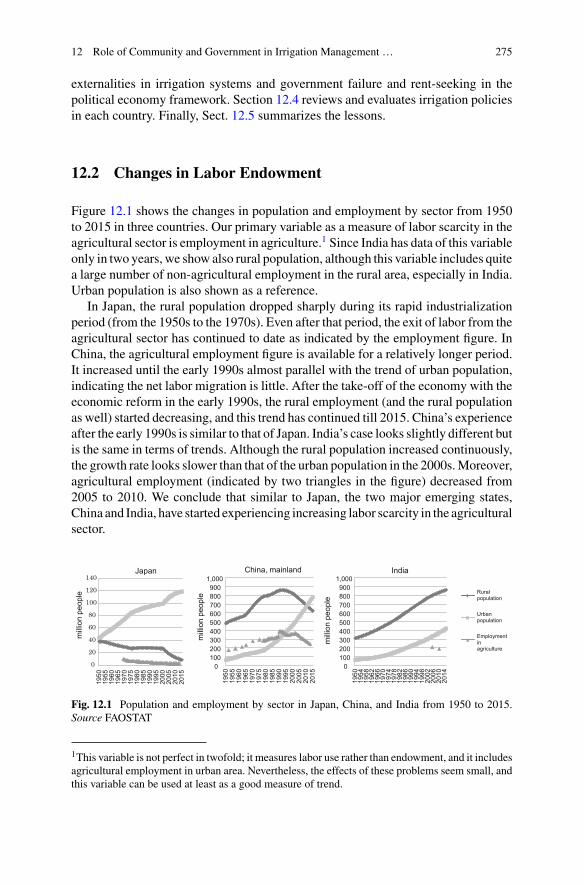
12 Role of Community and Government in Irrigation Management … 275
externalities in irrigation systems and government failure and rent-seeking in thepolitical economy framework. Section 12.4 reviews and evaluates irrigation policiesin each country. Finally, Sect. 12.5 summarizes the lessons.
12.2 Changes in Labor Endowment
Figure 12.1 shows the changes in population and employment by sector from 1950to 2015 in three countries. Our primary variable as a measure of labor scarcity in theagricultural sector is employment in agriculture.1 Since India has data of this variableonly in two years, we show also rural population, although this variable includes quitea large number of non-agricultural employment in the rural area, especially in India.Urban population is also shown as a reference.
In Japan, the rural population dropped sharply during its rapid industrializationperiod (from the 1950s to the 1970s). Even after that period, the exit of labor from theagricultural sector has continued to date as indicated by the employment figure. InChina, the agricultural employment figure is available for a relatively longer period.It increased until the early 1990s almost parallel with the trend of urban population,indicating the net labor migration is little. After the take-off of the economy with theeconomic reform in the early 1990s, the rural employment (and the rural populationas well) started decreasing, and this trend has continued till 2015. China’s experienceafter the early 1990s is similar to that of Japan. India’s case looks slightly different butis the same in terms of trends. Although the rural population increased continuously,the growth rate looks slower than that of the urban population in the 2000s.Moreover,agricultural employment (indicated by two triangles in the figure) decreased from2005 to 2010. We conclude that similar to Japan, the two major emerging states,China and India, have started experiencing increasing labor scarcity in the agriculturalsector.
0 20 40 60 80
100 120 140
1950
19
5519
6019
6519
7019
7519
8019
8519
9019
9520
0020
0520
1020
15
milli
on p
eopl
e
Japan
0 100 200 300 400 500 600 700 800 900
1,000
1950
1955
1960
1965
1970
1975
1980
1985
19
9019
9520
0020
0520
1020
15
milli
on p
eopl
e
China, mainland
0 100 200 300 400 500 600 700 800 900
1,000
1950
1954
1958
1962
1966
1970
1974
1978
1982
1986
1990
1994
1998
2002
2006
2010
2014
milli
on p
eopl
e
India
Rural population
Urban population
Employment in agriculture
Fig. 12.1 Population and employment by sector in Japan, China, and India from 1950 to 2015.Source FAOSTAT
1This variable is not perfect in twofold; it measures labor use rather than endowment, and it includesagricultural employment in urban area. Nevertheless, the effects of these problems seem small, andthis variable can be used at least as a good measure of trend.
276 K. Kajisa
12.3 Key Concepts
This section explains four key concepts used in the following case studies: (1) exter-nalities in surface irrigation systems, (2) externalities in non-agricultural sector, (3)externalities in ground water irrigation systems, and (4) government failures in agri-cultural policies.
Externalities in surface irrigation systems is related with technological indivisi-bility and collective management of the systems, and they are further divided intotwo aspects: (a) those related with maintenance of irrigation facilities and (b) thoserelated with allocation of irrigation water. We explain the maintenance aspect first.Once a system is installed to supply water to cover a certain command area, it cannotshrink its supply capacity according to the reduction of the number of users. This isbecause such systems need to maintain a certain water pressure and a certain waterlevel in order to supply water to the tail-end users. If one user, for example in themidstream, becomes reluctant to fully provide his/her maintenance work or evencompletely exits from the irrigation system, the remaining users have to shoulderthe exiting farmer’s maintenance costs to maintain the capacity; this is a negativeexternality of the exit on themaintenance aspect. Regarding the allocation aspect, theexit of a farmer makes the continuity of irrigation water use along the canal broken.After the exits of some farmers from the irrigation system, the users’ plots becomesegmented from each other, which makes coordination and supervision of allocationamong remaining water users more difficult. Although Olson (1965) predicts that thesmaller group can make collective action more effectively, such a mechanism maynot work in the context of irrigation management if the cost of the former (i.e., coor-dination difficulty due to scattered plots) is greater than the benefit of the latter (i.e.,effective communication in the smaller group). In this manner, the negative external-ities are likely to arise on both the maintenance and allocation aspects in the processof farmers’ exit from the system, and, thus, the involvement of the government iscalled for.
The second type of externalities emerge when irrigation water provides non-agricultural benefits, such as drainage services for residences, fire prevention, envi-ronmental amenities, and the recharging of groundwater aquifers. Theoretically, theseexternalities can be internalized by ensuring all beneficiaries are involved in irriga-tion management. Practically, however, the non-agricultural benefits are so thinlyand so widely spread that it is difficult to get all involved. It should be noted thatsuch kinds of externalities also increase with economic development as the numbersof non-agricultural residents increase in rural areas and as groundwater irrigationsystems becomes popular.
Because of the existence of these externalities, the private incentives for irrigationinvestment and management tend to be smaller than the socially optimal level. Thisproblem becomes more serious as industrialization progresses. In the context ofsurface irrigation management, as labor scarcity increases, the substitution of capitalfor labor must proceed. However, the necessary investment may not reach to thesocially optimal level. The role of government can be observed in supporting capital
12 Role of Community and Government in Irrigation Management … 277
investment in irrigation systems or the modernization of such systems to correct thisfailure.
Now wemove to the case of externalities in groundwater. The over-disseminationof wells and overexploitation of groundwater is commonly observed. This is indeed atypical case of “the tragedy of the commons.” The use of groundwater by some indi-vidual entails negative externalities for otherswho share a groundwater aquifer.With-out sufficient groundwater recharge, the groundwater will eventually be depleted.Furthermore, in many developing countries, governments use groundwater develop-ment as a tool for rural development. Support for such development by the govern-ment will make the depletion process more rapid. Regulations or interventions areneeded to control for these negative externalities.
Finally, let us discuss government failures. For a clearer understanding of theformation of irrigation policies, it is important to distinguish between two kindsof government failures. The first can occur when asymmetric information existsbetween the government and the users. The government may fail to provide appro-priate support if it cannot precisely estimate the demand for water by the farmers.A possible solution is to get the farmers involved in the project design, which iswell-known as a participatory development approach. However, it seems that theuse of this solution becomes increasingly difficult for emerging states when supportfrom the government increases and the projects are handled by bureaucrats and tech-nocrats of the irrigation authorities who are usually public servants, rather than localfarmers. This may be particularly so when the form of support is financial ratherthan technical, because an increase in financial support makes the implementationof irrigation projects similar to the provision of pure public goods.
Another type of government failure is related to the political economy. This prob-lem occurs in a way that the government, expecting votes, tends to provide publicgoods in favor of a particular group of people. As many studies argue, this frame-work can convincingly explain why agricultural protection rises in many countrieswhen the comparative advantage of the agricultural sector declines and politicalpressure from the farmers’ group increases. In the context of irrigation policies, thegovernment may use support for irrigation as ameans of protection, resulting in over-investment in irrigation facilities, pumps, and wells. Note that agricultural protectioncan be implemented by many means, such as output price support, input subsidies,income support, and trade regulation. One may argue that support for irrigation isbetter than price support as the former increases productivity while the latter spoilsproductivity improvement incentives. Nevertheless, even the irrigation support mustbe the one which increases labor productivity because the factor getting scarce islabor.
In summary, through experiencing an increase in labor scarcity and/or the devel-opment of groundwater irrigation under conditions of rapid industrialization andglobalization, the level of different kinds of externalities increases, and thus the needfor government interventions increases. Accordingly, the possibility of governmentfailures also increases. Because of such failures, the level of interventions couldeither be too great or too little with a different combination of policies. The govern-ment must achieve an appropriate level of intervention to facilitate the substitution of
278 K. Kajisa
capital for labor as the resource endowment of the economy changes. This is difficultbut crucially important for sustainable development. In the following section, wereview how Japan, China, and India have dealt with these issues.
12.4 Case Studies
12.4.1 Japan’s Irrigation Policies Since the Late 19th Century
This section provides a historical review of Japan’s irrigation policies since the late19th century.We divide our review into three periods based on the attitude of the gov-ernment: (1) community-based management (1880s–1910s), (2) increasing financialsupport by the government (1920s–1950s), and (3) financial takeover and modern-ization by the government (1960s–2010s).
Community-based management (1880s–1910s) The origin of water manage-ment institutions in which we can find the roots of current systems dates back to the18th century, the mid-Edo period, when the rapid development of new paddy fieldsincreased water demand (Tamaki et al. 1984). Traditionally, irrigation infrastructureswere managed by local communities, with some exceptional cases of vast irrigationsystems which received supports from local or national authorities (Tamaki andHatate 1974). After theMeiji Restoration, the government replaced old systems withmodern ones, in many respects to “catch up” with the Western world. Exceptionally,however, regarding water institutions, the government approved traditional waterrights in the River Act (Kasen-hou) of 1886 and allowed traditional communities tohandle the management. In addition, the Irrigation Association Code (Suiri-kumiai-zyourei) of 1890 stipulated that irrigation development projects must be financed byprivate sources (Tamaki et al. 1984).2 The local leaders, usually large landlords inthe rural area, bore the financial burden, and put their efforts into mobilizing localresources for the development and management of irrigation facilities to improvethe social welfare of their local communities. In this regard, we may claim that thegovernment left the role of irrigation development andmanagement to the local com-munities, and that the local landlords behaved as if they were the local government.The local landlords had incentive to do so not only because they accepted the bur-den as a local leader and tried to maintain their social status but also because theimprovement of land productivity in the entire community could increase the landrent from their tenants. This division of work functioned well when the financial andmanpower capacity of the government was limited. Figure 12.2 shows the proportionof financial support for such land improvement projects (mainly irrigation develop-
2Meanwhile, it was stipulated that projects related to public rivers were publicly financed.
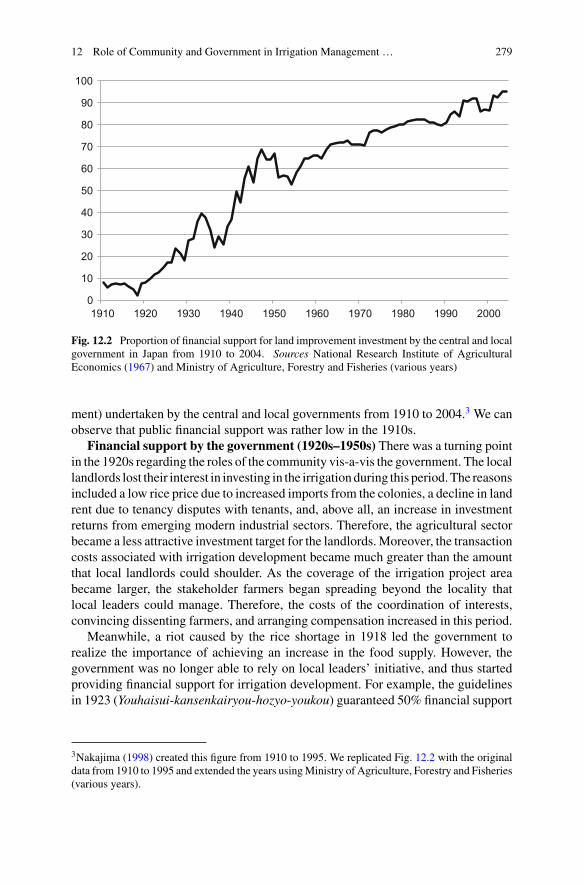
12 Role of Community and Government in Irrigation Management … 279
0
10
20
30
40
50
60
70
80
90
100
1910 1920 1930 1940 1950 1960 1970 1980 1990 2000
Fig. 12.2 Proportion of financial support for land improvement investment by the central and localgovernment in Japan from 1910 to 2004. Sources National Research Institute of AgriculturalEconomics (1967) and Ministry of Agriculture, Forestry and Fisheries (various years)
ment) undertaken by the central and local governments from 1910 to 2004.3 We canobserve that public financial support was rather low in the 1910s.
Financial support by the government (1920s–1950s) There was a turning pointin the 1920s regarding the roles of the community vis-a-vis the government. The locallandlords lost their interest in investing in the irrigationduring this period.The reasonsincluded a low rice price due to increased imports from the colonies, a decline in landrent due to tenancy disputes with tenants, and, above all, an increase in investmentreturns from emerging modern industrial sectors. Therefore, the agricultural sectorbecame a less attractive investment target for the landlords.Moreover, the transactioncosts associated with irrigation development became much greater than the amountthat local landlords could shoulder. As the coverage of the irrigation project areabecame larger, the stakeholder farmers began spreading beyond the locality thatlocal leaders could manage. Therefore, the costs of the coordination of interests,convincing dissenting farmers, and arranging compensation increased in this period.
Meanwhile, a riot caused by the rice shortage in 1918 led the government torealize the importance of achieving an increase in the food supply. However, thegovernment was no longer able to rely on local leaders’ initiative, and thus startedproviding financial support for irrigation development. For example, the guidelinesin 1923 (Youhaisui-kansenkairyou-hozyo-youkou) guaranteed 50% financial support
3Nakajima (1998) created this figure from 1910 to 1995. We replicated Fig. 12.2 with the originaldata from 1910 to 1995 and extended the years usingMinistry of Agriculture, Forestry and Fisheries(various years).
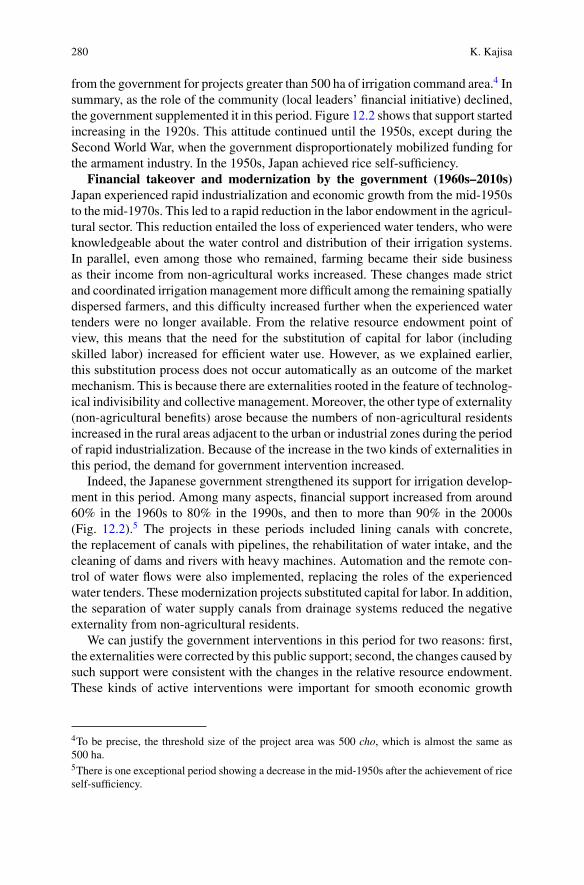
280 K. Kajisa
from the government for projects greater than 500 ha of irrigation command area.4 Insummary, as the role of the community (local leaders’ financial initiative) declined,the government supplemented it in this period. Figure 12.2 shows that support startedincreasing in the 1920s. This attitude continued until the 1950s, except during theSecond World War, when the government disproportionately mobilized funding forthe armament industry. In the 1950s, Japan achieved rice self-sufficiency.
Financial takeover and modernization by the government (1960s–2010s)Japan experienced rapid industrialization and economic growth from the mid-1950sto the mid-1970s. This led to a rapid reduction in the labor endowment in the agricul-tural sector. This reduction entailed the loss of experienced water tenders, who wereknowledgeable about the water control and distribution of their irrigation systems.In parallel, even among those who remained, farming became their side businessas their income from non-agricultural works increased. These changes made strictand coordinated irrigation management more difficult among the remaining spatiallydispersed farmers, and this difficulty increased further when the experienced watertenders were no longer available. From the relative resource endowment point ofview, this means that the need for the substitution of capital for labor (includingskilled labor) increased for efficient water use. However, as we explained earlier,this substitution process does not occur automatically as an outcome of the marketmechanism. This is because there are externalities rooted in the feature of technolog-ical indivisibility and collective management. Moreover, the other type of externality(non-agricultural benefits) arose because the numbers of non-agricultural residentsincreased in the rural areas adjacent to the urban or industrial zones during the periodof rapid industrialization. Because of the increase in the two kinds of externalities inthis period, the demand for government intervention increased.
Indeed, the Japanese government strengthened its support for irrigation develop-ment in this period. Among many aspects, financial support increased from around60% in the 1960s to 80% in the 1990s, and then to more than 90% in the 2000s(Fig. 12.2).5 The projects in these periods included lining canals with concrete,the replacement of canals with pipelines, the rehabilitation of water intake, and thecleaning of dams and rivers with heavy machines. Automation and the remote con-trol of water flows were also implemented, replacing the roles of the experiencedwater tenders. These modernization projects substituted capital for labor. In addition,the separation of water supply canals from drainage systems reduced the negativeexternality from non-agricultural residents.
We can justify the government interventions in this period for two reasons: first,the externalities were corrected by this public support; second, the changes caused bysuch support were consistent with the changes in the relative resource endowment.These kinds of active interventions were important for smooth economic growth
4To be precise, the threshold size of the project area was 500 cho, which is almost the same as500 ha.5There is one exceptional period showing a decrease in the mid-1950s after the achievement of riceself-sufficiency.
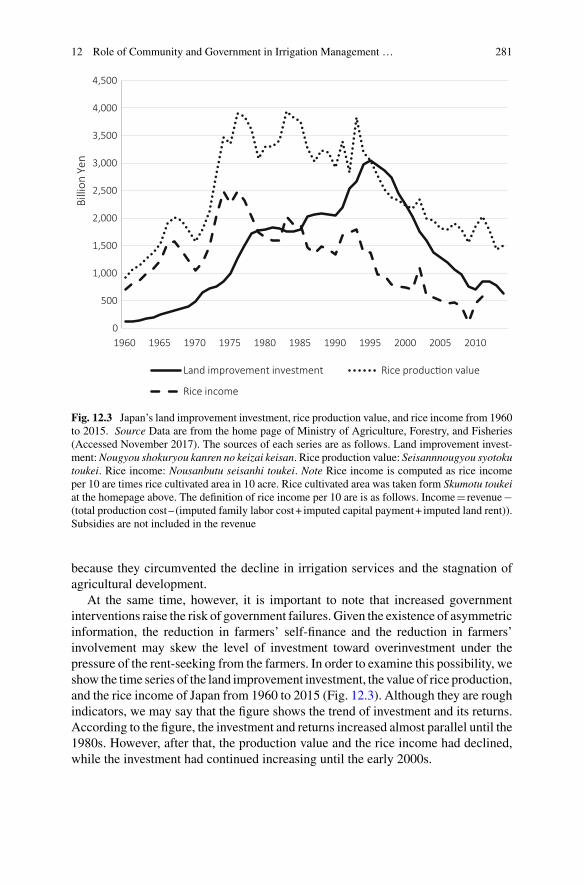
12 Role of Community and Government in Irrigation Management … 281
0
500
1,000
1,500
2,000
2,500
3,000
3,500
4,000
4,500
1960 1965 1970 1975 1980 1985 1990 1995 2000 2005 2010
Billi
on Y
en
Land improvement investment Rice produc on value
Rice income
Fig. 12.3 Japan’s land improvement investment, rice production value, and rice income from 1960to 2015. Source Data are from the home page of Ministry of Agriculture, Forestry, and Fisheries(Accessed November 2017). The sources of each series are as follows. Land improvement invest-ment:Nougyou shokuryou kanren no keizai keisan. Rice production value: Seisannnougyou syotokutoukei. Rice income: Nousanbutu seisanhi toukei. Note Rice income is computed as rice incomeper 10 are times rice cultivated area in 10 acre. Rice cultivated area was taken form Skumotu toukeiat the homepage above. The definition of rice income per 10 are is as follows. Income� revenue−(total production cost – (imputed family labor cost+ imputed capital payment+ imputed land rent)).Subsidies are not included in the revenue
because they circumvented the decline in irrigation services and the stagnation ofagricultural development.
At the same time, however, it is important to note that increased governmentinterventions raise the risk of government failures. Given the existence of asymmetricinformation, the reduction in farmers’ self-finance and the reduction in farmers’involvement may skew the level of investment toward overinvestment under thepressure of the rent-seeking from the farmers. In order to examine this possibility, weshow the time series of the land improvement investment, the value of rice production,and the rice income of Japan from 1960 to 2015 (Fig. 12.3). Although they are roughindicators, we may say that the figure shows the trend of investment and its returns.According to the figure, the investment and returns increased almost parallel until the1980s. However, after that, the production value and the rice income had declined,while the investment had continued increasing until the early 2000s.
282 K. Kajisa
Major reasons for the decline in the production value from the 1980s to the early2000s were the double effects of the drop in the rice procurement price and the reduc-tion in the quantity of rice production.6 Even under such an adverse environment, ifthe cost for production were reduced and thus the profitability improved, the incomewould not decline this much. However, in reality, the cost was merely reduced,resulting in a sharp decline in rice income as shown in the figure.7 It seemed that theinvestment did not contribute much to the improvement of rice sector profitabilityin this period. Note that the financial support by the government in the same periodincreased from70 to 90% (Fig. 12.2).Moreover, since the 1970s the investment targethad changed from the modernization of irrigation infrastructure to the improvementof individual farmers’ paddy fields, where the new target can be regarded as a pri-vate property with much smaller externalities than irrigation infrastructure. In thisregard, we may claim that there was overinvestment to the less justifiable target bythe government.
After the 2000s, the land improvement investment had declined. Note, however,that the income subsidies to the farmers (data are not shown in the figure), which haveless incentive for productivity improvement than the support for land improvement,has been maintained (as of 2017) as a major mean to support the agricultural sector.In summary, Japan’s experience teaches us that under increasing labor scarcity inagriculture, it is important to provide public support for the substitution of capital forlabor and, at the same time, to introduce an appropriate mechanism that can suppressthe tendency for overinvestment under the trend of agricultural protectionism.
12.4.2 The Case of a Surface Gravity Irrigation Schemein Hubei, China8
Facing a rapid increase in water demand for urban and industrial use, China aimedto achieve water savings in the agricultural sector, particularly in paddy farmingas this was considered the largest water consumer. The major effort to promote
6We set the comparison period from 1986 to 2003; the beginning year is the year of the record-highprice and the ending year is the year the government stopped the rice procurement policy. In thisperiod, the price dropped 26% from 18,505 (yen/60 kg) to 13,748 (yen/60 kg), and the productionquantity was reduced 21% from 11,035 (1000t) to 8,698 (1000t) in the same period, resulting ina 38% reduction in the production value. The reduction of production quantity was mainly dueto the enforcement of the policy of reducing rice cultivated area. (Price data are from Shokuryotoukei nenpou, production quantity data are from Seisannnougyou syotoku toukei. Production valuedata are from Seisannnougyou syotoku toukei. All are taken from the homepage of the Ministry ofAgriculture, Forestry and Fisheries)7The average cost of production was reduced by 2% from 15,312 (yen/60 kg of rice) to 14,963(yen/60 kg of rice) from 1986 to 2003, while the price was reduced by 26% from 18,505 (yen/60 kg)to 13,748 (yen/60 kg) in the same period. The total rice income declined by 41%. (Price data arefrom Shokuryo toukei nenpou, production cost data are from Nousanbutu seisanhi toukei. All aretaken from the homepage of the Ministry of Agriculture, Forestry and Fisheries)8This section draws heavily on Kajisa and Dong (2017).
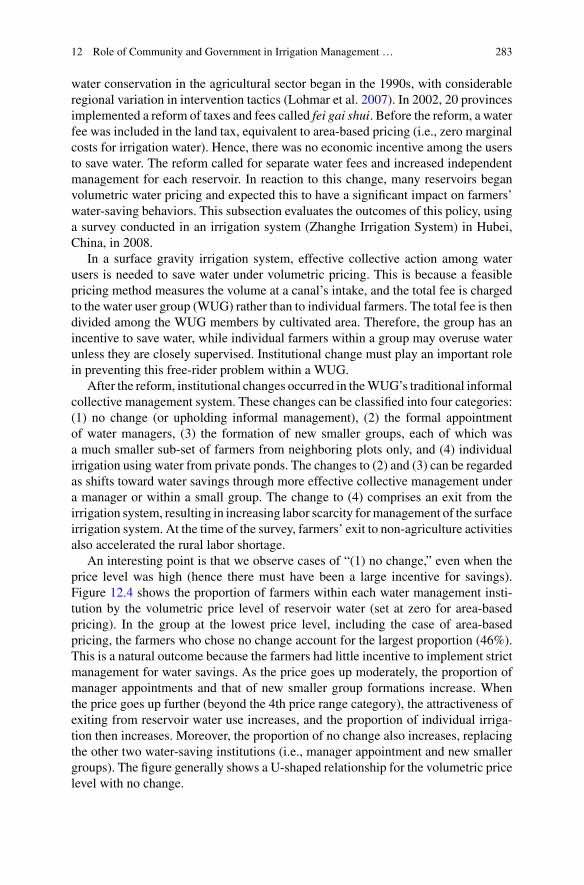
12 Role of Community and Government in Irrigation Management … 283
water conservation in the agricultural sector began in the 1990s, with considerableregional variation in intervention tactics (Lohmar et al. 2007). In 2002, 20 provincesimplemented a reform of taxes and fees called fei gai shui. Before the reform, a waterfee was included in the land tax, equivalent to area-based pricing (i.e., zero marginalcosts for irrigation water). Hence, there was no economic incentive among the usersto save water. The reform called for separate water fees and increased independentmanagement for each reservoir. In reaction to this change, many reservoirs beganvolumetric water pricing and expected this to have a significant impact on farmers’water-saving behaviors. This subsection evaluates the outcomes of this policy, usinga survey conducted in an irrigation system (Zhanghe Irrigation System) in Hubei,China, in 2008.
In a surface gravity irrigation system, effective collective action among waterusers is needed to save water under volumetric pricing. This is because a feasiblepricing method measures the volume at a canal’s intake, and the total fee is chargedto the water user group (WUG) rather than to individual farmers. The total fee is thendivided among the WUG members by cultivated area. Therefore, the group has anincentive to save water, while individual farmers within a group may overuse waterunless they are closely supervised. Institutional change must play an important rolein preventing this free-rider problem within a WUG.
After the reform, institutional changes occurred in theWUG’s traditional informalcollective management system. These changes can be classified into four categories:(1) no change (or upholding informal management), (2) the formal appointmentof water managers, (3) the formation of new smaller groups, each of which wasa much smaller sub-set of farmers from neighboring plots only, and (4) individualirrigation using water from private ponds. The changes to (2) and (3) can be regardedas shifts toward water savings through more effective collective management undera manager or within a small group. The change to (4) comprises an exit from theirrigation system, resulting in increasing labor scarcity formanagement of the surfaceirrigation system. At the time of the survey, farmers’ exit to non-agriculture activitiesalso accelerated the rural labor shortage.
An interesting point is that we observe cases of “(1) no change,” even when theprice level was high (hence there must have been a large incentive for savings).Figure 12.4 shows the proportion of farmers within each water management insti-tution by the volumetric price level of reservoir water (set at zero for area-basedpricing). In the group at the lowest price level, including the case of area-basedpricing, the farmers who chose no change account for the largest proportion (46%).This is a natural outcome because the farmers had little incentive to implement strictmanagement for water savings. As the price goes up moderately, the proportion ofmanager appointments and that of new smaller group formations increase. Whenthe price goes up further (beyond the 4th price range category), the attractiveness ofexiting from reservoir water use increases, and the proportion of individual irriga-tion then increases. Moreover, the proportion of no change also increases, replacingthe other two water-saving institutions (i.e., manager appointment and new smallergroups). The figure generally shows a U-shaped relationship for the volumetric pricelevel with no change.
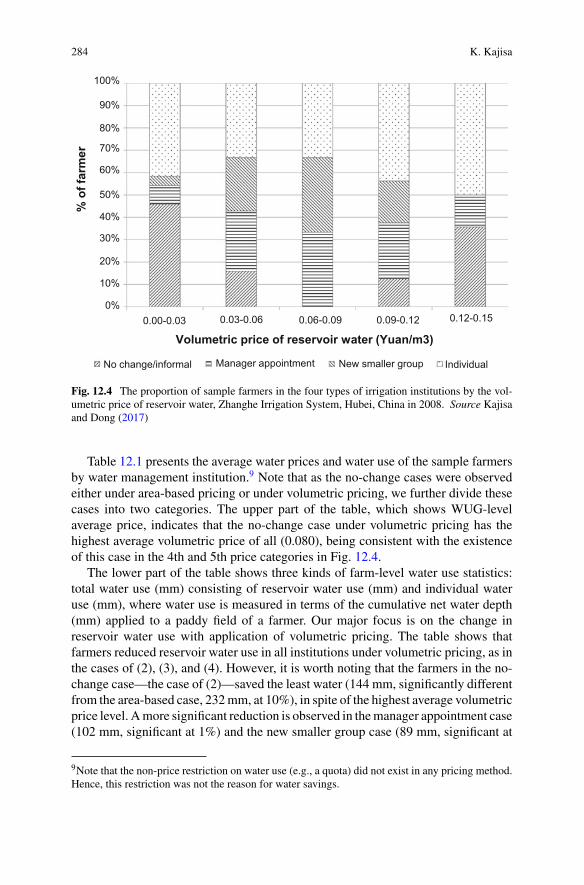
284 K. Kajisa
0%
10%
20%
30%
40%
50%
60%
70%
80%
90%
100%
0.00-0.03 0.03-0.06 0.06-0.09 0.09-0.12 0.12-0.15
% o
f far
mer
Volumetric price of reservoir water (Yuan/m3)
No change/informal Manager appointment New smaller group Individual
Fig. 12.4 The proportion of sample farmers in the four types of irrigation institutions by the vol-umetric price of reservoir water, Zhanghe Irrigation System, Hubei, China in 2008. Source Kajisaand Dong (2017)
Table 12.1 presents the average water prices and water use of the sample farmersby water management institution.9 Note that as the no-change cases were observedeither under area-based pricing or under volumetric pricing, we further divide thesecases into two categories. The upper part of the table, which shows WUG-levelaverage price, indicates that the no-change case under volumetric pricing has thehighest average volumetric price of all (0.080), being consistent with the existenceof this case in the 4th and 5th price categories in Fig. 12.4.
The lower part of the table shows three kinds of farm-level water use statistics:total water use (mm) consisting of reservoir water use (mm) and individual wateruse (mm), where water use is measured in terms of the cumulative net water depth(mm) applied to a paddy field of a farmer. Our major focus is on the change inreservoir water use with application of volumetric pricing. The table shows thatfarmers reduced reservoir water use in all institutions under volumetric pricing, as inthe cases of (2), (3), and (4). However, it is worth noting that the farmers in the no-change case—the case of (2)—saved the least water (144 mm, significantly differentfrom the area-based case, 232mm, at 10%), in spite of the highest average volumetricprice level. Amore significant reduction is observed in themanager appointment case(102 mm, significant at 1%) and the new smaller group case (89 mm, significant at
9Note that the non-price restriction on water use (e.g., a quota) did not exist in any pricing method.Hence, this restriction was not the reason for water savings.
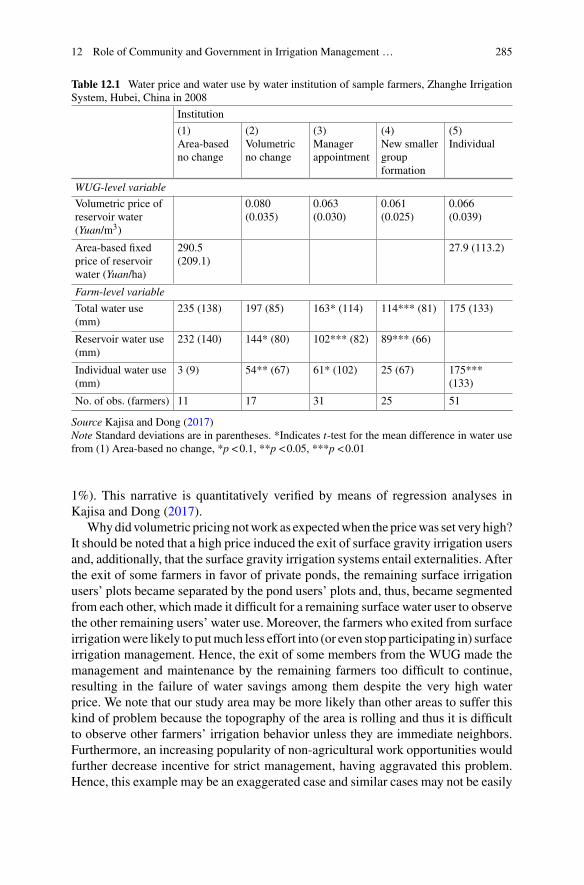
12 Role of Community and Government in Irrigation Management … 285
Table 12.1 Water price and water use by water institution of sample farmers, Zhanghe IrrigationSystem, Hubei, China in 2008
Institution
(1)Area-basedno change
(2)Volumetricno change
(3)Managerappointment
(4)New smallergroupformation
(5)Individual
WUG-level variable
Volumetric price ofreservoir water(Yuan/m3)
0.080(0.035)
0.063(0.030)
0.061(0.025)
0.066(0.039)
Area-based fixedprice of reservoirwater (Yuan/ha)
290.5(209.1)
27.9 (113.2)
Farm-level variable
Total water use(mm)
235 (138) 197 (85) 163* (114) 114*** (81) 175 (133)
Reservoir water use(mm)
232 (140) 144* (80) 102*** (82) 89*** (66)
Individual water use(mm)
3 (9) 54** (67) 61* (102) 25 (67) 175***(133)
No. of obs. (farmers) 11 17 31 25 51
Source Kajisa and Dong (2017)Note Standard deviations are in parentheses. *Indicates t-test for the mean difference in water usefrom (1) Area-based no change, *p <0.1, **p <0.05, ***p <0.01
1%). This narrative is quantitatively verified by means of regression analyses inKajisa and Dong (2017).
Whydid volumetric pricingnotwork as expectedwhen the pricewas set very high?It should be noted that a high price induced the exit of surface gravity irrigation usersand, additionally, that the surface gravity irrigation systems entail externalities. Afterthe exit of some farmers in favor of private ponds, the remaining surface irrigationusers’ plots became separated by the pond users’ plots and, thus, became segmentedfrom each other, which made it difficult for a remaining surface water user to observethe other remaining users’ water use. Moreover, the farmers who exited from surfaceirrigationwere likely to putmuch less effort into (or even stop participating in) surfaceirrigation management. Hence, the exit of some members from the WUG made themanagement and maintenance by the remaining farmers too difficult to continue,resulting in the failure of water savings among them despite the very high waterprice. We note that our study area may be more likely than other areas to suffer thiskind of problem because the topography of the area is rolling and thus it is difficultto observe other farmers’ irrigation behavior unless they are immediate neighbors.Furthermore, an increasing popularity of non-agricultural work opportunities wouldfurther decrease incentive for strict management, having aggravated this problem.Hence, this example may be an exaggerated case and similar cases may not be easily
286 K. Kajisa
found in other areas. Nevertheless, the basic logic may be applicable to other areas asone of the reasons for declining collective management. Indeed, this case is similarto Japan’s experience during its rapid industrialization, in which the exit of full-timefarmers resulted in the decline of collective management.
What are the lessons from China’s case? It implies that volumetric pricing is aneffective method for water savings but needs a careful implementation because watersavings failed when strict management became difficult under labor shortage (due toexit to private ponds in this case). Based on Japan’s experience, we suggest that theauthority may support the substitution of capital for labor, so that the system can bemanaged properly with fewer users. A possible option is to support investments incanals and water control devices to make water flow more visible (and thus measur-able) and controllable (ideally, the system should be something similar to a domesticwater system). To enhance the effect of this investment, reshaping of paddy fieldsinto a more regular shape would be effective. Currently, Chinese farmers own severalsmall parcels over scattered areas. The creation of a few larger parcels through merg-ing and exchanging with others also makes water management easier. This is indeedwhat Japan did in its rapid industrialization period. Another lesson from Japan is thatChina seems to already be in the stage of rising agricultural protection and now theymay have to be cautious about over-investment in such facilities.
12.4.3 The Case of Tank Irrigation Systems in Tamil Nadu,India10
Traditional irrigation systems in Tamil Nadu are tank systems, which consist ofa water storage area (a tank), sluices, and canals. This communal infrastructurehas collectively been managed by informal local bodies. Farmers use this irrigationwater mainly for rice (the staple food of the area), as well as for cotton, groundnuts,sugarcane, and vegetables.
Three factors accelerated the exit of the farmers from tank systems during the early1990s: (1) migration to urban and foreign non-agricultural sectors, (2) reductions inelectric pump prices and well-digging costs, and (3) a free electricity power policy.The first factor, migration, started with the country’s rapid industrialization whenthe government started its economic liberalization policies in 1991. In addition,globalizationmade overseasworksmore accessible. An important change underlyingthis trend was that water tenders, called Neerkatti in local terms, who were hiredfrom some specific scheduled caste families under a hereditary system, left watermanagement for non-agricultural work, seeking higher wages as well as freedomfrom the hereditary system (Jegadeesan and Fujita 2011). This is similar to whathappened in Japan in that the scarcity of experiencedwater tenders increasedwith therapid industrialization. The second and the third factors caused the massive diffusionof private wells and pumps (Fig. 12.5). The shift in the relative share in Fig. 12.5
10This section draws heavily on Kajisa (2012) and Kajisa et al. (2007).
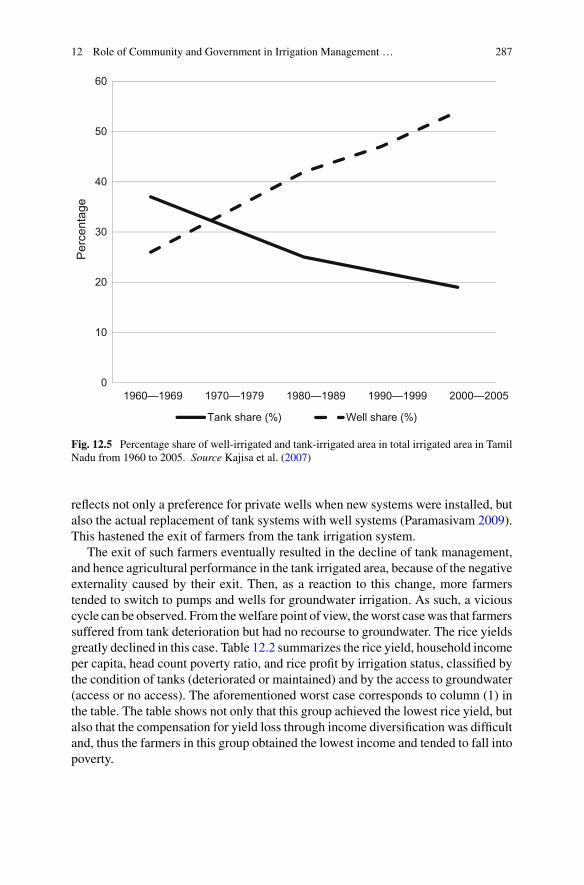
12 Role of Community and Government in Irrigation Management … 287
0
10
20
30
40
50
60
1960–1969 1970–1979 1980–1989 1990–1999 2000–2005
Perc
enta
ge
Tank share (%) Well share (%)
Fig. 12.5 Percentage share of well-irrigated and tank-irrigated area in total irrigated area in TamilNadu from 1960 to 2005. Source Kajisa et al. (2007)
reflects not only a preference for private wells when new systems were installed, butalso the actual replacement of tank systems with well systems (Paramasivam 2009).This hastened the exit of farmers from the tank irrigation system.
The exit of such farmers eventually resulted in the decline of tank management,and hence agricultural performance in the tank irrigated area, because of the negativeexternality caused by their exit. Then, as a reaction to this change, more farmerstended to switch to pumps and wells for groundwater irrigation. As such, a viciouscycle can be observed. From thewelfare point of view, theworst casewas that farmerssuffered from tank deterioration but had no recourse to groundwater. The rice yieldsgreatly declined in this case. Table 12.2 summarizes the rice yield, household incomeper capita, head count poverty ratio, and rice profit by irrigation status, classified bythe condition of tanks (deteriorated or maintained) and by the access to groundwater(access or no access). The aforementioned worst case corresponds to column (1) inthe table. The table shows not only that this group achieved the lowest rice yield, butalso that the compensation for yield loss through income diversification was difficultand, thus the farmers in this group obtained the lowest income and tended to fall intopoverty.
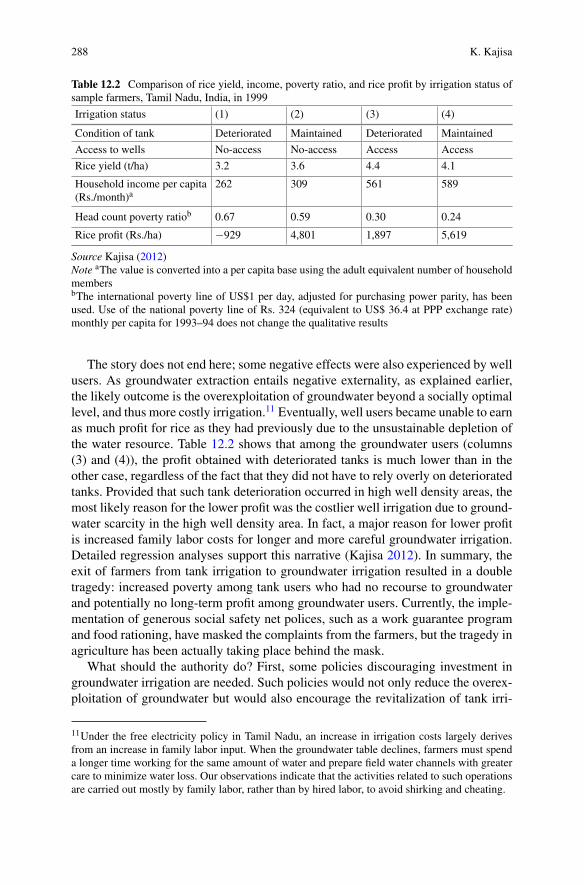
288 K. Kajisa
Table 12.2 Comparison of rice yield, income, poverty ratio, and rice profit by irrigation status ofsample farmers, Tamil Nadu, India, in 1999
Irrigation status (1) (2) (3) (4)
Condition of tank Deteriorated Maintained Deteriorated Maintained
Access to wells No-access No-access Access Access
Rice yield (t/ha) 3.2 3.6 4.4 4.1
Household income per capita(Rs./month)a
262 309 561 589
Head count poverty ratiob 0.67 0.59 0.30 0.24
Rice profit (Rs./ha) −929 4,801 1,897 5,619
Source Kajisa (2012)Note aThe value is converted into a per capita base using the adult equivalent number of householdmembersbThe international poverty line of US$1 per day, adjusted for purchasing power parity, has beenused. Use of the national poverty line of Rs. 324 (equivalent to US$ 36.4 at PPP exchange rate)monthly per capita for 1993–94 does not change the qualitative results
The story does not end here; some negative effects were also experienced by wellusers. As groundwater extraction entails negative externality, as explained earlier,the likely outcome is the overexploitation of groundwater beyond a socially optimallevel, and thus more costly irrigation.11 Eventually, well users became unable to earnas much profit for rice as they had previously due to the unsustainable depletion ofthe water resource. Table 12.2 shows that among the groundwater users (columns(3) and (4)), the profit obtained with deteriorated tanks is much lower than in theother case, regardless of the fact that they did not have to rely overly on deterioratedtanks. Provided that such tank deterioration occurred in high well density areas, themost likely reason for the lower profit was the costlier well irrigation due to ground-water scarcity in the high well density area. In fact, a major reason for lower profitis increased family labor costs for longer and more careful groundwater irrigation.Detailed regression analyses support this narrative (Kajisa 2012). In summary, theexit of farmers from tank irrigation to groundwater irrigation resulted in a doubletragedy: increased poverty among tank users who had no recourse to groundwaterand potentially no long-term profit among groundwater users. Currently, the imple-mentation of generous social safety net polices, such as a work guarantee programand food rationing, have masked the complaints from the farmers, but the tragedy inagriculture has been actually taking place behind the mask.
What should the authority do? First, some policies discouraging investment ingroundwater irrigation are needed. Such policies would not only reduce the overex-ploitation of groundwater but would also encourage the revitalization of tank irri-
11Under the free electricity policy in Tamil Nadu, an increase in irrigation costs largely derivesfrom an increase in family labor input. When the groundwater table declines, farmers must spenda longer time working for the same amount of water and prepare field water channels with greatercare to minimize water loss. Our observations indicate that the activities related to such operationsare carried out mostly by family labor, rather than by hired labor, to avoid shirking and cheating.
12 Role of Community and Government in Irrigation Management … 289
gation management (by increasing the number of farmers remaining in the tanksystem). The termination of the free electricity policy sounds reasonable and effec-tive but could be politically difficult because politicians fear the loss of votes fromrural farmers. As Japan’s experience shows, an overdose of agricultural protectionis one of the most challenging problems in the rapidly growing countries. We mustfocus our greatest efforts on finding solutions to this issue.
Second, similar to the cases of Japan and China, support for the substitution ofcapital for labor is another possible solution.12 This support is justifiable not onlyfrom the viewpoint of the existence of the first type of externality but also fromthat of second type because people started recognizing the amenity benefits of thetanks.13 Note, however, that concrete canal lining or pipeline installations, as inJapan, might not be the appropriate means of substitution because water flow andthe location of water intake will be fixed once such facilities are installed. In TamilNadu, farmers cultivate multiple crops over the seasons in a single year, and theyalso change cropping patterns over the years. Hence, the water flow structure in thecommand area must remain flexible. A possible labor-saving intervention might bethe use of heavy machines for tank cleaning to maintain the supply capacity. Suchsubstitutions must proceed in a way that suits the local farming systems.
12.5 Concluding Remarks
In all three cases, the fundamental underlying change was the decline in the num-ber of traditional irrigation system users. Therefore, the most appropriate strategyreflecting the change in factor endowment is the substitution of capital for labor. Nei-ther the market nor the community can achieve this substitution properly because ofthe increasing externalities and the rapid decline of community mechanisms in theemerging states. We must understand that the demand for active involvement of thegovernment increases for these countries and the government should not hesitate toimplement policies supporting labor saving investments in irrigation management.14
It is important to recognize this point because we tend to assume abundant laborin rural area in LDCs and, thus, try to develop strategies for labor mobilization for
12The tanks larger than 100 ac. are already under the control of public authority (Public WorksDepartment), meanwhile those smaller than 100 ac are under the control of local communities. Ourimplication applies particularly to the latter ones.13Encroachments of residences in the water catchment area, which reduces the amount of waterstored in the tanks, is a unique problem of tank irrigation system. This is another example of negativeexternality which require some interventions.14Revitalization or restructuring of a community as a new unit with the new linkages among themembers can be an alternative solution to the decline of the traditional community. Japan’s experi-ence, however, implies that seeking this solution is not easy because the support for group farmingdid not work successfully and then the government has eventually shifted toward an individualsupport. Nevertheless, we do not deny the potential role of the new community in the aspects otherthan irrigation management. One possible benefit may be the provision of informal social safetynet among the newly linked members.
290 K. Kajisa
successful collectivemanagement.With the academic success of Ostrom’s group, thedevelopment society seems to believe the high potential of the community to achievesuccessful collective management. In fact, development strategies such as the com-munity participatory approach and the transfer of management to local institutionsboomed in the 1980s. The community seems to have been used as a convenient insti-tution for solutions to resource management issues. However, the use of communityis not a panacea, which is particularly so among emerging states.15 The governmentcan also play an important role.
The role of government is more important among the emerging states becauseof two contemporary issues. First, the overexploitation of groundwater is a seriousproblem in many LDCs. Since this problem is related with negative externality, wecan find again an important role of the government. Second, not only the groundwa-ter but also fresh surface water is becoming scarce in the emerging states becauseof the increasing demand in industrial and urban sectors. Introduction of volumetricirrigation water pricing is regarded as one of the solutions for water savings in theagricultural sector. To make this system work in the emerging states, the moderniza-tion of irrigation facilities for water control and measurement must come togetherwith the introduction of a new pricing system. This strengthens our argument onthe necessity for smooth substitution of capital for labor. These two contemporaryissues indicate that the emerging state must deal with resource scarcity issues moreseriously than the time DCs used to do, and the role of the government is becomingcrucially important.
Although we admit an increasing importance in the role of the government,we also learn from Japan’s experience that we need some mechanism which helpsus circumvent excessive support following the trend for increasing agriculturalprotectionism during rapid industrialization. The protection of the agricultural sectorcan have a positive role in the economic development under certain contexts. Forexample, it can reduce the risk of social unrest in rapidly growing economies wherethe agricultural income grows slower than that of the industrial sector. However,the support provided must be that which can achieve sustainable agriculturalgrowth thorough the correction of externalities, rather than that which will result instagnation under such protection.
In this regard, we cannot be too optimistic about the direction China and Indiaare moving in. Anderson and Martin (2008) shows the increasing trend of the nomi-nal rate of assistance, an indicator of agricultural protection, of these two countries.Although the level of protection was still low (6% for China and 16% for India in2000–2004, compared with 137% in Korea and 61% in Taiwan), the trend shownin these countries is the same as the one predicted by Honma’s political economyframework (see Chap. 10). Moreover, in India, the source of protection largely camefrom subsidies for fertilizer and electricity (for irrigation pumps), which are forfarmers’ income support but not for sustainable agricultural growth (Anderson and
15It is not Ostrom who advocated the versatileness of community. Rather, the development societyseemed to overdose such policies. In later year, Ostrom (2007) and Meinzen-Dick (2007) tried toadjust the trend in their synthesis using a phrase of “beyond panaceas.”
12 Role of Community and Government in Irrigation Management … 291
Martin 2008). Our cases exemplify the difficulties the emerging states would face incircumventing the trap of agricultural protectionism. However, the government mustclearly understand that maintaining the support and protection without productiv-ity improvement eventually become a huge financial burden to the state. Choosingappropriate policies under pressures from different interest groups is a challengingpolitical economy issue for the emerging states, but they certainly must deal withit by upgrading their political systems and convince their citizens not to repeat thesame mistake that some DCs had made.
References
Anderson, K., & Martin, W. (Eds.). (2008). Distortions to agricultural incentives in Asia. Wash-ington, DC: World Bank.
Jegadeesan, M., & Fujita, K. (2011). Deterioration of the informal tank institution in Tamil Nadu:Caste-based rural society and rapid economic development in India. Southeast Asian Studies,49(1), 93–123.
Kajisa, K. (2012). The double tragedy of irrigation systems in Tamil Nadu, India: Assessment ofthe replacement of traditional systems by private wells.Water Policy, 14, 371–390.
Kajisa, K., & Dong, B. (2017). The effect of volumetric pricing policy on farmers’ water manage-ment institutions and their water use: The case of water user organization in an irrigation systemin Hubei, China.World Bank Economic Review, 31(1), 220–240.
Kajisa, K., Palanisami, K., & Sakurai, T. (2007). Effects on poverty and equity of the decline inthe collective tank irrigation management in Tamil Nadu, India. Agricultural Economics, 36(3),347–362.
Lohmar, B., Huang, Q., Lei, B., & Gao, Z. (2007). Water pricing policies and recent reform inChina: The conflict between conservation and other policy goals. In F. Molle & J. Berkoff (Eds.),Irrigation water pricing: The gap between theory and practice. Oxford: CABI.
Meinzen-Dick, R. (2007). Beyond panaceas in water institutions. Proceedings of the NationalAcademy of Science, 104(39), 15200–15205.
Ministry of Agriculture, Forestry and Fisheries. (Various Years). Nougyou syuokuryou kannrensangyou no keizai keisan (in Japanese) (Economic accounting of agricultural and food industries),Ministry of Agriculture, Forestry and Fisheries, Tokyo.
Ministry of Agriculture, Forestry and Fisheries. (Various Years). Statistics section of the homepage.Retrieved November 6, 2017 from http://www.maff.go.jp/j/tokei/index.html.
Nakajima, Y. (1998). Nougyou nouson seibi jigyou to hozyo seido (Agrarian Development Projectsand Government Support Programs). In M. Okuno & M. Honma (Eds.), Nougyou Mondai noKeizaibunseki (Economic analysis of agrarian issues) Tokyo: Nihon Keizai Shinbun sha.
National Research Institute of Agricultural Economics. (1967). Nihon Nougyou no TyoukiToukeisyuu (I) (in Japanese) (Long-term statistics of Japan’s Agriculture). National ResearchInstitute of Agricultural Economics, Tokyo.
Olson, M. (1965). The logic of collective action. Cambridge: Harvard University Press.Ostrom, E. (2007). A diagnostic approach for going beyond panaceas. Proceedings of the NationalAcademy of Science, 104(39), 15181–15187.
Paramasivam, P. (2009). Changing sources and emerging issues in the irrigation sector of TamilNadu Agriculture. In M. Chandrasekaran, N. Ajjan, N. Kumar, & D. Suresh, (Eds.), Agriculturaldevelopment issues in Tamil Nadu: Proceedings of the symposium conducted in 17th annualconference of agricultural economics research association, November 19–21, 2009. Coimbatore:Tamil Nadu Agricultural University.
292 K. Kajisa
Tamaki, A., & Hatate, I. (1974). Fudo daichi to ningen no rekishi (Ecology: history of land andhuman). Tokyo: Heibonsya.
Tamaki, A., Hatate, I., & Imamura,N. (1984). Suiri no Syakai Kouzou (Social structure of irrigation).Tokyo: University of Tokyo Press.
Open Access This chapter is licensed under the terms of the Creative Commons Attribution-NonCommercial-NoDerivatives 4.0 International License (http://creativecommons.org/licenses/by-nc-nd/4.0/), which permits any noncommercial use, sharing, distribution and reproduction in anymedium or format, as long as you give appropriate credit to the original author(s) and the source,provide a link to the Creative Commons licence and indicate if you modified the licensed material.You do not have permission under this licence to share adapted material derived from this chapteror parts of it.
The images or other third party material in this chapter are included in the chapter’s CreativeCommons licence, unless indicated otherwise in a credit line to the material. If material is notincluded in the chapter’s Creative Commons licence and your intended use is not permitted bystatutory regulation or exceeds the permitted use, you will need to obtain permission directly fromthe copyright holder.