Illustrative Example of a Function Point Analysis for the ... · PDF fileIllustrative Example...
34
Orion Project Office Illustrative Example of a Function Point Analysis for the NASA Crew Exploration Vehicle Guidance, Navigation & Control Flight Software Robert Georgi / Terry Vogt / Orion Strategic Assessment Team National Aeronautics & Space Administration Lyndon B. Johnson Space Center Houston, TX 77058 April 9, 2008
Transcript of Illustrative Example of a Function Point Analysis for the ... · PDF fileIllustrative Example...
Orio
n P
roje
ct O
ffice
Illustrative Example of a Function Point Analysis for the NASA Crew Exploration Vehicle Guidance, Navigation & Control Flight Software
Robert Georgi / Terry Vogt /Orion Strategic Assessment Team
National Aeronautics & Space AdministrationLyndon B. Johnson Space CenterHouston, TX 77058
April 9, 2008
Orio
n P
roje
ct O
ffice Agenda
•Task Background•Function Points Concepts•GN&C Function Point Analysis•GN&C SEER-SEM Estimate
Orio
n P
roje
ct O
ffice
3
Strategic Assessment Team direction
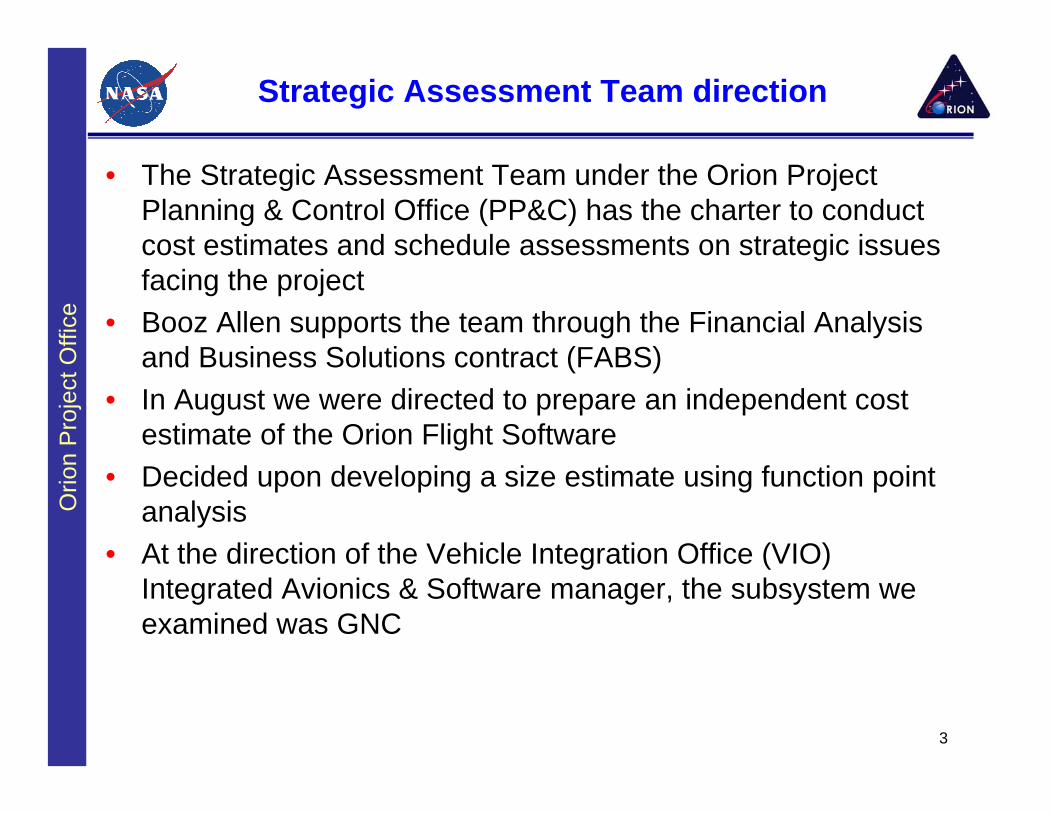
• The Strategic Assessment Team under the Orion Project Planning & Control Office (PP&C) has the charter to conduct cost estimates and schedule assessments on strategic issues facing the project
• Booz Allen supports the team through the Financial Analysis and Business Solutions contract (FABS)
• In August we were directed to prepare an independent cost estimate of the Orion Flight Software
• Decided upon developing a size estimate using function point analysis
• At the direction of the Vehicle Integration Office (VIO) Integrated Avionics & Software manager, the subsystem we examined was GNC

Orio
n P
roje
ct O
ffice
4
Software development is a significant schedule and cost risk for the project
• Currently the #6 risk on the project (1115 – CEV software development cycle)1
• Recent studies have shown that only 35 percent of software development projects are completed successfully within the estimated schedule and budget2
• This terrible track record is due, in large part, to initial project estimates that are overly optimistic and inaccurate
• Since the cost of the development effort is directly proportional to the size of the development, estimating the size well is key– You cannot manage what you do not understand, you
cannot understand what you cannot measure
(1) Orion Top Risks 7-17-07, Mark Kirasich, Deputy Project Manager(2) 2006 Standish Group Chaos Report www.sdtimes.com/article/story-20070301-01.html
Orio
n P
roje
ct O
ffice
5
GNC
• The Orion Flight Software is composed of Computer Software Configuration Items (CSCI)
• The GNC subsystem comprises three of the CSCI:– Guidance– Navigation– Control
• Chosen for the analysis because it is the most critical component of the Flight Software
Orio
n P
roje
ct O
ffice
6
GNC Description and Functions
• The CEV Spacecraft GN&C performs the following functions during different modes and phases of the CEV missions:– Spacecraft navigation, – Targeting, – Guidance, – Controls, – Rendezvous, – Proximity operations, – Docking, – Undocking, – Solar panel and high gain antenna pointing.
• Other GNC functions include: house keeping operations such as health and status information generation and checking for the GNC sensors and effectors; performing GNC Fault Detection, Isolation and Recovery (FDIR) of GNC functionality; and maintaining flight parameter databases required for the GNC functions
Orio
n P
roje
ct O
ffice Agenda
•Task Background•Function Points Concepts•GN&C Function Point Analysis•GN&C SEER-SEM Estimate
Orio
n P
roje
ct O
ffice
Objectives of Counting Function Points
• Objectives– To measure functionality that the user requests and receives– To measure software development and maintenance
independently of technology used for implementation– To measure software by quantifying the functionality the
software provides to the user based primarily on logical design
• The process of counting function points is intended to be:– Simple enough to minimize the overhead of the measurement
process– A consistent measure among various projects and organizations
Orio
n P
roje
ct O
ffice
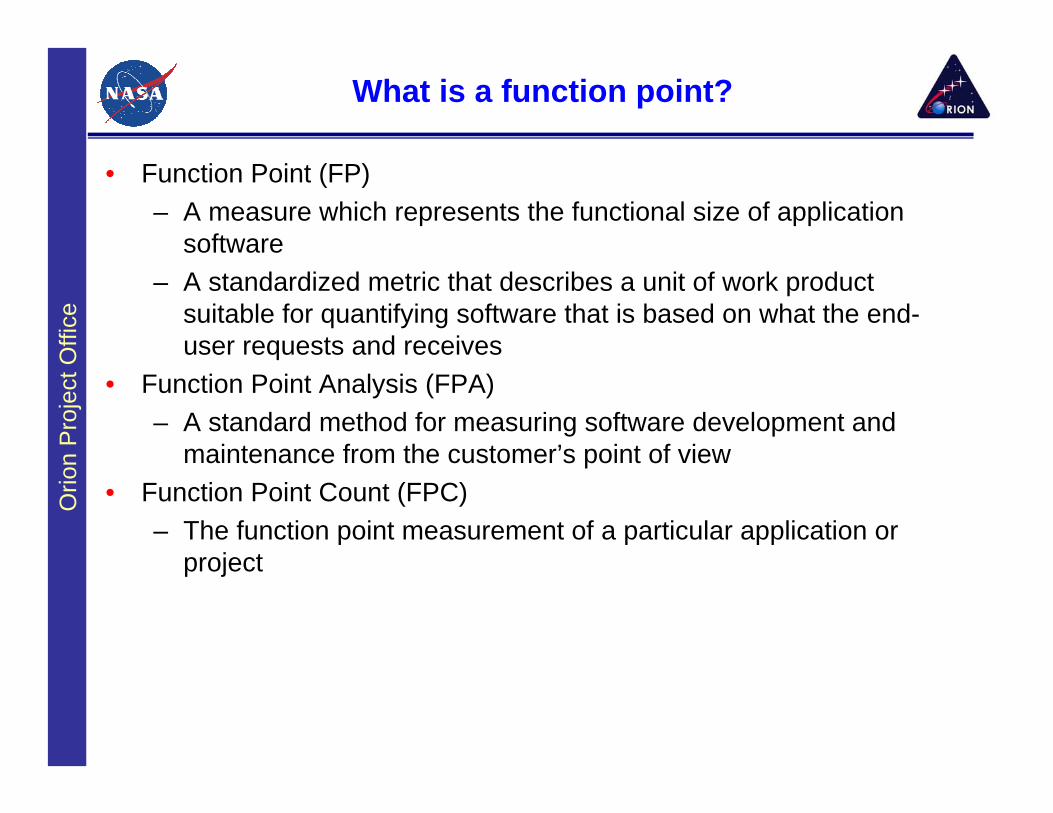
What is a function point?
• Function Point (FP)– A measure which represents the functional size of application
software– A standardized metric that describes a unit of work product
suitable for quantifying software that is based on what the end-user requests and receives
• Function Point Analysis (FPA)– A standard method for measuring software development and
maintenance from the customer’s point of view• Function Point Count (FPC)
– The function point measurement of a particular application or project
Orio
n P
roje
ct O
ffice
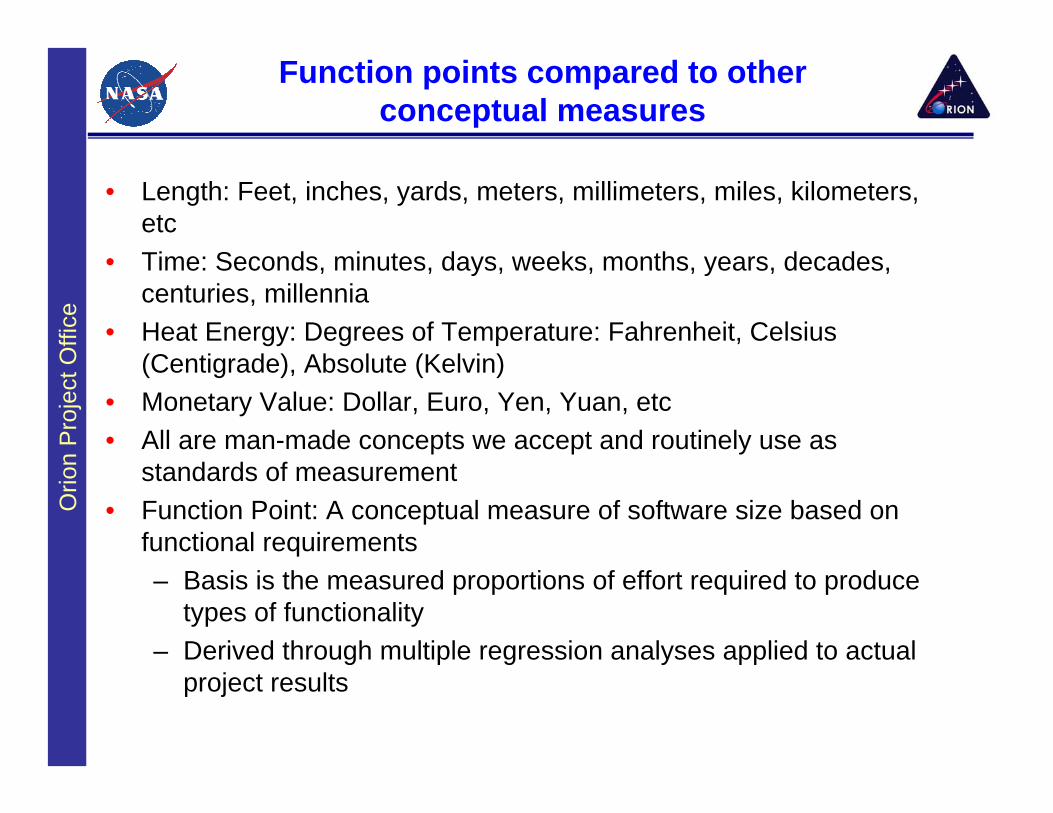
Function points compared to other conceptual measures
• Length: Feet, inches, yards, meters, millimeters, miles, kilometers, etc
• Time: Seconds, minutes, days, weeks, months, years, decades, centuries, millennia
• Heat Energy: Degrees of Temperature: Fahrenheit, Celsius (Centigrade), Absolute (Kelvin)
• Monetary Value: Dollar, Euro, Yen, Yuan, etc • All are man-made concepts we accept and routinely use as
standards of measurement• Function Point: A conceptual measure of software size based on
functional requirements– Basis is the measured proportions of effort required to produce
types of functionality– Derived through multiple regression analyses applied to actual
project results
Orio
n P
roje
ct O
ffice
11
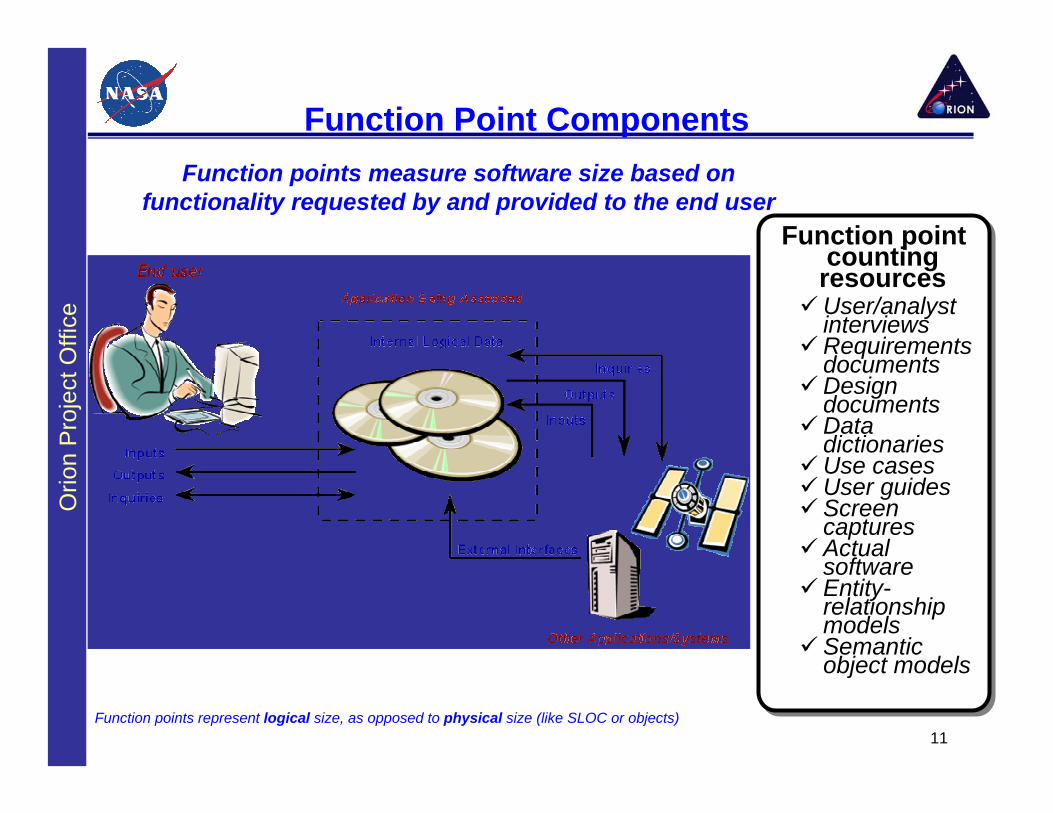
Function points measure software size based on functionality requested by and provided to the end user
Function point counting
resourcesUser/analyst interviewsRequirements documentsDesign documentsData dictionariesUse casesUser guidesScreen capturesActual softwareEntity-relationship modelsSemantic object models
Function point counting
resourcesUser/analyst interviewsRequirements documentsDesign documentsData dictionariesUse casesUser guidesScreen capturesActual softwareEntity-relationship modelsSemantic object models
Function points represent logical size, as opposed to physical size (like SLOC or objects)
Function Point Components
Orio
n P
roje
ct O
ffice
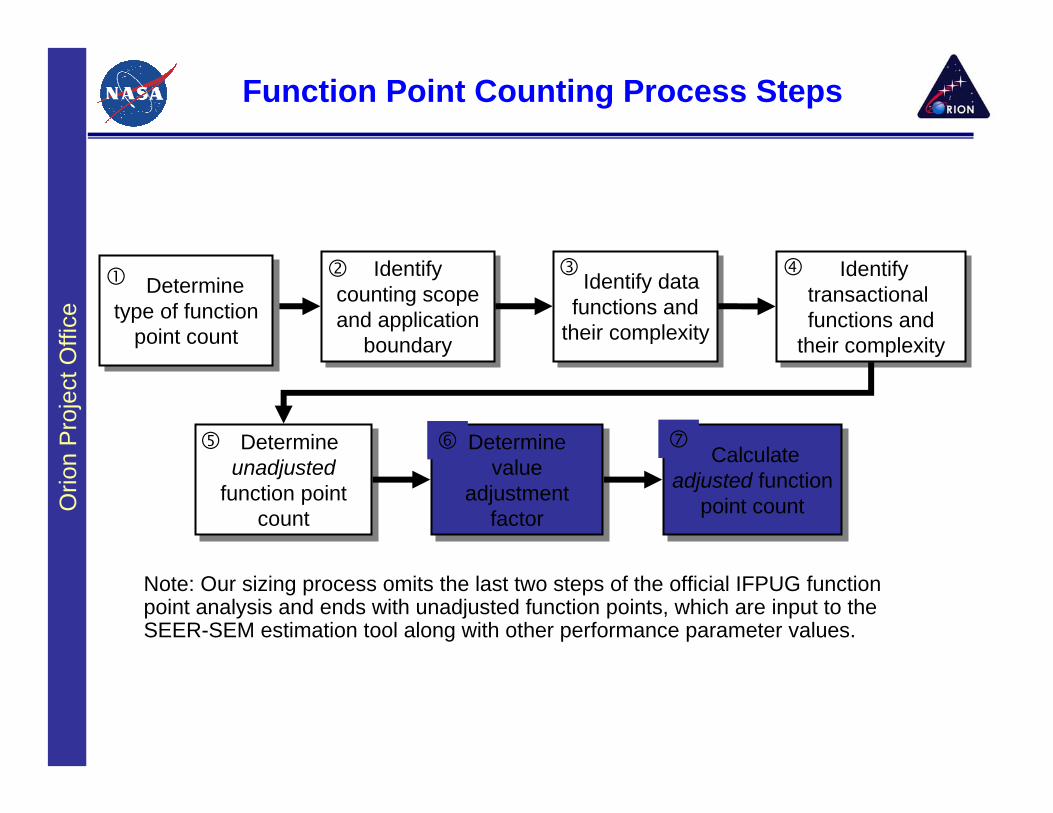
Function Point Counting Process Steps
Identify counting scope and application
boundary
Identify counting scope and application
boundary
Identify data functions and
their complexity
Identify data functions and
their complexity
Identify transactional functions and
their complexity
Identify transactional functions and
their complexity
Determine unadjusted
function point count
Determine unadjusted
function point count
Determine value
adjustment factor
Determine value
adjustment factor
Calculateadjusted function
point count
Calculateadjusted function
point count
Note: Our sizing process omits the last two steps of the official IFPUG function point analysis and ends with unadjusted function points, which are input to the SEER-SEM estimation tool along with other performance parameter values.
Determine type of function
point count
Determine type of function
point count
Orio
n P
roje
ct O
ffice
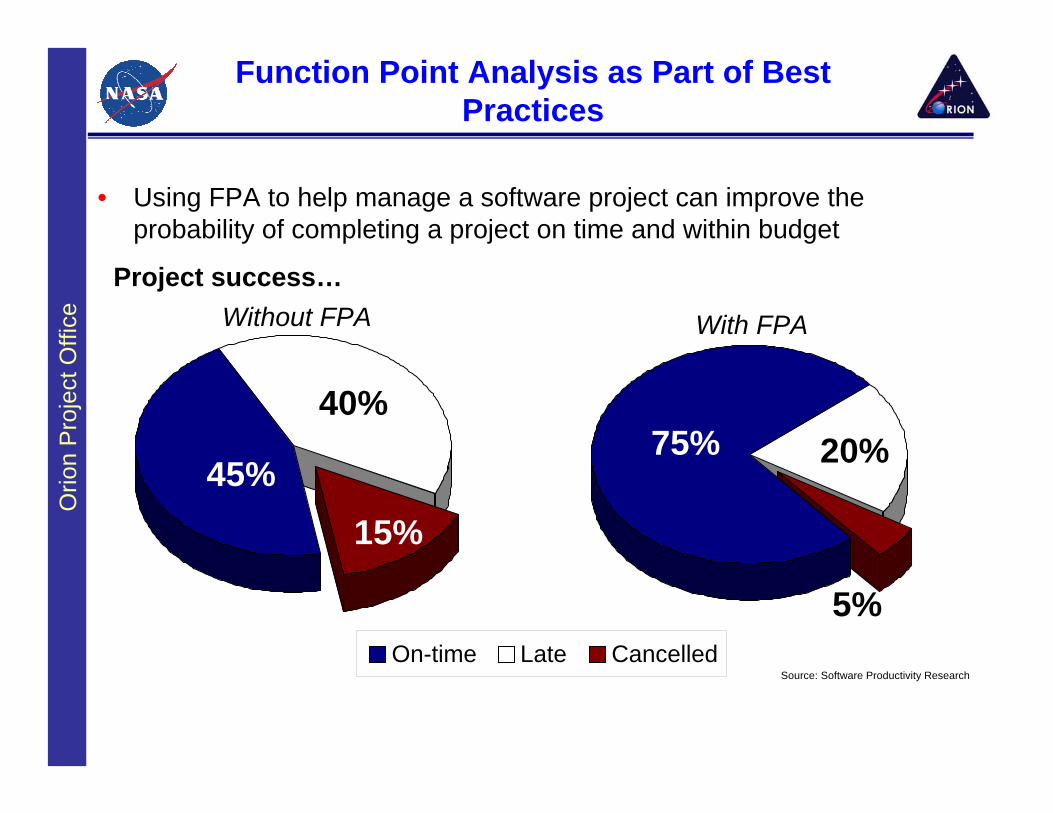
Function Point Analysis as Part of Best Practices
• Using FPA to help manage a software project can improve the probability of completing a project on time and within budget
Without FPA
40%
15%45%
On-time Late CancelledSource: Software Productivity Research
5%
20%75%
With FPA
Project success…
Orio
n P
roje
ct O
ffice
Why Use Function Points?
• FPA provides a consistent, documentable, repeatable measurement methodology
• Because it is linked directly to system requirements and functionality, FPA puts size analysis into terms that a client or end user can understand – Function points can help with communications between the end user
community and the developer– Assists with requirements management - functional size traceable
throughout entire life cycle
– Applicable from earliest requirements stage and throughout full life-cycle
• Technology, platform, and language independent• Advantages over lines of code: not dependent on engineering
estimates, better metrics• Provides quantitative basis for earned value management• Can reveal gaps in functional requirements e.g. data stores without
related transactions
Orio
n P
roje
ct O
ffice
Alternative Software Size Measure: Lines of Code
• Source Lines Of Code (SLOC)– A purely physical measure – measures code used to provide
functionality
• Pros– Easy to come up with a number– Plenty of historical data available – Supported by most cost estimating tools
Orio
n P
roje
ct O
ffice
Alternative Software Size Measure: Lines of Code
• Cons– No standards - huge divergence in measured size of same
material by different individuals• Methodologies for coding software and for counting SLOC differ
between organizations– Cross-language estimates are inconsistent
• Conversion factors are unreliable, code size varies widely for equivalent functionality
– Rewards profligate design, penalizes tight design• No incentive for developers to reduce lines of code or associated
effort or cost– Measures components, not completed products
• Measures what is used to make a thing, not what is delivered• Measurement before coding phase is guesswork, estimates are
very doubtful– Irrelevant to some modern development environments
• Graphical design environments minimize use of code, wild swings in code versus functionality
Orio
n P
roje
ct O
ffice
17
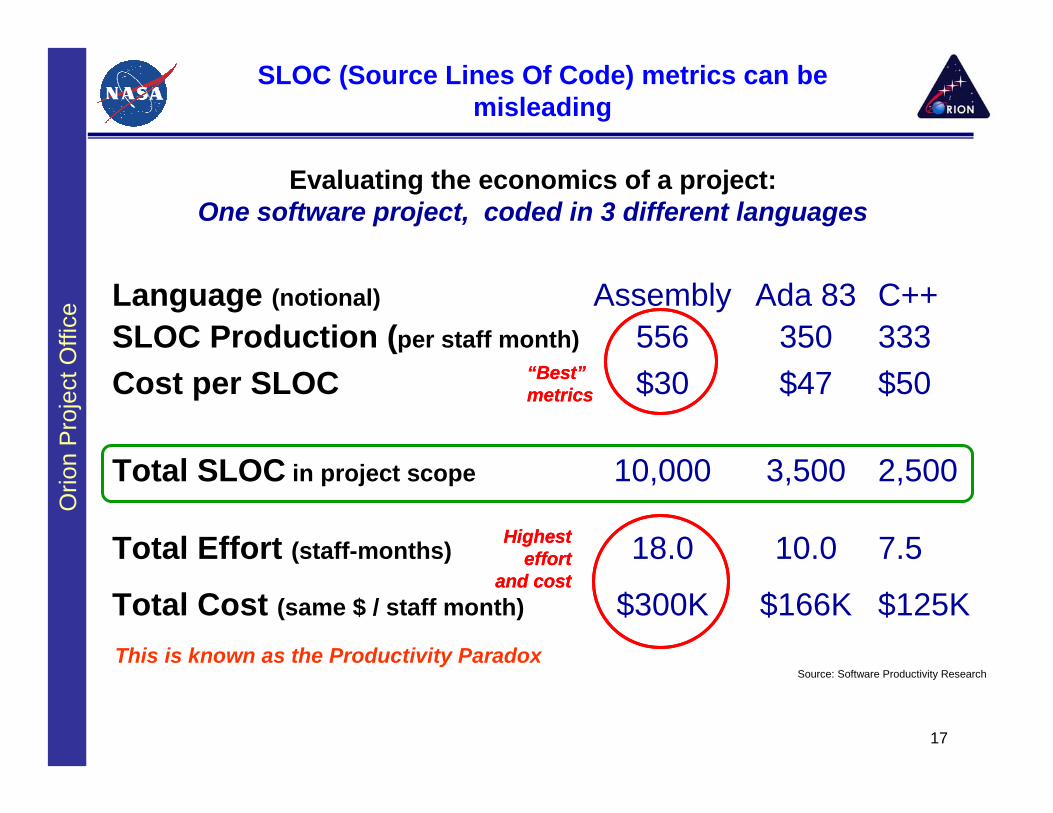
SLOC (Source Lines Of Code) metrics can be misleading
Source: Software Productivity ResearchThis is known as the Productivity Paradox
Evaluating the economics of a project: One software project, coded in 3 different languages
SLOC Production (per staff month) 556 350 333Cost per SLOC $30 $47 $50
Total SLOC in project scope 10,000 3,500 2,500
Total Effort (staff-months) 18.0 10.0 7.5
Total Cost (same $ / staff month) $300K $166K $125K
“Best”metrics“Best”metrics
Highest effort
and cost
Highest effort
and cost
Language (notional) Assembly Ada 83 C++
Orio
n P
roje
ct O
ffice
18
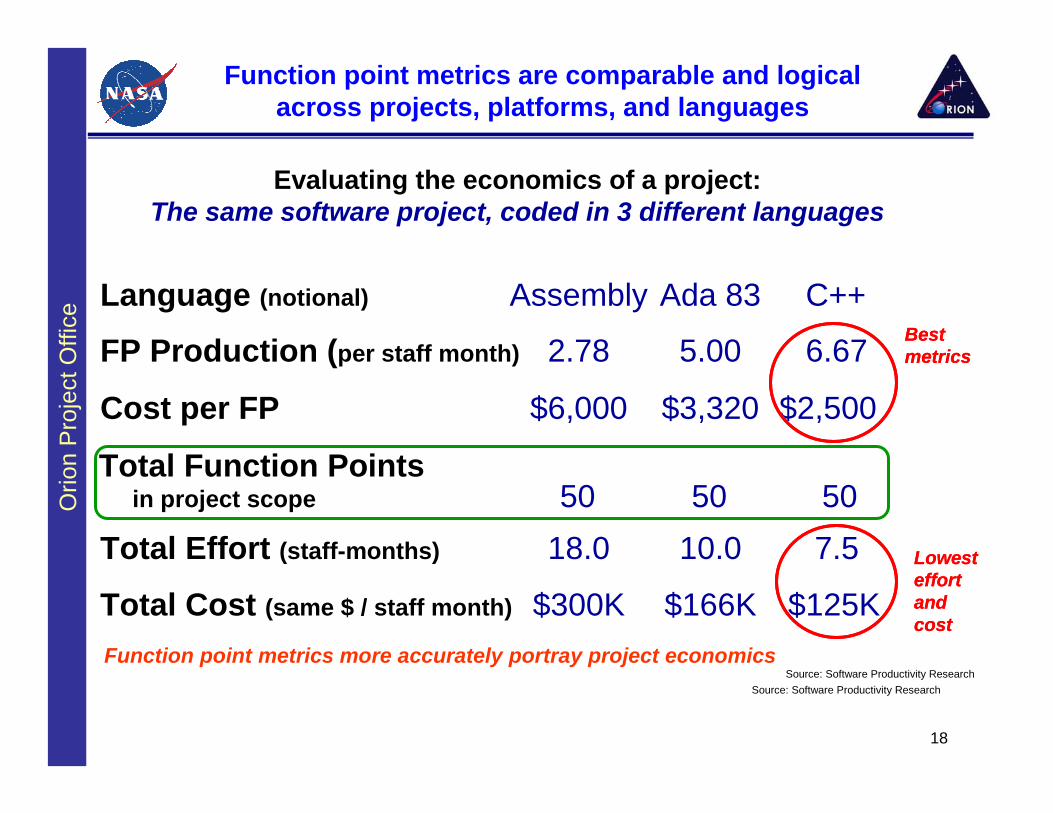
Function point metrics are comparable and logical across projects, platforms, and languages
Source: Software Productivity Research
Function point metrics more accurately portray project economics
FP Production (per staff month) 2.78 5.00 6.67
Cost per FP $6,000 $3,320 $2,500
Total Function Points in project scope 50 50 50
Total Effort (staff-months) 18.0 10.0 7.5
Total Cost (same $ / staff month) $300K $166K $125K
Best metricsBest metrics
Lowest effort and cost
Lowest effort and cost
Source: Software Productivity Research
Evaluating the economics of a project: The same software project, coded in 3 different languages
Language (notional) Assembly Ada 83 C++
Orio
n P
roje
ct O
ffice
Function Point Usage and Support
• Representative US users of Function Point Analysis include Accenture, Allied-Signal, Allstate, Dayton Hudson, DFAS, DHS, DOJ , Exelon, General Motors, IBM, IRS, JHUAPL, US Air Force, US Army, US Navy, Verizon
• Function points have been used to size and estimates numerous applications and projects in government, DoD, aerospace and embedded processes. Examples include:– GPS III next generation satellite system replacement for current
GPS– Factory automation processes (Boeing, Daimler-Benz)– Communication systems (AT&T)– Avionics systems
Orio
n P
roje
ct O
ffice
Function Point Usage and Support
• International Function Point Users Group (IFPUG) serves over 1,200 members in more than 30 countries. The members come from every major industry segment including aerospace, automotive, banking, insurance, government, manufacturing, retail, and telecom
• IFPUG certifies individual proficiency in function point analysis by rigorous, recurrent testing: CFPS designation, which must be individually renewed every three years
• Function Point Analysis is supported by a number of tools designed specifically for documenting and reporting function point measurement
• Function point counts are directly accepted as input to major software cost estimating tools including SEER-SEM
Orio
n P
roje
ct O
ffice Agenda
•Task Background•Function Points Concepts•GN&C Function Point Analysis•GN&C SEER-SEM Estimate
Orio
n P
roje
ct O
fficeProcess
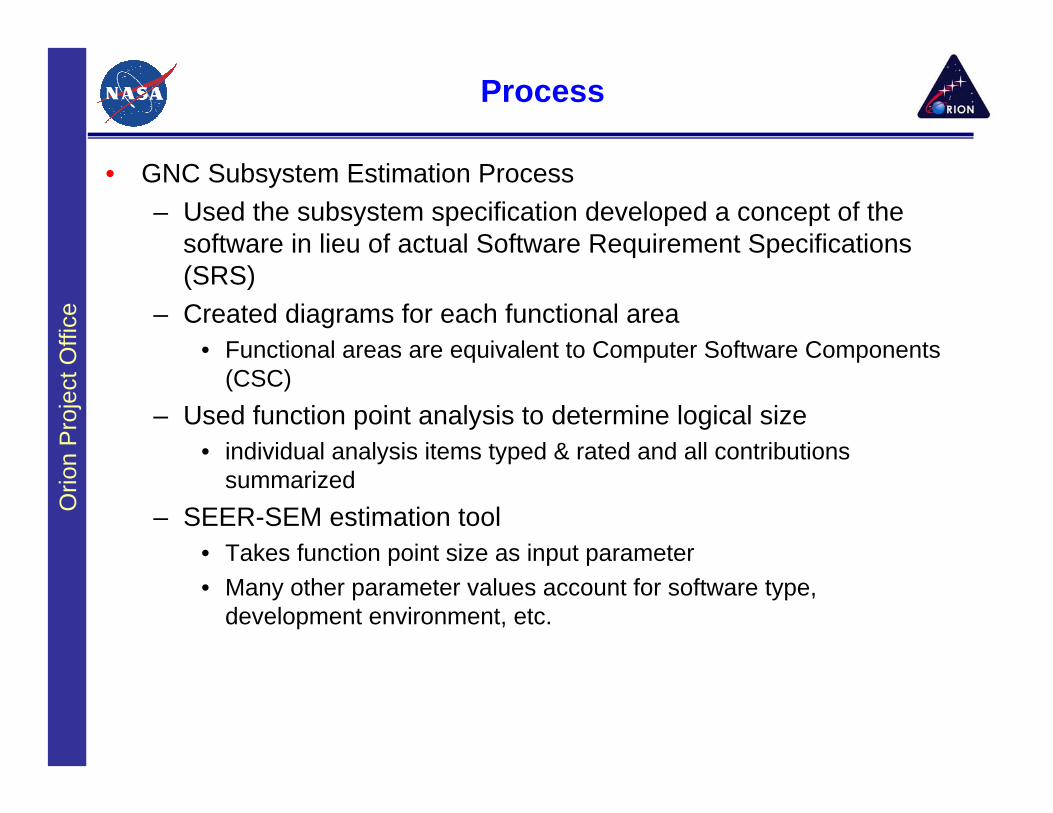
• GNC Subsystem Estimation Process– Used the subsystem specification developed a concept of the
software in lieu of actual Software Requirement Specifications (SRS)
– Created diagrams for each functional area• Functional areas are equivalent to Computer Software Components
(CSC)– Used function point analysis to determine logical size
• individual analysis items typed & rated and all contributions summarized
– SEER-SEM estimation tool• Takes function point size as input parameter• Many other parameter values account for software type,
development environment, etc.
Orio
n P
roje
ct O
ffice
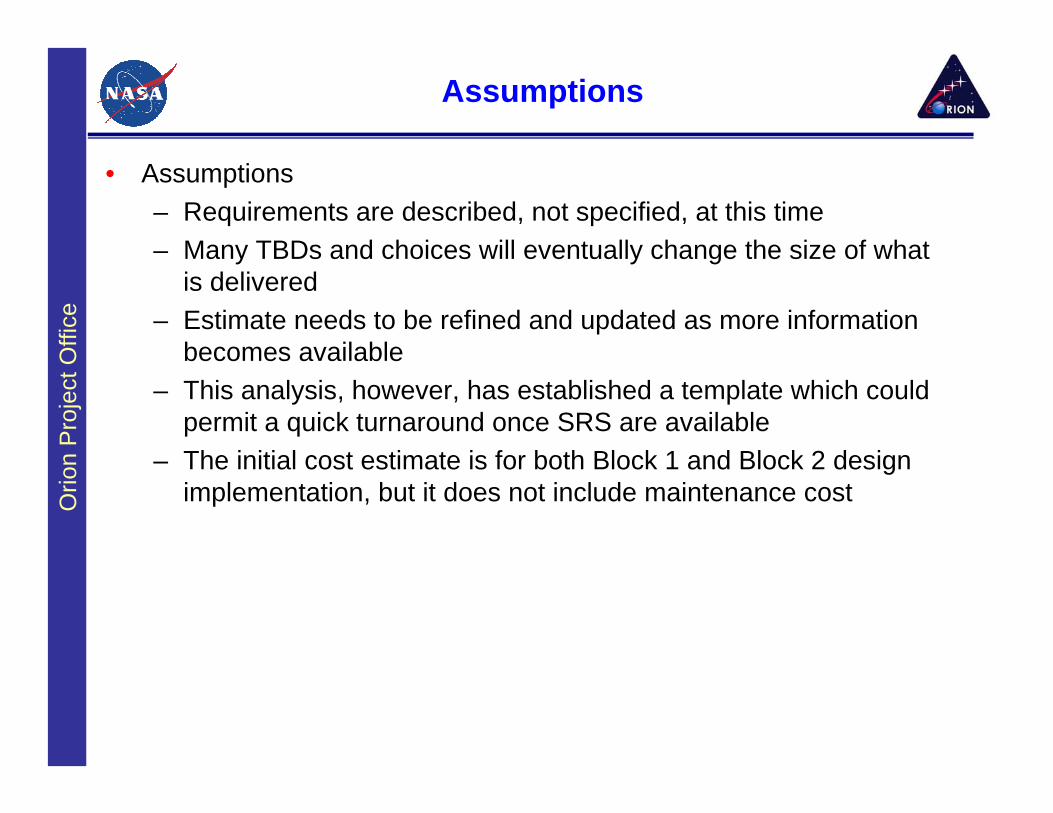
Assumptions
• Assumptions– Requirements are described, not specified, at this time– Many TBDs and choices will eventually change the size of what
is delivered– Estimate needs to be refined and updated as more information
becomes available– This analysis, however, has established a template which could
permit a quick turnaround once SRS are available– The initial cost estimate is for both Block 1 and Block 2 design
implementation, but it does not include maintenance cost
Orio
n P
roje
ct O
ffice
24
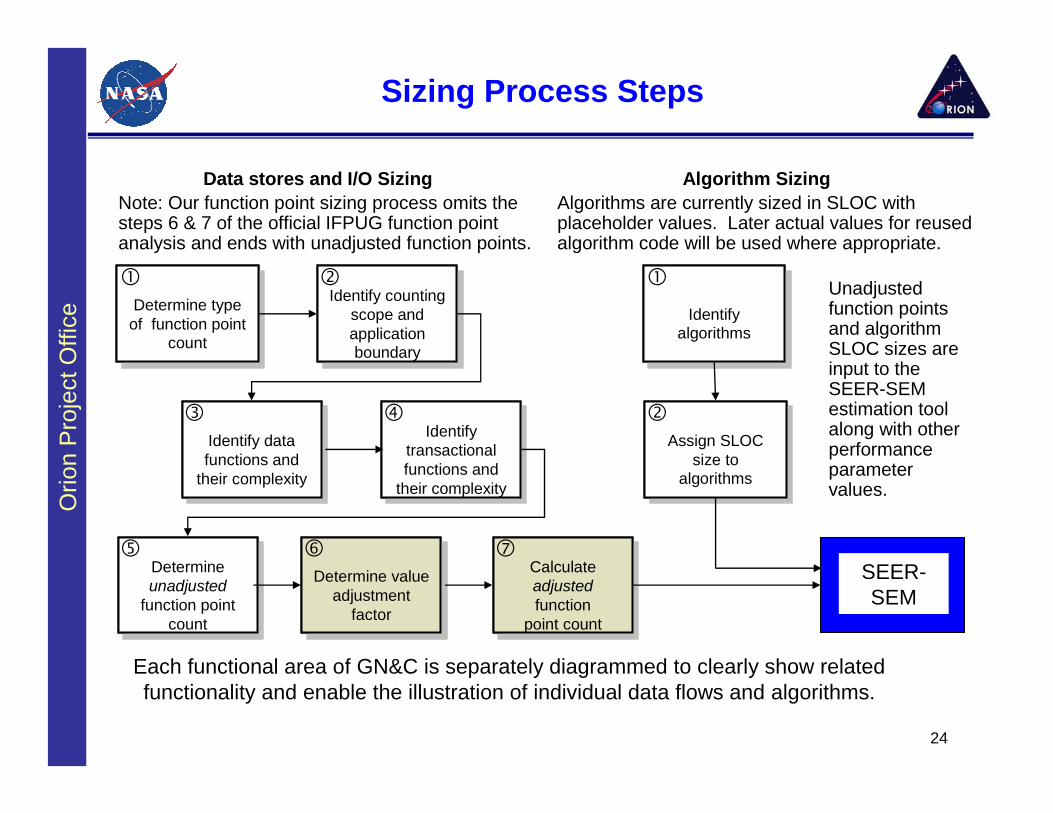
Sizing Process Steps
Note: Our function point sizing process omits the steps 6 & 7 of the official IFPUG function point analysis and ends with unadjusted function points.
Determine type of function point
count
Determine type of function point
count
Determine type of function point
count
Determine type of function point
count
Each functional area of GN&C is separately diagrammed to clearly show related functionality and enable the illustration of individual data flows and algorithms.
Identify counting scope and application boundary
Identify counting scope and application boundary
Identify counting scope and application boundary
Identify counting scope and application boundary
Identify data functions and
their complexity
Identify data functions and
their complexity
Identify data functions and
their complexity
Identify data functions and
their complexity
Identify transactional functions and
their complexity
Identify transactional functions and
their complexity
Identify transactional functions and
their complexity
Identify transactional functions and
their complexity
Determine unadjusted
function point count
Determine unadjusted
function point count
Determine unadjusted
function point count
Determine unadjusted
function point count
Determine value adjustment
factor
Determine value adjustment
factor
Determine value adjustment
factor
Determine value adjustment
factor
Calculateadjustedfunction
point count
Calculateadjustedfunction
point count
Calculateadjustedfunction
point count
Calculateadjustedfunction
point count
Identify algorithmsIdentify
algorithmsIdentify
algorithmsIdentify
algorithms
Unadjusted function points and algorithm SLOC sizes are input to the SEER-SEM estimation tool along with other performance parameter values.
SEER-SEM
SEER-SEM
Assign SLOC size to
algorithms
Assign SLOC size to
algorithms
Assign SLOC size to
algorithms
Assign SLOC size to
algorithms
Algorithms are currently sized in SLOC with placeholder values. Later actual values for reused algorithm code will be used where appropriate.
Data stores and I/O Sizing Algorithm Sizing
Orio
n P
roje
ct O
ffice
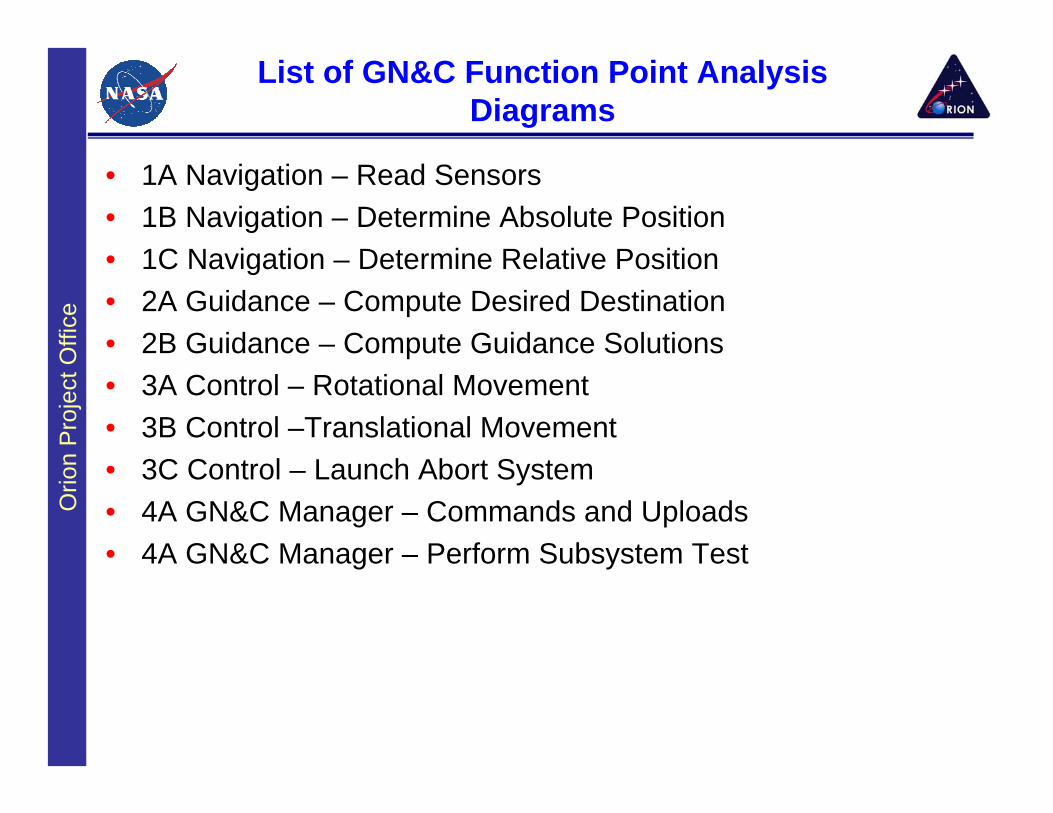
List of GN&C Function Point Analysis Diagrams
• 1A Navigation – Read Sensors• 1B Navigation – Determine Absolute Position• 1C Navigation – Determine Relative Position• 2A Guidance – Compute Desired Destination• 2B Guidance – Compute Guidance Solutions• 3A Control – Rotational Movement• 3B Control –Translational Movement• 3C Control – Launch Abort System• 4A GN&C Manager – Commands and Uploads• 4A GN&C Manager – Perform Subsystem Test
Orio
n P
roje
ct O
ffice
26
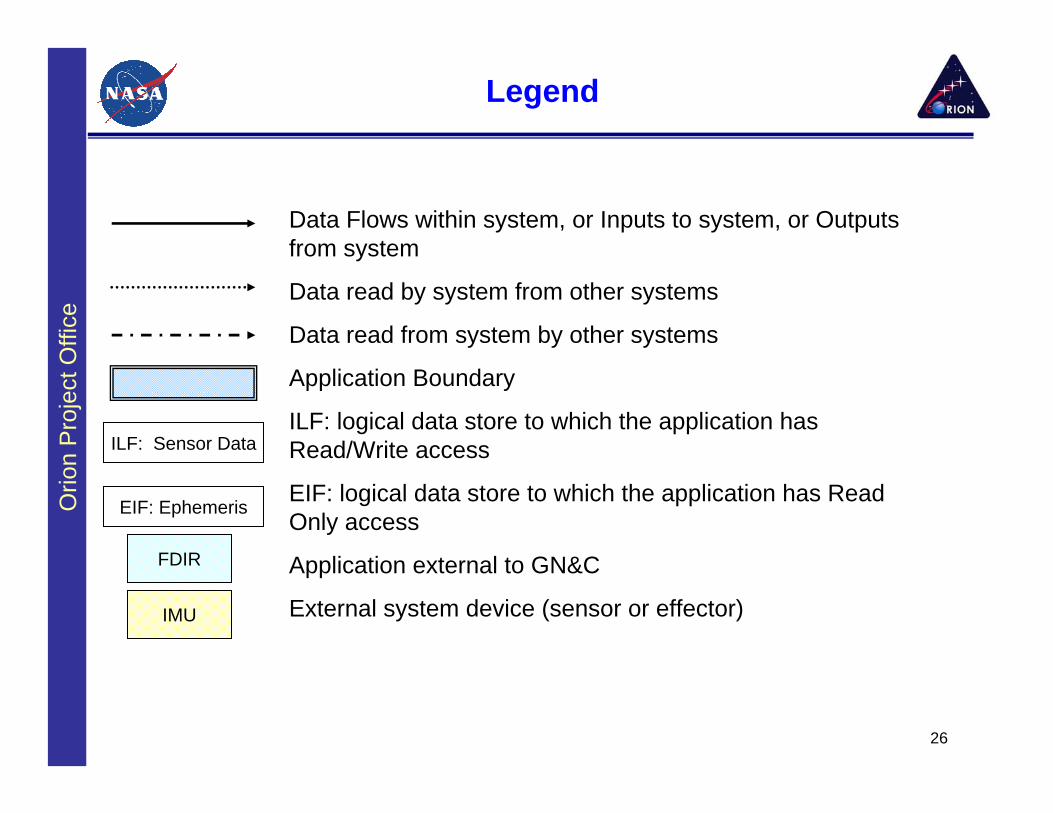
Legend
Data Flows within system, or Inputs to system, or Outputs from system
Data read by system from other systems
Data read from system by other systems
Application Boundary
ILF: logical data store to which the application has Read/Write access
EIF: logical data store to which the application has Read Only access
Application external to GN&C
External system device (sensor or effector)
ILF: Sensor Data
EIF: Ephemeris
FDIR
IMU
Orio
n P
roje
ct O
ffice
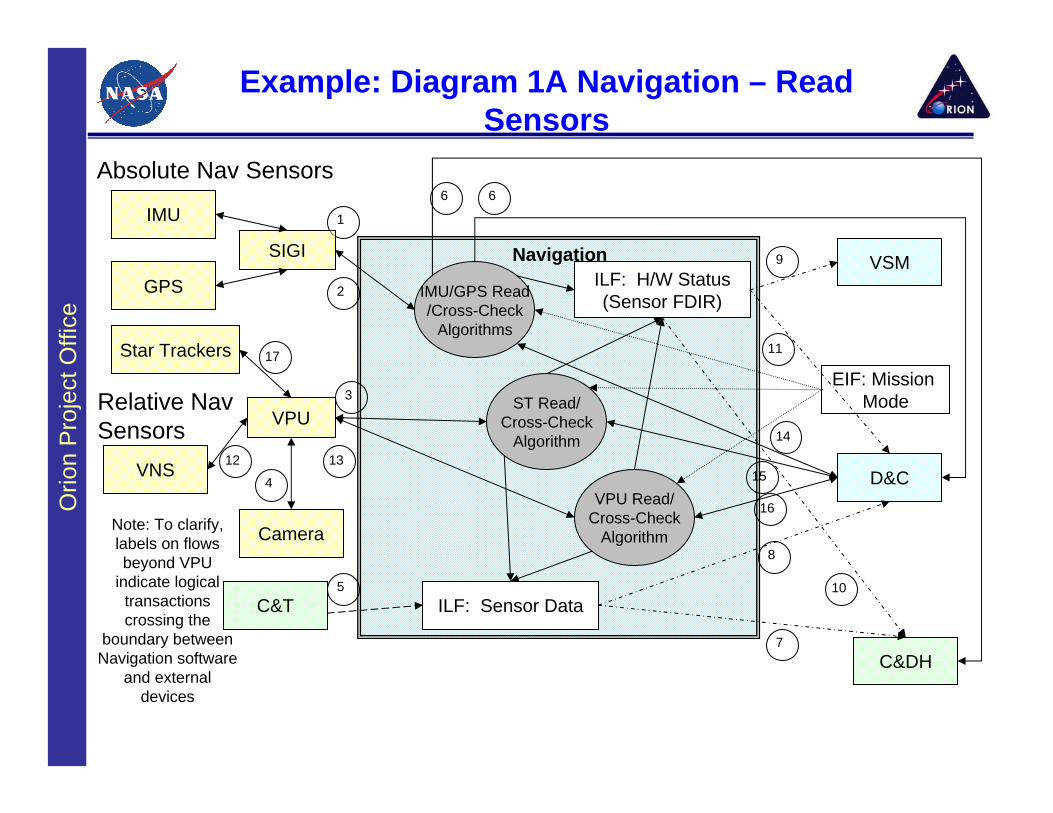
Example: Diagram 1A Navigation – Read Sensors
Absolute Nav Sensors
Relative Nav Sensors
IMU
GPS
Star Trackers
VNS
Camera
ILF: Sensor Data
ILF: H/W Status(Sensor FDIR)
VPU
IMU/GPS Read/Cross-Check
Algorithms
D&C
C&DH
VSM
EIF: Mission Mode
1
2
3
4
5
8
7
9
11
10
SIGI
ST Read/Cross-Check
Algorithm
VPU Read/Cross-Check
Algorithm
6
Navigation
12 13
Note: To clarify, labels on flows beyond VPU
indicate logical transactions crossing the
boundary between Navigation software
and external devices
14
15
16
17
C&T
6
Orio
n P
roje
ct O
ffice
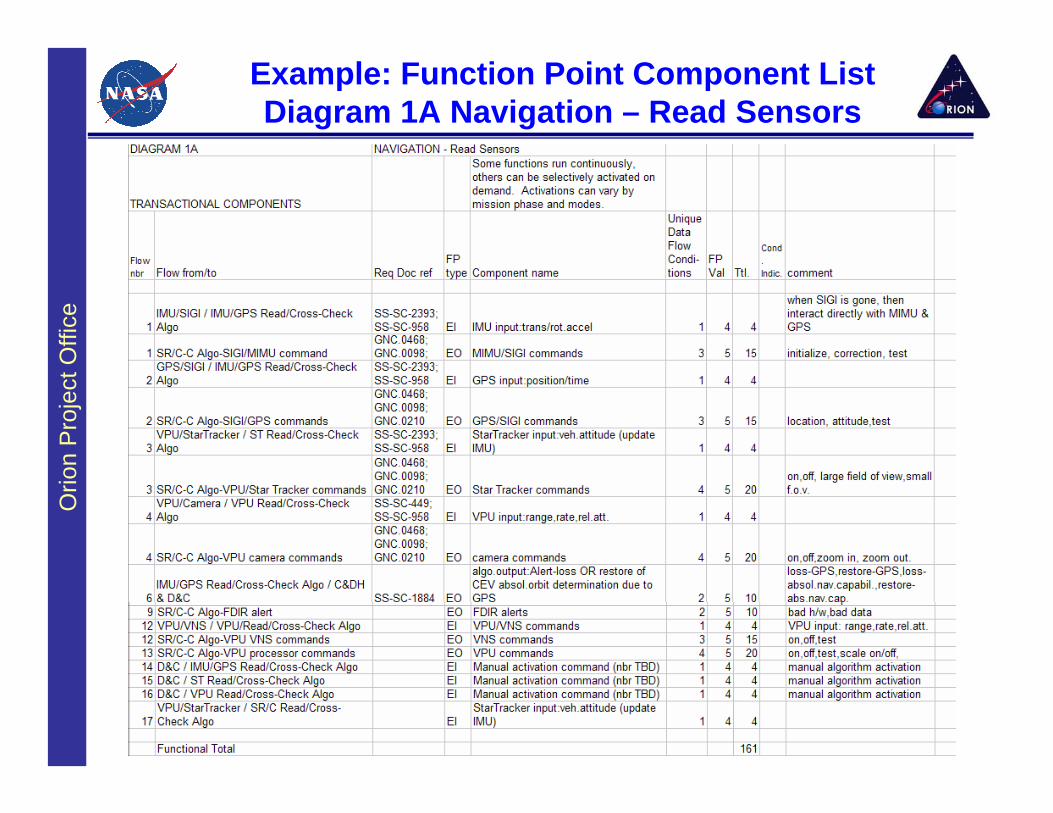
Example: Function Point Component ListDiagram 1A Navigation – Read Sensors
Orio
n P
roje
ct O
ffice Agenda
•Task Background•Function Points Concepts•GN&C Function Point Analysis•GN&C SEER-SEM Estimate
Orio
n P
roje
ct O
ffice
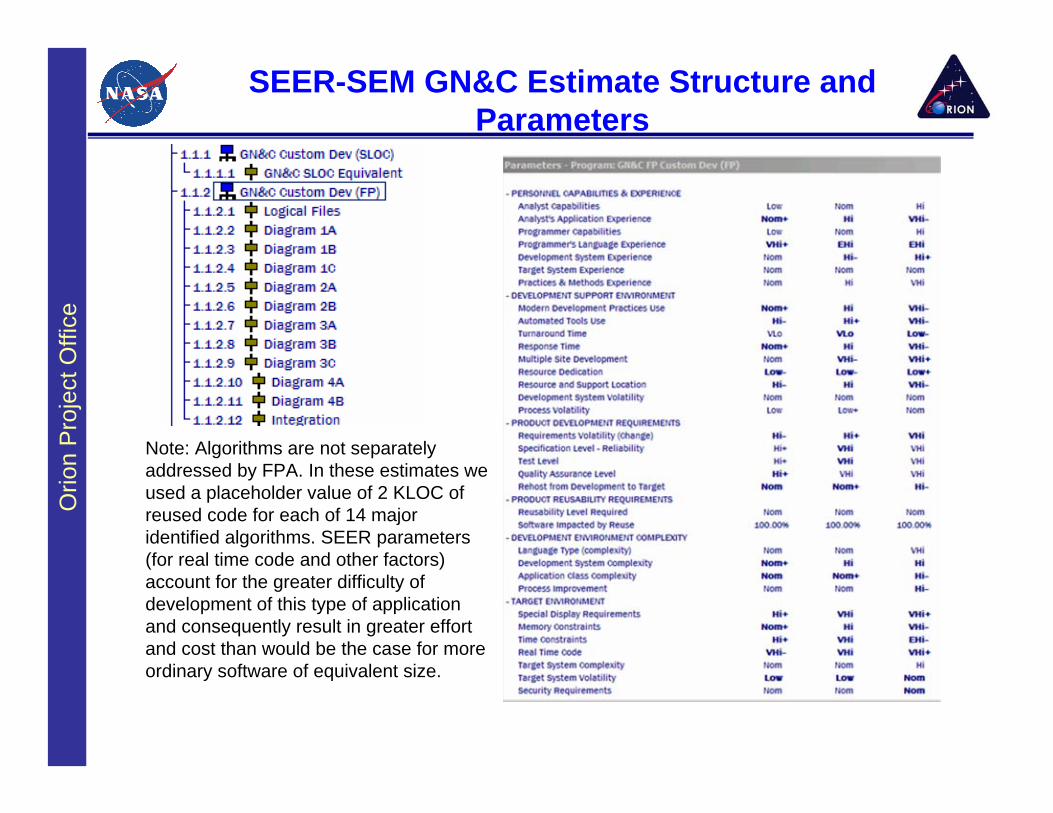
SEER-SEM GN&C Estimate Structure and Parameters
Note: Algorithms are not separately addressed by FPA. In these estimates we used a placeholder value of 2 KLOC of reused code for each of 14 major identified algorithms. SEER parameters (for real time code and other factors) account for the greater difficulty of development of this type of application and consequently result in greater effort and cost than would be the case for more ordinary software of equivalent size.
Orio
n P
roje
ct O
ffice
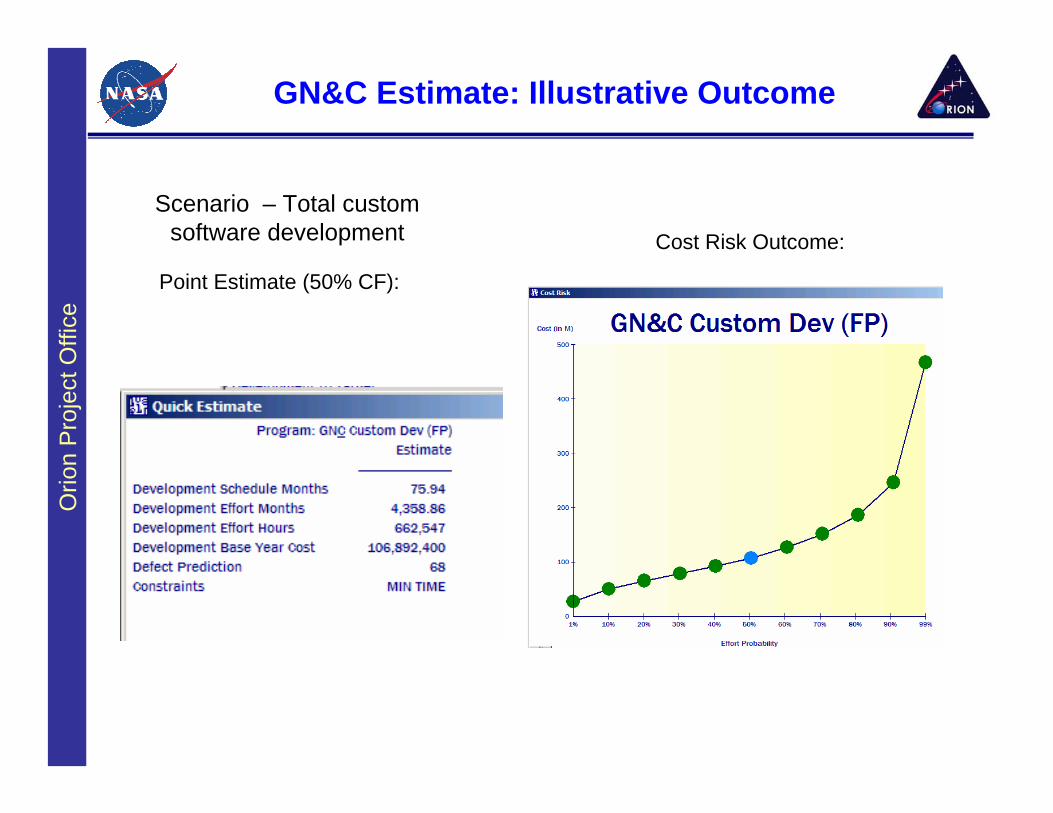
GN&C Estimate: Illustrative Outcome
Scenario – Total custom software development
Point Estimate (50% CF):
Cost Risk Outcome:
Orio
n P
roje
ct O
ffice
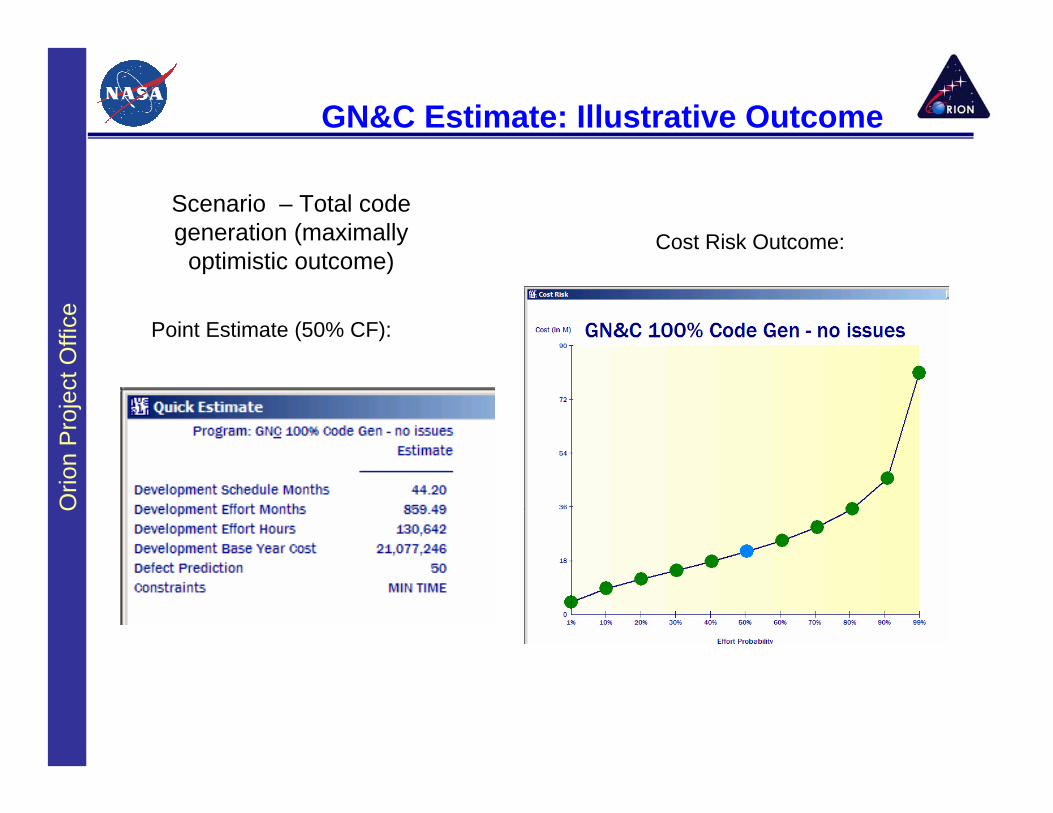
GN&C Estimate: Illustrative Outcome
Scenario – Total code generation (maximally
optimistic outcome)
Point Estimate (50% CF):
Cost Risk Outcome:
Orio
n P
roje
ct O
ffice
GN&C Estimate: Function Point to SLOC Equivalence
• There is no reliable translation table or method of crosswalk between SLOC and function points
• Software estimates here are sized in function points and then combined with additional parameters specific to the application type, environment, etc. to produce a cost estimate
• To determine an equivalent representation of cost based on SLOC we reverse engineered the function point solution to determine the equivalent size in SLOC that could be created with the same costand effort.
• According to SEER in the scenario of a solution based on custom code the development of 112.5K to 150K SLOC would require effortequivalent to the development of the current estimate of 939 function points for GN&C (including expected incorporation of reused codefor algorithms, currently a placeholder value)
Orio
n P
roje
ct O
ffice
34
Forward work and an Overview of the rest of the FSW
• Booz Allen did not have sufficient funding to continue developing a FP based size estimate for the CSCI beyond the work done for theGNC illustration
• We continue to work on developing a SEER- SEM estimate for the total FSW architecture using SLOC counts provided by the Prime and its teammates
• The FSW consists of flight software which includes GNC, Electronic Ground Support Equipement (EGSE) (ground software), Data Service, Firmware and Test and Simulation software
• NASA held the Software Requirements Review in March and we are incorporating that data in the estimate with the assistance of Gary Constantine, Galorath senior consultant