HDI india vs pakistan
15
HDI:INDIA Vs PAKISTAN COMPARISON BETWEEN HDI INDICATORS OF INDIA AND PAKISTAN
-
Upload
sameer-kumar -
Category
Economy & Finance
-
view
647 -
download
0
Transcript of HDI india vs pakistan
HDI:INDIA Vs PAKISTANCOMPARISON BETWEEN HDI INDICATORS OF INDIA AND PAKISTAN
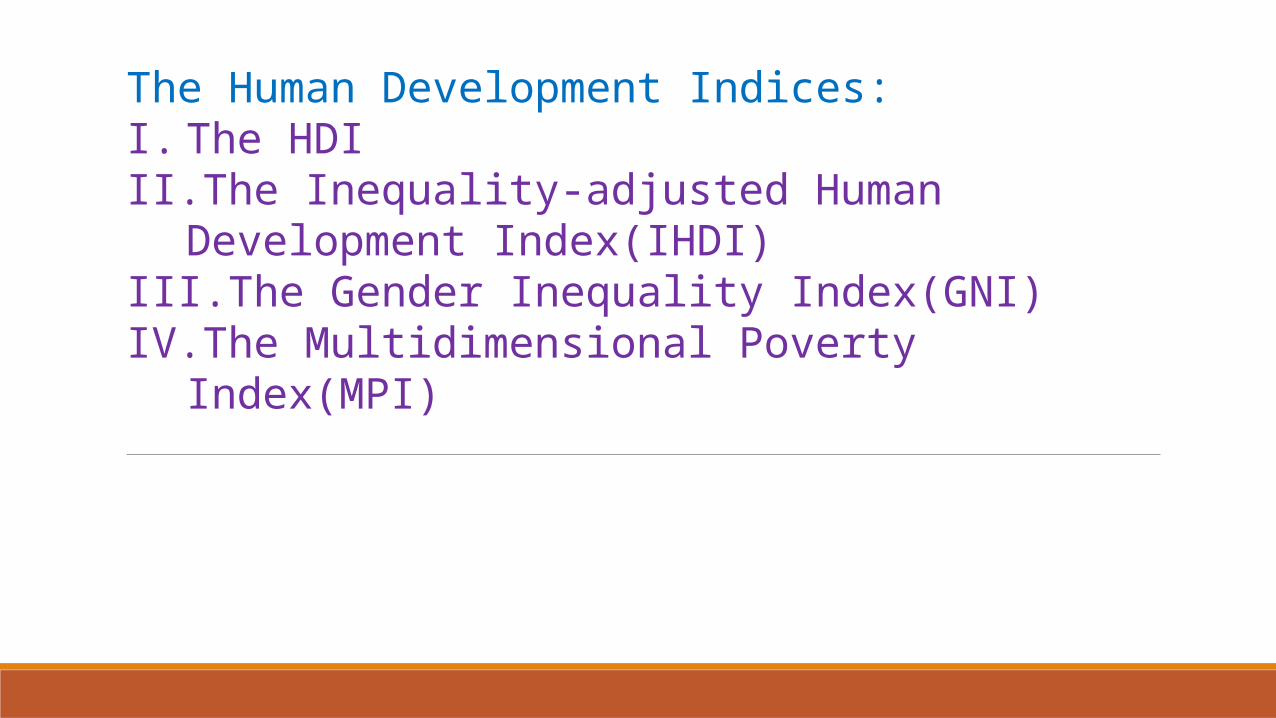
The Human Development Indices:I. The HDIII. The Inequality-adjusted Human Development
Index(IHDI)III. The Gender Inequality Index(GNI)IV. The Multidimensional Poverty Index(MPI)
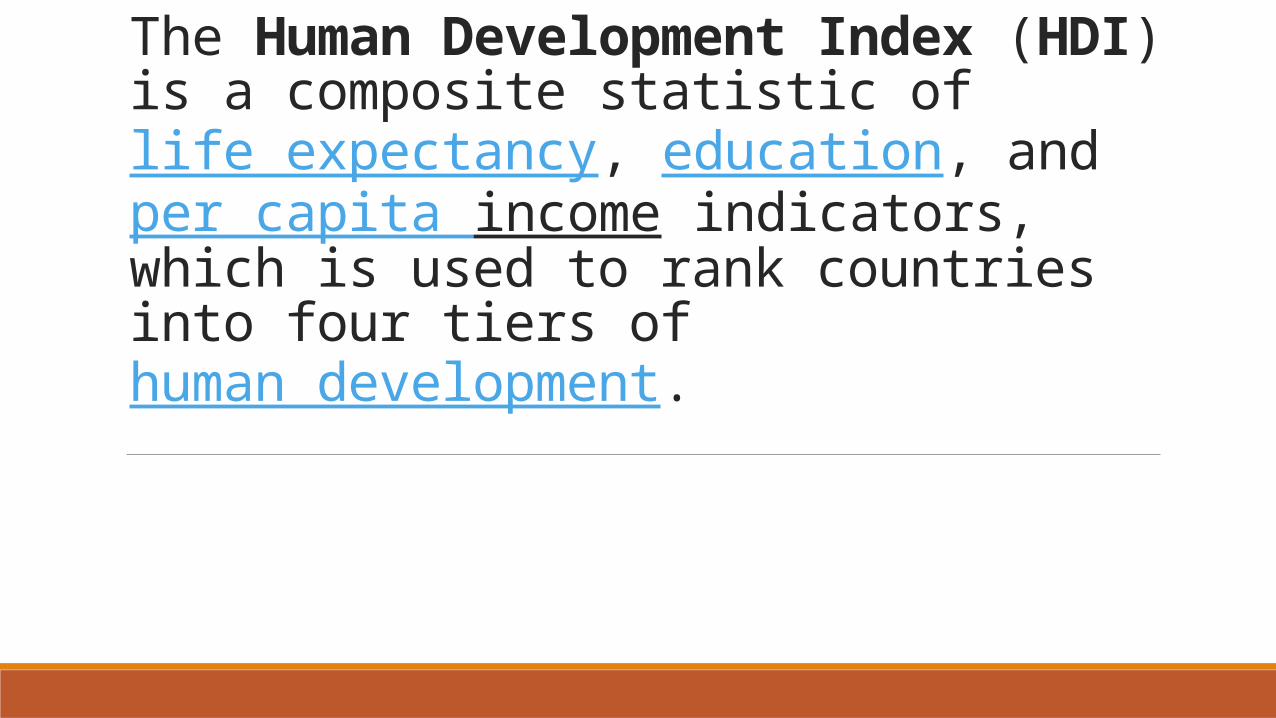
What is HDI?The Human Development Index (HDI) is a composite statistic of life expectancy, education, and per capita income indicators, which is used to rank countries into four tiers of human development.
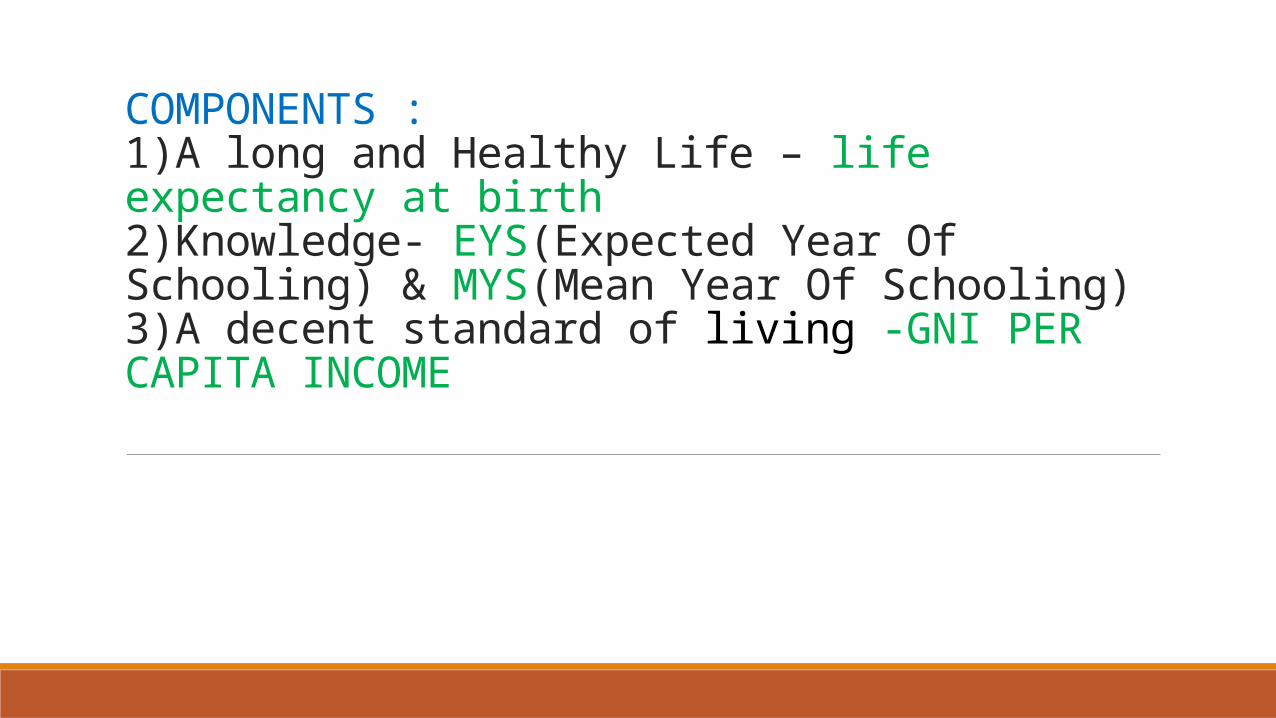
COMPONENTS :1)A long and Healthy Life – life expectancy at birth2)Knowledge- EYS(Expected Year Of Schooling) & MYS(Mean Year Of Schooling)3)A decent standard of living -GNI PER CAPITA INCOME
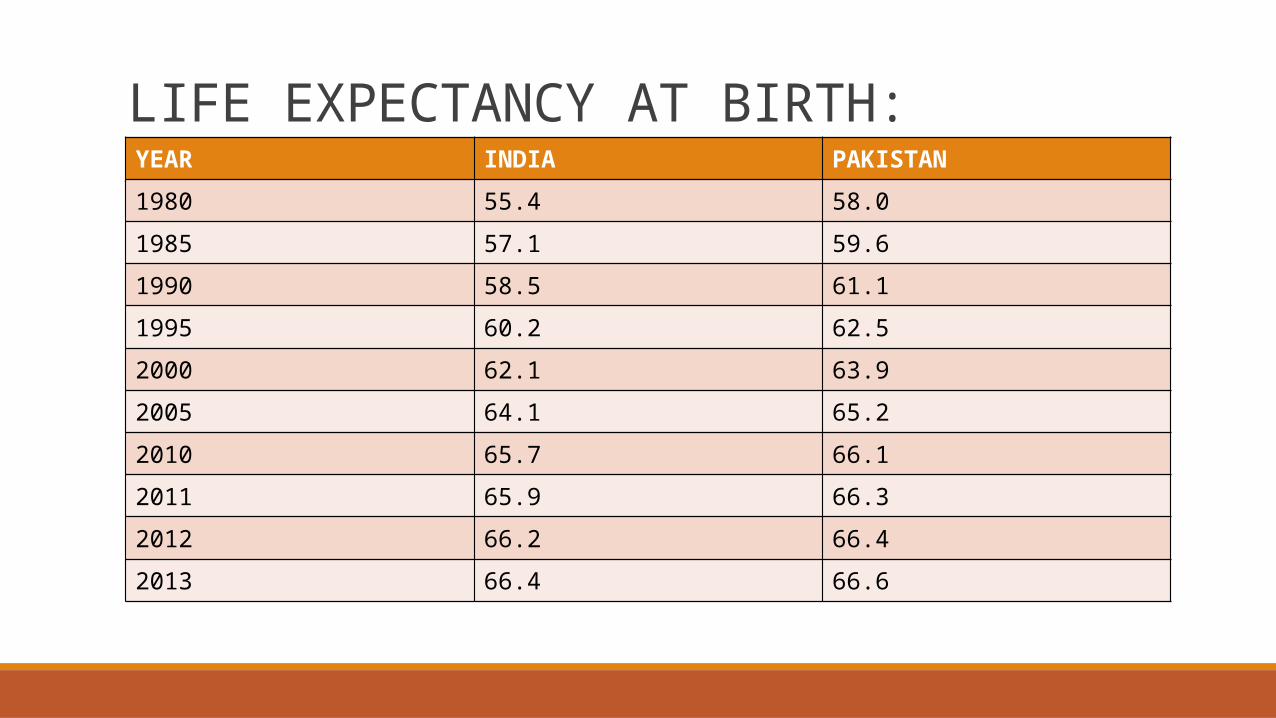
LIFE EXPECTANCY AT BIRTH:YEAR INDIA PAKISTAN
1980 55.4 58.0
1985 57.1 59.6
1990 58.5 61.1
1995 60.2 62.5
2000 62.1 63.9
2005 64.1 65.2
2010 65.7 66.1
2011 65.9 66.3
2012 66.2 66.4
2013 66.4 66.6
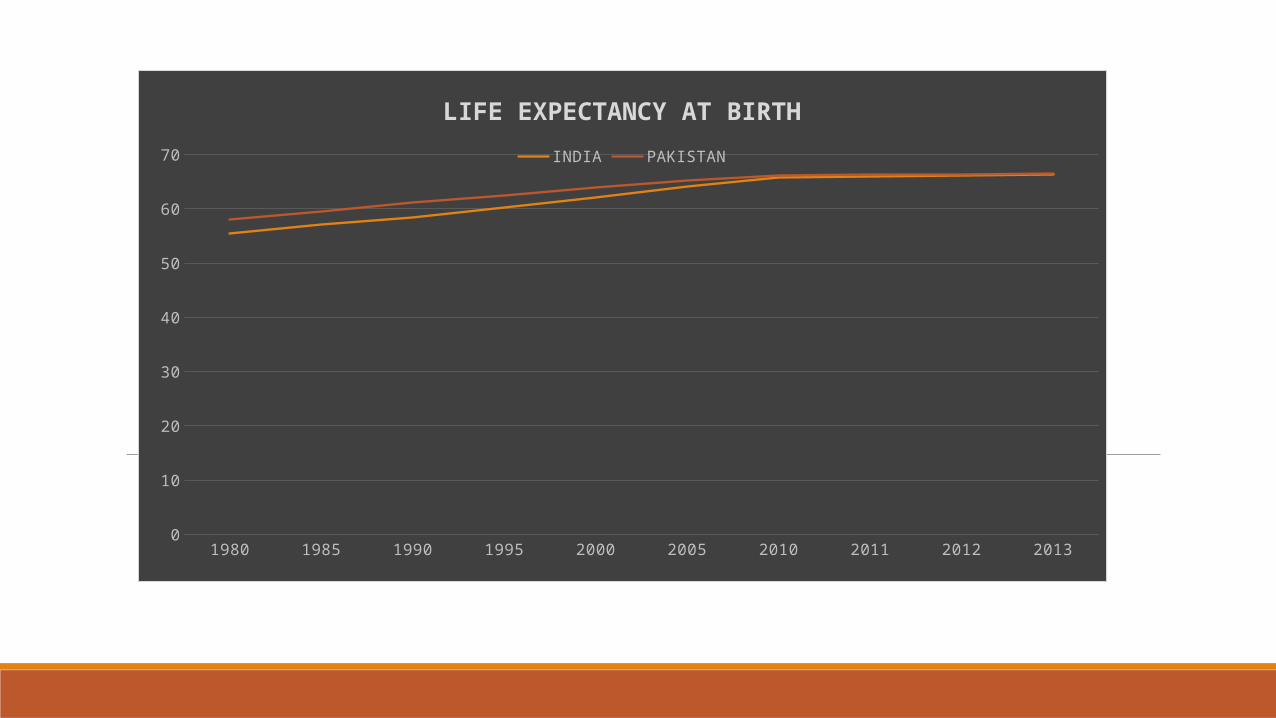
1980 1985 1990 1995 2000 2005 2010 2011 2012 20130
10
20
30
40
50
60
70
LIFE EXPECTANCY AT BIRTHINDIA PAKISTAN
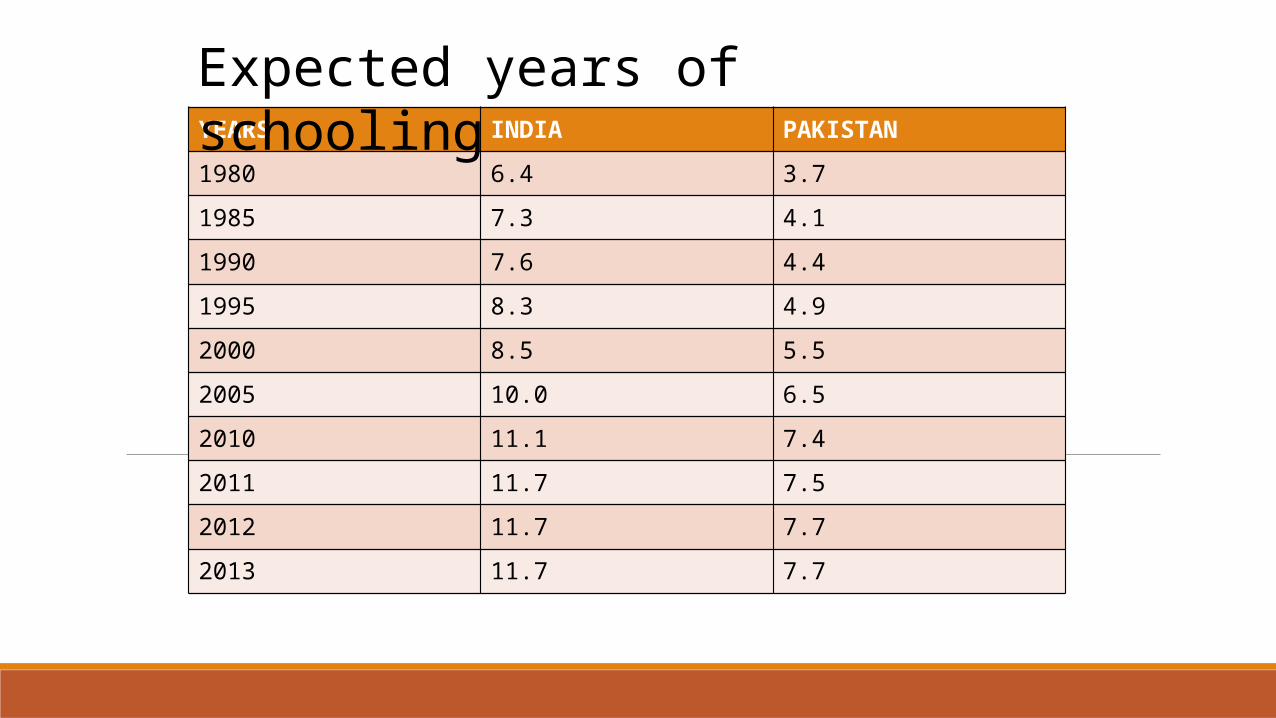
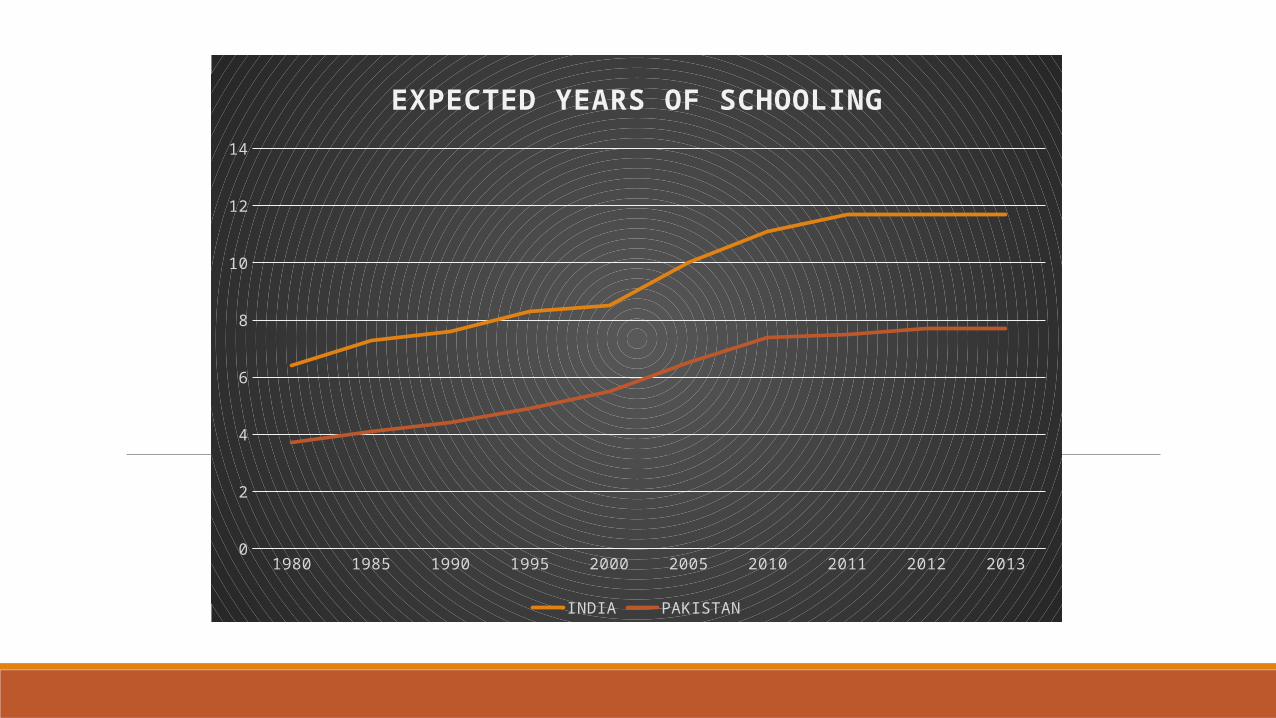
YEARS INDIA PAKISTAN
1980 6.4 3.7
1985 7.3 4.1
1990 7.6 4.4
1995 8.3 4.9
2000 8.5 5.5
2005 10.0 6.5
2010 11.1 7.4
2011 11.7 7.5
2012 11.7 7.7
2013 11.7 7.7
Expected years of schooling
1980 1985 1990 1995 2000 2005 2010 2011 2012 20130
2
4
6
8
10
12
14
EXPECTED YEARS OF SCHOOLING
INDIA PAKISTAN
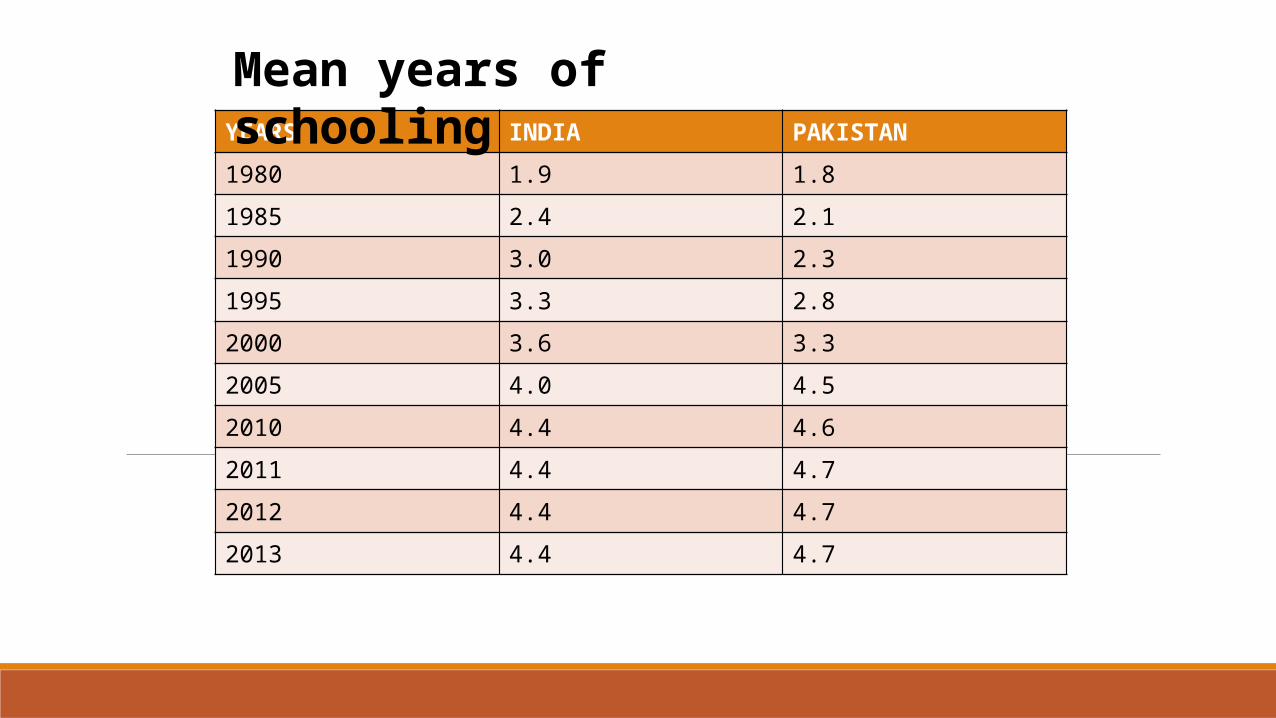
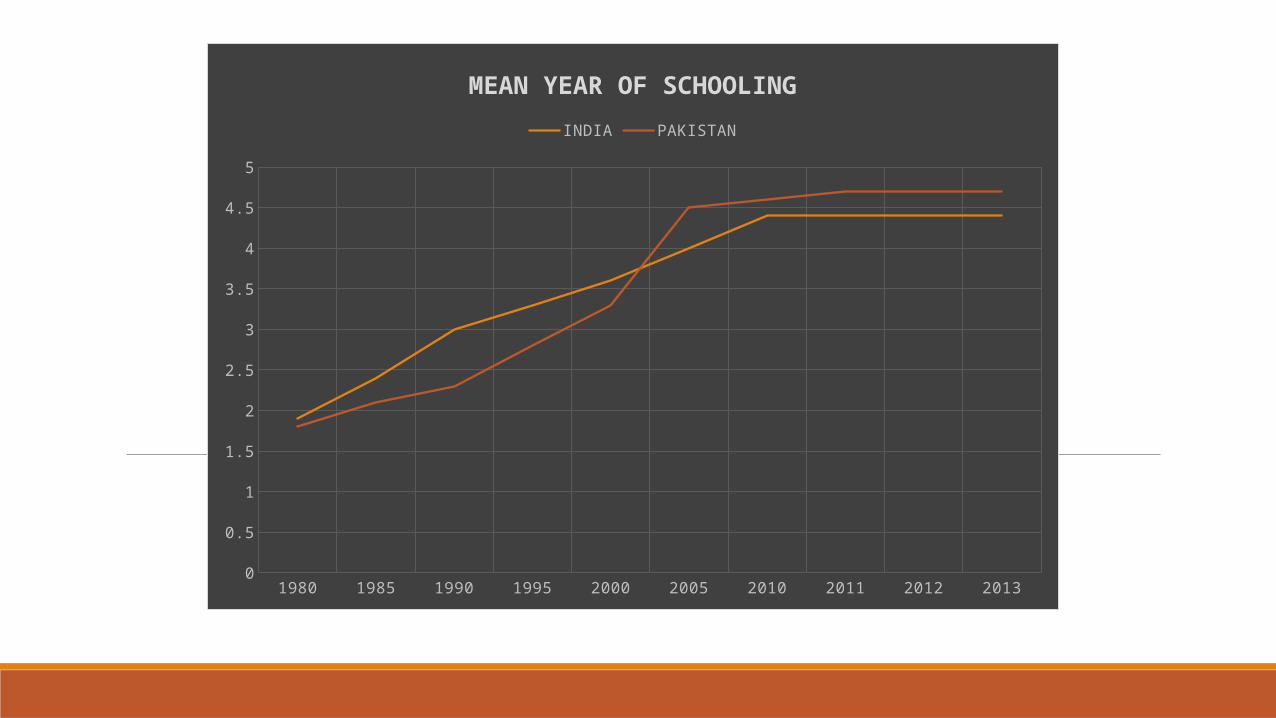
YEARS INDIA PAKISTAN
1980 1.9 1.8
1985 2.4 2.1
1990 3.0 2.3
1995 3.3 2.8
2000 3.6 3.3
2005 4.0 4.5
2010 4.4 4.6
2011 4.4 4.7
2012 4.4 4.7
2013 4.4 4.7
Mean years of schooling
1980 1985 1990 1995 2000 2005 2010 2011 2012 20130
0.5
1
1.5
2
2.5
3
3.5
4
4.5
5
MEAN YEAR OF SCHOOLINGINDIA PAKISTAN
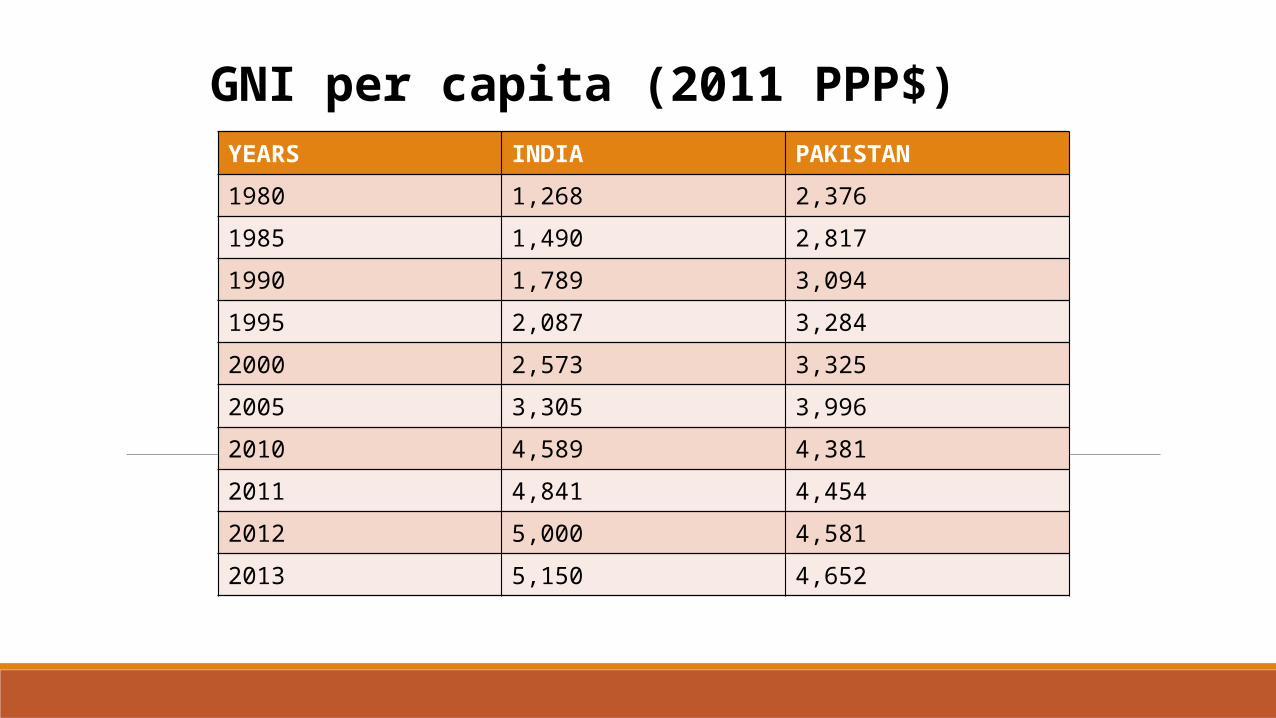
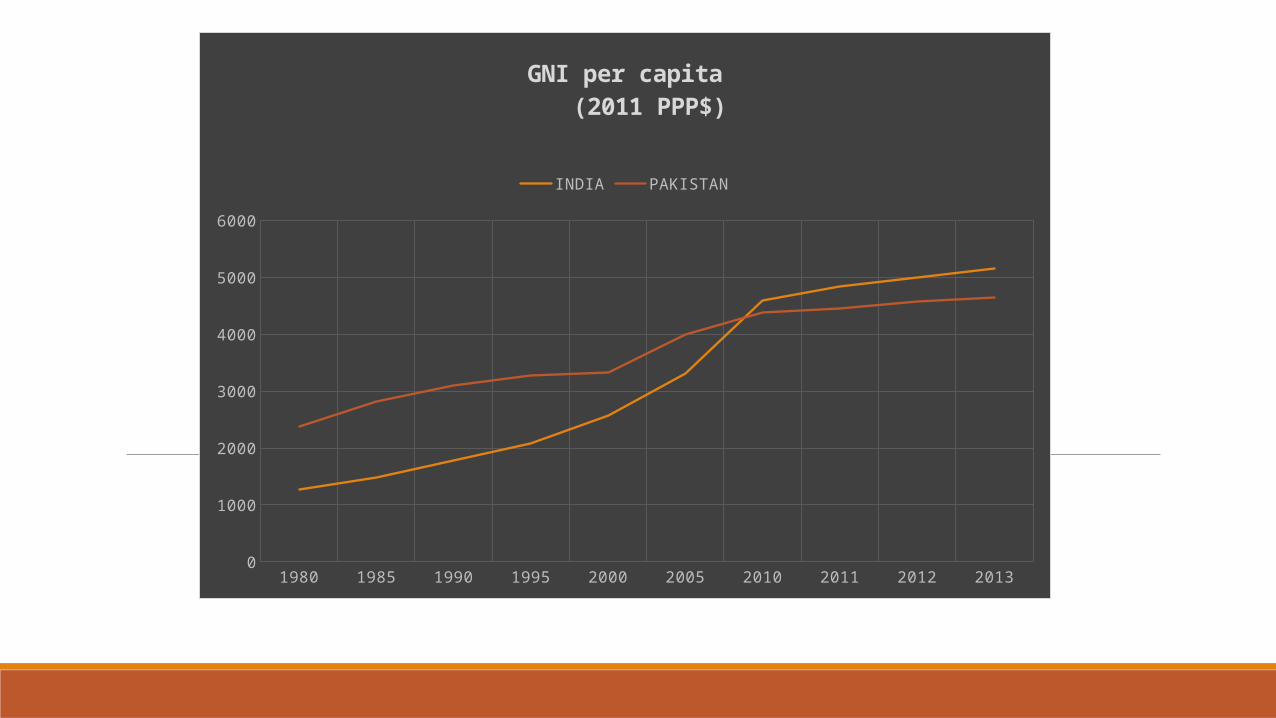
YEARS INDIA PAKISTAN
1980 1,268 2,376
1985 1,490 2,817
1990 1,789 3,094
1995 2,087 3,284
2000 2,573 3,325
2005 3,305 3,996
2010 4,589 4,381
2011 4,841 4,454
2012 5,000 4,581
2013 5,150 4,652
GNI per capita (2011 PPP$)
1980 1985 1990 1995 2000 2005 2010 2011 2012 20130
1000
2000
3000
4000
5000
6000
GNI per capita (2011 PPP$)
INDIA PAKISTAN
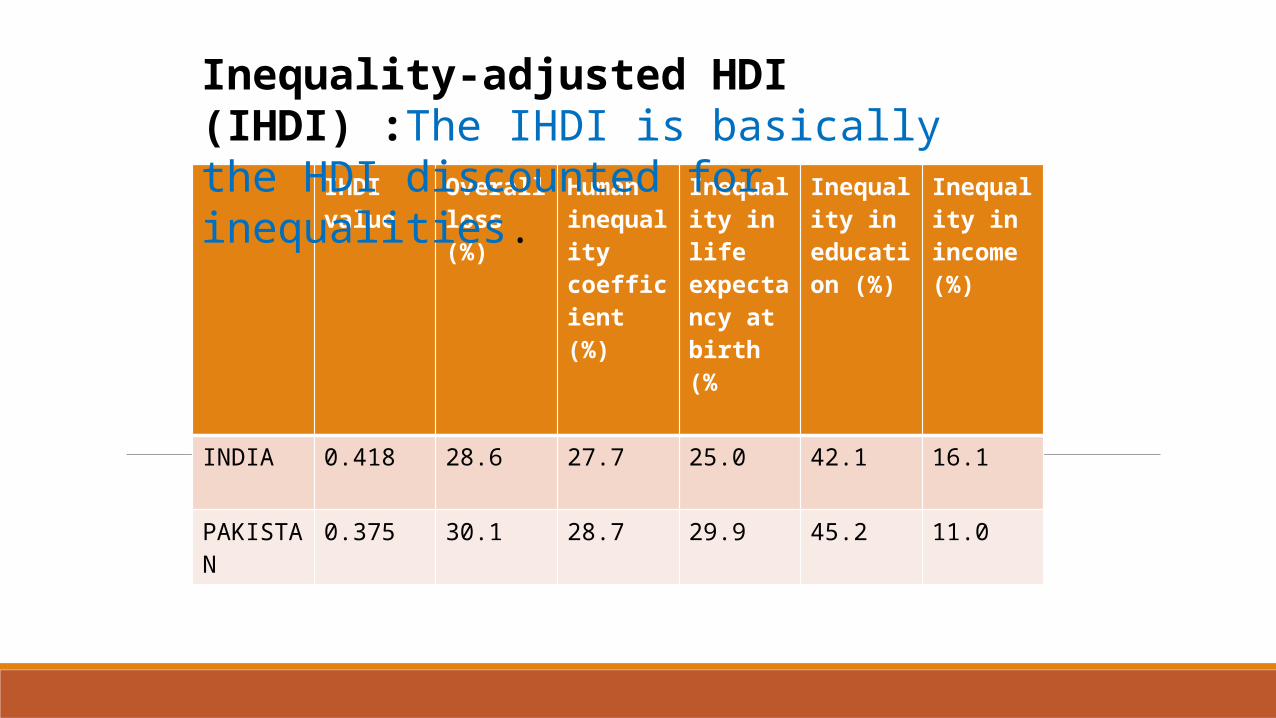
IHDI value Overall loss (%)
Human inequality coefficient (%)
Inequality in life expectancy at birth (%
Inequality in education (%)
Inequality in income (%)
INDIA 0.418 28.6 27.7 25.0 42.1 16.1
PAKISTAN 0.375 30.1 28.7 29.9 45.2 11.0
Inequality-adjusted HDI (IHDI) :The IHDI is basically the HDI discounted for inequalities.
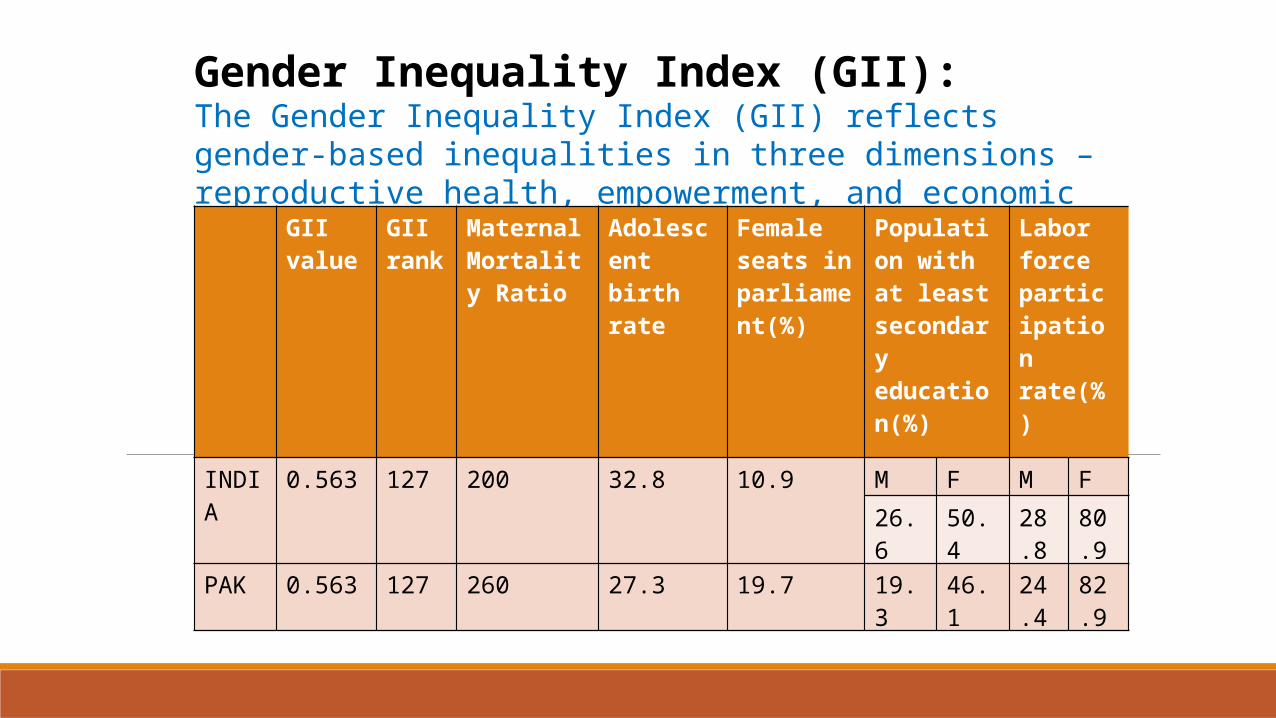
Gender Inequality Index (GII):The Gender Inequality Index (GII) reflects gender-based inequalities in three dimensions – reproductive health, empowerment, and economic activity.
GII value
GII rank
Maternal Mortality Ratio
Adolescent birth rate
Female seats in parliament(%)
Population with at least secondary education(%)
Labor force participation rate(%)
INDIA 0.563 127 200 32.8 10.9 M F M F
26.6 50.4 28.8
80.9
PAK 0.563 127 260 27.3 19.7 19.3 46.1 24.4
82.9
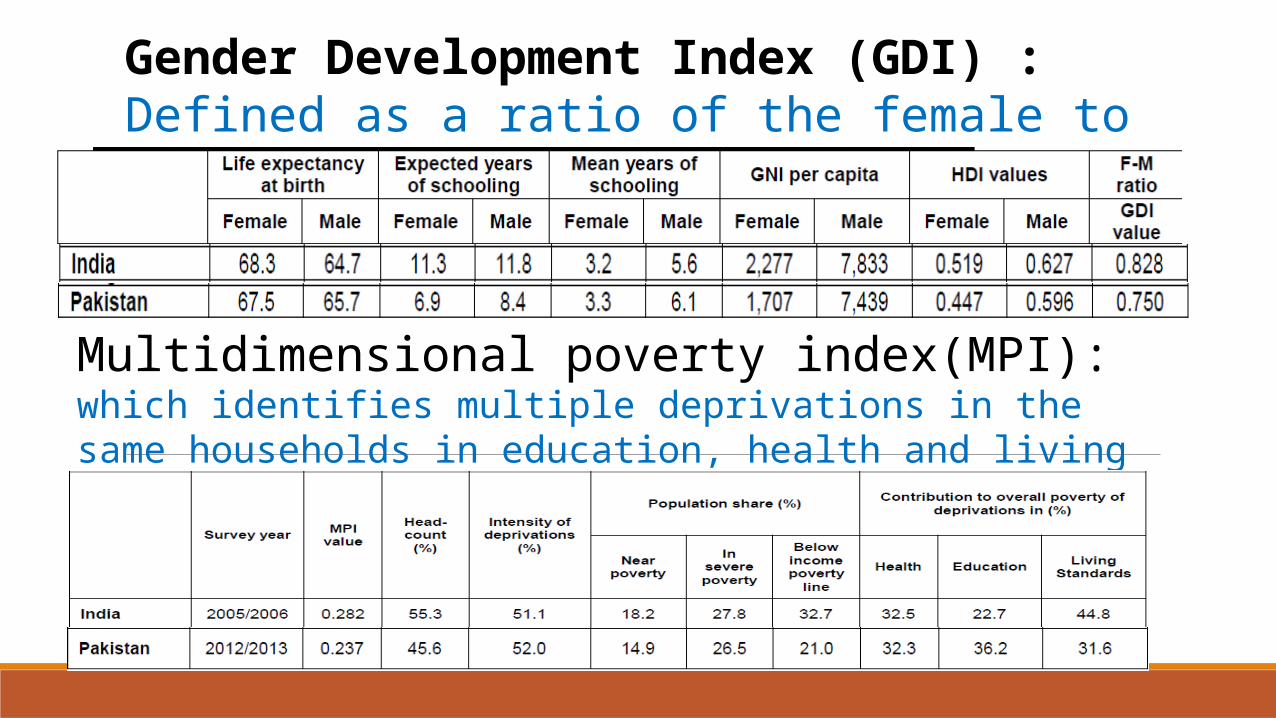
Gender Development Index (GDI) :Defined as a ratio of the female to the male HDI.
Multidimensional poverty index(MPI):which identifies multiple deprivations in the same households in education, health and living standards.


![[KONFLIK] Perebutn Kashmir Antra India n Pakistan](https://static.fdocument.pub/doc/165x107/5571fa884979599169927043/konflik-perebutn-kashmir-antra-india-n-pakistan.jpg)