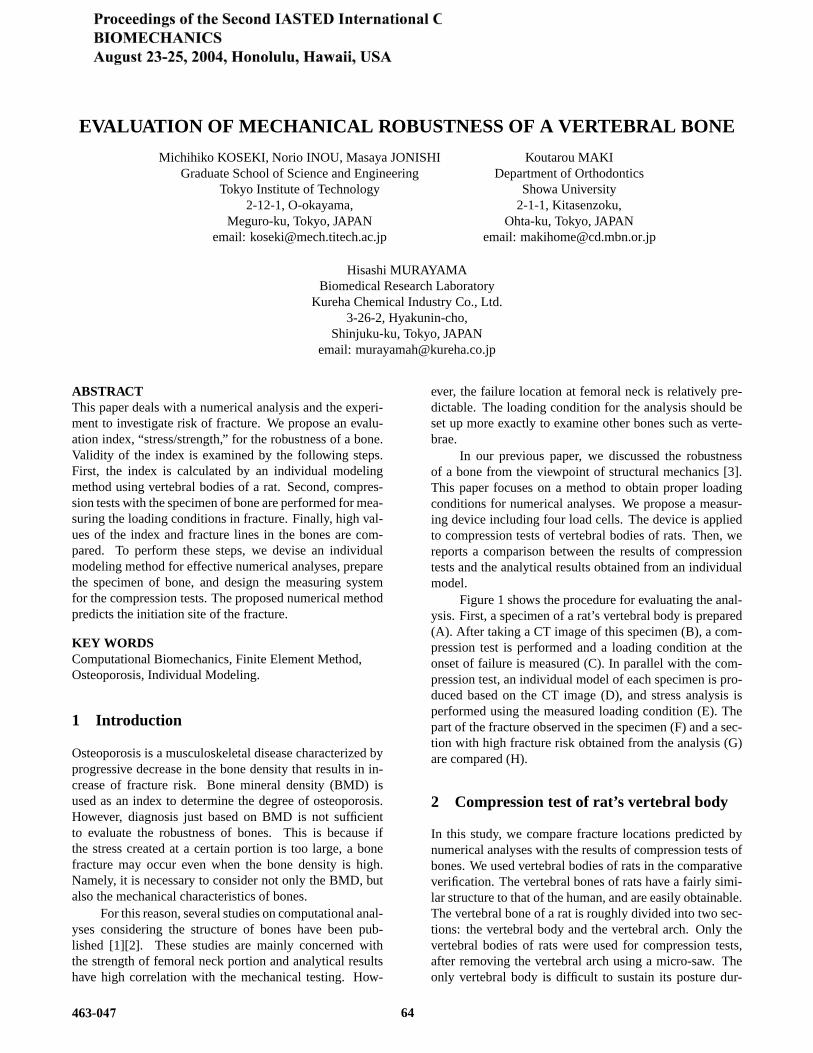
EVALUATION OF MECHANICAL ROBUSTNESS OF A VERTEBRAL …
4
EVALUATION OF MECHANICAL ROBUSTNESS OF A VERTEBRAL BONE Michihiko KOSEKI, Norio INOU, Masaya JONISHI Graduate School of Science and Engineering Tokyo Institute of Technology 2-12-1, O-okayama, Meguro-ku, Tokyo, JAPAN email: [email protected] Koutarou MAKI Department of Orthodontics Showa University 2-1-1, Kitasenzoku, Ohta-ku, Tokyo, JAPAN email: [email protected] Hisashi MURAYAMA Biomedical Research Laboratory Kureha Chemical Industry Co., Ltd. 3-26-2, Hyakunin-cho, Shinjuku-ku, Tokyo, JAPAN email: [email protected] ABSTRACT This paper deals with a numerical analysis and the experi- ment to investigate risk of fracture. We propose an evalu- ation index, “stress/strength,” for the robustness of a bone. Validity of the index is examined by the following steps. First, the index is calculated by an individual modeling method using vertebral bodies of a rat. Second, compres- sion tests with the specimen of bone are performed for mea- suring the loading conditions in fracture. Finally, high val- ues of the index and fracture lines in the bones are com- pared. To perform these steps, we devise an individual modeling method for effective numerical analyses, prepare the specimen of bone, and design the measuring system for the compression tests. The proposed numerical method predicts the initiation site of the fracture. KEY WORDS Computational Biomechanics, Finite Element Method, Osteoporosis, Individual Modeling. 1 Introduction Osteoporosis is a musculoskeletal disease characterized by progressive decrease in the bone density that results in in- crease of fracture risk. Bone mineral density (BMD) is used as an index to determine the degree of osteoporosis. However, diagnosis just based on BMD is not sufficient to evaluate the robustness of bones. This is because if the stress created at a certain portion is too large, a bone fracture may occur even when the bone density is high. Namely, it is necessary to consider not only the BMD, but also the mechanical characteristics of bones. For this reason, several studies on computational anal- yses considering the structure of bones have been pub- lished [1][2]. These studies are mainly concerned with the strength of femoral neck portion and analytical results have high correlation with the mechanical testing. How- ever, the failure location at femoral neck is relatively pre- dictable. The loading condition for the analysis should be set up more exactly to examine other bones such as verte- brae. In our previous paper, we discussed the robustness of a bone from the viewpoint of structural mechanics [3]. This paper focuses on a method to obtain proper loading conditions for numerical analyses. We propose a measur- ing device including four load cells. The device is applied to compression tests of vertebral bodies of rats. Then, we reports a comparison between the results of compression tests and the analytical results obtained from an individual model. Figure 1 shows the procedure for evaluating the anal- ysis. First, a specimen of a rat’s vertebral body is prepared (A). After taking a CT image of this specimen (B), a com- pression test is performed and a loading condition at the onset of failure is measured (C). In parallel with the com- pression test, an individual model of each specimen is pro- duced based on the CT image (D), and stress analysis is performed using the measured loading condition (E). The part of the fracture observed in the specimen (F) and a sec- tion with high fracture risk obtained from the analysis (G) are compared (H). 2 Compression test of rat’s vertebral body In this study, we compare fracture locations predicted by numerical analyses with the results of compression tests of bones. We used vertebral bodies of rats in the comparative verification. The vertebral bones of rats have a fairly simi- lar structure to that of the human, and are easily obtainable. The vertebral bone of a rat is roughly divided into two sec- tions: the vertebral body and the vertebral arch. Only the vertebral bodies of rats were used for compression tests, after removing the vertebral arch using a micro-saw. The only vertebral body is difficult to sustain its posture dur- 463-047 64
Transcript of EVALUATION OF MECHANICAL ROBUSTNESS OF A VERTEBRAL …
EVALUATION OF MECHANICAL ROBUSTNESS OF A VERTEBRAL BONE
Michihiko KOSEKI, Norio INOU, Masaya JONISHIGraduate School of Science and Engineering
Tokyo Institute of Technology2-12-1, O-okayama,
Meguro-ku, Tokyo, JAPANemail: [email protected]
Koutarou MAKIDepartment of Orthodontics
Showa University2-1-1, Kitasenzoku,
Ohta-ku, Tokyo, JAPANemail: [email protected]
Hisashi MURAYAMABiomedical Research Laboratory
Kureha Chemical Industry Co., Ltd.3-26-2, Hyakunin-cho,
Shinjuku-ku, Tokyo, JAPANemail: [email protected]
ABSTRACTThis paper deals with a numerical analysis and the experi-ment to investigate risk of fracture. We propose an evalu-ation index, “stress/strength,” for the robustness of a bone.Validity of the index is examined by the following steps.First, the index is calculated by an individual modelingmethod using vertebral bodies of a rat. Second, compres-sion tests with the specimen of bone are performed for mea-suring the loading conditions in fracture. Finally, high val-ues of the index and fracture lines in the bones are com-pared. To perform these steps, we devise an individualmodeling method for effective numerical analyses, preparethe specimen of bone, and design the measuring systemfor the compression tests. The proposed numerical methodpredicts the initiation site of the fracture.
KEY WORDSComputational Biomechanics, Finite Element Method,Osteoporosis, Individual Modeling.
1 Introduction
Osteoporosis is a musculoskeletal disease characterized byprogressive decrease in the bone density that results in in-crease of fracture risk. Bone mineral density (BMD) isused as an index to determine the degree of osteoporosis.However, diagnosis just based on BMD is not sufficientto evaluate the robustness of bones. This is because ifthe stress created at a certain portion is too large, a bonefracture may occur even when the bone density is high.Namely, it is necessary to consider not only the BMD, butalso the mechanical characteristics of bones.
For this reason, several studies on computational anal-yses considering the structure of bones have been pub-lished [1][2]. These studies are mainly concerned withthe strength of femoral neck portion and analytical resultshave high correlation with the mechanical testing. How-
ever, the failure location at femoral neck is relatively pre-dictable. The loading condition for the analysis should beset up more exactly to examine other bones such as verte-brae.
In our previous paper, we discussed the robustnessof a bone from the viewpoint of structural mechanics [3].This paper focuses on a method to obtain proper loadingconditions for numerical analyses. We propose a measur-ing device including four load cells. The device is appliedto compression tests of vertebral bodies of rats. Then, wereports a comparison between the results of compressiontests and the analytical results obtained from an individualmodel.
Figure 1 shows the procedure for evaluating the anal-ysis. First, a specimen of a rat’s vertebral body is prepared(A). After taking a CT image of this specimen (B), a com-pression test is performed and a loading condition at theonset of failure is measured (C). In parallel with the com-pression test, an individual model of each specimen is pro-duced based on the CT image (D), and stress analysis isperformed using the measured loading condition (E). Thepart of the fracture observed in the specimen (F) and a sec-tion with high fracture risk obtained from the analysis (G)are compared (H).
2 Compression test of rat’s vertebral body
In this study, we compare fracture locations predicted bynumerical analyses with the results of compression tests ofbones. We used vertebral bodies of rats in the comparativeverification. The vertebral bones of rats have a fairly simi-lar structure to that of the human, and are easily obtainable.The vertebral bone of a rat is roughly divided into two sec-tions: the vertebral body and the vertebral arch. Only thevertebral bodies of rats were used for compression tests,after removing the vertebral arch using a micro-saw. Theonly vertebral body is difficult to sustain its posture dur-
463-047 64
melissa
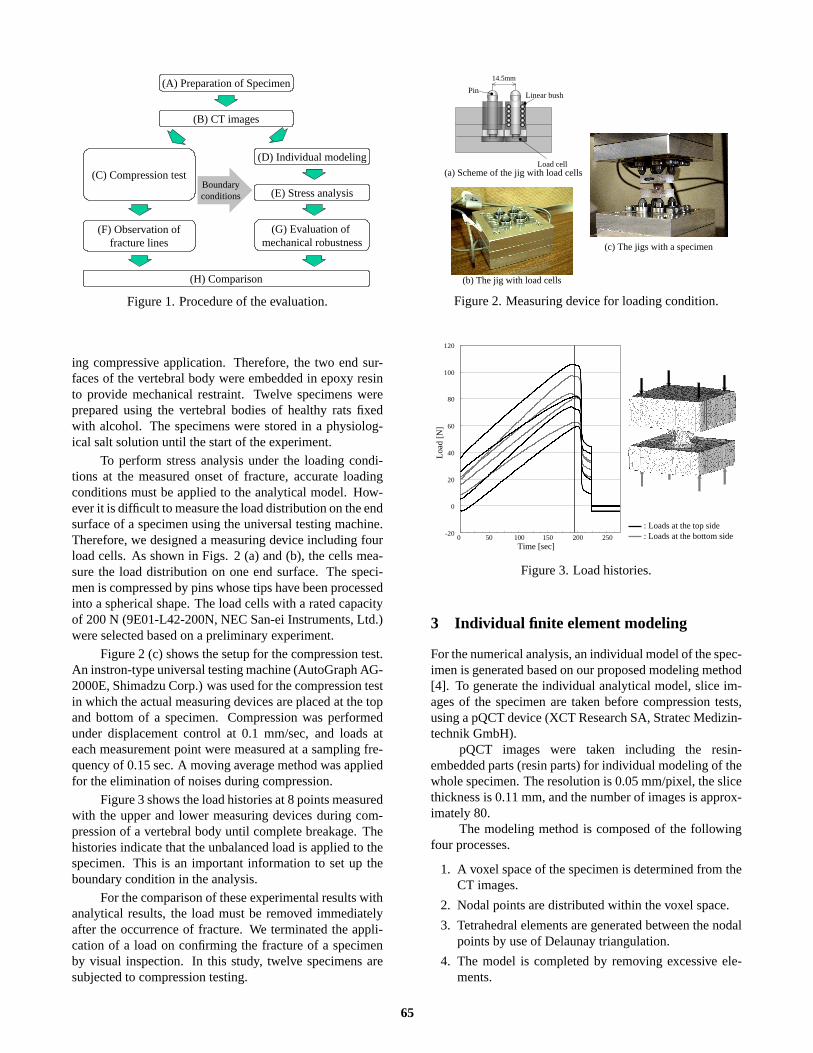
(A) Preparation of Specimen
(B) CT images
(D) Individual modeling
(E) Stress analysis
(G) Evaluation of mechanical robustness
(C) Compression test
(H) Comparison
Boundary conditions
(F) Observation offracture lines
Figure 1. Procedure of the evaluation.
ing compressive application. Therefore, the two end sur-faces of the vertebral body were embedded in epoxy resinto provide mechanical restraint. Twelve specimens wereprepared using the vertebral bodies of healthy rats fixedwith alcohol. The specimens were stored in a physiolog-ical salt solution until the start of the experiment.
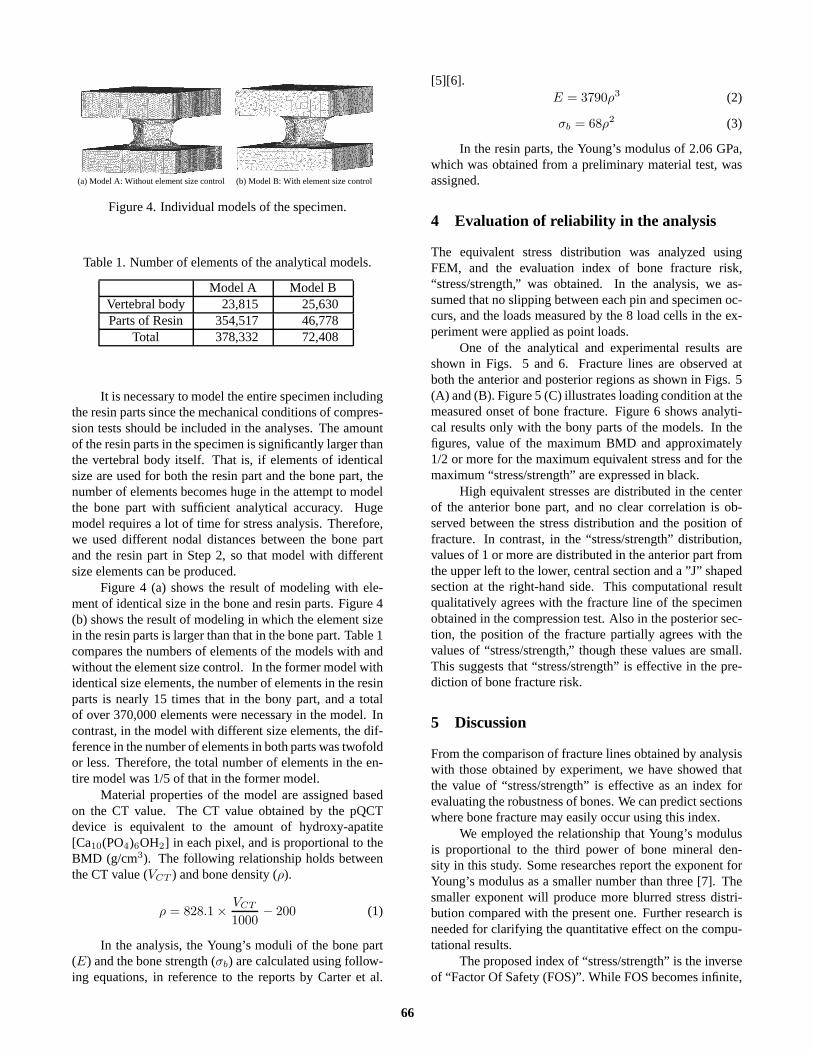
To perform stress analysis under the loading condi-tions at the measured onset of fracture, accurate loadingconditions must be applied to the analytical model. How-ever it is difficult to measure the load distribution on the endsurface of a specimen using the universal testing machine.Therefore, we designed a measuring device including fourload cells. As shown in Figs. 2 (a) and (b), the cells mea-sure the load distribution on one end surface. The speci-men is compressed by pins whose tips have been processedinto a spherical shape. The load cells with a rated capacityof 200 N (9E01-L42-200N, NEC San-ei Instruments, Ltd.)were selected based on a preliminary experiment.
Figure 2 (c) shows the setup for the compression test.An instron-type universal testing machine (AutoGraph AG-2000E, Shimadzu Corp.) was used for the compression testin which the actual measuring devices are placed at the topand bottom of a specimen. Compression was performedunder displacement control at 0.1 mm/sec, and loads ateach measurement point were measured at a sampling fre-quency of 0.15 sec. A moving average method was appliedfor the elimination of noises during compression.
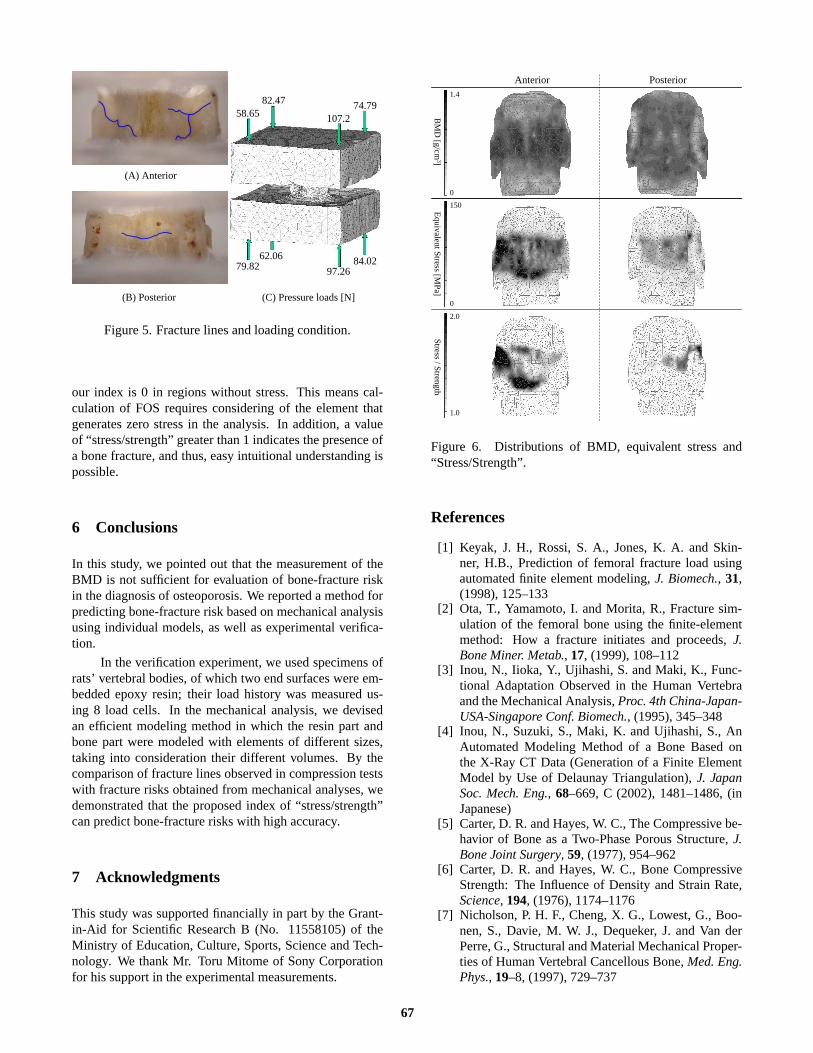
Figure 3 shows the load histories at 8 points measuredwith the upper and lower measuring devices during com-pression of a vertebral body until complete breakage. Thehistories indicate that the unbalanced load is applied to thespecimen. This is an important information to set up theboundary condition in the analysis.
For the comparison of these experimental results withanalytical results, the load must be removed immediatelyafter the occurrence of fracture. We terminated the appli-cation of a load on confirming the fracture of a specimenby visual inspection. In this study, twelve specimens aresubjected to compression testing.
(a) Scheme of the jig with load cells
(b) The jig with load cells
(c) The jigs with a specimen
PinLinear bush
Load cell
14.5mm
Figure 2. Measuring device for loading condition.
-20
0
20
40
60
80
100
120
Load
[N]
Time [sec]
: Loads at the top side: Loads at the bottom side0 50 100 150 200 250
Figure 3. Load histories.
3 Individual finite element modeling
For the numerical analysis, an individual model of the spec-imen is generated based on our proposed modeling method[4]. To generate the individual analytical model, slice im-ages of the specimen are taken before compression tests,using a pQCT device (XCT Research SA, Stratec Medizin-technik GmbH).
pQCT images were taken including the resin-embedded parts (resin parts) for individual modeling of thewhole specimen. The resolution is 0.05 mm/pixel, the slicethickness is 0.11 mm, and the number of images is approx-imately 80.
The modeling method is composed of the followingfour processes.
1. A voxel space of the specimen is determined from theCT images.
2. Nodal points are distributed within the voxel space.
3. Tetrahedral elements are generated between the nodalpoints by use of Delaunay triangulation.
4. The model is completed by removing excessive ele-ments.
65
(a) Model A: Without element size control (b) Model B: With element size control
Figure 4. Individual models of the specimen.
Table 1. Number of elements of the analytical models.
Model A Model BVertebral body 23,815 25,630Parts of Resin 354,517 46,778
Total 378,332 72,408
It is necessary to model the entire specimen includingthe resin parts since the mechanical conditions of compres-sion tests should be included in the analyses. The amountof the resin parts in the specimen is significantly larger thanthe vertebral body itself. That is, if elements of identicalsize are used for both the resin part and the bone part, thenumber of elements becomes huge in the attempt to modelthe bone part with sufficient analytical accuracy. Hugemodel requires a lot of time for stress analysis. Therefore,we used different nodal distances between the bone partand the resin part in Step 2, so that model with differentsize elements can be produced.
Figure 4 (a) shows the result of modeling with ele-ment of identical size in the bone and resin parts. Figure 4(b) shows the result of modeling in which the element sizein the resin parts is larger than that in the bone part. Table 1compares the numbers of elements of the models with andwithout the element size control. In the former model withidentical size elements, the number of elements in the resinparts is nearly 15 times that in the bony part, and a totalof over 370,000 elements were necessary in the model. Incontrast, in the model with different size elements, the dif-ference in the number of elements in both parts was twofoldor less. Therefore, the total number of elements in the en-tire model was 1/5 of that in the former model.
Material properties of the model are assigned basedon the CT value. The CT value obtained by the pQCTdevice is equivalent to the amount of hydroxy-apatite[Ca10(PO4)6OH2] in each pixel, and is proportional to theBMD (g/cm3). The following relationship holds betweenthe CT value (VCT ) and bone density (ρ).
ρ = 828.1 ×
VCT
1000− 200 (1)
In the analysis, the Young’s moduli of the bone part(E) and the bone strength (σb) are calculated using follow-ing equations, in reference to the reports by Carter et al.
[5][6].E = 3790ρ3 (2)
σb = 68ρ2 (3)
In the resin parts, the Young’s modulus of 2.06 GPa,which was obtained from a preliminary material test, wasassigned.
4 Evaluation of reliability in the analysis
The equivalent stress distribution was analyzed usingFEM, and the evaluation index of bone fracture risk,“stress/strength,” was obtained. In the analysis, we as-sumed that no slipping between each pin and specimen oc-curs, and the loads measured by the 8 load cells in the ex-periment were applied as point loads.
One of the analytical and experimental results areshown in Figs. 5 and 6. Fracture lines are observed atboth the anterior and posterior regions as shown in Figs. 5(A) and (B). Figure 5 (C) illustrates loading condition at themeasured onset of bone fracture. Figure 6 shows analyti-cal results only with the bony parts of the models. In thefigures, value of the maximum BMD and approximately1/2 or more for the maximum equivalent stress and for themaximum “stress/strength” are expressed in black.
High equivalent stresses are distributed in the centerof the anterior bone part, and no clear correlation is ob-served between the stress distribution and the position offracture. In contrast, in the “stress/strength” distribution,values of 1 or more are distributed in the anterior part fromthe upper left to the lower, central section and a ”J” shapedsection at the right-hand side. This computational resultqualitatively agrees with the fracture line of the specimenobtained in the compression test. Also in the posterior sec-tion, the position of the fracture partially agrees with thevalues of “stress/strength,” though these values are small.This suggests that “stress/strength” is effective in the pre-diction of bone fracture risk.
5 Discussion
From the comparison of fracture lines obtained by analysiswith those obtained by experiment, we have showed thatthe value of “stress/strength” is effective as an index forevaluating the robustness of bones. We can predict sectionswhere bone fracture may easily occur using this index.
We employed the relationship that Young’s modulusis proportional to the third power of bone mineral den-sity in this study. Some researches report the exponent forYoung’s modulus as a smaller number than three [7]. Thesmaller exponent will produce more blurred stress distri-bution compared with the present one. Further research isneeded for clarifying the quantitative effect on the compu-tational results.
The proposed index of “stress/strength” is the inverseof “Factor Of Safety (FOS)”. While FOS becomes infinite,
66
(A) Anterior
(B) Posterior (C) Pressure loads [N]
58.6582.47
107.274.79
84.0297.26
62.0679.82
Figure 5. Fracture lines and loading condition.
our index is 0 in regions without stress. This means cal-culation of FOS requires considering of the element thatgenerates zero stress in the analysis. In addition, a valueof “stress/strength” greater than 1 indicates the presence ofa bone fracture, and thus, easy intuitional understanding ispossible.
6 Conclusions
In this study, we pointed out that the measurement of theBMD is not sufficient for evaluation of bone-fracture riskin the diagnosis of osteoporosis. We reported a method forpredicting bone-fracture risk based on mechanical analysisusing individual models, as well as experimental verifica-tion.
In the verification experiment, we used specimens ofrats’ vertebral bodies, of which two end surfaces were em-bedded epoxy resin; their load history was measured us-ing 8 load cells. In the mechanical analysis, we devisedan efficient modeling method in which the resin part andbone part were modeled with elements of different sizes,taking into consideration their different volumes. By thecomparison of fracture lines observed in compression testswith fracture risks obtained from mechanical analyses, wedemonstrated that the proposed index of “stress/strength”can predict bone-fracture risks with high accuracy.
7 Acknowledgments
This study was supported financially in part by the Grant-in-Aid for Scientific Research B (No. 11558105) of theMinistry of Education, Culture, Sports, Science and Tech-nology. We thank Mr. Toru Mitome of Sony Corporationfor his support in the experimental measurements.
Anterior Posterior
Stress / S
trength
1.0
2.0
Equivalent S
tress [MP
a]
0
150
BM
D [g/cm
3]
0
1.4
Figure 6. Distributions of BMD, equivalent stress and“Stress/Strength”.
References
[1] Keyak, J. H., Rossi, S. A., Jones, K. A. and Skin-ner, H.B., Prediction of femoral fracture load usingautomated finite element modeling,J. Biomech., 31,(1998), 125–133
[2] Ota, T., Yamamoto, I. and Morita, R., Fracture sim-ulation of the femoral bone using the finite-elementmethod: How a fracture initiates and proceeds,J.Bone Miner. Metab., 17, (1999), 108–112
[3] Inou, N., Iioka, Y., Ujihashi, S. and Maki, K., Func-tional Adaptation Observed in the Human Vertebraand the Mechanical Analysis,Proc. 4th China-Japan-USA-Singapore Conf. Biomech., (1995), 345–348
[4] Inou, N., Suzuki, S., Maki, K. and Ujihashi, S., AnAutomated Modeling Method of a Bone Based onthe X-Ray CT Data (Generation of a Finite ElementModel by Use of Delaunay Triangulation),J. JapanSoc. Mech. Eng., 68–669, C (2002), 1481–1486, (inJapanese)
[5] Carter, D. R. and Hayes, W. C., The Compressive be-havior of Bone as a Two-Phase Porous Structure,J.Bone Joint Surgery, 59, (1977), 954–962
[6] Carter, D. R. and Hayes, W. C., Bone CompressiveStrength: The Influence of Density and Strain Rate,Science, 194, (1976), 1174–1176
[7] Nicholson, P. H. F., Cheng, X. G., Lowest, G., Boo-nen, S., Davie, M. W. J., Dequeker, J. and Van derPerre, G., Structural and Material Mechanical Proper-ties of Human Vertebral Cancellous Bone,Med. Eng.Phys., 19–8, (1997), 729–737
67