East Waterway, Harbor Island Superfund Site Waterway, Harbor Island Superfund Site S LIP 27 S...
30
East Waterway, Harbor Island Superfund Site SLIP 27 SEDIMENT SAMPLING RESULTS For submittal to The U.S. Environmental Protection Agency Region 10 Seattle, WA October 18, 2007 Prepared by: 200 West Mercer Street, Suite 401 Seattle, Washington 98119
Transcript of East Waterway, Harbor Island Superfund Site Waterway, Harbor Island Superfund Site S LIP 27 S...
East Waterway, Harbor Island Superfund Site
SLIP 27 SEDIMENT SAMPLING RESULTS
For submittal to
The U.S. Environmental Protection Agency Region 10 Seattle, WA
October 18, 2007
Prepared by:
200 West Mercer Street, Suite 401 � Seattle, Washington � 98119

Table of Contents
List of Tables ii
List of Figures ii
1 Project Overview 1
2 Sampling and Results 1 2.1 SAMPLING LOCATIONS AND ACTIVITIES 1 2.2 LABORATORY METHODS 2 2.3 FIELD AND LABORATORY DEVIATIONS 3 2.4 ANALYTICAL RESULTS 3
2.4.1 Surface sediment grab samples 20 2.4.2 Sediment core samples 20
2.5 DATA VALIDATION 21
3 Data Interpretation 22
4 References 27
Figures 28
Appendix A Field Forms and Field Notes Appendix B Data Validation Appendix C Form 1s Appendix D Chain-of-Custody Forms (Appendices are provided in electronic form on accompanying CD)
East Waterway, Harbor Island Superfund Site October 18, 2007 Slip 27 Sediment Sampling Results
Page i

List of Tables Table 1. Slip 27 location descriptions 2
Table 2. Summary laboratory methods 2
Table 3a. East Waterway - Slip 27 grab sample data comparison to SMS and DMMP values 4
Table 3b. East Waterway - Slip 27 grab sample data (comparison to LAET and 2LAET)10
Table 4a. East Waterway - Slip 27 core sample data (comparison to SMS and DMMP values) 12
Table 4b. East Waterway - Slip 27 core sample data (comparison to LAET values) 18
Table 5a. East Waterway Pier 27 (historical) grabs and core samples 23
Table 5b. East Waterway Pier 27 (historical) core sample (comparison to LAET values)25
Table 6. Summary of SMS exceedances in 1991 and 2007 26
List of Figures
Figure 1a and 1b. Slip 27 sampling locations
Figure 2. Slip 27 PCBs (total calc'd)
Figure 3. Slip 27 Mercury
Figure 4. Slip 27 Total HPAH (calc'd)
Figure 5. Slip 27 Bis(2-ethylhexyl)phthalate
Figure 6. Slip 27 Cadmium
Figure 7. Slip 27 Copper
Figure 8. Slip 27 Silver
Figure 9. Slip 27 Zinc
Figure 10. Slip 27 all other detected exceedances
Figure 11. Slip 27 all nondetected exceedances
Slip 27 Sediment Sampling Results East Waterway, Harbor Island Superfund Site October 18, 2007
Page ii

1
2
Project Overview
This memorandum presents the results of the sediment sampling conducted in Slip 27 in accordance with Slip 27 Sampling Plan (Windward 2007). The Port is constructing a cargo connection bridge on the east end of Slip 27 and removing approximately 400 dilapidated creosote pilings from the southwest margin of Slip 27. This sediment investigation was conducted independently by the Port of Seattle (Port) with review and input from the US Environmental Protection Agency (EPA). To address EPA concerns at the site, the Port agreed to obtain samples from the footprint of the cargo connection bridge prior to installation of the bridge deck, since the bridge deck would likely impede any future sediment sampling efforts. The Port also sampled the sediment around the pilings in order to characterize the material that was re-suspending during the removal process.
Sampling and Results
Sediment sampling occurred on January 10 and 12, 2007. Six surface sediment grabs and three 4-ft cores that were analyzed in 1-ft sample intervals were collected and analyzed for the full suite Washington State Sediment Management Standards (SMS) chemicals, organochlorine pesticides, and bulk tributyltin (TBT).
2.1 SAMPLING LOCATIONS AND ACTIVITIES
All field activities were performed under the direction of the field coordinator. Sampling was accomplished by a joint operation of Windward and Research Support Services and Bio Marine Enterprises. Sediment cores were collected with a 4-in diameter barrel vibracorer and surface grabs were collected with a 0.1m2 van Veen grab sampler.
Grab samples were processed on the boat immediately after collection. Core samples were processed at Analytical Resources, Inc within 24 hrs of collection. The core samples were to be collected to the maximum depth possible with 5.5 ft being the maximum depth possible with the coring device under ideal conditions (Blomberg et al. 2007). The final core depths were 4.2 ft (S27-1C) and 3.5 ft (S27-2C and S27-3C) which represent the maximum sediment penetration achieved at these locations. Sediment collection and processing followed standardized procedures for the Puget Sound area that have been developed by Puget Sound Estuary Program (PSEP 1997). The location and descriptions of the samples are presented in Table 1 and shown on Figure 1a and 1b.
Slip 27 Sediment Sampling Results East Waterway, Harbor Island Superfund Site October 18, 2007
Page 1

Table 1. Slip 27 location descriptions
LOCATION ID MAP ID
LOCATION TYPE DATE
ACTUAL COORDINATESa
TARGET COORDINATESa
X Y X Y EW-S27-1G 1G Grab 1/10/07 1267842 214883 1267918 214815
EW-S27-2Gb 2G Grab 1/10/07 1267923 214966 1267881 214918
EW-S27-3G 3G Grab 1/10/07 1267819 214973 1267977 214867
EW-S27-4G 4G Grab 1/10/07 1268456 214495 1268456 214459
EW-S27-5G 5G Grab 1/12/07 1268453 214579 1268458 214575
EW-S27-9G 9G Grab 1/12/07 1268428 214502 1268426 214501
EW-S27-1C 1C Core 1/12/07 1268459 214511 1268457 214511
EW-S27-2C 2C Core 1/12/07 1268442 214583 1268457 214511
EW-S27-3C 3C Core 1/12/07 1268394 214546 1268383 214547 a Washington State Plane North, NAD83, US survey ft. b field duplicate EW-S27-101G was collected from this location
2.2 LABORATORY METHODS
The methods used to chemically analyze sediment samples are summarized in Table 2 and described in detail the Slip 27 Sampling Plan (Windward 2007).
Table 2. Summary laboratory methods
PARAMETER UNITS METHOD
Semivolatile organic compounds (SVOC) µg/kg dw GC/MS (EPA 8270D)
Selected SVOCa µg//kg dw GC/MS (EPA 8270D-SIM)
Polychlorinated biphenyls (PCBs) µg/kg dw GC/ECD (EPA 8082)
Organochlorine pesticidesb µg/kg dw GC/ECD (EPA 8081A)
Butyltins µg/kg dw GC/MS (EPA 8270-SIM)
Mercury mg/kg dw CVAA (EPA 7471)
Other metalsc mg/kg dw ICP-AES or ICP-MS (EPA 6010B or 6020)
TOC percent dw Combustion (Plumb 1981)
Grain size percent dw Sieve/ hydrometer (PSEP 1986)
Total solids percent dw Combustion (EPA 160.1)
a Selected SVOCs for SIM include: 1,2,4-trichlorobenzene, 1,2-dichlorobenzene, 1,4-dichlorobenzene, 2,4dimethylphenol, 2-methylphenol, benzoic acid, benzyl alcohol, butyl benzyl phthalate, hexachlorobenzene, hexachlorobutadiene, n-nitrosodimethylamine, n-nitrosodiphenylamine, n-nitrosodi-n-propylamine, and pentachlorophenol. Dibenzo(a,h)anthracene and dimethyl phthalate were added to the SIM analyte list for the analysis of archived samples, and benzoic acid was moved to the full-scan analyte list for reasons discussed in Section 3.3. Chemicals analyzed using SIM were not included in the EPA Method 8270D analyte list
b Target pesticides include 4,4’-DDT, 4,4’-DDE, 4,4’-DDD, 2,4’-DDT, 2,4’-DDE, 2,4’-DDD, aldrin, alpha-benzene hexachloride (BHC), beta-BHC, delta-BHC, gamma-BHC, oxychlordane, alpha- and gamma-chlordane, cis- and trans-nonachlor, dieldrin, endosulfan, endosulfan sulfate, endrin, heptachlor, heptachlor epoxide, hexachlorobenzene, methoxychlor, mirex, and toxaphene.
Slip 27 Sediment Sampling Results East Waterway, Harbor Island Superfund Site October 18, 2007
Page 2

c Other metals include arsenic, cadmium, chromium, copper, lead, silver, antimony, nickel, and zinc dw – dry weight PCB – polychlorinated biphenyl AES – atomic emission spectrometry PSEP – Puget Sound Estuary Program CVAA – Cold vapor atomic absorption na – not applicable ECD – electron capture detection SIM – selected ion monitoring GC – gas chromatography TOC - total organic carbon MS – mass spectroscopy
2.3 FIELD AND LABORATORY DEVIATIONS
Sediment samples could not be obtained from the head of Slip 27 just east of the bridge location. Several attempts were made to collect surface sediment samples in this area, but large cobbles made it impossible for the sampler to penetrate to the sediment surface. The target sediment locations for 4C, 6G, 7G, and 8G are shown on Figure 1. Samples 1G, 2G, and 3G were collected from locations with deeper depths than the target locations due to the vessel’s inability to access the target locations due to the presence of the dilapidated pier and pilings. The samples were collected from locations as close to the pier and surrounding pilings as possible and were still within the removal area. The sediment coring device was not able to achieve maximum penetration at any of the coring locations. The core samples were collected to the maximum achievable depths (3.5 ft and 4.2 ft) which were less than the maximum possible depth of 5.5 ft for the coring device under ideal conditions.
The laboratory followed all methods and procedures outlined in the Slip 27 Sampling Plan (Windward 2007); there were no laboratory deviations.
2.4 ANALYTICAL RESULTS
Sediment and chemistry results were compared to the SMS sediment standards. The criteria values and analytical results are presented in Tables 3 and 4. When SMS standards were not available, Dredge Material Management Program (DMMP) guidelines, screening level (SL) and maximum level (ML) values were used. For those chemicals whose standards are based on organic-carbon normalized concentrations [i.e. polycyclic aromatic hydrocarbons(PAHs), polychlorinated biphenyls (PCBs), and phthalates], four samples with organic carbon contents greater than 4% were not organic carbon normalized (S27-1G,S27-4G, S27-1C [0-1 ft], S27-3C [0-1 ft and 3-4 ft]). The concentrations associated with these samples were compared to the two lowest available Apparent Effects Threshold (AET) values on a dry weight basis. In the Tables 3 and 4 and Figures 2, 4 and 5, exceedance of the lowest AET (LAET) value is presented as a Sediment Quality Standard (SQS) exceedance and exceedance of the 2nd
lowest AET (2LAET) value is presented as a Cleanup Screening Level (CSL) exceedance.
Slip 27 Sediment Sampling Results East Waterway, Harbor Island Superfund Site October 18, 2007
Page 3

Table 3a. East Waterway - Slip 27 grab sample data comparison to SMS and DMMP values
ANALYTE UNIT SQS/SL CSL/ML
EW-S27-1G-010a
EW-S27-2G-010
EW-S27-101G-010b
EW-S27-3G-010
EW-S27-4G-010a
EW-S27-5G-010
EW-S27-9G-010
0 – 10 cm 0 - 10 cm 0 - 10 cm 0 - 10 cm 0 - 10 cm 0 - 10 cm 0 - 10 cm Metals and trace elements
Antimony mg/kg dw 150 200 8 UJ 9 UJ 9 UJ 8 UJ 8 UJ 7 UJ 8 UJ
Arsenic mg/kg dw 57 93 16.2 J 10.6 J 9.7 J 9.0 J 3.5 J 4.5 J 5.6 J
Cadmium mg/kg dw 5.1 6.7 2.6 1.4 1.3 1.5 0.4 1.2 1.2
Chromium mg/kg dw 260 270 30.4 34.0 32.0 28.8 16.0 20.7 22.6
Copper mg/kg dw 390 390 93.5 78.8 75.5 68.1 44.6 40.3 53.3
Lead mg/kg dw 450 530 109 69 60 55 57 31 47
Mercury mg/kg dw 0.41 0.59 0.53 J 0.37 J 0.36 J 0.31 J 0.10 J 0.13 J 0.13 J
Nickel mg/kg dw 140 370 18 21 20 17 11 14 14
Selenium mg/kg dw nv nv 0.8 U 0.9 U 0.9 U 0.9 U 0.8 U 0.7 U 0.8 U
Silver mg/kg dw 6.1 6.1 1.4 1.3 1.1 1.1 0.5 U 0.5 0.5 U
Zinc mg/kg dw 410 960 500 222 192 230 109 203 180
Organometals
Monobutyltin as ion µg/kg dw nv nv 5.3 5.7 7.1 5.1 3.6 U 8.4 8.4
Dibutyltin as ion µg/kg dw nv nv 15 20 22 21 11 13 22
Tributyltin as ion µg/kg dw nv nv 67 130 150 120 70 48 60
PAHs
1-Methylnaphthalene µg/kg dw nv nv 37 31 U 31 U 31 U 180 31 U 31 U
2-Chloronaphthalene µg/kg dw nv nv 31 U 31 U 31 U 31 U 31 U 31 U 31 U
2-Methylnaphthalene mg/kg OC 38 64 AET 1.2 U 1.5 1.5 AET 1.2 U 1.8
Acenaphthene mg/kg OC 16 57 AET 2.1 2.6 4.0 AET 1.4 3.2
Acenaphthylene mg/kg OC 66 66 AET 1.7 2.9 1.9 AET 1.2 U 5.0
Anthracene mg/kg OC 220 1,200 AET 9.8 14 12 AET 5.2 35
Benzo(a)anthracene mg/kg OC 110 270 AET 20 33 26 AET 10 150
Benzo(a)pyrene mg/kg OC 99 210 AET 19 31 24 AET 10 73
Benzo(b)fluoranthene µg/kg dw nv nv 930 1,100 1,600 1,000 1,600 560 2,500
Benzo(g,h,i)perylene mg/kg OC 31 78 AET 6.0 9.1 5.9 AET 3.2 12
Benzo(k)fluoranthene µg/kg dw nv nv 940 380 530 390 510 200 900
Benzofluoranthenes (total-calc'd) mg/kg OC 230 450 AET 56 100 64 AET 30 180
Slip 27 Sediment Sampling Results East Waterway, Harbor Island Superfund Site October 18, 2007
Page 4
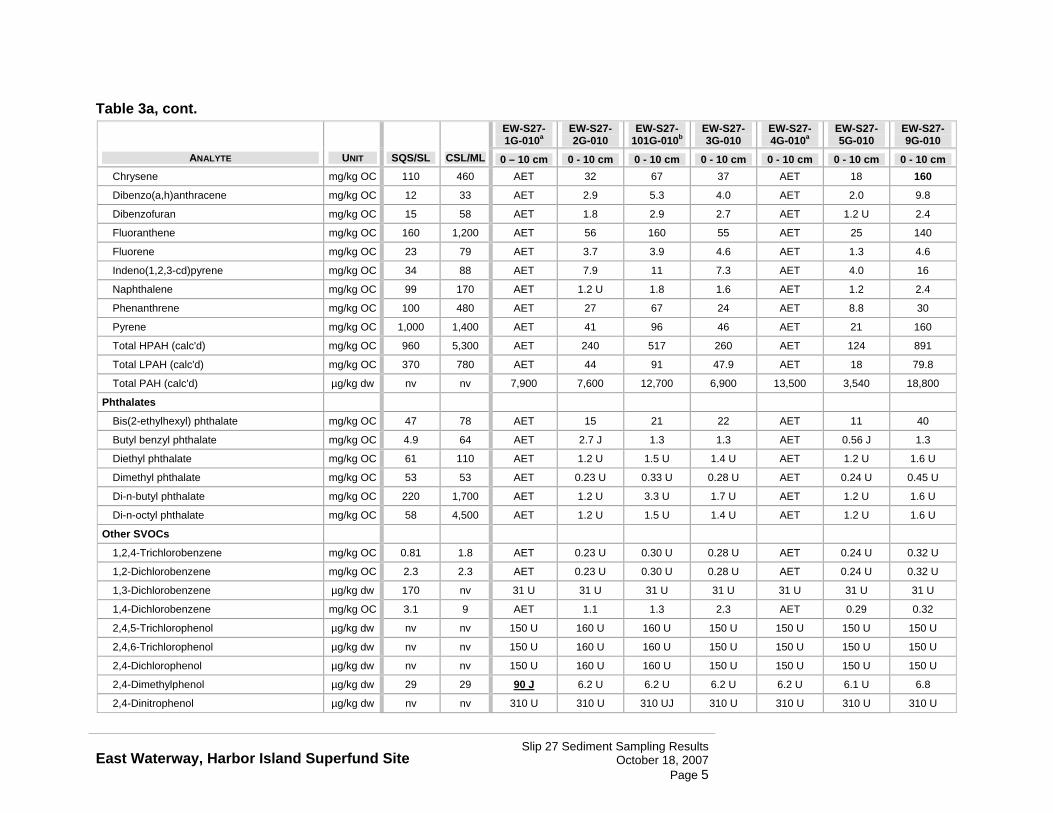
Table 3a, cont.
ANALYTE UNIT SQS/SL CSL/ML
EW-S27-1G-010a
EW-S27-2G-010
EW-S27-101G-010b
EW-S27-3G-010
EW-S27-4G-010a
EW-S27-5G-010
EW-S27-9G-010
0 – 10 cm 0 - 10 cm 0 - 10 cm 0 - 10 cm 0 - 10 cm 0 - 10 cm 0 - 10 cm Chrysene mg/kg OC 110 460 AET 32 67 37 AET 18 160
Dibenzo(a,h)anthracene mg/kg OC 12 33 AET 2.9 5.3 4.0 AET 2.0 9.8
Dibenzofuran mg/kg OC 15 58 AET 1.8 2.9 2.7 AET 1.2 U 2.4
Fluoranthene mg/kg OC 160 1,200 AET 56 160 55 AET 25 140
Fluorene mg/kg OC 23 79 AET 3.7 3.9 4.6 AET 1.3 4.6
Indeno(1,2,3-cd)pyrene mg/kg OC 34 88 AET 7.9 11 7.3 AET 4.0 16
Naphthalene mg/kg OC 99 170 AET 1.2 U 1.8 1.6 AET 1.2 2.4
Phenanthrene mg/kg OC 100 480 AET 27 67 24 AET 8.8 30
Pyrene mg/kg OC 1,000 1,400 AET 41 96 46 AET 21 160
Total HPAH (calc'd) mg/kg OC 960 5,300 AET 240 517 260 AET 124 891
Total LPAH (calc'd) mg/kg OC 370 780 AET 44 91 47.9 AET 18 79.8
Total PAH (calc'd) µg/kg dw nv nv 7,900 7,600 12,700 6,900 13,500 3,540 18,800
Phthalates
Bis(2-ethylhexyl) phthalate mg/kg OC 47 78 AET 15 21 22 AET 11 40
Butyl benzyl phthalate mg/kg OC 4.9 64 AET 2.7 J 1.3 1.3 AET 0.56 J 1.3
Diethyl phthalate mg/kg OC 61 110 AET 1.2 U 1.5 U 1.4 U AET 1.2 U 1.6 U
Dimethyl phthalate mg/kg OC 53 53 AET 0.23 U 0.33 U 0.28 U AET 0.24 U 0.45 U
Di-n-butyl phthalate mg/kg OC 220 1,700 AET 1.2 U 3.3 U 1.7 U AET 1.2 U 1.6 U
Di-n-octyl phthalate mg/kg OC 58 4,500 AET 1.2 U 1.5 U 1.4 U AET 1.2 U 1.6 U
Other SVOCs
1,2,4-Trichlorobenzene mg/kg OC 0.81 1.8 AET 0.23 U 0.30 U 0.28 U AET 0.24 U 0.32 U
1,2-Dichlorobenzene mg/kg OC 2.3 2.3 AET 0.23 U 0.30 U 0.28 U AET 0.24 U 0.32 U
1,3-Dichlorobenzene µg/kg dw 170 nv 31 U 31 U 31 U 31 U 31 U 31 U 31 U
1,4-Dichlorobenzene mg/kg OC 3.1 9 AET 1.1 1.3 2.3 AET 0.29 0.32
2,4,5-Trichlorophenol µg/kg dw nv nv 150 U 160 U 160 U 150 U 150 U 150 U 150 U
2,4,6-Trichlorophenol µg/kg dw nv nv 150 U 160 U 160 U 150 U 150 U 150 U 150 U
2,4-Dichlorophenol µg/kg dw nv nv 150 U 160 U 160 U 150 U 150 U 150 U 150 U
2,4-Dimethylphenol µg/kg dw 29 29 90 J 6.2 U 6.2 U 6.2 U 6.2 U 6.1 U 6.8
2,4-Dinitrophenol µg/kg dw nv nv 310 U 310 U 310 UJ 310 U 310 U 310 U 310 U
Slip 27 Sediment Sampling Results East Waterway, Harbor Island Superfund Site October 18, 2007
Page 5
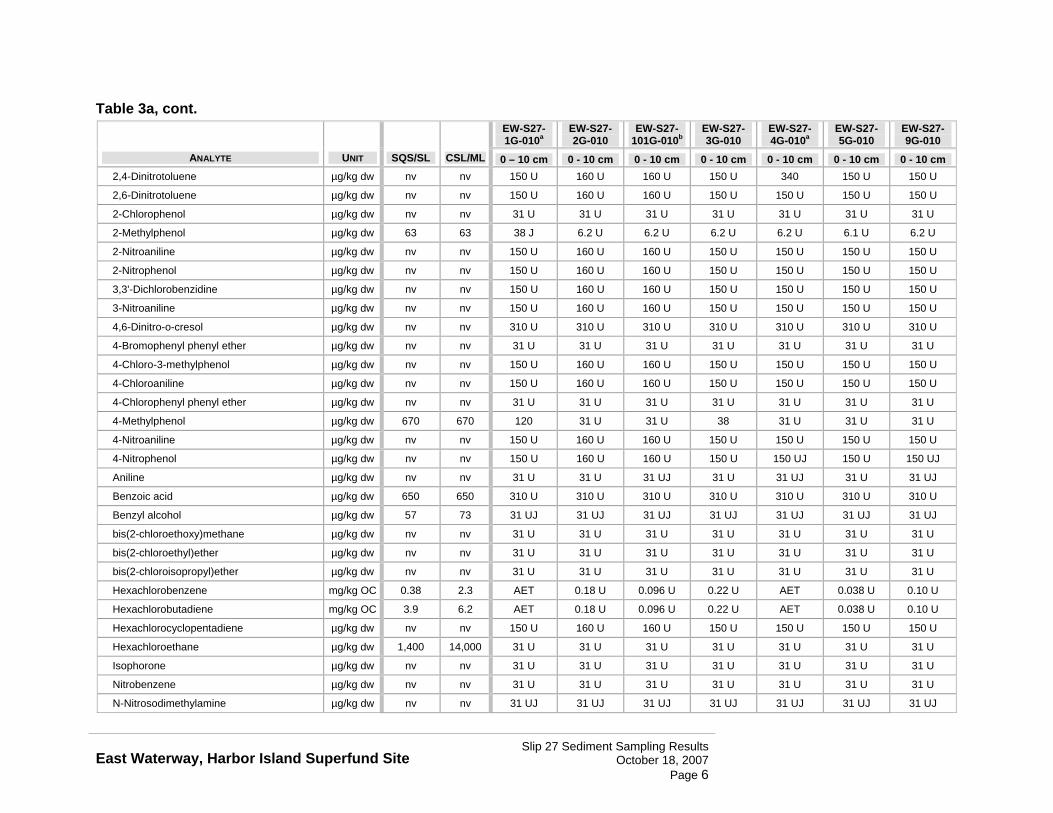
Table 3a, cont.
ANALYTE UNIT SQS/SL CSL/ML
EW-S27-1G-010a
EW-S27-2G-010
EW-S27-101G-010b
EW-S27-3G-010
EW-S27-4G-010a
EW-S27-5G-010
EW-S27-9G-010
0 – 10 cm 0 - 10 cm 0 - 10 cm 0 - 10 cm 0 - 10 cm 0 - 10 cm 0 - 10 cm 2,4-Dinitrotoluene µg/kg dw nv nv 150 U 160 U 160 U 150 U 340 150 U 150 U
2,6-Dinitrotoluene µg/kg dw nv nv 150 U 160 U 160 U 150 U 150 U 150 U 150 U
2-Chlorophenol µg/kg dw nv nv 31 U 31 U 31 U 31 U 31 U 31 U 31 U
2-Methylphenol µg/kg dw 63 63 38 J 6.2 U 6.2 U 6.2 U 6.2 U 6.1 U 6.2 U
2-Nitroaniline µg/kg dw nv nv 150 U 160 U 160 U 150 U 150 U 150 U 150 U
2-Nitrophenol µg/kg dw nv nv 150 U 160 U 160 U 150 U 150 U 150 U 150 U
3,3'-Dichlorobenzidine µg/kg dw nv nv 150 U 160 U 160 U 150 U 150 U 150 U 150 U
3-Nitroaniline µg/kg dw nv nv 150 U 160 U 160 U 150 U 150 U 150 U 150 U
4,6-Dinitro-o-cresol µg/kg dw nv nv 310 U 310 U 310 U 310 U 310 U 310 U 310 U
4-Bromophenyl phenyl ether µg/kg dw nv nv 31 U 31 U 31 U 31 U 31 U 31 U 31 U
4-Chloro-3-methylphenol µg/kg dw nv nv 150 U 160 U 160 U 150 U 150 U 150 U 150 U
4-Chloroaniline µg/kg dw nv nv 150 U 160 U 160 U 150 U 150 U 150 U 150 U
4-Chlorophenyl phenyl ether µg/kg dw nv nv 31 U 31 U 31 U 31 U 31 U 31 U 31 U
4-Methylphenol µg/kg dw 670 670 120 31 U 31 U 38 31 U 31 U 31 U
4-Nitroaniline µg/kg dw nv nv 150 U 160 U 160 U 150 U 150 U 150 U 150 U
4-Nitrophenol µg/kg dw nv nv 150 U 160 U 160 U 150 U 150 UJ 150 U 150 UJ
Aniline µg/kg dw nv nv 31 U 31 U 31 UJ 31 U 31 UJ 31 U 31 UJ
Benzoic acid µg/kg dw 650 650 310 U 310 U 310 U 310 U 310 U 310 U 310 U
Benzyl alcohol µg/kg dw 57 73 31 UJ 31 UJ 31 UJ 31 UJ 31 UJ 31 UJ 31 UJ
bis(2-chloroethoxy)methane µg/kg dw nv nv 31 U 31 U 31 U 31 U 31 U 31 U 31 U
bis(2-chloroethyl)ether µg/kg dw nv nv 31 U 31 U 31 U 31 U 31 U 31 U 31 U
bis(2-chloroisopropyl)ether µg/kg dw nv nv 31 U 31 U 31 U 31 U 31 U 31 U 31 U
Hexachlorobenzene mg/kg OC 0.38 2.3 AET 0.18 U 0.096 U 0.22 U AET 0.038 U 0.10 U
Hexachlorobutadiene mg/kg OC 3.9 6.2 AET 0.18 U 0.096 U 0.22 U AET 0.038 U 0.10 U
Hexachlorocyclopentadiene µg/kg dw nv nv 150 U 160 U 160 U 150 U 150 U 150 U 150 U
Hexachloroethane µg/kg dw 1,400 14,000 31 U 31 U 31 U 31 U 31 U 31 U 31 U
Isophorone µg/kg dw nv nv 31 U 31 U 31 U 31 U 31 U 31 U 31 U
Nitrobenzene µg/kg dw nv nv 31 U 31 U 31 U 31 U 31 U 31 U 31 U
N-Nitrosodimethylamine µg/kg dw nv nv 31 UJ 31 UJ 31 UJ 31 UJ 31 UJ 31 UJ 31 UJ
Slip 27 Sediment Sampling Results East Waterway, Harbor Island Superfund Site October 18, 2007
Page 6

Table 3a, cont.
ANALYTE UNIT SQS/SL CSL/ML
EW-S27-1G-010a
EW-S27-2G-010
EW-S27-101G-010b
EW-S27-3G-010
EW-S27-4G-010a
EW-S27-5G-010
EW-S27-9G-010
0 – 10 cm 0 - 10 cm 0 - 10 cm 0 - 10 cm 0 - 10 cm 0 - 10 cm 0 - 10 cm N-Nitroso-di-n-propylamine µg/kg dw nv nv 31 U 31 U 31 U 31 U 31 U 31 U 31 U
N-Nitrosodiphenylamine mg/kg OC 11 11 AET 0.35 U 0.44 U 0.39 U AET 0.24 U 0.62 U
Pentachlorophenol µg/kg dw 360 690 110 J 67 66 63 71 58 U 65
Phenol µg/kg dw 420 1,200 92 42 31 82 31 U 31 U 31 U
Polychlorinated biphenyls
Aroclor-1016 µg/kg dw nv nv 160 U 170 U 58 U 100 U 59 U 57 U 95 U
Aroclor-1221 µg/kg dw nv nv 160 U 170 U 58 U 100 U 59 U 57 U 95 U
Aroclor-1232 µg/kg dw nv nv 160 U 170 U 120 U 100 U 59 U 57 U 95 U
Aroclor-1242 µg/kg dw nv nv 160 U 170 U 58 U 100 U 59 U 57 U 95 U
Aroclor-1248 µg/kg dw nv nv 240 U 170 U 120 U 160 U 59 U 57 U 95 U
Aroclor-1254 µg/kg dw nv nv 400 300 270 280 90 120 170
Aroclor-1260 µg/kg dw nv nv 610 420 420 450 200 200 310
Total PCBs mg/kg OC 12 65 AET 27 33 33 AET 13 25
Pesticides
2,4'-DDD µg/kg dw nv nv 9.8 U 9.9 U 3.9 U 9.7 U 9.9 U 1.9 U 3.9 U
2,4'-DDE µg/kg dw nv nv 9.8 U 9.9 U 21 U 9.7 U 9.9 U 10 U 3.9 U
2,4'-DDT µg/kg dw nv nv 9.8 U 9.9 U 3.9 U 9.7 U 9.9 U 1.9 U 3.9 U
4,4'-DDD µg/kg dw nv nv 9.8 U 9.9 U 3.9 U 9.7 U 9.9 U 7.2 U 3.9 U
4,4'-DDE µg/kg dw nv nv 9.8 U 9.9 U 13 U 9.7 U 9.9 U 1.9 U 3.9 U
4,4'-DDT µg/kg dw nv nv 82 UJ 52 UJ 3.9 UJ 9.7 UJ 35 UJ 1.9 U 3.9 UJ
Total DDTs µg/kg dw 6.9 69 82 UJ 52 UJ 21 U 9.7 UJ 35 UJ 10 U 3.9 UJ
Aldrin µg/kg dw 10 nv 4.9 U 4.9 U 2.0 U 4.9 U 5.0 U 0.95 U 2.0 U
Dieldrin µg/kg dw 10 nv 22 U 9.9 U 16 U 18 U 9.9 U 6.3 U 11 U
Total aldrin/dieldrin (calc'd) µg/kg dw 10 nv 22 U 9.9 U 16 U 18 U 9.9 U 6.3 U 11 U
alpha-BHC µg/kg dw nv nv 4.9 U 4.9 U 2.0 U 4.9 U 5.0 U 0.95 U 2.0 U
beta-BHC µg/kg dw nv nv 4.9 U 4.9 U 2.0 U 4.9 U 5.0 U 0.95 U 2.0 U
gamma-BHC µg/kg dw 10 nv 4.9 U 4.9 U 2.0 U 4.9 U 5.0 U 0.95 U 2.0 U
delta-BHC µg/kg dw nv nv 4.9 U 4.9 U 2.0 U 4.9 U 5.0 U 0.95 U 2.0 U
alpha-Chlordane µg/kg dw nv nv 4.9 U 4.9 U 2.0 U 4.9 U 5.0 U 0.95 U 2.0 U
Slip 27 Sediment Sampling Results East Waterway, Harbor Island Superfund Site October 18, 2007
Page 7

Table 3a, cont.
ANALYTE UNIT SQS/SL CSL/ML
EW-S27-1G-010a
EW-S27-2G-010
EW-S27-101G-010b
EW-S27-3G-010
EW-S27-4G-010a
EW-S27-5G-010
EW-S27-9G-010
0 – 10 cm 0 - 10 cm 0 - 10 cm 0 - 10 cm 0 - 10 cm 0 - 10 cm 0 - 10 cm gamma-Chlordane µg/kg dw nv nv 4.9 U 4.9 U 2.0 U 4.9 U 5.0 U 0.95 U 2.0 U
Total chlordane (calc'd) µg/kg dw 10 nv 9.8 UJ 9.9 UJ 3.9 UJ 9.7 UJ 9.9 UJ 1.9 U 16 UJ
alpha-Endosulfan µg/kg dw nv nv 4.9 U 4.9 U 2.0 U 4.9 U 5.0 U 0.95 U 2.0 U
beta-Endosulfan µg/kg dw nv nv 9.8 U 9.9 U 3.9 U 9.7 U 9.9 U 1.9 U 3.9 U
Endosulfan sulfate µg/kg dw nv nv 9.8 U 9.9 U 3.9 U 9.7 U 9.9 U 1.9 U 3.9 U
Endrin µg/kg dw nv nv 9.8 U 9.9 U 7.7 U 9.7 U 9.9 U 1.9 U 3.9 U
Endrin aldehyde µg/kg dw nv nv 25 U 21 U 16 U 20 U 9.9 U 8.0 U 12 U
Endrin ketone µg/kg dw nv nv 47 U 9.9 U 26 U 26 U 41 U 1.9 U 3.9 U
Heptachlor µg/kg dw 10 nv 4.9 U 4.9 U 2.0 U 4.9 U 5.0 U 0.95 U 2.0 U
Heptachlor epoxide µg/kg dw nv nv 4.9 U 4.9 U 2.0 U 4.9 U 5.0 U 0.95 U 2.0 U
Methoxychlor µg/kg dw nv nv 49 U 49 U 20 U 49 U 50 U 9.5 U 20 U
Mirex µg/kg dw nv nv 9.8 U 9.9 U 3.9 U 9.7 U 68 U 1.9 U 3.9 U
Cis-Nonachlor µg/kg dw nv nv 9.8 UJ 9.9 UJ 3.9 UJ 9.7 UJ 9.9 UJ 1.9 U 16 UJ
Oxychlordane µg/kg dw nv nv 9.8 U 9.9 U 3.9 U 9.7 U 9.9 U 1.9 U 3.9 U
Toxaphene µg/kg dw nv nv 490 U 490 U 200 U 490 U 500 U 95 U 200 U
Trans-Nonachlor µg/kg dw nv nv 9.8 U 9.9 U 3.9 U 9.7 U 9.9 U 1.9 U 3.9 U
Grain size
Fractional % phi >-1 (>2000 µm) % dw nv nv 6.6 1.4 1.4 9.6 15.8 0.5 7.9
Fractional % phi -1-0 (1000-2000 µm) % dw nv nv 2.7 1.5 1.2 4.9 6.7 2.5 2.5
Fractional % phi 0-1 (500-1000 µm) % dw nv nv 6.8 2.0 2.3 2.9 11.4 11.7 6.2
Fractional % phi 1-2 (250-500 µm) % dw nv nv 28.2 11.3 11.3 8.7 35.4 40.9 32.9
Fractional % phi 2-3 (125-250 µm) % dw nv nv 16.3 14.7 14.5 15.3 17.6 18.5 22.4
Fractional % phi 3-4 (62.5-125 µm) % dw nv nv 5.7 11.3 11.7 13.2 4.6 5.1 6.9
Fractional % phi 4-5 (31.2-62.5 µm) % dw nv nv 3.1 9.4 8.9 6.6 3.2 3.6 5.3
Fractional % phi 5-6 (15.6-31.2 µm) % dw nv nv 5.5 10.0 11.1 10.8 2.1 3.2 4.9
Fractional % phi 6-7 (7.8-15.6 µm) % dw nv nv 6.5 9.7 10.0 9.0 0.4 3.1 2.9
Fractional % phi 7-8 (3.9-7.8 µm) % dw nv nv 4.8 7.6 7.2 4.4 0.5 2.6 1.5
Fractional % phi 8-9 (1.95-3.9 µm) % dw nv nv 2.9 4.7 4.3 3.0 0.1 1.6 1
Fractional % phi 9-10 (0.98-1.95 µm) % dw nv nv 3.9 5.8 6.1 4.1 0.4 2.3 1.8
Slip 27 Sediment Sampling Results East Waterway, Harbor Island Superfund Site October 18, 2007
Page 8
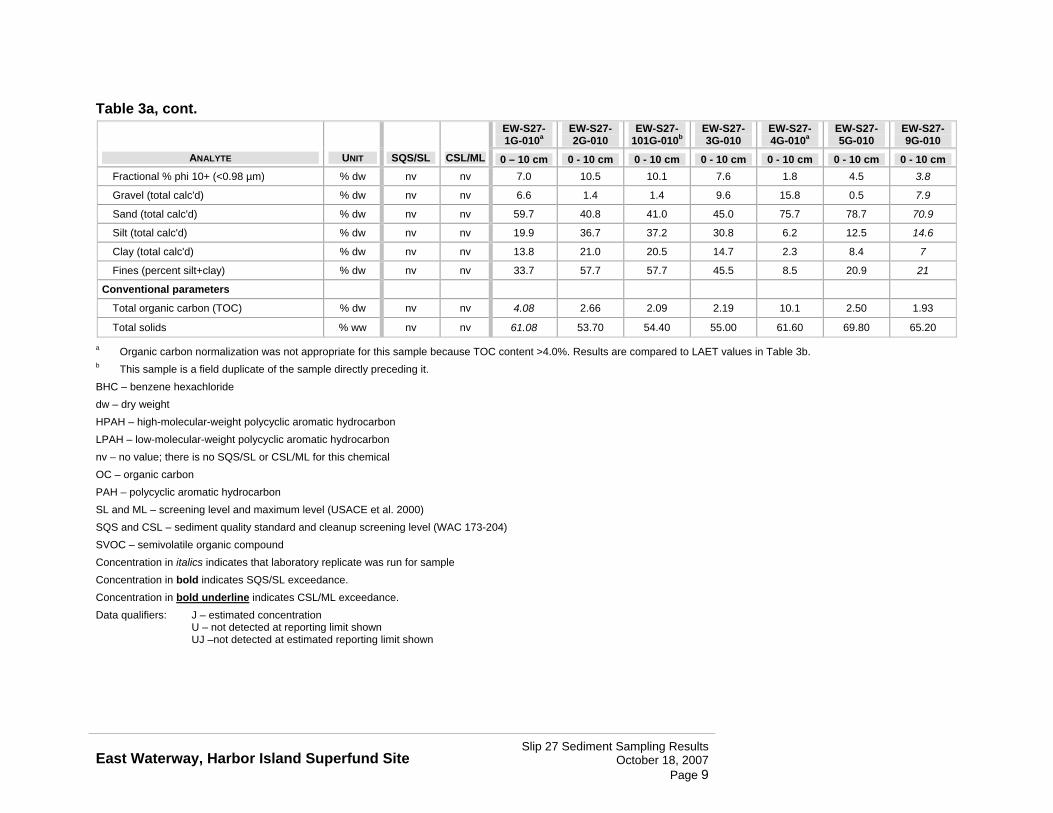
Table 3a, cont.
ANALYTE UNIT SQS/SL CSL/ML
EW-S27-1G-010a
EW-S27-2G-010
EW-S27-101G-010b
EW-S27-3G-010
EW-S27-4G-010a
EW-S27-5G-010
EW-S27-9G-010
0 – 10 cm 0 - 10 cm 0 - 10 cm 0 - 10 cm 0 - 10 cm 0 - 10 cm 0 - 10 cm Fractional % phi 10+ (<0.98 µm) % dw nv nv 7.0 10.5 10.1 7.6 1.8 4.5 3.8
Gravel (total calc'd) % dw nv nv 6.6 1.4 1.4 9.6 15.8 0.5 7.9
Sand (total calc'd) % dw nv nv 59.7 40.8 41.0 45.0 75.7 78.7 70.9
Silt (total calc'd) % dw nv nv 19.9 36.7 37.2 30.8 6.2 12.5 14.6
Clay (total calc'd) % dw nv nv 13.8 21.0 20.5 14.7 2.3 8.4 7
Fines (percent silt+clay) % dw nv nv 33.7 57.7 57.7 45.5 8.5 20.9 21
Conventional parameters
Total organic carbon (TOC) % dw nv nv 4.08 2.66 2.09 2.19 10.1 2.50 1.93
Total solids % ww nv nv 61.08 53.70 54.40 55.00 61.60 69.80 65.20
a Organic carbon normalization was not appropriate for this sample because TOC content >4.0%. Results are compared to LAET values in Table 3b. b This sample is a field duplicate of the sample directly preceding it. BHC – benzene hexachloride dw – dry weight HPAH – high-molecular-weight polycyclic aromatic hydrocarbon LPAH – low-molecular-weight polycyclic aromatic hydrocarbon nv – no value; there is no SQS/SL or CSL/ML for this chemical OC – organic carbon PAH – polycyclic aromatic hydrocarbon SL and ML – screening level and maximum level (USACE et al. 2000) SQS and CSL – sediment quality standard and cleanup screening level (WAC 173-204) SVOC – semivolatile organic compound Concentration in italics indicates that laboratory replicate was run for sample Concentration in bold indicates SQS/SL exceedance. Concentration in bold underline indicates CSL/ML exceedance. Data qualifiers: J – estimated concentration
U – not detected at reporting limit shown UJ –not detected at estimated reporting limit shown
Slip 27 Sediment Sampling Results East Waterway, Harbor Island Superfund Site October 18, 2007
Page 9

Table 3b. East Waterway - Slip 27 grab sample data (comparison to LAET and 2LAET)
ANALYTE UNIT LAET 2LAET
EW-S27-1G-010a
EW-S27-4G-010a
0 – 10 cm 0 - 10 cm PAHs
2-Methylnaphthalene µg/kg dw 670 1,400 44 190
Acenaphthene µg/kg dw 500 730 53 1,500
Acenaphthylene µg/kg dw 1,300 1,300 48 62
Anthracene µg/kg dw 960 4,400 210 600
Benzo(a)anthracene µg/kg dw 1,300 1,600 450 770
Benzo(a)pyrene µg/kg dw 1,600 3,000 630 560
Benzo(g,h,i)perylene µg/kg dw 670 720 180 120
Benzofluoranthenes (total-calc'd) µg/kg dw 3,200 3,600 1,870 2,100
Chrysene µg/kg dw 1,400 2,800 760 1,400
Dibenzo(a,h)anthracene µg/kg dw 230 540 84 94
Dibenzofuran µg/kg dw 540 700 34 310
Fluoranthene µg/kg dw 1,700 2,500 880 2,800
Fluorene µg/kg dw 540 1,000 59 390
Indeno(1,2,3-cd)pyrene µg/kg dw 600 690 220 160
Naphthalene µg/kg dw 2,100 2,400 48 110
Phenanthrene µg/kg dw 1,500 5,400 420 1,300
Pyrene µg/kg dw 2,600 3,300 2,000 1,500
Total HPAH (calc'd) µg/kg dw 12,000 17,000 7,100 9,500
Total LPAH (calc'd) µg/kg dw 5,200 13,000 840 4,000
Phthalates
Bis(2-ethylhexyl) phthalate µg/kg dw 1,300 1,900 600 500
Butyl benzyl phthalate µg/kg dw 63 900 14 J 35
Diethyl phthalate µg/kg dw 200 1,200 31 U 31 U
Dimethyl phthalate µg/kg dw 71 160 6.2 U 51 U
Di-n-butyl phthalate µg/kg dw 1,400 5,100 47 U 31 U
Di-n-octyl phthalate µg/kg dw 6,200 nv 31 U 31 U
Slip 27 Sediment Sampling Results East Waterway, Harbor Island Superfund Site October 18, 2007
Page 10
ANALYTE UNIT LAET 2LAET
EW-S27-1G-010a
EW-S27-4G-010a
0 – 10 cm 0 - 10 cm Other SVOCs
1,2,4-Trichlorobenzene µg/kg dw 31 51 6.2 U 6.2 U
1,2-Dichlorobenzene µg/kg dw 35 50 6.2 U 6.2 U
1,4-Dichlorobenzene µg/kg dw 110 120 26 6.8
Hexachlorobenzene µg/kg dw 22 70 4.9 U 5.0 U
Hexachlorobutadiene µg/kg dw 11 120 4.9 U 5.0 U
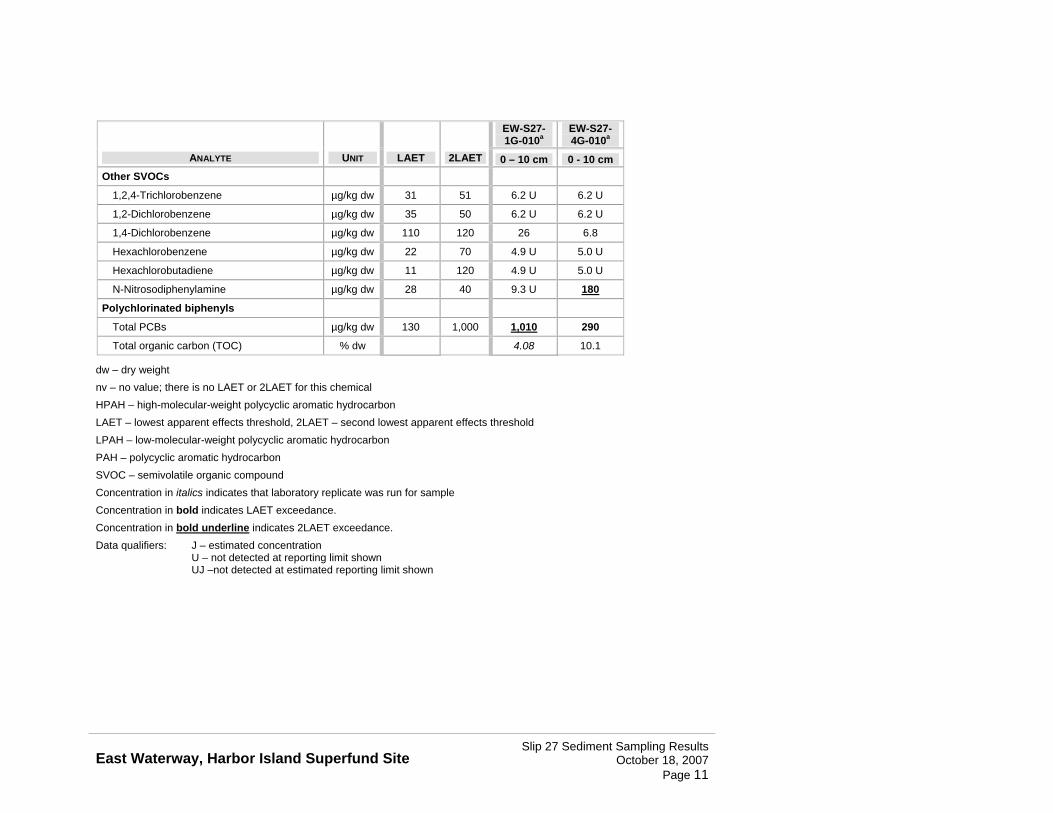
N-Nitrosodiphenylamine µg/kg dw 28 40 9.3 U 180
Polychlorinated biphenyls
Total PCBs µg/kg dw 130 1,000 1,010 290
Total organic carbon (TOC) % dw 4.08 10.1
dw – dry weight nv – no value; there is no LAET or 2LAET for this chemical HPAH – high-molecular-weight polycyclic aromatic hydrocarbon LAET – lowest apparent effects threshold, 2LAET – second lowest apparent effects threshold LPAH – low-molecular-weight polycyclic aromatic hydrocarbon PAH – polycyclic aromatic hydrocarbon SVOC – semivolatile organic compound Concentration in italics indicates that laboratory replicate was run for sample Concentration in bold indicates LAET exceedance. Concentration in bold underline indicates 2LAET exceedance. Data qualifiers: J – estimated concentration
U – not detected at reporting limit shown UJ –not detected at estimated reporting limit shown
Slip 27 Sediment Sampling Results East Waterway, Harbor Island Superfund Site October 18, 2007
Page 11
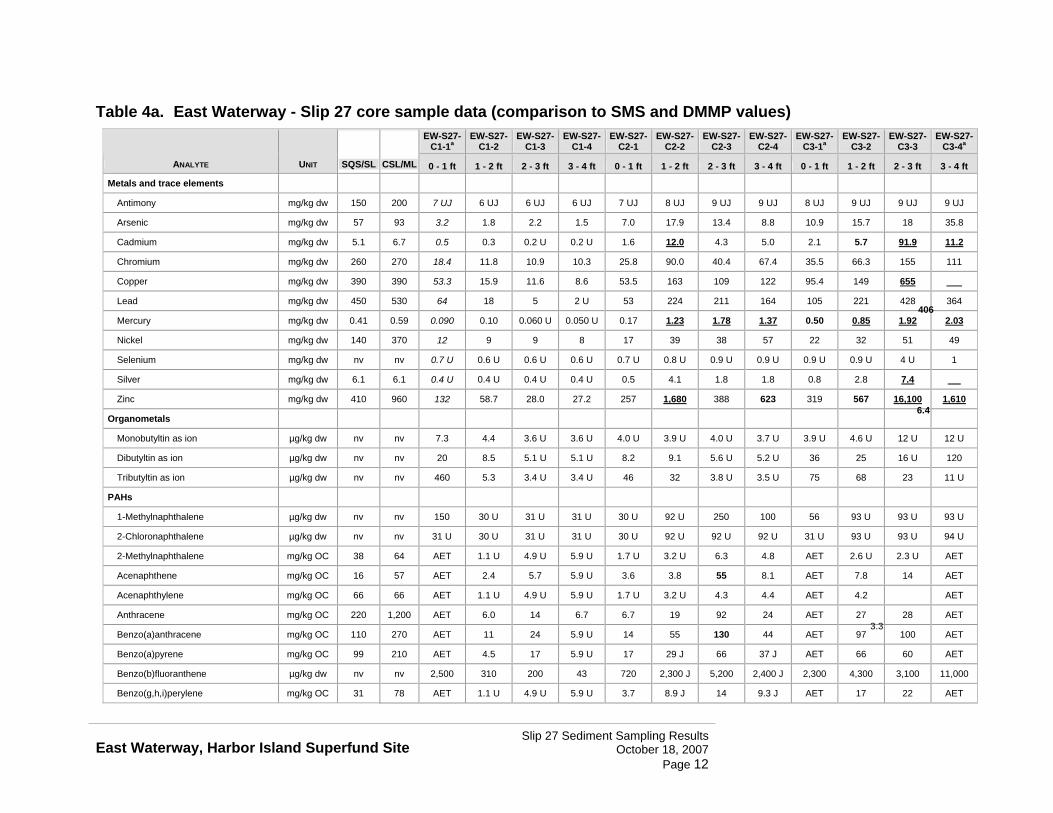
Table 4a. East Waterway - Slip 27 core sample data (comparison to SMS and DMMP values)
ANALYTE UNIT SQS/SL CSL/ML
EW-S27-C1-1a
EW-S27-C1-2
EW-S27-C1-3
EW-S27-C1-4
EW-S27-C2-1
EW-S27-C2-2
EW-S27-C2-3
EW-S27-C2-4
EW-S27-C3-1a
EW-S27-C3-2
EW-S27-C3-3
EW-S27-C3-4a
0 - 1 ft 1 - 2 ft 2 - 3 ft 3 - 4 ft 0 - 1 ft 1 - 2 ft 2 - 3 ft 3 - 4 ft 0 - 1 ft 1 - 2 ft 2 - 3 ft 3 - 4 ft
Metals and trace elements
Antimony mg/kg dw 150 200 7 UJ 6 UJ 6 UJ 6 UJ 7 UJ 8 UJ 9 UJ 9 UJ 8 UJ 9 UJ 9 UJ 9 UJ
Arsenic mg/kg dw 57 93 3.2 1.8 2.2 1.5 7.0 17.9 13.4 8.8 10.9 15.7 18 35.8
Cadmium mg/kg dw 5.1 6.7 0.5 0.3 0.2 U 0.2 U 1.6 12.0 4.3 5.0 2.1 5.7 91.9 11.2
Chromium mg/kg dw 260 270 18.4 11.8 10.9 10.3 25.8 90.0 40.4 67.4 35.5 66.3 155 111
Copper mg/kg dw 390 390 53.3 15.9 11.6 8.6 53.5 163 109 122 95.4 149 655
406 Lead mg/kg dw 450 530 64 18 5 2 U 53 224 211 164 105 221 428 364
Mercury mg/kg dw 0.41 0.59 0.090 0.10 0.060 U 0.050 U 0.17 1.23 1.78 1.37 0.50 0.85 1.92 2.03
Nickel mg/kg dw 140 370 12 9 9 8 17 39 38 57 22 32 51 49
Selenium mg/kg dw nv nv 0.7 U 0.6 U 0.6 U 0.6 U 0.7 U 0.8 U 0.9 U 0.9 U 0.9 U 0.9 U 4 U 1
Silver mg/kg dw 6.1 6.1 0.4 U 0.4 U 0.4 U 0.4 U 0.5 4.1 1.8 1.8 0.8 2.8 7.4
6.4 Zinc mg/kg dw 410 960 132 58.7 28.0 27.2 257 1,680 388 623 319 567 16,100 1,610
Organometals
Monobutyltin as ion µg/kg dw nv nv 7.3 4.4 3.6 U 3.6 U 4.0 U 3.9 U 4.0 U 3.7 U 3.9 U 4.6 U 12 U 12 U
Dibutyltin as ion µg/kg dw nv nv 20 8.5 5.1 U 5.1 U 8.2 9.1 5.6 U 5.2 U 36 25 16 U 120
Tributyltin as ion µg/kg dw nv nv 460 5.3 3.4 U 3.4 U 46 32 3.8 U 3.5 U 75 68 23 11 U
PAHs
1-Methylnaphthalene µg/kg dw nv nv 150 30 U 31 U 31 U 30 U 92 U 250 100 56 93 U 93 U 93 U
2-Chloronaphthalene µg/kg dw nv nv 31 U 30 U 31 U 31 U 30 U 92 U 92 U 92 U 31 U 93 U 93 U 94 U
2-Methylnaphthalene mg/kg OC 38 64 AET 1.1 U 4.9 U 5.9 U 1.7 U 3.2 U 6.3 4.8 AET 2.6 U 2.3 U AET
Acenaphthene mg/kg OC 16 57 AET 2.4 5.7 5.9 U 3.6 3.8 55 8.1 AET 7.8 14 AET
Acenaphthylene mg/kg OC 66 66 AET 1.1 U 4.9 U 5.9 U 1.7 U 3.2 U 4.3 4.4 AET 4.2
3.3
AET
Anthracene mg/kg OC 220 1,200 AET 6.0 14 6.7 6.7 19 92 24 AET 27 28 AET
Benzo(a)anthracene mg/kg OC 110 270 AET 11 24 5.9 U 14 55 130 44 AET 97 100 AET
Benzo(a)pyrene mg/kg OC 99 210 AET 4.5 17 5.9 U 17 29 J 66 37 J AET 66 60 AET
Benzo(b)fluoranthene µg/kg dw nv nv 2,500 310 200 43 720 2,300 J 5,200 2,400 J 2,300 4,300 3,100 11,000
Benzo(g,h,i)perylene mg/kg OC 31 78 AET 1.1 U 4.9 U 5.9 U 3.7 8.9 J 14 9.3 J AET 17 22 AET
Slip 27 Sediment Sampling Results East Waterway, Harbor Island Superfund Site October 18, 2007
Page 12

Table 4a, cont.
ANALYTE UNIT SQS/SL CSL/ML
EW-S27-C1-1a
EW-S27-C1-2
EW-S27-C1-3
EW-S27-C1-4
EW-S27-C2-1
EW-S27-C2-2
EW-S27-C2-3
EW-S27-C2-4
EW-S27-C3-1a
EW-S27-C3-2
EW-S27-C3-3
EW-S27-C3-4a
0 - 1 ft 1 - 2 ft 2 - 3 ft 3 - 4 ft 0 - 1 ft 1 - 2 ft 2 - 3 ft 3 - 4 ft 0 - 1 ft 1 - 2 ft 2 - 3 ft 3 - 4 ft
Benzo(k)fluoranthene µg/kg dw nv nv 820 91 74 31 U 260 780 J 1,400 760 J 750 4,900 3,600 4,000
Benzofluoranthenes (total-calc'd) mg/kg OC 230 450 AET 15 43 8.2 55 110 J 190 120 J AET 250 170 AET
Chrysene mg/kg OC 110 460 AET 12 30 5.9 U 22 58 120 59 AET 110 110 AET
Dibenzo(a,h)anthracene mg/kg OC 12 33 AET 0.83 2.7 1.7 U 3.0 2.6 4.0 7.0 AET 12 7.3 AET
Dibenzofuran mg/kg OC 15 58 AET 1.9 5.6 5.9 U 2.5 3.2 U 25 UJ 6.7 AET 3.3 6.8 AET
Fluoranthene mg/kg OC 160 1,200 AET 38 59 15 42 170 460 63 AET 200 380 AET
Fluorene mg/kg OC 23 79 AET 2.1 6.7 5.9 U 2.5 5.5 63 8.9 AET 7.2 14 AET
Indeno(1,2,3-cd)pyrene mg/kg OC 34 88 AET 1.1 U 5.2 5.9 U 4.6 10 J 18 11 J AET 21 25 AET
Naphthalene mg/kg OC 99 170 AET 1.2 5.1 5.9 U 2.5 10 9.8 20 AET 3.9 5.0 AET
Phenanthrene mg/kg OC 100 480 AET 12 24 11 12 20 180 35 AET 33 55 AET
Pyrene mg/kg OC 1,000 1,400 AET 25 64 14 56 180 630 230 AET 280 330 AET
Total HPAH (calc'd) mg/kg OC 960 5,300 AET 110 245 37.3 220 623 J 1,600 581 J AET 1,100 1,200 AET
Total LPAH (calc'd) mg/kg OC 370 780 AET 24 56 18 27 58.6 409 101 AET 83 120 AET
Total PAH (calc'd) µg/kg dw nv nv 19,200 3,400 1,890 291 4,400 19,900 J 71,000 18,400 J 11,500 41,000 52,000 102,000
Phthalates
Bis(2-ethylhexyl)phthalate mg/kg OC 47 78 AET 1.4 4.9 U 5.9 U 17 110 J 3.5 3.4 U AET 110
140
AET
Butyl benzyl phthalate mg/kg OC 4.9 64 AET 0.35 U 1.5 U 1.7 U 0.79 6.5 0.63 4.1 AET 4.2 5.3 AET
Diethyl phthalate mg/kg OC 61 110 AET 1.1 U 4.9 U 5.9 U 1.7 U 3.2 U 2.7 U 3.4 U AET 2.6 U 2.3 U AET
Dimethyl phthalate mg/kg OC 53 53 AET 0.35 U 1.5 U 1.7 U 0.62 U 1.5 U 0.35 U 1.1 U AET 1.4 U 1.8 U AET
Di-n-butyl phthalate mg/kg OC 220 1,700 AET 1.1 U 4.9 U 5.9 U 1.7 U 3.2 U 2.7 U 3.4 U AET 2.6 U 2.3 U AET
Di-n-octyl phthalate mg/kg OC 58 4,500 AET 1.1 U 4.9 U 5.9 U 1.7 U R 2.7 U 3.4 U AET 2.6 U 2.3 UJ AET
Other SVOCs
1,2,4-Trichlorobenzene mg/kg OC 0.81 1.8 AET 0.35 U 1.5 U 1.7 U 0.51 U 1.1 U 0.27 U 1.1 U AET 0.86 U 0.78 U AET
1,2-Dichlorobenzene mg/kg OC 2.3 2.3 AET 0.35 U 1.5 U 1.7 U 0.51 U 1.1 U 0.27 U 1.1 U AET 0.86 U 0.78 U AET
1,3-Dichlorobenzene µg/kg dw 170 nv 31 U 30 U 31 U 31 U 30 U 92 U 92 U 92 U 31 U 93 U 93 U 93 U
1,4-Dichlorobenzene mg/kg OC 3.1 9 AET 0.35 U 1.5 U 1.7 U 0.51 U 1.1 U 0.27 U 1.1 U AET 0.86 U 0.78 U AET
2,4,5-Trichlorophenol µg/kg dw nv nv 160 U 150 U 160 U 150 U 150 U 460 U 460 U 460 U 150 U 460 U 460 U 460 U
2,4,6-Trichlorophenol µg/kg dw nv nv 160 U 150 U 160 U 150 U 150 U 460 U 460 U 460 U 150 U 460 U 460 U 460 U
Slip 27 Sediment Sampling Results East Waterway, Harbor Island Superfund Site October 18, 2007
Page 13

Table 4a, cont.
ANALYTE UNIT SQS/SL CSL/ML
EW-S27-C1-1a
EW-S27-C1-2
EW-S27-C1-3
EW-S27-C1-4
EW-S27-C2-1
EW-S27-C2-2
EW-S27-C2-3
EW-S27-C2-4
EW-S27-C3-1a
EW-S27-C3-2
EW-S27-C3-3
EW-S27-C3-4a
0 - 1 ft 1 - 2 ft 2 - 3 ft 3 - 4 ft 0 - 1 ft 1 - 2 ft 2 - 3 ft 3 - 4 ft 0 - 1 ft 1 - 2 ft 2 - 3 ft 3 - 4 ft
2,4-Dichlorophenol µg/kg dw nv nv 160 U 150 U 160 U 150 U 150 U 460 U 460 U 460 U 150 U 460 U 460 U 460 U
2,4-Dimethylphenol µg/kg dw 29 29 9.3 U 9.2 U 9.3 U 9.2 U 9.1 U 31 U 14 31 U 31 U 31 U 31 U 31 U
2,4-Dinitrophenol µg/kg dw nv nv 310 U 300 U 310 U 310 U 300 U 920 U 920 U 920 U 310 U 930 U 930 U 930 U
2,4-Dinitrotoluene µg/kg dw nv nv 160 U 150 U 160 U 150 U 150 U 460 U 460 U 460 U 150 U 460 U 460 U 460 U
2,6-Dinitrotoluene µg/kg dw nv nv 160 U 150 U 160 U 150 U 150 U 460 U 460 U 460 U 150 U 460 U 460 U 460 U
2-Chlorophenol µg/kg dw nv nv 31 U 30 U 31 U 31 U 30 U 92 U 92 U 92 U 31 U 93 U 93 U 93 U
2-Methylphenol µg/kg dw 63 63 9.3 U 9.2 U 9.3 U 9.2 U 9.1 U 31 U 9.2 U 31 U 31 U 31 U 31 U 31 U
2-Nitroaniline µg/kg dw nv nv 160 U 150 U 160 U 150 U 150 U 460 U 460 U 460 U 150 U 460 U 460 U 460 U
2-Nitrophenol µg/kg dw nv nv 160 U 150 U 160 U 150 U 150 U 460 U 460 U 460 U 150 U 460 U 460 U 460 U
3,3'-Dichlorobenzidine µg/kg dw nv nv 160 U 150 U 160 U 150 U 150 U 460 U 460 U 460 U 150 U 460 U 460 UJ 460 U
3-Nitroaniline µg/kg dw nv nv 160 U 150 U 160 U 150 U 150 U 460 U 460 U 460 U 150 U 460 U 460 U 460 U
4,6-Dinitro-o-cresol µg/kg dw nv nv 310 U 300 U 310 U 310 U 300 U 920 U 920 U 920 U 310 U 930 U 930 U 930 U
4-Bromophenyl phenyl ether µg/kg dw nv nv 31 U 30 U 31 U 31 U 30 U 92 U 92 U 92 U 31 U 93 U 93 U 93 U
4-Chloro-3-methylphenol µg/kg dw nv nv 160 U 150 U 160 U 150 U 150 U 460 U 460 U 460 U 150 U 460 U 460 U 460 U
4-Chloroaniline µg/kg dw nv nv 160 U 150 U 160 U 150 U 150 U 460 U 460 U 460 U 150 U 460 U 460 U 460 U
4-Chlorophenyl phenyl ether µg/kg dw nv nv 31 U 30 U 31 U 31 U 30 U 92 U 92 U 92 U 31 U 93 U 93 U 93 U
4-Methylphenol µg/kg dw 670 670 31 U 30 U 31 U 31 U 30 U 92 U 92 U 92 U 31 U 93 U 93 U 93 U
4-Nitroaniline µg/kg dw nv nv 160 U 150 U 160 U 150 U 150 U 460 U 460 U 460 U 150 U 460 U 460 U 460 U
4-Nitrophenol µg/kg dw nv nv 160 U 150 U 160 U 150 U 150 U 460 UJ 460 U 460 UJ 150 U 460 UJ 460 UJ 460 U
Aniline µg/kg dw nv nv 31 U 30 U 31 U 31 U 30 U 92 UJ 92 UJ 92 UJ 31 U 93 UJ 93 UJ 93 U
Benzoic acid µg/kg dw 650 650 310 U 300 U 310 U 310 U 300 U 920 U 920 U 920 U 310 U 930 U 930 U 930 U
Benzyl alcohol µg/kg dw 57 73 47 U 46 U 46 U 46 U 46 U 150 U 46 U 150 U 150 U 150 U 150 U 160 U
bis(2-chloroethoxy)methane µg/kg dw nv nv 31 U 30 U 31 U 31 U 30 U 92 U 92 U 92 U 31 U 93 U 93 U 93 U
bis(2-chloroethyl)ether µg/kg dw nv nv 31 U 30 U 31 U 31 U 30 U 92 U 92 U 92 U 31 U 93 U 93 U 93 U
bis(2-chloroisopropyl)ether µg/kg dw nv nv 31 U 30 U 31 U 31 U 30 U 92 U 92 U 92 U 31 U 93 U 93 U 93 U
Hexachlorobenzene mg/kg OC 0.38 2.3 AET 0.037 U 0.16 U 0.19 U 0.055 U 0.34 U 0.028 U 0.070 U AET 0.27 U 0.25 U AET
Hexachlorobutadiene mg/kg OC 3.9 6.2 AET 0.037 U 0.16 U 0.19 U 0.055 U 0.34 U 0.028 U 0.070 U AET 0.27 U 0.25 U AET
Hexachlorocyclopentadiene µg/kg dw nv nv 160 U 150 U 160 U 150 U 150 U 460 U 460 U 460 U 150 U 460 U 460 U 460 UJ
Slip 27 Sediment Sampling Results East Waterway, Harbor Island Superfund Site October 18, 2007
Page 14
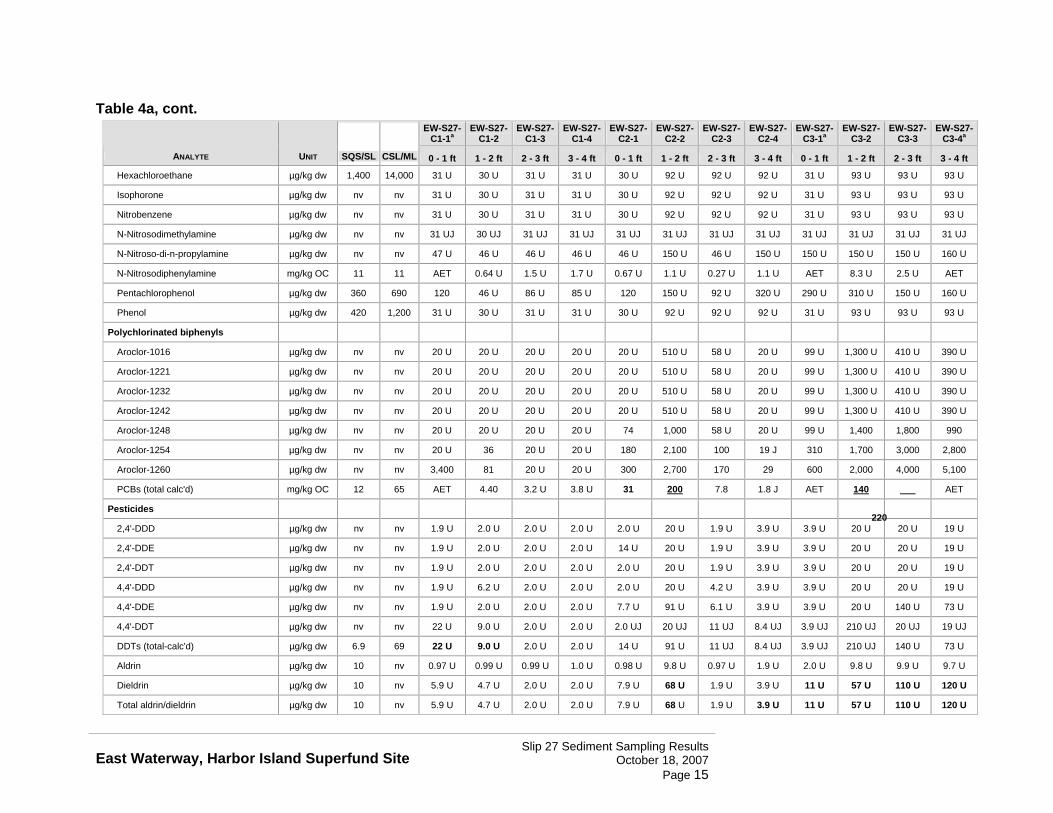
Table 4a, cont.
ANALYTE UNIT SQS/SL CSL/ML
EW-S27-C1-1a
EW-S27-C1-2
EW-S27-C1-3
EW-S27-C1-4
EW-S27-C2-1
EW-S27-C2-2
EW-S27-C2-3
EW-S27-C2-4
EW-S27-C3-1a
EW-S27-C3-2
EW-S27-C3-3
EW-S27-C3-4a
0 - 1 ft 1 - 2 ft 2 - 3 ft 3 - 4 ft 0 - 1 ft 1 - 2 ft 2 - 3 ft 3 - 4 ft 0 - 1 ft 1 - 2 ft 2 - 3 ft 3 - 4 ft
Hexachloroethane µg/kg dw 1,400 14,000 31 U 30 U 31 U 31 U 30 U 92 U 92 U 92 U 31 U 93 U 93 U 93 U
Isophorone µg/kg dw nv nv 31 U 30 U 31 U 31 U 30 U 92 U 92 U 92 U 31 U 93 U 93 U 93 U
Nitrobenzene µg/kg dw nv nv 31 U 30 U 31 U 31 U 30 U 92 U 92 U 92 U 31 U 93 U 93 U 93 U
N-Nitrosodimethylamine µg/kg dw nv nv 31 UJ 30 UJ 31 UJ 31 UJ 31 UJ 31 UJ 31 UJ 31 UJ 31 UJ 31 UJ 31 UJ 31 UJ
N-Nitroso-di-n-propylamine µg/kg dw nv nv 47 U 46 U 46 U 46 U 46 U 150 U 46 U 150 U 150 U 150 U 150 U 160 U
N-Nitrosodiphenylamine mg/kg OC 11 11 AET 0.64 U 1.5 U 1.7 U 0.67 U 1.1 U 0.27 U 1.1 U AET 8.3 U 2.5 U AET
Pentachlorophenol µg/kg dw 360 690 120 46 U 86 U 85 U 120 150 U 92 U 320 U 290 U 310 U 150 U 160 U
Phenol µg/kg dw 420 1,200 31 U 30 U 31 U 31 U 30 U 92 U 92 U 92 U 31 U 93 U 93 U 93 U
Polychlorinated biphenyls
Aroclor-1016 µg/kg dw nv nv 20 U 20 U 20 U 20 U 20 U 510 U 58 U 20 U 99 U 1,300 U 410 U 390 U
Aroclor-1221 µg/kg dw nv nv 20 U 20 U 20 U 20 U 20 U 510 U 58 U 20 U 99 U 1,300 U 410 U 390 U
Aroclor-1232 µg/kg dw nv nv 20 U 20 U 20 U 20 U 20 U 510 U 58 U 20 U 99 U 1,300 U 410 U 390 U
Aroclor-1242 µg/kg dw nv nv 20 U 20 U 20 U 20 U 20 U 510 U 58 U 20 U 99 U 1,300 U 410 U 390 U
Aroclor-1248 µg/kg dw nv nv 20 U 20 U 20 U 20 U 74 1,000 58 U 20 U 99 U 1,400 1,800 990
Aroclor-1254 µg/kg dw nv nv 20 U 36 20 U 20 U 180 2,100 100 19 J 310 1,700 3,000 2,800
Aroclor-1260 µg/kg dw nv nv 3,400 81 20 U 20 U 300 2,700 170 29 600 2,000 4,000 5,100
PCBs (total calc'd) mg/kg OC 12 65 AET 4.40 3.2 U 3.8 U 31 200 7.8 1.8 J AET 140
220
AET
Pesticides
2,4'-DDD µg/kg dw nv nv 1.9 U 2.0 U 2.0 U 2.0 U 2.0 U 20 U 1.9 U 3.9 U 3.9 U 20 U 20 U 19 U
2,4'-DDE µg/kg dw nv nv 1.9 U 2.0 U 2.0 U 2.0 U 14 U 20 U 1.9 U 3.9 U 3.9 U 20 U 20 U 19 U
2,4'-DDT µg/kg dw nv nv 1.9 U 2.0 U 2.0 U 2.0 U 2.0 U 20 U 1.9 U 3.9 U 3.9 U 20 U 20 U 19 U
4,4'-DDD µg/kg dw nv nv 1.9 U 6.2 U 2.0 U 2.0 U 2.0 U 20 U 4.2 U 3.9 U 3.9 U 20 U 20 U 19 U
4,4'-DDE µg/kg dw nv nv 1.9 U 2.0 U 2.0 U 2.0 U 7.7 U 91 U 6.1 U 3.9 U 3.9 U 20 U 140 U 73 U
4,4'-DDT µg/kg dw nv nv 22 U 9.0 U 2.0 U 2.0 U 2.0 UJ 20 UJ 11 UJ 8.4 UJ 3.9 UJ 210 UJ 20 UJ 19 UJ
DDTs (total-calc'd) µg/kg dw 6.9 69 22 U 9.0 U 2.0 U 2.0 U 14 U 91 U 11 UJ 8.4 UJ 3.9 UJ 210 UJ 140 U 73 U
Aldrin µg/kg dw 10 nv 0.97 U 0.99 U 0.99 U 1.0 U 0.98 U 9.8 U 0.97 U 1.9 U 2.0 U 9.8 U 9.9 U 9.7 U
Dieldrin µg/kg dw 10 nv 5.9 U 4.7 U 2.0 U 2.0 U 7.9 U 68 U 1.9 U 3.9 U 11 U 57 U 110 U 120 U
Total aldrin/dieldrin µg/kg dw 10 nv 5.9 U 4.7 U 2.0 U 2.0 U 7.9 U 68 U 1.9 U 3.9 U 11 U 57 U 110 U 120 U
Slip 27 Sediment Sampling Results East Waterway, Harbor Island Superfund Site October 18, 2007
Page 15
Table 4a, cont.
ANALYTE UNIT SQS/SL CSL/ML
EW-S27-C1-1a
EW-S27-C1-2
EW-S27-C1-3
EW-S27-C1-4
EW-S27-C2-1
EW-S27-C2-2
EW-S27-C2-3
EW-S27-C2-4
EW-S27-C3-1a
EW-S27-C3-2
EW-S27-C3-3
EW-S27-C3-4a
0 - 1 ft 1 - 2 ft 2 - 3 ft 3 - 4 ft 0 - 1 ft 1 - 2 ft 2 - 3 ft 3 - 4 ft 0 - 1 ft 1 - 2 ft 2 - 3 ft 3 - 4 ft
alpha-BHC µg/kg dw nv nv 0.97 U 0.99 U 0.99 U 1.0 U 0.98 U 9.8 U 0.97 U 1.9 U 2.0 U 9.8 U 9.9 U 9.7 U
beta-BHC µg/kg dw nv nv 5.6 U 0.99 U 0.99 U 1.0 U 0.98 U 9.8 U 10 U 1.9 U 2.0 U 11 U 9.9 U 9.7 U
gamma-BHC µg/kg dw 10 nv 0.97 U 0.99 U 0.99 U 1.0 U 0.98 U 9.8 U 0.97 U 1.9 U 2.0 U 9.8 U 9.9 U 9.7 U
delta-BHC µg/kg dw nv nv 0.97 U 0.99 U 0.99 U 1.0 U 0.98 U 9.8 U 0.97 U 1.9 U 2.0 U 9.8 U 9.9 U 9.7 U
alpha-Chlordane µg/kg dw nv nv 0.97 U 0.99 U 0.99 U 1.0 U 0.98 U 9.8 U 0.97 U 1.9 U 2.0 U 9.8 U 9.9 U 9.7 U
gamma-Chlordane µg/kg dw nv nv 3.5 U 0.99 U 0.99 U 1.0 U 0.98 U 9.8 U 0.97 U 1.9 U 2.0 U 9.8 U 9.9 U 9.7 U
alpha-Endosulfan µg/kg dw nv nv 0.97 U 0.99 U 0.99 U 1.0 U 0.98 U 9.8 U 0.97 U 1.9 U 2.0 U 9.8 U 9.9 U 9.7 U
beta-Endosulfan µg/kg dw nv nv 1.9 U 2.0 U 2.0 U 2.0 U 2.0 U 20 U 1.9 U 3.9 U 3.9 U 20 U 20 U 19 U
Endosulfan sulfate µg/kg dw nv nv 1.9 U 2.0 U 2.0 U 2.0 U 2.0 U 20 U 8.7 U 3.9 U 3.9 U 20 U 20 U 19 U
Endrin µg/kg dw nv nv 1.9 U 2.0 U 2.0 U 2.0 U 3.7 U 20 U 1.9 U 3.9 U 5.6 U 20 U 35 U 70 U
Endrin aldehyde µg/kg dw nv nv 11 U 2.0 U 2.0 U 2.0 U 11 U 100 U 1.9 U 3.9 U 15 U 81 U 130 U 19 U
Endrin ketone µg/kg dw nv nv 1.9 U 10 U 2.0 U 2.0 U 16 U 150 U 6.2 U 3.9 U 25 U 20 U 160 U 390 U
Heptachlor µg/kg dw 10 nv 0.97 U 0.99 U 0.99 U 1.0 U 0.98 U 9.8 U 0.97 U 23 U 2.0 U 9.8 U 9.9 U 9.7 U
Heptachlor epoxide µg/kg dw nv nv 0.97 U 0.99 U 0.99 U 1.0 U 0.98 U 9.8 U 0.97 U 1.9 U 2.0 U 9.8 U 9.9 U 9.7 U
Methoxychlor µg/kg dw nv nv 9.7 U 9.9 U 9.9 U 10 U 9.8 U 98 U 9.7 U 19 U 20 U 98 U 99 U 97 U
Mirex µg/kg dw nv nv 9.9 U 2.0 U 2.0 U 2.0 U 2.0 U 20 U 1.9 U 3.9 U 3.9 U 20 U 20 U 19 U
Cis-Nonachlor µg/kg dw nv nv 7.6 U 2.0 U 2.0 U 2.0 U 10 U 87 UJ 1.9 UJ 3.9 UJ 17 UJ 74 UJ 130 UJ 200 UJ
Oxychlordane µg/kg dw nv nv 1.9 U 2.0 U 2.0 U 2.0 U 2.0 U 30 U 1.9 U 3.9 U 3.9 U 36 U 47 U 19 U
Toxaphene µg/kg dw nv nv 97 U 99 U 99 U 100 U 98 U 980 U 97 U 190 U 200 U 980 U 990 U 970 U
Trans-Nonachlor µg/kg dw nv nv 1.9 U 2.0 U 2.0 U 2.0 U 2.0 U 20 U 1.9 U 3.9 U 3.9 U 20 U 20 U 19 U
Total Chlordane (calc'd) µg/kg dw 10 nv 7.6 U 2.0 U 2.0 U 2.0 U 10 U 87 UJ 1.9 UJ 3.9 UJ 17 UJ 74 UJ 130 UJ 200 UJ
Grain size
Fractional % phi >-1 (>2000 µm) % dw nv nv 13.1 1.3 0.4 0.9 3.6 1.2 0.7 0.4 18.0 2.2 2.8 2.8
Fractional % phi -1-0 (1000-2000 µm) % dw nv nv 7.4 1.1 0.6 0.3 3.9 2.7 1.1 1.0 5.5 2.4 2.7 3.2
Fractional % phi 0-1 (500-1000 µm) % dw nv nv 7.1 5.6 6.6 4.0 12.1 8.2 3.1 1.6 5.7 3.1 2.3 2.5
Fractional % phi 1-2 (250-500 µm) % dw nv nv 28.5 45.0 45.0 39.1 41.4 17.6 15.8 4.4 22.7 14.6 7.7 7.0
Fractional % phi 2-3 (125-250 µm) % dw nv nv 25.3 35.5 34.6 35.9 18.0 10.9 7.9 4.0 9.8 14.7 11.7 7.7
Fractional % phi 3-4 (62.5-125 µm) % dw nv nv 9.2 5.4 7.2 10.6 3.7 4.9 4.2 3.6 3.4 6.3 5.5 4.2
Slip 27 Sediment Sampling Results East Waterway, Harbor Island Superfund Site October 18, 2007
Page 16
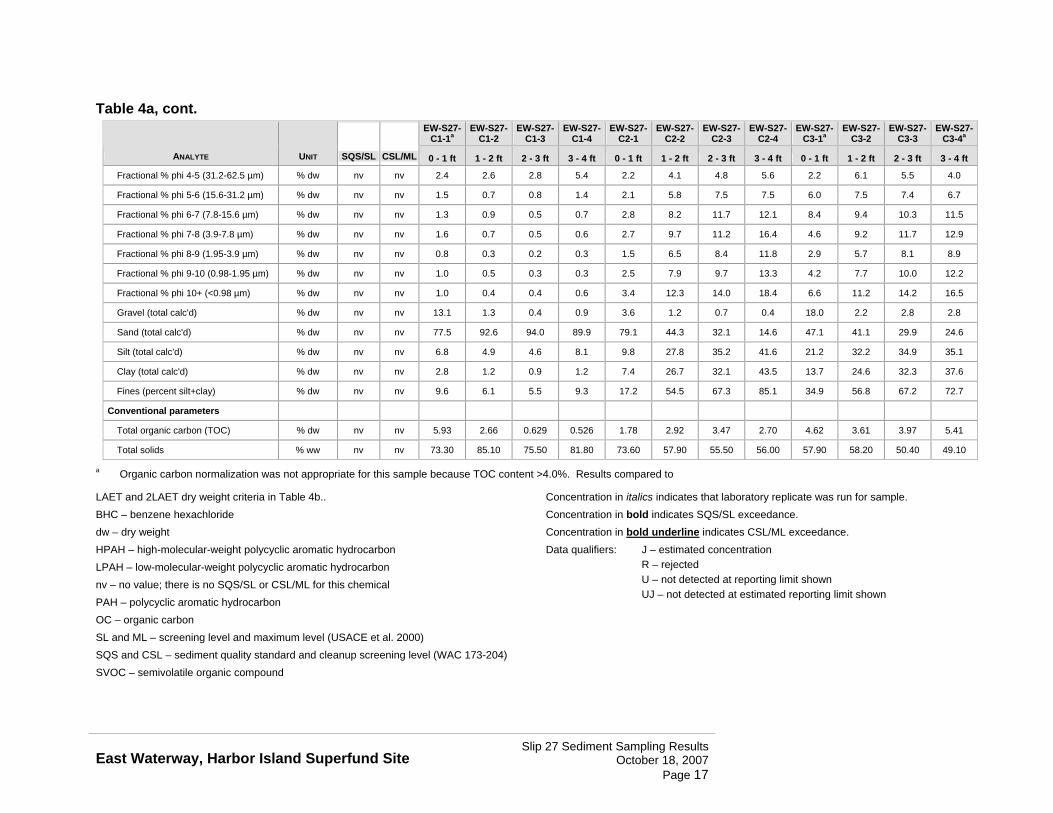
Table 4a, cont.
ANALYTE UNIT SQS/SL CSL/ML
EW-S27-C1-1a
EW-S27-C1-2
EW-S27-C1-3
EW-S27-C1-4
EW-S27-C2-1
EW-S27-C2-2
EW-S27-C2-3
EW-S27-C2-4
EW-S27-C3-1a
EW-S27-C3-2
EW-S27-C3-3
EW-S27-C3-4a
0 - 1 ft 1 - 2 ft 2 - 3 ft 3 - 4 ft 0 - 1 ft 1 - 2 ft 2 - 3 ft 3 - 4 ft 0 - 1 ft 1 - 2 ft 2 - 3 ft 3 - 4 ft
Fractional % phi 4-5 (31.2-62.5 µm) % dw nv nv 2.4 2.6 2.8 5.4 2.2 4.1 4.8 5.6 2.2 6.1 5.5 4.0
Fractional % phi 5-6 (15.6-31.2 µm) % dw nv nv 1.5 0.7 0.8 1.4 2.1 5.8 7.5 7.5 6.0 7.5 7.4 6.7
Fractional % phi 6-7 (7.8-15.6 µm) % dw nv nv 1.3 0.9 0.5 0.7 2.8 8.2 11.7 12.1 8.4 9.4 10.3 11.5
Fractional % phi 7-8 (3.9-7.8 µm) % dw nv nv 1.6 0.7 0.5 0.6 2.7 9.7 11.2 16.4 4.6 9.2 11.7 12.9
Fractional % phi 8-9 (1.95-3.9 µm) % dw nv nv 0.8 0.3 0.2 0.3 1.5 6.5 8.4 11.8 2.9 5.7 8.1 8.9
Fractional % phi 9-10 (0.98-1.95 µm) % dw nv nv 1.0 0.5 0.3 0.3 2.5 7.9 9.7 13.3 4.2 7.7 10.0 12.2
Fractional % phi 10+ (<0.98 µm) % dw nv nv 1.0 0.4 0.4 0.6 3.4 12.3 14.0 18.4 6.6 11.2 14.2 16.5
Gravel (total calc'd) % dw nv nv 13.1 1.3 0.4 0.9 3.6 1.2 0.7 0.4 18.0 2.2 2.8 2.8
Sand (total calc'd) % dw nv nv 77.5 92.6 94.0 89.9 79.1 44.3 32.1 14.6 47.1 41.1 29.9 24.6
Silt (total calc'd) % dw nv nv 6.8 4.9 4.6 8.1 9.8 27.8 35.2 41.6 21.2 32.2 34.9 35.1
Clay (total calc'd) % dw nv nv 2.8 1.2 0.9 1.2 7.4 26.7 32.1 43.5 13.7 24.6 32.3 37.6
Fines (percent silt+clay) % dw nv nv 9.6 6.1 5.5 9.3 17.2 54.5 67.3 85.1 34.9 56.8 67.2 72.7
Conventional parameters
Total organic carbon (TOC) % dw nv nv 5.93 2.66 0.629 0.526 1.78 2.92 3.47 2.70 4.62 3.61 3.97 5.41
Total solids % ww nv nv 73.30 85.10 75.50 81.80 73.60 57.90 55.50 56.00 57.90 58.20 50.40 49.10
a Organic carbon normalization was not appropriate for this sample because TOC content >4.0%. Results compared to
LAET and 2LAET dry weight criteria in Table 4b.. BHC – benzene hexachloride dw – dry weight HPAH – high-molecular-weight polycyclic aromatic hydrocarbon LPAH – low-molecular-weight polycyclic aromatic hydrocarbon nv – no value; there is no SQS/SL or CSL/ML for this chemical PAH – polycyclic aromatic hydrocarbon OC – organic carbon SL and ML – screening level and maximum level (USACE et al. 2000) SQS and CSL – sediment quality standard and cleanup screening level (WAC 173-204) SVOC – semivolatile organic compound
Concentration in italics indicates that laboratory replicate was run for sample. Concentration in bold indicates SQS/SL exceedance. Concentration in bold underline indicates CSL/ML exceedance. Data qualifiers: J – estimated concentration
R – rejected U – not detected at reporting limit shown UJ – not detected at estimated reporting limit shown
Slip 27 Sediment Sampling Results East Waterway, Harbor Island Superfund Site October 18, 2007
Page 17
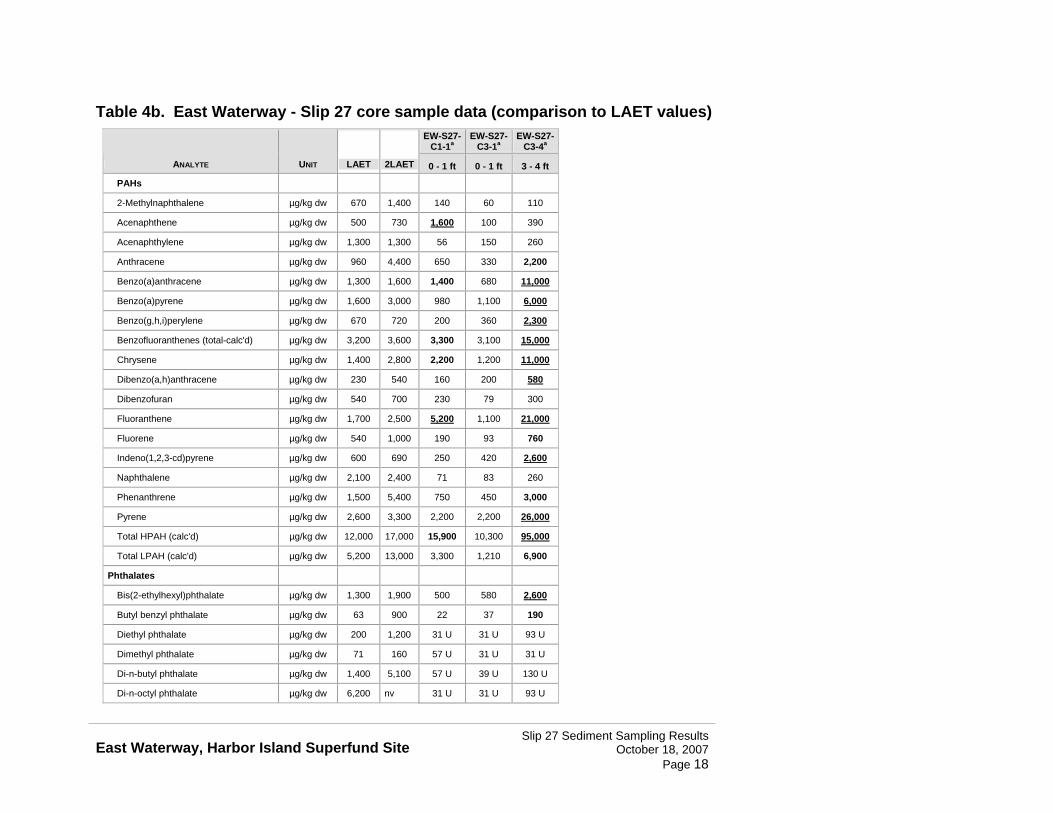
Table 4b. East Waterway - Slip 27 core sample data (comparison to LAET values)
ANALYTE UNIT LAET 2LAET
EW-S27-C1-1a
EW-S27-C3-1a
EW-S27-C3-4a
0 - 1 ft 0 - 1 ft 3 - 4 ft
PAHs
2-Methylnaphthalene µg/kg dw 670 1,400 140 60 110
Acenaphthene µg/kg dw 500 730 1,600 100 390
Acenaphthylene µg/kg dw 1,300 1,300 56 150 260
Anthracene µg/kg dw 960 4,400 650 330 2,200
Benzo(a)anthracene µg/kg dw 1,300 1,600 1,400 680 11,000
Benzo(a)pyrene µg/kg dw 1,600 3,000 980 1,100 6,000
Benzo(g,h,i)perylene µg/kg dw 670 720 200 360 2,300
Benzofluoranthenes (total-calc'd) µg/kg dw 3,200 3,600 3,300 3,100 15,000
Chrysene µg/kg dw 1,400 2,800 2,200 1,200 11,000
Dibenzo(a,h)anthracene µg/kg dw 230 540 160 200 580
Dibenzofuran µg/kg dw 540 700 230 79 300
Fluoranthene µg/kg dw 1,700 2,500 5,200 1,100 21,000
Fluorene µg/kg dw 540 1,000 190 93 760
Indeno(1,2,3-cd)pyrene µg/kg dw 600 690 250 420 2,600
Naphthalene µg/kg dw 2,100 2,400 71 83 260
Phenanthrene µg/kg dw 1,500 5,400 750 450 3,000
Pyrene µg/kg dw 2,600 3,300 2,200 2,200 26,000
Total HPAH (calc'd) µg/kg dw 12,000 17,000 15,900 10,300 95,000
Total LPAH (calc'd) µg/kg dw 5,200 13,000 3,300 1,210 6,900
Phthalates
Bis(2-ethylhexyl)phthalate µg/kg dw 1,300 1,900 500 580 2,600
Butyl benzyl phthalate µg/kg dw 63 900 22 37 190
Diethyl phthalate µg/kg dw 200 1,200 31 U 31 U 93 U
Dimethyl phthalate µg/kg dw 71 160 57 U 31 U 31 U
Di-n-butyl phthalate µg/kg dw 1,400 5,100 57 U 39 U 130 U
Di-n-octyl phthalate µg/kg dw 6,200 nv 31 U 31 U 93 U
Slip 27 Sediment Sampling Results East Waterway, Harbor Island Superfund Site October 18, 2007
Page 18

ANALYTE UNIT LAET 2LAET
EW-S27-C1-1a
EW-S27-C3-1a
EW-S27-C3-4a
0 - 1 ft 0 - 1 ft 3 - 4 ft
Other SVOCs
1,2,4-Trichlorobenzene µg/kg dw 31 51 9.3 U 31 U 31 U
1,2-Dichlorobenzene µg/kg dw 35 50 9.3 U 31 U 31 U
1,4-Dichlorobenzene µg/kg dw 110 120 9.3 U 31 U 31 U
Hexachlorobenzene µg/kg dw 22 70 0.97 U 2.0 U 9.7 U
Hexachlorobutadiene µg/kg dw 11 120 0.97 U 2.0 U 9.7 U
N-Nitrosodiphenylamine µg/kg dw 28 40 190 U 31 U 40 U
Polychlorinated biphenyls
PCBs (total calc'd) µg/kg dw 130 1,000 3,400 910 8,900
Total organic carbon (TOC) % dw nv nv 5.93 4.62 5.41
dw – dry weight HPAH – high-molecular-weight polycyclic aromatic hydrocarbon LAET – lowest apparent effects threshold, 2LAET – second lowest apparent effects threshold LPAH – low-molecular-weight polycyclic aromatic hydrocarbon nv – no value; there is no LAET or 2LAET for this chemical PAH – polycyclic aromatic hydrocarbon SVOC – semivolatile organic compound Concentration in italics indicates that laboratory replicate was run for sample Concentration in bold indicates LAET exceedance. Concentration in bold underline indicates 2LAET exceedance. Data qualifiers: J – estimated concentration
U – not detected at reporting limit shown UJ –not detected at estimated reporting limit shown
Slip 27 Sediment Sampling Results East Waterway, Harbor Island Superfund Site October 18, 2007
Page 19

Figures 2 through 9 show the grab and core locations of chemicals which exceeded the SQS or CSL in more than 1 sample. The results for total HPAH were presented rather than the results for each individual PAH (Figure 4). Figure 10 shows all other detected exceedances not shown in Figures 2-9. Figure 11 shows all the locations with reporting limits associated with non-detected results that exceeded SMS or DMMP values.
2.4.1 Surface sediment grab samples
The results for the surface sediment grab samples are presented in Table 3. The surface sediment samples exceeding SMS criteria are also indicated on Figures 2 through 9.
� One sample (S27-1G) exceeded the SQS criteria for mercury and zinc (Figures 3 and 9, respectively). Two samples exceeded SMS values for PAHs. Two PAH compounds (acenaphthene and fluoranthene) had concentrations above the corresponding 2 LAET values in S27-4G and two PAH compounds (benzo(a)anthracene and chrysene) were above the corresponding SQS in S27-9G.
� Two samples had semi-volatile organic compounds (SVOC) exceedances, N-nitrosodiphenylamine exceeded the CSL in S27-4G and 2,4-Dimethylphenol exceeded the CSL in S27-1G.
� All surface grab samples exceeded the SQS for PCBs (Figure 2), of which one sample also exceeded the 2LAET (CSL dry weight equivalent).
� No pesticides were detected any of the grabs samples, however total DDTs reporting limits associated with non-detected results exceeded the SL (5 samples) and ML (1 sample)\. The RL for dieldrin was above the SL in S27-1G. The RL for total chlordane exceeded the SL in S27-9G.
� There are no SMS values for sediment TBT concentrations. The maximum sediment TBT concentrations were reported in samples S27-2G, a field replicate of S27-2G and S27-3G (120, 150 and 130 mg/kg dw, respectively).
2.4.2 Sediment core samples
The results for the three sediment cores are presented in Table 4. The results of the core samples for selected analytes are also presented on Figures 2 through 9.
� At core locations S27-2C (1-2 ft) and S27-3C (2-3 ft, 3-4 ft) cadmium and zinc exceeded the CSL criteria (Figures 6 and 9, respectively).
� Copper and silver concentrations (Figures 7 and 8, respectively) were greater than the respective CSLs in S27-3C (2-3 ft and 3-4 ft).
� Mercury concentrations (Figure 3) exceeded the SQS in the 0-1-ft sample from S27-3C and the CSL in the three remaining samples from S27-3C as well as the 0-1 ft, 1-2 ft, 2-3 ft, and 3-4 ft samples from S27-2C.
Slip 27 Sediment Sampling Results East Waterway, Harbor Island Superfund Site October 18, 2007
Page 20

� There is no SMS value for sediment TBT concentrations. The maximum sediment TBT concentration (460 mg/kg dw) was measured in S27-1C (0-1 ft).
� PAH concentrations exceeded the LAET [(benzo(a)anthracene, total benzofluoranthenes, chrysene and high molecular weight PAH (HPAH)] and 2LAET (acenaphthene, fluoranthene) in the 0-1ft interval of core location S27-C1. PAH concentrations also exceeded the SQS the 1-2 ft (fluoranthene) and 2-3 ft (acenaphthene, benzo(a)anthracene, chrysene, fluoranthene, phenanthrene, HPAH, LPAH) intervals from locations S27-2C. PAH concentrations above the SQS were reported for S27-C3 in the 1-2 ft sample (total benzofluoranthenes, fluoranthene, HPAH) and the 2-3 ft sample (fluoranthene and HPAH). In the 3-4 ft sample, concentrations of nine individual PAH and total HPAH concentrations (Figure 4) exceeded the 2LAET and concentrations of two individual PAH and total LPAH exceeded the LAET.
� Bis(2-ethylhexyl)phthalate (BEHP) exceeded the CSL in four core samples (Figure 5), S27-2C (1-2 ft) and S27-3C (1-2 ft, 2-3 ft, and 3-4 ft).
� Butylbenzyl phthalate concentrations exceeded the SQS in S27-2C (1-2 ft).
� N-nitrosodiphenylamine RL exceeded the SQS in S27-1C (0-1 ft).
� PCBs exceeded the CSL or 2LAET at least once in each core location (Figure 2). The 2LAET was exceeded in samples S27-1C (0-1 ft) and S27-3C (0-1 ft and 3-4 ft). The CSL was exceeded in samples S27-2C (1-2 ft) and S27-3C (1-2 ft and 2-3 ft), the SQS for PCBs was also exceeded at S27-2C (0-1 ft).
� No pesticides were detected any of the core samples, however RLs associated with non-detected values for total DDTs exceeded the SL (5 samples) and ML (4 samples). Reporting limits associated with non-detected values for dieldrin exceeded the SL(4 samples). Total chlordane reporting limits exceeded the same four samples. The four samples with total DDT RLs above the ML and dieldrin and total chlordane RLs above the SL were all samples with total PCB concentrations above the CSL.
2.5 DATA VALIDATION
The raw laboratory data and field sample documentation forms are available upon request. Rinsate blank (RB) and field duplicate samples were collected as part of the quality assurance procedure. The RB results were not detected indicating that no cross contamination between samples or introduction of contamination from sampling equipment occurred. A field duplicate was also collected and its results are presented next to its parent sample.
The sediment samples submitted to ARI were analyzed in two sample delivery groups: KL33 and KL34. EcoChem conducted a summary-level data validation on all results. The data validation included a review of calibration, internal standard, and
Slip 27 Sediment Sampling Results East Waterway, Harbor Island Superfund Site October 18, 2007
Page 21

3
interference check sample summary forms. The majority of the data did not require qualification, or were qualified with a J, indicating an estimated value. Based on the information reviewed, the overall data quality was considered acceptable for use as qualified. The complete data validation report providing detailed information regarding every qualified sample is available upon request.
Matrix interferences were identified in the SVOC full-scan, SVOC-SIM, and the pesticide analyses. Extracts were submitted for silica gel clean up and re-analyzed following the cleanup. Two SVOCs, N-nitrosodiphenylamine (8 samples) and pentachlorophenol (3 samples) were initially M-qualified by the laboratory and subsequently JN qualified by EcoChem to indicate that analytical interferences resulted in uncertainty with regard to analyte identification and quantification. A single monobutyltin result was JN qualified for the same reason. The spectra for these twelve M-qualified results were evaluated by EPA, and it was concluded that these results should be reported as non-detected with RLs elevated to the level of the reported concentration. Several pesticide results were qualified as not detected with elevated reporting limits that reflect probable interference in the analysis due to the presence of PCBs in the samples. Additional matrix interferences resulted in elevated reporting limits for several SVOC results. One non-detected result for di-n-octyl-phthalate in sample EW-S27-C2-2 was rejected because of severely low internal standard recoveries. The detected results in this sample that were associated with low internal standard recoveries were J-qualified as estimated.
Data Interpretation
Elevated reporting limits associated with pesticide results are not indicative of the presence of pesticides in the sediment samples. Matrix interference in the analysis of pesticides due to the presence of PCBs has been observed historically in East Waterway, the lower Duwamish and many other sites.
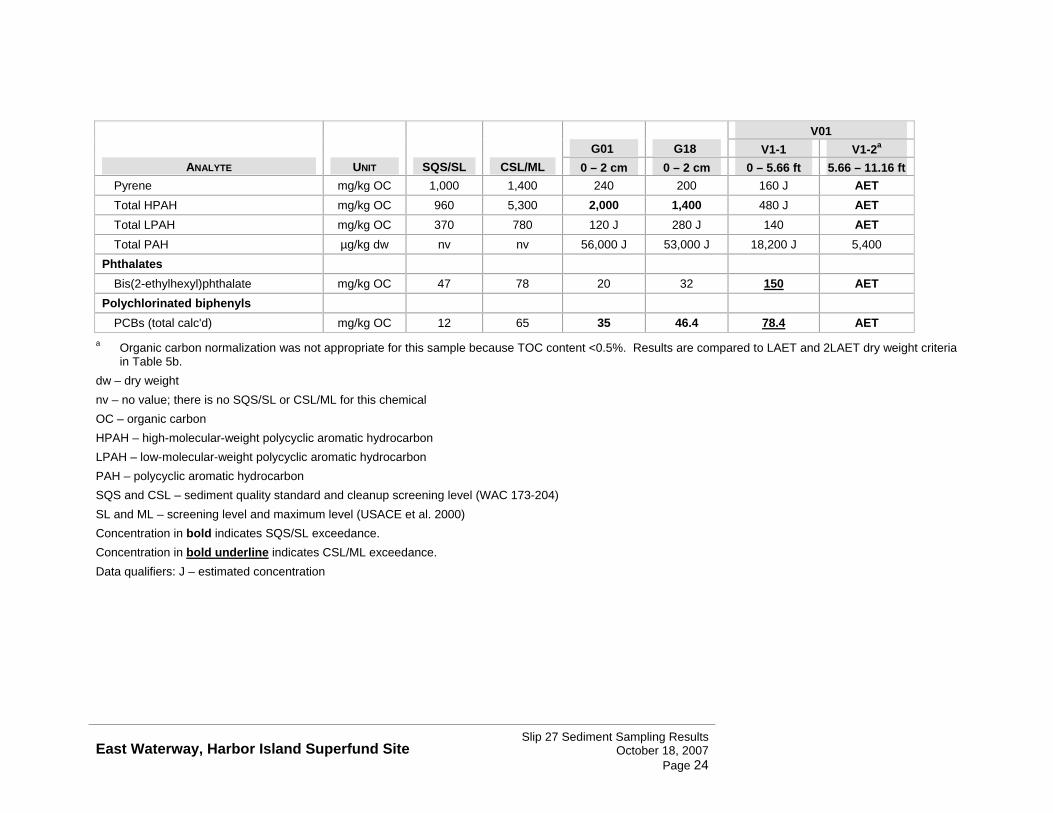
The sediment concentrations were compared to results for two grab samples and a core sample collected in this area in 1991 by Battelle (Smolski et al. 1991) (Figure 1). The results for the historical samples are summarized in Table 5. There are important differences between the historical data and the 2007 data presented here. The core sample collected in 1991 was analyzed as two composites representing 0-5.7 ft and 5.7-11.2 ft. In 2007, sediment cores were collected representing 0-4 ft of sediment and analyzed in one foot intervals. In addition, the surface grabs analyzed by Battelle represent the top 2cm of sediment compared to the surface sediment results for this investigation which represent the top 10cm.
Slip 27 Sediment Sampling Results East Waterway, Harbor Island Superfund Site October 18, 2007
Page 22

Table 5a. East Waterway Pier 27 (historical) grabs and core samples
ANALYTE UNIT SQS/SL CSL/ML G01 G18
V01 V1-1 V1-2a
0 – 2 cm 0 – 2 cm 0 – 5.66 ft 5.66 – 11.16 ft Metals and trace elements
Cadmium mg/kg dw 5.1 6.7 2.9 5.42 8.18 0.47 Chromium mg/kg dw 260 270 102 109 180 48 Copper mg/kg dw 390 390 160.6 155.2 160.1 37.6 Mercury mg/kg dw 0.41 0.59 0.664 0.607 0.970 0.16 Silver mg/kg dw 6.1 6.1 1.82 1.68 3.89 0.3 Zinc mg/kg dw 410 960 799 946 840 124.4
PAHs Acenaphthene mg/kg OC 16 57 4.2 J 10 34 AET Acenaphthylene mg/kg OC 66 66 6.0 J 4.9 J 2.4 AET Anthracene mg/kg OC 220 1,200 34 45 3.7 AET Benzo(a)anthracene mg/kg OC 110 270 180 100 51 AET Benzo(a)pyrene mg/kg OC 99 210 190 110 23 AET Benzo(b)fluoranthene µg/kg dw nv nv 7,000 5,400 1,800 340 Benzo(g,h,i)perylene mg/kg OC 31 78 42 23 10 AET Benzo(k)fluoranthene µg/kg dw nv nv 5,300 5,200 na na Total benzofluoranthenes mg/kg OC 230 450 464
344
61 AET Chrysene mg/kg OC 110 460 230 180 51 AET Dibenzo(a,h)anthracene mg/kg OC 12 33 31 23 4.7 AET Dibenzofuran mg/kg OC 15 58 6.8 U 7.8 18 AET Fluoranthene mg/kg OC 160 1,200 490 390 100 AET Fluorene mg/kg OC 23 79 6.8 J 16 27 AET Indeno(1,2,3-cd)pyrene mg/kg OC 34 88 110
75
11 AET Naphthalene mg/kg OC 99 170 3.6 J 3.9 J 6.4 AET Phenanthrene mg/kg OC 100 480 68 200 64 AET
Slip 27 Sediment Sampling Results East Waterway, Harbor Island Superfund Site October 18, 2007
Page 23
ANALYTE UNIT SQS/SL CSL/ML G01 G18
V01 V1-1 V1-2a
0 – 2 cm 0 – 2 cm 0 – 5.66 ft 5.66 – 11.16 ft Pyrene mg/kg OC 1,000 1,400 240 200 160 J AET Total HPAH mg/kg OC 960 5,300 2,000 1,400 480 J AET Total LPAH mg/kg OC 370 780 120 J 280 J 140 AET Total PAH µg/kg dw nv nv 56,000 J 53,000 J 18,200 J 5,400
Phthalates Bis(2-ethylhexyl)phthalate mg/kg OC 47 78 20 32 150 AET
Polychlorinated biphenyls PCBs (total calc'd) mg/kg OC 12 65 35 46.4 78.4 AET
a Organic carbon normalization was not appropriate for this sample because TOC content <0.5%. Results are compared to LAET and 2LAET dry weight criteria in Table 5b.
dw – dry weight nv – no value; there is no SQS/SL or CSL/ML for this chemical OC – organic carbon HPAH – high-molecular-weight polycyclic aromatic hydrocarbon LPAH – low-molecular-weight polycyclic aromatic hydrocarbon PAH – polycyclic aromatic hydrocarbon SQS and CSL – sediment quality standard and cleanup screening level (WAC 173-204) SL and ML – screening level and maximum level (USACE et al. 2000) Concentration in bold indicates SQS/SL exceedance. Concentration in bold underline indicates CSL/ML exceedance. Data qualifiers: J – estimated concentration
Slip 27 Sediment Sampling Results East Waterway, Harbor Island Superfund Site October 18, 2007
Page 24
Table 5b. East Waterway Pier 27 (historical) core sample (comparison to LAET values)
ANALYTE UNIT LAET 2LAET V1-2
5.66 – 11.16 ft PAHs
Acenaphthene µg/kg dw 500 730 600 Acenaphthylene µg/kg dw 1,300 1,300 18 Anthracene µg/kg dw 960 4,400 420 Benzo(a)anthracene µg/kg dw 1,300 1,600 310 Benzo(a)pyrene µg/kg dw 1,600 3,000 130 Benzo(g,h,i)perylene µg/kg dw 670 720 48 Total benzofluoranthenes µg/kg dw 3,200 3,600 340 Chrysene µg/kg dw 1,400 2,800 370 Dibenzo(a,h)anthracene µg/kg dw 230 540 17 Dibenzofuran µg/kg dw 540 700 320 Fluoranthene µg/kg dw 1,700 2,500 1,200 Fluorene µg/kg dw 540 1,000 390 Indeno(1,2,3-cd)pyrene µg/kg dw 600 690 67 Naphthalene µg/kg dw 2,100 2,400 78 Phenanthrene µg/kg dw 1,500 5,400 510 Pyrene µg/kg dw 2,600 3,300 880 Total HPAH) µg/kg dw 12,000 17,000 3,400 Total LPAH µg/kg dw 5,200 13,000 2,020
Phthalates Bis(2-ethylhexyl)phthalate µg/kg dw 47 78 140
Polychlorinated biphenyls PCBs (total calc'd) µg/kg dw 12 65 380
dw – dry weight PAH – polycyclic aromatic hydrocarbon LAET – lowest apparent effects threshold, 2LAET – second lowest apparent effects threshold Concentration in bold indicates LAET exceedance. Concentration in bold underline indicates 2LAET exceedance.
Slip 27 Sediment Sampling Results East Waterway, Harbor Island Superfund Site October 18, 2007
Page 25
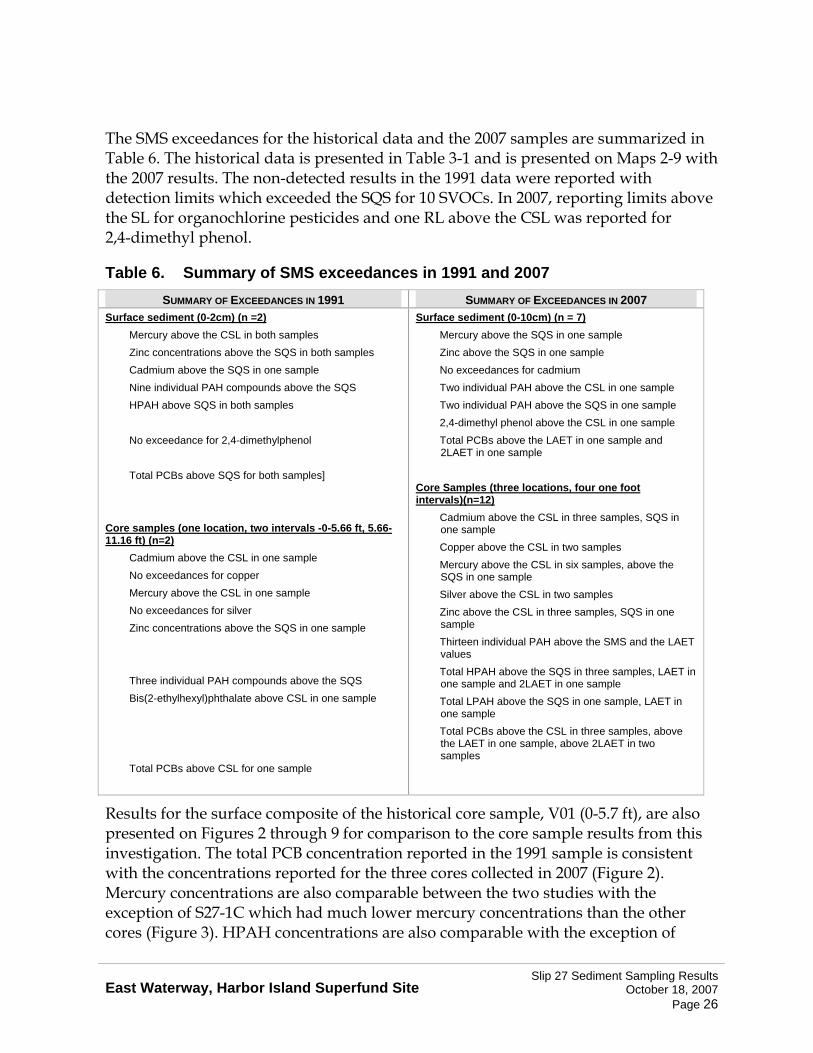
The SMS exceedances for the historical data and the 2007 samples are summarized in Table 6. The historical data is presented in Table 3-1 and is presented on Maps 2-9 with the 2007 results. The non-detected results in the 1991 data were reported with detection limits which exceeded the SQS for 10 SVOCs. In 2007, reporting limits above the SL for organochlorine pesticides and one RL above the CSL was reported for 2,4-dimethyl phenol.
Table 6. Summary of SMS exceedances in 1991 and 2007 SUMMARY OF EXCEEDANCES IN 1991 SUMMARY OF EXCEEDANCES IN 2007
Surface sediment (0-2cm) (n =2) Mercury above the CSL in both samples Zinc concentrations above the SQS in both samples Cadmium above the SQS in one sample Nine individual PAH compounds above the SQS HPAH above SQS in both samples
No exceedance for 2,4-dimethylphenol
Total PCBs above SQS for both samples]
Core samples (one location, two intervals -0-5.66 ft, 5.66-11.16 ft) (n=2)
Cadmium above the CSL in one sample No exceedances for copper Mercury above the CSL in one sample No exceedances for silver Zinc concentrations above the SQS in one sample
Three individual PAH compounds above the SQS Bis(2-ethylhexyl)phthalate above CSL in one sample
Total PCBs above CSL for one sample
Surface sediment (0-10cm) (n = 7) Mercury above the SQS in one sample Zinc above the SQS in one sample No exceedances for cadmium Two individual PAH above the CSL in one sample Two individual PAH above the SQS in one sample 2,4-dimethyl phenol above the CSL in one sample Total PCBs above the LAET in one sample and 2LAET in one sample
Core Samples (three locations, four one foot intervals)(n=12)
Cadmium above the CSL in three samples, SQS in one sample Copper above the CSL in two samples Mercury above the CSL in six samples, above the SQS in one sample Silver above the CSL in two samples Zinc above the CSL in three samples, SQS in one sample Thirteen individual PAH above the SMS and the LAET values Total HPAH above the SQS in three samples, LAET in one sample and 2LAET in one sample Total LPAH above the SQS in one sample, LAET in one sample Total PCBs above the CSL in three samples, above the LAET in one sample, above 2LAET in two samples
Results for the surface composite of the historical core sample, V01 (0-5.7 ft), are also presented on Figures 2 through 9 for comparison to the core sample results from this investigation. The total PCB concentration reported in the 1991 sample is consistent with the concentrations reported for the three cores collected in 2007 (Figure 2). Mercury concentrations are also comparable between the two studies with the exception of S27-1C which had much lower mercury concentrations than the other cores (Figure 3). HPAH concentrations are also comparable with the exception of
Slip 27 Sediment Sampling Results East Waterway, Harbor Island Superfund Site October 18, 2007
Page 26
4
S27-3C which had HPAH concentrations higher than the historical core and the two other cores collected in 2007 (Figure 4). BEHP concentration in V01 is consistent with the concentrations reported for S27-3C. Both of these cores had consistently higher concentrations than the concentrations in S27-1C and S27-2C (Figure 5). Cadmium, copper, silver, and zinc concentrations in the V01 composite are higher than the concentrations reported for S27-1C and similar to the concentrations reported for S27-2C. The maximum concentrations of these four metals were measured in the 2-3 ft sample from S27-3C.
In conclusion, the chemicals present in the sediments at concentrations above SMS are similar in the 2007 data set and the 1991 data set. In both studies, metals (cadmium, mercury and zinc), PAHs and PCBs were found to be present at concentrations above SMS values.
References
Blomberg G, Hotchkiss D, McGroddy SE. 2007. Memorandum dated May 3, 2007 to R. Sanga, EPA, regarding Slip 27 sediment sampling results. Port of Seattle and Windward Environmental LLC, Seattle, WA.
Plumb R, Jr. 1981. Procedures for handling and chemical analysis of sediment and water samples. Waterways Experiment Station, US Army Corps of Engineers, Vicksburg, MS.
PSEP. 1986. Recommended protocols for measuring conventional sediment variables in Puget Sound. Prepared for the Puget Sound Estuary Program. US Environmental Protection Agency, Region 10, Seattle, WA.
PSEP. 1997. Recommended guidelines for sampling marine sediment, water column, and tissue in Puget Sound. Final report. Prepared for the US Environmental Protection Agency, Seattle, WA. Puget Sound Water Quality Action Team, Olympia, WA.
Smolski EM, Lefkowitz LF, Thom RM, Word JQ. 1991. Port of Seattle Pier 27 report on field sampling, sediment chemistry, and biological analyses. Prepared for Port of Seattle. Battelle Marine Sciences Laboratory, Sequim, WA.
USACE, EPA, WDNR, Ecology. 2000. Dredged material evaluation and disposal procedures. A user's manual for the Puget Sound Dredged Disposal Analysis (PSDDA) Program. US Army Corps of Engineers, Seattle District, Seattle, WA; US Environmental Protection Agency, Region 10, Seattle, WA; Washington Department of Natural Resources; and Washington Department of Ecology.
Windward. 2007. Slip 27 sediment sampling plan. Windward Environmental LLC, Seattle, WA.
Slip 27 Sediment Sampling Results East Waterway, Harbor Island Superfund Site October 18, 2007
Page 27


![WATERWAY RISK ASSESSMENT WATERWAYS MANAGEMENT PLANNING TODAY TO BE READY FOR TOMORROW PAWSA [WATERWAY NAME]](https://static.fdocument.pub/doc/165x107/56649efb5503460f94c0d4ff/waterway-risk-assessment-waterways-management-planning-today-to-be-ready-for.jpg)