Disclaimer - s-space.snu.ac.krs-space.snu.ac.kr/bitstream/10371/124396/1/000000008381.pdf · 1.2....
50
저작자표시-비영리-변경금지 2.0 대한민국 이용자는 아래의 조건을 따르는 경우에 한하여 자유롭게 l 이 저작물을 복제, 배포, 전송, 전시, 공연 및 방송할 수 있습니다. 다음과 같은 조건을 따라야 합니다: l 귀하는, 이 저작물의 재이용이나 배포의 경우, 이 저작물에 적용된 이용허락조건 을 명확하게 나타내어야 합니다. l 저작권자로부터 별도의 허가를 받으면 이러한 조건들은 적용되지 않습니다. 저작권법에 따른 이용자의 권리는 위의 내용에 의하여 영향을 받지 않습니다. 이것은 이용허락규약 ( Legal Code) 을 이해하기 쉽게 요약한 것입니다. Disclaimer 저작자표시. 귀하는 원저작자를 표시하여야 합니다. 비영리. 귀하는 이 저작물을 영리 목적으로 이용할 수 없습니다. 변경금지. 귀하는 이 저작물을 개작, 변형 또는 가공할 수 없습니다.
Transcript of Disclaimer - s-space.snu.ac.krs-space.snu.ac.kr/bitstream/10371/124396/1/000000008381.pdf · 1.2....
저 시-비 리- 경 지 2.0 한민
는 아래 조건 르는 경 에 한하여 게
l 저 물 복제, 포, 전송, 전시, 공연 송할 수 습니다.
다 과 같 조건 라야 합니다:
l 하는, 저 물 나 포 경 , 저 물에 적 된 허락조건 명확하게 나타내어야 합니다.
l 저 터 허가를 면 러한 조건들 적 되지 않습니다.
저 에 른 리는 내 에 하여 향 지 않습니다.
것 허락규약(Legal Code) 해하 쉽게 약한 것 니다.
Disclaimer
저 시. 하는 원저 를 시하여야 합니다.
비 리. 하는 저 물 리 목적 할 수 없습니다.
경 지. 하는 저 물 개 , 형 또는 가공할 수 없습니다.
경 사 논
The effect of buyer-supplier
performance metrics alignment on
supply chain performance
구매자-생산자 과 지표 연계
공 사슬 과 상 계에 연구
2013년 2 월
울 원
경 과 생산 리 공
원

The effect of buyer-supplier
performance metrics alignment on
supply chain performance
지도 수 박 상 욱
이 논 경 사 논 출함
2012 년 12 월
울 원
경 과 생산 리 공
원
원 경 사 논 인 함
2012 년 12 월
원 장 수 욱 (인)
부 원장 양 (인)
원 박 상 욱 (인)
i
Abstract
The effect of buyer-supplier performance metrics alignment on
supply chain performance
Moon Won Chung
Operations Management
The Graduate School
Seoul National University
As business performance metrics grow more and more complicated,
developing a guideline to select and eliminate performance indices is now
becoming an important process. Based on the belief that there is a right supply
chain strategy and performance management system for a certain product, this
study focuses on developing a strategy guideline by aligning strategy with
environmental uncertainties and supplying partners. Adopting the framework
proposed by Lee (2002), and the methodology by Szu et al. (2009), we add
the supplier aspect to the model and evaluate the effectiveness of alignment in
the whole supply chain level. Survey data on KPI management was collected
from 134 Korean/Chinese manufacturing firms, and profile deviation
approach was implemented.
Results show stronger positive effect on firm’s overall performance when a
supply chain achieves higher degree of alignment between both environment
uncertainties and its suppliers. This emphasizes the need for cooperation and
collaboration between supply chain partners, and provides empirical evidence
to Lee’s framework. Also, the effectiveness of current KPI PMS is confirmed.
Keywords : Performance Measurement, Alignment, Supply chain
Strategy, Environmental Uncertainty
Student Number : 2011-20562

ii
Table of Contents 1. Introduction ........................................................................................ 1
2. Literature Review............................................................................... 4 2.1. Performance metrics ................................................................................ 4
2.2. Supply chain Strategies ........................................................................ 8 2.3. Alignment .......................................................................................... 11
3. Research Method .............................................................................. 14
3.1. Research model .................................................................................. 14
3.2. Sample and data collection ................................................................. 16 3.3. Measurement ...................................................................................... 18 3.4. Reliability and Validity of constructs .................................................. 18
4. Discussion ......................................................................................... 22
4.1. Data Analysis and Results .................................................................. 22 4.2. Results ............................................................................................... 23
5. Conclusion ........................................................................................ 26
5.1. Implications ....................................................................................... 26 5.2. Research Limitations ............................................................................. 27
References ............................................................................................ 28
Appendix .............................................................................................. 31 국 ............................................................................................... 45
List of Tables [Table 1] .................................................................................................. 7 [Table 2] .................................................................................................. 8 [Table 3] .................................................................................................11 [Table 4] ................................................................................................ 17 [Table 5] ................................................................................................ 29 [Table 6] ................................................................................................ 20 [Table 7] ................................................................................................ 24
List of Figures [Figure 1] .............................................................................................. 14
1
1. Introduction
There have been numerous approaches in evaluating the performance of
a supply chain throughout the history. An accurate evaluation framework is
becoming more and more critical since firms nowadays compete on the
efficiency of supply chains rather than competing with individual capabilities.
(Calantone and Dröge, 2006) Scholars recently indicate that the emphasis on
supply chain management has shifted from factory level management to
enterprise level management. (A. Gunasekaran, 2001)
Clearly, performance measurement is essential given the following
reasons for performance management by (Gunasekaran and Kobu, 2007).
l Identify success
l Identify if customer needs are met
l Better Understanding of the process
l Identifying bottlenecks, waste, problems and improvement
opportunities
l Providing factual decisions
l Enabling progress
l Tracking progress
l Facilitating a more open and transparent communication and
co-operation
Some even put performance measurement as ‘vital in strategy
formulation and communication and informing diagnostic control
2
mechanisms by measuring actual results’ (Wouters, 2009).
However, precise performance measurement is a difficult task due to the
mix of qualitative elements and quantitative elements. Recent performance
measurement system attempts to implement these qualitative measurements
within the measurement framework. Such metrics include Quality, Flexibility,
Visibility, Trust, and innovativeness. (Chan, 2003)
Although there are attempts trying to identify the latent factors that affect
supply chain performance, existing frameworks are still facing constant
criticism. The main reasons stated by (Craig Shepherd, 2006) are,
l Lack of connection with strategy
l Focus on cost to the detriment of non-cost indicators
l Lack of a balanced approach
l Insufficient focus on customers and competitors
l Loss of supply chain context, thus encouraging sub optimization
l Lack of system thinking
But as the definition and conceptual boundaries of supply chain
management grows, performance measurement faces a yet challenging issue
in terms of integration and alignment. Such integration efforts take place in
the four major processes of strategy integration, organizational integration,
logistics integration, and information technology integration. (Sangwook
Park, 2007) An integrative measurement system is a physical/technical
requirement in strategy integration. This paper focuses on identifying the
alignment factor in supply chain performance measurement. And by using
3
actual quantitative performance metrics, we could derive the actual
effectiveness of current performance management efforts in supply chains.
And we could also provide some empirical evidence to previous measurement
and alignment frameworks.
In the following sections of this paper, we identify the concept of
alignment through previous literatures. Second, we discuss the methodology
of the research. And finally, the analysis and findings will be presented.
4
Literature Review
1.1. Performance Metrics
Previous literatures have identified many performance measurement
metrics. It is now rather a problem of selection than invention. Due to the
development of Business intelligence, managers are facing more and more
information day after day. The number of KPI’s and corporate data are being
accumulated faster than ever, and failure to attend to critical signs, wasting
time and resources on improving unimportant measures could lead to
devastating results.
It is then important to maintain an effective performance management
system. (Beamon, 1999) previously indicated the conditions for an effective
performance measurement system.
l Inclusiveness (measurement of all pertinent aspects)
l Universality (allow for comparison under various operating
conditions)
l Measurability (data required are measurable)
l Consistency (measures consistent with organization goals)
Although there are a number of conceptual frameworks on how to
measure supply chain performance, we still lack empirical analysis and case
studies on performance metrics and measurement in supply chains. (A.
5
Gunasekaran, 2001) In order to address various supply chain performance
metrics, we take a categorical approach. Many academics tried to categorize
the measures to make it easy to study the large number of existing measures.
(Neely et al., 1995) presented a category set including quality, time,
flexibility, and cost. This category was also mentioned by Beamon (1999) for
its usefulness in systems analysis. Another category was presented by
(Stewart, 1995). Measurements are categorized by process flows such as plan,
source, make/assemble, and deliver/customer. This category is also now the
widely used framework in the Supply Chain Operations Reference model
(SCOR) developed by the Supply Chain Council (SCC). Neely et al. (1995)
also identifies a number of performance measurement frameworks. These
frameworks include the balanced scorecard (Kaplan and Norton, 1992)
(Brewer and Speh, 2000). The balanced scorecard approach is now widely
used to measure a firm’s overall performance. The measure consists of four
main categories; Customer perspective, internal business perspective,
innovation and learning perspective, and financial perspective. This research
also uses the balanced scorecard metrics in order to measure overall firm
performance.
Although there is a need for a new framework that consider factors such
as measurement systems implementation (Bourne et al., 2000, Bourne et al.,
2002), forces that drive change to the existing framework (Kennerley and
Neely, 2002); (Waggoner et al., 1999) and dynamic factors that keeps the
framework in alignment with strategy and constantly changing business
circumstances (Kennerley and Neely, 2003); (Bourne et al., 2002). However,
6
most of the remaining performance measurement systems utilized by
companies still maintains a static performance management system, and by
focusing on the objective of measurement, Neely’s categories still provide
significant explanation in studying measures. Recent performance
measurement frameworks incorporate qualitative measurements such as
Visibility, Trust, Innovativeness which have significant impact on
performance, but is also impossible to measure and track as a daily process.
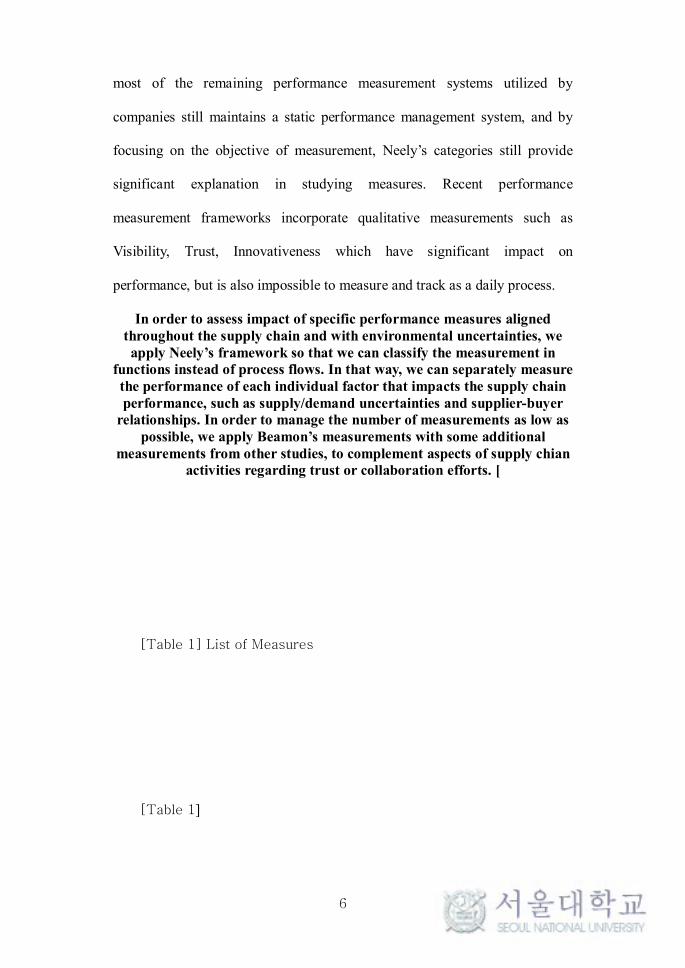
In order to assess impact of specific performance measures aligned throughout the supply chain and with environmental uncertainties, we apply Neely’s framework so that we can classify the measurement in
functions instead of process flows. In that way, we can separately measure the performance of each individual factor that impacts the supply chain performance, such as supply/demand uncertainties and supplier-buyer
relationships. In order to manage the number of measurements as low as possible, we apply Beamon’s measurements with some additional
measurements from other studies, to complement aspects of supply chian activities regarding trust or collaboration efforts. [
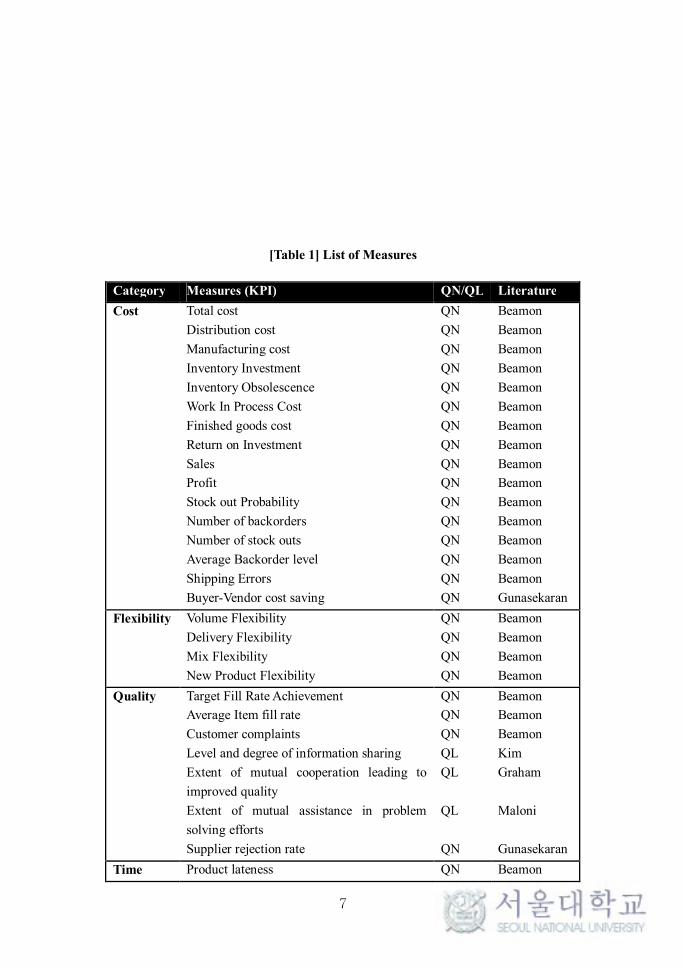
[Table 1] List of Measures
[Table 1]
7
[Table 1] List of Measures
Category Measures (KPI) QN/QL Literature
Cost Total cost
Distribution cost
Manufacturing cost
Inventory Investment
Inventory Obsolescence
Work In Process Cost
Finished goods cost
Return on Investment
Sales
Profit
Stock out Probability
Number of backorders
Number of stock outs
Average Backorder level
Shipping Errors
Buyer-Vendor cost saving
QN
QN
QN
QN
QN
QN
QN
QN
QN
QN
QN
QN
QN
QN
QN
QN
Beamon
Beamon
Beamon
Beamon
Beamon
Beamon
Beamon
Beamon
Beamon
Beamon
Beamon
Beamon
Beamon
Beamon
Beamon
Gunasekaran
Flexibility Volume Flexibility
Delivery Flexibility
Mix Flexibility
New Product Flexibility
QN
QN
QN
QN
Beamon
Beamon
Beamon
Beamon
Quality Target Fill Rate Achievement
Average Item fill rate
Customer complaints
Level and degree of information sharing
Extent of mutual cooperation leading to
improved quality
Extent of mutual assistance in problem
solving efforts
Supplier rejection rate
QN
QN
QN
QL
QL
QL
QN
Beamon
Beamon
Beamon
Kim
Graham
Maloni
Gunasekaran
Time Product lateness QN Beamon
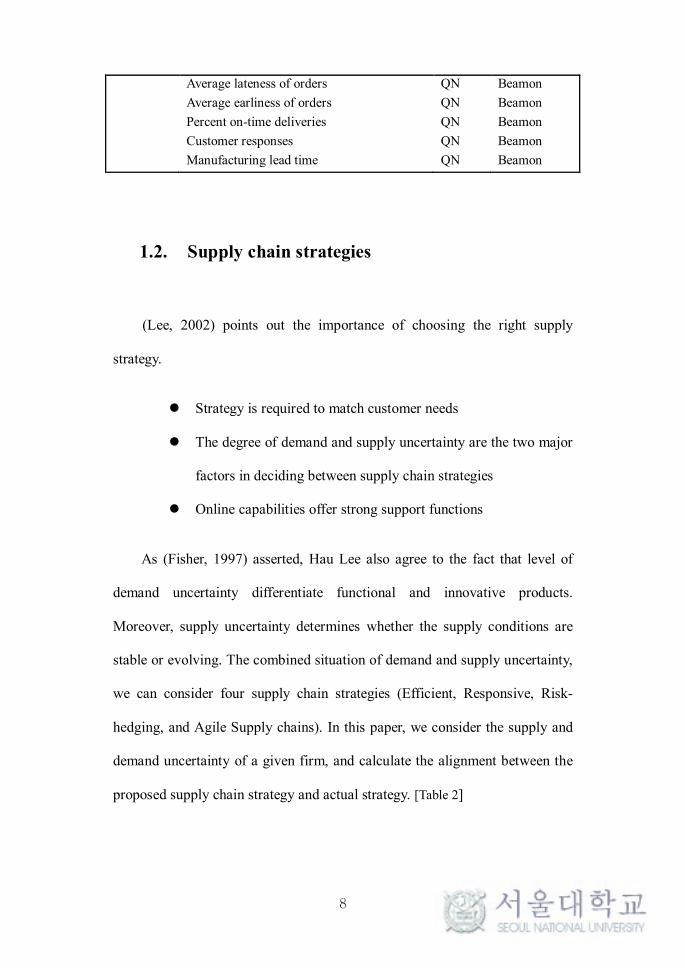
8
Average lateness of orders
Average earliness of orders
Percent on-time deliveries
Customer responses
Manufacturing lead time
QN
QN
QN
QN
QN
Beamon
Beamon
Beamon
Beamon
Beamon
1.2. Supply chain strategies
(Lee, 2002) points out the importance of choosing the right supply
strategy.
l Strategy is required to match customer needs
l The degree of demand and supply uncertainty are the two major
factors in deciding between supply chain strategies
l Online capabilities offer strong support functions
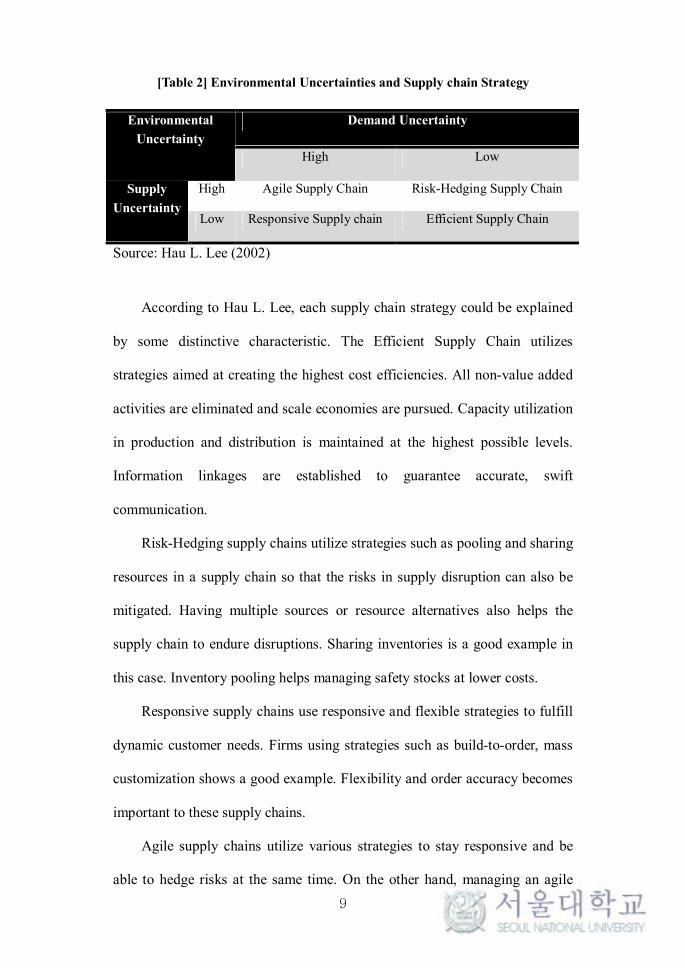
As (Fisher, 1997) asserted, Hau Lee also agree to the fact that level of
demand uncertainty differentiate functional and innovative products.
Moreover, supply uncertainty determines whether the supply conditions are
stable or evolving. The combined situation of demand and supply uncertainty,
we can consider four supply chain strategies (Efficient, Responsive, Risk-
hedging, and Agile Supply chains). In this paper, we consider the supply and
demand uncertainty of a given firm, and calculate the alignment between the
proposed supply chain strategy and actual strategy. [Table 2]
9
[Table 2] Environmental Uncertainties and Supply chain Strategy
Environmental
Uncertainty
Demand Uncertainty
High Low
Supply
Uncertainty
High Agile Supply Chain Risk-Hedging Supply Chain
Low Responsive Supply chain Efficient Supply Chain
Source: Hau L. Lee (2002)
According to Hau L. Lee, each supply chain strategy could be explained
by some distinctive characteristic. The Efficient Supply Chain utilizes
strategies aimed at creating the highest cost efficiencies. All non-value added
activities are eliminated and scale economies are pursued. Capacity utilization
in production and distribution is maintained at the highest possible levels.
Information linkages are established to guarantee accurate, swift
communication.
Risk-Hedging supply chains utilize strategies such as pooling and sharing
resources in a supply chain so that the risks in supply disruption can also be
mitigated. Having multiple sources or resource alternatives also helps the
supply chain to endure disruptions. Sharing inventories is a good example in
this case. Inventory pooling helps managing safety stocks at lower costs.
Responsive supply chains use responsive and flexible strategies to fulfill
dynamic customer needs. Firms using strategies such as build-to-order, mass
customization shows a good example. Flexibility and order accuracy becomes
important to these supply chains.
Agile supply chains utilize various strategies to stay responsive and be
able to hedge risks at the same time. On the other hand, managing an agile
10
supply chain could also be costly.
As we aim in this research, in order to calculate the alignment of
organization strategy with environmental uncertainties, developing an ideal
supply chain strategy profile would be essential. Although Hau L. Lee
proposed a conceptual framework for the four supply chain strategy, there are
not much of prior studies that attempt to clarify the profile for each supply
chain strategy. However previous study from (Markham T. Frohlich, 2001)
proposes three types of players named as Maketeers, Caretakers, and
Innovators. By studying their characteristics, we could perhaps infer profiles
for the four supply chain strategies. A recent study by (Szu-Yuan Sun, 2009)
made an exemplar case for the four supply chain strategies by making such an
inference.
The concept of efficient supply chains are quite identical to caretakers
studied in previous literature (Markham T. Frohlich, 2001); (Miller and Roth,
1994); (Wang et al., 2007). Emphasis is on performances such as cost
efficiency and speed.
Responsive supply chains tend to focus on flexibility, quality, and time.
Their profile matches the Marketeers from previous studies. Considering the
cost, these firms are said to be capable of managing cost through
manufacturing and/or logistics postponement to control inventory levels (Pagh
and Cooper, 1998).
Risk hedging Supply chains have to manage multiple supply bases in
order to share and pool resources. Such efforts will be costly. And given the
unstable supply and predictable demand, these firms will also be handling
11
functional products focusing on quality. However their speed performance
will not match that of the efficient supply chain.
Finally, agile supply chain will be characterized as an all rounded player.
Their focus is similar to the Innovators for previous studies. By managing all
aspects at high levels, we could assume that cost performance will be
sacrificed.
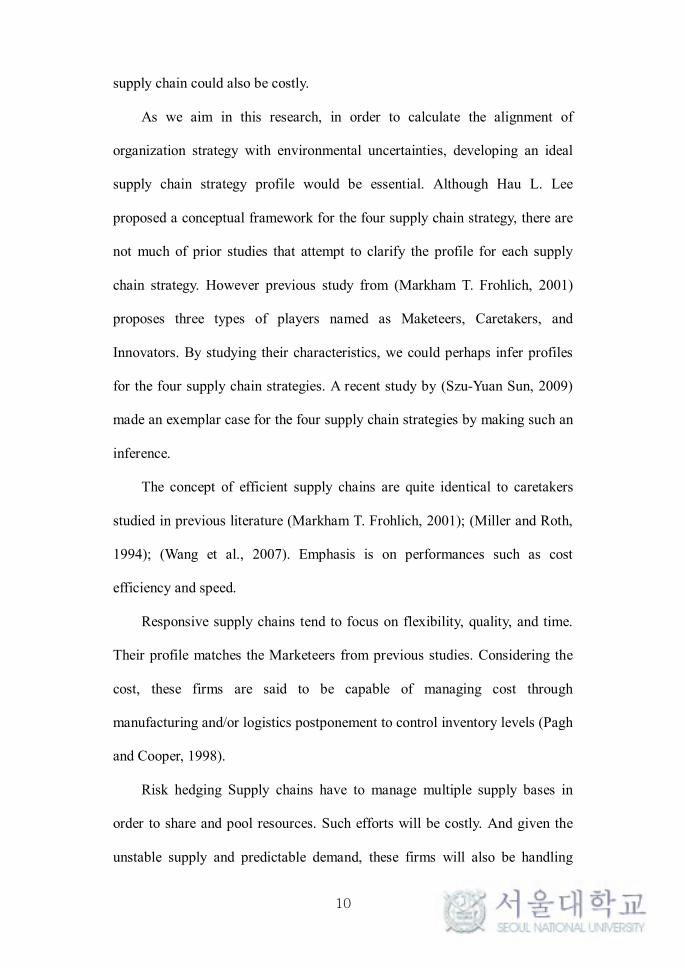
A brief summary is displayed in [Table 3]. Each characteristic will be the
guideline for deriving the alignment index later on.
[Table 3] Supply chain Strategy Profiles
Measures Efficient Responsive Risk-Hedging Agile
Cost High Med Med Low
Flexibility Low High Low High
Quality High High High High
Time High High Med High
Source: Szu-Yuan Sun et al. (2009)
1.3. Alignment
The key to managing performance metrics is to have them well aligned
with the firm or supply chain’s strategy. The concept of alignment and its
benefits were researched for many years. (Venkatraman, 1989) classified the
concepts and methodologies of previous studies about fit and alignment into 6
groups. The groups differ in how fit is defined. Fit is defined as Moderation,
Mediation, Matching, Gestalt, Profile Deviation, and Covariation. The
12
perspective of seeing fit as a deviation from a profile best expresses the
circumstance we are trying to illustrate through this research. Previous studies
from (Van de Ven and Drazin, 1984) also takes on this perspective. The degree
of adherence to a specified profile has significant effect on performance. The
calculation of deviation is made by measuring the Euclidean distance in an N-
dimensional space MDS. This methodology is adopted when multiple
variables more than two are concerned in the model.
These six groups are regrouped into three broader categories of
congruence, contingency, and holistic configuration. Congruence free of
specification criterion studies fit as the relationship between independent pair
of variables. Contingency anchored by specific criterions shows the
intervention of variables between the predictor and criterion. And fit as
holistic configuration has a predefined system specification, and shows the
gestalt or profile deviation characterizing holistic patterns of inter
dependencies simultaneously subjected to multiple contingencies. (Umanath,
2003)
The importance of alignment has been emphasized by researchers.
Successful integration and alignment in the supply chain leads to competitive
prices at the required time and space. (Harland et al., 2006) Total integration
of performance measurements is not an easy task. This requires a
comprehensive understanding on all related variables. (Theodore P. Stank,
2001) Studies by (Stock et al., 2000) confirmed the positive impact of
enterprise logistics and supply chain structure alignment on organizational
performance. And the importance of alignment between strategic, operational

13
variables and environment was emphasized by (Stonebraker and Liao, 2006).
Alongside with the conceptual framework by Hau Lee, (Paulraj and Chen,
2007) also pointed out that environmental uncertainty takes a crucial role in
implementation of strategic supply management.
The study by Szu-Yuan sun et al.,(2009), which is also the key reference
of this research followed the analytical expressions of profile deviation and
treated alignment as holistic configuration type of fit in order to examine the
impacts of the alignment between SC strategies and environmental
uncertainties on SCM performance. However their research is only limited in
calculating the distance between environmental uncertainties and SC
strategies of a single focal firm. In this study, we take a step further by
including the supplier of the focal firm, and calculate the alignment between
the focal firm and its supplier to find out the importance of alignment within
the whole supply chain.
14
2. Research Method
2.1. Research Model
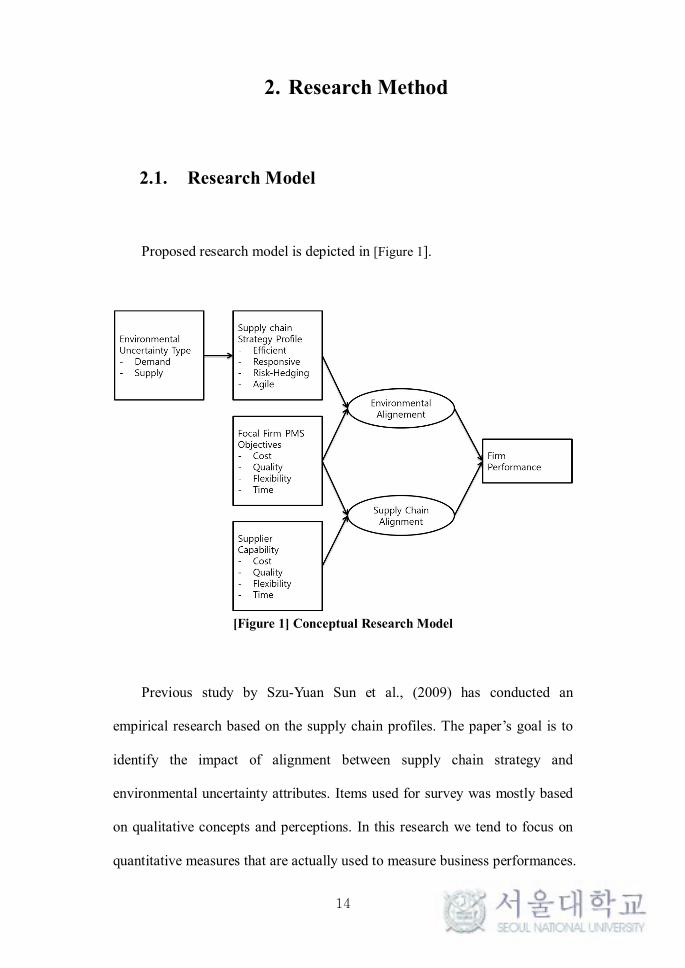
Proposed research model is depicted in [Figure 1].
[Figure 1] Conceptual Research Model
Previous study by Szu-Yuan Sun et al., (2009) has conducted an
empirical research based on the supply chain profiles. The paper’s goal is to
identify the impact of alignment between supply chain strategy and
environmental uncertainty attributes. Items used for survey was mostly based
on qualitative concepts and perceptions. In this research we tend to focus on
quantitative measures that are actually used to measure business performances.
15
Also shown in the framework figure, this study is differentiated by another
aspect named as supply chain alignment. In addition to the original
environmental alignment construct, to ensure full alignment within the whole
supply chain, the alignment between the buyer and supplier will be measured
and its effects will be evaluated.
Once the environmental uncertainty is clarified, a single supply chain
strategy will be assigned to each case following the profile discussed earlier.
Each case will be evaluated be the alignment level between the environment
uncertainty and the buyer firm’s supply chain strategy. Next, the supplier
firm’s alignment will be evaluated with the given buyer firm’s supply chain
strategy. All evaluations will be performed at performance metrics level.
Several authors have highlighted the importance of this alignment (Fisher,
1997); (Lee, 2002); (Miller, 1993); (Venkatraman and Prescott, 2006). Such
research indicates that the alignment between environmental uncertainty and
supply chain strategy is critical to business performance. Based on these
findings we propose the following hypotheses.
H1. Supply Chain Performance will be higher when supply chain
strategy of the buyer firm is well aligned with environmental
uncertainty.
H2. Supply chain Performance will be even higher when supply chain
strategies are well aligned between the buyer and supplier firm in
addition to environment alignment.
16
2.2. Sample and Data Collection
Online Survey Questionnaires were used to collect data. A total of 115
questions were asked to each respondent and average response time was 20
minutes. The questionnaire was distributed to manufacturing firms in Korea
and China. To have the samples reflect the population, the survey was sent to
all possible contacts. Contact information was extracted from commercial
research firm databases and MBA students at Seoul National University. A
total of 1,000 surveys were sent, and 161 samples were collected. (16.1%)
Among the final samples, 27 samples were eliminated due to
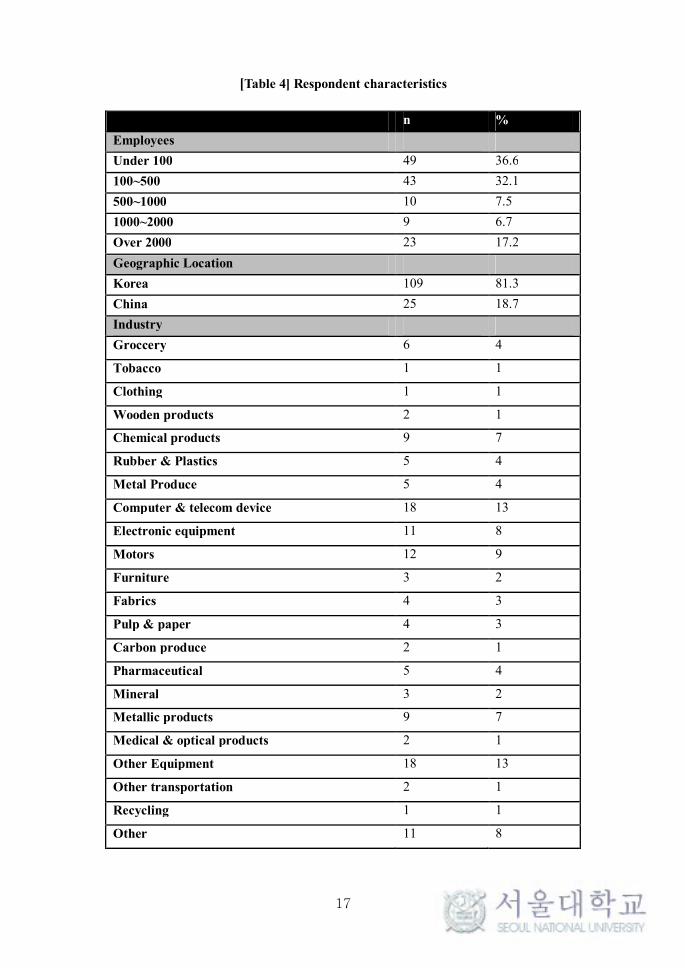
incomplete/inaccuracy of the information. Details of the respondent
characteristics are available in [Table 4].
The survey is consisted of four main parts. The first part was to identify
the environmental uncertainty of the respondent. The second part of the
survey measures the strategic importance of each performance measure of the
buyer firm. The third part asks the respondent of strategic importance of each
performance metric when evaluating supplier performance. The final section
measures the supply chain performance of the buyer firm and overall
efficiency of the supply chain.
17
[Table 4] Respondent characteristics
n %
Employees
Under 100 49 36.6
100~500 43 32.1
500~1000 10 7.5
1000~2000 9 6.7
Over 2000 23 17.2
Geographic Location
Korea 109 81.3
China 25 18.7
Industry
Groccery 6 4
Tobacco 1 1
Clothing 1 1
Wooden products 2 1
Chemical products 9 7
Rubber & Plastics 5 4
Metal Produce 5 4
Computer & telecom device 18 13
Electronic equipment 11 8
Motors 12 9
Furniture 3 2
Fabrics 4 3
Pulp & paper 4 3
Carbon produce 2 1
Pharmaceutical 5 4
Mineral 3 2
Metallic products 9 7
Medical & optical products 2 1
Other Equipment 18 13
Other transportation 2 1
Recycling 1 1
Other 11 8
18
2.3. Measurement
Scales for measurement on each survey construct were adopted from
previous literatures to ensure content validity. Measurement items for supply
and demand uncertainty were adopted from researches by (Premkumar et al.,
2003).
And since various performance items were used to measure the
performance of buyer and supplier firms, we use the balanced score card
items to measure overall firm performance. Items for the supply chain
balanced score card were adopted from the paper by Brewer and Speh (2000).
Each questionnaire items were measured by using a 7-point Likert scale
labeled as 1=strongly disagree (not important) ~ 7=strongly agree (very
important). Questionnaire was offered to the respondents in Korean and
Chinese respectively. And a pretest of the questionnaire was carried out by 2
SCM experts to ensure content validity and reliability.
2.4. Reliability and Validity of Construct
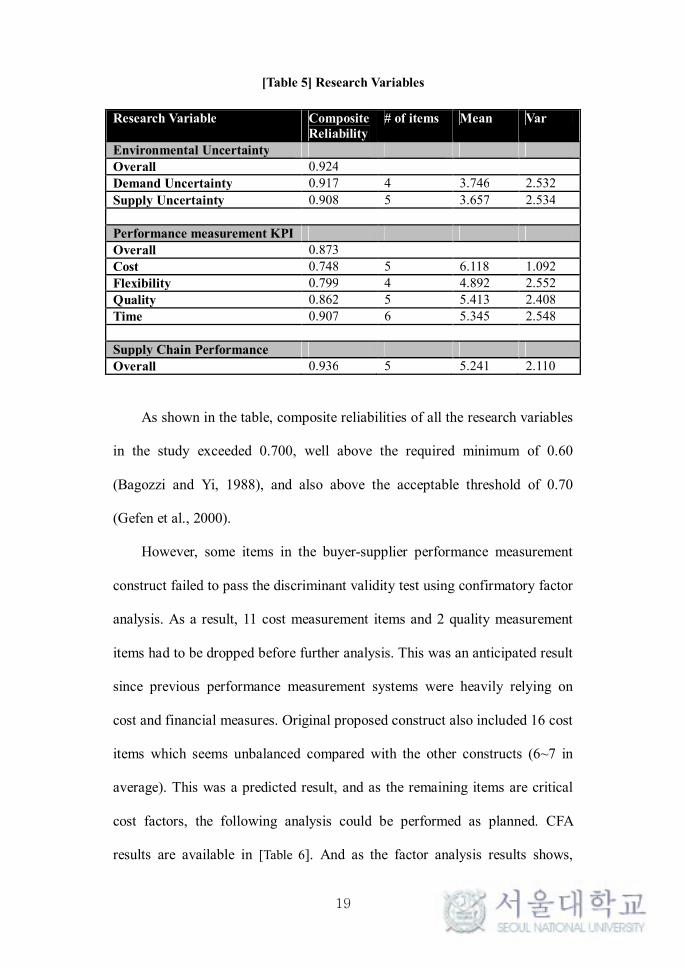
A Cronbach’s alpha test was performed along with confirmatory factor
analysis to test the reliability and validity of measurement items and
constructs. Test results and descriptive statistics are available in [Table 5].
19
[Table 5] Research Variables
Research Variable Composite Reliability
# of items Mean Var
Environmental Uncertainty
Overall 0.924
Demand Uncertainty 0.917 4 3.746 2.532
Supply Uncertainty 0.908 5 3.657 2.534
Performance measurement KPI
Overall 0.873
Cost 0.748 5 6.118 1.092
Flexibility 0.799 4 4.892 2.552
Quality 0.862 5 5.413 2.408
Time 0.907 6 5.345 2.548
Supply Chain Performance
Overall 0.936 5 5.241 2.110
As shown in the table, composite reliabilities of all the research variables
in the study exceeded 0.700, well above the required minimum of 0.60
(Bagozzi and Yi, 1988), and also above the acceptable threshold of 0.70
(Gefen et al., 2000).
However, some items in the buyer-supplier performance measurement
construct failed to pass the discriminant validity test using confirmatory factor
analysis. As a result, 11 cost measurement items and 2 quality measurement
items had to be dropped before further analysis. This was an anticipated result
since previous performance measurement systems were heavily relying on
cost and financial measures. Original proposed construct also included 16 cost
items which seems unbalanced compared with the other constructs (6~7 in
average). This was a predicted result, and as the remaining items are critical
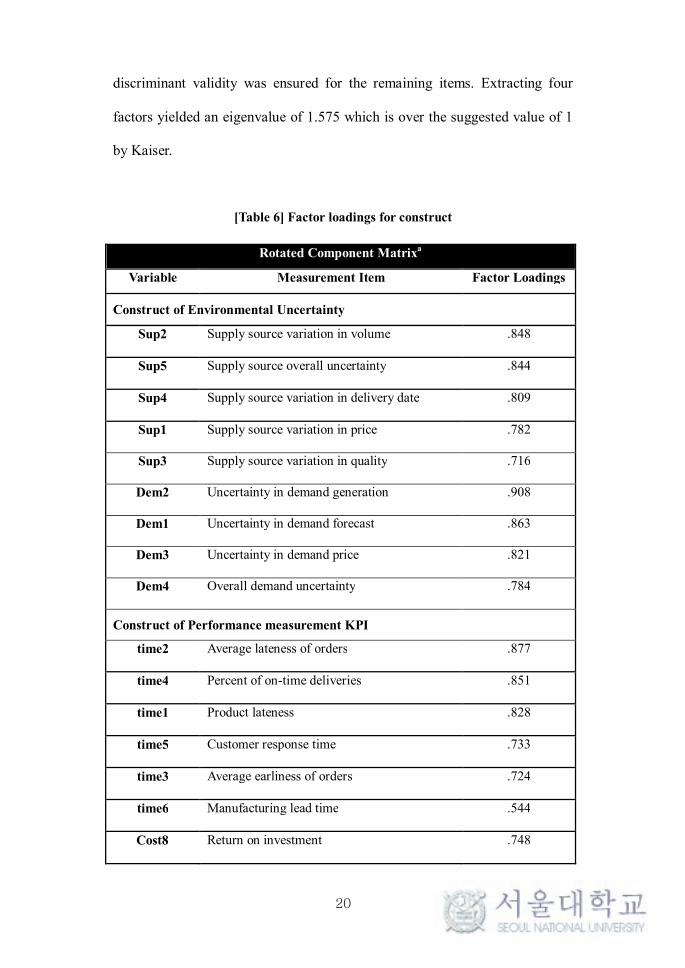
cost factors, the following analysis could be performed as planned. CFA
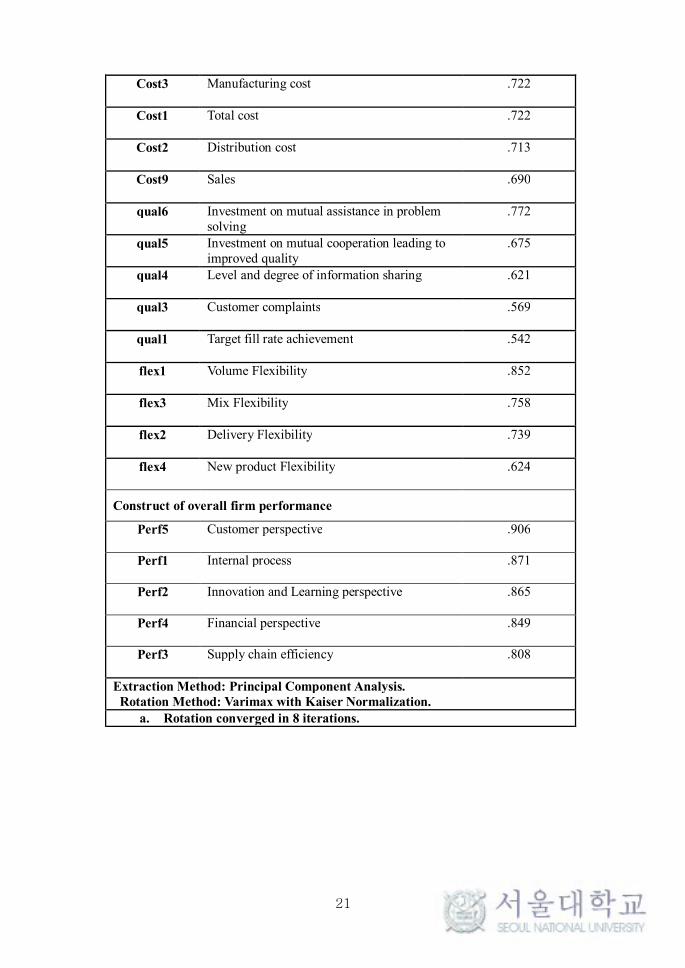
results are available in [Table 6]. And as the factor analysis results shows,
20
discriminant validity was ensured for the remaining items. Extracting four
factors yielded an eigenvalue of 1.575 which is over the suggested value of 1
by Kaiser.
[Table 6] Factor loadings for construct
Rotated Component Matrixa
Variable Measurement Item Factor Loadings
Construct of Environmental Uncertainty
Sup2 Supply source variation in volume .848
Sup5 Supply source overall uncertainty .844
Sup4 Supply source variation in delivery date .809
Sup1 Supply source variation in price .782
Sup3 Supply source variation in quality .716
Dem2 Uncertainty in demand generation .908
Dem1 Uncertainty in demand forecast .863
Dem3 Uncertainty in demand price .821
Dem4 Overall demand uncertainty .784
Construct of Performance measurement KPI
time2 Average lateness of orders .877
time4 Percent of on-time deliveries .851
time1 Product lateness .828
time5 Customer response time .733
time3 Average earliness of orders .724
time6 Manufacturing lead time .544
Cost8 Return on investment .748
21
Cost3 Manufacturing cost .722
Cost1 Total cost .722
Cost2 Distribution cost .713
Cost9 Sales .690
qual6 Investment on mutual assistance in problem solving
.772
qual5 Investment on mutual cooperation leading to improved quality
.675
qual4 Level and degree of information sharing .621
qual3 Customer complaints .569
qual1 Target fill rate achievement .542
flex1 Volume Flexibility .852
flex3 Mix Flexibility .758
flex2 Delivery Flexibility .739
flex4 New product Flexibility .624
Construct of overall firm performance
Perf5 Customer perspective .906
Perf1 Internal process .871
Perf2 Innovation and Learning perspective .865
Perf4 Financial perspective .849
Perf3 Supply chain efficiency .808
Extraction Method: Principal Component Analysis. Rotation Method: Varimax with Kaiser Normalization.
a. Rotation converged in 8 iterations.

22
3. Discussion
3.1. Data Analysis and results
In order to derive the alignment index, first, each response cases are
classified into one of the four uncertainty profiles by calculating the total
sample mean of supply and demand uncertainty. Each case is classified into
their respective environment and thus, assigned to an ideal supply chain
strategy.
For the next step, performance scores are transformed into standard
scores in order to calculate the distance between each case and the ideal
supply chain strategy.
For the third step, ideal supply chain strategies were assigned to target
values for each measurement construct. As discussed earlier, each supply
chain strategies were profiled in terms of the level of each performance metric
in terms of High-Med-Low. The target values are assigned as 1=High, 0=Med,
-1=Low. Then the Euclidian distance between the standardized scores and
target values are calculated.
Distance = −
Where, X is the standardized score for jth construct, and I is the target
value for jth construct. The distance would mean the deviation from the target
profile, and small distance values would mean high alignment with
environmental uncertainty and focal firm’s supply chain performance
23
management efforts.
The supply chain alignment index is also calculated in a similar way.
Instead of subtracting the Ideal value of a supply chain strategy, standardized
score of buyer firm is subtracted from the standardized score of the supplier
firm. Also this distance would mean the supplier’s deviation from the buying
firm’s strategic goals, and small distance could be interpreted as higher degree
of alignment between the two firms.
3.2. Results
Result from the classification is as follows. The analysis identified 48
HD/HS, 24 HD/LS, 22 LD/LS, and 40 LD/HS environmental uncertainty
firms. Agile, Responsive, Efficient, Risk-hedging supply chain strategies were
assigned to each segments respectively.
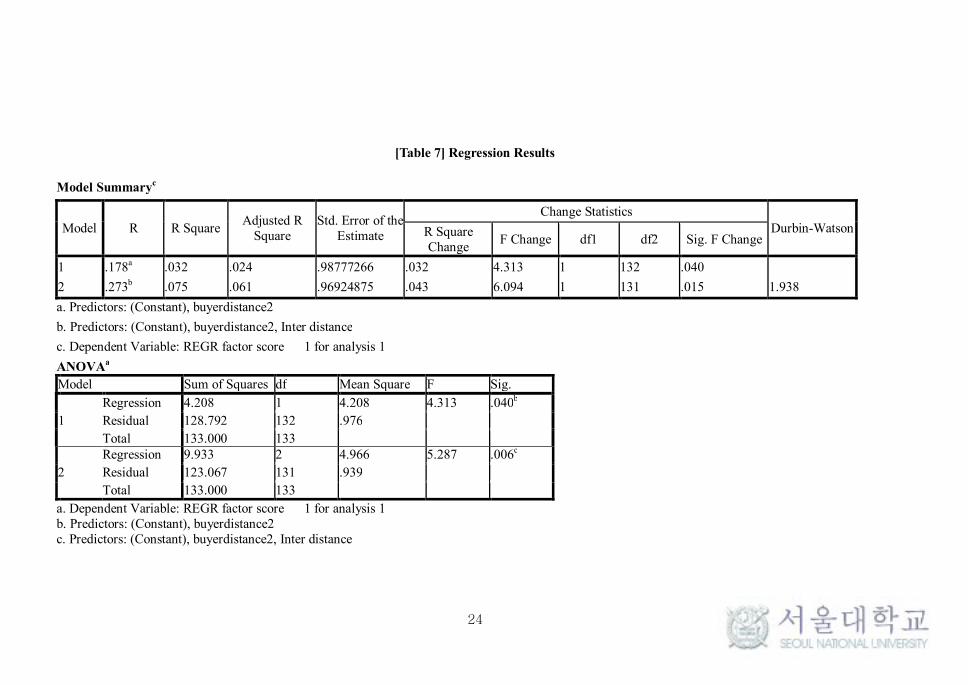
In order to test the hypothesis, a simple stepwise linear regression test
was performed. The first regression was performed with only having buyer
alignment as the predictor, and the second model included the supply chain
alignment as another predictor. Regression results for the first model showed
significant fit (p<.05). And also, the results showed significant (p<.05)
changes in R square values (0.024->0.061) and F statistics (4.313->6.094) by
adding supply chain alignment. Overall fit of the regression model also
increased, thus supporting both hypotheses. Results of the regression analysis
are provided in [Table ].
24
[Table 7] Regression Results
Model Summaryc
Model R R Square Adjusted R
Square Std. Error of the
Estimate
Change Statistics Durbin-Watson R Square
Change F Change df1 df2 Sig. F Change
1 .178a .032 .024 .98777266 .032 4.313 1 132 .040
2 .273b .075 .061 .96924875 .043 6.094 1 131 .015 1.938
a. Predictors: (Constant), buyerdistance2
b. Predictors: (Constant), buyerdistance2, Inter distance
c. Dependent Variable: REGR factor score 1 for analysis 1
ANOVAa
Model Sum of Squares df Mean Square F Sig.
1
Regression 4.208 1 4.208 4.313 .040b
Residual 128.792 132 .976
Total 133.000 133
2
Regression 9.933 2 4.966 5.287 .006c
Residual 123.067 131 .939
Total 133.000 133
a. Dependent Variable: REGR factor score 1 for analysis 1 b. Predictors: (Constant), buyerdistance2 c. Predictors: (Constant), buyerdistance2, Inter distance

25
Correlations
REGR factor score 1 for analysis 1
buyerdistance2 Inter distance
Pearson Correlation
REGR factor score 1 for analysis 1 1.000 -.178 -.087
buyerdistance2 -.178 1.000 -.513
Inter distance -.087 -.513 1.000
Sig. (1-tailed) REGR factor score 1 for analysis 1 . .020 .159 buyerdistance2 .020 . .000 Inter distance .159 .000 .
N
REGR factor score 1 for analysis 1 134 134 134
buyerdistance2 134 134 134
Inter distance 134 134 134
Coefficientsa
Model Unstandardized Coefficients
Standardized Coefficients
t Sig. 95.0% Confidence Interval for B
Correlations Collinearity Statistics
B Std. Error Beta Lower Bound Upper Bound Zero-order Partial Part Tolerance VIF
1(Constant) -.270 .155 -1.736 .085 -.577 .038
buyerdistance2 -.168 .081 -.178 -2.077 .040 -.327 -.008 -.178 -.178 -.178 1.000 1.000
2
(Constant) -.221 .154 -1.434 .154 -.525 .084
buyerdistance2 -.285 .092 -.302 -3.083 .002 -.467 -.102 -.178 -.260 -.259 .737 1.357
Inter distance -.198 .080 -.242 -2.469 .015 -.356 -.039 -.087 -.211 -.207 .737 1.357
a. Dependent Variable: REGR factor score 1 for analysis 1
26
4. Conclusion
4.1. Implications
This study contributes to research for the following reasons. First, this
study provides further empirical evidence for environmental uncertainty and
supply chain strategy alignment. Hau Lee’s framework is supported by the
findings in this study. Second, the findings in this paper agrees and supports
the profiling of the four supply chain strategies proposed by Szu-Yuan Sun et
al. (2009). However instead of just following the framework, we identified
important aspects of supply chain strategy alignment. It is the fact that supply
chain alignment should be incorporated though out the entire supply chain
instead of just a single entity. Third, by using actual quantitative measures, we
could evaluate the effectiveness of current measures applied by companies.
Fourth, compared with the SCOR framework which only compares the supply
chain strategy with supply chain performance, we can conclude that there can
be a preferable supply chain strategy given the uncertain environment. And
that the importance of buyer-supplier alignment and cooperation is never
emphasized too much.
For practitioners, this research provides guidelines on evaluating their
own business and set a corresponding supply chain strategy. Identifying the
core performance attributes would enable a more goal driven and effective
supply chain management. Simple imitations of competitors would not seem
27
as attractive as before. And the importance of supplier cooperation and
collaboration is elevated.
4.2. Research Limitations
The research results showed several limitations as well. First of all, since
the survey was taken only by the buyer firm, performance evaluation of
suppliers has a possibility to be biased. And although the construct was
considering actual quantitative measures, acquiring real performance data is
highly difficult.
Second, ideal values for the target supply chain strategy requires further
research since the current method cannot fully reflect the weights between
measurement constructs. The SCOR model uses market research data and
calculates the industry average for top performing firms. Other studies use
various methods such as AHP, Fuzzy models in order to derive priorities
between performance measures. There is still no consensus regarding this
issue and comparing the outcomes of each method would be a promising field
of future research.
Third, there remains some obscurity in current profiling of the four
supply chain strategies using KPIs. Supply uncertainty is not yielding much
distinguishable characteristics at this point. This makes grey areas in the
profiling when it comes to set ideal performance targets for agile, responsive
strategies. Re-categorizing current performance measures, or defining new
performance attributes could perhaps shed some light on this issue.
28
References
A. GUNASEKARAN, C. P., E. TIRTIROGLU 2001. Performance measures and metrics in a supply chain environment. International Journal of Operations & Production Management, 21, 17.
BAGOZZI, R. P. & YI, Y. 1988. On the evaluation of structural equation models. Journal of the academy of marketing science, 16, 74-94.
BEAMON, B. M. 1999. Measuring supply chain performance. International Journal of Operations & Production Management, 19, 275-292.
BOURNE, M., MILLS, J., WILCOX, M., NEELY, A. & PLATTS, K. 2000. Designing, implementing and updating performance measurement systems. International Journal of Operations & Production Management, 20, 754-771.
BOURNE, M., NEELY, A., PLATTS, K. & MILLS, J. 2002. The success and failure of performance measurement initiatives: perceptions of participating managers. International journal of operations & production management, 22, 1288-1310.
BREWER, P. C. & SPEH, T. W. 2000. Using the balanced scorecard to measure supply chain performance. Journal of Business logistics, 21, 75-94.
CALANTONE, R. & DR GE, C. 2006. Supply chain flexibility: an empirical study. Journal of Supply Chain Management, 35, 16-24.
CHAN, F. T. S. 2003. Performance measurement in a supply chain. The International Journal of Advanced manufacturing technology, 21, 15.
CRAIG SHEPHERD, H. G. 2006. Measuring supply chain performance: current research and future directions. International Journal of Productivity and Performance Management, 55, 17.
FISHER, M. L. 1997. What is the right supply chain for your product? Harvard business review, 75, 105-117.
GEFEN, D., STRAUB, D. W. & BOUDREAU, M. C. 2000. Structural equation modeling and regression: Guidelines for research practice. Communication of the Association for Information Systems, 4, 1-77.
GUNASEKARAN, A. & KOBU, B. 2007. Performance measures and metrics in logistics and supply chain management: a review of recent literature (1995–2004) for research and applications. International Journal of Production Research, 45, 2819-2840.
HARLAND, C. M., LAMMING, R. C., ZHENG, J. & JOHNSEN, T. E. 2006. A taxonomy of supply networks. Journal of Supply Chain Management, 37, 21-27.
29
KAPLAN, R. S. & NORTON, D. P. 1992. The balanced scorecard–measures that drive performance. Harvard business review, 70, 71-79.
KENNERLEY, M. & NEELY, A. 2002. A framework of the factors affecting the evolution of performance measurement systems. International journal of operations & production management, 22, 1222-1245.
KENNERLEY, M. & NEELY, A. 2003. Measuring performance in a changing business environment. International Journal of Operations & Production Management, 23, 213-229.
LEE, H. L. 2002. Aligning Supply Chain Strategies with Product Uncertainties. California Management Review, 44, 16.
MARKHAM T. FROHLICH, J. R. D. 2001. A Taxonomy of manufacturing strategies revisited. Journal of operations management, 19, 18.
MILLER, J. G. & ROTH, A. V. 1994. A taxonomy of manufacturing strategies. Management Science, 40, 285-304.
NEELY, A., GREGORY, M. & PLATTS, K. 1995. Performance measurement system design: a literature review and research agenda. International Journal of Operations & Production Management, 15, 80-116.
PAGH, J. D. & COOPER, M. C. 1998. Supply chain postponement and speculation strategies: how to choose the right strategy. Journal of business logistics, 19, 13-34.
PAULRAJ, A. & CHEN, I. J. 2007. Environmental uncertainty and strategic supply management: a resource dependence perspective and performance implications. Journal of Supply Chain Management, 43, 29-42.
PREMKUMAR, G., RAMAMURTHY, K. & SAUNDERS, C. S. 2003. Information processing view of organizations: an exploratory examination of fit in the context of interorganizational relationships. Journal of Management Information Systems, 22, 257-294.
SANGWOOK PARK, S. K. 2007. The Establishment of SC Integration Architecture. Journal of Korea Productivity Association, 18, 28.
STEWART, G. 1995. Supply chain performance benchmarking study reveals keys to supply chain excellence. Logistics Information Management, 8, 38-44.
STOCK, G. N., GREIS, N. P. & KASARDA, J. D. 2000. Enterprise logistics and supply chain structure: the role of fit. Journal of Operations Management, 18, 531-547.
STONEBRAKER, P. W. & LIAO, J. 2006. Supply chain integration: exploring product and environmental contingencies. Supply Chain Management: An International Journal, 11, 34-43.
30
SZU-YUAN SUN, M.-H. H., WEN-JIN HWANG 2009. The impact of alignment between supply chain strategy and environmental uncertainty on SCM performance. Supply Chain Management: An International Journal, 14, 12.
THEODORE P. STANK, S. B. K., DAVID J. CLOSS 2001. Performance Benefits of Supply Chain Logistical Integration. Transportation Journal, 16.
UMANATH, N. S. 2003. The concept of contingency beyond “It depends”: illustrations from IS research stream. Information & Management, 40, 551-562.
VAN DE VEN, A. H. & DRAZIN, R. 1984. The Concept of Fit in Contingency Theory. Research in Organizational Behavior, 7, 333-365.
VENKATRAMAN, N. 1989. The concept of fit in strategy research: Toward verbal and statistical correspondence. Academy of management review, 423-444.
VENKATRAMAN, N. & PRESCOTT, J. E. 2006. Environment‐strategy coalignment: An empirical test of its performance implications. Strategic Management Journal, 11, 1-23.
WAGGONER, D. B., NEELY, A. D. & P KENNERLEY, M. 1999. The forces that shape organisational performance measurement systems:: An interdisciplinary review. International journal of production economics, 60, 53-60.
WANG, J. W., HUANG, C. C. & CHEN, Y. J. The impact of alignment between supply chain strategy and IS strategy on SCM performance. Conference of the International Decision Sciences Institute (DSI), CD-Format, Bangkok, July, 2007. 11-15.
WOUTERS, M. 2009. A developmental approach to performance measures—Results from a longitudinal case study. European Management Journal, 27, 64-78.

31
Appendix
공급사슬망에서 공급자-구매자 성과측정 지표의 연계
효과에 관한 연구 설문지
안 내 문
안녕하십니까?
설문에 응해주신 귀하께 진심으로 감사드립니다. 본 설문조사는
서울대학교 경영대학원 생산관리 연구실에서 작성되었으며, 귀사는 본
설문조사를 위해 국내 기업 중에서 본 연구를 위해 몇 가지 기준에 의해
특별히 엄선되었음을 알려드립니다. 업무에 여러모로 바쁘시겠지만,
우리나라의 경영학 발전에 도움을 주신다는 마음으로 설문에 응해
주신다면 대단히 감사하겠습니다.
조사목적
본 설문지는 공급사와 구매사의 핵심 제품의 수요/공급 불확실성 특성을
반영한 공급사슬 성과측정 지표의 연계를 통해 이루어지는 전략, 조직,
물류, 정보기술 통합이 공급사슬 성과에 미치는 영향을 분석하기 위해
작성되었습니다. 본 연구는 기업의 공급사슬 경쟁력을 진단하고 기업간
역량을 비교하기 위한 자료로 활용할 수 있는 공급사슬의 통합도 지표를
산출하는데 그 목적이 있습니다.
조사내용
본 설문에는 정답이 정해져 있는 것이 아니며, 각 질문에 대해 주어진
안내를 주의 깊게 읽으신 후 평소 사내에서 하시는 그대로 응답해주시면
연구에 큰 도움이 될 것입니다. 본 설문조사는 총 112 개의 단순 체크
문항으로 구성되어 있으며 완료 예상시간은 15~20 분입니다. 모든 문항은
7 점 척도로 구성되어 있으며 귀사 핵심제품의 시장 특성, 핵심 성과
지표에 대한 귀사의 인식, 공급망 통합을 위한 귀사의 노력에 대한 질문,
지표간 상대적 중요성 평가 파트로 구성되어있습니다.
32
비밀유지 서약
귀하께서 응답하신 내용은 순수한 연구목적으로만 사용되며 이 외의 다른
어떠한 용도로도 절대 사용되지 않는다는 것을 약속 드립니다. 또한
응답자는 모두 익명으로 처리되며 어떠한 경우에도 비밀이 철저히 보장될
것임을 약속드립니다.
연구에 대한 문의사항
혹시 본 조사와 관련하여 의문점이 있으시면 아래의 연락처로 언제든지
문의해주시면 답해 드리도록 하겠습니다. 협조해 주신 점 다시 한번 감사
드립니다.
귀사의 무궁한 발전을 기원합니다.
서울대학교 경영대학 교 수 박 상 욱 ([email protected])
서울대학교 경영대학 석사과정 정 문 원 ([email protected])

33
질문그룹 1 : 기업 정보
1. 본 설문조사는 제조기업의 자재 구매/조달 담당 실무자를 대상으로
진행됩니다. 귀사가 제조업체가 아니거나, 자재 구매/조달 담당 실무자가
아닌 경우 아래의 “아니오”를 체크하시고 설문조사를 종료하여주시기
바랍니다. 위의 설문조사에 관한 안내를 모두 읽고, 이해하였으며, 본
설문조사에 참여하겠습니다.
○예 (1) ○아니오 (2)
2. 귀사의 법정 유형에 해당하는 곳에 표시해주시기 바랍니다.
○대기업 (1)
○중기업 (2)
○소기업 (3)
○해당 없음 (4)
3. 귀사의 명칭을 적어주시기 바랍니다.
4. 귀사의 설립 연도를 적어주시기 바랍니다.
5. 귀사의 현재 종업원 수는 총 몇명입니까?
6. 귀사의 작년도 총 매출액을 적어주시기 바랍니다.

34
7. 귀사의 주 업종은 무엇입니까? 아래의 목록에서 선택하여 동그라미에
체크해 주시기 바랍니다.
○식료품 제조업(음료와
담배제조업 제외) (1)
○담배 제조업 (2)
○의복, 의복 악세사리 및
모피제품 제조업 (3)
○목재 및 나무제품 제조업(가구
제외) (4)
○인쇄 및 기록매체 복제업 (5)
○화학물질 및 화학제품
제조업(의약품 제외) (6)
○고무제품 및 플라스틱제품
제조업 (7)
○1 차 금속 제조업 (8)
○전자부품,컴퓨터,영상,음향/통신
장비 제조업 (9)
○전기장비 제조업 (10)
○자동차 및 트레일러 제조업
(11)
○가구 제조업 (12)
○음료 제조업 (13)
○섬유제품 제조업(의복 제외)
(14)
○가죽, 가방 및 신발 제조업
(15)
○펄프, 종이 및 종이제품
제조업 (16)
○코크스, 연탄 및 석유 정제품
제조업 (17)
○의료용 물질 및 의약품 제조업
(18)
○비금속 광물제품 제조업 (19)
○금속가공제품 제조업(기계 및
가구 제외) (20)
○의료, 정밀, 광학기기 및 시계
제조업 (21)
○기타 기계 및 장비 제조업 (22)
○기타 운송장비 제조업 (23)
○폐기물 수집운반, 처리 및
원료재생업 (24)
○해당 없음(직접 기입) (25)
8. 위에 해당사항이 없는 경우, 귀사의 주 업종을 직접 기입하여 주시기
바랍니다.
35
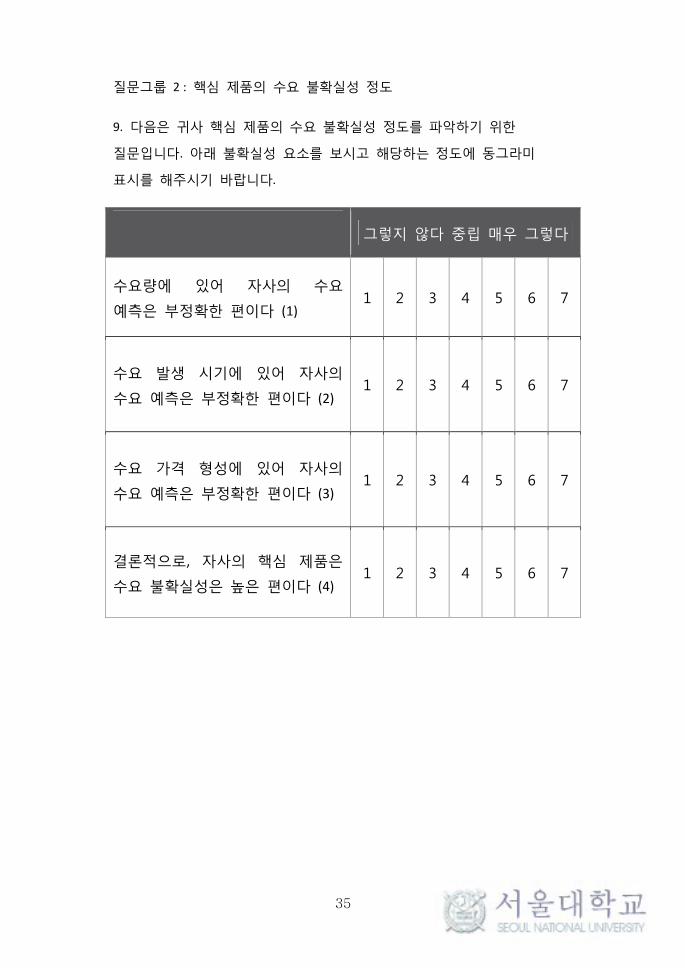
질문그룹 2 : 핵심 제품의 수요 불확실성 정도
9. 다음은 귀사 핵심 제품의 수요 불확실성 정도를 파악하기 위한
질문입니다. 아래 불확실성 요소를 보시고 해당하는 정도에 동그라미
표시를 해주시기 바랍니다.
그렇지 않다 중립 매우 그렇다
수요량에 있어 자사의 수요
예측은 부정확한 편이다 (1) 1 2 3 4 5 6 7
수요 발생 시기에 있어 자사의
수요 예측은 부정확한 편이다 (2) 1 2 3 4 5 6 7
수요 가격 형성에 있어 자사의
수요 예측은 부정확한 편이다 (3) 1 2 3 4 5 6 7
결론적으로, 자사의 핵심 제품은
수요 불확실성은 높은 편이다 (4) 1 2 3 4 5 6 7
36
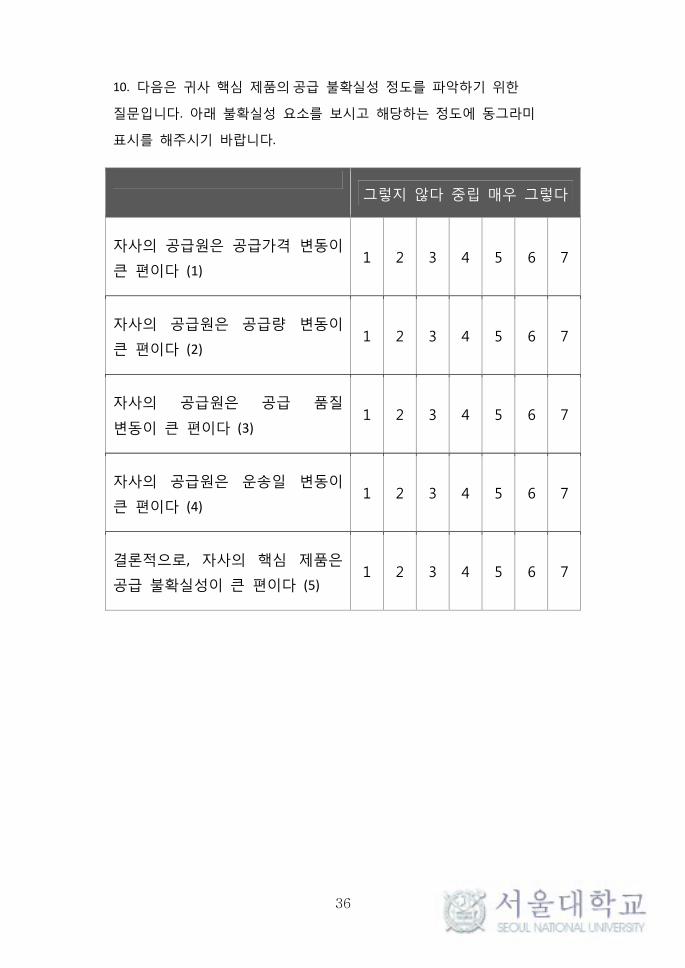
10. 다음은 귀사 핵심 제품의 공급 불확실성 정도를 파악하기 위한
질문입니다. 아래 불확실성 요소를 보시고 해당하는 정도에 동그라미
표시를 해주시기 바랍니다.
그렇지 않다 중립 매우 그렇다
자사의 공급원은 공급가격 변동이
큰 편이다 (1) 1 2 3 4 5 6 7
자사의 공급원은 공급량 변동이
큰 편이다 (2) 1 2 3 4 5 6 7
자사의 공급원은 공급 품질
변동이 큰 편이다 (3) 1 2 3 4 5 6 7
자사의 공급원은 운송일 변동이
큰 편이다 (4) 1 2 3 4 5 6 7
결론적으로, 자사의 핵심 제품은
공급 불확실성이 큰 편이다 (5) 1 2 3 4 5 6 7
37
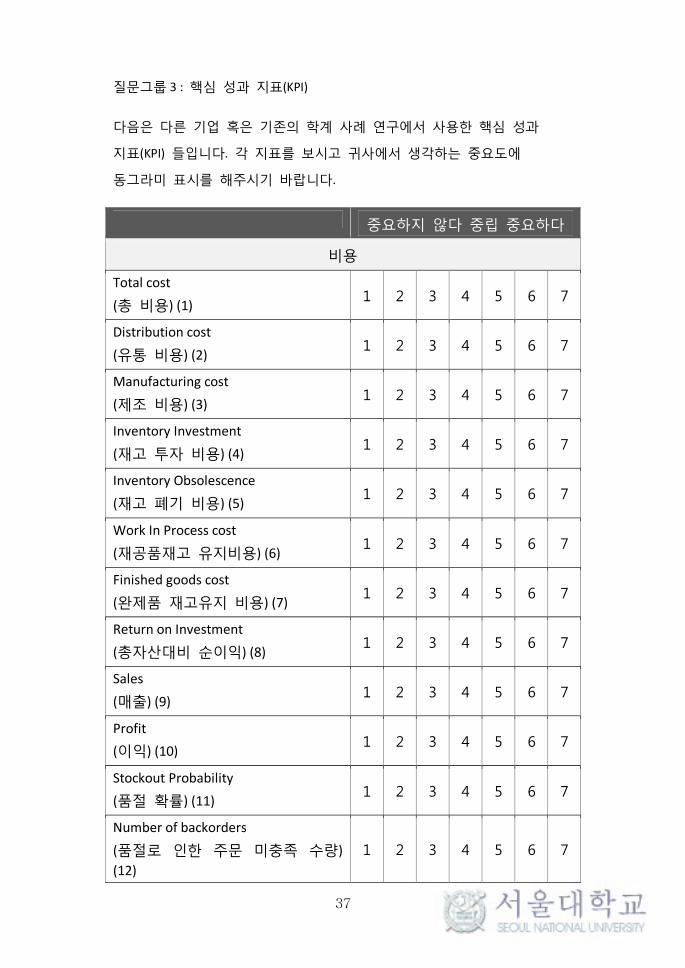
질문그룹 3 : 핵심 성과 지표(KPI)
다음은 다른 기업 혹은 기존의 학계 사례 연구에서 사용한 핵심 성과
지표(KPI) 들입니다. 각 지표를 보시고 귀사에서 생각하는 중요도에
동그라미 표시를 해주시기 바랍니다.
중요하지 않다 중립 중요하다
비용
Total cost
(총 비용) (1) 1 2 3 4 5 6 7
Distribution cost
(유통 비용) (2) 1 2 3 4 5 6 7
Manufacturing cost
(제조 비용) (3) 1 2 3 4 5 6 7
Inventory Investment
(재고 투자 비용) (4) 1 2 3 4 5 6 7
Inventory Obsolescence
(재고 폐기 비용) (5) 1 2 3 4 5 6 7
Work In Process cost
(재공품재고 유지비용) (6) 1 2 3 4 5 6 7
Finished goods cost
(완제품 재고유지 비용) (7) 1 2 3 4 5 6 7
Return on Investment
(총자산대비 순이익) (8) 1 2 3 4 5 6 7
Sales
(매출) (9) 1 2 3 4 5 6 7
Profit
(이익) (10) 1 2 3 4 5 6 7
Stockout Probability
(품절 확률) (11) 1 2 3 4 5 6 7
Number of backorders
(품절로 인한 주문 미충족 수량)
(12)
1 2 3 4 5 6 7

38
Number of stockouts
(품절 횟수) (13) 1 2 3 4 5 6 7
Average Backorder level
(평균 제품별 주문 미충족 수량)
(14)
1 2 3 4 5 6 7
Shipping errors
(선적 오류 횟수) (15) 1 2 3 4 5 6 7
Buyer-Vendor cost saving initiatives
(구매자-공급자 공동 비용
절감노력) (16)
1 2 3 4 5 6 7
중요하지 않다 중립 중요하다
유연성
Volume flexibility
(제조 수량 유연성) (17) 1 2 3 4 5 6 7
Delivery flexibility
(운송 계획 유연성) (18) 1 2 3 4 5 6 7
Mix flexibility
(제조 제품 종류 유연성) (19) 1 2 3 4 5 6 7
New Product flexibility
(신제품 개발/출시 속도) (20) 1 2 3 4 5 6 7
품질
Target fill rate Achievement
(목표 주문충족율 달성도) (21) 1 2 3 4 5 6 7
Average item fill rate
(평균 제품별 주문 충족율) (22) 1 2 3 4 5 6 7
Customer complaints
(고객 불만 접수 건수) (23) 1 2 3 4 5 6 7
Level and degree of information sharing
(정보 공유 수준) (24) 1 2 3 4 5 6 7
Extent of mutual cooperation leading
to improved quality(품질 향상을 1 2 3 4 5 6 7

39
위한 공동 협업) (25)
Extent of mutual assistance in
problem solving efforts(문제 해결을
위한 공동 지원 노력) (26)
1 2 3 4 5 6 7
Supplier rejection rate
(공급자 납품 거부율) (27) 1 2 3 4 5 6 7
시간
Product lateness
(제품 지연 납품) (28) 1 2 3 4 5 6 7
Average lateness of orders
(평균 주문별 지연 납품) (29) 1 2 3 4 5 6 7
Average earliness of orders
(평균 주문별 조기 납품) (30) 1 2 3 4 5 6 7
Percent on-time deliveries
(정시 납품 비율) (31) 1 2 3 4 5 6 7
Customer response time
(고객 주문 충족 시간) (32) 1 2 3 4 5 6 7
Manufacturing lead time
(제품 제조 시간) (33) 1 2 3 4 5 6 7

40
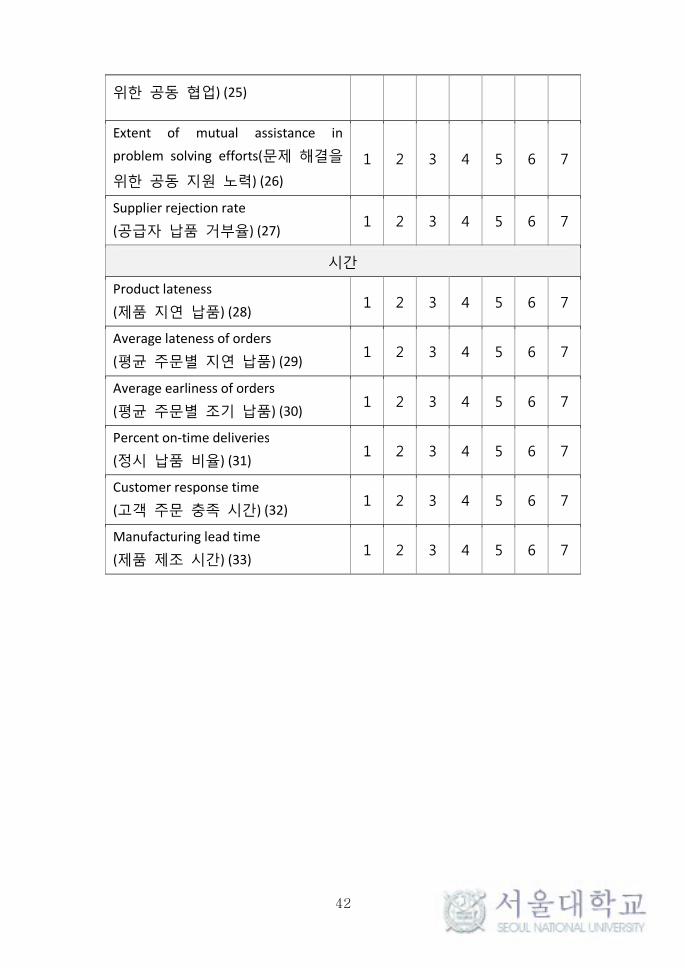
질문그룹 4 : 핵심 원자재 공급자를 선정하는데 있어 각 지표가 고려되는
정도
다음의 성과지표들을 보시고, 핵심 원자재 공급자를 선정하는데 있어 각
지표가 고려되는 정도에 동그라미로 표시하여 주시기 바랍니다.
중요하지 않다 중립 중요하다
비용
Total cost
(총 비용) (1) 1 2 3 4 5 6 7
Distribution cost
(유통 비용) (2) 1 2 3 4 5 6 7
Manufacturing cost
(제조 비용) (3) 1 2 3 4 5 6 7
Inventory Investment
(재고 투자 비용) (4) 1 2 3 4 5 6 7
Inventory Obsolescence
(재고 폐기 비용) (5) 1 2 3 4 5 6 7
Work In Process cost
(재공품재고 유지비용) (6) 1 2 3 4 5 6 7
Finished goods cost
(완제품 재고유지 비용) (7) 1 2 3 4 5 6 7
Return on Investment
(총자산대비 순이익) (8) 1 2 3 4 5 6 7
Sales
(매출) (9) 1 2 3 4 5 6 7
Profit
(이익) (10) 1 2 3 4 5 6 7
Stockout Probability
(품절 확률) (11) 1 2 3 4 5 6 7
Number of backorders
(품절로 인한 주문 미충족 수량)
(12)
1 2 3 4 5 6 7

41
Number of stockouts
(품절 횟수) (13) 1 2 3 4 5 6 7
Average Backorder level
(평균 제품별 주문 미충족 수량)
(14)
1 2 3 4 5 6 7
Shipping errors
(선적 오류 횟수) (15) 1 2 3 4 5 6 7
Buyer-Vendor cost saving initiatives
(구매자-공급자 공동 비용
절감노력) (16)
1 2 3 4 5 6 7
중요하지 않다 중립 중요하다
유연성
Volume flexibility
(제조 수량 유연성) (17) 1 2 3 4 5 6 7
Delivery flexibility
(운송 계획 유연성) (18) 1 2 3 4 5 6 7
Mix flexibility
(제조 제품 종류 유연성) (19) 1 2 3 4 5 6 7
New Product flexibility
(신제품 개발/출시 속도) (20) 1 2 3 4 5 6 7
품질
Target fill rate Achievement
(목표 주문충족율 달성도) (21) 1 2 3 4 5 6 7
Average item fill rate
(평균 제품별 주문 충족율) (22) 1 2 3 4 5 6 7
Customer complaints
(고객 불만 접수 건수) (23) 1 2 3 4 5 6 7
Level and degree of information sharing
(정보 공유 수준) (24) 1 2 3 4 5 6 7
Extent of mutual cooperation leading
to improved quality(품질 향상을 1 2 3 4 5 6 7
42
위한 공동 협업) (25)
Extent of mutual assistance in
problem solving efforts(문제 해결을
위한 공동 지원 노력) (26)
1 2 3 4 5 6 7
Supplier rejection rate
(공급자 납품 거부율) (27) 1 2 3 4 5 6 7
시간
Product lateness
(제품 지연 납품) (28) 1 2 3 4 5 6 7
Average lateness of orders
(평균 주문별 지연 납품) (29) 1 2 3 4 5 6 7
Average earliness of orders
(평균 주문별 조기 납품) (30) 1 2 3 4 5 6 7
Percent on-time deliveries
(정시 납품 비율) (31) 1 2 3 4 5 6 7
Customer response time
(고객 주문 충족 시간) (32) 1 2 3 4 5 6 7
Manufacturing lead time
(제품 제조 시간) (33) 1 2 3 4 5 6 7
43
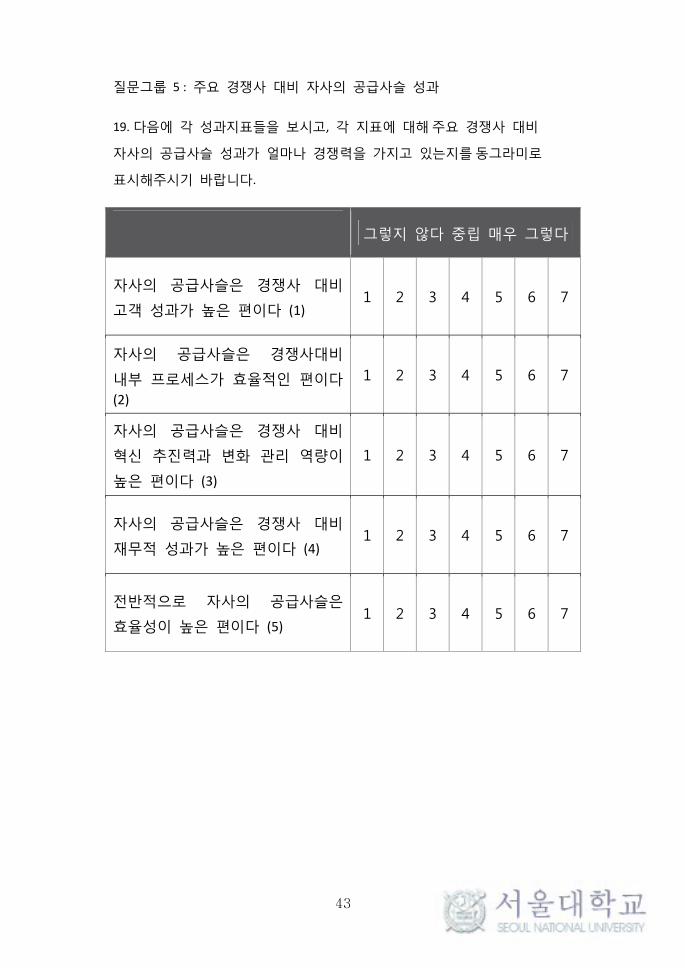
질문그룹 5 : 주요 경쟁사 대비 자사의 공급사슬 성과
19. 다음에 각 성과지표들을 보시고, 각 지표에 대해 주요 경쟁사 대비
자사의 공급사슬 성과가 얼마나 경쟁력을 가지고 있는지를 동그라미로
표시해주시기 바랍니다.
그렇지 않다 중립 매우 그렇다
자사의 공급사슬은 경쟁사 대비
고객 성과가 높은 편이다 (1) 1 2 3 4 5 6 7
자사의 공급사슬은 경쟁사대비
내부 프로세스가 효율적인 편이다
(2)
1 2 3 4 5 6 7
자사의 공급사슬은 경쟁사 대비
혁신 추진력과 변화 관리 역량이
높은 편이다 (3)
1 2 3 4 5 6 7
자사의 공급사슬은 경쟁사 대비
재무적 성과가 높은 편이다 (4) 1 2 3 4 5 6 7
전반적으로 자사의 공급사슬은
효율성이 높은 편이다 (5) 1 2 3 4 5 6 7

44
질문그룹 6 : 인적 사항
20 귀하의 성별을 표시하여주시기 바랍니다.
○남 (1)
○여 (2)
21 귀하의 나이를 기입하여 주시기 바랍니다.
22 장시간 설문에 응해 주셔서 대단히 감사합니다. 연구결과가 나오는대로
요약본을 송부해 드리겠습니다. 하단에 응답자의 업무용(사내)이메일
주소를 기입해주시기 바랍니다.
E-mail:

45
구매자-생산자 과 지표
연계 공 사슬 과
상 계에 연구
원
생산 리 공
울 경 원
첨단 술 발 에 힘입어 경 지원 시스 과 역량이
약 향상 고 있다. 이에 라 과 지표 및
거를 마 이 보다 요해지고 있다. 이 연구는 품
특 에 라 합 공 사슬 략이 존재 다는 가 에 경
불 실 및 공 자들과 공 사슬 략 연계 는
마 는데 고 있다. 경 불 실 에 른 공 사슬
략 시 Lee(2002) 임웍과 Szu et al.(2009)
방법 토 공 자 연계를 새롭게 추가 여 공 사슬
체에 연계를 고자 다. 국/ 국 조 업 134
업체 과 지표 리에 조사 자료를 바탕
연계도 이 이루어 다.
결과 , 경 불 실 에 른 효과 인 공 사슬 략
연계에 해 공 자 연계 도가 높 수 업 체 인
과가 향상 인 다. 이는 공 자 업 및 상생
요 에 게를 해 뿐만 아니라, Lee 임웍에 실증
근거를 마 해주며, 재 업들이 용 고 있는 KPI 과 리
시스 효과 또 입증시켜주었다고 수 있다.
주요어 : 과 리, 연계, 통합, 공 사슬 략, 경 불 실
번 : 2011-20562