Cost-effectiveness analysis of lenvatinib treatment for ...this, the cost-effectiveness analysis...
13
ORIGINAL ARTICLE—LIVER, PANCREAS, AND BILIARY TRACT Cost-effectiveness analysis of lenvatinib treatment for patients with unresectable hepatocellular carcinoma (uHCC) compared with sorafenib in Japan Masahiro Kobayashi 1 • Masatoshi Kudo 2 • Namiki Izumi 3 • Shuichi Kaneko 4 • Mie Azuma 5 • Ronda Copher 6 • Genevieve Meier 6 • Janice Pan 6 • Mika Ishii 5 • Shunya Ikeda 7 Received: 2 November 2018 / Accepted: 27 January 2019 / Published online: 20 February 2019 Ó The Author(s) 2019 Abstract Background Lenvatinib demonstrated a treatment effect on overall survival by the statistical confirmation of non- inferiority to sorafenib for the first-line treatment of uHCC. The objective of this study was to evaluate the cost-ef- fectiveness of lenvatinib compared with sorafenib for patients with uHCC in Japan. Methods A partitioned-survival model was developed to estimate the cost-effectiveness of lenvatinib versus sor- afenib when treating uHCC patients over a lifetime horizon and considering total public healthcare expenditure. Effi- cacy and safety data were extracted from the REFLECT trial. Utility values were derived from the European Quality-of-Life 5-Dimension Questionnaire, conducted with patients enrolled in the REFLECT trial. Direct med- ical costs, such as primary drug therapy, outpatient visits, diagnostic tests, hospitalization, post-progression therapy, and adverse-event treatments, were included. Cost param- eters unavailable in the clinical trial or publications were obtained based on the consolidated clinical standards from a Delphi panel of four Japanese medical experts. Results For lenvatinib versus sorafenib, the incremental cost was - 406,307 Japanese Yen (JPY), and the incre- mental life years and quality-adjusted life years (QALYs) were 0.27 and 0.23, respectively. Thus, lenvatinib domi- nated sorafenib, due to the mean incremental cost-effec- tiveness ratio falling in the fourth quadrant, conferring more benefit at lower costs compared with sorafenib. The probabilistic sensitivity analysis showed that 81.3% of the simulations were favorable to lenvatinib compared with sorafenib, with a payer’s willingness-to-pay-per-QALY of 5 million JPY. Conclusions Lenvatinib was cost-effective compared with sorafenib for the first-line treatment of uHCC in Japan. Keywords Lenvatinib Á Sorafenib Á Hepatocellular carcinoma Á Cost-effectiveness Á QALY Introduction Hepatocellular carcinoma (HCC) is the most common type of liver cancer [1]. In Japan, approximately 40,000 patients are newly diagnosed with HCC each year; in 2018, there were 27,000 deaths estimated from HCC alone (https:// ganjoho.jp/en/public/statistics/short_pred.html). HCC is strongly related to chronic hepatitis and cirrhosis derived from hepatitis B or C virus infection [1]. Japanese HCC patients are likely to have a hepatitis C infection, similar to their Western counterparts [2, 3]. The other risk factors include being male, older age, higher alcohol use, a higher alpha-fetoprotein (AFP) level, or a low platelet count [2, 4, 5]. A few subjective symptoms due Electronic supplementary material The online version of this article (https://doi.org/10.1007/s00535-019-01554-0) contains sup- plementary material, which is available to authorized users. & Shunya Ikeda [email protected] 1 Toranomon Hospital, Minato-ku, Tokyo, Japan 2 Kindai University, Osakasayama, Osaka, Japan 3 Musashino Red Cross Hospital, Musashino, Tokyo, Japan 4 Kanazawa University, Kanazawa, Ishikawa, Japan 5 Eisai Co., Ltd., Bunkyo-ku, Tokyo, Japan 6 Eisai Inc., Woodcliff Lake, NJ, USA 7 International University of Health and Welfare, Narita, Japan 123 J Gastroenterol (2019) 54:558–570 https://doi.org/10.1007/s00535-019-01554-0
Transcript of Cost-effectiveness analysis of lenvatinib treatment for ...this, the cost-effectiveness analysis...

ORIGINAL ARTICLE—LIVER, PANCREAS, AND BILIARY TRACT
Cost-effectiveness analysis of lenvatinib treatment for patientswith unresectable hepatocellular carcinoma (uHCC) comparedwith sorafenib in Japan
Masahiro Kobayashi1 • Masatoshi Kudo2 • Namiki Izumi3 • Shuichi Kaneko4 •
Mie Azuma5 • Ronda Copher6 • Genevieve Meier6 • Janice Pan6 • Mika Ishii5 •
Shunya Ikeda7
Received: 2 November 2018 / Accepted: 27 January 2019 / Published online: 20 February 2019
� The Author(s) 2019
Abstract
Background Lenvatinib demonstrated a treatment effect
on overall survival by the statistical confirmation of non-
inferiority to sorafenib for the first-line treatment of uHCC.
The objective of this study was to evaluate the cost-ef-
fectiveness of lenvatinib compared with sorafenib for
patients with uHCC in Japan.
Methods A partitioned-survival model was developed to
estimate the cost-effectiveness of lenvatinib versus sor-
afenib when treating uHCC patients over a lifetime horizon
and considering total public healthcare expenditure. Effi-
cacy and safety data were extracted from the REFLECT
trial. Utility values were derived from the European
Quality-of-Life 5-Dimension Questionnaire, conducted
with patients enrolled in the REFLECT trial. Direct med-
ical costs, such as primary drug therapy, outpatient visits,
diagnostic tests, hospitalization, post-progression therapy,
and adverse-event treatments, were included. Cost param-
eters unavailable in the clinical trial or publications were
obtained based on the consolidated clinical standards from
a Delphi panel of four Japanese medical experts.
Results For lenvatinib versus sorafenib, the incremental
cost was - 406,307 Japanese Yen (JPY), and the incre-
mental life years and quality-adjusted life years (QALYs)
were 0.27 and 0.23, respectively. Thus, lenvatinib domi-
nated sorafenib, due to the mean incremental cost-effec-
tiveness ratio falling in the fourth quadrant, conferring
more benefit at lower costs compared with sorafenib. The
probabilistic sensitivity analysis showed that 81.3% of the
simulations were favorable to lenvatinib compared with
sorafenib, with a payer’s willingness-to-pay-per-QALY of
5 million JPY.
Conclusions Lenvatinib was cost-effective compared with
sorafenib for the first-line treatment of uHCC in Japan.
Keywords Lenvatinib � Sorafenib � Hepatocellular
carcinoma � Cost-effectiveness � QALY
Introduction
Hepatocellular carcinoma (HCC) is the most common type
of liver cancer [1]. In Japan, approximately 40,000 patients
are newly diagnosed with HCC each year; in 2018, there
were 27,000 deaths estimated from HCC alone (https://
ganjoho.jp/en/public/statistics/short_pred.html). HCC is
strongly related to chronic hepatitis and cirrhosis derived
from hepatitis B or C virus infection [1].
Japanese HCC patients are likely to have a hepatitis C
infection, similar to their Western counterparts [2, 3]. The
other risk factors include being male, older age, higher
alcohol use, a higher alpha-fetoprotein (AFP) level, or a
low platelet count [2, 4, 5]. A few subjective symptoms due
Electronic supplementary material The online version of thisarticle (https://doi.org/10.1007/s00535-019-01554-0) contains sup-plementary material, which is available to authorized users.
& Shunya Ikeda
1 Toranomon Hospital, Minato-ku, Tokyo, Japan
2 Kindai University, Osakasayama, Osaka, Japan
3 Musashino Red Cross Hospital, Musashino, Tokyo, Japan
4 Kanazawa University, Kanazawa, Ishikawa, Japan
5 Eisai Co., Ltd., Bunkyo-ku, Tokyo, Japan
6 Eisai Inc., Woodcliff Lake, NJ, USA
7 International University of Health and Welfare, Narita, Japan
123
J Gastroenterol (2019) 54:558–570
https://doi.org/10.1007/s00535-019-01554-0

to HCC may affect risk, such as anorexia, gastrointestinal
symptoms, and jaundice.
There are limited treatment options for HCC patients
who are ineligible for surgical resection. Locoregional
therapies, such as radiofrequency ablation, transarterial
chemoembolization (TACE), transarterial embolization
(TAE), or hepatic arterial infusion chemotherapy (HAIC),
are primarily recommended, and if one of those fail, then
systemic therapy is considered. The 2013 Japan Society of
Hepatology HCC Guidelines outlined that the factors
influencing treatment decisions should be based on the
degree of liver damage (Child–Pugh), presence or absence
of extrahepatic spread and macrovascular invasion, the
number of tumors, and tumor diameter [6].
Sorafenib, an oral multikinase inhibitor, has been the
only systemic therapy demonstrated to extend OS as a first-
line treatment, showing a median improvement of
2.8 months compared with placebo (10.7 months vs.
7.9 months; hazard ratio [HR] 0.69; p\ 0.001) [7]. In
patients from the Asia–Pacific region taking sorafenib, the
median OS (mOS) improvement compared with placebo
was 2.3 months (HR 0.68; p = 0.014) [8]. The use of other
molecularly targeted agents has not demonstrated efficacy
via non-inferiority [9–11] or superiority [12] to sorafenib;
thus, until the appearance of lenvatinib, sorafenib has also
been widely used as the first-line treatment for uHCC
patients in Japan [13, 14]. Recently, regorafenib was
approved as a second-line systemic treatment for patients
who do not respond to the first-line treatments [15].
Lenvatinib is a multiple receptor tyrosine kinase inhi-
bitor that acts on vascular endothelial growth factor
receptors (VEGFR1-3), fibroblast growth factor receptors
(FGFR1–4), platelet-derived growth factor receptor alpha
(PDGFR-alpha), KIT, and RET to inhibit pathogenic
angiogenesis. Lenvatinib monotherapy is approved for the
treatment of radioiodine-refractory differentiated thyroid
cancer [16] worldwide, including Japan. Lenvatinib and
everolimus were approved as a combined treatment for
advanced renal cell carcinoma following 1 previous
antiangiogenic therapy in the United States, the European
Union, and several other countries, but not in Japan [17].
More recently, lenvatinib was approved first in Japan
(March 2018) as a first-line treatment for unre-
sectable hepatocellular carcinoma (uHCC).
Lenvatinib was investigated for the treatment of uHCC
in the phase 3 REFLECT (Study E7080-G000-304—Eisai)
trial. REFLECT [A Multicenter, Randomized, Open-Label,
Phase 3 Trial to Compare the Efficacy and Safety of
Lenvatinib (E7080)Versus Sorafenib in the First-Line
Treatment of Subjects With Unresectable Hepatocellular
Carcinoma] was a non-inferiority trial conducted in 20
countries worldwide. A total of 954 eligible patients with
confirmed uHCC were randomly assigned to receive oral
lenvatinib (n = 478; 12 mg/day for a bodyweight of C 60
kg or 8 mg/day for a bodyweight of\ 60 kg) or sorafenib
(n = 476) 400 mg twice daily in 28-day cycles. The pri-
mary end point was OS, with the non-inferiority margin set
at 1.08. The lenvatinib median survival time of
13.6 months (95% confidence interval [CI] 12.1–14.9) was
non-inferior to that of sorafenib (12.3 months, 10.4–13.9;
HR 0.92, 95% CI 0.79–1.06). The median duration of study
treatment for patients in the lenvatinib group was
5.7 months compared with 3.7 months in the sorafenib
group. Relative to sorafenib, treatment with lenvatinib
resulted in a statistically significant improvement in pro-
gression-free survival (PFS) of 7.4 months (95% CI
6.9–8.8), while sorafenib treatment PFS was 3.7 months
(3.6–4.6; HR 0.66, 95% CI 0.57–0.77, p\ 0.0001) [18].
Recently, there is an increasing awareness of about rising
health care costs into innovative and expensive pharma-
ceuticals [19, 20]. The objective of this study was, there-
fore, to evaluate the cost-effectiveness of lenvatinib
compared with sorafenib for the first-line treatment of
uHCC patients in Japan, using patient-level data from the
REFLECT trial and considering total Japanese public
healthcare expenditure.
Methods
Model structure
We implemented a partitioned-survival model (PSM),
using mature patient-level data from REFLECT. Trial-
based Kaplan–Meier curves and cumulative survival
probabilities were used to determine the proportion of
patients in each health state. A PSM is commonly used in
the late-stage oncology modeling (http://www.yhec.co.uk/
glossary/partitioned-survival-model/). A PSM was devel-
oped in Microsoft� Excel over a lifetime horizon.
As shown in the online Supplemental Figure 1, patients
are in 1 of 3 distinct and mutually exclusive health states at
the end of each 28-day model cycle:
• Progression-free: time from randomization to the first
documentation of disease progression or death, which-
ever occurred first.
• Post-progression: time from the date of first documen-
tation of disease progression until death using the
modified response evaluation criteria in solid tumors
(mRECIST).
• Death.
By incorporating these health states, the model captures
the chronic and progressive nature of uHCC and reflects
the key outcomes of the REFLECT trial. These are the 3
most relevant health states from a patient, clinician, and
J Gastroenterol (2019) 54:558–570 559
123

payer perspective, as 2 of the primary objectives of treating
advanced HCC are prolonging life and avoiding disease
progression [21].
Patient treatment pathways
The REFLECT trial enrolled patients with intermediate and
advanced stage uHCC (Barcelona Clinic Liver Cancer
Stage ‘‘B’’ or ‘‘C’’). The treatment pathway was based on
the clinical trial and we assumed the pathway matched
clinical practice in Japan. There are only 3 agents recom-
mended as systemic therapy in Japan: sorafenib and len-
vatinib for first-line (i.e., primary) systemic therapy and
regorafenib for second-line systemic therapy. In this anal-
ysis, sorafenib was set as the study comparator, and rego-
rafenib was used as an option for post-progression therapy,
including TACE and HAIC.
Clinical outcomes
Efficacy
REFLECT demographic characteristics were generally
well balanced between the lenvatinib and sorafenib arms,
but the proportion of patients with baseline AFP levels
of C 200 ng/mL, an adverse prognostic factor in HCC
[2, 6], was greater in the lenvatinib arm than in the sor-
afenib arm: 46.4% versus 39.3%, respectively. Conse-
quently, there were fewer patients with AFP
levels\ 200 ng/mL in the lenvatinib arm than the sor-
afenib arm: 53.3% and 60.1%, respectively. One of the
most important prognostic factors for survival in HCC is
elevated AFP levels. Indeed, AFP levels in adult patients
with HCC are directly proportional to cancer size and tend
to parallel the tumor-volume doubling time [22]. A plan to
perform covariate analyses for supporting the efficacy
results was included in the statistical analysis plan of the
REFLECT trial. Kudo et al. (see supplementary appendix
Table S2 of [18]) [18] reported adjusted HRs (based on a
Cox regression model including treatment group and the
respective baseline characteristics), where stratifying for
AFP was the only variable to produce a nominally signif-
icant OS HR (0.856, CI 0.736–0.995). In consideration of
this, the cost-effectiveness analysis used clinical outcomes
from the AFP-adjusted population of the REFLECT trial in
the base case. The intent-to-treat (ITT) population from the
REFLECT trial was included as a scenario analysis in the
results.
In the REFLECT trial, 73.4% and 73.5% of patients in
the lenvatinib and sorafenib trial arms, respectively, died
and 64.4% and 72.1% had experienced disease progression,
respectively; thus, extrapolating PFS and OS data beyond
the end of the REFLECT trial was needed. Extrapolation
was achieved using parametric survival analysis, per-
formed in accordance with the relevant National Institute
for Health and Clinical Excellence Decision Support Unit
guidance [23]. Parametric survival models were generated
with AFP adjustment for 6 parametric distributions, namely
Weibull, exponential, log-logistic, log-normal, generalized
gamma, and Gompertz. The analysis adjusting for AFP
used the mean of covariates method. The most appropriate
distribution (of the 6) was selected based on:
• Assessment of the statistical goodness of fit (measured
using the Akaike Information Criterion [AIC] and
Bayesian Information Criteria [BIC])
• Consistency with the previous findings of extrapolation
methods in advanced HCC.
Model fit statistics (AIC/BIC) for the lenvatinib and
sorafenib data suggested that the log-logistic distribution
was preferred for OS. For PFS, the statistical measures
indicated that the log-normal was preferred for lenvatinib,
while the gamma distribution was preferred for sorafenib.
However, use of the gamma distribution led to implausible
extrapolations in which PFS for sorafenib exceeded that of
lenvatinib. This was not considered a clinically plausible
scenario. The log-normal distribution was the next-best-
fitting distribution and provided clinically plausible results
and was, therefore, used in the base case. Thus, these
distributions were applied in the base case.
Adverse events
We included AEs that had an impact on a patient’s quality
of life (QoL). We excluded asymptomatic AEs, such as
decreased platelet count and increased aspartate amino-
transferase, which only affected biological or immuno-
logical markers, but that had no impact on the patient’s
QoL. Rates of grade 3 or 4 treatment-emergent AEs, along
with the Common Terminology Criteria, occurring in at
least 1% of subjects in either treatment arm, came from the
REFLECT trial. In the lenvatinib and sorafenib arms, AEs
included: diarrhea (4% vs 4%), asthenic conditions (3% vs
2%), decreased appetite (5% vs 1%), abdominal pain (2%
vs 3%), decreased weight (8% vs 3%), vomiting (1% vs
1%), hypertension (23% vs 14%), and palmar–plantar
erythrodysesthesia/hand–foot syndrome (3% vs 11%),
respectively [18].
Utilities
Utility values in the model were derived through analysis
of the patient-level data in the REFLECT trial, using the
3-level version of the European Quality-of-Life 5-Dimen-
sion Questionnaire (EQ-5D-3L). Patients completed an
EQ-5D-3L at the baseline visit, on day 1 of each cycle after
560 J Gastroenterol (2019) 54:558–570
123

cycle 1, and at the off-treatment visit, which occurred
within 30 days after the final administration of the study
drug.
The baseline utility for a progression-free patient with-
out drug treatment was 0.845. The utility values for a
patient with progression were 0.714 in 2 treatment arms.
For patients who were progression-free with treatment, the
utility is calculated by the sum of progression-free disease
without treatment utility and the sum of AE disutilities for
each treatment, resulting in 0.832 for Lenvatinib and 0.837
for Sorafenib. Each AE disutility is calculated by multi-
plying the AE prevalence rate by a given disutility. The
sum of all AE disutilities was 1.253 9 10-2 for lenvatinib
and 0.809 9 10-2 for sorafenib, reported by Hudgens et al.
reported at ISPOR Europe 2017 and ISPOR US 2018.
Though not measured by the EQ-5D-3L instrument in the
REFLECT trial, hypertension is a relevant AE. To account
for this, we used a zero value for disutility in the base case
(Tables 1, 2).
Healthcare resource use
As there are limited available data for the remaining
healthcare resource use, we conducted a Delphi panel with
4 Japanese medical experts to consolidate resource uti-
lization information for uHCC standard treatment and
treatment pathways.
The Delphi method is a structured communication
technique, using surveys and subsequent rounds of feed-
back to generate expert consensus [24]. It comprised
sequential questionnaires answered anonymously by a
panel of participants with relevant HCC expertise. After
each questionnaire, a summary of the group’s responses
was fed back to the participants. To consolidate data from
the experts, we conducted a paper survey as a first round,
and then held a face-to-face meeting afterwards, as part of
a modified Delphi process.
Experts were queried on the medical resource use of
uHCC patients in progression-free and post-progression
health states, such as the number of physician visits, lab-
oratory and radiological tests, proportion of patients
requiring hospital admission, number of hospitalizations,
number of days per hospital admission stay, and types and
frequency of monitoring tests. Delphi panelists were also
questioned on the proportion of patients moving to post-
progression therapy, the types of post-progression treat-
ments, and the proportion of each treatment that patients
received in the clinical practice. Because lenvatinib was
not approved for HCC treatment in Japan when we initiated
the analysis, we obtained the medical resource use for
sorafenib treatment in practice and assumed the same
medical resource use for lenvatinib.
We defined hospitalization broadly as when treatment
required for unexpected conditions including adverse
events in the Delphi study, because there is large variation
between institutions regarding the definition of hospital-
ization of patients.
We considered that best supportive care (BSC) or pal-
liative care was given to any patient on any treatment,
including those not receiving treatment. Because there
were no studies demonstrating BSC costs in Japan, we set
BSC and palliative care costs to zero in this study.
Finally, the model included mortality as costs associated
with end-of-life (EoL) medical resource use.
Healthcare costs
We included direct healthcare costs, namely: (1) primary
drug-therapy costs, which included drugs and drug
administration; (2) medical resource-use costs, which
included outpatient visits, laboratory tests radiological
tests, and hospitalization; (3) AE treatment costs; (4) post-
progression therapy costs; and (5) EoL costs. Indirect costs,
such as caregiver costs or productivity losses arising from
an inability to work, were excluded. All costs were
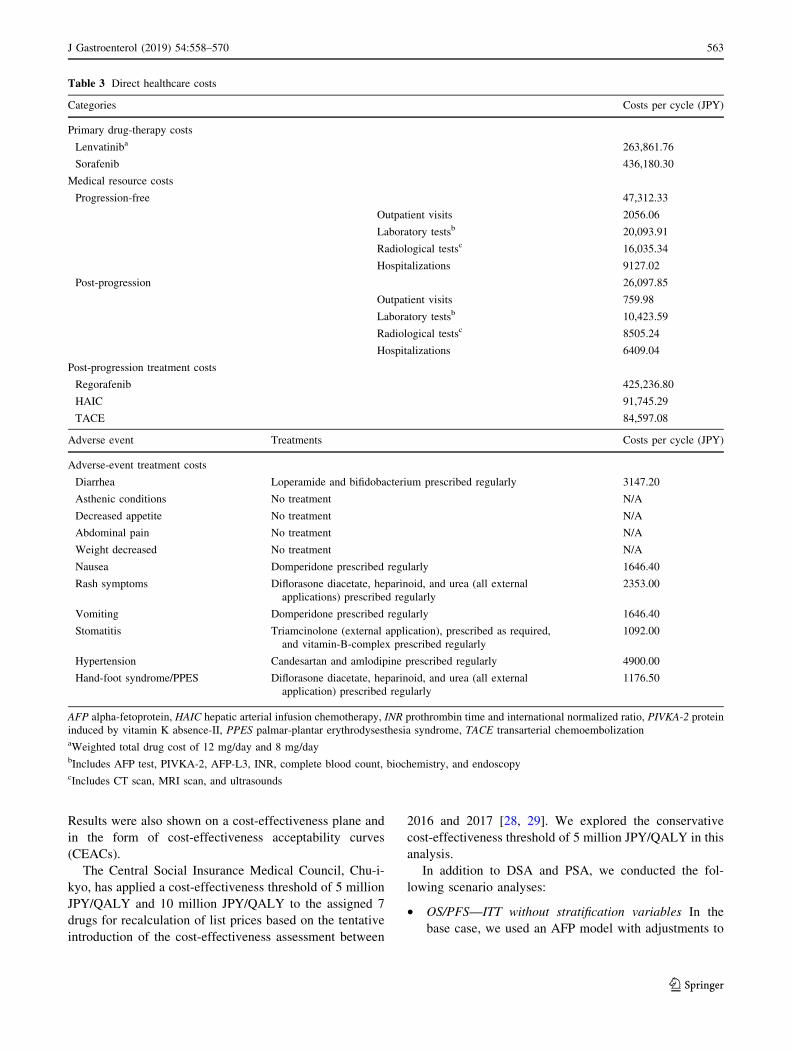
reported in Japanese Yen (JPY) 2017 value (Table 3).
Primary drug-therapy costs
We used the reimbursement price of 3956.40 JPY for
lenvatinib (per 4-mg capsule) and 4677.10 JPY for sor-
afenib (per 200-mg tablet), respectively, from the Japanese
National Health Insurance (NHI) Drug Price List in 2017.
Oral lenvatinib and oral sorafenib were prescribed in the
outpatient setting and self-administered by patients in
continuous 28-day cycles. Dose interruption, dose reduc-
tion, or treatment discontinuation was allowed for patients
who experienced drug-related toxicity.
Primary drug-therapy costs per day were calculated as the
number of pills per day multiplied by dose intensity and the
NHI list price per pill. The dose intensity was calculated as
the ratio of the actual dose to the planned starting dose. Dose
intensity and body weight (as lenvatinib dose varies based on
body weight) were extracted from patient demographics and
clinical information from the REFLECT trial. Of the 954 ITT
patients enrolled in the REFLECT trial, 478 were in the
lenvatinib arm (of whom 68% were prescribed 12 mg/day).
The mean dose intensity was 10.5 mg among patients treated
with 12 mg/day (i.e., 88% of the planned starting dose), and
7.0 mg for those treated with 8 mg/day (correspondingly, also
88%). The mean sorafenib dose intensity was 663.8 mg, or
83% of the planned starting dose.
The total primary drug-therapy cost per cycle included
an administrative cost for oral drugs based on the Japanese
NHI Reimbursement Schedule.
J Gastroenterol (2019) 54:558–570 561
123

Adverse-event treatment costs
Adverse-event treatment costs were included in the anal-
ysis for grade 3 or 4 treatment-emergent AEs occurring in
at least 1% of subjects in either treatment arm. We con-
sidered that treatments were given to all patients with grade
3–4 AEs. Dosage and frequencies of the drug treatments
were reviewed and confirmed by medical experts based on
the treatments given in the clinical trial. We assumed that
branded medicines were given to patients with AEs for the
duration of treatment. Adverse-event costs were calculated
using the NHI price of branded medicines for all AE
treatments.
Medical resource-use costs
Medical costs were calculated as a fee-for-service system.
Unit costs for outpatient visits, laboratory tests, radiologi-
cal tests, and hospitalization were charged based on the
NHI Reimbursement Schedule (Table 3).
Post-progression therapy costs
According to the Delphi panel, 52% of patients, after
receiving sorafenib as primary drug treatment, moved to
‘‘no treatment,’’ while the remaining (48%) received 1 of
the post-progression treatments of either regorafenib,
HAIC, or TACE for 155 days (5.5 cycles). The Delphi
process obtained the breakdown proportions of the post-
progression treatments as regorafenib (32.2%), HAIC
(23.7%), and TACE (44.1%) (Table 3).
EoL costs
The EoL costs for liver cancer patients were reported as 1
410 260 JPY in the last 3 months of life from a recent
database analysis (reported by Hagino and Moriwaki at
Annual meeting of Pharmaceutical Society of Japan 2018).
Analyses
Costs and outcomes were discounted at 2% per year [25]
over a time horizon of 65 years (849 cycles). We reported
economic end points, namely quality-adjusted life years
(QALYs) and life years (LYs), as well as incremental cost-
effectiveness ratios (ICERs).
We carried out a deterministic sensitivity analysis
(DSA) and probabilistic sensitivity analysis (PSA) to
explore the potential influences of the different parameters
in our analysis. In DSA, costs were varied ± 20% and dose
intensities by ± 5%. Utilities, survival outcomes (OS,
PFS), and treatment duration were varied based on ± 1.96
times their standard errors (SEs). The results are presented
as a tornado diagram that shows the impact of the param-
eter variation on the model base-case ICER. For each PSA,
1000 simulations were drawn from the variables’ distri-
butions. Costs were varied using a gamma distribution [26].
Utilities were assumed to follow a beta distribution [27]; a
log-normal distribution was applied to PFS, while a log-
logistic distribution was applied to OS [26]; and a normal
distribution was assumed for dose intensity. The PSA was
presented with the help of the probabilistic mean and SE.
Table 1 Disutility related to
grade 3–4 adverse eventsDisutility values Disutility calculation
Lenvatinib (9 10-2) Sorafenib (9 10-2)
Diarrhea - 0.014 - 0.059 - 0.059
Asthenic conditions - 0.108 - 0.318 - 0.250
Decreased appetite - 0.078 - 0.361 - 0.099
Abdominal pain - 0.005 - 0.008 - 0.014
Weight decreased - 0.053 - 0.401 - 0.156
Vomiting - 0.047 - 0.059 - 0.049
Hypertension 0.000 0.000 0.000
Hand–foot syndrome/PPES - 0.016 - 0.047 - 0.182
Total - 1.253 - 0.809
PPES palmar–plantar erythrodysesthesia syndrome
Table 2 Health-state utility
values including adverse eventsLenvatinib Sorafenib
Progression-free disease state without treatment (baseline) 0.845 0.845
Progression-free disease state with treatment 0.832 0.837
Post-progression state 0.714 0.714
562 J Gastroenterol (2019) 54:558–570
123
Results were also shown on a cost-effectiveness plane and
in the form of cost-effectiveness acceptability curves
(CEACs).
The Central Social Insurance Medical Council, Chu-i-
kyo, has applied a cost-effectiveness threshold of 5 million
JPY/QALY and 10 million JPY/QALY to the assigned 7
drugs for recalculation of list prices based on the tentative
introduction of the cost-effectiveness assessment between
2016 and 2017 [28, 29]. We explored the conservative
cost-effectiveness threshold of 5 million JPY/QALY in this
analysis.
In addition to DSA and PSA, we conducted the fol-
lowing scenario analyses:
• OS/PFS—ITT without stratification variables In the
base case, we used an AFP model with adjustments to
Table 3 Direct healthcare costs
Categories Costs per cycle (JPY)
Primary drug-therapy costs
Lenvatiniba 263,861.76
Sorafenib 436,180.30
Medical resource costs
Progression-free 47,312.33
Outpatient visits 2056.06
Laboratory testsb 20,093.91
Radiological testsc 16,035.34
Hospitalizations 9127.02
Post-progression 26,097.85
Outpatient visits 759.98
Laboratory testsb 10,423.59
Radiological testsc 8505.24
Hospitalizations 6409.04
Post-progression treatment costs
Regorafenib 425,236.80
HAIC 91,745.29
TACE 84,597.08
Adverse event Treatments Costs per cycle (JPY)
Adverse-event treatment costs
Diarrhea Loperamide and bifidobacterium prescribed regularly 3147.20
Asthenic conditions No treatment N/A
Decreased appetite No treatment N/A
Abdominal pain No treatment N/A
Weight decreased No treatment N/A
Nausea Domperidone prescribed regularly 1646.40
Rash symptoms Diflorasone diacetate, heparinoid, and urea (all external
applications) prescribed regularly
2353.00
Vomiting Domperidone prescribed regularly 1646.40
Stomatitis Triamcinolone (external application), prescribed as required,
and vitamin-B-complex prescribed regularly
1092.00
Hypertension Candesartan and amlodipine prescribed regularly 4900.00
Hand-foot syndrome/PPES Diflorasone diacetate, heparinoid, and urea (all external
application) prescribed regularly
1176.50
AFP alpha-fetoprotein, HAIC hepatic arterial infusion chemotherapy, INR prothrombin time and international normalized ratio, PIVKA-2 protein
induced by vitamin K absence-II, PPES palmar-plantar erythrodysesthesia syndrome, TACE transarterial chemoembolizationaWeighted total drug cost of 12 mg/day and 8 mg/daybIncludes AFP test, PIVKA-2, AFP-L3, INR, complete blood count, biochemistry, and endoscopycIncludes CT scan, MRI scan, and ultrasounds
J Gastroenterol (2019) 54:558–570 563
123

OS/PFS. In the scenario analysis, we excluded this
adjustment and assessed the impact of outcomes
without any stratification.
• Time horizon of 5 and 10 years PSM used extrapolated
survival curves estimated from the phase 3 REFLECT
trial data. As there are uncertainties around these
extrapolated data, we reduced their impact by consid-
ering 2 scenarios with shorter time horizons.
• Discount rate for costs and benefits set to 4% Per
Japanese guidelines, [25] we explored the alternative
where the base-case discount rate for both costs and
benefits was doubled.
• Dose intensity and distribution aligned to the Japanese
population As Japanese patients generally have lower
body weights than Western patients, we aligned these
statistics to those of the Japanese (only) patients in the
REFLECT trial, where: dose intensity of lenvatinib
8 mg = 80%, lenvatinib 12 mg = 70%, and sorafenib =
70%. Moreover, the distribution of patients treated with
lenvatinib 8 mg versus 12 mg was assumed to be 50%.
• The AE treatment cost was reduced by 60% of the base-
case values We reduced AE drug costs by 60% to
account for generic drug prices.
• Hypertension disutility from a systematic literature
review In the base case, we assumed a disutility of zero,
due to the lack of appropriate literature. In the scenario
analysis, we assumed a disutility of 0.012 for hyper-
tension, which is the value of disutility-related AEs in
the systematic literature review, although not specific to
hypertension [30]. In an alternative scenario, we
assumed a disutility of 0.028 for hypertension, which
is the value of disutility from ‘‘any AE’’ from grade 1 to
4, extracted from the REFLECT trial.
Results
Base-case analysis (AFP covariate analysis)
In the base-case analysis, the mean estimated LYs and
QALYs were 1.88 and 1.46 for lenvatinib treatment and
1.62 and 1.23 for sorafenib treatment, respectively
(Table 4). The incremental LYs and QALYs were 0.27 and
0.23, respectively, for lenvatinib compared with sorafenib.
Total costs of lenvatinib therapy were estimated at 5 088
957 JPY ($47 938 United States dollars [USD])1, while
sorafenib costs were 5,495,264 JPY ($51,765 USD). The
incremental cost was - 406,307 JPY ($3827 USD) for
lenvatinib compared with sorafenib. Moreover, when len-
vatinib is used instead of sorafenib, there was an estimated
decrease in costs of 406,307 JPY ($3827 USD). Lenvatinib
treatment is dominant versus sorafenib treatment, due to
the mean ICER falling in the fourth quadrant, i.e., lenva-
tinib treatment conferred additional LY or QALY gains
while reducing costs (Table 4).
In the breakdown of costs in Fig. 1, the cost structure
was similar in both groups. It reveals that primary drug-
therapy costs were the largest component of total costs,
which accounted for approximately half of the total costs in
both arms. The second largest cost component was EoL
costs, followed by medical resource use, post-progression
therapy, and AE treatment costs. Primary drug-therapy
costs were 2.4 M JPY for lenvatinib and 3.0 M JPY for
sorafenib. While the per-cycle drug cost of sorafenib is
approximately 1.65 times higher than lenvatinib, signifi-
cantly longer PFS and the longer treatment duration of
patients on lenvatinib partially offset this cost, such that,
over a lifetime horizon, the difference in primary drug-
therapy cost of sorafenib falls to 1.24 times that of
lenvatinib.
The difference in EoL costs between both therapies was
small. This aligns with the clinical trial data (see Figure 2
of Kudo et al. [18]), where the OS was longer for lenva-
tinib, but both therapies had survival outcomes that were
not statistically significantly different (HR 0.92, CI
0.79–1.06).
The medical resource-use costs associated with lenva-
tinib were approximately 20% higher than for sorafenib.
This reflects, in part, the higher costs incurred by lenvatinib
due to its significantly better PFS outcomes (see Figure 2
of Kudo et al. [18]). Medical resource-use costs are
dependent on the post-progression medical costs incurred,
which, for the same reason as above (i.e., longer survival),
are likely to be higher for lenvatinib than sorafenib. Post-
1 The exchange rate was $1 USD = 106.1575 JPY. Source http://
www.exchangerate.com/. Site accessed March 7, 2018.
Table 4 Results of the cost-
effectiveness analysis (base-
case analysis)
Treatment Cost (JPY) Effectiveness (LY) Effectiveness (QALY)
Lenvatinib 5,088,957 1.88 1.46
Sorafenib 5,495,264 1.62 1.23
Incremental values - 406,307 0.27 0.23
ICER Dominant Dominant
ICER incremental cost-effectiveness ratio, LY life year, QALY quality-adjusted life year
564 J Gastroenterol (2019) 54:558–570
123

progression costs are determined beyond the clinical trial
period and, hence, influenced by the methods used to
extrapolate data. We discuss this further in the scenario
analyses, in the following.
The AE treatment costs in both therapies were very
small and accounted for less than 1% of the total cost,
because no treatment was given to nearly half of the AEs.
Although it was a small proportion, AE treatment costs
associated with lenvatinib were slightly higher than with
sorafenib because the treatment cost for hypertension,
which occurred more frequently in lenvatinib than sor-
afenib, was the most expensive among those AE treatment
costs per cycle.
Sensitivity analysis
A DSA was performed to assess the impact of the model
parameter uncertainty on the base-case ICER (using
QALYs as the outcomes measure). Figure 2 shows the
results of the analysis. The 3 most significant model
parameters were OS curves, PFS curves, and progression-
free utility. Varying these 3 parameters still resulted in
lenvatinib being dominant over sorafenib.
A PSA was performed to assess the impact of uncer-
tainty on the model parameters. Figure 2 shows the cost-
effectiveness plane and the CEAC for the PSA simulation.
The CEAC shows the percentage of simulations favoring a
treatment option. The CEAC shows that 81.3% of the
simulations were favorable to lenvatinib compared with
sorafenib when the payer’s WTP per QALY was 5.0 mil-
lion JPY.
Scenario analyses
The results of scenario analyses are shown in Table 5 and
Supplemental Table 1. We show the base-case results in
the top row as a basis for comparison. Lenvatinib remains
dominant versus sorafenib across all scenarios. These
findings confirm the robustness of our base-case findings.
Discussion
The cost-effectiveness analysis results showed lenvatinib
treatment dominated sorafenib, due to the mean ICER
falling in the fourth quadrant, as lenvatinib was more
effective (measured by QALYs) and less costly compared
with sorafenib for uHCC treatment in Japan. The signifi-
cantly better PFS outcomes [18] resulted in higher QALYs
for lenvatinib compared with sorafenib, because more time
Lenva�nib Sorafenib
Primary drug therapy 2 444 931 3 026 092
Medical 901 999 717 418
AE treatment 1 583 1 139
Post-progression therapy 384 086 386 706
End of life 1 356 358 1 363 909
Total costs (JPY) 5 088 957 5 495 264
Fig. 1 Breakdown of costs in
the base case
J Gastroenterol (2019) 54:558–570 565
123

566 J Gastroenterol (2019) 54:558–570
123

was spent in a better health state (i.e., progression-free).
Moreover, using extrapolated data, lenvatinib patients
remained in the progression-free health state as well as in
the lifetime horizon longer than sorafenib patients, which
also contributed to higher cumulative lifetime QALYs.
Another beneficial aspect of lenvatinib treatment was
the cost-saving led by lower primary drug-therapy costs.
This was despite more medical resource-use costs for
lenvatinib. Due to oral administration, drug administration
costs were the same for the 2 treatments, and thus, the
major cost-saving driver was the drug cost. Dose intensity
and body weight were extracted from patient demographics
and clinical information from the REFLECT trial. We used
the lenvatinib and sorafenib list prices of 3956.40 JPY (4-
mg capsule) and 4677.10 JPY (200-mg tablet), respec-
tively, from the Japanese NHI 2017 list of drugs. In Japan,
the price of a new drug is determined based on its efficacy
relative to ‘‘similar’’ comparators and is given the same
daily costs as its comparator. In the case of lenvatinib, the
price was based on sorafenib when lenvatinib was newly
launched in the Japanese market in 2015. The daily dose of
lenvatinib in differentiated thyroid cancer is twice the dose
for HCC, whereas the daily dose of sorafenib for both HCC
and differentiated thyroid cancer is identical. As a result,
the total lenvatinib drug costs are nearly half sorafenib’s in
HCC. Drug prices are revised every 2 years in Japan; the
latest revision was in April 2018. The revised prices (as of
5 March 2018), where lenvatinib and sorafenib prices
remain equivalent, are reflected in our analysis.
There are several limitations and data gaps in this
analysis. First, we implemented a model analysis, using
patient-level data from REFLECT trial. This may not
necessarily reflect the real clinical efficacy and safety in the
real world practice, while delivering such cost-effective-
ness information at the timing when lenvatinib just laun-
ched would also be useful for physicians as well as for
healthcare policy makers in terms of decision-making. To
address such concern and to assess the robustness of our
base-case analysis, we conducted a DSA and PSA to rep-
resent uncertainty by reporting the impact on cost-effec-
tiveness following the standards of economic evaluation
[31]. In the DSA, model parameters were varied over
plausible values, with ICER varying between - 2,095,958
JPY (OS) and - 1,467,729 JPY (OS). The DSA results
consistently support lenvatinib dominance versus
bFig. 2 Deterministic sensitivity analysis (a), probabilistic sensitivity
analysis (b), and cost-effectiveness acceptability curves (c), in
lenvatinib compared to sorafenib. In a PSA, using a set of input
parameter values drawn 1000 times by random sampling from each
distribution, the model generates 1000 outcomes appeared as a
‘‘cloud’’ of potential outcomes (b), or graphed as a proportion in
CEAC (c). b Visibly shown the four quadrants that the outcomes (i.e.,
ICER) can be fallen. The first quadrant is the area that lenvatinib is
more effective (measured by QALY) and more costly compared with
sorafenib. Similarly, the fourth quadrant is the area that lenvatinib is
more effective and less costly compared with sorafenib. c tells that
81.3% of ICERs simulations fall the area considered cost-effective in
relation to a given Japanese cost-effectiveness threshold of 5 million
JPY per QALY. AFP alpha-fetoprotein, CT scan computed-tomog-
raphy scan, ICER incremental cost-effectiveness ratio, INR prothrom-
bin time and international normalized ratio, LEN lenvatinib, MRI
magnetic resonance imaging, PIVKA-2 protein induced by vitamin K
absence-II, QALY quality-adjusted life year, SOR sorafenib, WTP
willingness-to-pay
Fig. 2 continued
J Gastroenterol (2019) 54:558–570 567
123

sorafenib. In the PSA, simulation results were predomi-
nantly in the southeast quadrant of the cost-effectiveness
plane (i.e., dominance). The CEAC showed that 81.3% of
the simulations were favorable to lenvatinib compared with
sorafenib when the payer’s WTP per QALY was 5.0 mil-
lion JPY.
In addition, the cost-effectiveness analysis results were
robust in the scenario analyses, which included: the ITT
population from the REFLECT trial, an extrapolation
without the AFP covariate stratification, shortening the
model time horizon, doubling the discount rates, lowering
AE treatment costs, larger hypertension disutility, and dose
intensity and distribution aligned with Japanese population
characteristics. Importantly, the model used extrapolated
survival curves estimated from the REFLECT trial in
uHCC patients; the median follow-up times, in months,
were 27.7 for the lenvatinib treatment arm and 27.2 for the
sorafenib treatment arm. Parametric survival model meth-
ods allowed us to extrapolate the data beyond the observed
study period, but there are uncertainties associated with the
extrapolation of survival curves beyond the observed data
period. In the base case, the most appropriate distribution
was selected using the following process: (a) assessment of
the visual fit to the observed Kaplan–Meier, (b) assessment
of the statistical goodness of fit (measured using the AIC
and BIC), and (c) assessment of the plausibility of the long-
term extrapolation. To address the uncertainty around the
statistical methods used in extrapolating data, we explored
alternative assumptions by varying the estimation models
and functional forms for estimating OS/PFS in scenario
analyses, and in all scenarios, our conclusions remain
robust, namely that lenvatinib dominated sorafenib.
Second, we assumed that post-progression treatment
after the first-line treatment with lenvatinib (when it is
approved) would be the same as sorafenib. This was
followed by the indication of regorafenib that the Ministry
of Health, Labour and Welfare has granted regorafenib for
the second-line treatment of patients with uHCC who have
progressed after treatment with cancer chemotherapy. This
was also consistent with 2018 practice guide by AASLD
that the sequential use of multikinase tyrosine kinase
inhibitors with similar mechanisms of action may be con-
sidered, although there are no specific data to support the
use of regorafenib after progression on lenvatinib [32].
Further research may be necessary in the real world. On the
premise of this, post-progression therapies used and the
proportion of patients taking each therapy were obtained
from medical experts through a Delphi panel. A Delphi
panel was also necessary for 2 reasons: (1) the details of
Japanese-specific data of the post-study therapies in the
REFLECT trial were not available; (2) the post-study
therapies given in the clinical trial for the ITT patients were
different between the 2 arms due to the trial conditions. We
assumed that the potential effect on OS from the Delphi-
selected post-progression therapies was the same as those
in REFLECT.
Third, utility values of both progression-free and post-
progression health states were derived from EQ-5D-3L
data in the REFLECT trial. As the post-progression utility
data were obtained within the first month of entering the
post-progression health state, the values are likely higher
than if collected beyond the first month of post-progression
or when a patient is closer to death. As such, it is likely that
the utility values of the post-progression state in both
groups of patients were overestimated, but a systematic
literature review conducted in November 2017 was
unsuccessful in finding alternative values from the existing
literature in Japan.
Fourth, there is no consensus on the official WTP per
QALY threshold in Japan. We used the conservative
Table 5 Scenario analyses
results (lenvatinib vs sorafenib)Description of scenario D QALYs D Costsa ICER
Base case 0.230 - 406,307 Dominant
OS/PFS—ITT without stratification variables 0.148 - 444,145 Dominant
Time horizon—5 years (65 cycles) 0.166 - 466,560 Dominant
Time horizon—10 years (130 cycles) 0.201 - 427,448 Dominant
Discount rate for costs and benefits: 4% 0.210 - 423,928 Dominant
Dose intensity and distributionb 0.230 - 479,438 Dominant
AE treatment cost: 60% of base case 0.230 - 406,485 Dominant
HTN disutility from SLR (= 0.012) 0.229 - 406,307 Dominant
HTN disutility from 304 (= 0.028) 0.228 - 406,307 Dominant
The ‘‘base case’’ results were already presented in the Table 4. However, for reference, to compare with the
result of the scenario analysis, the base case results (in italic) were presented
AE adverse event, HTN hypertension, ICER incremental cost-effectiveness ratio, ITT intention-to-treat, LY
life year, OS overall survival, PFS progression-free survival, QALY quality-adjusted life yearaIncremental costs (i.e., D) are reported in Japanese JPY 2017 valuebThe dose intensity and distribution were aligned to the Japanese population
568 J Gastroenterol (2019) 54:558–570
123

threshold of 5 million JPY per QALY. We found that len-
vatinib is dominant versus sorafenib, suggesting that the
threshold is not a constraint. However, in many cost-effec-
tiveness analyses, the threshold is important for decision-
making. The Chu-i-kyo is scheduled to discuss introducing a
full-scale cost-effectiveness assessment in Japan; a decision
may be reached by the end of the fiscal year 2018, including
the WTP threshold that would apply in Japan.
Conclusions
A cost-effectiveness analysis demonstrated that lenvatinib
conferred more benefit at lower costs: it dominated sor-
afenib for the treatment of uHCC in Japan, due to the mean
ICER falling in the fourth quadrant. The significantly better
PFS outcomes observed in the trial resulted in higher
QALYs for lenvatinib compared with sorafenib, because
more time was spent in the progression-free health state.
Moreover, using extrapolated data, lenvatinib patients
remained in the progression-free health state as well as in
the lifetime horizon longer than sorafenib patients, adding
to the higher QALYs over a lifetime. The lower lenvatinib
drug cost offset the higher medical resource cost incurred
by lenvatinib patients who survived longer than sorafenib
patients. Our results are robust to sensitivity analyses (DSA
and PSA) and scenario analyses.
Compliance with ethical standards
Conflict of interest The author(s) declare that they have no com-
peting interests.
Open Access This article is distributed under the terms of the
Creative Commons Attribution 4.0 International License (http://crea
tivecommons.org/licenses/by/4.0/), which permits unrestricted use,
distribution, and reproduction in any medium, provided you give
appropriate credit to the original author(s) and the source, provide a
link to the Creative Commons license, and indicate if changes were
made.
References
1. Balogh J, Victor D 3rd, Asham EH, et al. Hepatocellular carci-
noma: a review. J Hepatocell Carcinoma. 2016;3:41–53.
2. European Association for The Study of The Liver; European
Organisation for Research and Treatment of Cancer. EASL-
EORTC clinical practice guidelines: management of hepatocel-
lular carcinoma. J Hepatol. 2012;56:908–43.
3. Kim MN, Kim BK, Han K-H. Hepatocellular carcinoma in
patients with chronic hepatitis C virus infection in the Asia–
Pacific region. J Gastroenterol. 2013;48:681–8.
4. Chiba T, Matsuzaki Y, Abei M, et al. Multivariate analysis of risk
factors for hepatocellular carcinoma in patients with hepatitis C
virus-related liver cirrhosis. J Gastroenterol. 1996;31:552–8.
5. Ikeda K, Saitoh S, Koida I, et al. A multivariate analysis of risk
factors for hepatocellular carcinogenesis: a prospective observa-
tion of 795 patients with viral and alcoholic cirrhosis. Hepatol-
ogy. 1993;18:47–53.
6. The Japan Society of Hepatology. Clinical Practice Guidelines
for Hepatocellular Carcinoma 2013. Kanahara-shuppan; 2013.
https://www.jsh.or.jp/English/guidelines_en/Guidelines_for_hepa
tocellular_carcinoma_2013.
7. Llovet JM, Ricci S, Mazzaferro V, et al. Sorafenib in advanced
hepatocellular carcinoma. N Engl J Med. 2008;359:378–90.
8. Cheng AL, Kang YK, Chen Z, et al. Efficacy and safety of sor-
afenib in patients in the Asia–Pacific region with advanced
hepatocellular carcinoma: a phase III randomised, double-blind,
placebo-controlled trial. Lancet Oncol. 2009;10:25–34.
9. Cheng AL, Kang YK, Lin DY, et al. Sunitinib versus sorafenib in
advanced hepatocellular cancer: results of a randomized phase III
trial. J Clin Oncol. 2013;31:4067–75.
10. Johnson PJ, Qin S, Park JW, et al. Brivanib versus sorafenib as
first-line therapy in patients with unresectable, advanced hepa-
tocellular carcinoma: results from the randomized phase III
BRISK-FL study. J Clin Oncol. 2013;31:3517–24.
11. Cainap C, Qin S, Huang WT, et al. Linifanib versus sorafenib in
patients with advanced hepatocellular carcinoma: results of a
randomized phase III trial. J Clin Oncol. 2015;33:172–9.
12. Zhu AX, Rosmorduc O, Evans TR, et al. SEARCH: a phase III,
randomized, double-blind, placebo-controlled trial of sorafenib
plus erlotinib in patients with advanced hepatocellular carcinoma.
J Clin Oncol. 2015;33:559–66.
13. Kaneko S, Ikeda K, Matsuzaki Y, et al. Safety and effectiveness
of sorafenib in Japanese patients with hepatocellular carcinoma in
daily medical practice: interim analysis of a prospective post-
marketing all-patient surveillance study. J Gastroenterol.
2016;51:1011–21.
14. Kudo M, Ikeda M, Takayama T, et al. Safety and efficacy of
sorafenib in Japanese patients with hepatocellular carcinoma in
clinical practice: a subgroup analysis of GIDEON. J Gastroen-
terol. 2016;51:1150–60.
15. Bruix J, Qin S, Merle P, et al. Regorafenib for patients with
hepatocellular carcinoma who progressed on sorafenib treatment
(RESORCE): a randomised, double-blind, placebo-controlled,
phase 3 trial. Lancet. 2017;389:55–66.
16. Schlumberger M, Tahara M, Wirth LJ, et al. Lenvatinib versus
placebo in radioiodine-refractory thyroid cancer. N Engl J Med.
2015;372:621–30.
17. Motzer RJ, Hutson TE, Glen H, et al. Lenvatinib, everolimus, and
the combination in patients with metastatic renal cell carcinoma:
a randomised, phase 2, open-label, multicentre trial. Lancet
Oncol. 2015;16:1473–82.
18. Kudo M, Finn RS, Qin S, et al. Lenvatinib versus sorafenib in
first-line treatment of patients with unresectable hepatocellular
carcinoma: a randomised phase 3 non-inferiority trial. Lancet
(Lond Engl). 2018;391:1163–73.
19. McEwan P, Ward T, Webster S, et al. Estimating the cost-ef-
fectiveness of daclatasvir plus asunaprevir in difficult to treat
Japanese patients chronically infected with hepatitis C genotype
1b. Hepatol Res. 2016;46:423–33.
20. Kaishima T, Akita T, Ohisa M, et al. Cost-effectiveness analyses
of anti-hepatitis C virus treatments using quality of life scoring
among patients with chronic liver disease in Hiroshima prefec-
ture, Japan. Hepatol Res. 2018;48:509–20.
21. Molla N, AlMenieir N, Simoneau E, et al. The role of interven-
tional radiology in the management of hepatocellular carcinoma.
Curr Oncol. 2014;21:e480–92.
22. Trevisani F, Brandi G, Garuti F, et al. Metronomic capecitabine
as second-line treatment for hepatocellular carcinoma after
J Gastroenterol (2019) 54:558–570 569
123
sorafenib discontinuation. J Cancer Res Clin Oncol.
2018;144:403–14.
23. Latimer N. NICE DSU Technical Support Document 14. Survival
analysis for economic evaluations alongside clinical trials—ex-
trapolation with patient-level data. 2013. http://nicedsu.org.uk/
wp-content/uploads/2016/03/NICE-DSU-TSD-Survival-analysis.
updated-March-2013.v2.pdf.
24. Eubank BH, Mohtadi NG, Lafave MR, et al. Using the modified
Delphi method to establish clinical consensus for the diagnosis
and treatment of patients with rotator cuff pathology. BMC Med
Res Methodol. 2016;16:56.
25. Fukuda T. Study team for establishing evaluation methods, data
standardization, and assessment systems toward the application
of economic evaluation of healthcare technologies to govern-
mental policies. Guideline for preparing cost-effectiveness eval-
uation to the central social insurance medical council. Strategic
Integrated Scientific Research Project, supported by Health and
Labour Science Research Grants. 2016. https://tools.ispor.org/
PEguidelines/source/Japanese_PE_Guideline.pdf.
26. Briggs AH, Weinstein MC, Fenwick EA, et al. Model parameter
estimation and uncertainty: a report of the ISPOR-SMDM
Modeling Good Research Practices Task Force–6. Value Health.
2012;15:835–42.
27. Swinburn P, Lloyd A, Nathan P, et al. Elicitation of health state
utilities in metastatic renal cell carcinoma. Curr Med Res Opin.
2010;26:1091–6.
28. Shiroiwa T, Fukuda T, Ikeda S, et al. New decision-making
processes for the pricing of health technologies in Japan: the FY
2016/2017 pilot phase for the introduction of economic evalua-
tions. Health Policy. 2017;121:836–41.
29. Shiroiwa T, Sung YK, Fukuda T, et al. International sur-vey on
willingness-to-pay (WTP) for one additional QALY gained: what
is the threshold of cost effectiveness. Health Econ. 2010;19:
422–37.
30. HealthCare Bayer. Single Technology Appraisal (STA) of sor-
afenib (Nexavar�) for the treatment of hepatocellular carcinoma
(HCC) [TA189]. London: National Institute for Health and Care
Excellence; 2009.
31. Drummond MF, Sculpher MJ, Claxton K, et al. Methods for the
economic evaluation of health care programmes. 4th ed. Oxford:
Oxford University Press; 2015.
32. Morrero JA, Kulik LM, Sirlin CB, et al. Diagnosis, staging, and
management of hepatocellular carcinoma: 2018 Practice Guid-
ance by the American Association for the Study of Liver Dis-
eases. Hepatology. 2018;68:723–50.
Publisher’s Note Springer Nature remains neutral with regard to
jurisdictional claims in published maps and institutional affiliations.
570 J Gastroenterol (2019) 54:558–570
123