1 Cost-Effectiveness Analysis Life Years Analysis Scott Matthews Courses: 12-706 / 19-702.
36
1 Cost-Effectiveness Analysis Life Years Analysis Scott Matthews Courses: 12-706 / 19-702
-
date post
20-Dec-2015 -
Category
Documents
-
view
217 -
download
0
Transcript of 1 Cost-Effectiveness Analysis Life Years Analysis Scott Matthews Courses: 12-706 / 19-702.

1
Cost-Effectiveness AnalysisLife Years Analysis
Scott MatthewsCourses: 12-706 / 19-702

2
Admin
HW 5 Due Wednesday
Project 2 Coming soon. Due Monday Nov 24 (2 weeks)

3
Specifics on Saving Lives
Cost-Utility Analysis Quantity and quality of lives important
Just like discounting, lives are not equal Back to the developing/developed example
But also: YEARS are not equal Young lives “more important” than old Cutting short a year of life for us vs Cutting short a year of life for 85-year-old Often look at ‘life years’ rather than ‘lives’
saved.. These values also get discounted

4
Simple Example
Measure of TotalAdditional Years
HealthStatus
Y1 Y2 Y3
H1 Y1H1SQ Y2H1 Y3H1
H2 Y1H2 Y2H2 Y3H2B
H3 Y1H3 Y2H3A Y3H3

5
Cost-Effectiveness TestingGenerally, use when:
Considering externality effects or damagesCould be environmental, safety, etc.
Benefits able to be reduced to one dimension Alternatives give same result - e.g. ‘reduced x’ Benefit-Cost Analysis otherwise
difficult/impossible
Instead of finding NB, find “cheapest” Want greatest bang for the buck
Find cost “per unit benefit” (e.g. lives saved) Allows us to NOT include ‘social costs’

6
The CEA ratiosCE = C/E
Equals cost “per unit of effectiveness” e.g. $ per lives saved, tons CO2 reduced Want to minimize CE (cheapest is best)
EC = E/C Effectiveness per unit cost e.g. Lives saved per dollar Want to maximize EC
No practical difference between 2 ratios

7
Interesting Example
AlternativesA B
Cost $1 M $100 M# LivesSaved
4 200
CE ratio $250k $500kEC ratio 4 lives 2 lives

8
Lessons Learned
Ratios still tend to hide results Do not take into account scale issues CBA might have shown Option B to be better (more lives
saved) Tend to only consider budgetary costs CEA used with constraints? Minimize C s.t. E > E*
Min. effectiveness level (prev slide) Find least costly way to achieve it
Minimize CE s.t. E > E* Generally -> higher levels of C and E!
Can have similar rules to constrain cost

9
Sample Applications
Cost-effectiveness of: New drug/medical therapies* very
popular Pollution prevention Safety regulations

10
Definitions
Overall cost-effectiveness is the ratio of the annualized cost to the quantity of effectiveness benefit.
Incremental cost-effectiveness is the difference in costs divided by the difference in effectiveness that results from comparing one option to another, or to a benchmark measure.
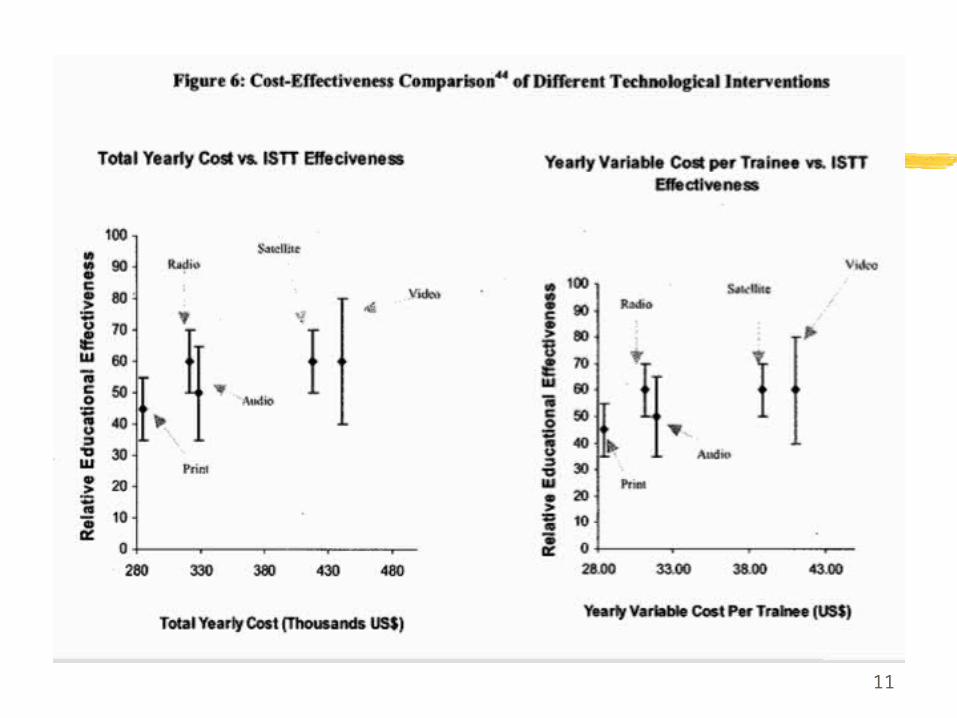
11

12
Incremental CE
To find incremental cost-effectiveness : Sort alternatives by ‘increasing effectiveness’ TAC = total annualized cost of compliance PE = effectiveness (e.g. benefit measure) CE = (TACk – TACk-1) / ( PEk – PEk-1) CE = incremental cost-effectiveness of Option k Use zero values (if applicable) for base case

13
Incremental CE Example
Inc CE here only relevant within control categories (metals v. oils v. org’s) ** Negative CE means option has more removals at lower cost Source: US EPA Office of Water EPA 821-R-98-018, “Cost Effectiveness Analysis of Effluent Limitations
Guidelines and Standards for the Centralized Waste Treatment Industry”
Control Option Name Costs Removals Cost- Incremental(pounds) Effectiveness CE
Metals 2 $8,853,173 369,112 $24 $24Metals 4 $1,843,303 372,040 $5 -$2394.08**Metals 3 $9,179,935 379,571 $24 $974Oils 8 $313,523 13,943 $22 $22Oils 9 $313,523 14,811 $21 $0Organics 4 $150,694 —Organics 3 $275,074 27,055 $10 $10

14
Definitions (2)
Marginal cost-effectiveness refers to the change in costs and benefits from a one-unit expansion or contraction of service from a particular intervention (e.g. an extra pound of emissions, an extra fatality avoided).

15
Why is CEA so relevant for public policy analysis?
Limited resources!Opportunity cost of public spending
i.e. if we spend $100 M with agency A, its $100 M we cannot spend elsewhere
There is no federal rule saying ‘each million dollars spent must save x lives’
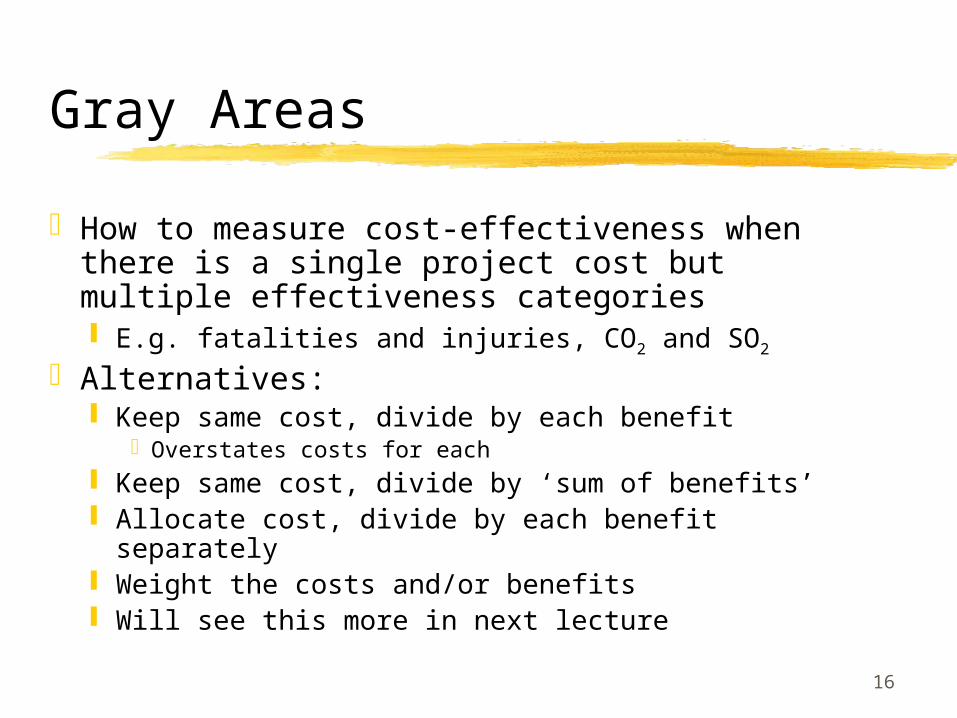
16
Gray Areas
How to measure cost-effectiveness when there is a single project cost but multiple effectiveness categories E.g. fatalities and injuries, CO2 and SO2
Alternatives: Keep same cost, divide by each benefit
Overstates costs for each Keep same cost, divide by ‘sum of benefits’ Allocate cost, divide by each benefit separately Weight the costs and/or benefits Will see this more in next lecture
17
Another CEA Example
Automated defribillators in community http://www.early-defib.org/03_06_09.ht
ml What would costs be? What is effectiveness?

18
Value of Life Analysis
Scott MatthewsCourses: 12-706 / 73-359 / 19-702

12-706 and 73-359 19
“Value of Life”
Economists don’t like to say they put a value on life
They say they “Study peoples’ willingness to pay to prevent premature mortality” Translation: “how much is your life
worth”?

20
WTP versus WTA
Economics implies that WTP should be equal to ‘willingness to accept’ loss
Turns out people want MUCH MORE in compensation for losing something
WTA is factor of 4-15 higher than WTP! Also see discrepancy shrink with
experience WTP formats should be used in CVs Only can compare amongst individuals

12-706 and 73-359 21
Economic valuations of life
Miller (n=29) $3 M in 1999 USD, surveyed Wage risk premium method WTP for safety measures Behavioral decisions (e.g. seat belt use) Foregone future earnings Contingent valuation
Note that we are not finding value of a specific life, but instead of a statistical life

12-706 and 73-359 22
DALY/QALY measures
Disability adjusted life years or quality-adjusted life years
These are measures used to normalize the quality-quantity tradeoff discussed last time. E.g., product of life expectancy (in
years) and the quality of life available in those years.

12-706 and 73-359 23
Risk Analysis
Study of the interactions between decision making, judgment, and nature
Evidence : cost-effectiveness of risk reduction opportunities varied widely - orders of magnitude
Economic efficiency problems

12-706 and 73-359 24
Example - MAIS scale
Abbreviated Injury Scale (AIS) is an anatomically based system that classifies individual injuries by body region on a six point ordinal scale of risk to life.
AIS does not assess the combined effects of multiple injuries.
The maximum AIS (MAIS) is the highest single AIS code for an occupant with multiple injuries.

12-706 and 73-359 25
MAIS Table - Used for QALY Conversions
Comprehensive Fatality / Injury Values
Injury Severity 1994 Relative Value
MAIS1 .0038
MAIS2 .0468
MAIS3 .1655
MAIS4 .4182
MAIS5 .8791
Fatality 1.0

12-706 and 73-359 26
Sample QALY comparison
A: 4 years in a health state of 0.5B: 2 years in a health state of 0.75QALYs: A=2 QALY; B=1.5 QALYSo A would be preferred to B.

12-706 and 73-359 27
Cost-Effectiveness of Life-Saving Interventions
From “500 Life-saving Interventions and Their Cost-Effectiveness”, Risk Analysis, Vol. 15, No. 3, 1995.
‘References’ (eg #1127) are all other studiesModel:
Estimate costs of intervention vs. a baseline Discount all costs Estimate lives and life-years saved Discount life years saved CE = CI-CB/EI-EB

12-706 and 73-359 28
Specific (Sample) Example
From p.373 - Ref no. 1127 Intervention: Rear outboard lap/shoulder belts
in all (100%) of cars Baseline: 95.8% of cars already in compliance Intervention: require all cars made after
9/1/90 to have beltsThus costs only apply to remaining 4.2% (65,900)
cars Target population: occupants over age 4 Others would be in child safety seats What would costs be?
12-706 and 73-359 29
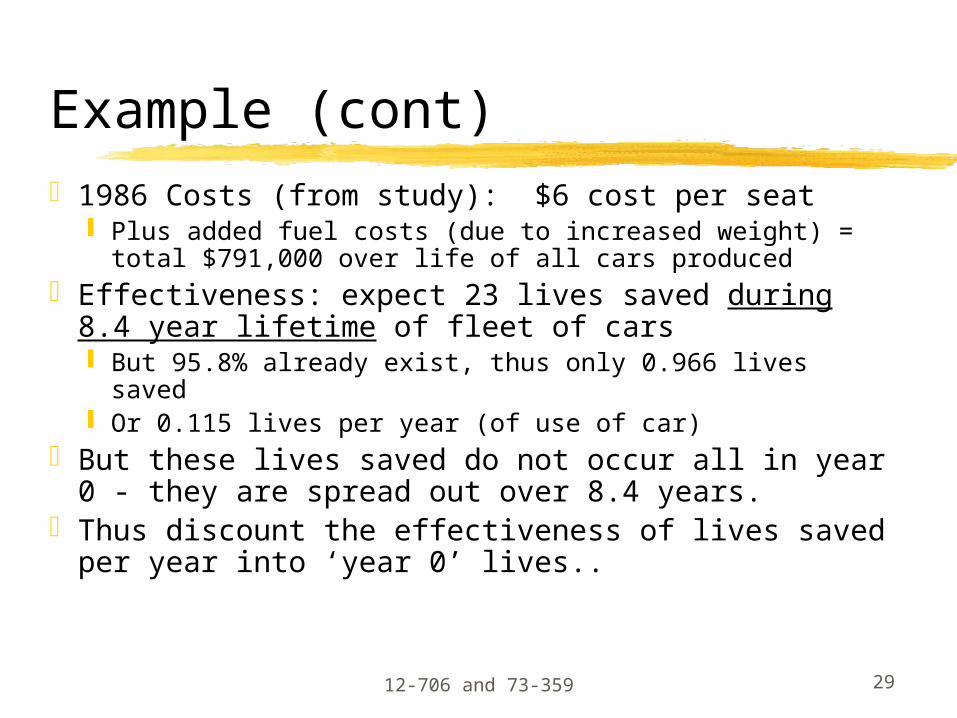
Example (cont)1986 Costs (from study): $6 cost per seat
Plus added fuel costs (due to increased weight) = total $791,000 over life of all cars produced
Effectiveness: expect 23 lives saved during 8.4 year lifetime of fleet of cars But 95.8% already exist, thus only 0.966 lives saved Or 0.115 lives per year (of use of car)
But these lives saved do not occur all in year 0 - they are spread out over 8.4 years.
Thus discount the effectiveness of lives saved per year into ‘year 0’ lives..

12-706 and 73-359 30
Cost per life savedWith a 5% discount rate, the ‘present value’ of
0.115 lives for 9 years = 0.817 (less than 0.966) Discounted lives saved =
This is basically an annuity factorSo cost/life saved = $791,000/0.817
Or $967,700 per life (in “$1986/1986 lives”) Using CPI: 145.8/109.6 -> $1,287,326 in $1993
But this tells us only the cost per life savedWe realistically care more about quality of life,
which suggests using a quality index, e.g. life-years saved.
€
0.115
(1.05) jj=1..9
∑

12-706 and 73-359 31
Sample Life Expectancy Table
35-year old American expected to live 43.6 more years (newer data than our study)
Source: National Center for Health Statistics, http://www.cdc.gov/nchs/fastats/lifexpec.htm

12-706 and 73-359 32
Cost per life-year saved
Assume average age of fatality in car accident was 35 years Life expectancy tables suggested a 35 year old
person would on average live to age 77 Thus ‘42’ life years saved per fatality avoided 1 life-year for 42 yrs @5%= 17.42 years (ann.
factor)$1993 cost/life-year = $1,287,326/17.42
With 2 sig. figures: ~$74,000 as in paper Note $1,287,326 is already in cost/life units ->
just need to further scale for life-years by 17.42
12-706 and 73-359 33
Example 2 - Incremental CE
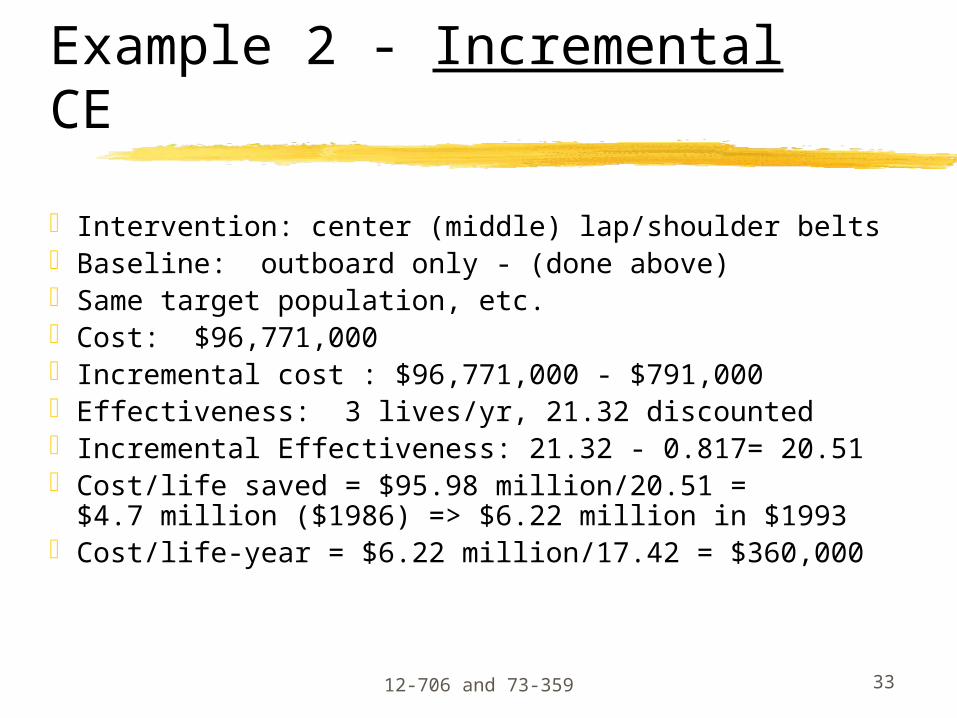
Intervention: center (middle) lap/shoulder belts Baseline: outboard only - (done above)Same target population, etc.Cost: $96,771,000 Incremental cost : $96,771,000 - $791,000Effectiveness: 3 lives/yr, 21.32 discounted Incremental Effectiveness: 21.32 - 0.817= 20.51Cost/life saved = $95.98 million/20.51 =
$4.7 million ($1986) => $6.22 million in $1993Cost/life-year = $6.22 million/17.42 = $360,000
12-706 and 73-359 34
Overall Results in Paper
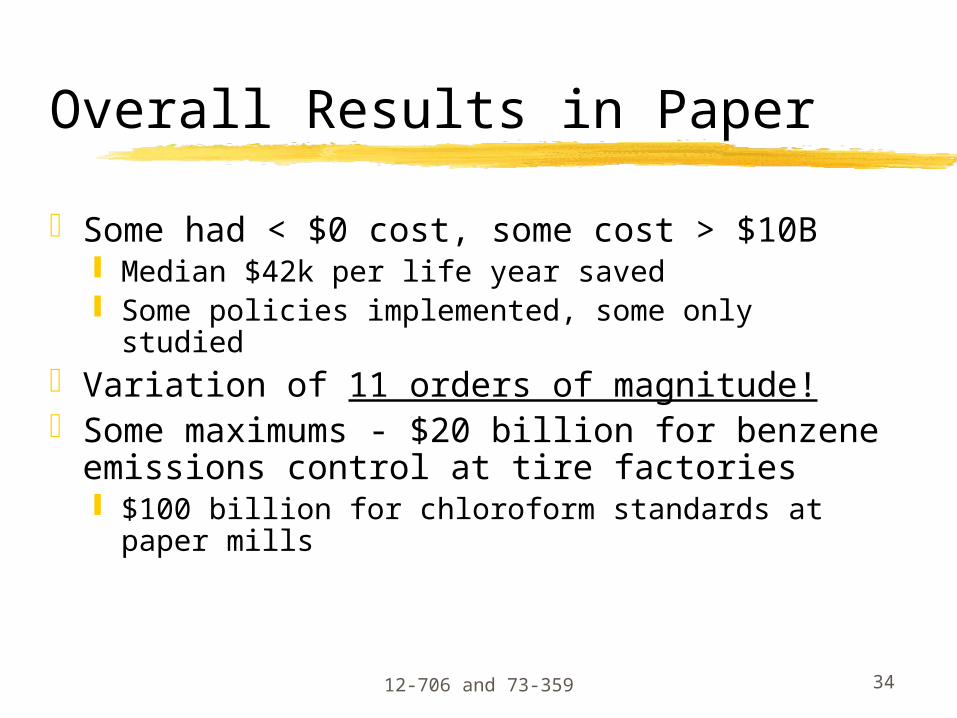
Some had < $0 cost, some cost > $10B Median $42k per life year saved Some policies implemented, some only studied
Variation of 11 orders of magnitude!Some maximums - $20 billion for benzene
emissions control at tire factories $100 billion for chloroform standards at paper
mills

12-706 and 73-359 35
Comparisons
Type of InterventionSector Medicine Fatality
reductionToxincontrol
All
Health Care $19,000(n=310)
N/A N/A $19,000(n=310)
Residential N/A $36,000(n=30)
N/A $36,000(n=30)
Transportation N/A $56,000(n=87)
N/A $56,000
Occupational N/A $68,000(n=16)
$1,400,000(n=20)
$350,000(n=36)
Environmental N/A N/A $4,200,000(n=124)
$4,200,000
All $19,000 $48,000 $2,800,000 $42,000

12-706 and 73-359 36
Agency Comparisons
$1993 Costs per life year saved for agencies:FAA (Aviation): $23,000CPSC (Consumer Products): $68,000NHTSA (Highways): $78,000OSHA (Worker Safety): $88,000EPA (Environment): $7,600,000!Are there underlying causes for range? Hint:
are we comparing apples and oranges?


![Analysis of biomechanical effectiveness of valgus-inducing ...patients with knee osteoarthrit is are fitted with a knee brace [2]. The clinical effectiveness of this medical device](https://static.fdocument.pub/doc/165x107/60bbb573327d9f102a77dd05/analysis-of-biomechanical-effectiveness-of-valgus-inducing-patients-with-knee.jpg)