Strategival vid organisationsförändringar Choosing strategy for ...
Upload
nguyenlienCategory
view
214download
0
Whitehorse Contractors Seminar May 7, 2015
G.Finch - RDH www.rdh.com 1
Choosing Windows for the North
MAY 7, 2015 – WHITEHORSE, YUKON
GRAHAM FINCH, MASC, PENG – PRINCIPAL, BUILDING SCIENCE RESEARCH SPECIALISTRDH BUILDING ENGINEERING LTD. VANCOUVER, BC - [email protected]
Afternoon Agenda
� Luncheon 12:00 to 1:00
� Choosing Windows for the North –
A Balancing Act
� Workshop – 1:00 to 3:00
� Understanding Energy Use in Multi-
Unit Residential Buildings (MURBs) &
Opportunities for Deep Retrofits –
Case Studies and Lessons Learned
from BC
� PNWER Net Zero Study Case Study
Building Discussion

Whitehorse Contractors Seminar May 7, 2015
G.Finch - RDH www.rdh.com 2
Contact Information & Resources
� Presentation Slides will be made available by email
– Fill out information sheet and/or email me
� Graham Finch
� 604-873-1181
Why The Focus on Windows?
� Are a focal architectural and
function part of our homes (views,
daylighting, aesthetics)
� Can be one of the biggest
components of heat loss in a
building
� But they can also gain an
appreciable amount of heat, which
can be good to reduce space-heat
loads – or it can also be bad and
cause overheating and discomfort
� Picking windows is a learned
experience of conflicting priorities
and a fairly technical one at that!

Whitehorse Contractors Seminar May 7, 2015
G.Finch - RDH www.rdh.com 3
The Engineer’s Solutions to Windows!
How Do YOU Pick a Window?
� Frame & Glazing Considerations
� Aesthetics, Colour, Look & Feel?
� Materials?
� Hardware & Accessories?
� Technical Performance &
Specifications?
� Thermal
� Air-tightness
� Water-resistance
� Security
� Condensation Resistance
� Etc.

Whitehorse Contractors Seminar May 7, 2015
G.Finch - RDH www.rdh.com 4
Picking Frames
� Frame Material
� Vinyl
� Aluminium
� Wood
� Fiberglass
� Hybrids
� Dimensions
� Structural Considerations
� Aesthetics
� Thermal Performance (U-value)
� Hardware Integration
� Installation Method
Picking Glazing
� Insulated Glazing Units (IGUs)
� Double/Triple/Quad Glazing
� Inert Gas Fill (Air, Argon, Xenon,
Krypton)
� Aesthetics
� Colour (Clear, Green, Blue etc.)
� Clarity (Visible Light Transmission,
VLT)
� Reflection
� Technical Specifications
� U-value
� Solar Heat Gain Coefficient (SHGC)
� UV Resistance
� Spacer Bars/Edge Seals

Whitehorse Contractors Seminar May 7, 2015
G.Finch - RDH www.rdh.com 5
Insulating Glazing Units (IGUs)
IGU Components:
1. Surface 1 (exterior)
2. Surface 2 (interior side
of exterior lite)
3. Surface 3 (exterior side
of interior lite)
4. Surface 4
5. Low-e coating
6. Edge spacer (separate
glass panes)
7. Desiccant (to dry air)
8. Primary edge seal
(vapor)
9. Secondary edge seal
(structure)
Airspace(s)
With triples – add in surfaces 5&6With quads – add in surfaces 7&8
Wading through the Technical Specs of IGUs
Indoor
Trans. UV Tdw
Clear % % Out % In SHGC SC Air Argon WinterSummer Trans ISO/CIE
Clear IG 82% 15% 15% 0.78 0.89 0.48 0.46 45 90 58% 75%
LoE Products - Sputtered
Cardinal LoE²-272 #2 (e=.041) 72% 11% 12% 0.41 0.47 0.30 0.25 56 84 16% 55%
Cardinal LoE²-272 #3 (e=.041) 72% 12% 11% 0.50 0.57 0.30 0.25 56 98 16% 55%
Cardinal LoE²-270 #2 (e=.036) 70% 12% 13% 0.37 0.42 0.29 0.25 56 93 14% 53%
Cardinal LoE²-270 #3 (e=.036) 70% 13% 12% 0.45 0.53 0.29 0.25 56 99 14% 53%
Cardinal LoE3-366 #2 (e=.022) 65% 11% 12% 0.27 0.31 0.29 0.24 56 83 5% 43%
Cardinal LoE3-366 #3 (e=.022) 65% 12% 11% 0.39 0.45 0.29 0.24 56 101 5% 43%
PPG SolarBan 60#2 (e=.043) 71% 12% 13% 0.39 0.45 0.30 0.25 56 95 16% 53%
Viracon VE-2000 #2(e=.040) 72% 11% 12% 0.38 0.44 0.26 0.25 56 84 11% 52%
Guardian Perf. Plus ll #2(e=.044) 69% 19% 17% 0.41 0.47 0.30 0.25 56 65 20% 50%
AFG Comfort TIAC #2(e=.036) 62% 23% 29% 0.40 0.46 0.29 0.25 56 85 30% 51%
AFG Comfort TIR #2(e=.034) 71% 21% 19% 0.47 0.54 0.29 0.25 56 85 30% 57%
AFG Comfort TIPS #3(e=.047) 77% 13% 14% 0.60 0.69 0.30 0.25 56 94 33% 63%
LoE Products - Pyrolytic
AFG Comfort E2 #3 (e=.204) 76% 16% 14% 0.73 0.85 0.35 0.31 53 101 44% 64%
Pilk/LOF Energy Adv. #3,(e=.153) 75% 18% 17% 0.72 0.82 0.33 0.29 54 100 45% 65%
Pilk/LOF Solar E #2(e=.153) 54% 10% 16% 0.48 0.55 0.33 0.29 54 91 40% 52%
PPG Sungate 500 #3,(e=.215) 76% 18% 17% 0.71 0.81 0.35 0.31 52 99 49% 66%
PPG Sungate 300 #3 (e=.324) 76% 18% 18% 0.71 0.82 0.38 0.34 51 96 56% 66%
Glass Temp (F)(Btu/hr/ft²/°F)
Center of Glass
U-Factor
Reflectance
Visible Light
Whitehorse Contractors Seminar May 7, 2015
G.Finch - RDH www.rdh.com 6
Triples & Quads
� More airspaces – lower (better) U-
values
� Argon consistently makes sense to
incorporate and minimal cost to do so
� More glass – lower SHGC values
� Fundamental law with stacking layers
of glass together, even clear non-low-
e, unless you use optically clear glass,
$$
� Low-e coatings typically put on inner
and outer panes of glass
� Concerns with glass breakage
increases with more layers of glass –
watch placement of low-e
� From experience – glass is better
than thin suspended plastic films
Free program by LBNL, called WINDOW allows you to design your own IGUs and get all of the optical properties
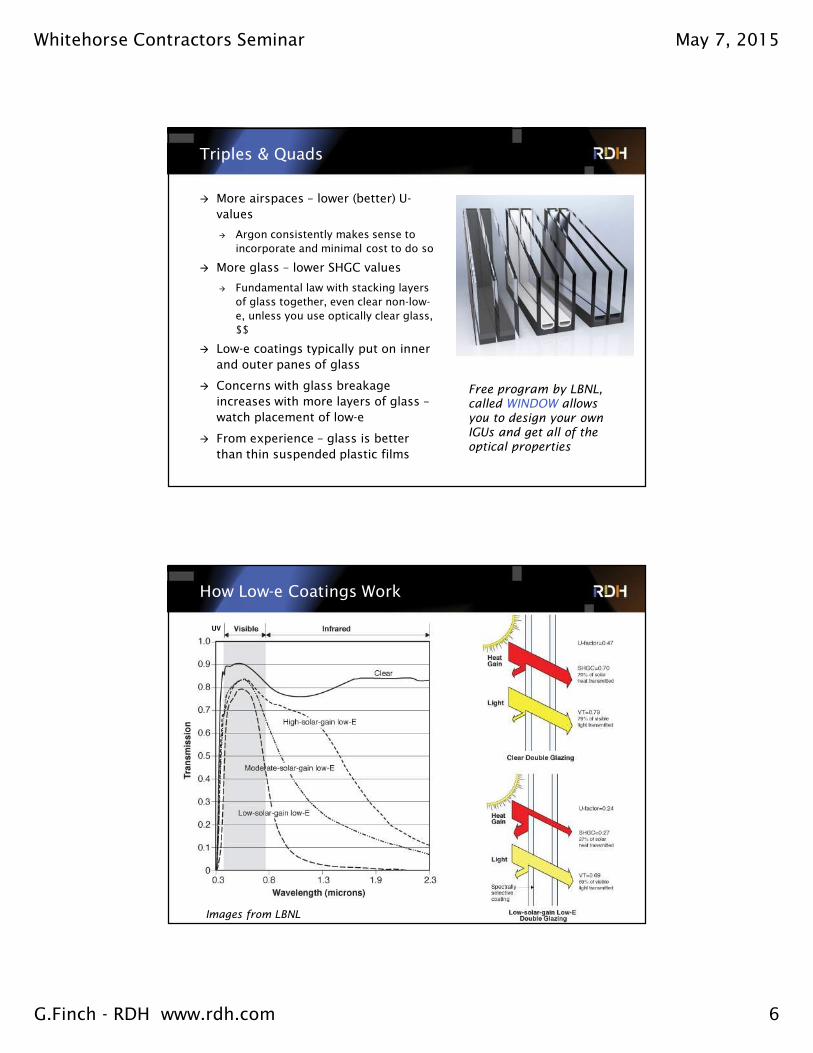
How Low-e Coatings Work
UV
Images from LBNL

Whitehorse Contractors Seminar May 7, 2015
G.Finch - RDH www.rdh.com 7
Hard Coat vs. Soft Coat Low-e Coatings
� Both thin metal films (silver,
tin,stainless steel etc.) & anti-
reflective metal-oxide films
applied to glass
� Hard coat (pyrolytic) applied
during float process of making
glass
� Tends to result in higher SHGC
but lower thermal performance
(higher U-values)
� Soft coat (sputtered) applied to
glass anytime
� Tends to result in lower SHGC
but better thermal performance
� Newer coatings can get best of
both worlds high SGHC, high
thermal performance Images from PPG
Aesthetics, Colour, & Reflection

Whitehorse Contractors Seminar May 7, 2015
G.Finch - RDH www.rdh.com 8
Visible Light Transmission
� Visible Light Transmission (VLT) is the visible light
spectrum that is transmitted through the glazing unit
� Important in day-lighting and glare control
� Typical range of 30-70%, optimum depends on use of
space and window to wall ratio
Solar Heat Gain Coefficient (SHGC)
� SHGC is the percentage of total
solar radiation transmitted as heat-
gain through an IGU (window)
� SHGC of 0.45 means 45%
transferred to interior (directly by
short wave radiation and indirectly
by absorption and long-wave
radiation)
� Rest is reflected or absorbed and re-
radiated back out
� Too high can cause over-heating
with too much glass
� Too low can limit amount of “free”
heat gain often beneficial in
heating climates
SHGC for a window includes the frames, hence why operable windows have lower SHGCs overall
Whitehorse Contractors Seminar May 7, 2015
G.Finch - RDH www.rdh.com 9
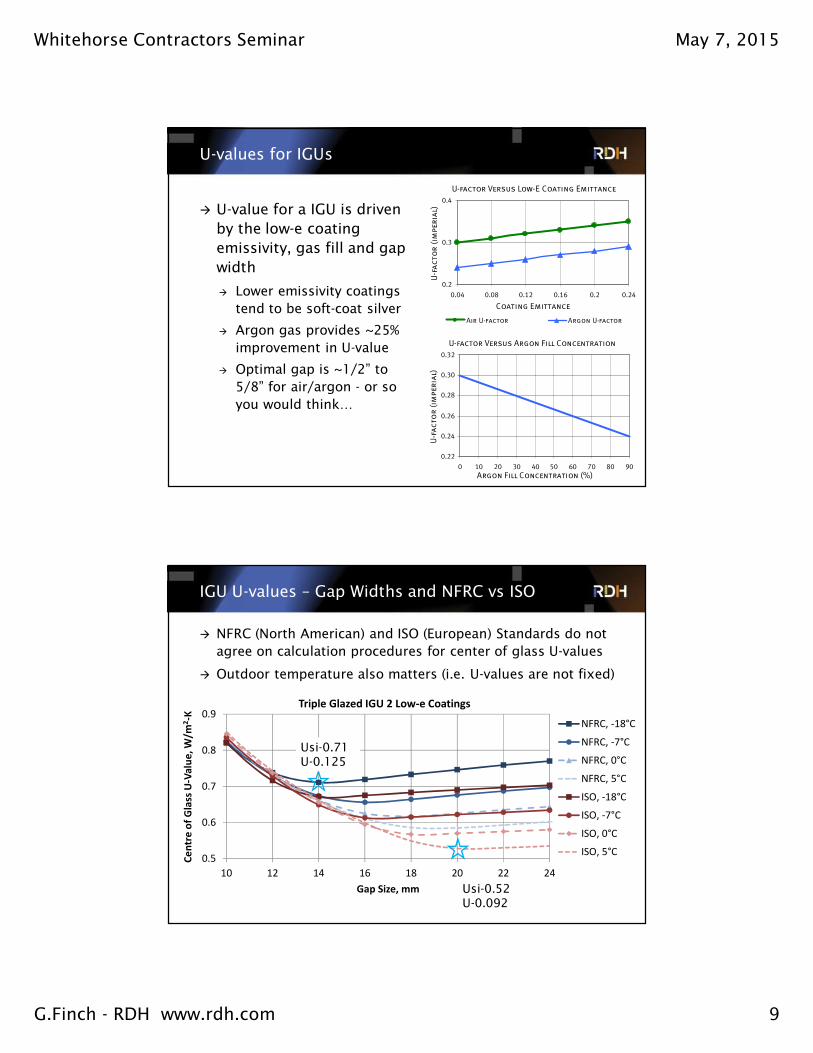
U-values for IGUs
� U-value for a IGU is driven
by the low-e coating
emissivity, gas fill and gap
width
� Lower emissivity coatings
tend to be soft-coat silver
� Argon gas provides ~25%
improvement in U-value
� Optimal gap is ~1/2” to
5/8” for air/argon - or so
you would think…
U-factor Versus Low-E Coating Emittance
0.2
0.3
0.4
0.04 0.08 0.12 0.16 0.2 0.24
Coating Emittance
U-factor (im
peria
l)
Air U-factor Argon U-factor
U-factor Versus Argon Fill Concentration
0.22
0.24
0.26
0.28
0.30
0.32
0 10 20 30 40 50 60 70 80 90
Argon Fill Concentration (%)
U-facto
r (im
peria
l)
IGU U-values – Gap Widths and NFRC vs ISO
� NFRC (North American) and ISO (European) Standards do not
agree on calculation procedures for center of glass U-values
� Outdoor temperature also matters (i.e. U-values are not fixed)
0.5
0.6
0.7
0.8
0.9
10 12 14 16 18 20 22 24
Ce
ntr
e o
f G
lass
U-V
alu
e,
W/m
2-K
Gap Size, mm
NFRC, -18°C
NFRC, -7°C
NFRC, 0°C
NFRC, 5°C
ISO, -18°C
ISO, -7°C
ISO, 0°C
ISO, 5°C
Usi-0.71U-0.125
Usi-0.52U-0.092
Triple Glazed IGU 2 Low-e Coatings

Whitehorse Contractors Seminar May 7, 2015
G.Finch - RDH www.rdh.com 10
Overall Window U-values
Window U-value =
Frame U-value x
% Frame Area
+
Center of Glass U-value x
% Glass Area
+
Edge of Glass U-value x
% Edge of Glass Area
Overall R-value =
1/U-value
Center of Glazing
U-value
Frame U-value
(Operable & Fixed Frames)
Edge of Glazing
U-value
IGU Spacer Bars
� Lots of options – look for
lower conductivity & dual
edge seal technology
� PIB primary seal
(vapour), silicone
secondary seal
(structural) work well
� Not all created equal

Whitehorse Contractors Seminar May 7, 2015
G.Finch - RDH www.rdh.com 11
Conduction through IGU Spacer Bars
Failed IGUs from Bad Spacer Bar Choices

Whitehorse Contractors Seminar May 7, 2015
G.Finch - RDH www.rdh.com 12
Condensation & Frost Prevention
� Condensation/frost occurs when
the surface temperature of the
window drops below the
dewpoint temperature of the
surrounding air
� Causes:
� Inadequate window frames or
IGU spacer bars for climate
� Curtains/inadequate airflow at
interior of glazing/frame
� Poor installation of window
frame and thermal bridging
� Too high of an indoor dewpoint
� Bad HVAC design, not enough
heat or air
Condensation & Frost due to Hardware Problems

Whitehorse Contractors Seminar May 7, 2015
G.Finch - RDH www.rdh.com 13
Window Frame Design & Condensation Risk
� Every window has a slightly different condensation
potential & many factors involved
� More conductive frame materials tend to be colder, but
also bring heat from the frame to the edge glass
� Massing of frame material inboard or outboard of thermal
break or IGU matters
� Operable units tend to perform worse than fixed units
(frame profile & air leakage)
� IGU spacer bars matter for edge of glass & frame
temperatures
� Glazing stop material also matters
� Glazing matters – double vs triple glazing, low-e coating
location, and interior surface low-e coatings
� Placement of window in rough opening can be as
powerful of impact
Frame Profile/Massing & Condensation Potential
Exterior -18°C Interior 21°C
1.7°C
11.4°C
5.0°C
5.3°C
4.3°C
7.4°C
Whitehorse Contractors Seminar May 7, 2015
G.Finch - RDH www.rdh.com 14
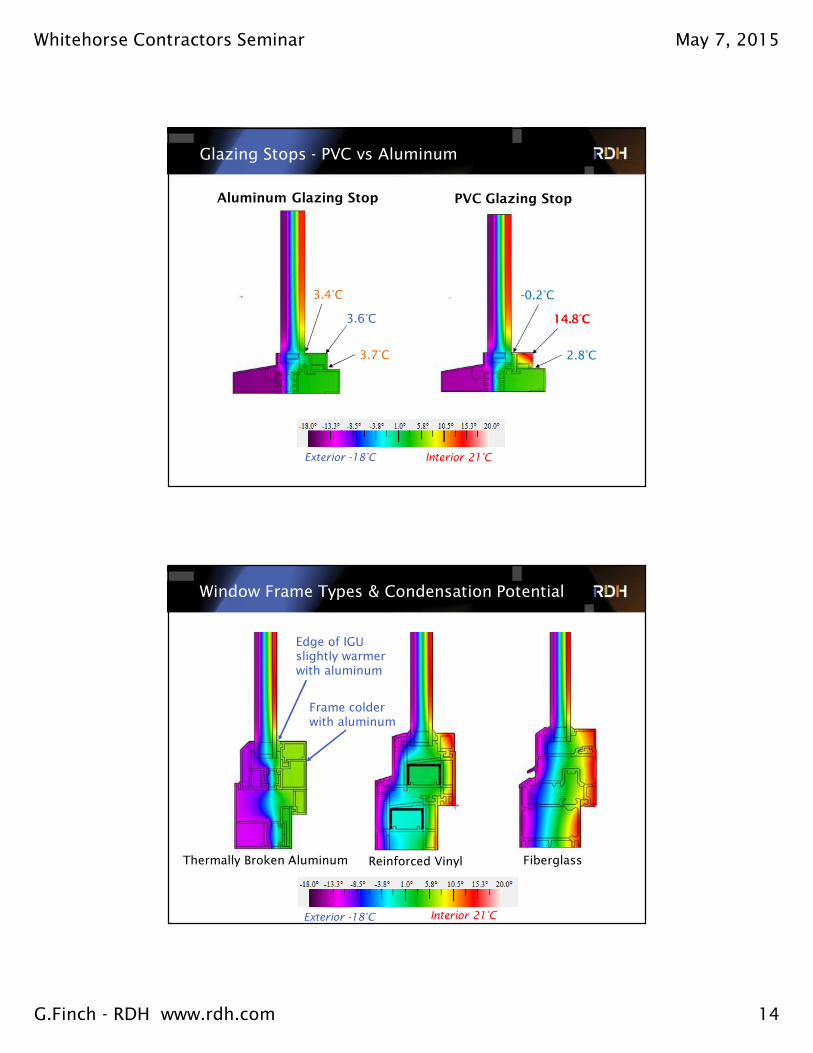
Glazing Stops - PVC vs Aluminum
-0.2°C
2.8°C
PVC Glazing StopAluminum Glazing Stop
14.8°C
3.4°C
3.7°C
3.6°C
Exterior -18°C Interior 21°C
Window Frame Types & Condensation Potential
Thermally Broken Aluminum Reinforced Vinyl Fiberglass
Exterior -18°C Interior 21°C
Edge of IGU slightly warmer with aluminum
Frame colder with aluminum

Whitehorse Contractors Seminar May 7, 2015
G.Finch - RDH www.rdh.com 15
Wood vs Aluminum Curtainwall – Subtle Tradeoffs
-1.9°C
5.1°C
Frame = R-2.6
Frame = R-2.0
Exterior -18°C Interior 21°C
wood Warmer frame
Colder frame
Double vs. Triple Glazing
8.9°C2.6°C
Exterior -18°C Interior 21°C Exterior -18°C Interior 21°C

Whitehorse Contractors Seminar May 7, 2015
G.Finch - RDH www.rdh.com 16
Condensation on the Exterior of Windows
Rating Condensation Resistance of Windows
� Temperature Index (I-value) – CSA A440
� Measured in Lab – coldest location
� Is value that can also be checked in the field - preferred
� Condensation Resistance Factor (CRF) – AAMA
� Measured in Lab – weighted cold location (relative metric)
� Condensation Resistance (CR) – NFRC
� Simulated – weighted factor accounting for range of indoor
RH levels (30,50,70%) and fixed outdoor conditions
� All factors are different and cannot be correlated
� In all cases a higher number means a better product
with lower potential for condensation
Whitehorse Contractors Seminar May 7, 2015
G.Finch - RDH www.rdh.com 17
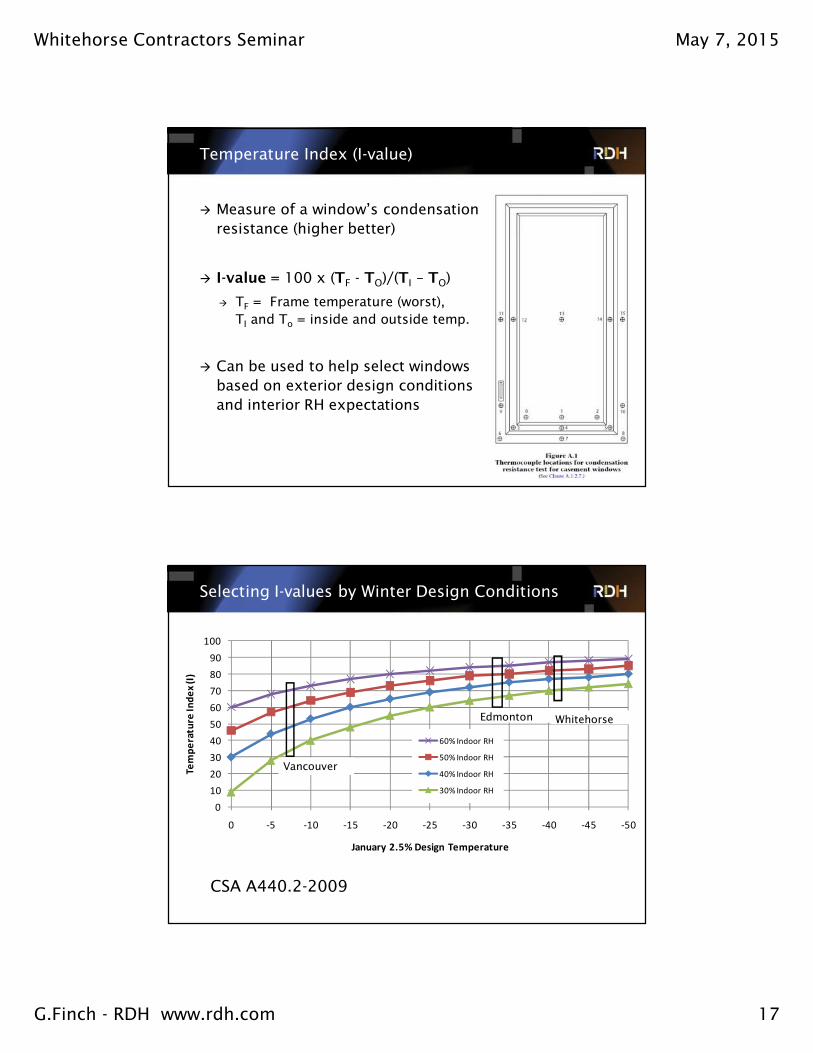
Temperature Index (I-value)
� Measure of a window’s condensation
resistance (higher better)
� I-value = 100 x (TF - TO)/(TI – TO)
� TF = Frame temperature (worst),
TI and To = inside and outside temp.
� Can be used to help select windows
based on exterior design conditions
and interior RH expectations
Selecting I-values by Winter Design Conditions
0
10
20
30
40
50
60
70
80
90
100
0 -5 -10 -15 -20 -25 -30 -35 -40 -45 -50
Tem
pe
ratu
re I
nd
ex
(I)
January 2.5% Design Temperature
60% Indoor RH
50% Indoor RH
40% Indoor RH
30% Indoor RH
Edmonton Whitehorse
Vancouver
CSA A440.2-2009

Whitehorse Contractors Seminar May 7, 2015
G.Finch - RDH www.rdh.com 18
Other Considerations - Window Air-Leakage Rates
� Leakage occurs at frame joints/glazing interfaces,
gaskets & operable hardware
� Air leakage ratings in CSA A440-00 and NAFS-08
Window Rating
CSA A440-00 NAFS-08
Max air leakage rate, m3/h/m
Max air leakage rate, converted
to L/s/m2
(NFRC Standard Size Window)
Max air leakage rate for R Class,
L/s/m2
A1 2.79 1.86 n/a
A2 1.65 1.10 1.5
A3 0.55 0.37 0.5
Fixed 0.25 0.17 0.2
Window ER Study – Selecting Optimal Windows to Balance Energy Savings & Thermal Comfort

Whitehorse Contractors Seminar May 7, 2015
G.Finch - RDH www.rdh.com 19
Window ER Study Research
� Canada-wide study of the Energy
Rating (ER) for windows
� Single rating for a window based
on U-value, solar heat gain
coefficient, and air leakage
� Research study goals
� Assess how well the ER rating as a
single metric is at helping users
pick the most energy efficient
window for their home
� Understand how comfort may be
positively or negatively affected
� Understand differences between
Canadian & International standards
Download full report at www.rdh.com
What is the ER Calculation
� Calculation given in CSA A440.2, for low-rise residential
� ER Equation:
� Simplified Equation:
Solar Heat Gain Conduction Air Leakage

Whitehorse Contractors Seminar May 7, 2015
G.Finch - RDH www.rdh.com 20
How the ER Works
The ER & Energy Star® Program

Whitehorse Contractors Seminar May 7, 2015
G.Finch - RDH www.rdh.com 21
The ER & The Building Code (Part 9.36)
Zone 4 Zone 5 Zone 6 Zone 7a
Zone 7b
Zone 8
HDD <3000 3000 to 3999
4000 to 4999
5000 to 5999
6000 to 6999
≥7000
Max U-Value, Btu/h-ft2-F (W/m2-K)
0.32(1.8)
0.32(1.8)
0.28(1.6)
0.28(1.6)
0.25(1.4)
0.25(1.4)
MinimumER
21 21 25 25 29 29
Window Selection for Energy & Thermal Comfort
� Winter Goals
� Minimize heating energy
� Improve thermal comfort by
reducing cold surfaces
� Low U-values, High SHGC
� Summer & Swing Season Goals
� Minimize overheating to
prevent or reduce cooling
needs
� Improve thermal comfort by
reducing surface temperatures
and indoor gains
� U-values not as important,
Lower SHGC

Whitehorse Contractors Seminar May 7, 2015
G.Finch - RDH www.rdh.com 22
How to Optimize Window Selection – Modeling Tools
� Hourly energy simulations
performed using the program
DesignBuilder (EnergyPlus
engine)
� 10 different archetype houses –
sizes, enclosures, etc.
� Representative cities & climate
zones across Canada
� 23 different window types
selected - investigate wide range
of different combinations of
U-values and SHGCs (ER value)
� Orientation, WWR, Shades etc. all
evaluated
Northern Cities
0
5
10
15
20
25
30
Jan
Fe
b
Ma
r
Ap
r
Ma
y
Jun
Jul
Au
g
Se
p
Oct
No
v
De
c
So
lar
Ra
dia
tio
n (
MJ/
m²/
da
y)
Month
Average Monthly Global Solar Radiation for Canadian CitiesSt. John's
Halifax
Fredericton
Quebec City
Montreal
Ottawa
Toronto
Windsor
Timmins
Winnipeg
Regina
Calgary
Edmonton
Kelowna (Summerland)
Prince George
Prince Rupert
Vancouver
Victoria
Yellowknife
Whitehorse
Iqaluit
0
5
10
15
20
25
Jan
Fe
b
Ma
r
Ap
r
Ma
y
Jun
Jul
Au
g
Se
p
Oct
No
v
De
c
So
lar
Ra
dia
tio
n (
MJ/
m²/
da
y)
Month
Average Monthly Global Solar Radiation, >6500 HDD
Yellowknife
Whitehorse
Iqaluit

Whitehorse Contractors Seminar May 7, 2015
G.Finch - RDH www.rdh.com 23
General Findings – Energy Use Sorted by ER
� Generally higher ER results in lower heating energy
consumption, but not always (SHGC biggest variable)
W19 (ER 32) – Triple Glazed U-0.16, SHGC 0.2 (Low)W15 (ER 49) – Triple Glazed U-0.16, SHGC 0.5 (High)
Same U-value Triple, higher ER, higher SHGC lower energy use in all cities
Heating Energy Consumption – 10 Different Archetypes, Yellowknife
-
10,000
20,000
30,000
40,000
50,000
60,000
70,000
W01
(-39)
W11
(8)
W12
(13)
W02
(14)
W08
(17)
W13
(19)
W03
(22)
W09
(22)
W18
(25)
W05
(26)
W10
(28)
W20
(29)
W06
(30)
W19
(32)
W04
(34)
W16
(34)
W07
(37)
W17
(41)
W23
(42)
W14
(43)
W15
(49)
W22
(50)
W21
(59)
An
nu
al H
ea
tin
g E
ne
rgy
(k
Wh
e)
Window Type (Ordered by Increasing ER)
A10
A9
A8
A2
A1
A6
A5
A4
A3
A7
Ho
use
Arc
he
typ
e
W19 (ER 32) – Triple Glazed U-0.16, SHGC 0.2W15 (ER 49) – Triple Glazed U-0.16, SHGC 0.5

Whitehorse Contractors Seminar May 7, 2015
G.Finch - RDH www.rdh.com 24
Heating Energy Consumption – Impact of WWR, Yellowknife
14,000
16,000
18,000
20,000
22,000
24,000
26,000
28,000
30,000
32,000
34,000
36,000
W01
(-39)
W11
(8)
W12
(13)
W02
(14)
W08
(17)
W13
(19)
W03
(22)
W09
(22)
W18
(25)
W05
(26)
W10
(28)
W20
(29)
W06
(30)
W19
(32)
W04
(34)
W16
(34)
W07
(37)
W17
(41)
W23
(42)
W14
(43)
W15
(49)
W22
(50)
W21
(59)
An
nu
al H
ea
tin
g E
ne
rgy,
kW
he
Window Type (Ordered by Increasing ER)
5% WWR
10% WWR
15% WWR
20% WWR
25% WWR
30% WWR
W19 (ER 32) – Triple Glazed U-0.16, SHGC 0.2W15 (ER 49) – Triple Glazed U-0.16, SHGC 0.5
Heating Energy Consumption – Impact of Window Orientation, Yellowknife
15,000
17,000
19,000
21,000
23,000
25,000
27,000
29,000
31,000
33,000
W01
(-39)
W11
(8)
W12
(13)
W02
(14)
W08
(17)
W13
(19)
W03
(22)
W09
(22)
W18
(25)
W05
(26)
W10
(28)
W20
(29)
W06
(30)
W19
(32)
W04
(34)
W16
(34)
W07
(37)
W17
(41)
W23
(42)
W14
(43)
W15
(49)
W22
(50)
W21
(59)
An
nu
al
He
ati
ng
En
erg
y C
on
sum
pti
on
, k
Wh
e
Window Type (Ordered by Increasing ER)
Equal
North
South
East
West
North-South
East-West
For scenarios with windows facing predominantly one direction, a 45% WWR was used
in that direction versus 5% WWR in the other directions.
For scenarios with windows facing predominantly two directions (north-south and
east-west), a 25% WWR was used in the predominant directions and 5% WWR in the
opposite directions.
W19 (ER 32) – Triple Glazed U-0.16, SHGC 0.2W15 (ER 49) – Triple Glazed U-0.16, SHGC 0.5
Whitehorse Contractors Seminar May 7, 2015
G.Finch - RDH www.rdh.com 25
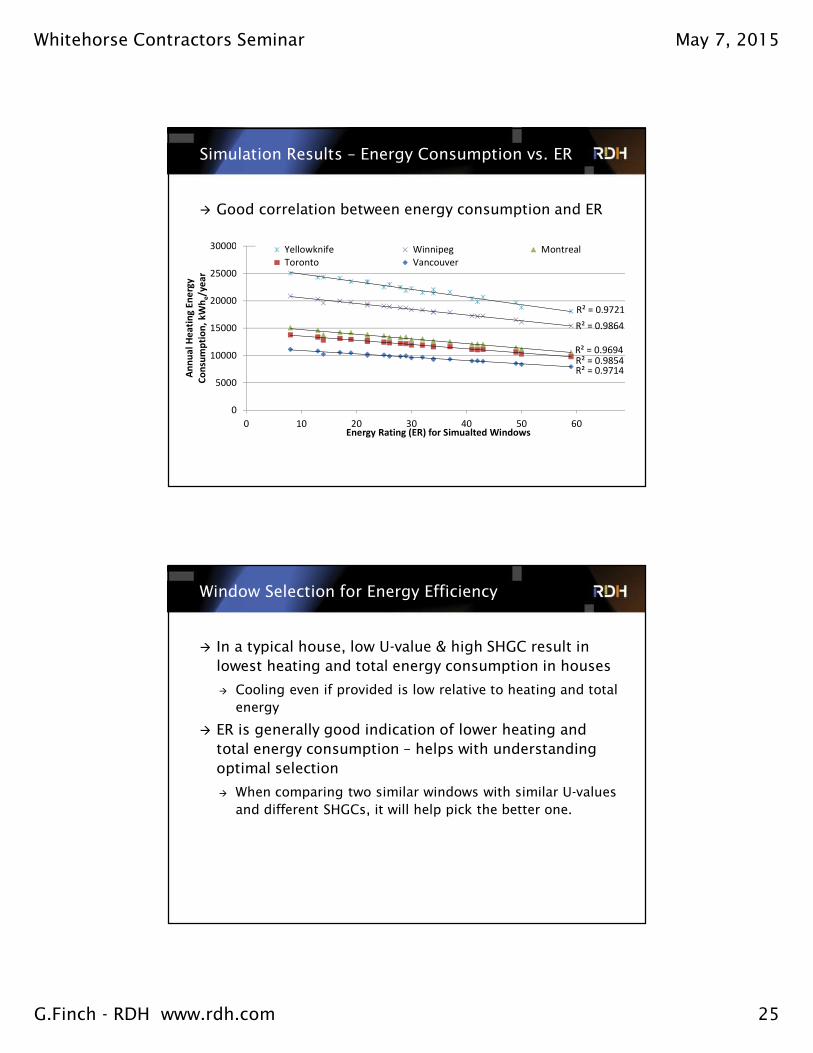
Simulation Results – Energy Consumption vs. ER
� Good correlation between energy consumption and ER
R² = 0.9721
R² = 0.9864
R² = 0.9694R² = 0.9854R² = 0.9714
0
5000
10000
15000
20000
25000
30000
0 10 20 30 40 50 60
An
nu
al
He
ati
ng
En
erg
y
Co
nsu
mp
tio
n,
kW
he/y
ea
r
Energy Rating (ER) for Simualted Windows
Yellowknife Winnipeg Montreal
Toronto Vancouver Linear (Yellowknife)
Window Selection for Energy Efficiency
� In a typical house, low U-value & high SHGC result in
lowest heating and total energy consumption in houses
� Cooling even if provided is low relative to heating and total
energy
� ER is generally good indication of lower heating and
total energy consumption – helps with understanding
optimal selection
� When comparing two similar windows with similar U-values
and different SHGCs, it will help pick the better one.

Whitehorse Contractors Seminar May 7, 2015
G.Finch - RDH www.rdh.com 26
Window Selection for Thermal Comfort
� How to “measure” thermal comfort?
� ASHRAE Standard 55: Thermal Comfort Conditions for
Human Occupancy
� 6 Primary factors that affect thermal comfort:
� Air temperature
� Radiant Surface Temperature
� Humidity
� Air Speed
� Metabolic Rate
� Clothing Insulation
Window Selection for Thermal Comfort
� Operative Temperature: Balance of window surface
temperature and air temperature
� ASHRAE acceptable range of operative temperature
based on research studies

Whitehorse Contractors Seminar May 7, 2015
G.Finch - RDH www.rdh.com 27
Window Selection for Thermal Comfort
� Hourly Energy Simulations –
extract window surface
temperature, air temperature,
operative temperatures
� Defined comfort parameters:
� Operative temperature 19°C to
25°C
� Surface temperature 15°C to 30°C
� Count number of hours outside
this range (4 orientations so
maximum hours per year =
4*8760 = 35040)
Window Surface Temperature & Operative Temperature Results, Yellowknife (Bedroom)

Whitehorse Contractors Seminar May 7, 2015
G.Finch - RDH www.rdh.com 28
Window Surface Temperatures – Too Cold
W19 (ER 32) – Triple Glazed U-0.16, SHGC 0.2 (Low SHGC)W15 (ER 49) – Triple Glazed U-0.16, SHGC 0.5 (High Solar)
Operative Temperature – Too Cold
W19 (ER 32) – Triple Glazed U-0.16, SHGC 0.2 (Low SHGC)W15 (ER 49) – Triple Glazed U-0.16, SHGC 0.5 (High Solar)
Whitehorse Contractors Seminar May 7, 2015
G.Finch - RDH www.rdh.com 29
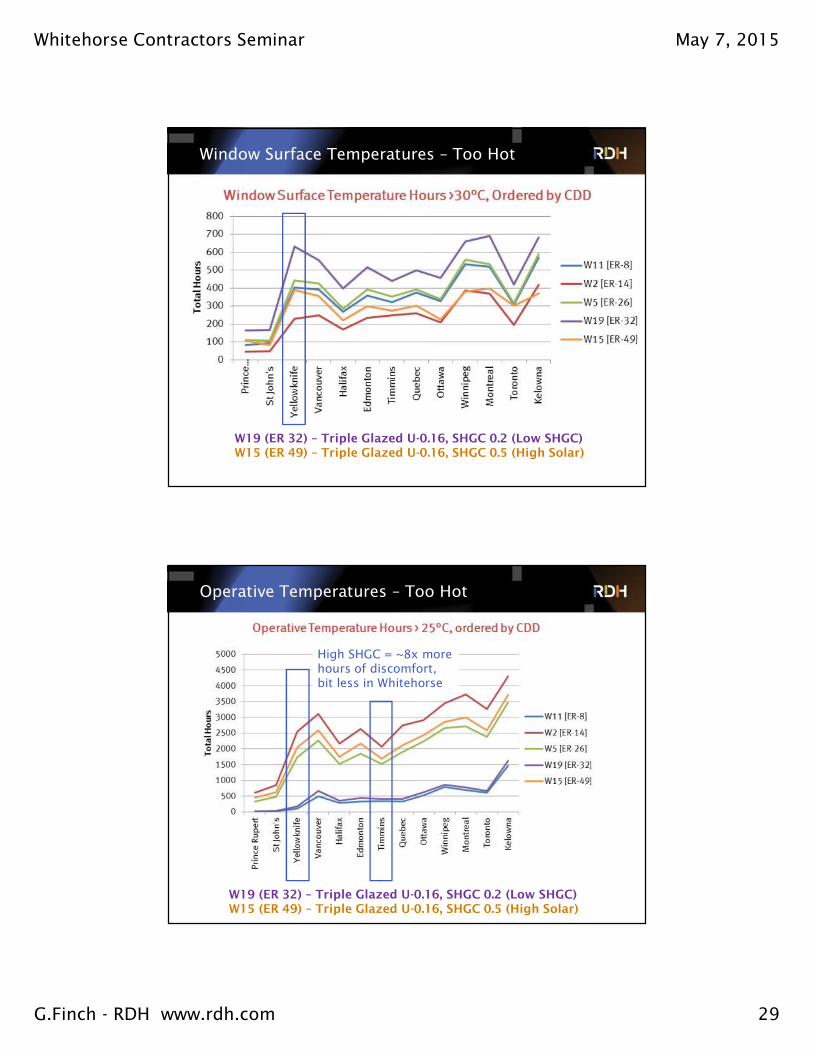
Window Surface Temperatures – Too Hot
W19 (ER 32) – Triple Glazed U-0.16, SHGC 0.2 (Low SHGC)W15 (ER 49) – Triple Glazed U-0.16, SHGC 0.5 (High Solar)
Operative Temperatures – Too Hot
W19 (ER 32) – Triple Glazed U-0.16, SHGC 0.2 (Low SHGC)W15 (ER 49) – Triple Glazed U-0.16, SHGC 0.5 (High Solar)
High SHGC = ~8x more hours of discomfort, bit less in Whitehorse

Whitehorse Contractors Seminar May 7, 2015
G.Finch - RDH www.rdh.com 30
Choosing Windows for Thermal Comfort
� Low U-value improves surface temperatures, particularly
in the winter
� Low SHGC reduces overheating
� Consider whether overheating is a concern
� ER may or may not result in more overheating, better to
review SHGC than rely on ER alone
� Also consider project-specific conditions
� Exterior shading (trees, shades etc)
� Orientation
� Window to Wall Ratio
Overall Window Selection for Houses
� Always look for the lowest possible U-value
� Wide range of glazing available means large selection of
low/high SHGC products with good U-values
� Evaluate an appropriate SHGC based on project specific
conditions
� If overheating is not a concern, use a high SHGC window
(e.g. if there is good exterior shading)
� If overheating may be a concern, consider a low SHGC
window
� When in doubt – modeling is a very useful tool for
window optimization – every project is unique
Whitehorse Contractors Seminar May 7, 2015
G.Finch - RDH www.rdh.com 31
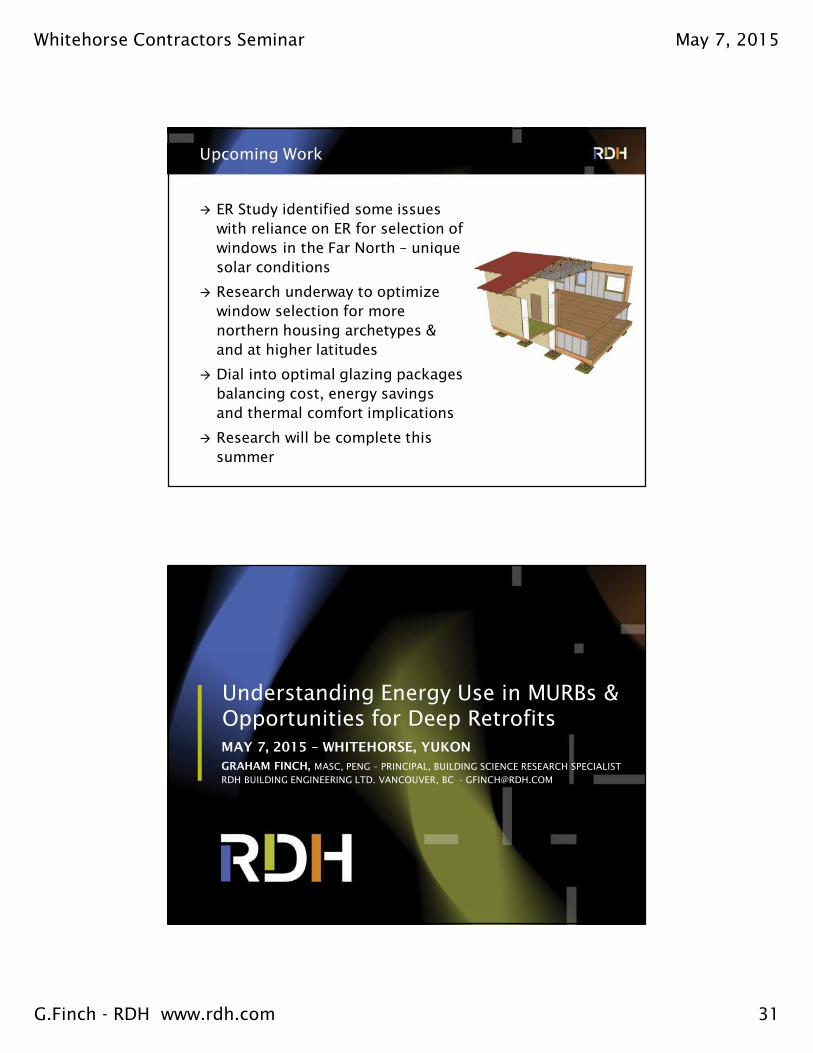
Upcoming Work
� ER Study identified some issues
with reliance on ER for selection of
windows in the Far North – unique
solar conditions
� Research underway to optimize
window selection for more
northern housing archetypes &
and at higher latitudes
� Dial into optimal glazing packages
balancing cost, energy savings
and thermal comfort implications
� Research will be complete this
summer
Understanding Energy Use in MURBs & Opportunities for Deep RetrofitsMAY 7, 2015 – WHITEHORSE, YUKON
GRAHAM FINCH, MASC, PENG – PRINCIPAL, BUILDING SCIENCE RESEARCH SPECIALISTRDH BUILDING ENGINEERING LTD. VANCOUVER, BC - [email protected]
Whitehorse Contractors Seminar May 7, 2015
G.Finch - RDH www.rdh.com 32
Presentation Outline� Energy use on Multi-Unit Residential Buildings
� Case Study:
� Deep Energy Retrofit of a High-Rise MURB
� Monitoring of Energy Savings
� Monitoring of Indoor Environmental Conditions
& understanding Airflow and Ventilation
Problems within MURBs
Understanding Energy use in Multi-Unit Residential Buildings
Whitehorse Contractors Seminar May 7, 2015
G.Finch - RDH www.rdh.com 33
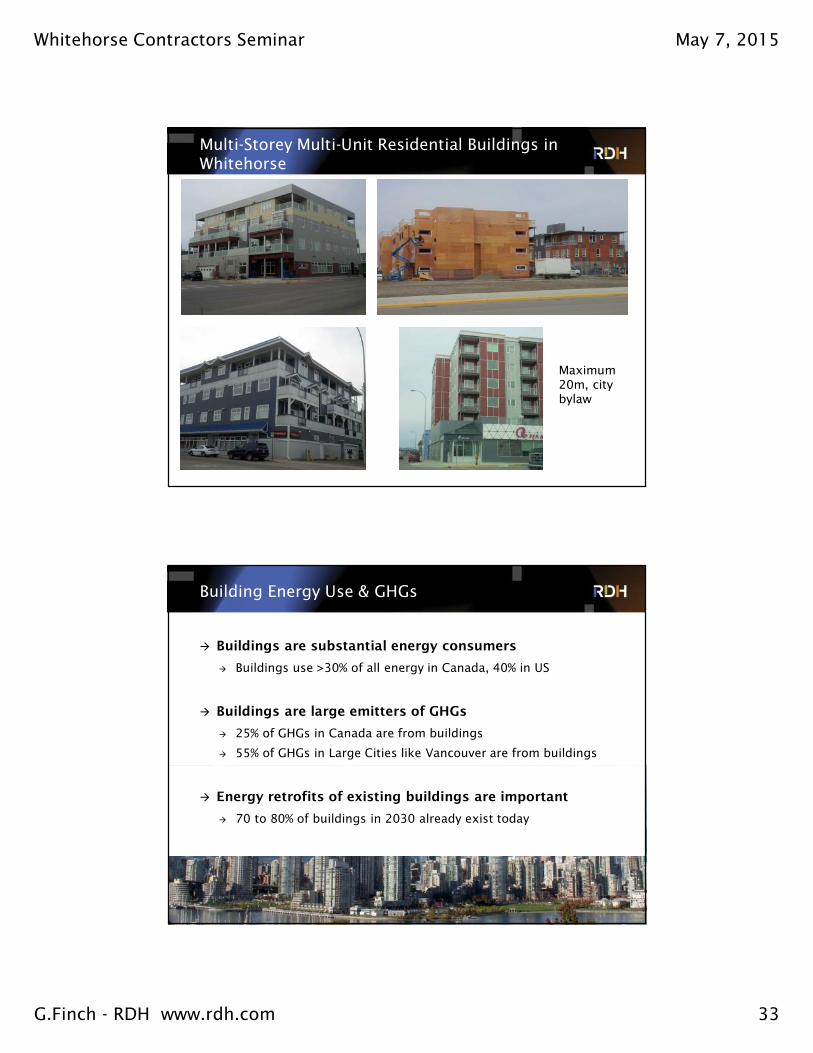
Multi-Storey Multi-Unit Residential Buildings in Whitehorse
Maximum 20m, city bylaw
Building Energy Use & GHGs
� Buildings are substantial energy consumers
� Buildings use >30% of all energy in Canada, 40% in US
� Buildings are large emitters of GHGs
� 25% of GHGs in Canada are from buildings
� 55% of GHGs in Large Cities like Vancouver are from buildings
� Energy retrofits of existing buildings are important
� 70 to 80% of buildings in 2030 already exist today

Whitehorse Contractors Seminar May 7, 2015
G.Finch - RDH www.rdh.com 34
Why Multi-Unit Residential Buildings?
� Significant and Growing Proportion of the Housing Stock
� Many Important Challenges & Features
› Split Incentives (only 1/3 of energy bills paid directly by owners),
mix of gas/electricity suites/common areas which no-one is
looking at together
› Complicated Building Forms & poor thermal performance
(Windows, balconies, height, etc)
› Utilities are Significant Portion of Operating Costs
30%
10%
10%20%
10%
20% Maintenance
Repairs
Capital Reserve
Insurance & Admin
Staffing & Misc
Utilities
Why Now?
� Large opportunity to impact building stock is coming up
� Buildings from late 80’s and early 90’s will need renewals work
0
2,000
4,000
6,000
8,000
10,000
12,000
14,000
16,000
18,000
20,000
19
80
19
85
19
90
19
95
20
00
20
05
20
10
20
15
20
20
Nu
mb
er
of
Un
its
Issu
ed
Pe
rmit
s
Multi-Unit Residential Building Unit Construction in Canada
Significant Construction in Late 80’s and Early 90’s
Now
Significant Renewals Needed Every 30 – 40 Years
Whitehorse Contractors Seminar May 7, 2015
G.Finch - RDH www.rdh.com 35
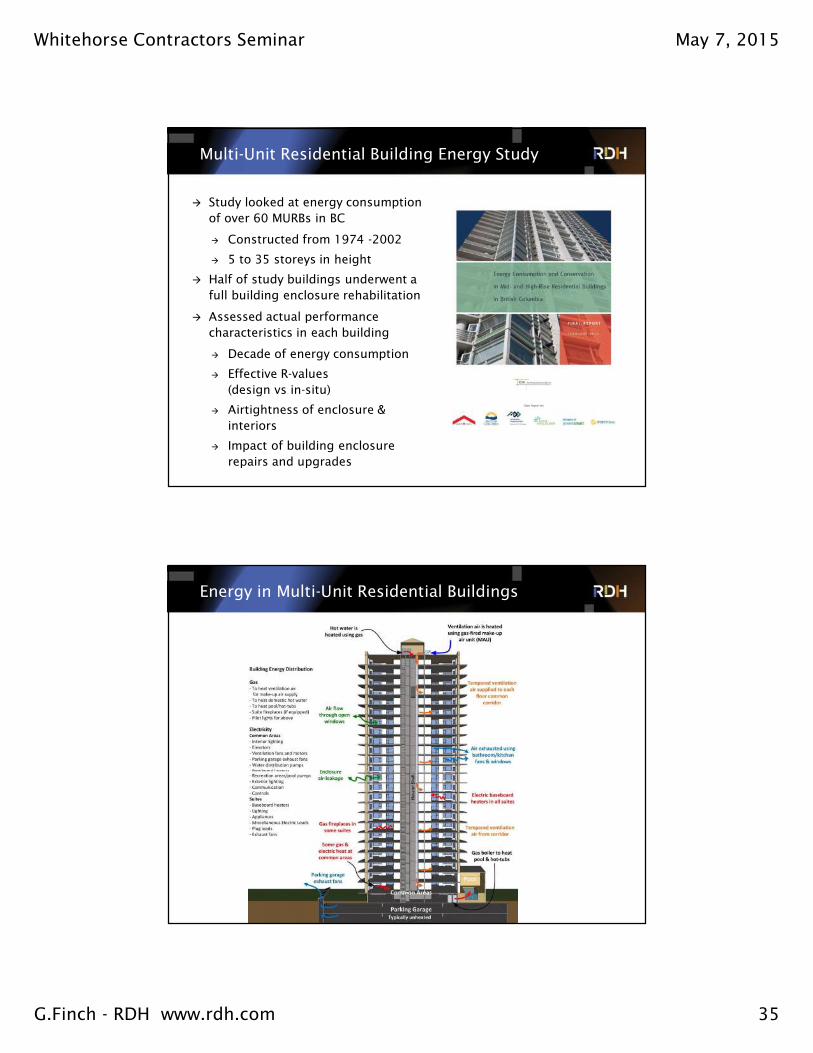
Multi-Unit Residential Building Energy Study
� Study looked at energy consumption
of over 60 MURBs in BC
� Constructed from 1974 -2002
� 5 to 35 storeys in height
� Half of study buildings underwent a
full building enclosure rehabilitation
� Assessed actual performance
characteristics in each building
� Decade of energy consumption
� Effective R-values
(design vs in-situ)
� Airtightness of enclosure &
interiors
� Impact of building enclosure
repairs and upgrades
Energy in Multi-Unit Residential Buildings

Whitehorse Contractors Seminar May 7, 2015
G.Finch - RDH www.rdh.com 36
Energy Use Intensity of MURBs
Average 39 Buildings = 213 kWh/m2/yr
Total Energy Consumption vs Year of Construction
2005
Total Energy Space Heat Energy

Whitehorse Contractors Seminar May 7, 2015
G.Finch - RDH www.rdh.com 37
Typical MURB Energy Consumption
Units of kWh/m2/yr, % of total
Measured Energy Savings from Building Enclosure Rehabilitations
-15%
-10%
-5%
0%
5%
10%
15%
20%
25%
Bldg07 Bldg11 Bldg17 Bldg18 Bldg19 Bldg20 Bldg21 Bldg28 Bldg32 Bldg33 Bldg62
Tota
l En
erg
y Consu
mp
tion, kW
h/m
Tota
l En
erg
y Consu
mp
tion, kW
h/m
Tota
l En
erg
y Consu
mp
tion, kW
h/m
Tota
l En
erg
y Consu
mp
tion, kW
h/m
22 22
Metered Savings
Modeled Savings
Average Metered (Actual Savings) = 7.5% (-11% up to 19%)Average Modeled Savings = 3% (0% to 7%)In all cases* actual savings exceeded modeled

Whitehorse Contractors Seminar May 7, 2015
G.Finch - RDH www.rdh.com 38
Calibration of Whole Building Energy Models
� Step 1: Gathering input data
� Step 2: Building the model
� Step 3: Checking the results
� Step 4: Assess potential Energy Efficiency Measures
SketchUp Energy Model Geometry
Energy Model Rendering
ScenarioScenarioScenarioScenario Simulation InputsSimulation InputsSimulation InputsSimulation Inputs
Baseline:
Pre-Rehab
• Walls effective R-3.6
• Windows single glazed U = 0.7, SC = 0.67
• Air tightness “Tight – High Average”, 0.15 cfm/ft2
• Make-up air temperature set-point 68°F
• No heat recovery
Good:
Target
Performance
• Walls effective R-10
• Windows double glazed, argon fill, low-e, low conductive frame; U = 0.27, SC = 0.35
• Air tightness “Tight – Low Average”, 0.05 cfm/ft2
• Make-up air temperature set-point 64°F
• No heat recovery
• No Fireplaces
Best:
Green Design
Performance
• Walls effective R-18.2
• Windows triple glazed, argon fill, low-e, low conductive frame; U = 0.17, SC = 0.23
• Air tightness “Very Tight”, 0.02 cfm/ft2
• Make-up air temperature set-point 60°F
• 80% Heat Recovery
• No Fireplaces
MURB Energy Simulations: The Potential

Whitehorse Contractors Seminar May 7, 2015
G.Finch - RDH www.rdh.com 39
102.4
38.2
9.7
0.0
20.0
40.0
60.0
80.0
100.0
120.0
Baseline Good Best
An
nua
l Space
Heat Consum
ptio
n, k
Wh
/mA
nn
ua
l Space
Heat Consum
ptio
n, k
Wh
/mA
nn
ua
l Space
Heat Consum
ptio
n, k
Wh
/mA
nn
ua
l Space
Heat Consum
ptio
n, k
Wh
/m22 22
Potential for Space Heat Savings in MURBs
91% Space Heat Savings
63% Space Heat Savings
110.3
60.839.4
96.0
81.3
74.2
0
50
100
150
200
250
Baseline Good Best
An
nu
al Energ
y Co
nsu
mp
tio
n, kW
h/m
An
nu
al Energ
y Co
nsu
mp
tio
n, kW
h/m
An
nu
al Energ
y Co
nsu
mp
tio
n, kW
h/m
An
nu
al Energ
y Co
nsu
mp
tio
n, kW
h/m
22 22
Electricity
Gas
Potential for Significant Energy Savings
� Can reduce energy by almost half with ventilation and
enclosure upgrades
� Further improvements possible from other systems
Current Levels ~ 200 kWh/m2/yr We can get to ~100 kWh/m2/yr

Whitehorse Contractors Seminar May 7, 2015
G.Finch - RDH www.rdh.com 40
Deep Building Enclosure Retrofit – Applying the MURB Study Findings
Case Study: Deep Energy Retrofit
� Started with a condition assessment
� Then, whole building energy modeling to assess
options for renewals project
BE Upgrades
1 year M&V
Mechanical upgrades
1 year M&V
Monitoring & Testing
Pilot Timeline
Year 2011 2012 2013 2015 future
Whitehorse Contractors Seminar May 7, 2015
G.Finch - RDH www.rdh.com 41
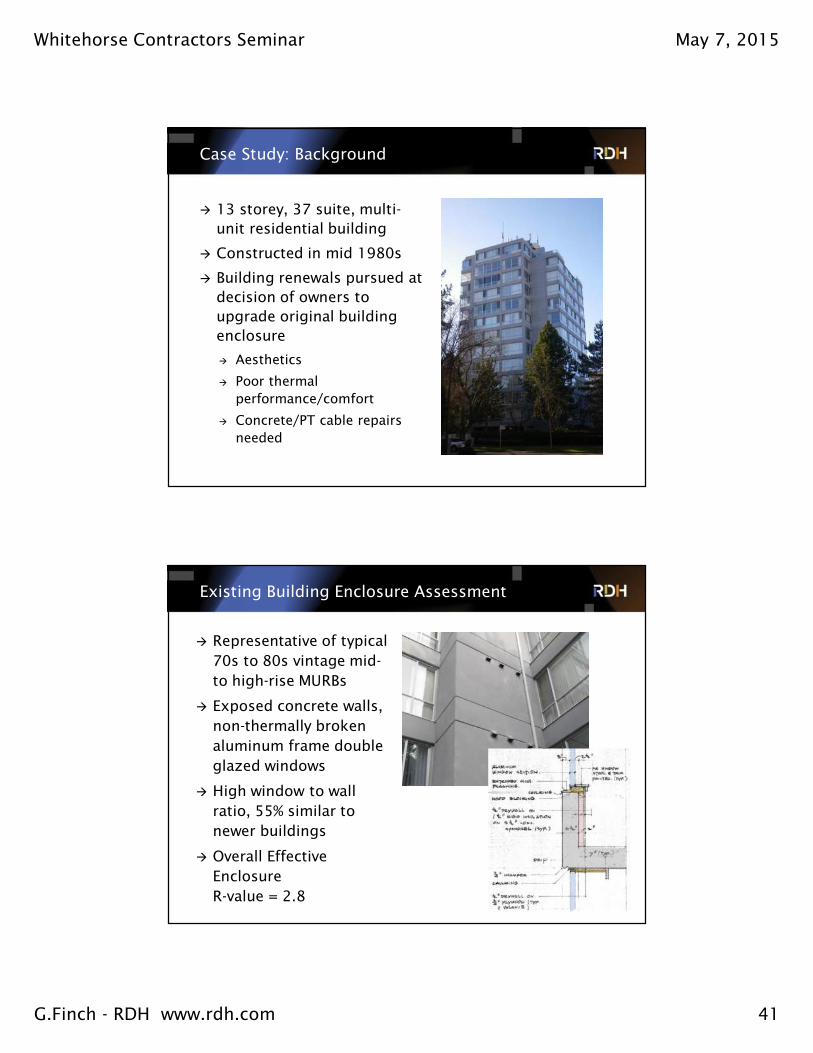
� 13 storey, 37 suite, multi-
unit residential building
� Constructed in mid 1980s
� Building renewals pursued at
decision of owners to
upgrade original building
enclosure
� Aesthetics
� Poor thermal
performance/comfort
� Concrete/PT cable repairs
needed
Case Study: Background
Existing Building Enclosure Assessment
� Representative of typical
70s to 80s vintage mid-
to high-rise MURBs
� Exposed concrete walls,
non-thermally broken
aluminum frame double
glazed windows
� High window to wall
ratio, 55% similar to
newer buildings
� Overall Effective
Enclosure
R-value = 2.8

Whitehorse Contractors Seminar May 7, 2015
G.Finch - RDH www.rdh.com 42
Existing Mechanical System Assessment
� Original mechanical
systems largely in place
� Electric baseboard heating
� Gas-heated make-up air for
ventilation (to corridors)
� 14 decorative gas
fireplaces at upper floor
suites – some replaced by
owners
� Hot-water boiler & tanks
replaced few times before
Metered Energy Data
� Metered data from Local Utilities (Electricity & Natural Gas)
0
10,000
20,000
30,000
40,000
50,000
60,000
70,000
80,000
90,000
100,000
Jul 2
00
6
Sep
20
06
No
v 2
00
6
Jan
20
07
Ma
r 2
00
7
Ma
y 2
00
7
Jul 2
00
7
Sep
20
07
No
v 2
00
7
Jan
20
08
Ma
r 2
00
8
Ma
y 2
00
8
Jul 2
00
8
Sep
20
08
No
v 2
00
8
Jan
20
09
Ma
r 2
00
9
Ma
y 2
00
9
Jul 2
00
9
Sep
20
09
No
v 2
00
9
Jan
20
10
Ma
r 2
01
0
Ma
y 2
01
0
Jul 2
01
0
Sep
20
10
No
v 2
01
0
Jan
20
11
Ma
r 2
01
1
Ma
y 2
01
1
Jul 2
01
1
Mo
nth
ly E
ne
rgy
Co
nsu
mp
toin
, e
kW
h
Suite Electricity, kWh
Common Electricity (Strata), kWh
Gas, ekWh

Whitehorse Contractors Seminar May 7, 2015
G.Finch - RDH www.rdh.com 43
Typical Year Energy Consumption
� Calendarize and weather normalize
-
10,000
20,000
30,000
40,000
50,000
60,000
70,000
80,000
Mo
nth
ly E
ne
rgy
Co
nsu
mp
tio
n,
ek
Wh
Suite Electricity, kWh Common Electricity, kWh Gas, ekWh
Gas
46%
Suite Electricity
36%
Common
Electricity
(Strata)
18%
Annual Breakdown
Comparison to Other Similar MURBs
225 kWh/m2/yr
Average 213 kWh/m2/yr

Whitehorse Contractors Seminar May 7, 2015
G.Finch - RDH www.rdh.com 44
Use of Energy Modeling to Evaluate Energy Efficiency Measures
� Reviewed measured utility data (gas and electricity) for past 5 years
� Calibrated whole building energy model developed to evaluate potential
Energy Efficiency Measures (EEMs)
Electric Baseboard
Heating
22%
Fireplaces
9%
Ventilation Heating
25%
Hot Water
11%
Lights - Common
2%
Lights - Suite
7%
Plug and Appliances
(Suites)
8%
Equipment and
Ammenity
(Common)
16%Total Energy
Consumption:
225 kWh/m2/yr
Energy costs
$65,500/yr total
($1770/suite)
� Plan to renew building
aesthetic to more modern
appearance
� Metal panels with color
features
� Stucco features
� New windows
� New skylights at penthouse
� New entrance door
� Enclosed balconies
� New roof and decks
� Adds value
Building Enclosure Renewal Design

Whitehorse Contractors Seminar May 7, 2015
G.Finch - RDH www.rdh.com 45
� Wall insulation with low
conductivity cladding attachment
� Reduced thermal bridging
� Windows
� Double & triple glazed low-
conductivity frames
� Airtightness improvement
� Roof insulation
� Heat recovery ventilation
� Fireplace upgrade
� Make-up air unit (ventilation)
Potential Energy Efficiency Measures
Window Replacement Evaluation
� Alternatives:
� Double glazed, metal frame windows
(minimum code requirement)
� Double glazed, fibreglass frame
� Triple glazed, fibreglass frame
Window Estimated Annual Energy Savings
Estimated % Savings
Double Glazed, Aluminum Frames
$1,900 3%
Double Glazed, Fibreglass Frames
$7,600 7%
Triple Glazed, Fibreglass Frames
$11,000 10%
Whitehorse Contractors Seminar May 7, 2015
G.Finch - RDH www.rdh.com 46
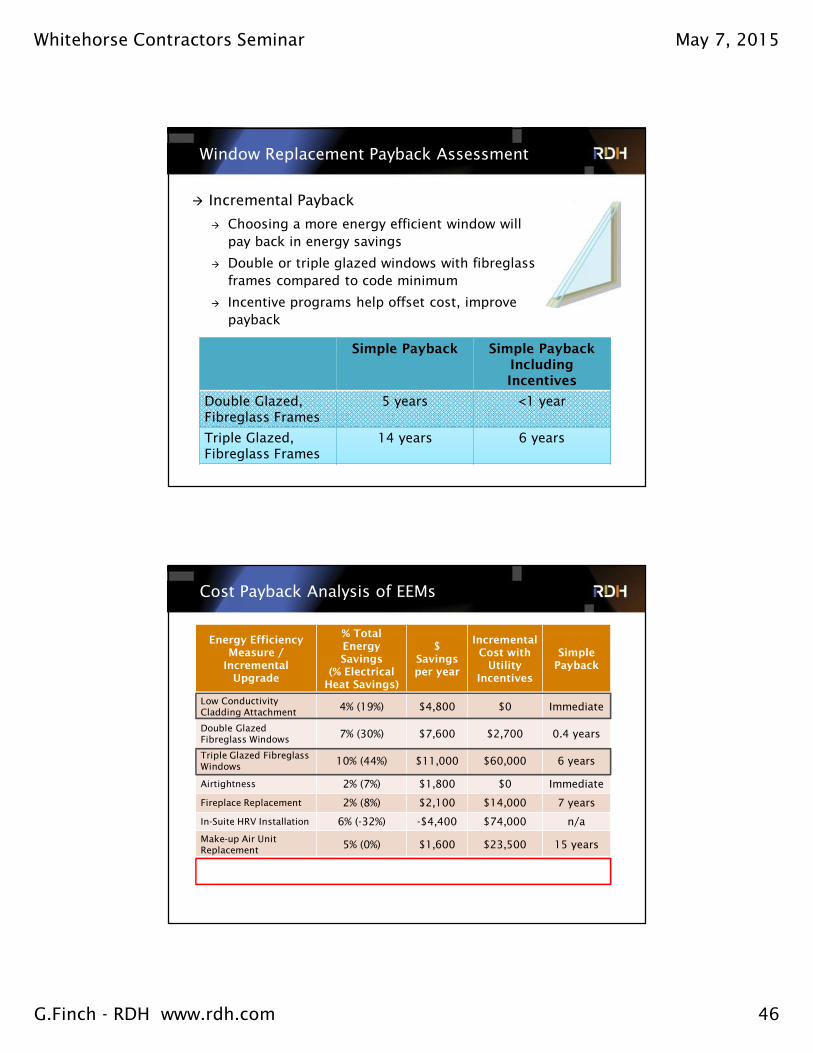
Window Replacement Payback Assessment
� Incremental Payback
� Choosing a more energy efficient window will
pay back in energy savings
� Double or triple glazed windows with fibreglass
frames compared to code minimum
� Incentive programs help offset cost, improve
payback
Simple Payback Simple PaybackIncluding Incentives
Double Glazed, Fibreglass Frames
5 years <1 year
Triple Glazed, Fibreglass Frames
14 years 6 years
Cost Payback Analysis of EEMs
Energy Efficiency Measure / Incremental Upgrade
% TotalEnergy Savings
(% Electrical Heat Savings)
$Savings per year
Incremental Cost with Utility
Incentives
SimplePayback
Low Conductivity Cladding Attachment
4% (19%) $4,800 $0 Immediate
Double Glazed Fibreglass Windows
7% (30%) $7,600 $2,700 0.4 years
Triple Glazed Fibreglass Windows
10% (44%) $11,000 $60,000 6 years
Airtightness 2% (7%) $1,800 $0 Immediate
Fireplace Replacement 2% (8%) $2,100 $14,000 7 years
In-Suite HRV Installation 6% (-32%) -$4,400 $74,000 n/a
Make-up Air Unit Replacement
5% (0%) $1,600 $23,500 15 years
Enclosure EEMs (triple glazed)
20% (87%) $21,900 $60,000 2.7 years
Enclosure & Mechanical EEMs (triple glazed)
30% (62%) $19,700 $166,800 8.5 years

Whitehorse Contractors Seminar May 7, 2015
G.Finch - RDH www.rdh.com 47
Predicted Annual Energy Savings
Electric
Baseboard
Heating
3% Fireplaces
9%
Ventilation
Heating
24%
Fans
1%
Hot Water
11%Lights - Common
1%Lights - Suite
7%
Plug and
Appliances
(Suites)
8%
Equipment and
Ammenity
(Common)
15%
Enclosure
Savings
21%
Modeled Post-Retrofit: 177 kWh/m2
� Pre-retrofit = 225 kWh/m2/yr
� Building enclosure EEMs (insulation, windows, airtightness)
� 20% savings overall
� 87% electric baseboard
heating savings
Building Enclosure Renewals
� $3.6M renewals project, 7
month construction period
� Work primarily from exterior
with access to suites for
window installations
Whitehorse Contractors Seminar May 7, 2015
G.Finch - RDH www.rdh.com 48
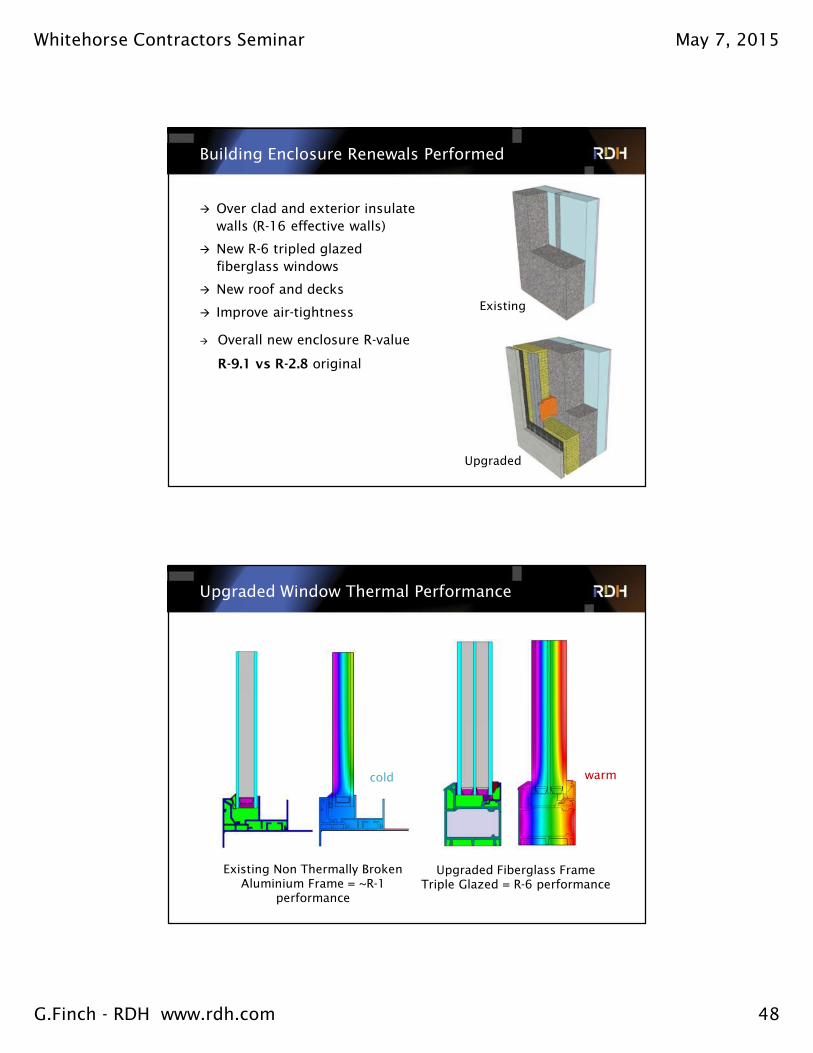
Building Enclosure Renewals Performed
� Over clad and exterior insulate
walls (R-16 effective walls)
� New R-6 tripled glazed
fiberglass windows
� New roof and decks
� Improve air-tightness
� Overall new enclosure R-value
R-9.1 vs R-2.8 original
Existing
Upgraded
Upgraded Window Thermal Performance
Existing Non Thermally Broken Aluminium Frame = ~R-1
performance
Upgraded Fiberglass FrameTriple Glazed = R-6 performance
cold warm
Whitehorse Contractors Seminar May 7, 2015
G.Finch - RDH www.rdh.com 49
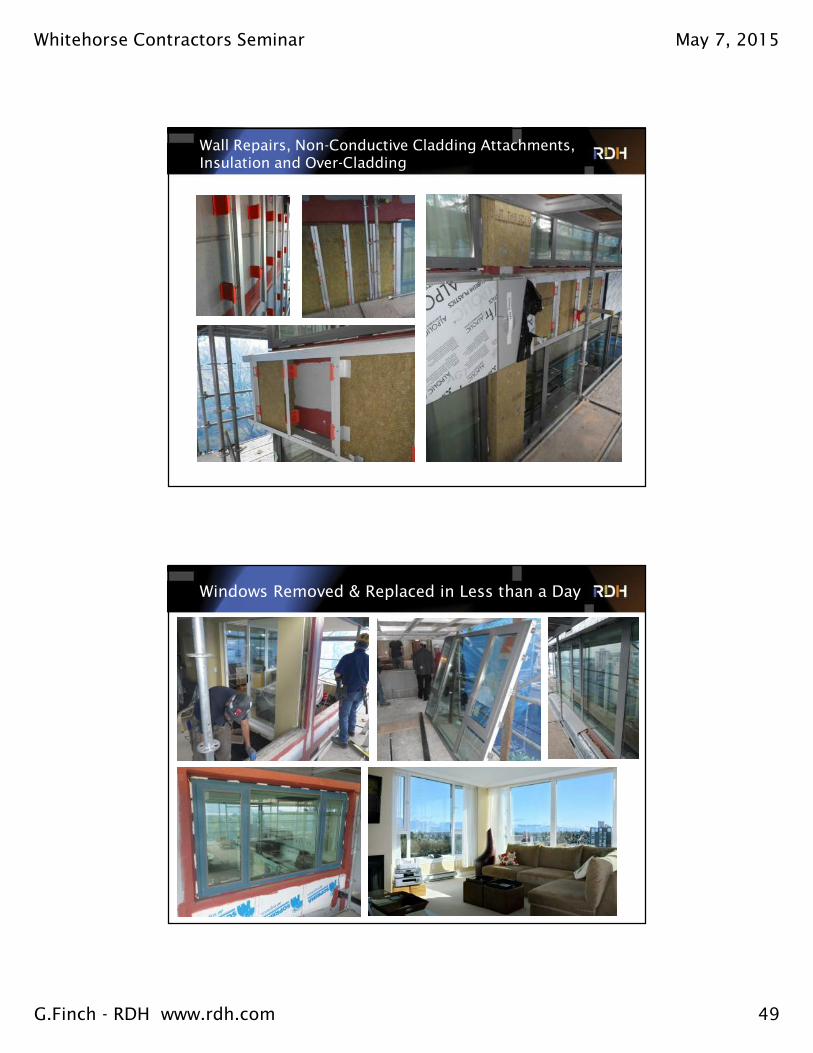
Wall Repairs, Non-Conductive Cladding Attachments, Insulation and Over-Cladding
Windows Removed & Replaced in Less than a Day
Whitehorse Contractors Seminar May 7, 2015
G.Finch - RDH www.rdh.com 50
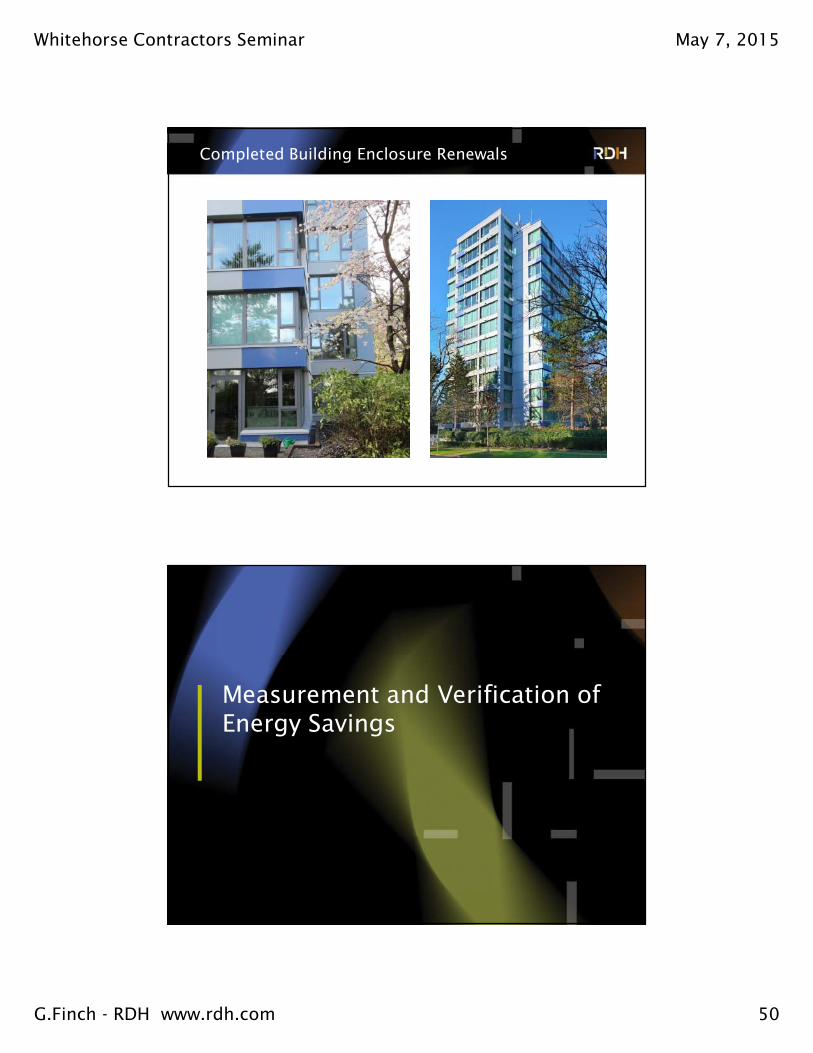
Completed Building Enclosure Renewals
Measurement and Verification of Energy Savings
Whitehorse Contractors Seminar May 7, 2015
G.Finch - RDH www.rdh.com 51
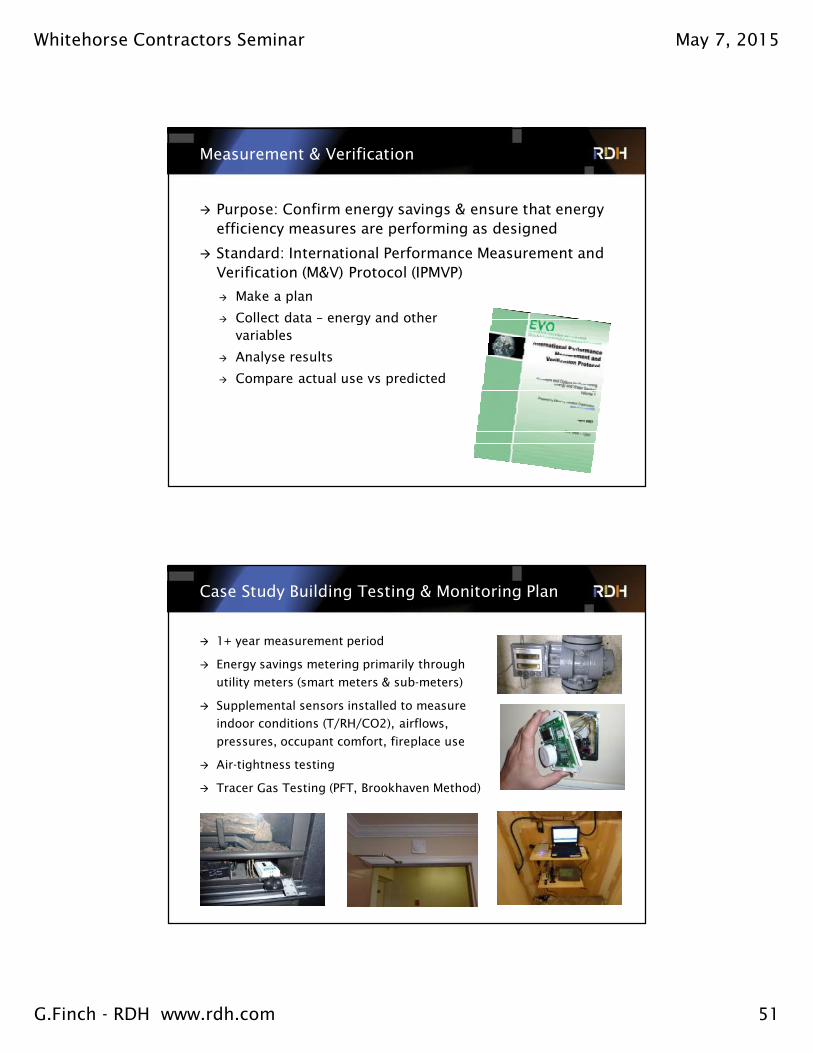
Measurement & Verification
� Purpose: Confirm energy savings & ensure that energy
efficiency measures are performing as designed
� Standard: International Performance Measurement and
Verification (M&V) Protocol (IPMVP)
� Make a plan
� Collect data – energy and other
variables
� Analyse results
� Compare actual use vs predicted
Case Study Building Testing & Monitoring Plan
� 1+ year measurement period
� Energy savings metering primarily through
utility meters (smart meters & sub-meters)
� Supplemental sensors installed to measure
indoor conditions (T/RH/CO2), airflows,
pressures, occupant comfort, fireplace use
� Air-tightness testing
� Tracer Gas Testing (PFT, Brookhaven Method)

Whitehorse Contractors Seminar May 7, 2015
G.Finch - RDH www.rdh.com 52
Calibration of Energy Models
-
10,000
20,000
30,000
40,000
50,000
60,000
70,000
Jan Feb Mar Apr May Jun Jul Aug Sept Oct Nov Dec
Gas Consumption, ekWh
Metered Post-Retrofit Uncalibrated Model Post-Retrofit Calibrated Model Post-Retrofit
-
5,000
10,000
15,000
20,000
25,000
30,000
35,000
40,000
45,000
50,000
Jan Feb Mar Apr May Jun Jul Aug Sept Oct Nov Dec
Electricity Consumption, kWh
Metered Post-Retrofit Uncalibrated Model Post-Retrofit Calibrated Model Post-Retrofit
Sub-metering of Gas
0
50
100
150
200
250
Jan-13 Feb-13 Mar-13 Apr-13 May-13 Jun-13 Jul-13 Aug-13 Sep-13 Oct-13 Nov-13 Dec-13
Natural Gas Consumption, GJ
Month
Sub-Metered Natural Gas Consumption by Source
FP, Corrected GJ MAU, Normalized, GJ
DHW, Corrected GJ Fortis BC Data
DHW34%
Make-up Air42%
Fireplaces24%

Whitehorse Contractors Seminar May 7, 2015
G.Finch - RDH www.rdh.com 53
Measured Savings: Electricity
� Total Building Electricity Savings of 33%
� Suite Baseboard heat reduced by ~63%
-
10,000
20,000
30,000
40,000
50,000
60,000
70,000
80,000
90,000
Jan Feb Mar Apr May Jun Jul Aug Sep Oct Nov Dec
Electricity Consumption, kWh Calibrated Model Pre-Retrofit Calibrated Model Post-Retrofit
Measured Savings: Gas
� 2% Gas savings (fireplaces)
-
10,000
20,000
30,000
40,000
50,000
60,000
70,000
Jan Feb Mar Apr May Jun Jul Aug Sept Oct Nov Dec
Gas Consumption, ekWh
Calibrated Model Pre-Retrofit Calibrated Model Post-Retrofit

Whitehorse Contractors Seminar May 7, 2015
G.Finch - RDH www.rdh.com 54
Measured Savings: Total
� 19% savings predicted (calibrated model, 20%
uncalibrated), 19% total energy savings achieved
-
20,000
40,000
60,000
80,000
100,000
120,000
140,000
160,000
Jan Feb Mar Apr May Jun Jul Aug Sep Oct Nov Dec
Total Energy Consumption, ekWh Calibrated Model Pre-Retrofit Calibrated Model Post-Retrofit
Monitoring of Indoor Conditions and Airflow Within the Building

Whitehorse Contractors Seminar May 7, 2015
G.Finch - RDH www.rdh.com 55
Building Monitoring Overview
Building Monitoring Overview
Whitehorse Contractors Seminar May 7, 2015
G.Finch - RDH www.rdh.com 56
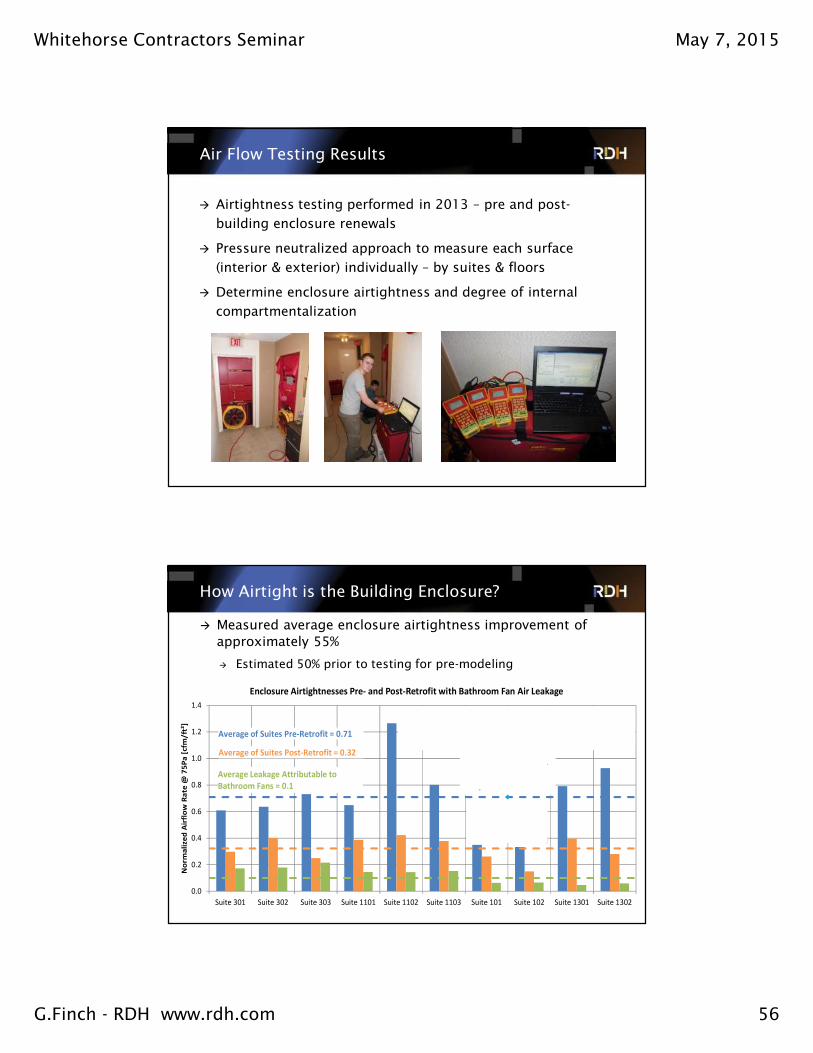
Air Flow Testing Results
� Airtightness testing performed in 2013 – pre and post-
building enclosure renewals
� Pressure neutralized approach to measure each surface
(interior & exterior) individually – by suites & floors
� Determine enclosure airtightness and degree of internal
compartmentalization
How Airtight is the Building Enclosure?
� Measured average enclosure airtightness improvement of
approximately 55%
� Estimated 50% prior to testing for pre-modeling
0.0
0.2
0.4
0.6
0.8
1.0
1.2
1.4
Suite 301 Suite 302 Suite 303 Suite 1101 Suite 1102 Suite 1103 Suite 101 Suite 102 Suite 1301 Suite 1302
No
rma
lize
d A
irfl
ow
Ra
te @
75
Pa
[cf
m/ft
²]
Enclosure Airtightnesses Pre- and Post-Retrofit with Bathroom Fan Air Leakage
Average of Suites Pre-Retrofit = 0.71
Average of Suites Post-Retrofit = 0.32
Average Leakage Attributable to
Bathroom Fans = 0.1
Note that the bathroom fan leakage includes leakage through 2 fans
per suite. Also, this does not include potential leakage through the
kitchen range hood, dryer vent, or fireplaces on relevant floors.
Low because include
floor area in the exterior
enclosure area because
parkade is below.

Whitehorse Contractors Seminar May 7, 2015
G.Finch - RDH www.rdh.com 57
Where Does the Air Go?
1 L/s ≈ 2 cfm
Despite this improvement, monitoring shows little to no effect on airflow patterns
Where are the Holes & Leaks?
AverageOperableWindow
Whitehorse Contractors Seminar May 7, 2015
G.Finch - RDH www.rdh.com 58
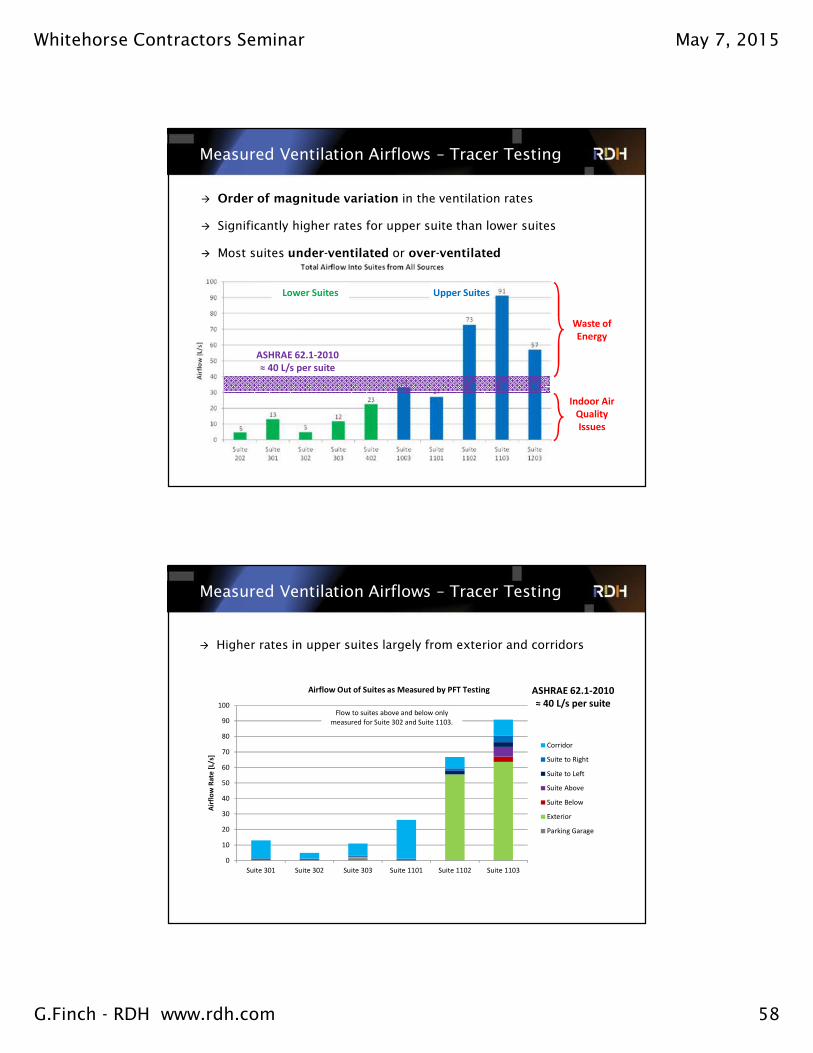
Measured Ventilation Airflows – Tracer Testing
� Order of magnitude variation in the ventilation rates
� Significantly higher rates for upper suite than lower suites
� Most suites under-ventilated or over-ventilated
ASHRAE 62.1-2010
≈ 40 L/s per suite
Lower Suites Upper Suites
Indoor Air
Quality
Issues
Waste of
Energy
Measured Ventilation Airflows – Tracer Testing
� Higher rates in upper suites largely from exterior and corridors
0
10
20
30
40
50
60
70
80
90
100
Suite 301 Suite 302 Suite 303 Suite 1101 Suite 1102 Suite 1103
Air
flo
w R
ate
[L/
s]
Airflow In to Suites as Measured by PFT Testing
Corridor
Suite to Right
Suite to Left
Suite Above
Suite Below
Exterior
Parking Garage
Flow to suites above and below only
measured for Suite 302 and Suite 1103.
*Some results
manually
corrected.0
10
20
30
40
50
60
70
80
90
100
Suite 301 Suite 302 Suite 303 Suite 1101 Suite 1102 Suite 1103
Air
flo
w R
ate
[L/
s]
Airflow Out of Suites as Measured by PFT Testing
Corridor
Suite to Right
Suite to Left
Suite Above
Suite Below
Exterior
Parking Garage
Flow to suites above and below only
measured for Suite 302 and Suite 1103.
*Some results
manually
corrected.
ASHRAE 62.1-2010
≈ 40 L/s per suite

Whitehorse Contractors Seminar May 7, 2015
G.Finch - RDH www.rdh.com 59
Measured Ventilation Make-up Air Distribution
PMCP Released in MAU
Measured Parking Garage Infiltration
PDCP Released in
Parking Garage8°°°°C Outside
343 L/s in to
the building
≈ 2 to 7 L/s
per suite

Whitehorse Contractors Seminar May 7, 2015
G.Finch - RDH www.rdh.com 60
Indoor Air Quality – CO2 Measurements
� Carbon dioxide concentration were monitored as an indicator of
indoor air quality (IAQ)
� Significantly higher concentration in the lower suites
� Summary:
� Over ventilation and under ventilation of most suites
� Higher ventilation rates in upper suites than lower suites
� Better indoor air quality in upper suites than lower suites
Why is this happening?
Measured Ventilation Rates

Whitehorse Contractors Seminar May 7, 2015
G.Finch - RDH www.rdh.com 61
Maybe the MAU isn’t working correctly?
� Custom powered flow hood used to measure intake flow rate of the make-up air unit
� MAU airflow approximately the same as design flow rate of 1,560 L/s (3,300 cfm)
Cause of Ventilation Rates
Maybe the ventilation air isn’t reaching the corridors?
� Only 40% of intake flow reaches the corridors directly
Cause of Ventilation Rates
0
2
4
6
8
10
12
14
0 25 50 75 100 125 150
Flo
or
Nu
mb
er
Flow Rate [L/s]
MAU Supply to Corridors
Pre-Retrofit (21°C) Post-Retrofit (6°C) Post-Retrofit (16°C)
Pre-Retrofit (21°C) Total = 593 L/s
Post-Retrofit (6°C) Total = 559 L/s
Post-Retrofit (16°C) Total = 580 L/s
Fire Damper noted to be
closed on Floors 4, 8, & 12.
1 L/s ≈ 2 cfm

Whitehorse Contractors Seminar May 7, 2015
G.Finch - RDH www.rdh.com 62
Maybe the air isn’t reaching the suites from the corridors?
� Airtightness tested corridors and found significant flow paths other than
to the suites through the suite entrance doors. Only 20% to the suites
Cause of Ventilation Rates
1 L/s ≈ 2 cfm
� Theoretically, only 8% of intended ventilation actually
goes where it is supposed to! Waste of ventilation air,
and the energy needed to move and condition it.
Cause of Ventilation Rates
� If only 40% of the flow rate reaches the corridors
And, only 20% of that air reaches the suites…
Leakage of air along ventilation flowpath is a major issue.
��% × ��% = �%

Whitehorse Contractors Seminar May 7, 2015
G.Finch - RDH www.rdh.com 63
� Pressure differences were
monitored with a focus on an
upper floor and a lower floor
(Floors 11 & 3)
� Assessed relationship between
exterior temperature (stack
effect) and wind events using a
weather station on the roof
Maybe pressure differencesare an important factor?
Cause of Ventilation Rates
� Mechanical ventilation system creates pressure of 5 to 10 Pa
Cause of Ventilation Rates
-20
-15
-10
-5
0
5
10
15
20
Feb 8 6:00 Feb 8 8:00 Feb 8 10:00 Feb 8 12:00 Feb 8 14:00 Feb 8 16:00 Feb 8 18:00
Pre
ssu
re D
iffe
ren
ce [
Pa
]
Floor 02 Floor 03 Floor 04 Floor 10 Floor 11 Floor 12
Measurement with MAU Off
Measurement with MAU Recently Turned On
Co
rrid
or-
to-S
uit
e P
ress
ure
Dif
fere
nce
[P
a] ≈10 Pa
≈5 Pa
Corridor-to-Suite Pressure Difference
Whitehorse Contractors Seminar May 7, 2015
G.Finch - RDH www.rdh.com 64
-5
0
5
10
15
20
25
-10
-5
0
5
10
15
20
Ex
teri
or
Te
mp
era
ture
[°C
]
Co
rrid
or-
to-S
uit
e P
ress
ure
Dif
fere
nce
[P
a]
Temperature - 24 Hour Moving Average
Floor 02 Floor 03 Floor 04
Floor 10 Floor 11 Floor 12
Exterior Temperature [°C]
-5
0
5
10
15
20
25
-10
-5
0
5
10
15
20
Ex
teri
or
Te
mp
era
ture
[°C
]
Co
rrid
or-
to-S
uit
e P
ress
ure
Dif
fere
nce
[P
a]
Temperature - 24 Hour Moving Average
Floor 02 Floor 03 Floor 04
Floor 10 Floor 11 Floor 12
Exterior Temperature [°C]
-5
0
5
10
15
20
25
-10
-5
0
5
10
15
20
Ex
teri
or
Te
mp
era
ture
[°C
]
Co
rrid
or-
to-S
uit
e P
ress
ure
Dif
fere
nce
[P
a]
Temperature - 24 Hour Moving Average
Floor 02 Floor 03 Floor 04
Floor 10 Floor 11 Floor 12
Exterior Temperature [°C]
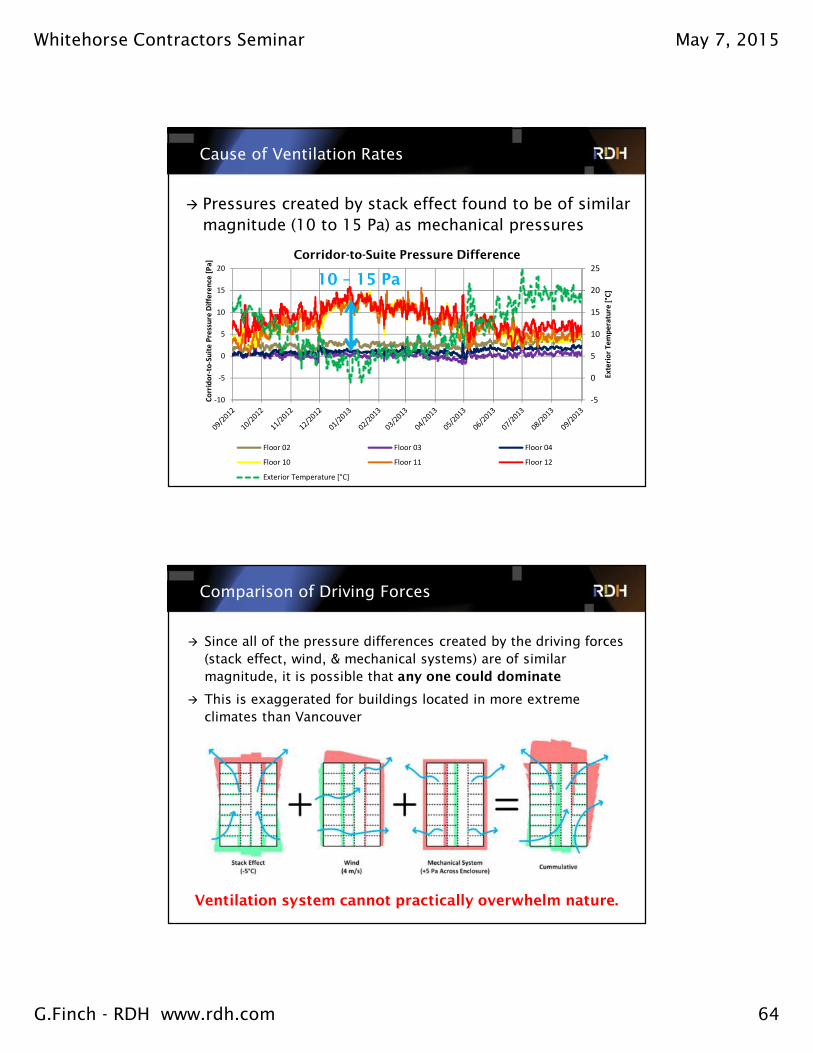
� Pressures created by stack effect found to be of similar
magnitude (10 to 15 Pa) as mechanical pressures
Cause of Ventilation Rates
Corridor-to-Suite Pressure Difference
10 – 15 Pa
Comparison of Driving Forces
� Since all of the pressure differences created by the driving forces
(stack effect, wind, & mechanical systems) are of similar
magnitude, it is possible that any one could dominate
� This is exaggerated for buildings located in more extreme
climates than Vancouver
Ventilation system cannot practically overwhelm nature.

Whitehorse Contractors Seminar May 7, 2015
G.Finch - RDH www.rdh.com 65
Ventilation & IAQ - Summary
� Corridor pressurization does not provide intended ventilation
rates to a large number of suites
� Some significantly over ventilated while others significantly
under ventilated
� Significant leakage along the ventilation air flow path from the
duct and the corridor (wasted ventilation)
� Uncontrolled airflow wastes energy and provides poor
ventilation
� Stack effect and wind pressures are often similar or greater than
mechanically-induced pressures
� Ventilation system can not practically overwhelm nature
� Plan to upgrade mechanical
ventilation system in building
� Most effective is to install in
suite HRV or ERVs – challenges
with retrofit & running ducts
� Will also perform air-sealing to
compartmentalize the suites
and corridors & reduce make-up
air to just corridor flow
rates/temperatures
� Measure ongoing energy
savings
� Proposed installation late 2015
Next Steps

Whitehorse Contractors Seminar May 7, 2015
G.Finch - RDH www.rdh.com 66
Summary
Summary

Whitehorse Contractors Seminar May 7, 2015
G.Finch - RDH www.rdh.com 67
Summary
� Significant opportunities exist to reduce
energy consumption of MURBs
� Pilot project demonstrates the potential
for simple and cost effective EEMs at time
of retrofit work & new construction
� Total building energy savings of 19% for
building enclosure improvements
predicted and then measured & verified
� Ventilation assessment necessary at time
of building enclosure renewals
� Replicating the success of this project is a
huge opportunity for the entire industry
Some Thoughts for Whitehorse MURB Retrofits
� Majority of MURBs here are wood-frame townhouse and
<4 storey multi-storey
� Will be easier to access and complete retrofits within a
single spring-fall construction season
� Central ventilation systems (if present in older
buildings, pre-HRV requirements) will be big consumers
of energy – consider in-suite systems/HRVs
� Fireplaces if present will be another big consumer of
energy – consider sub-metering
� Opportunities for thermal insulation upgrades to
window, wall and roof assemblies & overall building air-
tightness improvements – consider upgrades beyond
code

Whitehorse Contractors Seminar May 7, 2015
G.Finch - RDH www.rdh.com 68
Looking Ahead: Towards Net Zero New Construction and Retrofits
Looking Ahead
� Move towards improving resilience and
energy efficiency of new and existing
buildings
� Focus on GHGs and move towards “net-
zero” emissions
� Pacific Northwest Economic Region (PNWER)
– currently performing research &
developing strategies & a roadmap to
transform construction market in most
cost-effective manner
� Working with all levels of government &
private sector to develop roadmap with
multiple goals

Whitehorse Contractors Seminar May 7, 2015
G.Finch - RDH www.rdh.com 69
Roadmap to Resilient, Net Zero Energy Buildings and Deep Energy Retrofits
� Gathering & review of case study buildings of all types and in
all PNWER regions with demonstrated low-energy use, net-zero
energy, resilient construction etc.
� Technical & economic assessment, interviews with design
teams & owners to determine key energy efficiency measures
� Verification of energy & financial performance
� Summarize key design and operation features of net zero
buildings (existing & new) for potential replication across
PNEWR region
� Forecast regional benefits and savings to existing & future
building stock
� Review government policy and market mechanisms to facilitate
net zero new construction and deep retrofits
How You Can Help
� Looking for Case Studies in Yukon and Northwest
Territories
� New Buildings of all types demonstrating net-zero energy
and/or emissions
� Deep energy retrofits with >30% reduction in energy use or
GHG
� Designers & owners willing to share success stories
Whitehorse Contractors Seminar May 7, 2015
G.Finch - RDH www.rdh.com 70
� rdh.com
Discussion
GRAHAM FINCH – [email protected] – 604-873-1181