Burden of Oral Disease in Nevada
106
Burden of Oral Disease in Nevada Bureau of Family Health Services Nevada State Health Division Department of Health and Human Services Kenny C. Guinn, Governor Michael J. Willden, Director Department of Health & Human Services Alex Haartz, MPH, Administrator Bradford Lee, MD, State Health Officer Nevada State Health Division December 2005
Transcript of Burden of Oral Disease in Nevada
Burden of Oral Disease in Nevada
BBuurreeaauu ooff FFaammiillyy HHeeaalltthh SSeerrvviicceess NNeevvaaddaa SSttaattee HHeeaalltthh DDiivviissiioonn
DDeeppaarrttmmeenntt ooff HHeeaalltthh aanndd HHuummaann SSeerrvviicceess
Kenny C. Guinn, Governor Michael J. Willden, Director Department of Health & Human Services
Alex Haartz, MPH, Administrator Bradford Lee, MD, State Health Officer Nevada State Health Division
DDeecceemmbbeerr 22000055
2
This report is available on the State Health Division website www.health2k.state.nv.us/oral. Comments, suggestions, and requests for further information may be addressed to:
Oral Health Program
Bureau of Family Health Services
Oral Health Initiative
3427 Goni Road, Suite 108
Carson City, NV 89706
Tel: (775) 684-4285
Fax: (775) 684-4245
Funding for this project was provided by the Centers for Disease Control and Prevention through the Chronic Disease Prevention and Health Promotion Programs Component 4: State-Based Oral Disease Prevention Program (U58/CCU922830-03). The contents of this report are solely the responsibility of the authors and do not necessarily represent the official views of the CDC.
3
TABLE OF CONTENTS
I. INTRODUCTION ...............................................................................................................................................4
II. EXECUTIVE SUMMARY .................................................................................................................................5
III. NATIONAL AND STATE OBJECTIVES ON ORAL HEALTH ..................................................................9
IV. THE BURDEN OF ORAL DISEASES.....................................................................................................11
A. PREVALENCE OF DISEASE AND UNMET NEED ....................................................................................................11 i. Children .........................................................................................................................................................11 ii. Adults ............................................................................................................................................................13
B. SOCIETAL IMPACT OF ORAL DISEASE .................................................................................................................17 i. Social Impact .................................................................................................................................................17 ii. Economic Impact ..........................................................................................................................................18 iii. Oral Disease and Other Health Conditions.................................................................................................18
C. DISPARITIES .......................................................................................................................................................20 i. Racial and Ethnic Groups..............................................................................................................................20 ii. Socioeconomic Disparities............................................................................................................................21 iii. People with Disabilities ...............................................................................................................................23
V. RISK AND PROTECTIVE FACTORS AFFECTING ORAL DISEASES ................................................24
A. COMMUNITY WATER FLUORIDATION.................................................................................................................24 B. TOPICAL FLUORIDES AND FLUORIDE SUPPLEMENTS ..........................................................................................25 C. DENTAL SEALANTS ............................................................................................................................................26 D. PREVENTIVE VISITS ...........................................................................................................................................28 E. TOBACCO CONTROL ...........................................................................................................................................29 F. ORAL HEALTH EDUCATION ................................................................................................................................30 G. SCREENING FOR ORAL CANCER .........................................................................................................................32 H. NEVADA ORAL HEALTH COALITIONS ................................................................................................................33
VI. PROVISION OF DENTAL SERVICES....................................................................................................34
A. DENTAL WORKFORCE AND CAPACITY ...............................................................................................................34 i. Dental Educational Institutions ......................................................................................................................35
B. DENTAL WORKFORCE DIVERSITY ......................................................................................................................37 C. USE OF DENTAL SERVICES .................................................................................................................................38
i. General Population........................................................................................................................................38 D. DENTAL MEDICAID AND NEVADA � CHECK UP .................................................................................................39 E. COMMUNITY AND MIGRANT HEALTH CENTERS AND OTHER STATE, COUNTY, AND LOCAL PROGRAMS ............41
VII. CONCLUSIONS .........................................................................................................................................44
VIII. REFERENCES............................................................................................................................................45
APPENDIX A – THE BURDEN OF ORAL DISEASE IN NEVADA - 2005...........................................................................1 APPENDIX B: METHAMPHETAMINE USE – STATISTICS..............................................................................................5
i. National Survey on Drug Use and Health - Methamphetamine Use ................................................................5 ii. Youth Risk Behavior Survey.............................................................................................................................6
APPENDIX C: LOCAL ORAL HEALTH PROGRAM DETAILS .........................................................................................7 Statewide ..............................................................................................................................................................7 Clark County ......................................................................................................................................................15 Washoe County ..................................................................................................................................................32 Balance of the State............................................................................................................................................45
APPENDIX D: USER SURVEY ...................................................................................................................................58
4
I. INTRODUCTION The mouth is our primary connection to the world: it’s how we take in water and nutrients to sustain life, our primary means of communication, the most visible sign of our mood, and a major part of how we appear to others. Oral health is an essential and integral component of people’s overall health throughout life, and is much more than just healthy teeth. Oral refers to the whole mouth: the teeth, gums, hard and soft palate, linings of the mouth and throat, tongue, lips, salivary glands, chewing muscles, and upper and lower jaws. Not only does good oral health mean being free of tooth decay and gum disease, but it also means being free of chronic oral pain conditions, oral cancer, birth defects such as cleft lip and palate, and other conditions that affect the mouth and throat. Good oral health also includes the ability to carry on the most basic human functions such as chewing, swallowing, speaking, smiling, kissing, and singing. Because the mouth is an integral part of human anatomy, oral health is intimately related to the health of the rest of the body. For example, mounting evidence suggests that infections in the mouth such as periodontal (gum) diseases may increase the risk for heart disease, may put pregnant women at greater risk for premature delivery, and may complicate control of blood sugar for people living with diabetes. Conversely, changes in the mouth often are the first signs of problems elsewhere in the body such as infectious diseases, immune disorders, nutritional deficiencies, and cancer. This report summarizes the most current available information on the oral disease burden of people in Nevada. It also highlights groups and regions in our state that are at highest risk for oral health problems, and discusses strategies to prevent these conditions and provide access to dental care. Comparisons are made to national data whenever possible, and to Healthy People
2010 goals when appropriate. For some conditions, only national data, but not state data, is available at this time. It is hoped that the information will help raise awareness of the need for monitoring the oral health burden in Nevada and guide efforts to prevent and treat oral diseases and enhance the quality of life of Nevada’s residents.
5
II. EXECUTIVE SUMMARY The main forms of oral disease requiring attention as public health issues are dental caries (cavities) affecting teeth, periodontal (gum) diseases affecting the gums and bone supporting the teeth, and oral cancers. Dental caries begin at a young age and accumulate throughout life, underscoring the importance of starting efforts early in childhood to prevent caries. According to Oral Health in America: A
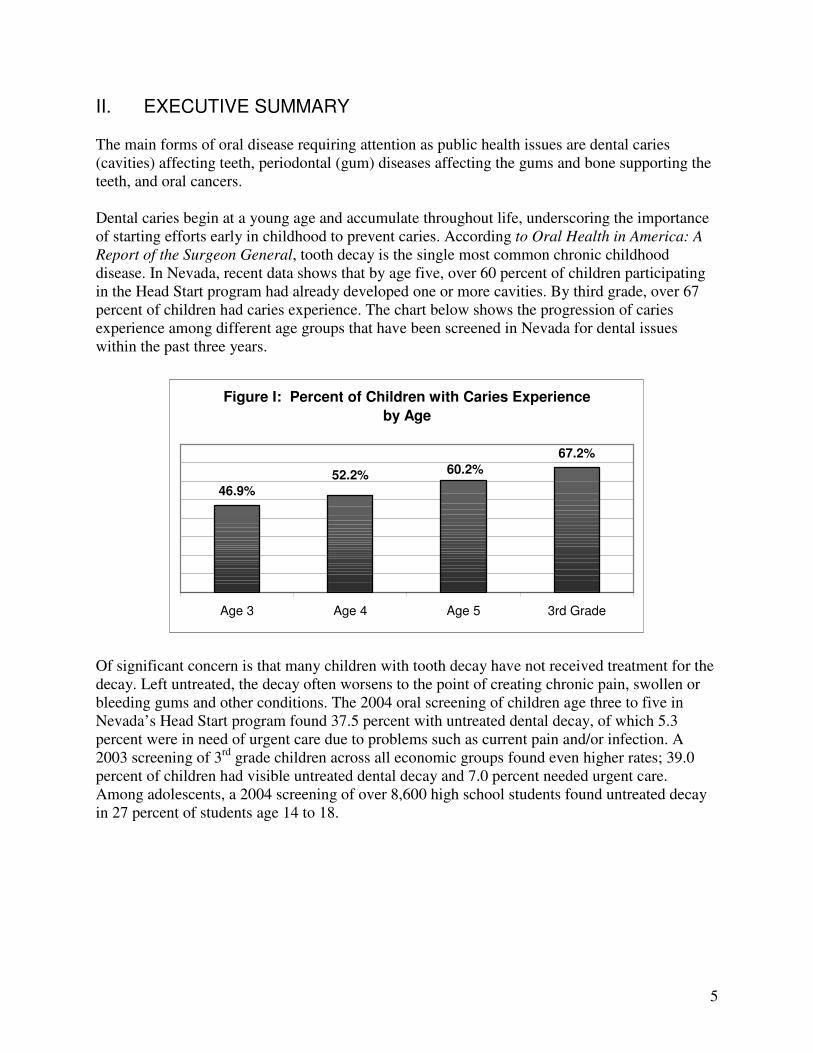
Report of the Surgeon General, tooth decay is the single most common chronic childhood disease. In Nevada, recent data shows that by age five, over 60 percent of children participating in the Head Start program had already developed one or more cavities. By third grade, over 67 percent of children had caries experience. The chart below shows the progression of caries experience among different age groups that have been screened in Nevada for dental issues within the past three years.
Figure I: Percent of Children with Caries Experience
by Age
46.9%
67.2%
60.2%52.2%
Age 3 Age 4 Age 5 3rd Grade
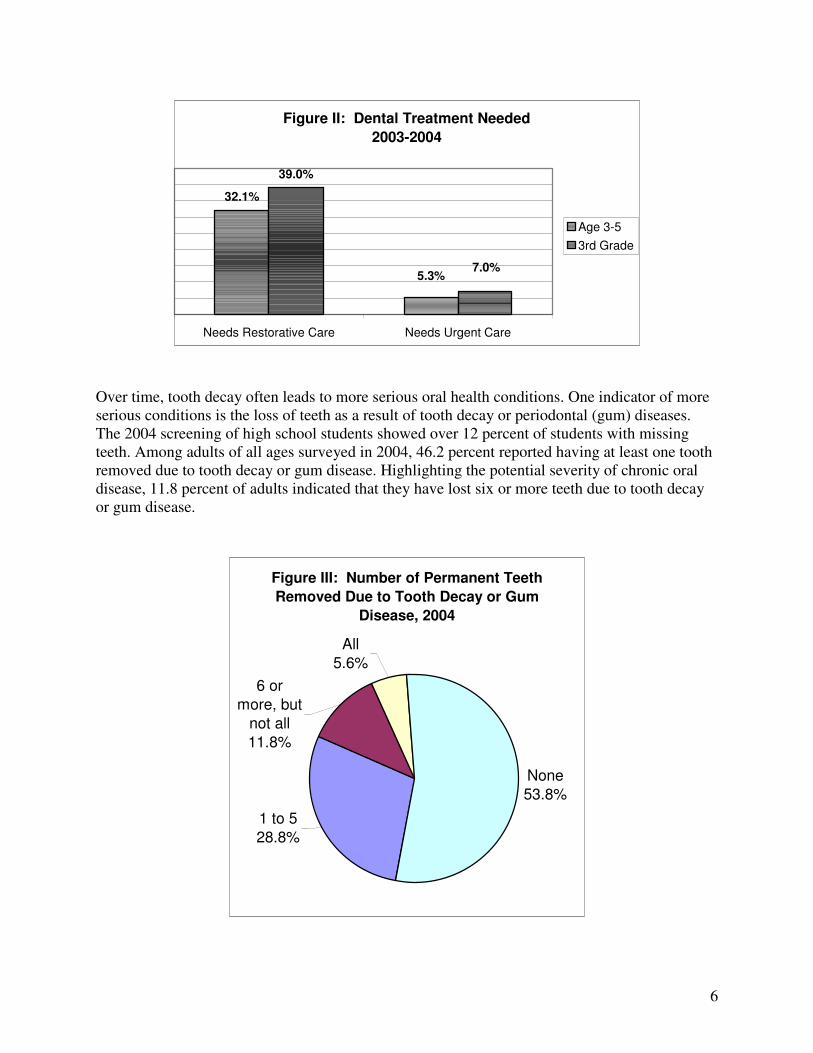
Of significant concern is that many children with tooth decay have not received treatment for the decay. Left untreated, the decay often worsens to the point of creating chronic pain, swollen or bleeding gums and other conditions. The 2004 oral screening of children age three to five in Nevada’s Head Start program found 37.5 percent with untreated dental decay, of which 5.3 percent were in need of urgent care due to problems such as current pain and/or infection. A 2003 screening of 3rd grade children across all economic groups found even higher rates; 39.0 percent of children had visible untreated dental decay and 7.0 percent needed urgent care. Among adolescents, a 2004 screening of over 8,600 high school students found untreated decay in 27 percent of students age 14 to 18.
6
Figure II: Dental Treatment Needed
2003-2004
32.1%
39.0%
5.3%7.0%
Needs Restorative Care Needs Urgent Care
Age 3-5
3rd Grade
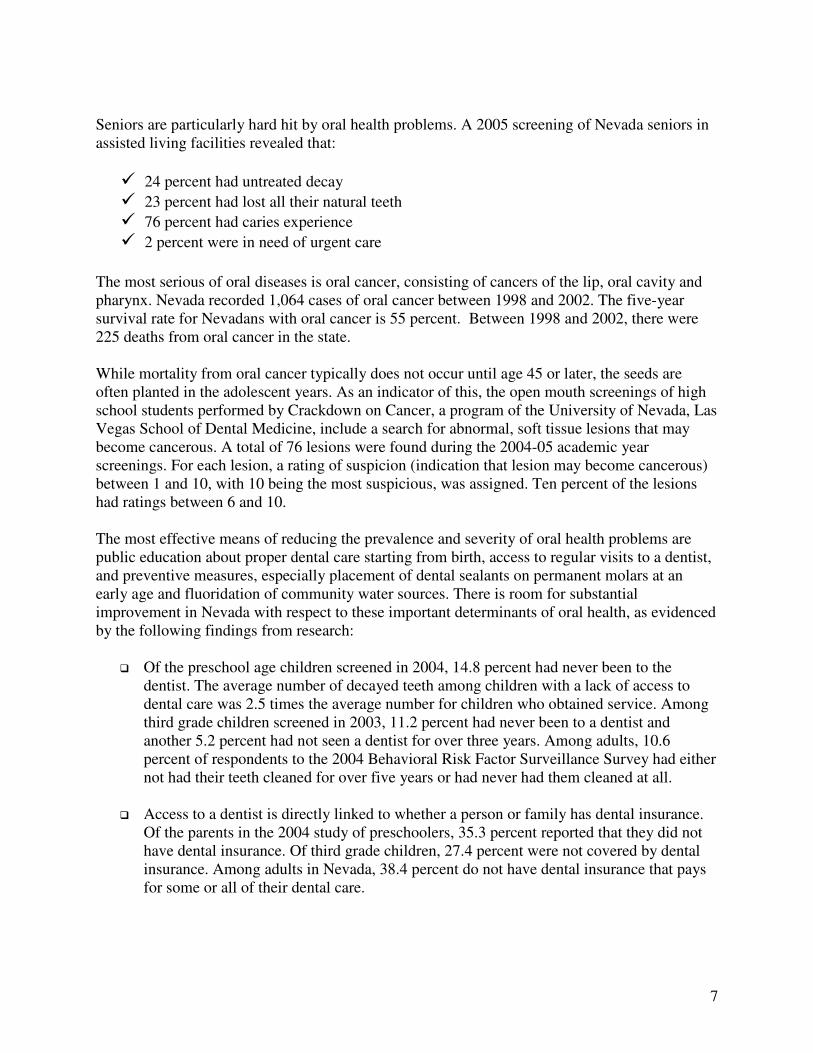
Over time, tooth decay often leads to more serious oral health conditions. One indicator of more serious conditions is the loss of teeth as a result of tooth decay or periodontal (gum) diseases. The 2004 screening of high school students showed over 12 percent of students with missing teeth. Among adults of all ages surveyed in 2004, 46.2 percent reported having at least one tooth removed due to tooth decay or gum disease. Highlighting the potential severity of chronic oral disease, 11.8 percent of adults indicated that they have lost six or more teeth due to tooth decay or gum disease.
Figure III: Number of Permanent Teeth
Removed Due to Tooth Decay or Gum
Disease, 2004
None
53.8%
6 or
more, but
not all
11.8%
1 to 5
28.8%
All
5.6%
7
Seniors are particularly hard hit by oral health problems. A 2005 screening of Nevada seniors in assisted living facilities revealed that:
� 24 percent had untreated decay � 23 percent had lost all their natural teeth � 76 percent had caries experience � 2 percent were in need of urgent care
The most serious of oral diseases is oral cancer, consisting of cancers of the lip, oral cavity and pharynx. Nevada recorded 1,064 cases of oral cancer between 1998 and 2002. The five-year survival rate for Nevadans with oral cancer is 55 percent. Between 1998 and 2002, there were 225 deaths from oral cancer in the state. While mortality from oral cancer typically does not occur until age 45 or later, the seeds are often planted in the adolescent years. As an indicator of this, the open mouth screenings of high school students performed by Crackdown on Cancer, a program of the University of Nevada, Las Vegas School of Dental Medicine, include a search for abnormal, soft tissue lesions that may become cancerous. A total of 76 lesions were found during the 2004-05 academic year screenings. For each lesion, a rating of suspicion (indication that lesion may become cancerous) between 1 and 10, with 10 being the most suspicious, was assigned. Ten percent of the lesions had ratings between 6 and 10. The most effective means of reducing the prevalence and severity of oral health problems are public education about proper dental care starting from birth, access to regular visits to a dentist, and preventive measures, especially placement of dental sealants on permanent molars at an early age and fluoridation of community water sources. There is room for substantial improvement in Nevada with respect to these important determinants of oral health, as evidenced by the following findings from research:
� Of the preschool age children screened in 2004, 14.8 percent had never been to the dentist. The average number of decayed teeth among children with a lack of access to dental care was 2.5 times the average number for children who obtained service. Among third grade children screened in 2003, 11.2 percent had never been to a dentist and another 5.2 percent had not seen a dentist for over three years. Among adults, 10.6 percent of respondents to the 2004 Behavioral Risk Factor Surveillance Survey had either not had their teeth cleaned for over five years or had never had them cleaned at all.
� Access to a dentist is directly linked to whether a person or family has dental insurance.
Of the parents in the 2004 study of preschoolers, 35.3 percent reported that they did not have dental insurance. Of third grade children, 27.4 percent were not covered by dental insurance. Among adults in Nevada, 38.4 percent do not have dental insurance that pays for some or all of their dental care.
8
� As of 2003, 33.2 percent of third graders had dental sealants placed on at least one permanent molar, well under the Healthy People 2010 goal of 50 percent. Approximately 46 percent of adolescents age 14-18 years had at least one dental sealant.
� Of the population in Nevada served by community water systems, 71 percent receives
fluoridated water, compared to the Healthy People 2010 target of 75 percent.
9
III. NATIONAL AND STATE OBJECTIVES ON ORAL HEALTH Oral Health in America: A Report of the Surgeon General (the Report) alerted Americans to the importance of oral health in their daily lives [USDHHS 2000a]. Issued in May 2000, the Report further detailed how oral health is promoted, how oral diseases and conditions are prevented and managed, and what needs and opportunities exist to enhance oral health. The Report’s message was that oral health is essential to general health and well-being and can be achieved. However, a number of barriers hinder the ability of some Americans from attaining optimal oral health. The Surgeon General’s Report concluded with a framework for action, calling for a national oral health plan to improve quality of life and eliminate oral health disparities. One component of a national oral health plan is a set of measurable and achievable objectives on key indicators of oral disease burden, oral health promotion, and oral disease prevention. A similar set of indicators was developed in November 2000 as part of Healthy People 2010, a document that presents a comprehensive, nationwide health promotion and disease prevention agenda [USDHHS 2000b]. It is designed to serve as a roadmap for improving the health of all people in the United States during the first decade of the 21st century. Included in Healthy
People 2010 are objectives for improving oral health. These objectives represent the ideas and expertise of a diverse range of individuals and organizations concerned about the Nation’s oral health. The Surgeon General’s Report on Oral Health was a wake-up call, spurring policy makers, community leaders, private industry, health professionals, the media, and the public to affirm that oral health is essential to general health and well-being and to take action. That call to action led a broad coalition of public and private organizations and individuals to generate A
National Call to Action to Promote Oral Health [USDHHS 2003]. The Vision of the Call to
Action is “To advance the general health and well-being of all Americans by creating critical partnerships at all levels of society to engage in programs to promote oral health and prevent disease.” The goals of the Call to Action reflect those of Healthy People 2010:
• To promote oral health
• To improve quality of life
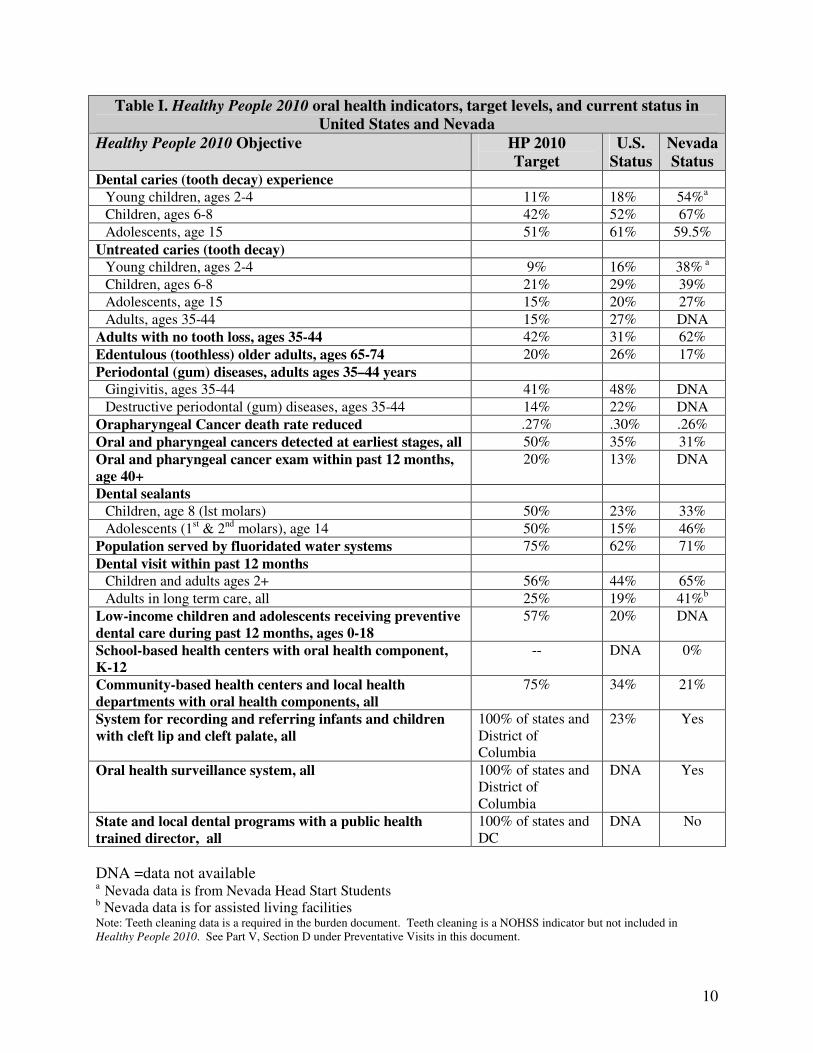
• To eliminate oral health disparities National objectives on oral health such as those in Healthy People 2010 provide measurable targets for the nation, but most core public health functions of assessment, assurance, and policy development occur at the state level. TABLE I summarizes the Healthy People 2010 Oral Health Objectives for the nation and the current status of each indicator for the United States and Nevada.
10
Table I. Healthy People 2010 oral health indicators, target levels, and current status in
United States and Nevada
Healthy People 2010 Objective HP 2010
Target
U.S.
Status
Nevada
Status Dental caries (tooth decay) experience
Young children, ages 2-4 11% 18% 54%a
Children, ages 6-8 42% 52% 67%
Adolescents, age 15 51% 61% 59.5%
Untreated caries (tooth decay)
Young children, ages 2-4 9% 16% 38% a
Children, ages 6-8 21% 29% 39%
Adolescents, age 15 15% 20% 27%
Adults, ages 35-44 15% 27% DNA
Adults with no tooth loss, ages 35-44 42% 31% 62%
Edentulous (toothless) older adults, ages 65-74 20% 26% 17%
Periodontal (gum) diseases, adults ages 35–44 years
Gingivitis, ages 35-44 41% 48% DNA
Destructive periodontal (gum) diseases, ages 35-44 14% 22% DNA
Orapharyngeal Cancer death rate reduced .27% .30% .26%
Oral and pharyngeal cancers detected at earliest stages, all 50% 35% 31%
Oral and pharyngeal cancer exam within past 12 months,
age 40+
20% 13% DNA
Dental sealants
Children, age 8 (lst molars) 50% 23% 33%
Adolescents (1st & 2nd molars), age 14 50% 15% 46%
Population served by fluoridated water systems 75% 62% 71%
Dental visit within past 12 months
Children and adults ages 2+ 56% 44% 65%
Adults in long term care, all 25% 19% 41%b
Low-income children and adolescents receiving preventive
dental care during past 12 months, ages 0-18
57% 20% DNA
School-based health centers with oral health component,
K-12
-- DNA 0%
Community-based health centers and local health
departments with oral health components, all
75% 34% 21%
System for recording and referring infants and children
with cleft lip and cleft palate, all
100% of states and District of Columbia
23% Yes
Oral health surveillance system, all 100% of states and District of Columbia
DNA Yes
State and local dental programs with a public health
trained director, all
100% of states and DC
DNA No
DNA =data not available a Nevada data is from Nevada Head Start Students
b Nevada data is for assisted living facilities Note: Teeth cleaning data is a required in the burden document. Teeth cleaning is a NOHSS indicator but not included in Healthy People 2010. See Part V, Section D under Preventative Visits in this document.
11
IV. THE BURDEN OF ORAL DISEASES
A. Prevalence of Disease and Unmet Need
i. Children
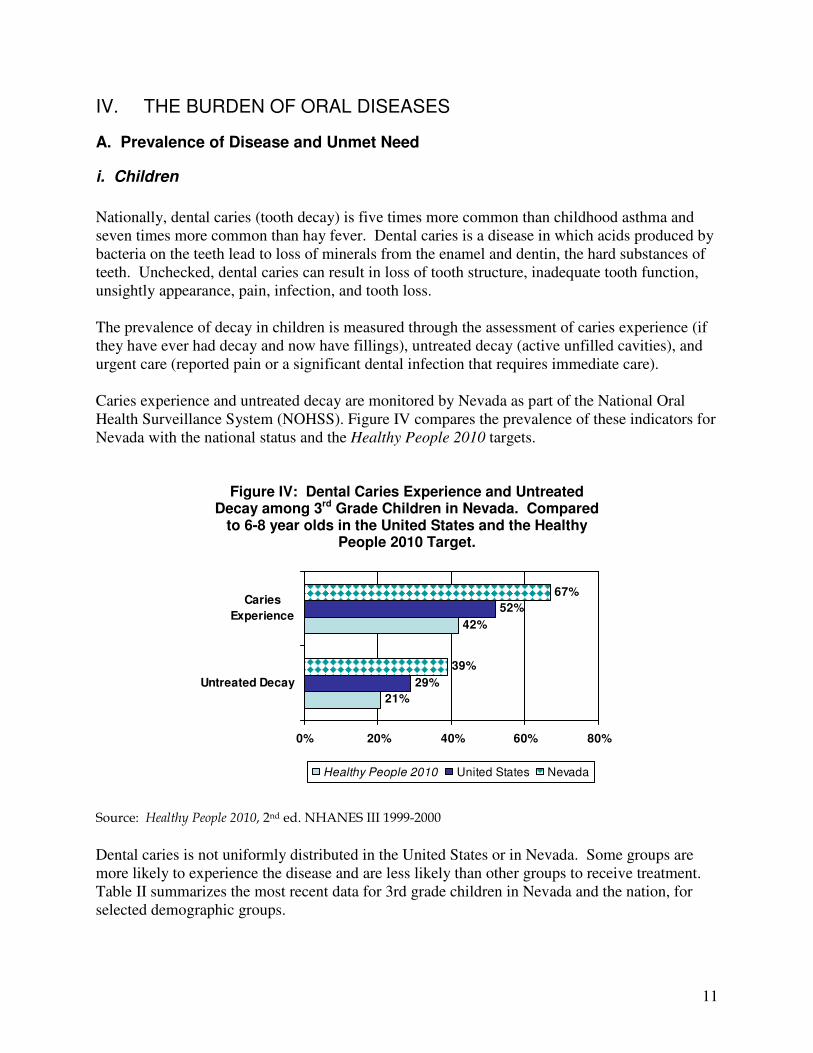
Nationally, dental caries (tooth decay) is five times more common than childhood asthma and seven times more common than hay fever. Dental caries is a disease in which acids produced by bacteria on the teeth lead to loss of minerals from the enamel and dentin, the hard substances of teeth. Unchecked, dental caries can result in loss of tooth structure, inadequate tooth function, unsightly appearance, pain, infection, and tooth loss. The prevalence of decay in children is measured through the assessment of caries experience (if they have ever had decay and now have fillings), untreated decay (active unfilled cavities), and urgent care (reported pain or a significant dental infection that requires immediate care). Caries experience and untreated decay are monitored by Nevada as part of the National Oral Health Surveillance System (NOHSS). Figure IV compares the prevalence of these indicators for Nevada with the national status and the Healthy People 2010 targets.
Figure IV: Dental Caries Experience and Untreated Decay among 3rd Grade Children in Nevada. Compared
to 6-8 year olds in the United States and the Healthy People 2010 Target.
Source: Healthy People 2010, 2nd ed. NHANES III 1999-2000
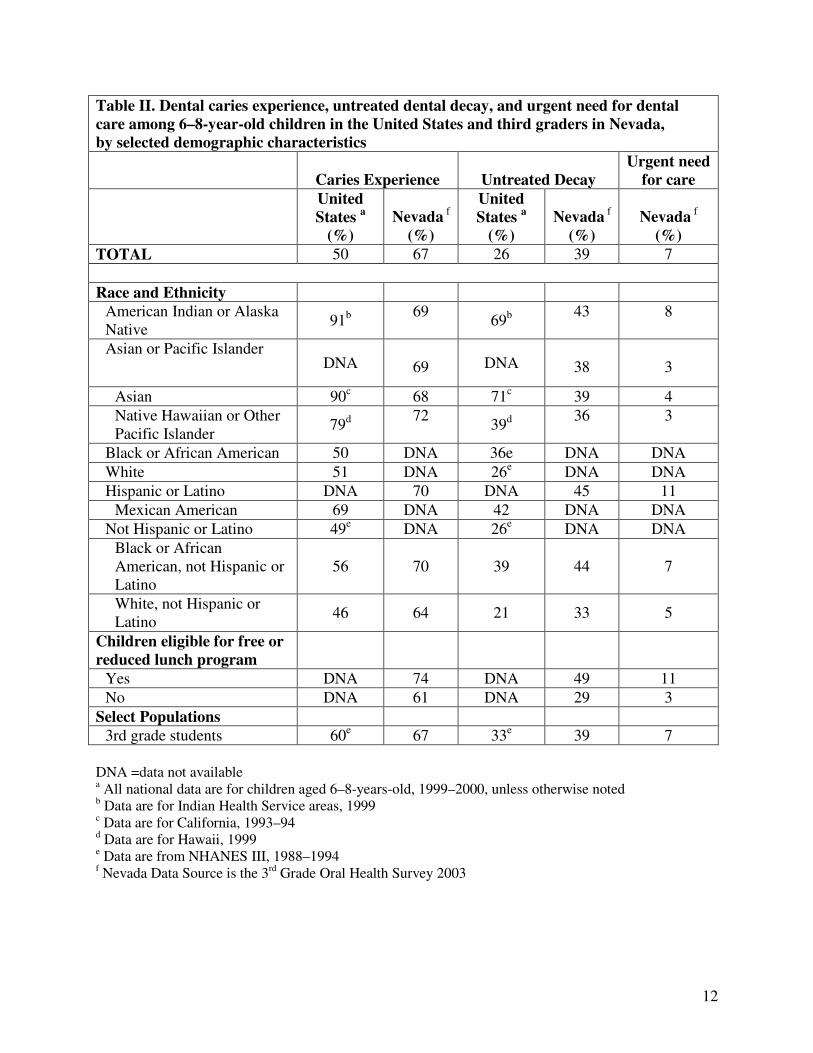
Dental caries is not uniformly distributed in the United States or in Nevada. Some groups are more likely to experience the disease and are less likely than other groups to receive treatment. Table II summarizes the most recent data for 3rd grade children in Nevada and the nation, for selected demographic groups.
21%
42%
29%
52%
39%
67%
0% 20% 40% 60% 80%
Untreated Decay
Caries
Experience
Healthy People 2010 United States Nevada
12
Table II. Dental caries experience, untreated dental decay, and urgent need for dental
care among 6–8-year-old children in the United States and third graders in Nevada,
by selected demographic characteristics
Caries Experience Untreated Decay
Urgent need
for care
United
States a
(%)
Nevada f
(%)
United
States a
(%)
Nevada f
(%)
Nevada f
(%)
TOTAL 50 67 26 39 7
Race and Ethnicity
American Indian or Alaska Native
91b 69
69b 43 8
Asian or Pacific Islander DNA
69 DNA
38
3
Asian 90c 68 71c 39 4
Native Hawaiian or Other Pacific Islander
79d 72
39d 36 3
Black or African American 50 DNA 36e DNA DNA
White 51 DNA 26e DNA DNA
Hispanic or Latino DNA 70 DNA 45 11
Mexican American 69 DNA 42 DNA DNA
Not Hispanic or Latino 49e DNA 26e DNA DNA
Black or African American, not Hispanic or Latino
56 70 39 44 7
White, not Hispanic or Latino
46 64 21 33 5
Children eligible for free or
reduced lunch program
Yes DNA 74 DNA 49 11
No DNA 61 DNA 29 3
Select Populations
3rd grade students 60e 67 33e 39 7
DNA =data not available a All national data are for children aged 6–8-years-old, 1999–2000, unless otherwise noted b Data are for Indian Health Service areas, 1999 c Data are for California, 1993–94 d Data are for Hawaii, 1999 e Data are from NHANES III, 1988–1994 f Nevada Data Source is the 3rd Grade Oral Health Survey 2003
13
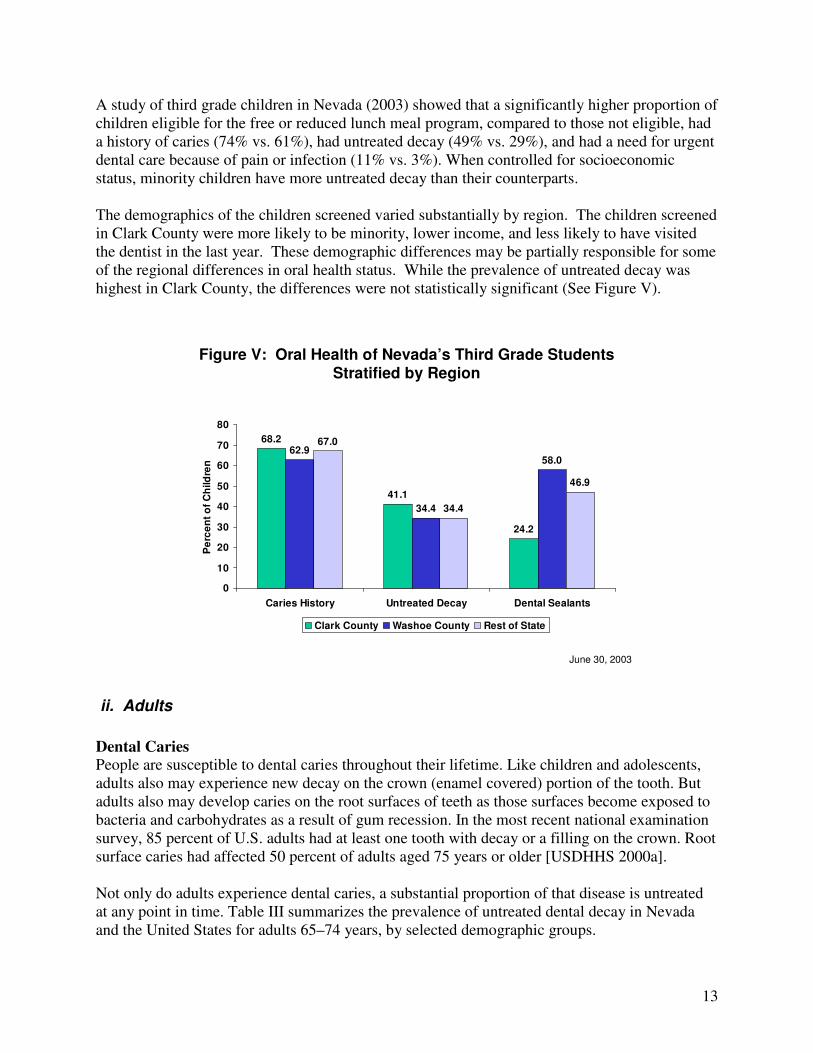
A study of third grade children in Nevada (2003) showed that a significantly higher proportion of children eligible for the free or reduced lunch meal program, compared to those not eligible, had a history of caries (74% vs. 61%), had untreated decay (49% vs. 29%), and had a need for urgent dental care because of pain or infection (11% vs. 3%). When controlled for socioeconomic status, minority children have more untreated decay than their counterparts. The demographics of the children screened varied substantially by region. The children screened in Clark County were more likely to be minority, lower income, and less likely to have visited the dentist in the last year. These demographic differences may be partially responsible for some of the regional differences in oral health status. While the prevalence of untreated decay was highest in Clark County, the differences were not statistically significant (See Figure V).
June 30, 2003
Figure V: Oral Health of Nevada’s Third Grade StudentsStratified by Region
68.2
41.1
24.2
62.9
34.4
58.0
67.0
34.4
46.9
0
10
20
30
40
50
60
70
80
Caries History Untreated Decay Dental Sealants
Pe
rce
nt
of
Ch
ild
ren
Clark County Washoe County Rest of State
ii. Adults
Dental Caries
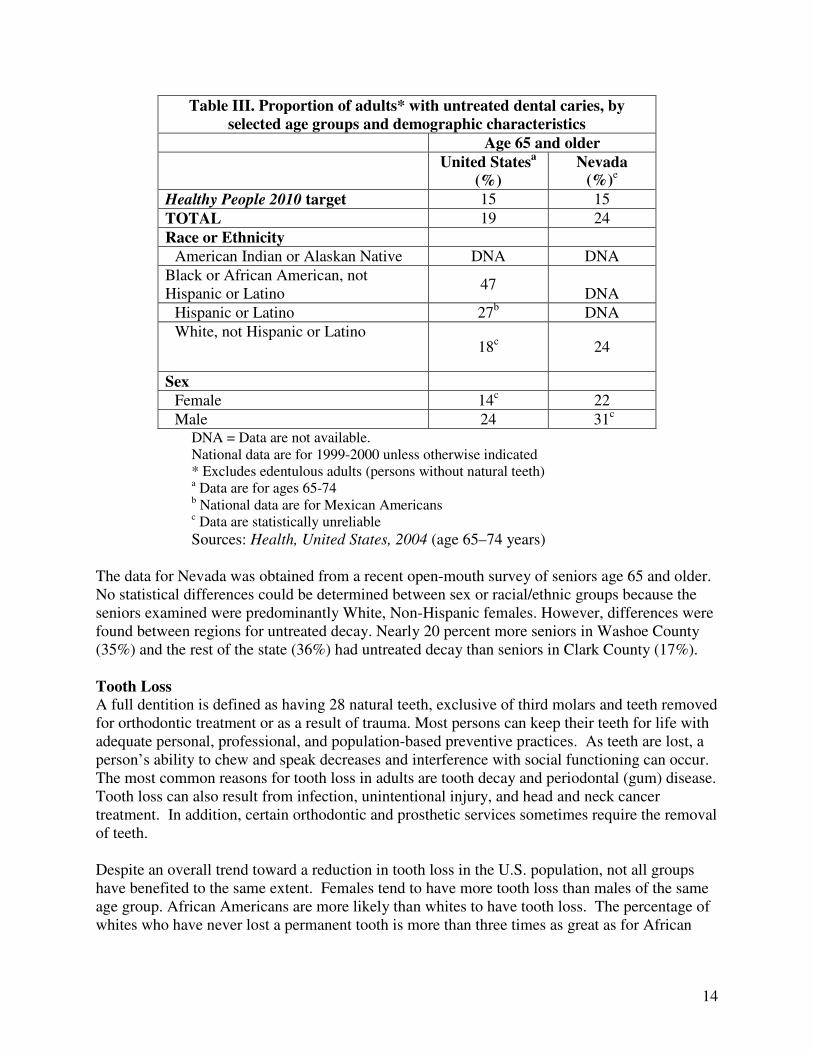
People are susceptible to dental caries throughout their lifetime. Like children and adolescents, adults also may experience new decay on the crown (enamel covered) portion of the tooth. But adults also may develop caries on the root surfaces of teeth as those surfaces become exposed to bacteria and carbohydrates as a result of gum recession. In the most recent national examination survey, 85 percent of U.S. adults had at least one tooth with decay or a filling on the crown. Root surface caries had affected 50 percent of adults aged 75 years or older [USDHHS 2000a]. Not only do adults experience dental caries, a substantial proportion of that disease is untreated at any point in time. Table III summarizes the prevalence of untreated dental decay in Nevada and the United States for adults 65–74 years, by selected demographic groups.
14
Table III. Proportion of adults* with untreated dental caries, by
selected age groups and demographic characteristics
Age 65 and older
United Statesa
(%)
Nevada
(%)e
Healthy People 2010 target 15 15
TOTAL 19 24
Race or Ethnicity
American Indian or Alaskan Native DNA DNA
Black or African American, not Hispanic or Latino
47
DNA
Hispanic or Latino 27b DNA
White, not Hispanic or Latino 18c 24
Sex
Female 14c 22
Male 24 31c
DNA = Data are not available. National data are for 1999-2000 unless otherwise indicated * Excludes edentulous adults (persons without natural teeth) a Data are for ages 65-74 b National data are for Mexican Americans c Data are statistically unreliable
Sources: Health, United States, 2004 (age 65–74 years) The data for Nevada was obtained from a recent open-mouth survey of seniors age 65 and older. No statistical differences could be determined between sex or racial/ethnic groups because the seniors examined were predominantly White, Non-Hispanic females. However, differences were found between regions for untreated decay. Nearly 20 percent more seniors in Washoe County (35%) and the rest of the state (36%) had untreated decay than seniors in Clark County (17%). Tooth Loss
A full dentition is defined as having 28 natural teeth, exclusive of third molars and teeth removed for orthodontic treatment or as a result of trauma. Most persons can keep their teeth for life with adequate personal, professional, and population-based preventive practices. As teeth are lost, a person’s ability to chew and speak decreases and interference with social functioning can occur. The most common reasons for tooth loss in adults are tooth decay and periodontal (gum) disease. Tooth loss can also result from infection, unintentional injury, and head and neck cancer treatment. In addition, certain orthodontic and prosthetic services sometimes require the removal of teeth. Despite an overall trend toward a reduction in tooth loss in the U.S. population, not all groups have benefited to the same extent. Females tend to have more tooth loss than males of the same age group. African Americans are more likely than whites to have tooth loss. The percentage of whites who have never lost a permanent tooth is more than three times as great as for African
15
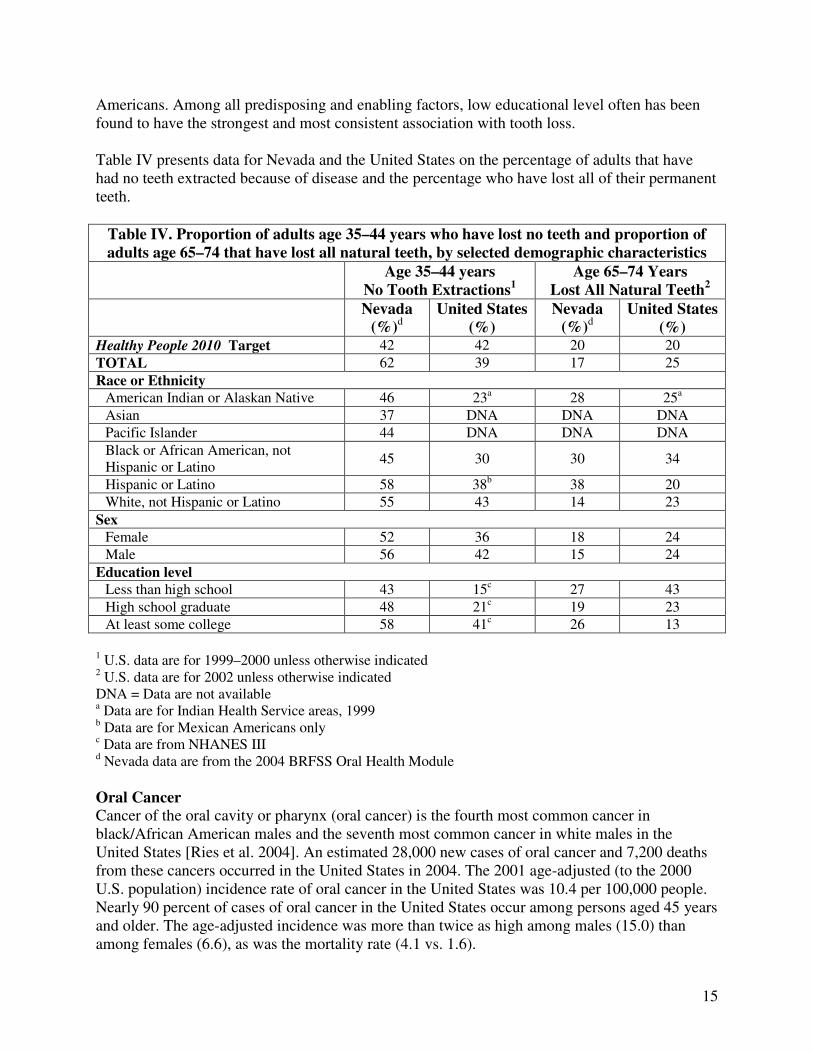
Americans. Among all predisposing and enabling factors, low educational level often has been found to have the strongest and most consistent association with tooth loss. Table IV presents data for Nevada and the United States on the percentage of adults that have had no teeth extracted because of disease and the percentage who have lost all of their permanent teeth.
Table IV. Proportion of adults age 35–44 years who have lost no teeth and proportion of
adults age 65–74 that have lost all natural teeth, by selected demographic characteristics
Age 35–44 years
No Tooth Extractions1
Age 65–74 Years
Lost All Natural Teeth2
Nevada
(%)d
United States
(%)
Nevada
(%)d
United States
(%) Healthy People 2010 Target 42 42 20 20
TOTAL 62 39 17 25
Race or Ethnicity
American Indian or Alaskan Native 46 23a 28 25a
Asian 37 DNA DNA DNA
Pacific Islander 44 DNA DNA DNA
Black or African American, not Hispanic or Latino
45 30 30 34
Hispanic or Latino 58 38b 38 20
White, not Hispanic or Latino 55 43 14 23
Sex
Female 52 36 18 24
Male 56 42 15 24
Education level
Less than high school 43 15c 27 43
High school graduate 48 21c 19 23
At least some college 58 41c 26 13
1 U.S. data are for 1999–2000 unless otherwise indicated 2 U.S. data are for 2002 unless otherwise indicated DNA = Data are not available a Data are for Indian Health Service areas, 1999 b Data are for Mexican Americans only c Data are from NHANES III d Nevada data are from the 2004 BRFSS Oral Health Module
Oral Cancer
Cancer of the oral cavity or pharynx (oral cancer) is the fourth most common cancer in black/African American males and the seventh most common cancer in white males in the United States [Ries et al. 2004]. An estimated 28,000 new cases of oral cancer and 7,200 deaths from these cancers occurred in the United States in 2004. The 2001 age-adjusted (to the 2000 U.S. population) incidence rate of oral cancer in the United States was 10.4 per 100,000 people. Nearly 90 percent of cases of oral cancer in the United States occur among persons aged 45 years and older. The age-adjusted incidence was more than twice as high among males (15.0) than among females (6.6), as was the mortality rate (4.1 vs. 1.6).
16
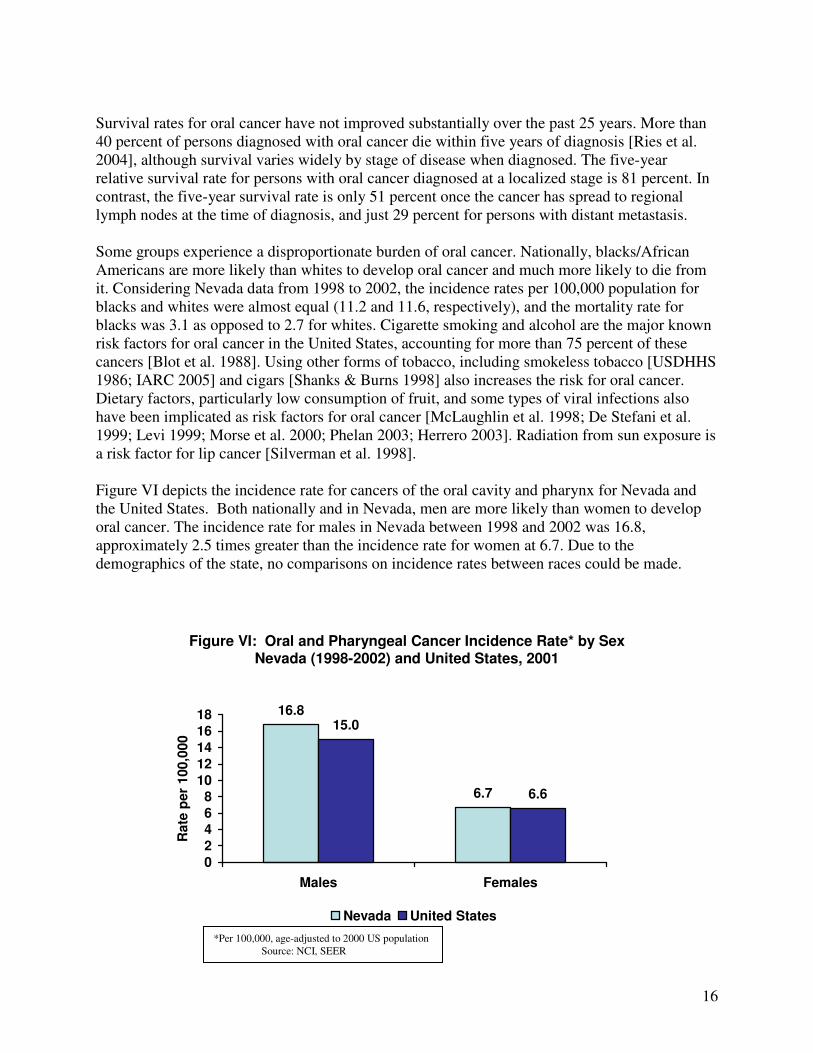
Survival rates for oral cancer have not improved substantially over the past 25 years. More than 40 percent of persons diagnosed with oral cancer die within five years of diagnosis [Ries et al. 2004], although survival varies widely by stage of disease when diagnosed. The five-year relative survival rate for persons with oral cancer diagnosed at a localized stage is 81 percent. In contrast, the five-year survival rate is only 51 percent once the cancer has spread to regional lymph nodes at the time of diagnosis, and just 29 percent for persons with distant metastasis. Some groups experience a disproportionate burden of oral cancer. Nationally, blacks/African Americans are more likely than whites to develop oral cancer and much more likely to die from it. Considering Nevada data from 1998 to 2002, the incidence rates per 100,000 population for blacks and whites were almost equal (11.2 and 11.6, respectively), and the mortality rate for blacks was 3.1 as opposed to 2.7 for whites. Cigarette smoking and alcohol are the major known risk factors for oral cancer in the United States, accounting for more than 75 percent of these cancers [Blot et al. 1988]. Using other forms of tobacco, including smokeless tobacco [USDHHS 1986; IARC 2005] and cigars [Shanks & Burns 1998] also increases the risk for oral cancer. Dietary factors, particularly low consumption of fruit, and some types of viral infections also have been implicated as risk factors for oral cancer [McLaughlin et al. 1998; De Stefani et al. 1999; Levi 1999; Morse et al. 2000; Phelan 2003; Herrero 2003]. Radiation from sun exposure is a risk factor for lip cancer [Silverman et al. 1998]. Figure VI depicts the incidence rate for cancers of the oral cavity and pharynx for Nevada and the United States. Both nationally and in Nevada, men are more likely than women to develop oral cancer. The incidence rate for males in Nevada between 1998 and 2002 was 16.8, approximately 2.5 times greater than the incidence rate for women at 6.7. Due to the demographics of the state, no comparisons on incidence rates between races could be made.
Figure VI: Oral and Pharyngeal Cancer Incidence Rate* by Sex Nevada (1998-2002) and United States, 2001
16.8
6.7
15.0
6.6
02468
1012141618
Males Females
Rate
per
100,0
00
Nevada United States
*Per 100,000, age-adjusted to 2000 US population Source: NCI, SEER
17
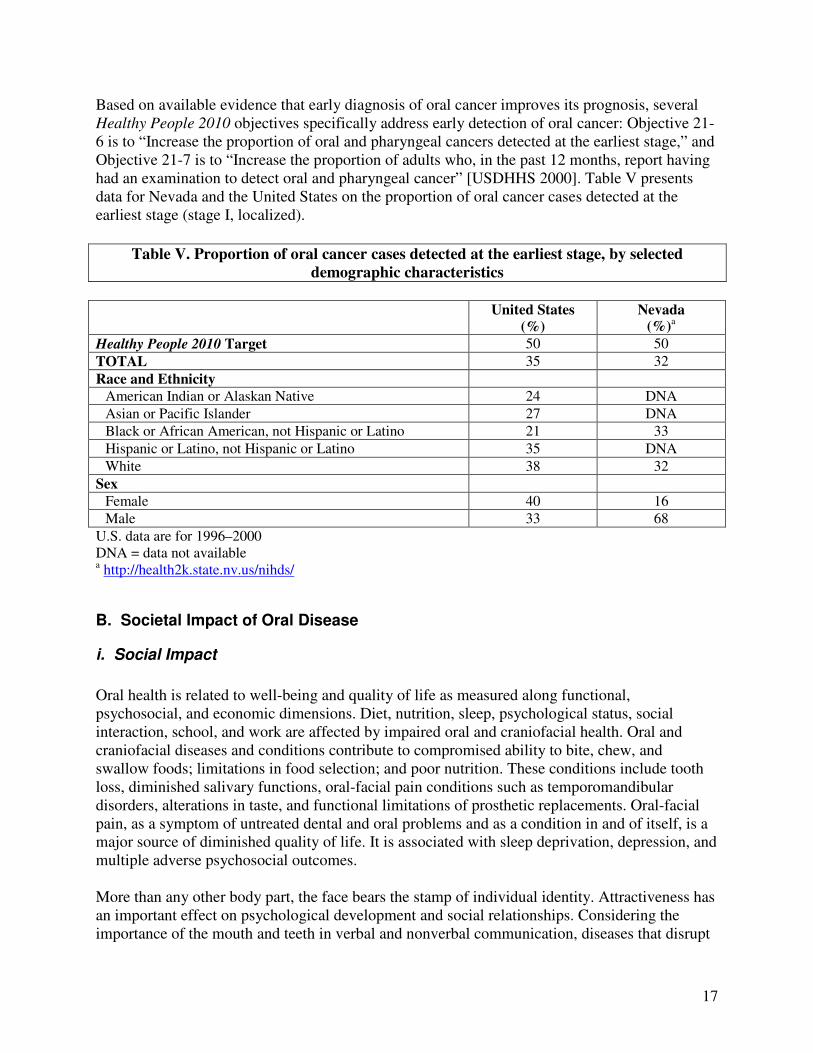
Based on available evidence that early diagnosis of oral cancer improves its prognosis, several Healthy People 2010 objectives specifically address early detection of oral cancer: Objective 21-6 is to “Increase the proportion of oral and pharyngeal cancers detected at the earliest stage,” and Objective 21-7 is to “Increase the proportion of adults who, in the past 12 months, report having had an examination to detect oral and pharyngeal cancer” [USDHHS 2000]. Table V presents data for Nevada and the United States on the proportion of oral cancer cases detected at the earliest stage (stage I, localized).
Table V. Proportion of oral cancer cases detected at the earliest stage, by selected
demographic characteristics
United States
(%)
Nevada (%)
a
Healthy People 2010 Target 50 50
TOTAL 35 32
Race and Ethnicity
American Indian or Alaskan Native 24 DNA
Asian or Pacific Islander 27 DNA
Black or African American, not Hispanic or Latino 21 33
Hispanic or Latino, not Hispanic or Latino 35 DNA
White 38 32
Sex
Female 40 16
Male 33 68
U.S. data are for 1996–2000 DNA = data not available a http://health2k.state.nv.us/nihds/
B. Societal Impact of Oral Disease
i. Social Impact
Oral health is related to well-being and quality of life as measured along functional, psychosocial, and economic dimensions. Diet, nutrition, sleep, psychological status, social interaction, school, and work are affected by impaired oral and craniofacial health. Oral and craniofacial diseases and conditions contribute to compromised ability to bite, chew, and swallow foods; limitations in food selection; and poor nutrition. These conditions include tooth loss, diminished salivary functions, oral-facial pain conditions such as temporomandibular disorders, alterations in taste, and functional limitations of prosthetic replacements. Oral-facial pain, as a symptom of untreated dental and oral problems and as a condition in and of itself, is a major source of diminished quality of life. It is associated with sleep deprivation, depression, and multiple adverse psychosocial outcomes. More than any other body part, the face bears the stamp of individual identity. Attractiveness has an important effect on psychological development and social relationships. Considering the importance of the mouth and teeth in verbal and nonverbal communication, diseases that disrupt
18
their functions are likely to damage self-image and alter the ability to sustain and build social relationships. The social functions of individuals encompass a variety of roles, from intimate interpersonal contacts to participation in social or community activities. Dental diseases and disorders can interfere with these social roles at any or all levels. Whether because of social embarrassment or functional problems, people with oral conditions may avoid conversation or laughing, smiling, or other nonverbal expressions that show their mouth and teeth.
ii. Economic Impact
Direct Costs of Oral Diseases Expenditures for dental services in the United States in 2003 were $74.3 billion, 4.4 percent of the total spent on health care that year (Centers for Medicare & Medicaid Services 2004). In Nevada in 2000, $468 million were spent on dental services. That figure represents 6.8 percent of total health care expenditures in Nevada for that year. A large proportion of dental care is paid out-of-pocket by patients. Nationally in 2003, 44 percent of dental care was paid out-of-pocket, 49 percent was paid by private dental insurance, and seven percent was paid by federal or state government sources. In comparison, 10 percent of physician and clinical services were paid out-of pocket, 50 percent were covered by private medical insurance, and 33 percent were paid by government sources (Centers for Medicare & Medicaid Services, Office of the Actuary, National Health Statistics Group 2005. http://www.cms.hhs.gov/statistics/nhe/definitions-sources-methods/) Indirect Costs of Oral Diseases Oral and craniofacial diseases and their treatment place a burden on society in the form of lost days and years of productive work. In 1996, the most recent year for which national data are available, U.S. school children missed a total of 1.6 million days of schools due to acute dental conditions, or more than three days for every 100 students (USDHHS 2000a). Acute dental conditions were responsible for more than 2.4 million days of work loss, and contributed to a range of problems for employed adults, including restricted activity and bed days. In addition, conditions such as oral and pharyngeal cancers contribute to premature death and can be measured by years of life lost.
iii. Oral Disease and Other Health Conditions
Oral health and general health are intimately associated with each other. Many systemic diseases and conditions have oral signs and symptoms, and these manifestations may be the initial sign of clinical disease and therefore may serve to inform health care providers and individuals of the need for further assessment. The oral cavity is a portal of entry as well as the site of disease for bacterial and viral infections that affect general health status. Recent research suggests that inflammation associated with periodontitis may increase the risk for heart disease and stroke, premature births in some females, difficulty in controlling blood sugar in people with diabetes, and respiratory infection in susceptible individuals [Dasanayake 1998; Offenbacher et al. 2001; Davenport et al. 1998; Beck et al. 1998; Scannapieco et al. 2003; Taylor 2001]. More research is needed in these areas.
19
Diabetes in Nevada Diabetes research indicates that it is one of the most controllable and often preventable chronic diseases. Despite this promising research, diabetes prevalence rates are increasing in Nevada from 4.2 percent in 1996 to 6.3 percent in 2003. The Nevada Diabetes Prevention and Control Program tracks diabetes care and management data to determine the progress in reducing the complications of diabetes. Current diabetes care and management recommendations include advice to get a dental exam two times each year to prevent gum disease and loss of teeth and to tell your dentist you have diabetes. (Nevada State Health Division, Bureau of Community Health, Diabetes Prevention and Control Program - Diabetes in Nevada, A Report and Performance Improvement Plan. http://health2k.state.nv.us/diabetes/) One of the national health objectives for 2010 is to increase the proportion of adults with diabetes who have an annual dental examination to at least 71 percent (objective 5-15). According to the CDC Weekly Report dated November 25, 2005, the proportion of adults in Nevada with diabetes who reported visiting a dentist within the past 12 months was 76.7 percent, up from 70.2 percent in 1999. The median national figures were 67.3 percent for 2004 and 65.9 percent for 1999.
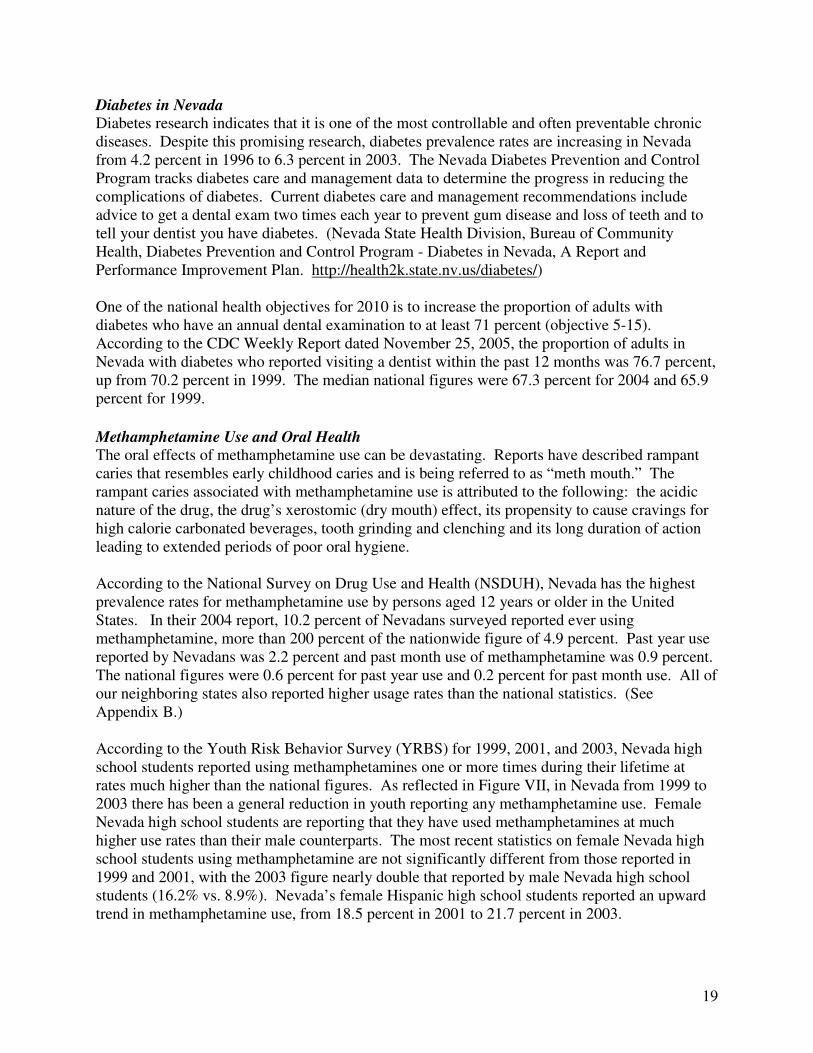
Methamphetamine Use and Oral Health The oral effects of methamphetamine use can be devastating. Reports have described rampant caries that resembles early childhood caries and is being referred to as “meth mouth.” The rampant caries associated with methamphetamine use is attributed to the following: the acidic nature of the drug, the drug’s xerostomic (dry mouth) effect, its propensity to cause cravings for high calorie carbonated beverages, tooth grinding and clenching and its long duration of action leading to extended periods of poor oral hygiene. According to the National Survey on Drug Use and Health (NSDUH), Nevada has the highest prevalence rates for methamphetamine use by persons aged 12 years or older in the United States. In their 2004 report, 10.2 percent of Nevadans surveyed reported ever using methamphetamine, more than 200 percent of the nationwide figure of 4.9 percent. Past year use reported by Nevadans was 2.2 percent and past month use of methamphetamine was 0.9 percent. The national figures were 0.6 percent for past year use and 0.2 percent for past month use. All of our neighboring states also reported higher usage rates than the national statistics. (See Appendix B.) According to the Youth Risk Behavior Survey (YRBS) for 1999, 2001, and 2003, Nevada high school students reported using methamphetamines one or more times during their lifetime at rates much higher than the national figures. As reflected in Figure VII, in Nevada from 1999 to 2003 there has been a general reduction in youth reporting any methamphetamine use. Female Nevada high school students are reporting that they have used methamphetamines at much higher use rates than their male counterparts. The most recent statistics on female Nevada high school students using methamphetamine are not significantly different from those reported in 1999 and 2001, with the 2003 figure nearly double that reported by male Nevada high school students (16.2% vs. 8.9%). Nevada’s female Hispanic high school students reported an upward trend in methamphetamine use, from 18.5 percent in 2001 to 21.7 percent in 2003.
20
Figure VII: YRBS 1999, 2001, 2003
% of Youth Reporting
Any Methamphetamine Use
16.2 15.6
12.5
9.1 9.87.6
0
5
10
15
20
1999 2001 2003P
erc
en
t
Nevada
U.S.
C. Disparities
i. Racial and Ethnic Groups
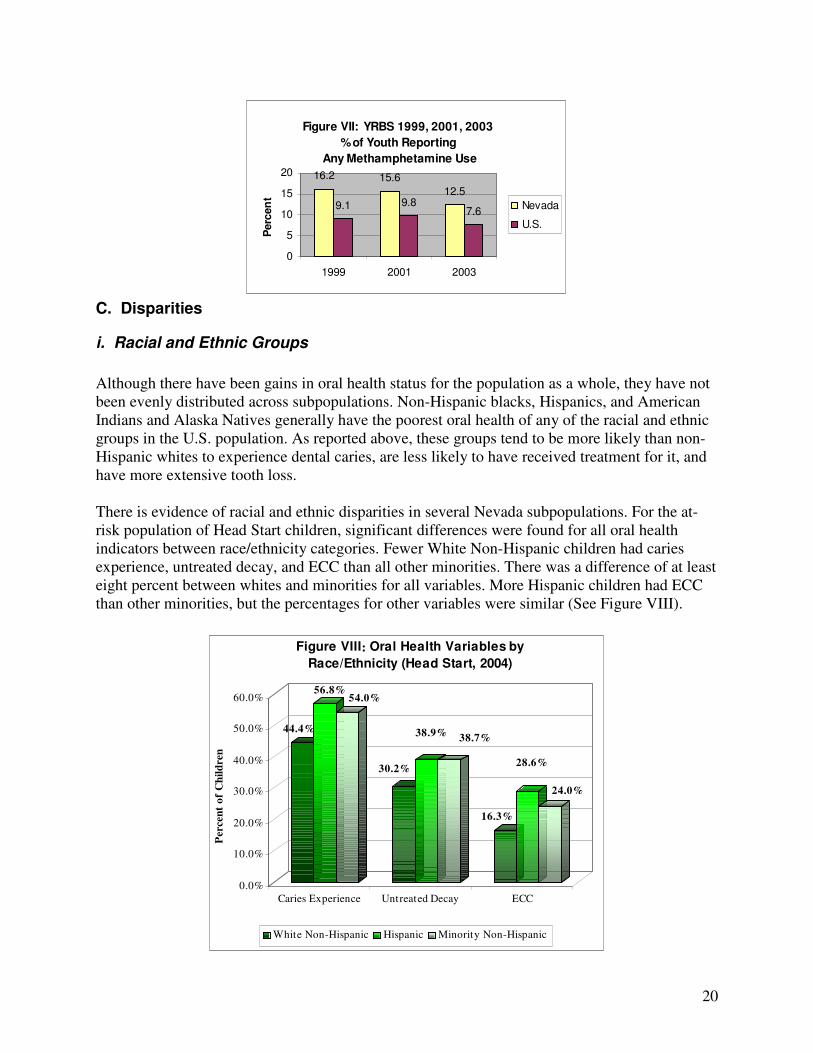
Although there have been gains in oral health status for the population as a whole, they have not been evenly distributed across subpopulations. Non-Hispanic blacks, Hispanics, and American Indians and Alaska Natives generally have the poorest oral health of any of the racial and ethnic groups in the U.S. population. As reported above, these groups tend to be more likely than non-Hispanic whites to experience dental caries, are less likely to have received treatment for it, and have more extensive tooth loss. There is evidence of racial and ethnic disparities in several Nevada subpopulations. For the at-risk population of Head Start children, significant differences were found for all oral health indicators between race/ethnicity categories. Fewer White Non-Hispanic children had caries experience, untreated decay, and ECC than all other minorities. There was a difference of at least eight percent between whites and minorities for all variables. More Hispanic children had ECC than other minorities, but the percentages for other variables were similar (See Figure VIII).
44.4%
56.8%54.0%
30.2%
38.9%38.7%
16.3%
28.6%
24.0%
0.0%
10.0%
20.0%
30.0%
40.0%
50.0%
60.0%
Percen
t o
f C
hil
dren
Caries Experience Untreated Decay ECC
Figure VIII: Oral Health Variables by
Race/Ethnicity (Head Start, 2004)
White Non-Hispanic Hispanic Minority Non-Hispanic
21
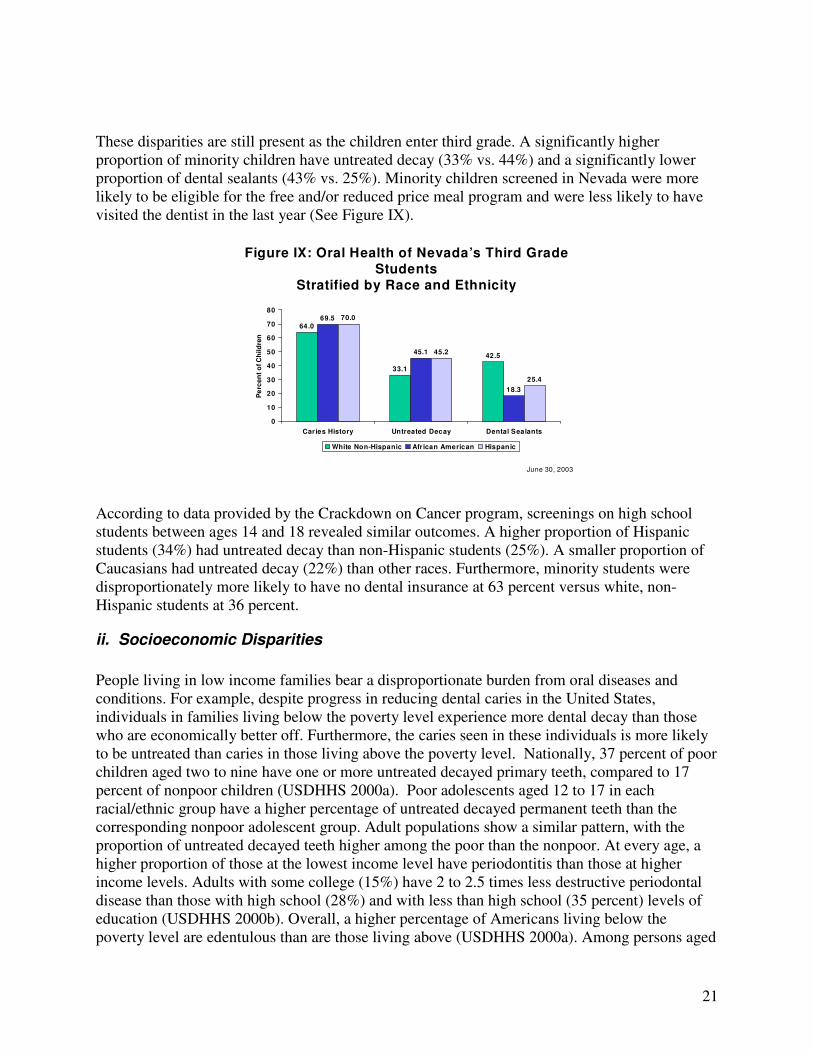
These disparities are still present as the children enter third grade. A significantly higher proportion of minority children have untreated decay (33% vs. 44%) and a significantly lower proportion of dental sealants (43% vs. 25%). Minority children screened in Nevada were more likely to be eligible for the free and/or reduced price meal program and were less likely to have visited the dentist in the last year (See Figure IX).
June 30, 2003
Figure IX: Oral Health of Nevada’s Third Grade Students
Stratified by Race and Ethnicity
64.0
33.1
42.5
69.5
45.1
18.3
70.0
45.2
25.4
0
10
20
30
40
50
60
70
80
Caries History Untreated Decay Dental Sealants
Pe
rce
nt
of
Ch
ild
ren
White Non-Hispanic African American Hispanic
According to data provided by the Crackdown on Cancer program, screenings on high school students between ages 14 and 18 revealed similar outcomes. A higher proportion of Hispanic students (34%) had untreated decay than non-Hispanic students (25%). A smaller proportion of Caucasians had untreated decay (22%) than other races. Furthermore, minority students were disproportionately more likely to have no dental insurance at 63 percent versus white, non-Hispanic students at 36 percent.
ii. Socioeconomic Disparities
People living in low income families bear a disproportionate burden from oral diseases and conditions. For example, despite progress in reducing dental caries in the United States, individuals in families living below the poverty level experience more dental decay than those who are economically better off. Furthermore, the caries seen in these individuals is more likely to be untreated than caries in those living above the poverty level. Nationally, 37 percent of poor children aged two to nine have one or more untreated decayed primary teeth, compared to 17 percent of nonpoor children (USDHHS 2000a). Poor adolescents aged 12 to 17 in each racial/ethnic group have a higher percentage of untreated decayed permanent teeth than the corresponding nonpoor adolescent group. Adult populations show a similar pattern, with the proportion of untreated decayed teeth higher among the poor than the nonpoor. At every age, a higher proportion of those at the lowest income level have periodontitis than those at higher income levels. Adults with some college (15%) have 2 to 2.5 times less destructive periodontal disease than those with high school (28%) and with less than high school (35 percent) levels of education (USDHHS 2000b). Overall, a higher percentage of Americans living below the poverty level are edentulous than are those living above (USDHHS 2000a). Among persons aged
22
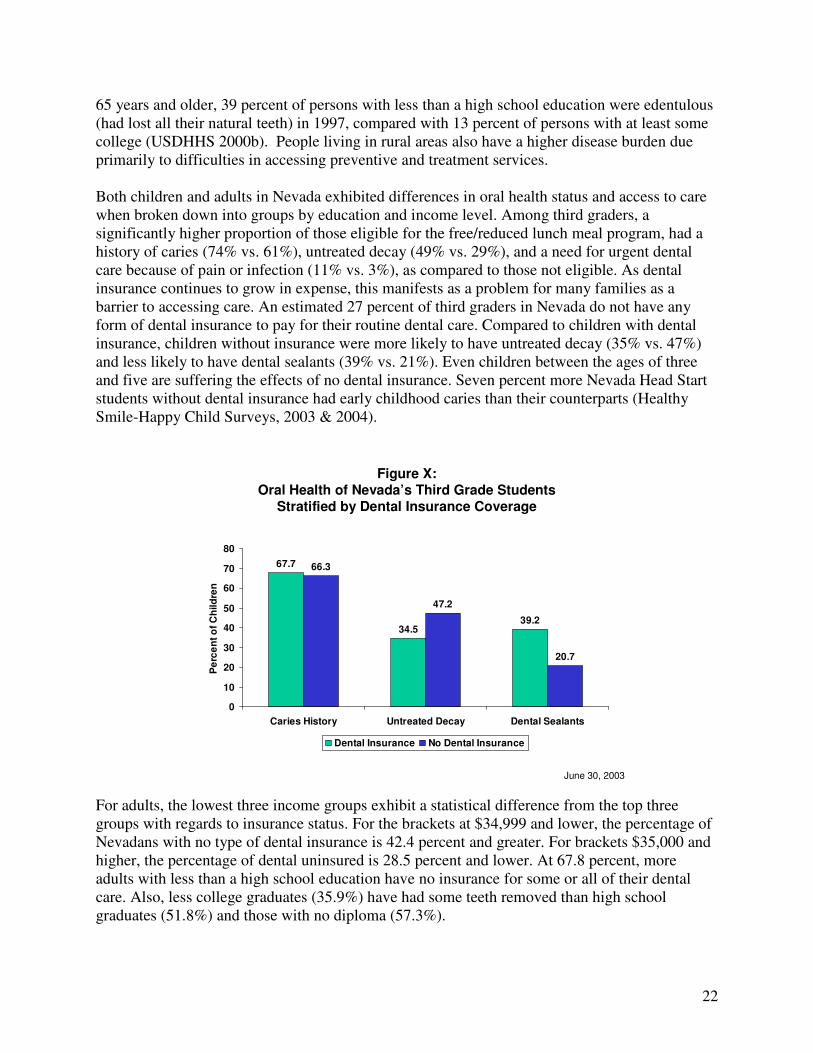
65 years and older, 39 percent of persons with less than a high school education were edentulous (had lost all their natural teeth) in 1997, compared with 13 percent of persons with at least some college (USDHHS 2000b). People living in rural areas also have a higher disease burden due primarily to difficulties in accessing preventive and treatment services. Both children and adults in Nevada exhibited differences in oral health status and access to care when broken down into groups by education and income level. Among third graders, a significantly higher proportion of those eligible for the free/reduced lunch meal program, had a history of caries (74% vs. 61%), untreated decay (49% vs. 29%), and a need for urgent dental care because of pain or infection (11% vs. 3%), as compared to those not eligible. As dental insurance continues to grow in expense, this manifests as a problem for many families as a barrier to accessing care. An estimated 27 percent of third graders in Nevada do not have any form of dental insurance to pay for their routine dental care. Compared to children with dental insurance, children without insurance were more likely to have untreated decay (35% vs. 47%) and less likely to have dental sealants (39% vs. 21%). Even children between the ages of three and five are suffering the effects of no dental insurance. Seven percent more Nevada Head Start students without dental insurance had early childhood caries than their counterparts (Healthy Smile-Happy Child Surveys, 2003 & 2004).
June 30, 2003
Figure X:Oral Health of Nevada’s Third Grade Students
Stratified by Dental Insurance Coverage
67.7
34.539.2
66.3
47.2
20.7
0
10
20
30
40
50
60
70
80
Caries History Untreated Decay Dental Sealants
Pe
rce
nt
of
Ch
ild
ren
Dental Insurance No Dental Insurance
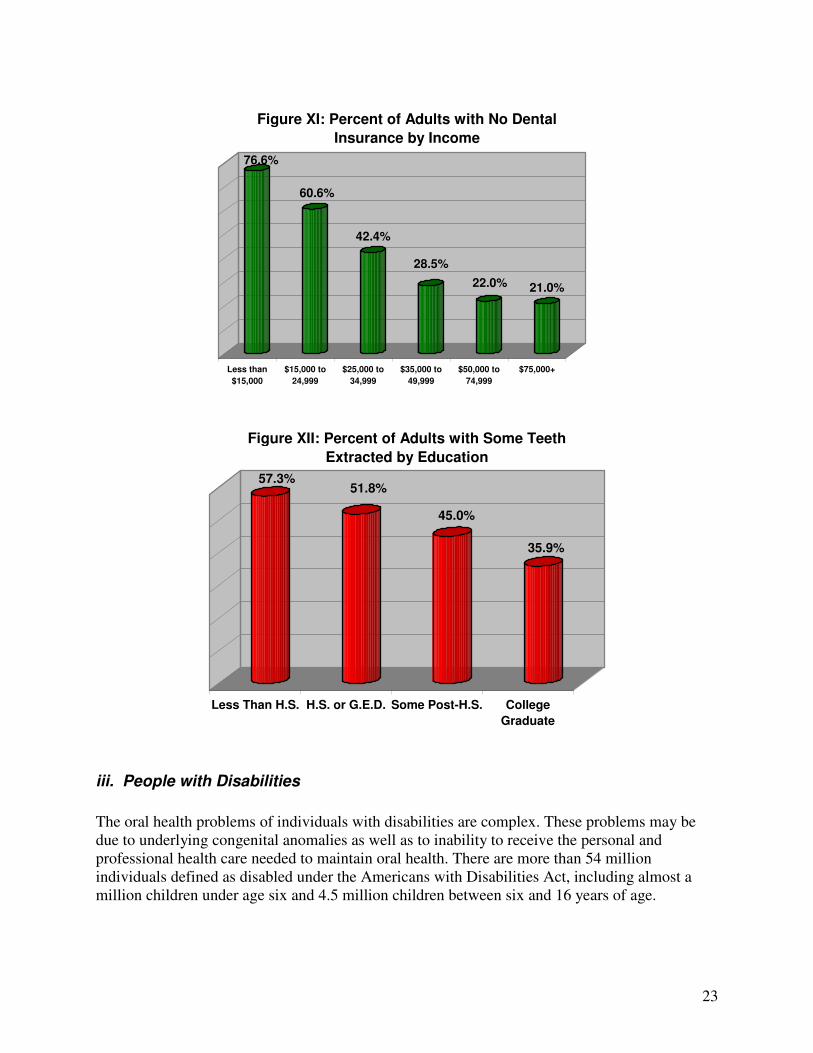
For adults, the lowest three income groups exhibit a statistical difference from the top three groups with regards to insurance status. For the brackets at $34,999 and lower, the percentage of Nevadans with no type of dental insurance is 42.4 percent and greater. For brackets $35,000 and higher, the percentage of dental uninsured is 28.5 percent and lower. At 67.8 percent, more adults with less than a high school education have no insurance for some or all of their dental care. Also, less college graduates (35.9%) have had some teeth removed than high school graduates (51.8%) and those with no diploma (57.3%).
23
76.6%
60.6%
42.4%
28.5%
22.0% 21.0%
Less than
$15,000
$15,000 to
24,999
$25,000 to
34,999
$35,000 to
49,999
$50,000 to
74,999
$75,000+
Figure XI: Percent of Adults with No Dental
Insurance by Income
57.3%51.8%
45.0%
35.9%
Less Than H.S. H.S. or G.E.D. Some Post-H.S. College
Graduate
Figure XII: Percent of Adults with Some Teeth
Extracted by Education
iii. People with Disabilities
The oral health problems of individuals with disabilities are complex. These problems may be due to underlying congenital anomalies as well as to inability to receive the personal and professional health care needed to maintain oral health. There are more than 54 million individuals defined as disabled under the Americans with Disabilities Act, including almost a million children under age six and 4.5 million children between six and 16 years of age.
24
No national studies have been conducted to determine the prevalence of oral and craniofacial diseases among the various populations with disabilities. Several smaller-scale studies show that the population with mental retardation or other developmental disabilities has significantly higher rates of poor oral hygiene and needs for periodontal disease treatment than the general population, due, in part, to limitations in individual understanding of and physical ability to perform personal prevention practices or to obtain needed services. There is a wide range of caries rates among people with disabilities, but overall their caries rates are higher than those of people without disabilities (USDHHS 2000a).
V. RISK AND PROTECTIVE FACTORS AFFECTING ORAL DISEASES The most common oral diseases and conditions can be prevented. There are safe and effective measures that can reduce the incidence of oral disease, reduce disparities, and increase quality of life.
A. Community Water Fluoridation
Community water fluoridation is the process of adjusting the natural fluoride concentration of a community’s water supply to a level that is best for the prevention of dental caries. In the United States, community water fluoridation has been the basis for the primary prevention of dental caries for 60 years and has been recognized as one of ten great achievements in public health of the 20th century (CDC 1999). It is an ideal public health method because it is effective, eminently safe, inexpensive, requires no behavior change by individuals, and does not depend on access or availability of professional services. Water fluoridation reduces or eliminates disparities in preventing dental caries among different socioeconomic, racial, and ethnic groups. Fluoridation helps to lower the cost of dental care and dental insurance and helps residents retain their teeth throughout life (USDHHS 2000a). Recognizing the importance of community water fluoridation, Healthy People 2010 Objective 21-9 is to “Increase the proportion of the U.S. population served by community water systems with optimally fluoridated water to 75%.” In the United States during 2002, approximately 162 million people (67% of the population served by public water systems) received optimally fluoridated water (CDC 2004). In Nevada during 2004, approximately 1,715,337 people received optimally fluoridated water, representing 71 percent of the state population. Not only does community water fluoridation effectively prevent dental caries, it is one of very few public health prevention measures that offer significant cost saving in almost all communities (Griffin et al. 2001). It has been estimated that about every $1 invested in community water fluoridation saves $38 in averted costs. The cost per person of instituting and maintaining a water fluoridation program in a community decreases with increasing population size. During 2004 it is estimated that in Clark County alone, community water fluoridation saved nearly $12.8 million in averted dental disease.
25
B. Topical Fluorides and Fluoride Supplements
Because frequent exposure to small amounts of fluoride each day will best reduce the risk for dental caries in all age groups, all people should drink water with an optimal fluoride concentration and brush their teeth twice daily with fluoride toothpaste (CDC 2001). For communities that do not receive fluoridated water and persons at high risk for dental caries, additional fluoride measures might be needed. Community measures include fluoride mouth rinse or tablet programs, typically conducted in schools. Individual measures include professionally applied topical fluoride gels or varnish for persons at high risk for caries. Several organizations and medical/dental professionals throughout Nevada are using fluoride varnish and the data has been reported to the Nevada State Health Division Oral Health Program. These are briefly listed below: Medical:
• Clark County Health District Nurses – Nurses see children and parents on home visits and in health clinics, perform an oral screen on the children, give oral health information to parents/guardians, and do a fluoride varnish up to four times per year. (360)
• Family Resource Center in Elko - This program involves nurses going into the schools through the Clinic On Wheels (COW) bus. (811)
• Community Health Nurse in Ely in conjunction with Little People’s Head Start does fluoride varnish on the children at least twice a year. (211)
• Orvis Health Center in Reno – This clinic is affiliated with the University of Nevada, Reno and has recently started applying fluoride varnish on children.
• Private Physician Offices – Private practice physicians and health clinics perform fluoride varnish on at-risk children throughout the state.
NOTE: The number of fluoride varnish applications submitted for reimbursement to
Nevada Medicaid and Nevada Check-up by non-dental providers has gone from 75
applications of fluoride varnish in 2002 to 6,416 applications in 2004.
Dental
• Indian Health/Tribal Dental Clinics – Clinics have been using fluoride varnish for over eight years. The children are a high risk population for dental caries.
• Miles For Smiles Van – This mobile dental clinic provides services at schools and community locations.
• Saint Mary’s WIC Mobile Van – This mobile dental clinic provides services at schools and community locations.
• Dental and Dental Hygiene Schools – The students are applying fluoride varnish in the dental/dental hygiene school clinics and in some community locations, like Head Start programs.
• Private Dental Offices – It is probable that most dental offices still use the conventional fluoride treatment (acidulated phosphate gel/foam). The private sector may convert to fluoride varnish over time.
26
C. Dental Sealants
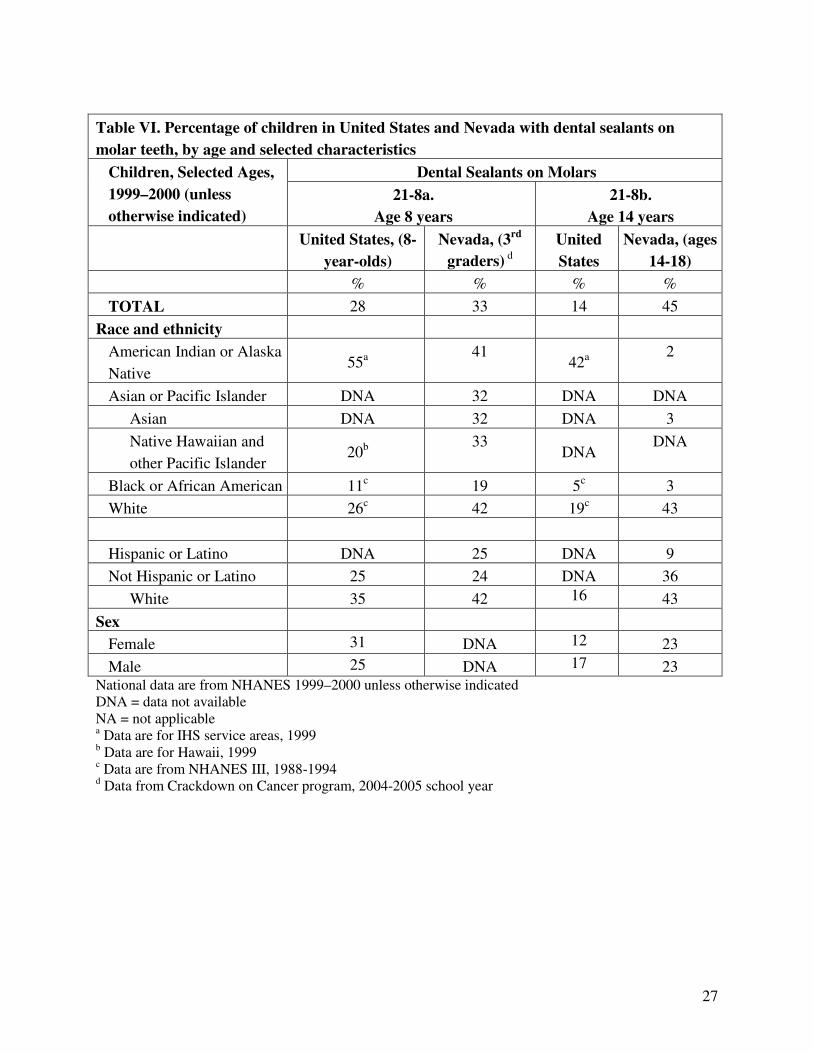
Since the early 1970s, childhood dental caries on smooth tooth surfaces (those without pits and fissures) has declined markedly because of widespread exposure to fluorides. Most decay among school-aged children now occurs on tooth surfaces with pits and fissures, particularly the molar teeth. Pit-and-fissure dental sealants—plastic coatings bonded to susceptible tooth surfaces—have been approved for use for many years and have been recommended by professional health associations and public health agencies. First permanent molars erupt into the mouth at about the age of six. Placing sealants on these teeth shortly after their eruption protects them from the development of caries in areas of the teeth where food and bacteria are retained. If sealants were applied routinely to susceptible tooth surfaces in conjunction with the appropriate use of fluoride, most tooth decay in children could be prevented (USDHHS 2000b). Second permanent molars erupt into the mouth at about the age of 12 to 13. Pit-and-fissure surfaces of these teeth are as susceptible to dental caries as the first permanent molars of younger children. Therefore, young teenagers need to receive dental sealants shortly after the eruption of their second permanent molars. The Healthy People 2010 target for dental sealants on molars is 50 percent for eight-year-olds and 14-year-olds. Table VI presents the most recent estimates of the proportion of children aged eight with dental sealants on one or more molars. Nationally, dental sealants are less prevalent among 14-year-olds than among eight-year-olds. Within each age group, African Americans and Mexican Americans are less likely than non-Hispanic whites to have sealants. The prevalence of sealants also varies by the education level of the head of household. Differences in the prevalence of sealants in Nevada are most greatly seen between regions. Results of the third grade screening showed that while 58 percent of children in Washoe County have at least one sealant, only 24 percent of children in Clark County are sealed. Even rural areas have a higher prevalence rate than Clark County at 47 percent. This significant difference does not lessen with age. Only 27 percent of students ages 14-18 in Clark County have sealants. In Washoe County and rural areas, this percentage jumps to 67 percent and 69 percent, respectively. Mirroring national trends, racial disparities also exist with regards to sealant prevalence. Compared to white non-Hispanic children, a significantly lower proportion of African American and Hispanic children have dental sealants (43% vs. 18% and 25% respectively). Of non-Hispanic adolescents, 52 percent have sealants, while only 33 percent of Hispanics of the same age group have sealants. Poorer children in Nevada also have a significantly lower prevalence of sealants (24%) than their counterparts (43%). Those with dental insurance have a 39 percent prevalence rate as compared to 21 percent of the dental uninsured. Of insured adolescents, 50 percent have sealants versus 24 percent of the uninsured. The data suggest that the children and adolescents who are most at risk for oral disease are not receiving sealants for prevention of decay. Changes must be made in current school-based and state sealant programs and in oral health education so that oral health in these populations can be improved.
27
Table VI. Percentage of children in United States and Nevada with dental sealants on
molar teeth, by age and selected characteristics
Dental Sealants on Molars Children, Selected Ages,
1999–2000 (unless
otherwise indicated)
21-8a.
Age 8 years
21-8b.
Age 14 years
United States, (8-
year-olds)
Nevada, (3rd
graders) d
United
States
Nevada, (ages
14-18)
% % % %
TOTAL 28 33 14 45
Race and ethnicity
American Indian or Alaska
Native 55a
41 42a
2
Asian or Pacific Islander DNA 32 DNA DNA
Asian DNA 32 DNA 3
Native Hawaiian and
other Pacific Islander 20b
33 DNA
DNA
Black or African American 11c 19 5c 3
White 26c 42 19c 43
Hispanic or Latino DNA 25 DNA 9
Not Hispanic or Latino 25 24 DNA 36
White 35 42 16 43
Sex
Female 31 DNA 12 23
Male 25 DNA 17 23 National data are from NHANES 1999–2000 unless otherwise indicated DNA = data not available NA = not applicable a Data are for IHS service areas, 1999 b Data are for Hawaii, 1999 c Data are from NHANES III, 1988-1994 d Data from Crackdown on Cancer program, 2004-2005 school year
28
D. Preventive Visits
Maintaining good oral health takes repeated efforts on the part of the individual, caregivers, and health care providers. Daily oral hygiene routines and healthy lifestyle behaviors play an important role in prevention of oral diseases. Regular preventive dental care can reduce the development of disease and facilitate early diagnosis and treatment. One measure of preventive care that is being tracked is the percentage of people (adults) who had their teeth cleaned in the past year. Having one's teeth cleaned by a dentist or dental hygienist is indicative of preventive behaviors.
Table VII. Percentage of people who had their teeth cleaned within the past year
ages 25 or higher
U.S. Status
1999
Nevada
Status, 2004
69% 65% National and state data from BRFSS
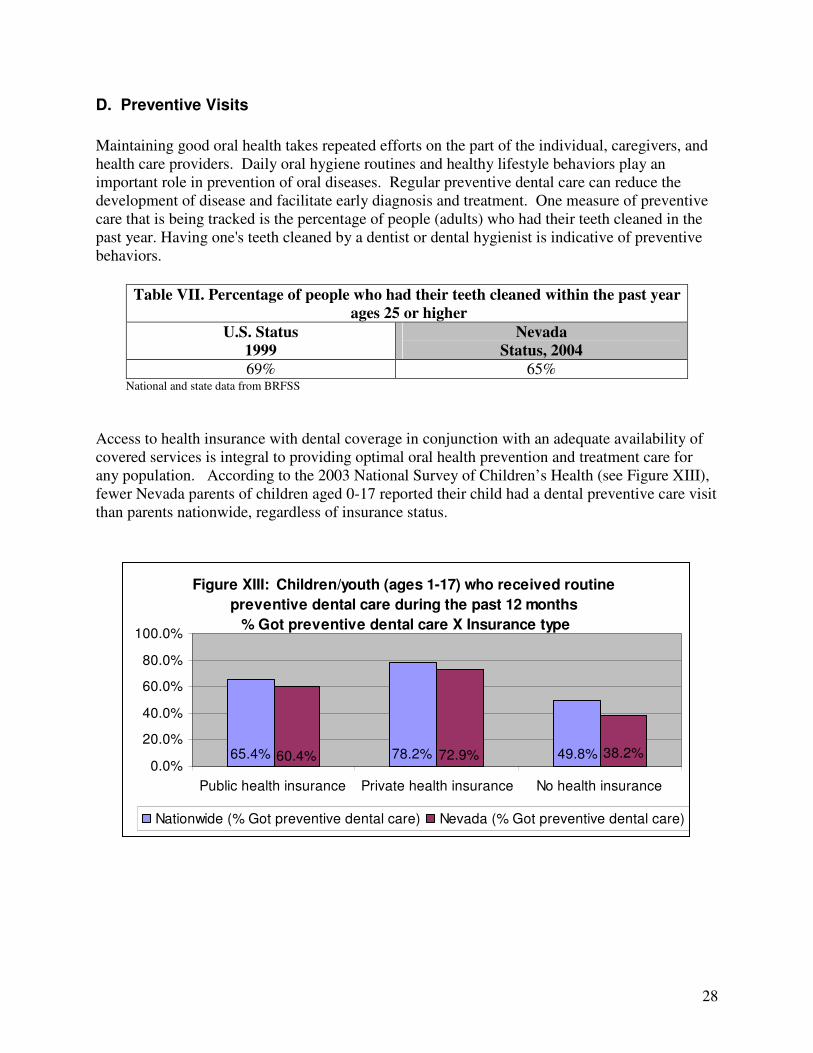
Access to health insurance with dental coverage in conjunction with an adequate availability of covered services is integral to providing optimal oral health prevention and treatment care for any population. According to the 2003 National Survey of Children’s Health (see Figure XIII), fewer Nevada parents of children aged 0-17 reported their child had a dental preventive care visit than parents nationwide, regardless of insurance status.
Figure XIII: Children/youth (ages 1-17) who received routine
preventive dental care during the past 12 months
% Got preventive dental care X Insurance type
49.8%78.2%65.4% 38.2%72.9%60.4%0.0%
20.0%
40.0%
60.0%
80.0%
100.0%
Public health insurance Private health insurance No health insurance
Nationwide (% Got preventive dental care) Nevada (% Got preventive dental care)
29
E. Tobacco Control
Use of tobacco has a devastating impact on the health and well-being of the public. More than 400,000 Americans die each year as a direct result of cigarette smoking, making it the nation’s leading preventable cause of premature mortality, and smoking caused over $150 billion in annual health-related economic losses (CDC 2002). The effects of tobacco use on the public’s oral health also are alarming. The use of any form of tobacco – including cigarettes, cigars, pipes, and smokeless tobacco – has been established as a major cause of oral and pharyngeal cancer (USDHHS 2004a). The evidence is sufficient to consider smoking a causal factor for adult periodontitis (USDHHS 2004a); one-half of the cases of periodontal disease in this country may be attributable to cigarette smoking (Tomar & Asma 2000). Tobacco use substantially worsens the prognosis of periodontal therapy and dental implants, impairs oral wound healing, and increases the risk for a wide range of oral soft tissue changes (Christen et al. 1991; AAP 1999). Comprehensive tobacco control would have a large impact on oral health status. The mission of the Nevada Tobacco Prevention and Education Program is to reduce the overall prevalence of tobacco use among Nevada residents and is funded by a grant from the Centers for Disease Control and Prevention. The goal is to reduce disease, disability and death related to tobacco use by:
• Preventing the initiation of tobacco use among young people;
• Promoting quitting among young people and adults;
• Eliminating nonsmokers’ exposure to secondhand smoke; and
• Identifying and eliminating the disparities related to tobacco use and its effects among different population groups.
The responsibilities of the program include:
• Providing technical assistance to the statewide tobacco prevention coalition, local coalitions, non-profits, health districts, and other government agencies;
• Surveillance and evaluation;
• Collaboration and support to rural communities; and
• Sub-grants to support local, regional, and statewide tobacco prevention and control programs.
The program works with the Task Force for the Fund for a Healthy Nevada, allocating body for the Master Settlement Agreement, by providing technical assistance and training to programs funded for tobacco prevention and cessation. Currently funded sub-grantees include Clark County Health District, Washoe County District Health Department and the Nevada Tobacco Users’ Helpline. The dental office provides an excellent venue for providing tobacco intervention services. More than one-half of adult smokers see a dentist each year (Tomar et al. 1996) as do nearly three-quarters of adolescents (NCHS 2004). Dental patients are particularly receptive to health messages at periodic check-up visits, and oral effects of tobacco use provide visible evidence and a strong motivation for tobacco users to quit. Because dentists and dental hygienists can be
30
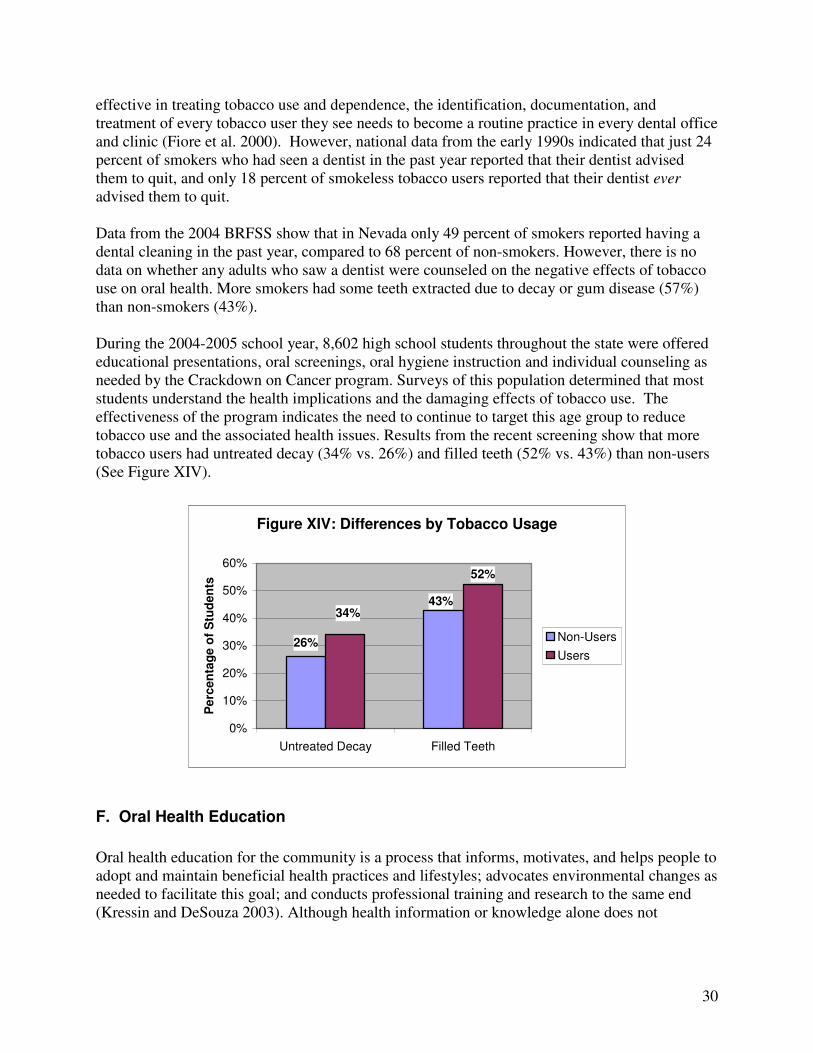
effective in treating tobacco use and dependence, the identification, documentation, and treatment of every tobacco user they see needs to become a routine practice in every dental office and clinic (Fiore et al. 2000). However, national data from the early 1990s indicated that just 24 percent of smokers who had seen a dentist in the past year reported that their dentist advised them to quit, and only 18 percent of smokeless tobacco users reported that their dentist ever advised them to quit. Data from the 2004 BRFSS show that in Nevada only 49 percent of smokers reported having a dental cleaning in the past year, compared to 68 percent of non-smokers. However, there is no data on whether any adults who saw a dentist were counseled on the negative effects of tobacco use on oral health. More smokers had some teeth extracted due to decay or gum disease (57%) than non-smokers (43%). During the 2004-2005 school year, 8,602 high school students throughout the state were offered educational presentations, oral screenings, oral hygiene instruction and individual counseling as needed by the Crackdown on Cancer program. Surveys of this population determined that most students understand the health implications and the damaging effects of tobacco use. The effectiveness of the program indicates the need to continue to target this age group to reduce tobacco use and the associated health issues. Results from the recent screening show that more tobacco users had untreated decay (34% vs. 26%) and filled teeth (52% vs. 43%) than non-users (See Figure XIV).
Figure XIV: Differences by Tobacco Usage
26%
43%34%
52%
0%
10%
20%
30%
40%
50%
60%
Untreated Decay Filled Teeth
Pe
rce
nta
ge
of
Stu
de
nts
Non-Users
Users
F. Oral Health Education
Oral health education for the community is a process that informs, motivates, and helps people to adopt and maintain beneficial health practices and lifestyles; advocates environmental changes as needed to facilitate this goal; and conducts professional training and research to the same end (Kressin and DeSouza 2003). Although health information or knowledge alone does not
31
necessarily lead to desirable health behaviors, knowledge may help empower people and communities to take action to protect their health. The Oral Health Program continues to offer courses relevant to the population concerning improving oral health of Nevadans. These programs include the following: Healthy Smile Happy Child This presentation includes the definition, identification, risk factors, financial impact, and the treatment strategies of Early Childhood Caries (ECC). An ECC Prevention Anticipatory
Guidance Manual with age-specific prevention objectives is included along with English and Spanish handouts. A Fluoride Varnish Manual is also provided with application protocol, ordering information, insurance billing information, handouts, and consent forms in English and Spanish. The PowerPoint presentation (short and long versions) and the text is available at www.health2k.state.nv.us/oral along with the brochures, ECC Prevention - English and Spanish, and Cavities – Fix Them or Forget Them? – English and Spanish. There is also an ECC
Prevention Presenter Manual. This course continues to be presented to a variety of groups – parent groups, Family Resource Centers (staff and parents), health care professionals, Tribal and Indian Health Service, Head Start, Early Intervention Services, and school teachers and nurses. This program was presented to 260 people in FY2005. Prevent Abuse and Neglect through Dental Awareness (PANDA)
Prevent Abuse and Neglect through Dental Awareness (P.A.N.D.A.), currently available in 44 states and six countries, provides training courses and materials to dental professionals and others regarding how to recognize, report, and prevent suspected child abuse and neglect. The P.A.N.D.A. booklet and P.A.N.D.A. brochure are on our website. This is also an ongoing course and is presented to similar groups as listed above under Healthy Smile Happy Child, including the Pediatric Dental Residents at UNLV School of Medicine. This program was presented to 85 people in FY2005. (Please note that some of this information is also included in the Oral Screening K-12 course for the school nurses and other health care providers.) Oral Screening K-12
Due to the prevalence of oral disease in our school age children, the Nevada State Health Division Oral Health Program offers a free continuing education course, Oral Screening K-12, to school nurses and to other health care providers. The course includes the techniques of performing an oral cancer screening and how to identify normal and abnormal hard and soft tissue in the mouth. This program was presented to 65 people in FY2005. Miscellaneous Presentations
Programs were developed and presented for various groups including: high school students, Native American/Tribal conferences, coalitions, dental and dental hygiene students, and Head Start kids, parents, and staff. The attendance breakdown was 300 high school students, 75 Tribal participants, and the 120 participants from other miscellaneous presentations, for a total of 495 people in FY2005.
32
G. Screening for Oral Cancer
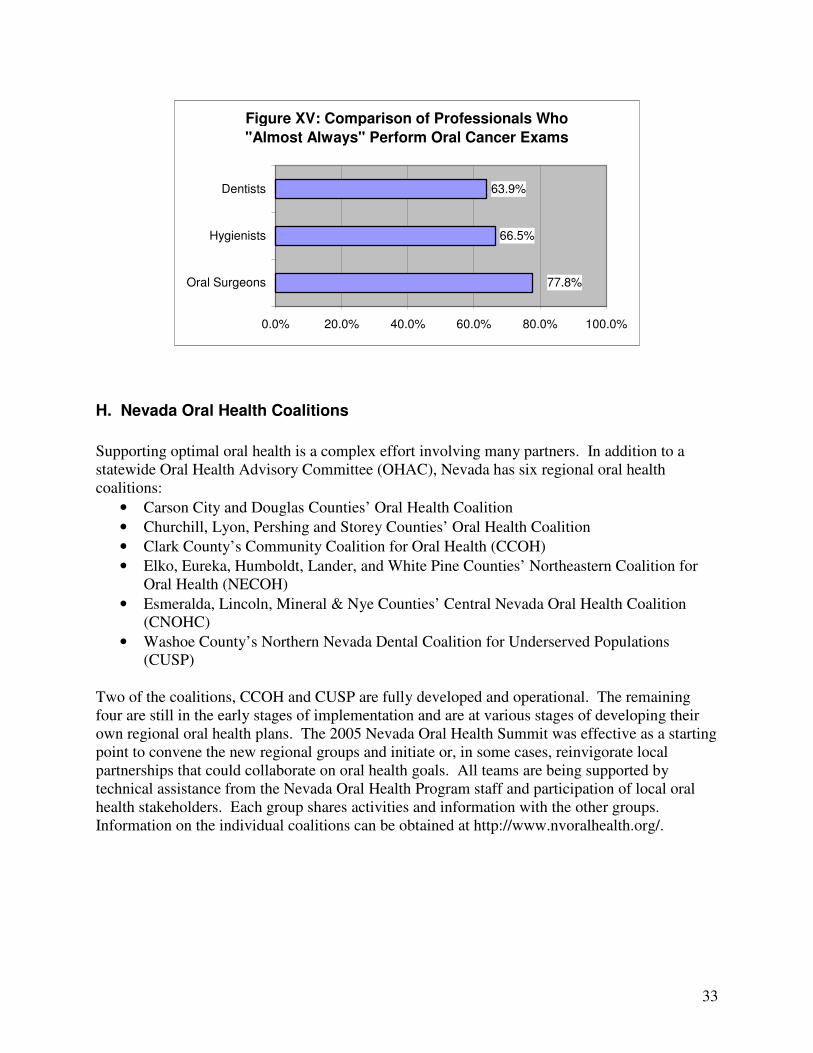
Oral cancer detection is accomplished by a thorough examination of the head and neck and an examination of the mouth including the tongue and the entire oral and pharyngeal mucosal tissues, lips, and palpation of the lymph nodes. Although the sensitivity and specificity of the oral cancer examination have not been established in clinical studies, most experts consider early detection and treatment of precancerous lesions and diagnosis of oral cancer at localized stages to be the major approaches for secondary prevention of these cancers (Silverman 1998; Johnson 1999; CDC 1998). If suspicious tissues are detected during examination, definitive diagnostic tests are needed, such as biopsies, to make a firm diagnosis. Oral cancer is more common after age 60. Known risk factors include use of tobacco products and alcohol. The risk of oral cancer is increased six to 28 times in current smokers. Alcohol consumption is an independent risk factor and, when combined with the use of tobacco products, accounts for most cases of oral cancer in the United States and elsewhere (USDHHS 2004). Individuals also should be advised to avoid other potential carcinogens, such as exposure to sunlight (risk factor for lip cancer) without protection (use of lip sunscreen and hats recommended). Recognizing the need for dental and medical providers to examine adults for oral and pharyngeal cancer, Healthy People 2010 Objective 21-7 is to increase the proportion of adults who, in the past 12 months, report having had an examination to detect oral and pharyngeal cancers. Nationally, relatively few adults aged 40 years and older (13%) reported receiving an examination for oral and pharyngeal cancer, although the proportion varied by race/ethnicity . In 2001, Nevada recorded 244 cases of oral cancer, representing 2.4 percent of all cancers in the state. The rate for these cancers is more than twice as high for men as for women (17.74 cases per 100,000 compared to 6.59, respectively). Gender specific death rates in 2003 were almost three times greater for men at 4.61 per 100,000 population than for women at 1.70 (http://health2k.state.nv.us/nihds/). The Oral Cancer Screening & Counseling Survey was conducted in August 2002. One questionnaire was sent to all licensed/practicing dentists (824) in Nevada, and a separate questionnaire was sent to all licensed/practicing oral surgeons (18) in Nevada. Some results are shown in Figure XV, which summarizes the percentage of each profession that chose “Almost Always” for the frequency of oral cancer exams. Statistically, differences in procedures between dentists and hygienists cannot be confirmed. The frequency of oral cancer exams is roughly the same for all three professions. Survey results also suggested that most hygienists (73.5%) perform oral cancer exams at every recall appointment, regardless of their dentist’s procedure. The remainder of hygienists are equally likely to screen once every six months, once a year, or never. There is no data that indicates what percentage of Nevadans have received an oral cancer exam.
33
Figure XV: Comparison of Professionals Who
"Almost Always" Perform Oral Cancer Exams
66.5%
63.9%
77.8%
0.0% 20.0% 40.0% 60.0% 80.0% 100.0%
Oral Surgeons
Hygienists
Dentists
H. Nevada Oral Health Coalitions
Supporting optimal oral health is a complex effort involving many partners. In addition to a statewide Oral Health Advisory Committee (OHAC), Nevada has six regional oral health coalitions:
• Carson City and Douglas Counties’ Oral Health Coalition
• Churchill, Lyon, Pershing and Storey Counties’ Oral Health Coalition
• Clark County’s Community Coalition for Oral Health (CCOH)
• Elko, Eureka, Humboldt, Lander, and White Pine Counties’ Northeastern Coalition for Oral Health (NECOH)
• Esmeralda, Lincoln, Mineral & Nye Counties’ Central Nevada Oral Health Coalition (CNOHC)
• Washoe County’s Northern Nevada Dental Coalition for Underserved Populations (CUSP)
Two of the coalitions, CCOH and CUSP are fully developed and operational. The remaining four are still in the early stages of implementation and are at various stages of developing their own regional oral health plans. The 2005 Nevada Oral Health Summit was effective as a starting point to convene the new regional groups and initiate or, in some cases, reinvigorate local partnerships that could collaborate on oral health goals. All teams are being supported by technical assistance from the Nevada Oral Health Program staff and participation of local oral health stakeholders. Each group shares activities and information with the other groups. Information on the individual coalitions can be obtained at http://www.nvoralhealth.org/.
34
VI. PROVISION OF DENTAL SERVICES
A. Dental Workforce and Capacity
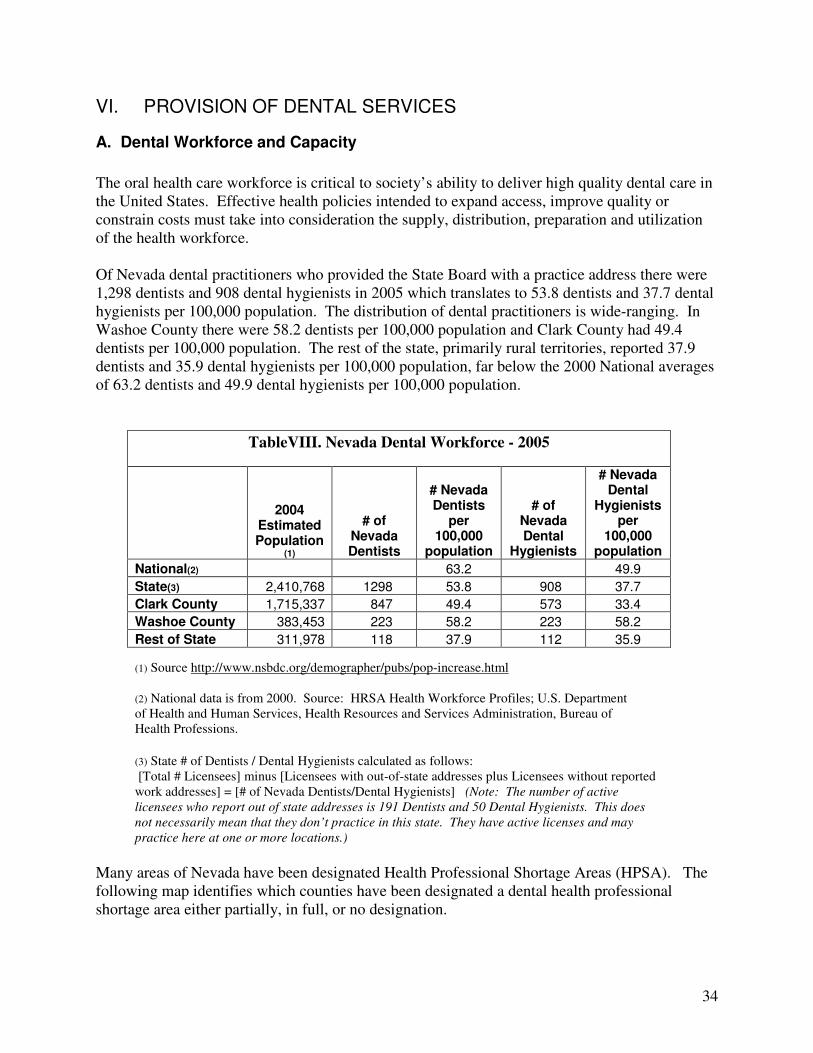
The oral health care workforce is critical to society’s ability to deliver high quality dental care in the United States. Effective health policies intended to expand access, improve quality or constrain costs must take into consideration the supply, distribution, preparation and utilization of the health workforce. Of Nevada dental practitioners who provided the State Board with a practice address there were 1,298 dentists and 908 dental hygienists in 2005 which translates to 53.8 dentists and 37.7 dental hygienists per 100,000 population. The distribution of dental practitioners is wide-ranging. In Washoe County there were 58.2 dentists per 100,000 population and Clark County had 49.4 dentists per 100,000 population. The rest of the state, primarily rural territories, reported 37.9 dentists and 35.9 dental hygienists per 100,000 population, far below the 2000 National averages of 63.2 dentists and 49.9 dental hygienists per 100,000 population.
TableVIII. Nevada Dental Workforce - 2005
2004 Estimated Population
(1)
# of Nevada Dentists
# Nevada Dentists
per 100,000
population
# of Nevada Dental
Hygienists
# Nevada Dental
Hygienists per
100,000 population
National(2) 63.2 49.9
State(3) 2,410,768 1298 53.8 908 37.7
Clark County 1,715,337 847 49.4 573 33.4
Washoe County 383,453 223 58.2 223 58.2
Rest of State 311,978 118 37.9 112 35.9
(1) Source http://www.nsbdc.org/demographer/pubs/pop-increase.html (2) National data is from 2000. Source: HRSA Health Workforce Profiles; U.S. Department of Health and Human Services, Health Resources and Services Administration, Bureau of Health Professions.
(3) State # of Dentists / Dental Hygienists calculated as follows: [Total # Licensees] minus [Licensees with out-of-state addresses plus Licensees without reported work addresses] = [# of Nevada Dentists/Dental Hygienists] (Note: The number of active
licensees who report out of state addresses is 191 Dentists and 50 Dental Hygienists. This does
not necessarily mean that they don’t practice in this state. They have active licenses and may
practice here at one or more locations.)
Many areas of Nevada have been designated Health Professional Shortage Areas (HPSA). The following map identifies which counties have been designated a dental health professional shortage area either partially, in full, or no designation.
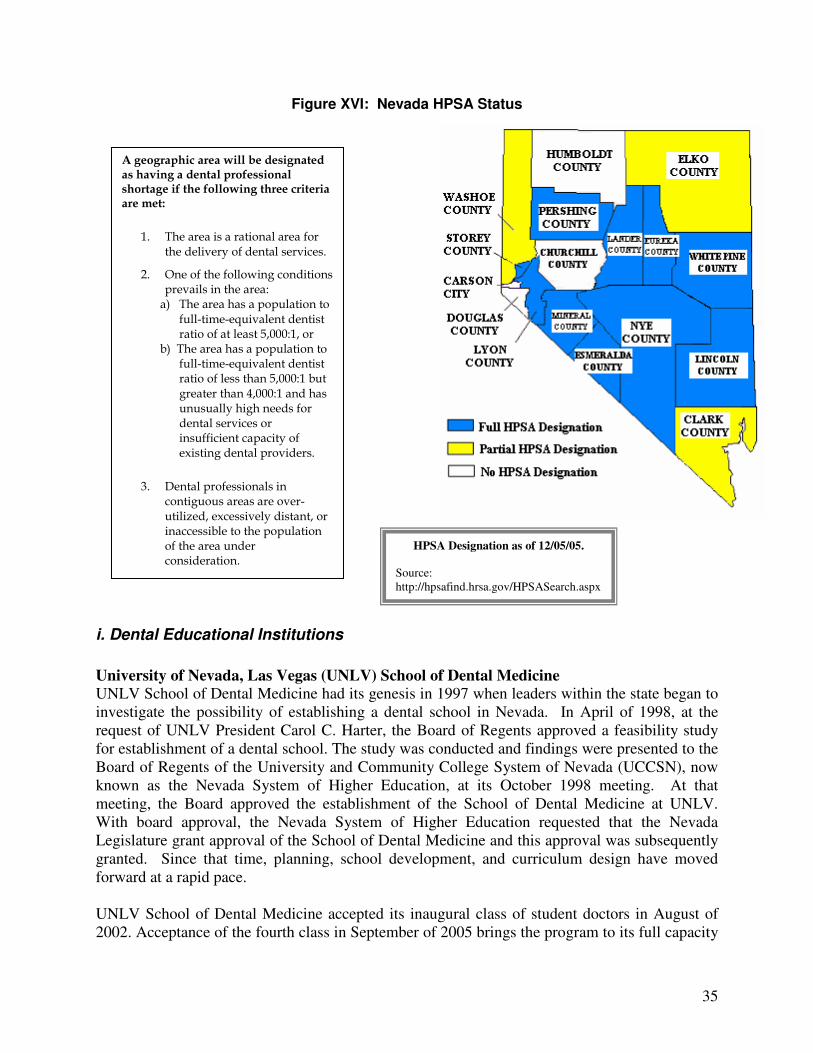
35
Figure XVI: Nevada HPSA Status
i. Dental Educational Institutions
University of Nevada, Las Vegas (UNLV) School of Dental Medicine
UNLV School of Dental Medicine had its genesis in 1997 when leaders within the state began to investigate the possibility of establishing a dental school in Nevada. In April of 1998, at the request of UNLV President Carol C. Harter, the Board of Regents approved a feasibility study for establishment of a dental school. The study was conducted and findings were presented to the Board of Regents of the University and Community College System of Nevada (UCCSN), now known as the Nevada System of Higher Education, at its October 1998 meeting. At that meeting, the Board approved the establishment of the School of Dental Medicine at UNLV. With board approval, the Nevada System of Higher Education requested that the Nevada Legislature grant approval of the School of Dental Medicine and this approval was subsequently granted. Since that time, planning, school development, and curriculum design have moved forward at a rapid pace. UNLV School of Dental Medicine accepted its inaugural class of student doctors in August of 2002. Acceptance of the fourth class in September of 2005 brings the program to its full capacity
A geographic area will be designated as having a dental professional shortage if the following three criteria are met:
1. The area is a rational area for the delivery of dental services.
2. One of the following conditions prevails in the area: a) The area has a population to
full-time-equivalent dentist ratio of at least 5,000:1, or
b) The area has a population to full-time-equivalent dentist ratio of less than 5,000:1 but greater than 4,000:1 and has unusually high needs for dental services or insufficient capacity of existing dental providers.
3. Dental professionals in contiguous areas are over-utilized, excessively distant, or inaccessible to the population of the area under consideration.
HPSA Designation as of 12/05/05. Source: http://hpsafind.hrsa.gov/HPSASearch.aspx
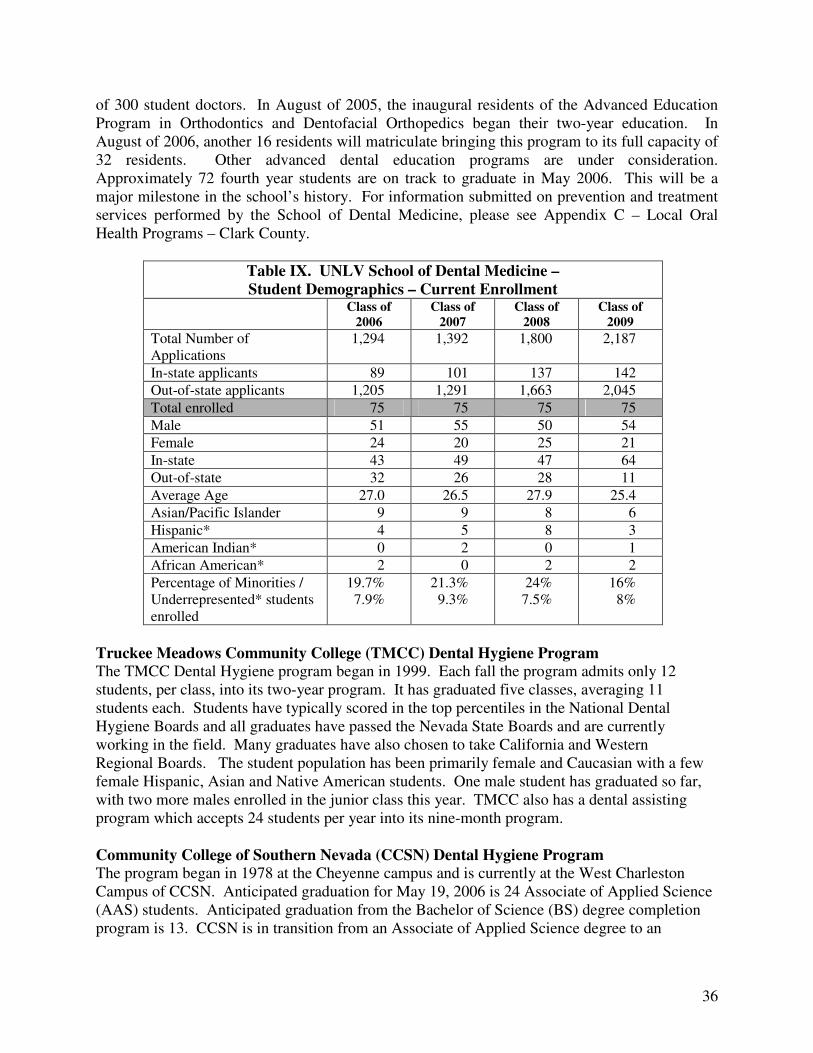
36
of 300 student doctors. In August of 2005, the inaugural residents of the Advanced Education Program in Orthodontics and Dentofacial Orthopedics began their two-year education. In August of 2006, another 16 residents will matriculate bringing this program to its full capacity of 32 residents. Other advanced dental education programs are under consideration. Approximately 72 fourth year students are on track to graduate in May 2006. This will be a major milestone in the school’s history. For information submitted on prevention and treatment services performed by the School of Dental Medicine, please see Appendix C – Local Oral Health Programs – Clark County.
Table IX. UNLV School of Dental Medicine –
Student Demographics – Current Enrollment
Class of
2006
Class of
2007
Class of
2008
Class of
2009
Total Number of Applications
1,294 1,392 1,800 2,187
In-state applicants 89 101 137 142
Out-of-state applicants 1,205 1,291 1,663 2,045
Total enrolled 75 75 75 75
Male 51 55 50 54
Female 24 20 25 21
In-state 43 49 47 64
Out-of-state 32 26 28 11
Average Age 27.0 26.5 27.9 25.4
Asian/Pacific Islander 9 9 8 6
Hispanic* 4 5 8 3
American Indian* 0 2 0 1
African American* 2 0 2 2
Percentage of Minorities / Underrepresented* students enrolled
19.7% 7.9%
21.3% 9.3%
24% 7.5%
16% 8%
Truckee Meadows Community College (TMCC) Dental Hygiene Program
The TMCC Dental Hygiene program began in 1999. Each fall the program admits only 12 students, per class, into its two-year program. It has graduated five classes, averaging 11 students each. Students have typically scored in the top percentiles in the National Dental Hygiene Boards and all graduates have passed the Nevada State Boards and are currently working in the field. Many graduates have also chosen to take California and Western Regional Boards. The student population has been primarily female and Caucasian with a few female Hispanic, Asian and Native American students. One male student has graduated so far, with two more males enrolled in the junior class this year. TMCC also has a dental assisting program which accepts 24 students per year into its nine-month program. Community College of Southern Nevada (CCSN) Dental Hygiene Program The program began in 1978 at the Cheyenne campus and is currently at the West Charleston Campus of CCSN. Anticipated graduation for May 19, 2006 is 24 Associate of Applied Science (AAS) students. Anticipated graduation from the Bachelor of Science (BS) degree completion program is 13. CCSN is in transition from an Associate of Applied Science degree to an
37
Associate of Science (AS) degree. Beginning Fall 2006, all students will be working toward the AS degree. May, 2006 will see the first Bachelor of Science (BS) degree graduates from the CCSN program. The BS program is a degree completion for Registered Dental Hygienists who have previously earned an associate degree or the equivalent from an ADA accredited dental hygiene program. The BS degree program has two areas of focus: education and public health. The goal for the public health track is to supply more dental hygienists to the state of Nevada who are prepared to develop and implement public health programs in areas of need. It is estimated that 53 out of 55 Bachelor degree students are current Nevada residents and all of the Associate degree students (27 first-year/24 second-year) are Nevada state residents. 100 percent of the current enrollment in the BS degree program is female. There are currently two male students enrolled in the associate degree programs, one first-year student and one in the second year. Statistics on the ethnicity of CCSN Dental Hygiene program students is estimated to be 55 out of 55 BS students are Caucasian; the ethnicity of the associate degree classes was reported as one African American, three Hispanic, three Asian and 20 Caucasian students in the first-year class and two African American, five Hispanic and 17 Caucasian students in the second-year class. Western Interstate Commission for Higher Education (WICHE) has a Health Care Access Program (HCAP) that provides financial assistance for oral health care professionals in Nevada, with an emphasis on underserved population (Medicare/Medicaid, uninsured, at-risk). WICHE also provides financial aid to assist students in obtaining their education in the field of dentistry and requires students to work in Nevada as professionals in general or specialized dentistry.
• Number of dental students in pipeline: 39 (21, or 53 percent, to practice with underserved populations)
• Number of WICHE dentists graduated and practicing in the state: 29
• Number of WICHE dentists practicing with underserved populations: 22
• Locations (counties) in which WICHE dentists practicing: 9 counties, 9 cities
B. Dental Workforce Diversity
One cause of oral health disparities is lack of access to oral health services among under-represented minorities. Increasing the number of dental professionals from under-represented racial and ethnic groups is viewed as an integral part of the solution to improving access to care (HP2010). Data on the race/ethnicity of dental care providers were derived from surveys of professionally active dentists conducted by the American Dental Association (ADA 1999). In 1997, 1.9 percent of active dentists in the United States identified themselves as black or African American, although that group comprised 12.1 percent of the U.S. population. Hispanic/Latino dentists comprised 2.7 percent of U.S. dentists, compared to 10.9 percent of the U.S. population that was Hispanic/Latino.
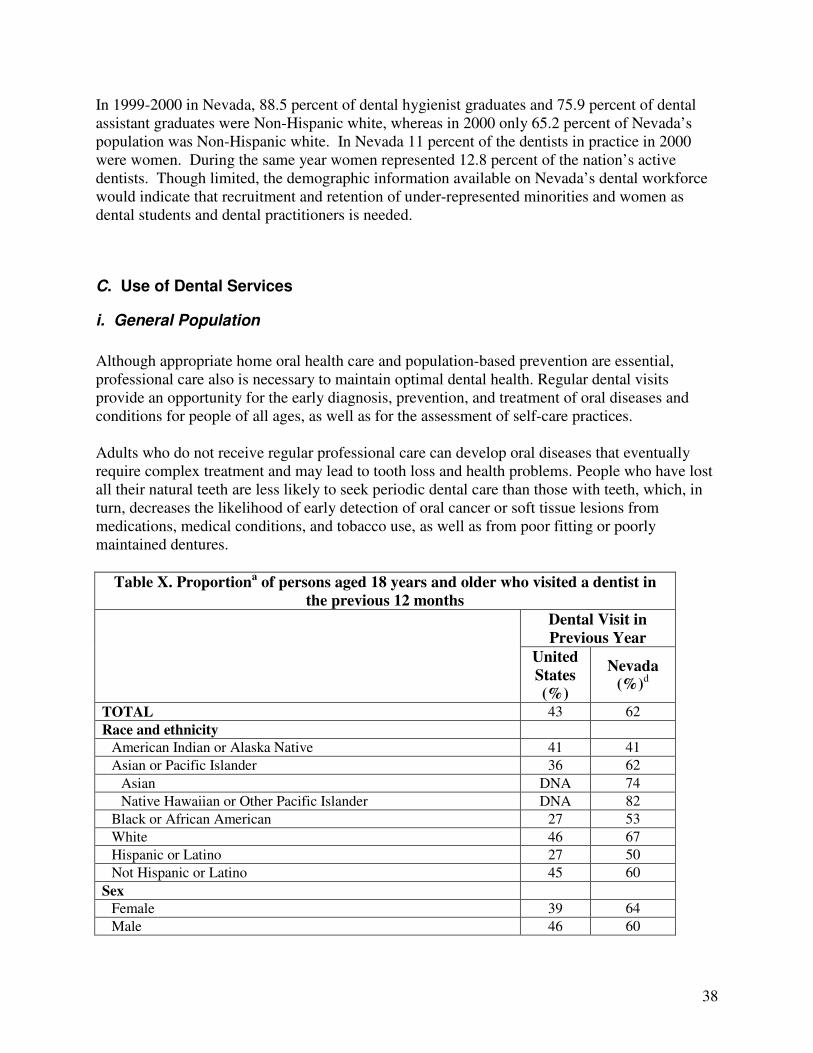
38
In 1999-2000 in Nevada, 88.5 percent of dental hygienist graduates and 75.9 percent of dental assistant graduates were Non-Hispanic white, whereas in 2000 only 65.2 percent of Nevada’s population was Non-Hispanic white. In Nevada 11 percent of the dentists in practice in 2000 were women. During the same year women represented 12.8 percent of the nation’s active dentists. Though limited, the demographic information available on Nevada’s dental workforce would indicate that recruitment and retention of under-represented minorities and women as dental students and dental practitioners is needed.
C. Use of Dental Services
i. General Population
Although appropriate home oral health care and population-based prevention are essential, professional care also is necessary to maintain optimal dental health. Regular dental visits provide an opportunity for the early diagnosis, prevention, and treatment of oral diseases and conditions for people of all ages, as well as for the assessment of self-care practices. Adults who do not receive regular professional care can develop oral diseases that eventually require complex treatment and may lead to tooth loss and health problems. People who have lost all their natural teeth are less likely to seek periodic dental care than those with teeth, which, in turn, decreases the likelihood of early detection of oral cancer or soft tissue lesions from medications, medical conditions, and tobacco use, as well as from poor fitting or poorly maintained dentures.
Table X. Proportiona of persons aged 18 years and older who visited a dentist in
the previous 12 months
Dental Visit in
Previous Year
United
States
(%)
Nevada
(%)d
TOTAL 43 62
Race and ethnicity
American Indian or Alaska Native 41 41
Asian or Pacific Islander 36 62
Asian DNA 74
Native Hawaiian or Other Pacific Islander DNA 82
Black or African American 27 53
White 46 67
Hispanic or Latino 27 50
Not Hispanic or Latino 45 60
Sex
Female 39 64
Male 46 60
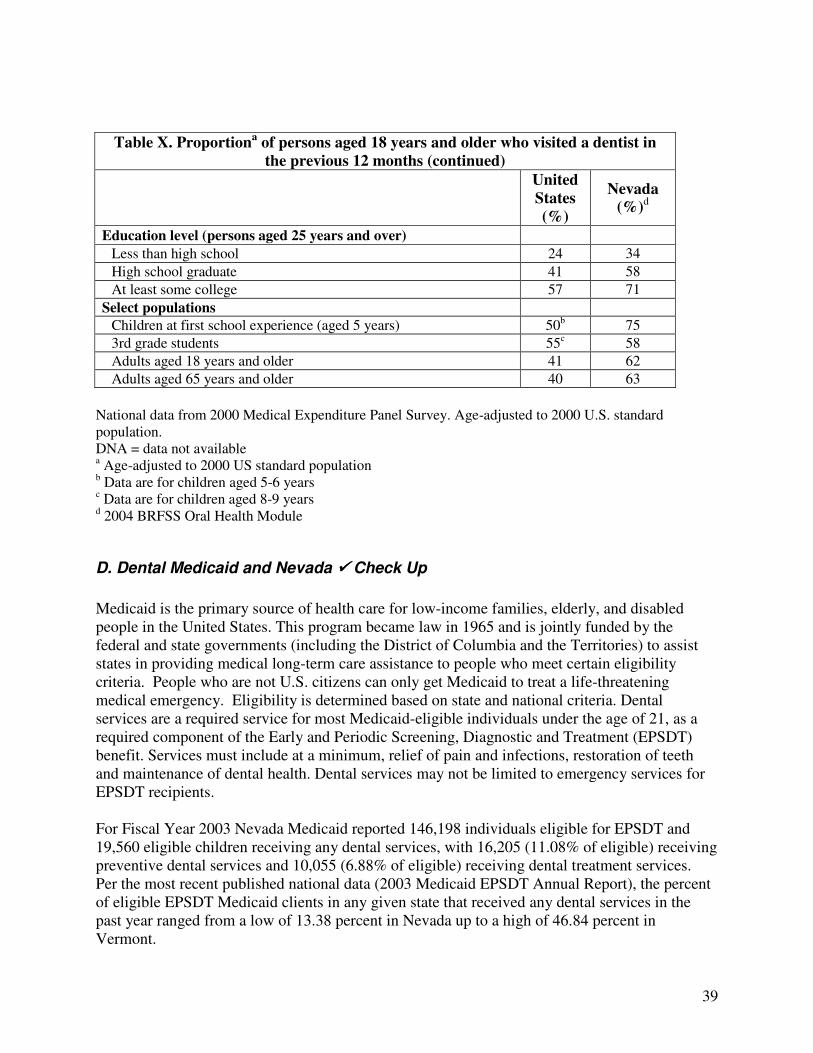
39
Table X. Proportiona of persons aged 18 years and older who visited a dentist in
the previous 12 months (continued)
United
States
(%)
Nevada
(%)d
Education level (persons aged 25 years and over) Less than high school 24 34
High school graduate 41 58
At least some college 57 71
Select populations
Children at first school experience (aged 5 years) 50b 75
3rd grade students 55c 58
Adults aged 18 years and older 41 62
Adults aged 65 years and older 40 63
National data from 2000 Medical Expenditure Panel Survey. Age-adjusted to 2000 U.S. standard population. DNA = data not available a Age-adjusted to 2000 US standard population b Data are for children aged 5-6 years c Data are for children aged 8-9 years d 2004 BRFSS Oral Health Module
D. Dental Medicaid and Nevada ���� Check Up
Medicaid is the primary source of health care for low-income families, elderly, and disabled people in the United States. This program became law in 1965 and is jointly funded by the federal and state governments (including the District of Columbia and the Territories) to assist states in providing medical long-term care assistance to people who meet certain eligibility criteria. People who are not U.S. citizens can only get Medicaid to treat a life-threatening medical emergency. Eligibility is determined based on state and national criteria. Dental services are a required service for most Medicaid-eligible individuals under the age of 21, as a required component of the Early and Periodic Screening, Diagnostic and Treatment (EPSDT) benefit. Services must include at a minimum, relief of pain and infections, restoration of teeth and maintenance of dental health. Dental services may not be limited to emergency services for EPSDT recipients. For Fiscal Year 2003 Nevada Medicaid reported 146,198 individuals eligible for EPSDT and 19,560 eligible children receiving any dental services, with 16,205 (11.08% of eligible) receiving preventive dental services and 10,055 (6.88% of eligible) receiving dental treatment services. Per the most recent published national data (2003 Medicaid EPSDT Annual Report), the percent of eligible EPSDT Medicaid clients in any given state that received any dental services in the past year ranged from a low of 13.38 percent in Nevada up to a high of 46.84 percent in Vermont.
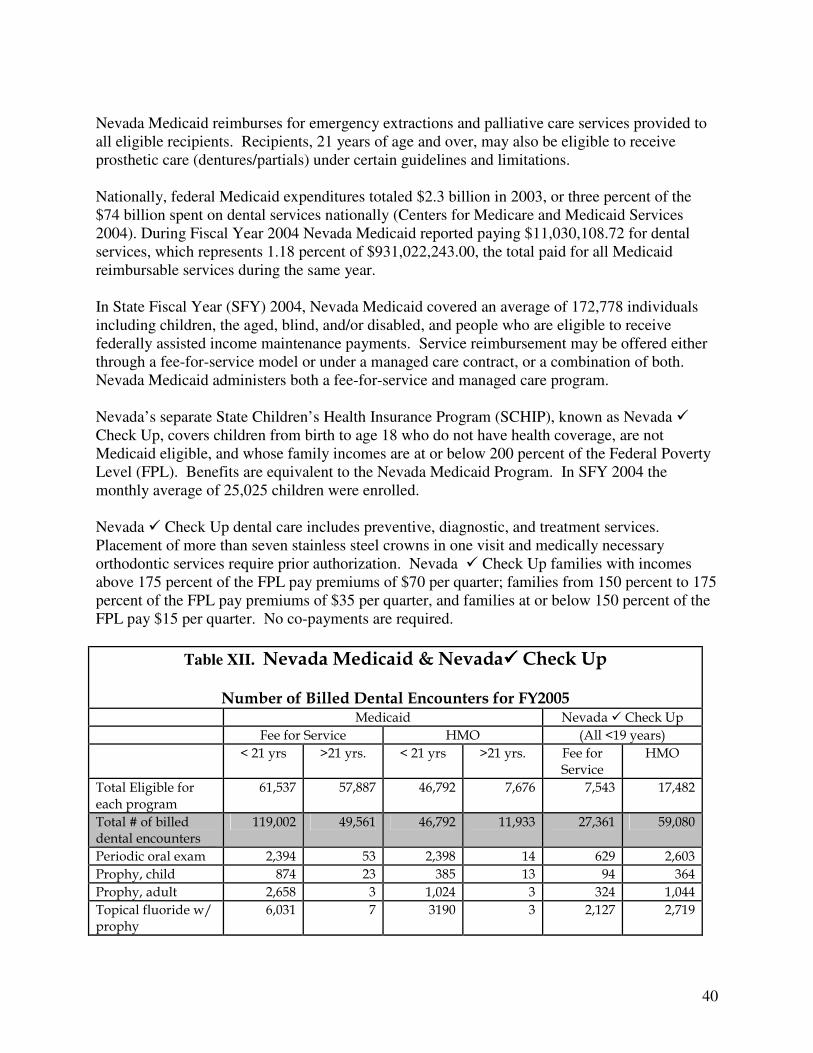
40
Nevada Medicaid reimburses for emergency extractions and palliative care services provided to all eligible recipients. Recipients, 21 years of age and over, may also be eligible to receive prosthetic care (dentures/partials) under certain guidelines and limitations. Nationally, federal Medicaid expenditures totaled $2.3 billion in 2003, or three percent of the $74 billion spent on dental services nationally (Centers for Medicare and Medicaid Services 2004). During Fiscal Year 2004 Nevada Medicaid reported paying $11,030,108.72 for dental services, which represents 1.18 percent of $931,022,243.00, the total paid for all Medicaid reimbursable services during the same year. In State Fiscal Year (SFY) 2004, Nevada Medicaid covered an average of 172,778 individuals including children, the aged, blind, and/or disabled, and people who are eligible to receive federally assisted income maintenance payments. Service reimbursement may be offered either through a fee-for-service model or under a managed care contract, or a combination of both. Nevada Medicaid administers both a fee-for-service and managed care program. Nevada’s separate State Children’s Health Insurance Program (SCHIP), known as Nevada � Check Up, covers children from birth to age 18 who do not have health coverage, are not Medicaid eligible, and whose family incomes are at or below 200 percent of the Federal Poverty Level (FPL). Benefits are equivalent to the Nevada Medicaid Program. In SFY 2004 the monthly average of 25,025 children were enrolled. Nevada � Check Up dental care includes preventive, diagnostic, and treatment services. Placement of more than seven stainless steel crowns in one visit and medically necessary orthodontic services require prior authorization. Nevada � Check Up families with incomes above 175 percent of the FPL pay premiums of $70 per quarter; families from 150 percent to 175 percent of the FPL pay premiums of $35 per quarter, and families at or below 150 percent of the FPL pay $15 per quarter. No co-payments are required.
Table XII. Nevada Medicaid & Nevada���� Check Up
Number of Billed Dental Encounters for FY2005 Medicaid Nevada � Check Up Fee for Service HMO (All <19 years) < 21 yrs >21 yrs. < 21 yrs >21 yrs. Fee for
Service HMO
Total Eligible for each program
61,537 57,887 46,792 7,676 7,543 17,482
Total # of billed dental encounters
119,002 49,561 46,792 11,933 27,361 59,080
Periodic oral exam 2,394 53 2,398 14 629 2,603 Prophy, child 874 23 385 13 94 364 Prophy, adult 2,658 3 1,024 3 324 1,044 Topical fluoride w/ prophy
6,031 7 3190 3 2,127 2,719
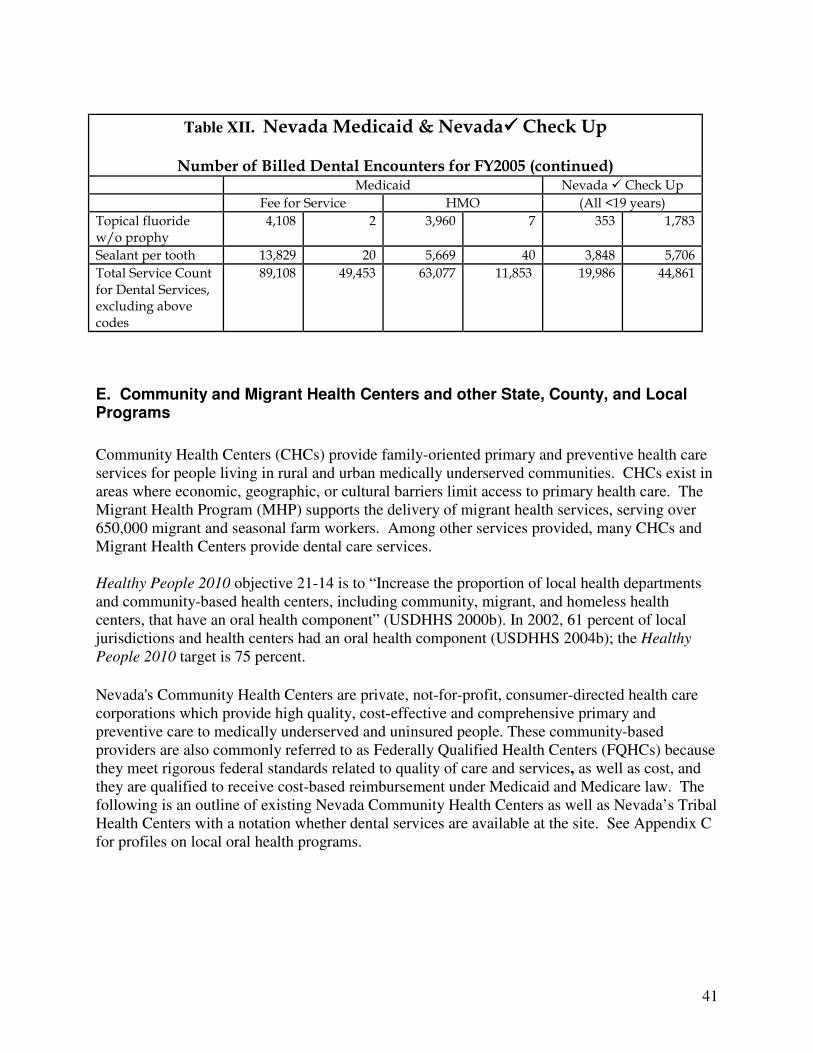
41
Table XII. Nevada Medicaid & Nevada���� Check Up
Number of Billed Dental Encounters for FY2005 (continued) Medicaid Nevada � Check Up Fee for Service HMO (All <19 years) Topical fluoride w/o prophy
4,108 2 3,960 7 353 1,783
Sealant per tooth 13,829 20 5,669 40 3,848 5,706 Total Service Count for Dental Services, excluding above codes
89,108 49,453 63,077 11,853 19,986 44,861
E. Community and Migrant Health Centers and other State, County, and Local Programs
Community Health Centers (CHCs) provide family-oriented primary and preventive health care services for people living in rural and urban medically underserved communities. CHCs exist in areas where economic, geographic, or cultural barriers limit access to primary health care. The Migrant Health Program (MHP) supports the delivery of migrant health services, serving over 650,000 migrant and seasonal farm workers. Among other services provided, many CHCs and Migrant Health Centers provide dental care services. Healthy People 2010 objective 21-14 is to “Increase the proportion of local health departments and community-based health centers, including community, migrant, and homeless health centers, that have an oral health component” (USDHHS 2000b). In 2002, 61 percent of local jurisdictions and health centers had an oral health component (USDHHS 2004b); the Healthy
People 2010 target is 75 percent.
Nevada's Community Health Centers are private, not-for-profit, consumer-directed health care corporations which provide high quality, cost-effective and comprehensive primary and preventive care to medically underserved and uninsured people. These community-based providers are also commonly referred to as Federally Qualified Health Centers (FQHCs) because
they meet rigorous federal standards related to quality of care and services, as well as cost, and they are qualified to receive cost-based reimbursement under Medicaid and Medicare law. The following is an outline of existing Nevada Community Health Centers as well as Nevada’s Tribal Health Centers with a notation whether dental services are available at the site. See Appendix C for profiles on local oral health programs.
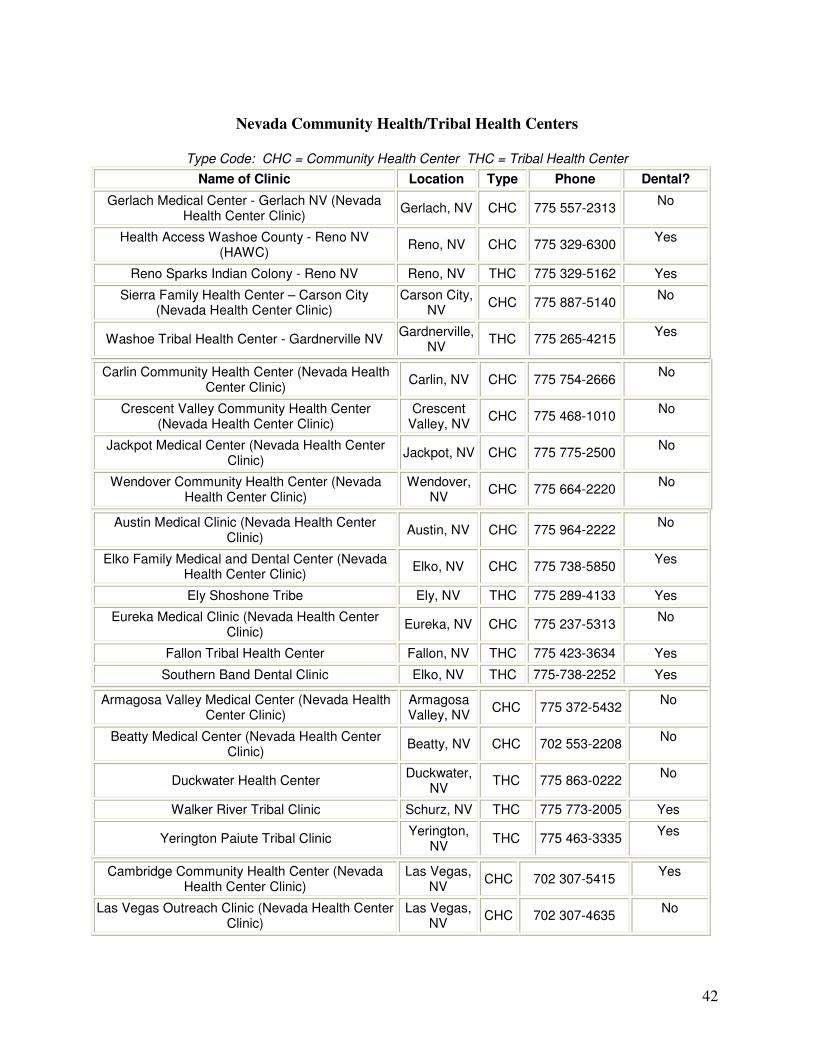
42
Nevada Community Health/Tribal Health Centers
Type Code: CHC = Community Health Center THC = Tribal Health Center
Name of Clinic Location Type Phone Dental?
Gerlach Medical Center - Gerlach NV (Nevada Health Center Clinic)
Gerlach, NV CHC 775 557-2313 No
Health Access Washoe County - Reno NV (HAWC)
Reno, NV CHC 775 329-6300 Yes
Reno Sparks Indian Colony - Reno NV Reno, NV THC 775 329-5162 Yes
Sierra Family Health Center – Carson City (Nevada Health Center Clinic)
Carson City, NV
CHC 775 887-5140 No
Washoe Tribal Health Center - Gardnerville NV Gardnerville,
NV THC 775 265-4215
Yes
Carlin Community Health Center (Nevada Health Center Clinic)
Carlin, NV CHC 775 754-2666 No
Crescent Valley Community Health Center (Nevada Health Center Clinic)
Crescent Valley, NV
CHC 775 468-1010 No
Jackpot Medical Center (Nevada Health Center Clinic)
Jackpot, NV CHC 775 775-2500 No
Wendover Community Health Center (Nevada Health Center Clinic)
Wendover, NV
CHC 775 664-2220 No
Austin Medical Clinic (Nevada Health Center Clinic)
Austin, NV CHC 775 964-2222 No
Elko Family Medical and Dental Center (Nevada Health Center Clinic)
Elko, NV CHC 775 738-5850 Yes
Ely Shoshone Tribe Ely, NV THC 775 289-4133 Yes
Eureka Medical Clinic (Nevada Health Center Clinic)
Eureka, NV CHC 775 237-5313 No
Fallon Tribal Health Center Fallon, NV THC 775 423-3634 Yes
Southern Band Dental Clinic Elko, NV THC 775-738-2252 Yes
Armagosa Valley Medical Center (Nevada Health Center Clinic)
Armagosa Valley, NV
CHC 775 372-5432 No
Beatty Medical Center (Nevada Health Center Clinic)
Beatty, NV CHC 702 553-2208 No
Duckwater Health Center Duckwater,
NV THC 775 863-0222
No
Walker River Tribal Clinic Schurz, NV THC 775 773-2005 Yes
Yerington Paiute Tribal Clinic Yerington,
NV THC 775 463-3335
Yes
Cambridge Community Health Center (Nevada Health Center Clinic)
Las Vegas, NV
CHC 702 307-5415 Yes
Las Vegas Outreach Clinic (Nevada Health Center Clinic)
Las Vegas, NV
CHC 702 307-4635 No
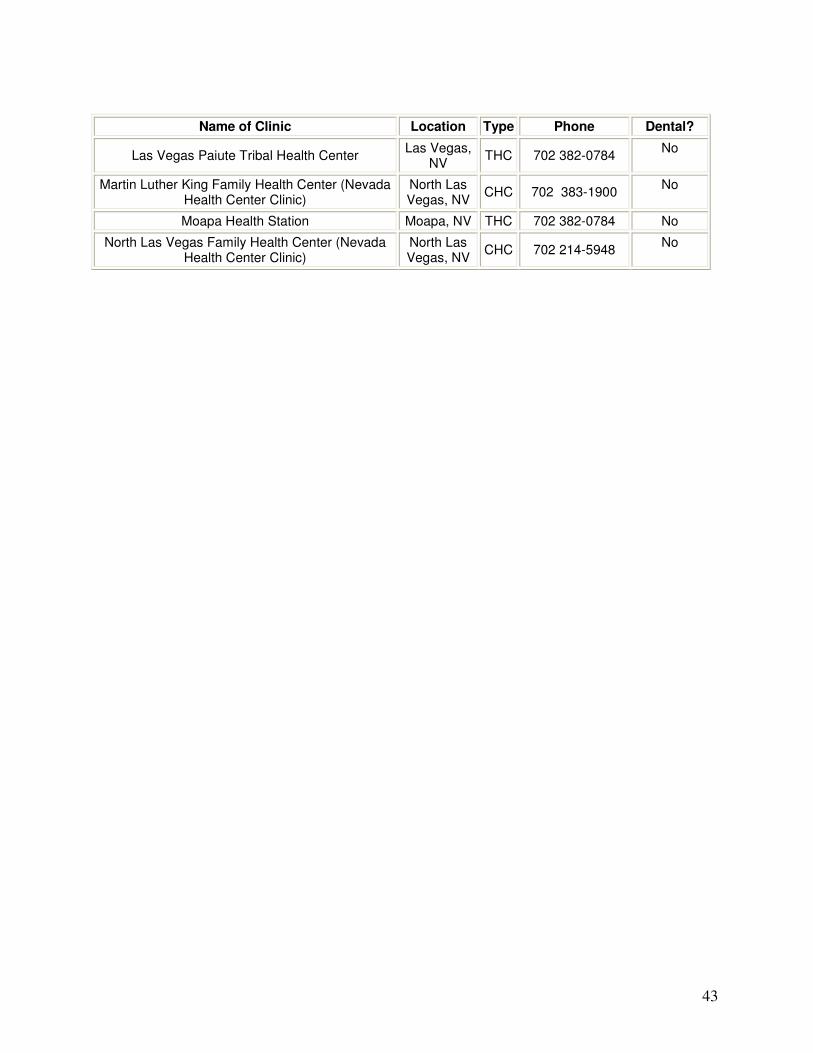
43
Name of Clinic Location Type Phone Dental?
Las Vegas Paiute Tribal Health Center Las Vegas,
NV THC 702 382-0784
No
Martin Luther King Family Health Center (Nevada Health Center Clinic)
North Las Vegas, NV
CHC 702 383-1900 No
Moapa Health Station Moapa, NV THC 702 382-0784 No
North Las Vegas Family Health Center (Nevada Health Center Clinic)
North Las Vegas, NV
CHC 702 214-5948 No
44
VII. CONCLUSIONS Nevada’s rapid population growth is severely impacting many organizations across the state, including public oral health care providers. Nevada’s population has more than doubled since 1990 from 1,201,833 to 2,410,768. While we have had a considerable increase in the number of dentists in Nevada in recent years, there are still significant numbers of our population that are underserved in both our rural and urban communities. Improving oral health disparities and increasing access to dental care in Nevada is dependant on many factors. We are continuously updating our surveillance and data collection systems to be able to measure the state’s oral health needs. Changes in Nevada’s Medicaid operations are intended to increase access to care for those with public insurance coverage. Expanding policies on fluoride varnish applications have opened the doors for utilization of and communication with other health care providers. Numerous opportunities exist for continued and new partnerships in improving the oral health of Nevadans. Examples of new alliances include resource sharing with other chronic care groups (i.e., diabetes patient educators, special needs advocates) and other state and local organizations that focus on prevention (i.e., tobacco control and methamphetamine prevention task forces). Partnerships among dental providers, community health organizations, patient advocates, schools and others are providing many dental care services to local communities. These groups are filling necessary gaps in service and identifying needs for future interventions. 2004-05 was a year of exceptional accomplishment for many organizations around the state working to improve oral health in Nevada. A solid foundation has now been laid that can make a measurable difference in improving oral health if it can be sustained and further strengthened in the years to come.
45
VIII. REFERENCES Amar S, Chung KM. Influence of hormonal variation on the periodontium in women. Periodontol 2000 1994;6:79–87. American Academy of Periodontology. Position paper: Tobacco use and the periodontal patient. J Periodontol 1999;70:1419–27.
American Dental Association. Distribution of dentists in the United States by Region and State, 1997. Chicago, IL: American Dental Association Survey Center; 1999.
American Dental Association. State and Community Models for Improving Access to Dental Care for the Underserved –A White Paper. October 2004.
Beck JD, Offenbacher S, Williams R, Gibbs P, Garcia R. Periodontics: a risk factor for coronary heart disease? Ann Periodontol 1998;3(1):127–41.
Blot WJ, McLaughlin JK, Winn DM, et al. Smoking and drinking in relation to oral and pharyngeal cancer. Cancer Res 1988;48(11):3282–7.
Brown LJ, Wagner KS, Johns B. Racial/ethnic variations of practicing dentists. J Am Dent Assoc 2000; 131:1750–4. Bureau of Primary Health Care. Community Health Centers: program information. Available at: http://www.bphc.hrsa.gov/programs/CHCPrograminfo.asp. Accessed 01/13/05. Burt BA, Eklund BA. Dentistry, dental practice, and the community. 5th ed. Philadelphia: WB Saunders; 1999. Centers for Disease Control and Prevention. Preventing and controlling oral and pharyngeal cancer. Recommendations from a national strategic planning conference. MMWR 1998; 47(No. RR-14):1-12. Centers for Disease Control and Prevention. Achievements in public health, 1900-1999: fluoridation of drinking water to prevent dental caries. MMWR 1999;48(41):933–40. Centers for Disease Control and Prevention. Populations receiving optimally fluoridated public drinking water — United States, 2000. MMWR 2002;51(7):144–7. Centers for Disease Control and Prevention. Recommendations for using fluoride to prevent and control dental caries in the United States. MMWR Recomm Rep 2001;50(RR-14):1–42. Centers for Disease Control and Prevention. Annual smoking-attributable mortality, years of potential life lost, and economic costs — United States, 1995–1999. MMWR 2002;51(14):300–3. Centers for Disease Control and Prevention. Dental Visits Among Dentate Adults with Diabetes ---United States, 1999 and 2004. MMWR November 25, 2005; 54(46); 1181-1183. Available at: http://www.cdc.gov/mmwr/preview/mmwrhtml/mm5446a3.htm Centers for Disease Control and Prevention, Health Youth, Youth Risk Behavior Survey. Available at: http://www.cdc.gov/HealthyYouth/yrbs/index.htm
46
Centers for Medicare and Medicaid Services. Health Accounts. CMS Web sit. Last modified 17 March 2005. Available at: http://www.cms.hhs.gov/statistics/nhe/. Centers for Medicare and Medicaid Services. 2003 Medicaid EPSDT Annual Report. Available at http://www.cms.hhs.gov/medicaid/epsdt/ep2003.pdf Child and Adolescent Health Measurement Initiative (2005). National Survey of Children’s Health, Data Resource Center on Child and Adolescent Health website. Retrieved 12/06/05 from www.nschdata.org. Christen AG, McDonald JL, Christen JA. The impact of tobacco use and cessation on nonmalignant and precancerous oral and dental diseases and conditions. Indianapolis, IN: Indiana University School of Dentistry; 1991. Dasanayake AP. Poor periodontal health of the pregnant woman as a risk factor for low birth weight. Ann Periodontal 1998;3:206–12. Davenport ES, Williams CE, Sterne JA, Sivapathasundram V, Fearne JM, Curtis MA. The East London study of maternal chronic periodontal disease and preterm low birth weight infants: study design and prevalence data. Ann Periodontol 1998;3:213–21. De Stefani E, Deneo-Pellegrini H, Mendilaharsu M, Ronco A. Diet and risk of cancer of the upper aerodigestive tract--I. Foods. Oral Oncol 1999;35(1):17–21. Division of Health Care Financing and Policy. Medicaid and Nevada Check Up Factbook – December, 2004. Available at: http://dhcfp.state.nv.us/pdf%20forms/Info/Fact%20Book%201-25-05%20Final.pdf Fiore MC, Bailey WC, Cohen SJ, et al. Treating tobacco use and dependence. Clinical practice guideline. Rockville, MD: US Department of Health and Human Services, Public Health Service; 2000. Available at: http://www.surgeongeneral.gov/tobacco/treating_tobacco_use.pdf Gaffield ML, Gilbert BJ, Malvitz DM, Romaguera R. Oral health during pregnancy: an analysis of information collected by the pregnancy risk assessment monitoring system. J Am Dent Assoc 2001;132(7):1009–16. Genco RJ. Periodontal disease and risk for myocardial infarction and cardiovascular disease. Cardiovasc Rev Rep 1998;19(3):34-40. Griffin SO, Jones K, Tomar SL. An economic evaluation of community water fluoridation. J Public Health Dent 2001;61(2):78–86. Herrero R. Chapter 7: Human papillomavirus and cancer of the upper aerodigestive tract. J Natl Cancer Inst Monogr 2003; (31):47–51. International Agency for Research on Cancer (IARC). IARC Monographs on the Evaluation of Carcinogenic Risks to Humans, Volume 89, Smokeless tobacco and some related nitrosamines. Lyon, France: World Health Organization, International Agency for Research on Cancer; 2005 (in preparation). Johnson NW. Oral Cancer. London: FDI World Press, 1999. Komaromy M, Grumbach K, Drake M, Vranizan K, Lurie N, Keane D, Bindman AB. The role of black and Hispanic physicians in providing health care for underserved populations. N Engl J Med 1996; 334(20):1305-10.
47
Kressin NR, De Souza MB. Oral health education and health promotion. In: Gluck GM, Morganstein WM (eds). Jong’s community dental health, 5th ed. St. Louis, MO: Mosby; 2003:277–328. Levi F. Cancer prevention: epidemiology and perspectives. Eur J Cancer 1999;35(14):1912–24. McLaughlin JK, Gridley G, Block G, et al. Dietary factors in oral and pharyngeal cancer. J Natl Cancer Inst 1988;80(15):1237–43. Mealey BL. Periodontal implications: medically compromised patients. Ann Periodontol 1996;1(1):256–321. Morse DE, Pendrys DG, Katz RV et al. Food group intake and the risk of oral epithelial dysplasia in a United States population. Cancer Causes Control 2000;11(8):713-20. National Center for Health Statistics. Health, United States, 2004, with chartbook on trends in the health of Americans. Hyattsville, Maryland: US Department of Health and Human Services, Centers for Disease Control and Prevention, National Center for Health Statistics; 2004. DHHS Publication No. 2004-1232. Available at: http://www.cdc.gov/nchs/data/hus/hus04.pdf Nevada State Health Division, Bureau of Community Health, Diabetes Prevention and Control Program. Diabetes in Nevada. A report and performance improvement plan from the Nevada State Health Division, Bureau of Community Health – April 2005. Offenbacher S, Jared HL, O’Reilly PG, Wells SR, Salvi GE, Lawrence HP, Socransky SS, Beck JD. Potential pathogenic mechanisms of periodontitis associated pregnancy complications. Ann Periodontol 1998;3(1):233–50. Offenbacher S, Lieff S, Boggess KA, Murtha AP, Madianos PN, Champagne CM, McKaig RG, Jared HL, Mauriello SM, Auten RL Jr, Herbert WN, Beck JD. Maternal periodontitis and prematurity. Part I: Obstetric outcome of prematurity and growth restriction. Ann Periodontol 2001;6(1):164–74. Phelan JA. Viruses and neoplastic growth. Dent Clin North Am 2003; 47(3):533–43. Redford M. Beyond pregnancy gingivitis: bringing a new focus to women’s oral health. J Dent Educ 1993;57(10):742–8. Ries LAG, Eisner MP, Kosary CL, Hankey BF, Miller BA, Clegg L, Mariotto A, Feuer EJ, Edwards BK (eds). SEER Cancer Statistics Review, 1975-2001, National Cancer Institute. Bethesda, MD; 2004. Available at: http://seer.cancer.gov/csr/1975_2001/ Scannapieco FA, Bush RB, Paju S. Periodontal disease as a risk factor for adverse pregnancy outcomes. A systematic review. Ann Periodontol. 2003;8(1):70–8. Shanks TG, Burns DM. Disease consequences of cigar smoking. In: National Cancer Institute. Cigars: health efffects and trends. Smoking and Tobacco Control Monograph 9 edition. Bethesda, MD: US Department of Health and Human Services, Public Health Service, National Institutes of Health, National Cancer Institute, 1998. Silverman SJ Jr. Oral cancer. 4th Edition edition. Atlanta, GA: American Cancer Society, 1998.
48
Substance Abuse and Mental Health Services Administration (SAMHSA), Office of Applied Studies, National Survey on Drug Use and Health, 2002, 2003, and 2004. Available at: http://oas.samhsa.gov/2k5States/statePE.doc Taylor GW. Bidirectional interrelationships between diabetes and periodontal diseases: an epidemiologic perspective. Ann Periodontol 2001;6(1):99–112. Tomar SL, Asma S. Smoking-attributable periodontitis in the United States: findings from NHANES III. J Periodontol 2000;71:743–51. Tomar SL, Husten CG, Manley MW. Do dentists and physicians advise tobacco users to quit? J Am Dent Assoc 1996;127(2):259–65. U.S. Department of Health and Human Services. The health consequences of using smokeless tobacco: a report of the Advisory Committee to the Surgeon General. Bethesda, MD: US Department of Health and Human Services, Public Health Service; 1986. NIH Publication No. 86-2874. U.S. Department of Health and Human Services. Oral Health in America: A Report of the Surgeon General. Rockville, MD: US Department of Health and Human Services, National Institutes of Health, National Institute of Dental and Craniofacial Research; 2000a. NIH Publication No. 00-4713. U.S. Department of Health and Human Services. Oral Health. In: Healthy People 2010 (2nd ed). With Understanding and Improving Health and Objectives for Improving Health. 2 vols. Washington, DC: U.S. Government Printing Office; 2000b. U.S. Department of Health and Human Services. National Call to Action to Promote Oral Health. Rockville, MD: U.S. Department of Health and Human Services, Public Health Service, National Institutes of Health, National Institute of Dental and Craniofacial Research; 2003. NIH Publication No. 03-5303. US Department of Health and Human Services. The health consequences of smoking: a report of the Surgeon General. Atlanta, GA: US Department of Health and Human Services, Centers for Disease Control and Prevention, National Center for Chronic Disease Prevention and Health Promotion, Office on Smoking and Health; 2004a. Available at: http://www.cdc.gov/tobacco/sgr/sgr_2004/index.htm . US Department of Health and Human Services. Healthy People 2010 progress review: oral health. Washington, DC: US Department of Health and Human Services, Public Health Service; 2004b. Available at: http://www.healthypeople.gov/data/2010prog/focus21/ Weaver RG, Ramanna S, Haden NK, Valachovic RW. Applicants to U.S. dental schools: an analysis of the 2002 entering class. J Dent Educ 2004;68(8):880–900.
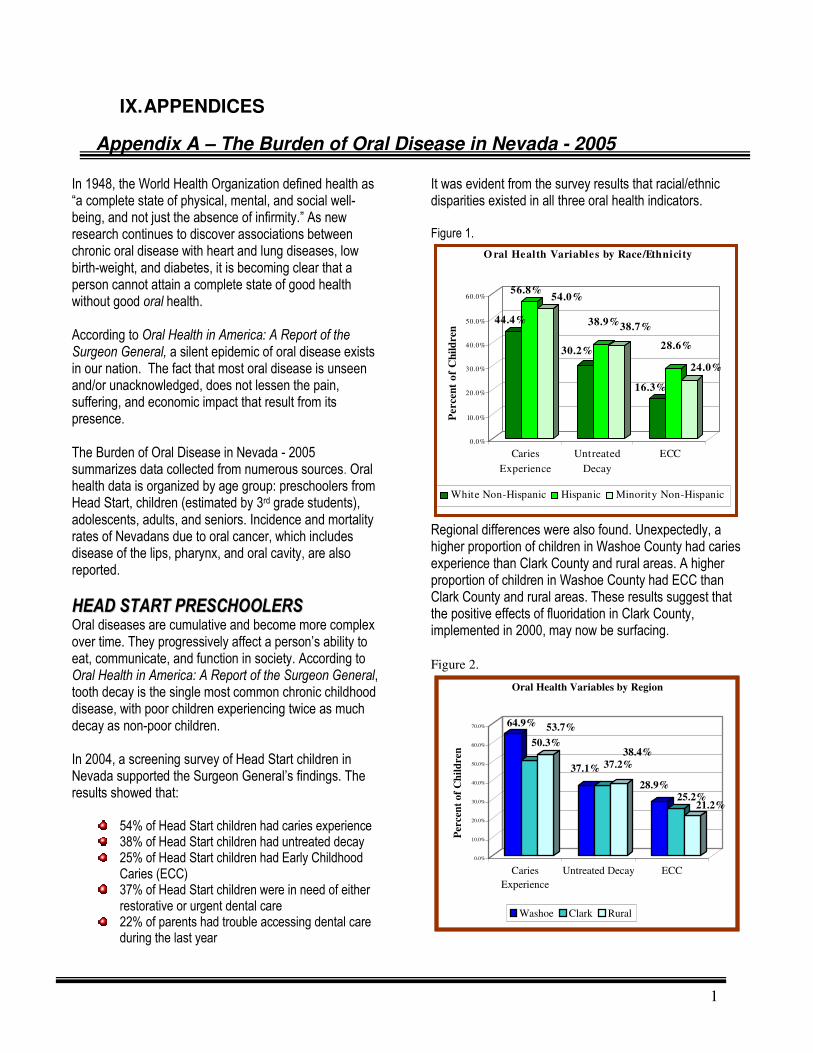
1
IX. APPENDICES
Appendix A – The Burden of Oral Disease in Nevada - 2005
In 1948, the World Health Organization defined health as “a complete state of physical, mental, and social well-being, and not just the absence of infirmity.” As new research continues to discover associations between chronic oral disease with heart and lung diseases, low birth-weight, and diabetes, it is becoming clear that a person cannot attain a complete state of good health without good oral health. According to Oral Health in America: A Report of the Surgeon General, a silent epidemic of oral disease exists in our nation. The fact that most oral disease is unseen and/or unacknowledged, does not lessen the pain, suffering, and economic impact that result from its presence. The Burden of Oral Disease in Nevada - 2005 summarizes data collected from numerous sources. Oral health data is organized by age group: preschoolers from Head Start, children (estimated by 3rd grade students), adolescents, adults, and seniors. Incidence and mortality rates of Nevadans due to oral cancer, which includes disease of the lips, pharynx, and oral cavity, are also reported.
HHEEAADD SSTTAARRTT PPRREESSCCHHOOOOLLEERRSS
Oral diseases are cumulative and become more complex over time. They progressively affect a person’s ability to eat, communicate, and function in society. According to Oral Health in America: A Report of the Surgeon General, tooth decay is the single most common chronic childhood disease, with poor children experiencing twice as much decay as non-poor children. In 2004, a screening survey of Head Start children in Nevada supported the Surgeon General’s findings. The results showed that:
54% of Head Start children had caries experience 38% of Head Start children had untreated decay 25% of Head Start children had Early Childhood Caries (ECC)
37% of Head Start children were in need of either restorative or urgent dental care
22% of parents had trouble accessing dental care during the last year
It was evident from the survey results that racial/ethnic disparities existed in all three oral health indicators. Figure 1.
44.4%
56.8%54.0%
30.2%
38.9%38.7%
16.3%
28.6%
24.0%
0.0%
10.0%
20.0%
30.0%
40.0%
50.0%
60.0%
Percen
t o
f C
hil
dren
Caries
Experience
Untreated
Decay
ECC
O ral Health Variables by Race/Ethnicity
White Non-Hispanic Hispanic Minority Non-Hispanic
Regional differences were also found. Unexpectedly, a higher proportion of children in Washoe County had caries experience than Clark County and rural areas. A higher proportion of children in Washoe County had ECC than Clark County and rural areas. These results suggest that the positive effects of fluoridation in Clark County, implemented in 2000, may now be surfacing. Figure 2.
64.9%
50.3%
53.7%
37.1% 37.2%
38.4%
28.9%25.2%
21.2%
0.0%
10.0%
20.0%
30.0%
40.0%
50.0%
60.0%
70.0%
Per
cen
t o
f C
hil
dre
n
Caries
Experience
Untreated Decay ECC
Oral Health Variables by Region
Washoe Clark Rural
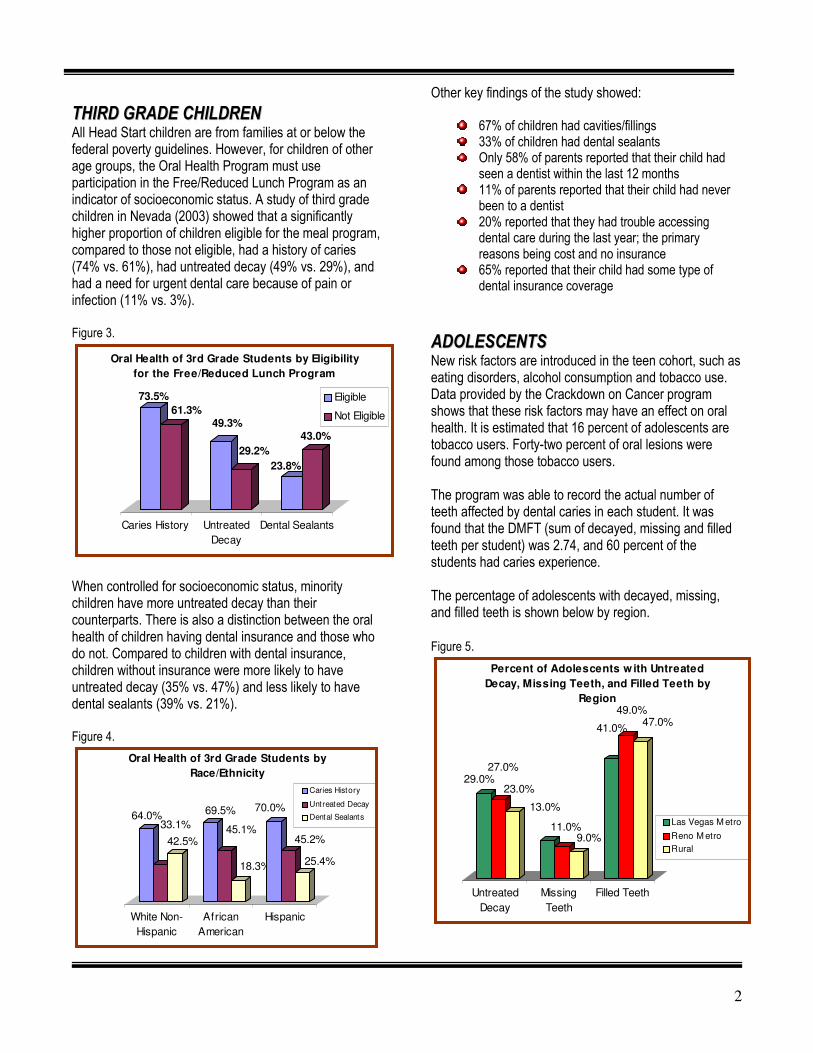
2
TTHHIIRRDD GGRRAADDEE CCHHIILLDDRREENN
All Head Start children are from families at or below the federal poverty guidelines. However, for children of other age groups, the Oral Health Program must use participation in the Free/Reduced Lunch Program as an indicator of socioeconomic status. A study of third grade children in Nevada (2003) showed that a significantly higher proportion of children eligible for the meal program, compared to those not eligible, had a history of caries (74% vs. 61%), had untreated decay (49% vs. 29%), and had a need for urgent dental care because of pain or infection (11% vs. 3%). Figure 3.
73.5%
61.3%49.3%
29.2%
23.8%
43.0%
Caries History Untreated
Decay
Dental Sealants
Oral Health of 3rd Grade Students by Eligibility
for the Free/Reduced Lunch Program
Eligible
Not Eligible
When controlled for socioeconomic status, minority children have more untreated decay than their counterparts. There is also a distinction between the oral health of children having dental insurance and those who do not. Compared to children with dental insurance, children without insurance were more likely to have untreated decay (35% vs. 47%) and less likely to have dental sealants (39% vs. 21%). Figure 4.
64.0%33.1%
42.5%
69.5%
45.1%
18.3%
70.0%
45.2%
25.4%
White Non-
Hispanic
African
American
Hispanic
Oral Health of 3rd Grade Students by
Race/Ethnicity
Caries History
Untreated Decay
Dental Sealants
Other key findings of the study showed:
67% of children had cavities/fillings 33% of children had dental sealants Only 58% of parents reported that their child had seen a dentist within the last 12 months
11% of parents reported that their child had never been to a dentist
20% reported that they had trouble accessing dental care during the last year; the primary reasons being cost and no insurance
65% reported that their child had some type of dental insurance coverage
AADDOOLLEESSCCEENNTTSS
New risk factors are introduced in the teen cohort, such as eating disorders, alcohol consumption and tobacco use. Data provided by the Crackdown on Cancer program shows that these risk factors may have an effect on oral health. It is estimated that 16 percent of adolescents are tobacco users. Forty-two percent of oral lesions were found among those tobacco users. The program was able to record the actual number of teeth affected by dental caries in each student. It was found that the DMFT (sum of decayed, missing and filled teeth per student) was 2.74, and 60 percent of the students had caries experience.
The percentage of adolescents with decayed, missing, and filled teeth is shown below by region. Figure 5.
29.0%27.0%
23.0%
13.0%
11.0%9.0%
41.0%
49.0%47.0%
Untreated
Decay
Missing
Teeth
Filled Teeth
Percent of Adolescents w ith Untreated
Decay, Missing Teeth, and Filled Teeth by
Region
Las Vegas M etro
Reno M etro
Rural
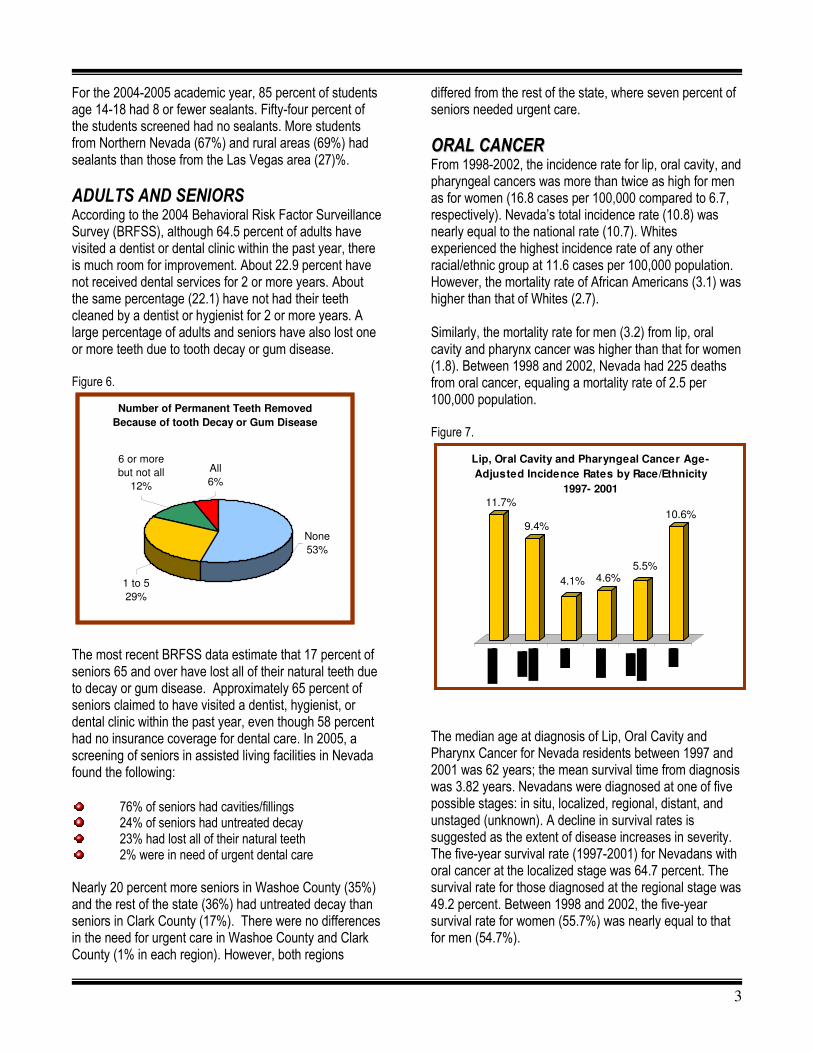
3
For the 2004-2005 academic year, 85 percent of students age 14-18 had 8 or fewer sealants. Fifty-four percent of the students screened had no sealants. More students from Northern Nevada (67%) and rural areas (69%) had sealants than those from the Las Vegas area (27)%.
ADULTS AND SENIORS
According to the 2004 Behavioral Risk Factor Surveillance Survey (BRFSS), although 64.5 percent of adults have visited a dentist or dental clinic within the past year, there is much room for improvement. About 22.9 percent have not received dental services for 2 or more years. About the same percentage (22.1) have not had their teeth cleaned by a dentist or hygienist for 2 or more years. A large percentage of adults and seniors have also lost one or more teeth due to tooth decay or gum disease. Figure 6.
Number of Permanent Teeth Removed
Because of tooth Decay or Gum Disease
None
53%
6 or more
but not all
12%
All
6%
1 to 5
29%
The most recent BRFSS data estimate that 17 percent of seniors 65 and over have lost all of their natural teeth due to decay or gum disease. Approximately 65 percent of seniors claimed to have visited a dentist, hygienist, or dental clinic within the past year, even though 58 percent had no insurance coverage for dental care. In 2005, a screening of seniors in assisted living facilities in Nevada found the following: 76% of seniors had cavities/fillings 24% of seniors had untreated decay 23% had lost all of their natural teeth 2% were in need of urgent dental care
Nearly 20 percent more seniors in Washoe County (35%) and the rest of the state (36%) had untreated decay than seniors in Clark County (17%). There were no differences in the need for urgent care in Washoe County and Clark County (1% in each region). However, both regions
differed from the rest of the state, where seven percent of seniors needed urgent care.
OORRAALL CCAANNCCEERR
From 1998-2002, the incidence rate for lip, oral cavity, and pharyngeal cancers was more than twice as high for men as for women (16.8 cases per 100,000 compared to 6.7, respectively). Nevada’s total incidence rate (10.8) was nearly equal to the national rate (10.7). Whites experienced the highest incidence rate of any other racial/ethnic group at 11.6 cases per 100,000 population. However, the mortality rate of African Americans (3.1) was higher than that of Whites (2.7). Similarly, the mortality rate for men (3.2) from lip, oral cavity and pharynx cancer was higher than that for women (1.8). Between 1998 and 2002, Nevada had 225 deaths from oral cancer, equaling a mortality rate of 2.5 per 100,000 population. Figure 7.
11.7%
9.4%
4.1% 4.6%5.5%
10.6%
Lip, Oral Cavity and Pharyngeal Cancer Age-
Adjusted Incidence Rates by Race/Ethnicity
1997- 2001
The median age at diagnosis of Lip, Oral Cavity and Pharynx Cancer for Nevada residents between 1997 and 2001 was 62 years; the mean survival time from diagnosis was 3.82 years. Nevadans were diagnosed at one of five possible stages: in situ, localized, regional, distant, and unstaged (unknown). A decline in survival rates is suggested as the extent of disease increases in severity. The five-year survival rate (1997-2001) for Nevadans with oral cancer at the localized stage was 64.7 percent. The survival rate for those diagnosed at the regional stage was 49.2 percent. Between 1998 and 2002, the five-year survival rate for women (55.7%) was nearly equal to that for men (54.7%).
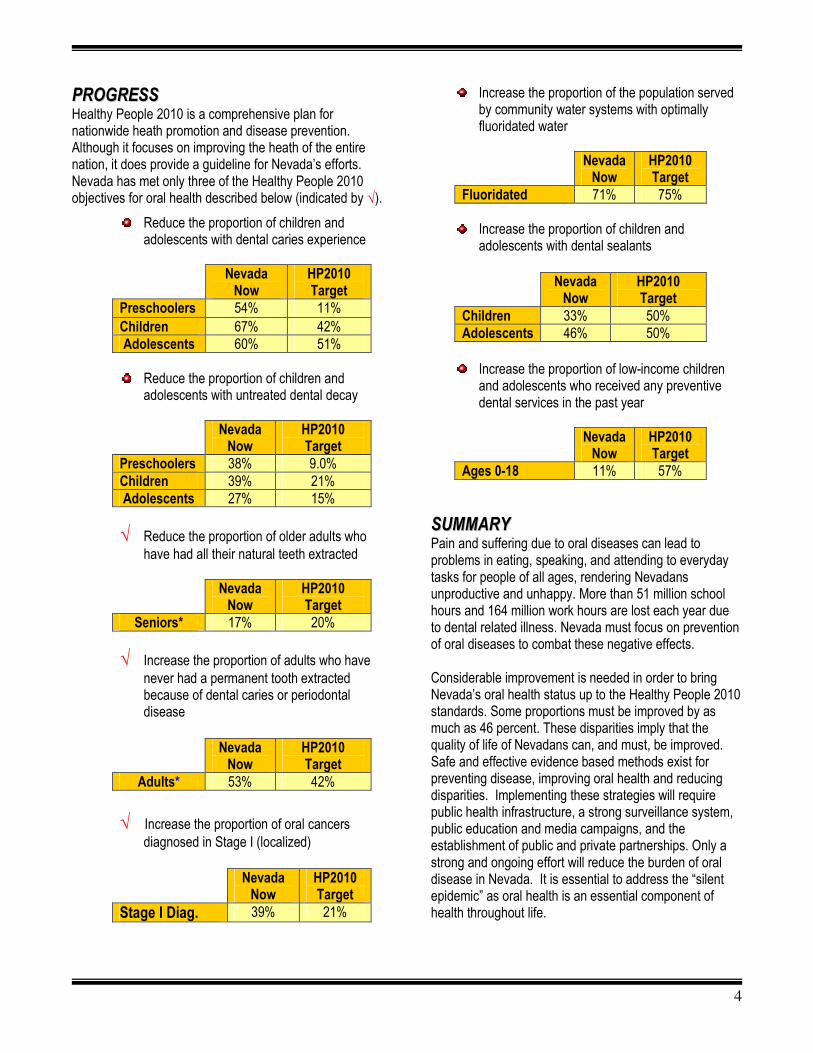
4
PPRROOGGRREESSSS
Healthy People 2010 is a comprehensive plan for nationwide heath promotion and disease prevention. Although it focuses on improving the heath of the entire nation, it does provide a guideline for Nevada’s efforts. Nevada has met only three of the Healthy People 2010 objectives for oral health described below (indicated by √).
Reduce the proportion of children and adolescents with dental caries experience
Nevada
Now HP2010 Target
Preschoolers 54% 11% Children 67% 42% Adolescents 60% 51%
Reduce the proportion of children and adolescents with untreated dental decay
Nevada
Now HP2010 Target
Preschoolers 38% 9.0% Children 39% 21% Adolescents 27% 15%
√ Reduce the proportion of older adults who
have had all their natural teeth extracted
Nevada Now
HP2010 Target
Seniors* 17% 20%
√ Increase the proportion of adults who have never had a permanent tooth extracted because of dental caries or periodontal disease
Nevada
Now HP2010 Target
Adults* 53% 42%
√ Increase the proportion of oral cancers
diagnosed in Stage I (localized)
Nevada Now
HP2010 Target
Stage I Diag. 39% 21%
Increase the proportion of the population served by community water systems with optimally fluoridated water
Nevada
Now HP2010 Target
Fluoridated 71% 75%
Increase the proportion of children and adolescents with dental sealants
Nevada
Now HP2010 Target
Children 33% 50% Adolescents 46% 50%
Increase the proportion of low-income children and adolescents who received any preventive dental services in the past year
Nevada
Now HP2010 Target
Ages 0-18 11% 57%
SSUUMMMMAARRYY
Pain and suffering due to oral diseases can lead to problems in eating, speaking, and attending to everyday tasks for people of all ages, rendering Nevadans unproductive and unhappy. More than 51 million school hours and 164 million work hours are lost each year due to dental related illness. Nevada must focus on prevention of oral diseases to combat these negative effects. Considerable improvement is needed in order to bring Nevada’s oral health status up to the Healthy People 2010 standards. Some proportions must be improved by as much as 46 percent. These disparities imply that the quality of life of Nevadans can, and must, be improved. Safe and effective evidence based methods exist for preventing disease, improving oral health and reducing disparities. Implementing these strategies will require public health infrastructure, a strong surveillance system, public education and media campaigns, and the establishment of public and private partnerships. Only a strong and ongoing effort will reduce the burden of oral disease in Nevada. It is essential to address the “silent epidemic” as oral health is an essential component of health throughout life.
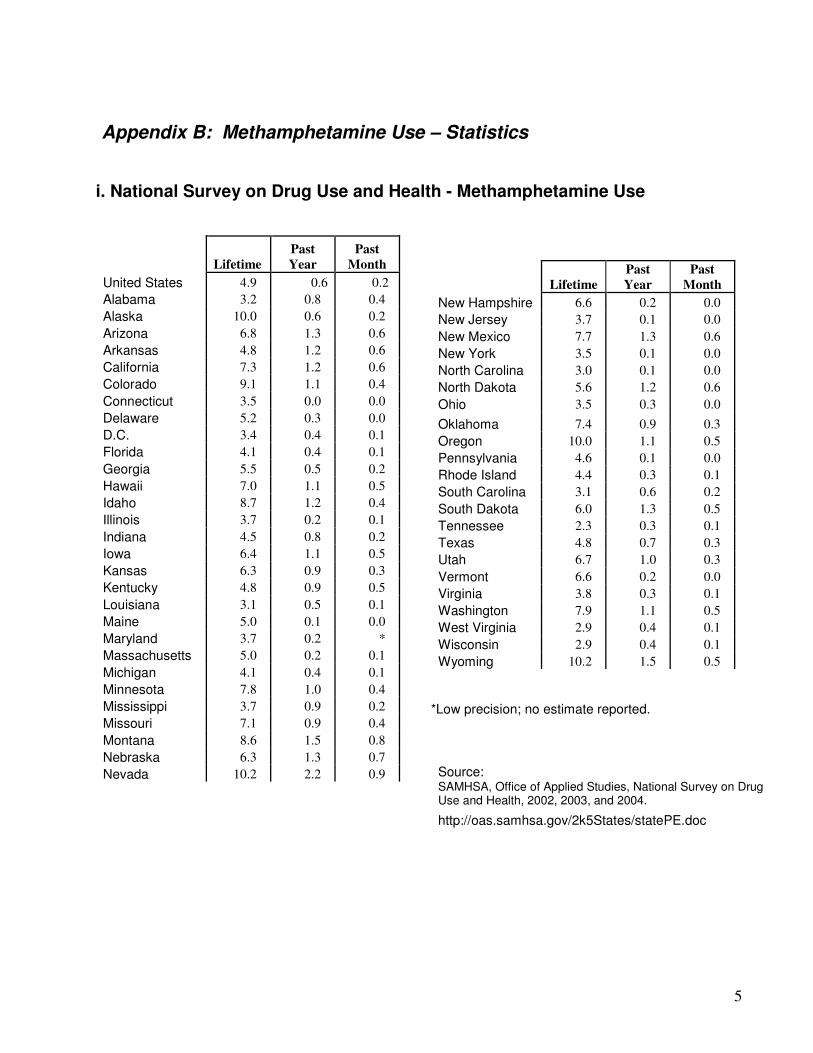
5
Appendix B: Methamphetamine Use – Statistics
i. National Survey on Drug Use and Health - Methamphetamine Use
Lifetime
Past
Year
Past
Month
United States 4.9 0.6 0.2
Alabama 3.2 0.8 0.4
Alaska 10.0 0.6 0.2
Arizona 6.8 1.3 0.6
Arkansas 4.8 1.2 0.6
California 7.3 1.2 0.6
Colorado 9.1 1.1 0.4
Connecticut 3.5 0.0 0.0
Delaware 5.2 0.3 0.0
D.C. 3.4 0.4 0.1
Florida 4.1 0.4 0.1
Georgia 5.5 0.5 0.2
Hawaii 7.0 1.1 0.5
Idaho 8.7 1.2 0.4
Illinois 3.7 0.2 0.1
Indiana 4.5 0.8 0.2
Iowa 6.4 1.1 0.5
Kansas 6.3 0.9 0.3
Kentucky 4.8 0.9 0.5
Louisiana 3.1 0.5 0.1
Maine 5.0 0.1 0.0
Maryland 3.7 0.2 *
Massachusetts 5.0 0.2 0.1
Michigan 4.1 0.4 0.1
Minnesota 7.8 1.0 0.4
Mississippi 3.7 0.9 0.2
Missouri 7.1 0.9 0.4
Montana 8.6 1.5 0.8
Nebraska 6.3 1.3 0.7
Nevada 10.2 2.2 0.9
Lifetime
Past
Year
Past
Month
New Hampshire 6.6 0.2 0.0
New Jersey 3.7 0.1 0.0
New Mexico 7.7 1.3 0.6
New York 3.5 0.1 0.0
North Carolina 3.0 0.1 0.0
North Dakota 5.6 1.2 0.6
Ohio 3.5 0.3 0.0
Oklahoma 7.4 0.9 0.3
Oregon 10.0 1.1 0.5
Pennsylvania 4.6 0.1 0.0
Rhode Island 4.4 0.3 0.1
South Carolina 3.1 0.6 0.2
South Dakota 6.0 1.3 0.5
Tennessee 2.3 0.3 0.1
Texas 4.8 0.7 0.3
Utah 6.7 1.0 0.3
Vermont 6.6 0.2 0.0
Virginia 3.8 0.3 0.1
Washington 7.9 1.1 0.5
West Virginia 2.9 0.4 0.1
Wisconsin 2.9 0.4 0.1
Wyoming 10.2 1.5 0.5
*Low precision; no estimate reported.
Source: SAMHSA, Office of Applied Studies, National Survey on Drug Use and Health, 2002, 2003, and 2004.
http://oas.samhsa.gov/2k5States/statePE.doc
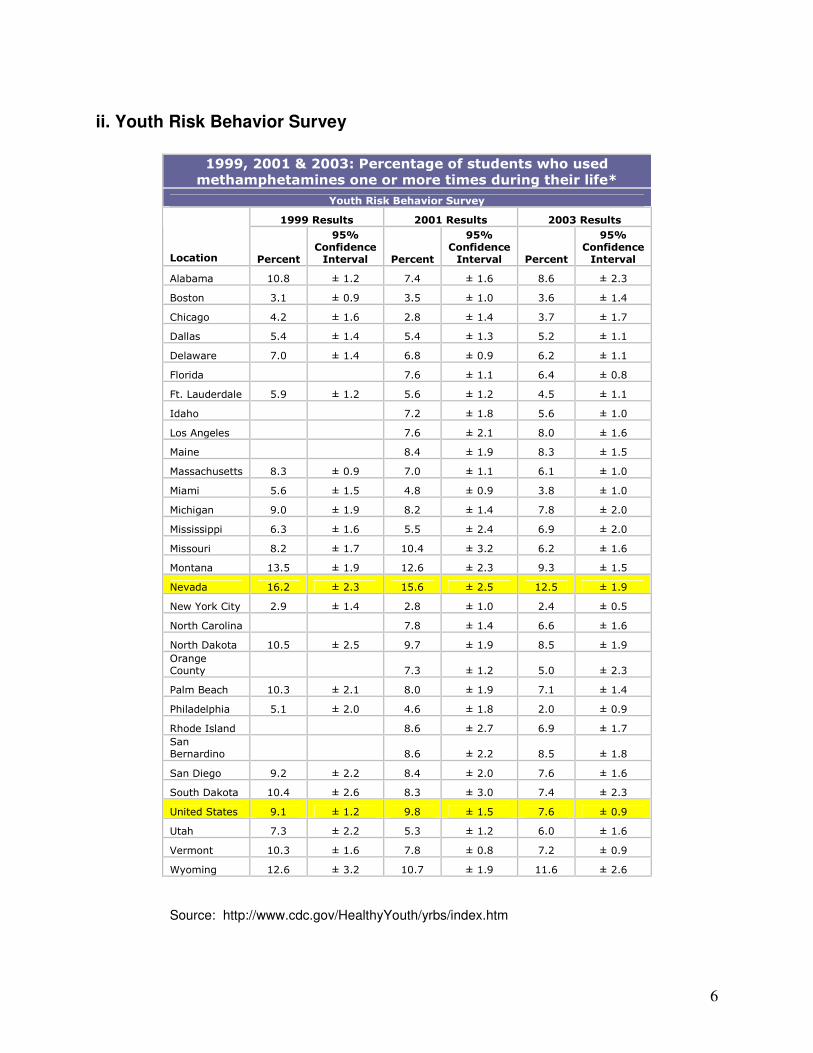
6
ii. Youth Risk Behavior Survey
1999, 2001 & 2003: Percentage of students who used
methamphetamines one or more times during their life*
Youth Risk Behavior Survey
1999 Results 2001 Results 2003 Results
Location Percent
95% Confidence Interval Percent
95% Confidence Interval Percent
95% Confidence Interval
Alabama 10.8 ± 1.2 7.4 ± 1.6 8.6 ± 2.3
Boston 3.1 ± 0.9 3.5 ± 1.0 3.6 ± 1.4
Chicago 4.2 ± 1.6 2.8 ± 1.4 3.7 ± 1.7
Dallas 5.4 ± 1.4 5.4 ± 1.3 5.2 ± 1.1
Delaware 7.0 ± 1.4 6.8 ± 0.9 6.2 ± 1.1
Florida 7.6 ± 1.1 6.4 ± 0.8
Ft. Lauderdale 5.9 ± 1.2 5.6 ± 1.2 4.5 ± 1.1
Idaho 7.2 ± 1.8 5.6 ± 1.0
Los Angeles 7.6 ± 2.1 8.0 ± 1.6
Maine 8.4 ± 1.9 8.3 ± 1.5
Massachusetts 8.3 ± 0.9 7.0 ± 1.1 6.1 ± 1.0
Miami 5.6 ± 1.5 4.8 ± 0.9 3.8 ± 1.0
Michigan 9.0 ± 1.9 8.2 ± 1.4 7.8 ± 2.0
Mississippi 6.3 ± 1.6 5.5 ± 2.4 6.9 ± 2.0
Missouri 8.2 ± 1.7 10.4 ± 3.2 6.2 ± 1.6
Montana 13.5 ± 1.9 12.6 ± 2.3 9.3 ± 1.5
Nevada 16.2 ± 2.3 15.6 ± 2.5 12.5 ± 1.9
New York City 2.9 ± 1.4 2.8 ± 1.0 2.4 ± 0.5
North Carolina 7.8 ± 1.4 6.6 ± 1.6
North Dakota 10.5 ± 2.5 9.7 ± 1.9 8.5 ± 1.9
Orange
County 7.3 ± 1.2 5.0 ± 2.3
Palm Beach 10.3 ± 2.1 8.0 ± 1.9 7.1 ± 1.4
Philadelphia 5.1 ± 2.0 4.6 ± 1.8 2.0 ± 0.9
Rhode Island 8.6 ± 2.7 6.9 ± 1.7
San
Bernardino 8.6 ± 2.2 8.5 ± 1.8
San Diego 9.2 ± 2.2 8.4 ± 2.0 7.6 ± 1.6
South Dakota 10.4 ± 2.6 8.3 ± 3.0 7.4 ± 2.3
United States 9.1 ± 1.2 9.8 ± 1.5 7.6 ± 0.9
Utah 7.3 ± 2.2 5.3 ± 1.2 6.0 ± 1.6
Vermont 10.3 ± 1.6 7.8 ± 0.8 7.2 ± 0.9
Wyoming 12.6 ± 3.2 10.7 ± 1.9 11.6 ± 2.6
Source: http://www.cdc.gov/HealthyYouth/yrbs/index.htm
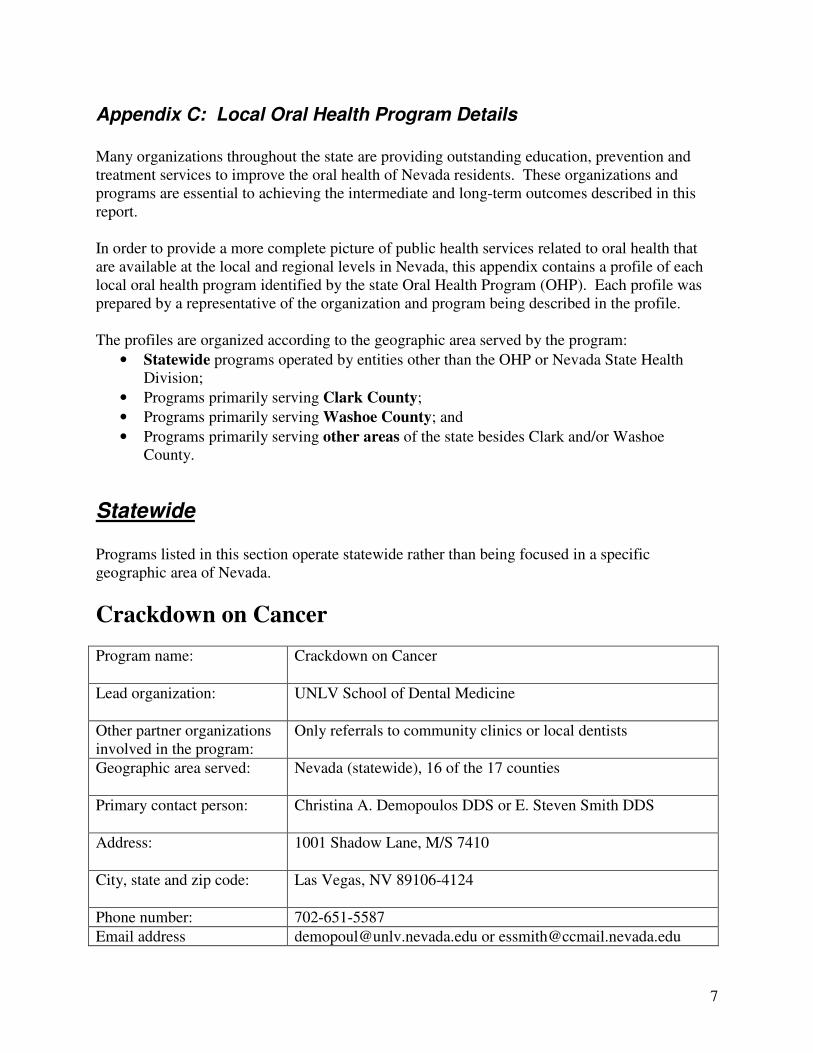
7
Appendix C: Local Oral Health Program Details
Many organizations throughout the state are providing outstanding education, prevention and treatment services to improve the oral health of Nevada residents. These organizations and programs are essential to achieving the intermediate and long-term outcomes described in this report. In order to provide a more complete picture of public health services related to oral health that are available at the local and regional levels in Nevada, this appendix contains a profile of each local oral health program identified by the state Oral Health Program (OHP). Each profile was prepared by a representative of the organization and program being described in the profile. The profiles are organized according to the geographic area served by the program:
• Statewide programs operated by entities other than the OHP or Nevada State Health Division;
• Programs primarily serving Clark County;
• Programs primarily serving Washoe County; and
• Programs primarily serving other areas of the state besides Clark and/or Washoe County.
Statewide Programs listed in this section operate statewide rather than being focused in a specific geographic area of Nevada.
Crackdown on Cancer
Program name:
Crackdown on Cancer
Lead organization:
UNLV School of Dental Medicine
Other partner organizations involved in the program:
Only referrals to community clinics or local dentists
Geographic area served:
Nevada (statewide), 16 of the 17 counties
Primary contact person:
Christina A. Demopoulos DDS or E. Steven Smith DDS
Address:
1001 Shadow Lane, M/S 7410
City, state and zip code:
Las Vegas, NV 89106-4124
Phone number: 702-651-5587
Email address [email protected] or [email protected]
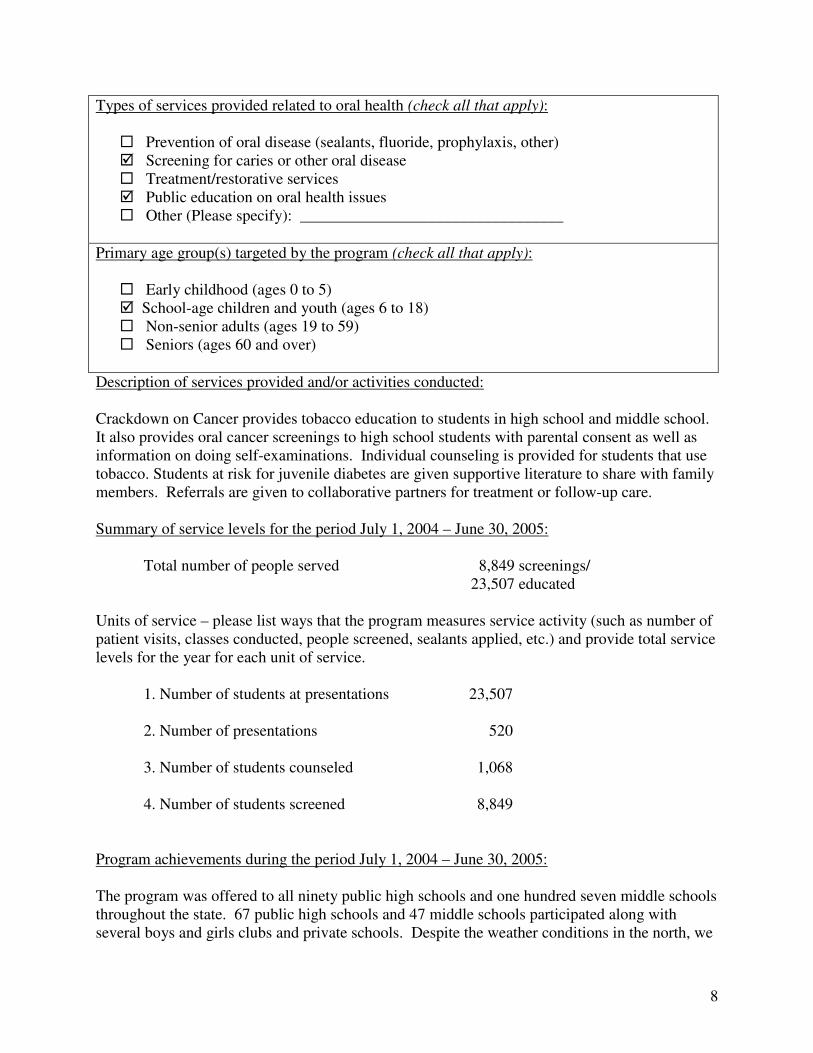
8
Types of services provided related to oral health (check all that apply):
� Prevention of oral disease (sealants, fluoride, prophylaxis, other) � Screening for caries or other oral disease � Treatment/restorative services � Public education on oral health issues � Other (Please specify): _________________________________
Primary age group(s) targeted by the program (check all that apply):
� Early childhood (ages 0 to 5) � School-age children and youth (ages 6 to 18) � Non-senior adults (ages 19 to 59) � Seniors (ages 60 and over)
Description of services provided and/or activities conducted: Crackdown on Cancer provides tobacco education to students in high school and middle school. It also provides oral cancer screenings to high school students with parental consent as well as information on doing self-examinations. Individual counseling is provided for students that use tobacco. Students at risk for juvenile diabetes are given supportive literature to share with family members. Referrals are given to collaborative partners for treatment or follow-up care. Summary of service levels for the period July 1, 2004 – June 30, 2005:
Total number of people served 8,849 screenings/ 23,507 educated
Units of service – please list ways that the program measures service activity (such as number of patient visits, classes conducted, people screened, sealants applied, etc.) and provide total service levels for the year for each unit of service.
1. Number of students at presentations 23,507 2. Number of presentations 520
3. Number of students counseled 1,068
4. Number of students screened 8,849
Program achievements during the period July 1, 2004 – June 30, 2005: The program was offered to all ninety public high schools and one hundred seven middle schools throughout the state. 67 public high schools and 47 middle schools participated along with several boys and girls clubs and private schools. Despite the weather conditions in the north, we
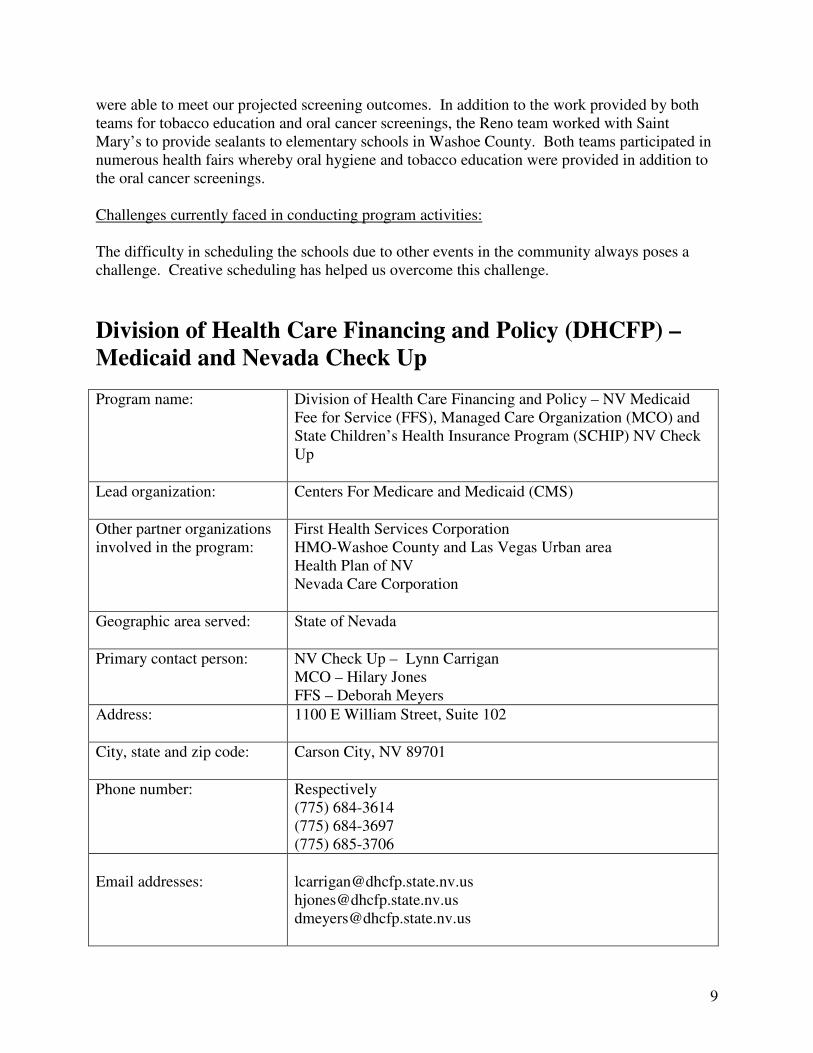
9
were able to meet our projected screening outcomes. In addition to the work provided by both teams for tobacco education and oral cancer screenings, the Reno team worked with Saint Mary’s to provide sealants to elementary schools in Washoe County. Both teams participated in numerous health fairs whereby oral hygiene and tobacco education were provided in addition to the oral cancer screenings. Challenges currently faced in conducting program activities: The difficulty in scheduling the schools due to other events in the community always poses a challenge. Creative scheduling has helped us overcome this challenge.
Division of Health Care Financing and Policy (DHCFP) –
Medicaid and Nevada Check Up
Program name:
Division of Health Care Financing and Policy – NV Medicaid Fee for Service (FFS), Managed Care Organization (MCO) and State Children’s Health Insurance Program (SCHIP) NV Check Up
Lead organization:
Centers For Medicare and Medicaid (CMS)
Other partner organizations involved in the program:
First Health Services Corporation HMO-Washoe County and Las Vegas Urban area Health Plan of NV Nevada Care Corporation
Geographic area served:
State of Nevada
Primary contact person:
NV Check Up – Lynn Carrigan MCO – Hilary Jones FFS – Deborah Meyers
Address:
1100 E William Street, Suite 102
City, state and zip code:
Carson City, NV 89701
Phone number:
Respectively (775) 684-3614 (775) 684-3697 (775) 685-3706
Email addresses:
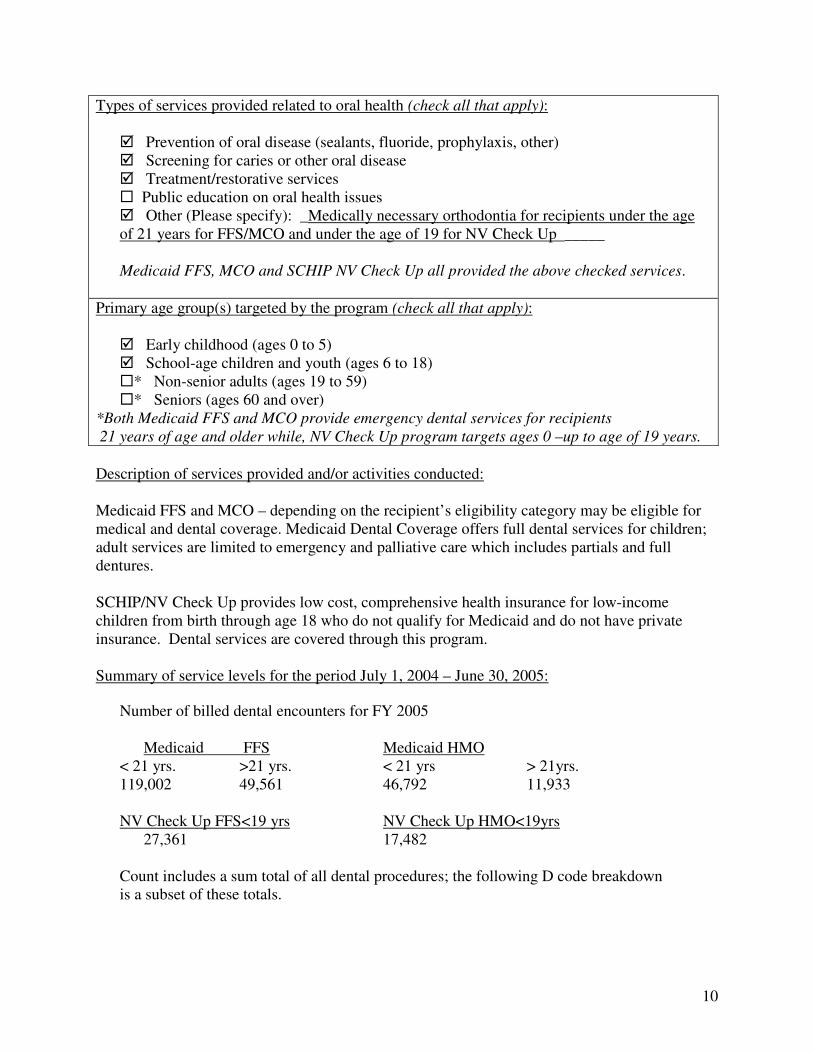
10
Types of services provided related to oral health (check all that apply):
� Prevention of oral disease (sealants, fluoride, prophylaxis, other) � Screening for caries or other oral disease � Treatment/restorative services � Public education on oral health issues � Other (Please specify): _Medically necessary orthodontia for recipients under the age of 21 years for FFS/MCO and under the age of 19 for NV Check Up _____ Medicaid FFS, MCO and SCHIP NV Check Up all provided the above checked services.
Primary age group(s) targeted by the program (check all that apply):
� Early childhood (ages 0 to 5) � School-age children and youth (ages 6 to 18) �* Non-senior adults (ages 19 to 59) �* Seniors (ages 60 and over)
*Both Medicaid FFS and MCO provide emergency dental services for recipients
21 years of age and older while, NV Check Up program targets ages 0 –up to age of 19 years.
Description of services provided and/or activities conducted: Medicaid FFS and MCO – depending on the recipient’s eligibility category may be eligible for medical and dental coverage. Medicaid Dental Coverage offers full dental services for children; adult services are limited to emergency and palliative care which includes partials and full dentures. SCHIP/NV Check Up provides low cost, comprehensive health insurance for low-income children from birth through age 18 who do not qualify for Medicaid and do not have private insurance. Dental services are covered through this program. Summary of service levels for the period July 1, 2004 – June 30, 2005:
Number of billed dental encounters for FY 2005 Medicaid FFS Medicaid HMO < 21 yrs. >21 yrs. < 21 yrs > 21yrs. 119,002 49,561 46,792 11,933 NV Check Up FFS<19 yrs NV Check Up HMO<19yrs 27,361 17,482 Count includes a sum total of all dental procedures; the following D code breakdown is a subset of these totals.
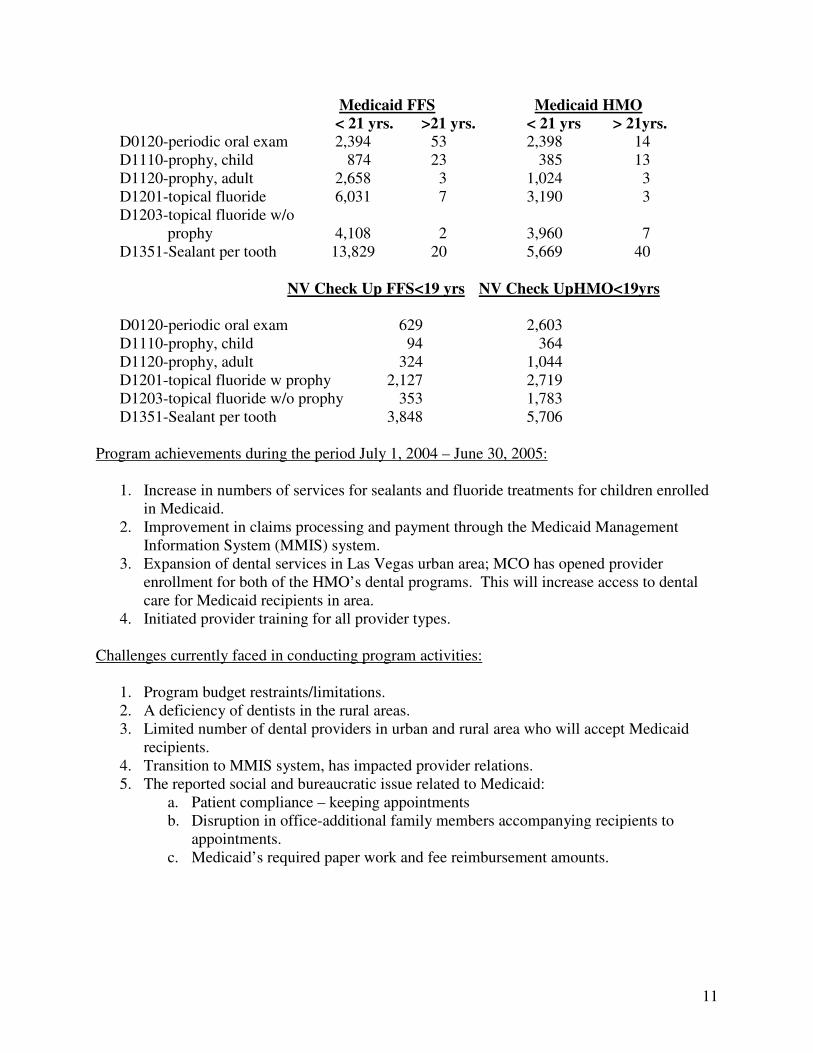
11
Medicaid FFS Medicaid HMO
< 21 yrs. >21 yrs. < 21 yrs > 21yrs.
D0120-periodic oral exam 2,394 53 2,398 14 D1110-prophy, child 874 23 385 13 D1120-prophy, adult 2,658 3 1,024 3 D1201-topical fluoride 6,031 7 3,190 3 D1203-topical fluoride w/o
prophy 4,108 2 3,960 7 D1351-Sealant per tooth 13,829 20 5,669 40 NV Check Up FFS<19 yrs NV Check UpHMO<19yrs
D0120-periodic oral exam 629 2,603 D1110-prophy, child 94 364 D1120-prophy, adult 324 1,044 D1201-topical fluoride w prophy 2,127 2,719 D1203-topical fluoride w/o prophy 353 1,783 D1351-Sealant per tooth 3,848 5,706
Program achievements during the period July 1, 2004 – June 30, 2005:
1. Increase in numbers of services for sealants and fluoride treatments for children enrolled in Medicaid.
2. Improvement in claims processing and payment through the Medicaid Management Information System (MMIS) system.
3. Expansion of dental services in Las Vegas urban area; MCO has opened provider enrollment for both of the HMO’s dental programs. This will increase access to dental care for Medicaid recipients in area.
4. Initiated provider training for all provider types. Challenges currently faced in conducting program activities:
1. Program budget restraints/limitations. 2. A deficiency of dentists in the rural areas. 3. Limited number of dental providers in urban and rural area who will accept Medicaid
recipients. 4. Transition to MMIS system, has impacted provider relations. 5. The reported social and bureaucratic issue related to Medicaid:
a. Patient compliance – keeping appointments b. Disruption in office-additional family members accompanying recipients to
appointments. c. Medicaid’s required paper work and fee reimbursement amounts.
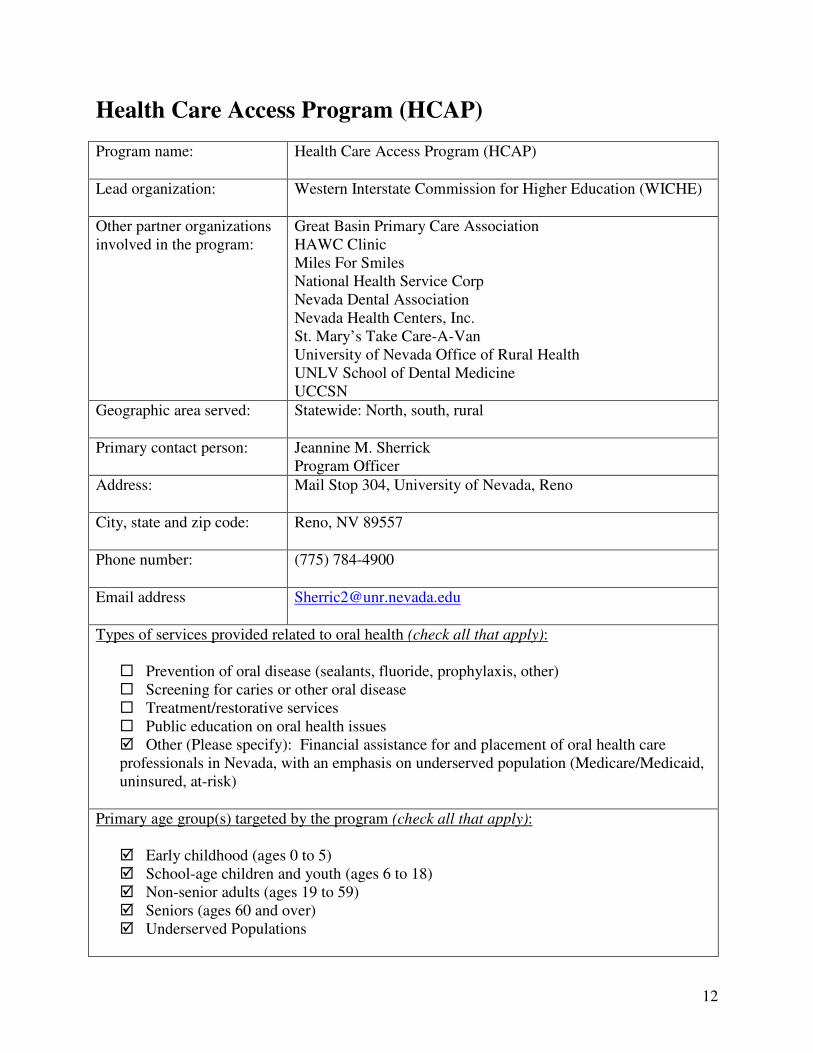
12
Health Care Access Program (HCAP)
Program name:
Health Care Access Program (HCAP)
Lead organization:
Western Interstate Commission for Higher Education (WICHE)
Other partner organizations involved in the program:
Great Basin Primary Care Association HAWC Clinic Miles For Smiles National Health Service Corp Nevada Dental Association Nevada Health Centers, Inc. St. Mary’s Take Care-A-Van University of Nevada Office of Rural Health UNLV School of Dental Medicine UCCSN
Geographic area served:
Statewide: North, south, rural
Primary contact person:
Jeannine M. Sherrick Program Officer
Address:
Mail Stop 304, University of Nevada, Reno
City, state and zip code:
Reno, NV 89557
Phone number:
(775) 784-4900
Email address
Types of services provided related to oral health (check all that apply):
� Prevention of oral disease (sealants, fluoride, prophylaxis, other) � Screening for caries or other oral disease � Treatment/restorative services � Public education on oral health issues � Other (Please specify): Financial assistance for and placement of oral health care professionals in Nevada, with an emphasis on underserved population (Medicare/Medicaid, uninsured, at-risk)
Primary age group(s) targeted by the program (check all that apply):
� Early childhood (ages 0 to 5) � School-age children and youth (ages 6 to 18) � Non-senior adults (ages 19 to 59) � Seniors (ages 60 and over) � Underserved Populations
13
Description of services provided and/or activities conducted: Provides financial aid to assist students in obtaining their education in the field of dentistry and requires students to return to Nevada as professionals to work in general or specialized dentistry. WICHE now offers a loan repayment program in which graduates will be given funding which is to be applied towards repayment of their student loans. In return, professionals make a two-year commitment to work with an underserved population. Summary of service levels for the period July 1, 2004 – June 30, 2005:
Total number of people served: N/A
Units of service – please list ways that the program measures service activity (such as number of patient visits, classes conducted, people screened, sealants applied, etc.) and provide total service levels for the year for each unit of service.
1. Number of dental students in pipeline: 36 2. Number of WICHE dentists graduated and practicing in the state: 28 3. Number of WICHE dentists practicing with underserved populations: 20
4. Locations (counties) in WICHE dentists practicing: 9 counties, 9 cities Program achievements during the period July 1, 2004 – June 30, 2005:
- Orthodontists now assigned to underserved populations - Providing general dental services throughout the state in urban and rural locations - HCAP coalition is actively collaborating and addressing the dental health needs of the
state - Development of a working group for the definition and identification of the term
“underserved” Challenges currently faced in conducting program activities: Measurement of program benefits National recruitment of dental professionals
Nevada Health Centers (NVHC) Dental – Miles for Smiles
Program name:
NVHC Dental – Miles for Smiles
Lead organization:
Nevada Health Centers, Inc.
Other partner organizations involved in the program:
Northeastern Nevada AHEC NV Office of Rural Health (We partner with many other organizations in various ways.)
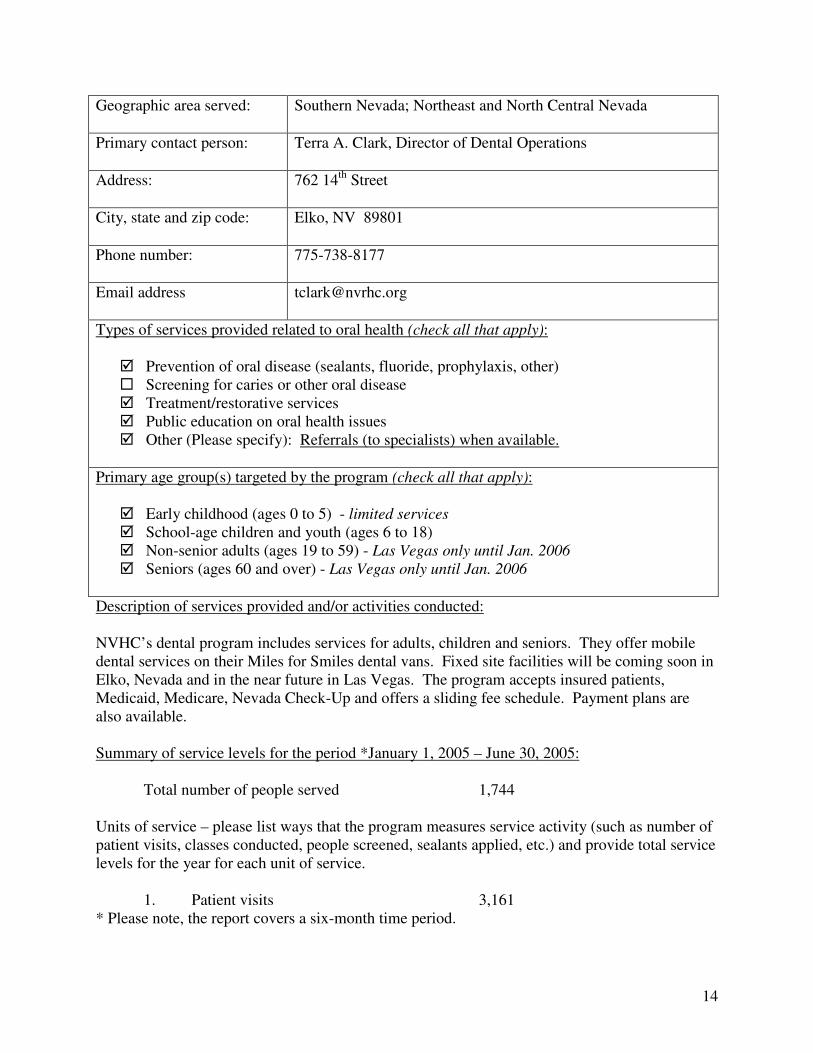
14
Geographic area served:
Southern Nevada; Northeast and North Central Nevada
Primary contact person:
Terra A. Clark, Director of Dental Operations
Address:
762 14th Street
City, state and zip code:
Elko, NV 89801
Phone number:
775-738-8177
Email address
Types of services provided related to oral health (check all that apply):
� Prevention of oral disease (sealants, fluoride, prophylaxis, other) � Screening for caries or other oral disease � Treatment/restorative services � Public education on oral health issues � Other (Please specify): Referrals (to specialists) when available.
Primary age group(s) targeted by the program (check all that apply):
� Early childhood (ages 0 to 5) - limited services
� School-age children and youth (ages 6 to 18) � Non-senior adults (ages 19 to 59) - Las Vegas only until Jan. 2006 � Seniors (ages 60 and over) - Las Vegas only until Jan. 2006
Description of services provided and/or activities conducted: NVHC’s dental program includes services for adults, children and seniors. They offer mobile dental services on their Miles for Smiles dental vans. Fixed site facilities will be coming soon in Elko, Nevada and in the near future in Las Vegas. The program accepts insured patients, Medicaid, Medicare, Nevada Check-Up and offers a sliding fee schedule. Payment plans are also available. Summary of service levels for the period *January 1, 2005 – June 30, 2005:
Total number of people served 1,744 Units of service – please list ways that the program measures service activity (such as number of patient visits, classes conducted, people screened, sealants applied, etc.) and provide total service levels for the year for each unit of service.
1. Patient visits 3,161 * Please note, the report covers a six-month time period.
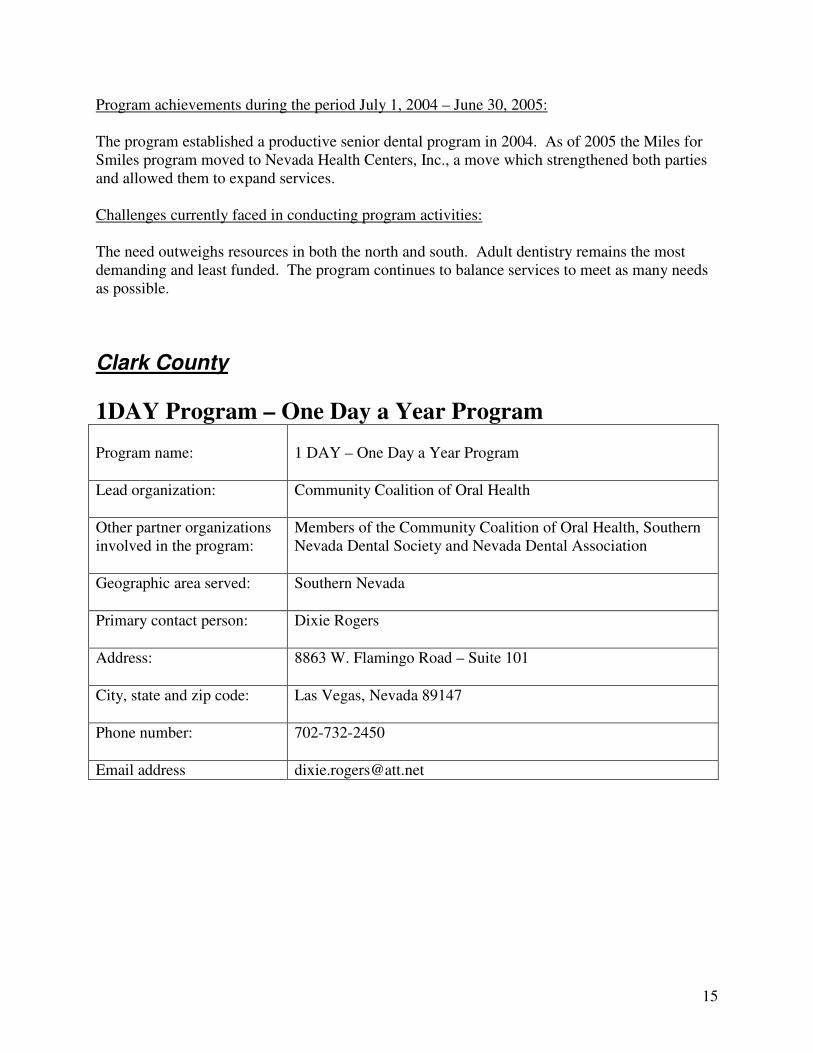
15
Program achievements during the period July 1, 2004 – June 30, 2005: The program established a productive senior dental program in 2004. As of 2005 the Miles for Smiles program moved to Nevada Health Centers, Inc., a move which strengthened both parties and allowed them to expand services. Challenges currently faced in conducting program activities: The need outweighs resources in both the north and south. Adult dentistry remains the most demanding and least funded. The program continues to balance services to meet as many needs as possible.
Clark County
1DAY Program – One Day a Year Program Program name:
1 DAY – One Day a Year Program
Lead organization:
Community Coalition of Oral Health
Other partner organizations involved in the program:
Members of the Community Coalition of Oral Health, Southern Nevada Dental Society and Nevada Dental Association
Geographic area served:
Southern Nevada
Primary contact person:
Dixie Rogers
Address:
8863 W. Flamingo Road – Suite 101
City, state and zip code:
Las Vegas, Nevada 89147
Phone number:
702-732-2450
Email address [email protected]
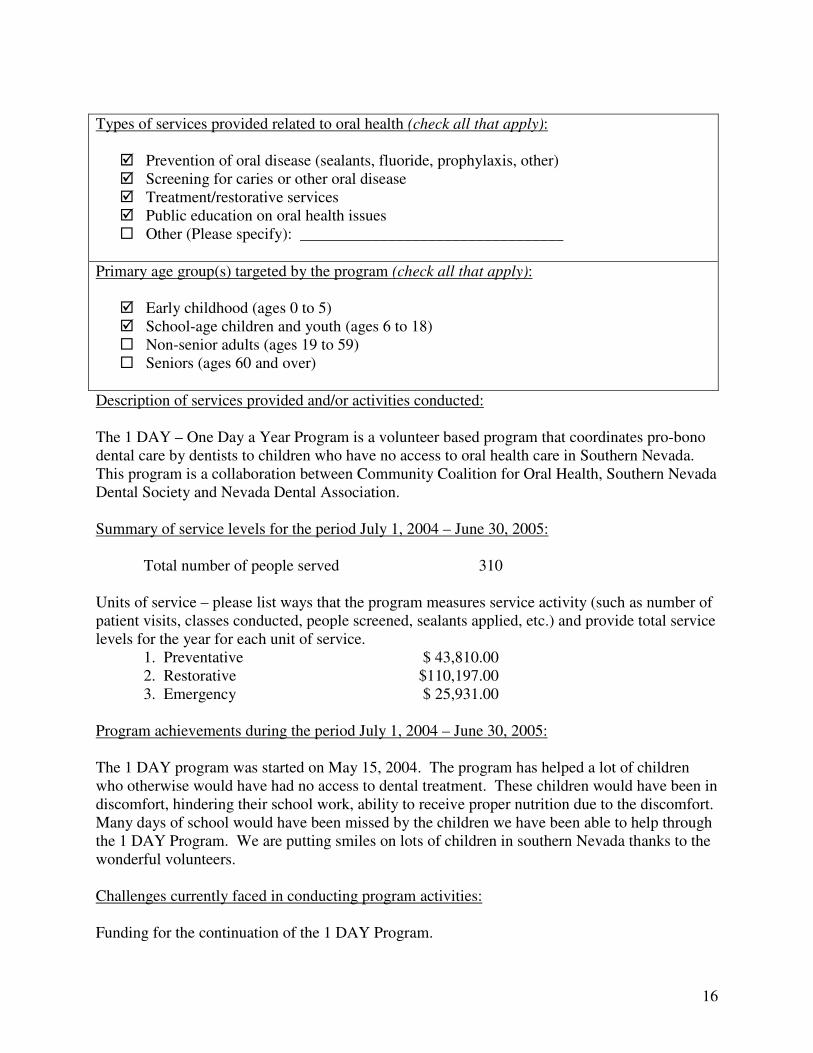
16
Types of services provided related to oral health (check all that apply):
� Prevention of oral disease (sealants, fluoride, prophylaxis, other) � Screening for caries or other oral disease � Treatment/restorative services � Public education on oral health issues � Other (Please specify): _________________________________
Primary age group(s) targeted by the program (check all that apply):
� Early childhood (ages 0 to 5) � School-age children and youth (ages 6 to 18) � Non-senior adults (ages 19 to 59) � Seniors (ages 60 and over)
Description of services provided and/or activities conducted: The 1 DAY – One Day a Year Program is a volunteer based program that coordinates pro-bono dental care by dentists to children who have no access to oral health care in Southern Nevada. This program is a collaboration between Community Coalition for Oral Health, Southern Nevada Dental Society and Nevada Dental Association. Summary of service levels for the period July 1, 2004 – June 30, 2005:
Total number of people served 310
Units of service – please list ways that the program measures service activity (such as number of patient visits, classes conducted, people screened, sealants applied, etc.) and provide total service levels for the year for each unit of service.
1. Preventative $ 43,810.00 2. Restorative $110,197.00 3. Emergency $ 25,931.00
Program achievements during the period July 1, 2004 – June 30, 2005: The 1 DAY program was started on May 15, 2004. The program has helped a lot of children who otherwise would have had no access to dental treatment. These children would have been in discomfort, hindering their school work, ability to receive proper nutrition due to the discomfort. Many days of school would have been missed by the children we have been able to help through the 1 DAY Program. We are putting smiles on lots of children in southern Nevada thanks to the wonderful volunteers. Challenges currently faced in conducting program activities: Funding for the continuation of the 1 DAY Program.
17
Clark County Health District
Program name:
Clark County Health District
Lead organization:
Clark County Health District
Geographic area served:
Clark County
Primary contact person:
Zona Hickstein, R.N., PHN Supervisor
Address:
625 Shadow Lane
City, state and zip code:
Las Vegas, Nevada, 89106
Phone number:
(702) 386-8538
Email address
Types of services provided related to oral health (check all that apply):
� Prevention of oral disease (sealants, fluoride, prophylaxis, other) � Screening for caries or other oral disease � Treatment/restorative services � Public education on oral health issues � Other (Please specify): _________________________________
Primary age group(s) targeted by the program (check all that apply):
� Early childhood (ages 0 to 5) � School-age children and youth (ages 6 to 18) � Non-senior adults (ages 19 to 59) � Seniors (ages 60 and over)
Description of services provided and/or activities conducted: Provide screening for all children seen within the Maternal and Child Health (MCH) Program, Satellite Clinic exams and Healthy Kids exams. Provide fluoride varnish to children with Medicaid. Provide education for parents and children in the MCH Program, Satellite Clinic exams and Healthy Kids exams. Summary of service levels for the period July 1, 2004 – June 30, 2005:
Total number of people served 7,993
18
Units of service – please list ways that the program measures service activity (such as number of patient visits, classes conducted, people screened, sealants applied, etc.) and provide total service levels for the year for each unit of service.
1. MCH Program (Home Visits) 5,838
2. Satellite Clinic 606
3. Healthy Kids Exam 1,247
4. Fluoride Varnish 302 Program achievements during the period July 1, 2004 – June 30, 2005: Fluoride varnish applied to 302 of children in the Clark County area. Approximately 7,691 children screened and education given on proper oral health. Challenges currently faced in conducting program activities: Obtaining approved Medicaid eligible children.
Clinic On Wheels
Program name:
Clinic On Wheels
Lead organization:
Classrooms On Wheels
Other partner organizations involved in the program:
Geographic area served:
Southern Nevada
Primary contact person:
Maribah Diaz
Address:
2039 E. Lake Mead Blvd
City, state and zip code:
North Las Vegas, NV 89030
Phone number:
702-870-7201
Email address
19
Types of services provided related to oral health (check all that apply):
� Prevention of oral disease (sealants, fluoride, prophylaxis, other) � Screening for caries or other oral disease � Treatment/restorative services � Public education on oral health issues � Other (Please specify): _________________________________
Primary age group(s) targeted by the program (check all that apply):
� Early childhood (ages 0 to 5) � School-age children and youth (ages 6 to 18) � Non-senior adults (ages 19 to 59) � Seniors (ages 60 and over)
Description of services provided and/or activities conducted: We are primarily a pediatric primary health care clinic so oral health is only a part of our exams and our teaching. We screen each child that is having a physical exam. We treat children for oral infections with prescriptions and referrals. Summary of service levels for the period July 1, 2004 – June 30, 2005:
Total number of people served 10,402 Units of service – please list ways that the program measures service activity (such as number of patient visits, classes conducted, people screened, sealants applied, etc.) and provide total service levels for the year for each unit of service.
1. Screenings 4,014 2. Prescriptions 132 3. Referral 330
Program achievements during the period July 1, 2004 – June 30, 2005: We have partnered with the One Day Program to refer children that have no access to insurance. If a child has access to insurance we facilitate getting appointments at an appropriate dentist. In February, we were the entity the Southern Nevada Dental Society selected to provide dental screenings for all 174 children at the Give Kids a Smile Day sponsored by the American Dental Association. We recently acquired a complete dental operatory at the Renaldo Martinez Elementary School Health Clinic. A volunteer dentist was already able to screen 35 children before the equipment was completely installed.
Challenges currently faced in conducting program activities: We only have one dental chair. We are relying on donations for all of our dental supplies.
20
Community College of Southern Nevada Dental Hygiene
Program
Program name:
Community College of Southern Nevada Dental Hygiene Program
Lead organization:
Community College of Southern Nevada
Other partner organizations involved in the program:
Seal Nevada South- Statewide Dental Sealant Program. Program Administrator- Stephanie Redwine RDH. BS
Geographic area served:
Clark County
Primary contact person:
Doreen Craig RDH, MS, Ed CCSN Dental Hygiene Interim Program Director
Address:
6375 W. Charleston Blvd. W1A
City, state and zip code:
Las Vegas, NV 89146
Phone number:
(702) 651-5593
Email address
Types of services provided related to oral health (check all that apply):
� Prevention of oral disease (sealants, fluoride, prophylaxis, other) � Screening for caries or other oral disease � Treatment/restorative services � Public education on oral health issues � Other (Please specify): _________________________________
Primary age group(s) targeted by the program (check all that apply):
� Early childhood (ages 0 to 5) � School-age children and youth (ages 6 to 18) � Non-senior adults (ages 19 to 59) � Seniors (ages 60 and over)
Description of services provided and/or activities conducted: CCSN Dental Hygiene Program- Students provide clinical services including; radiographs, intra and extra oral assessment, periodontal status recognition and documentation, non-surgical periodontal therapy, preventive chemotherapeutics, tobacco cessation, nutritional counseling and oral health education. Also, students perform public health dental hygiene services with various community partners in off-campus settings such as: school-based dental sealants in Clark
21
County School District (Seal Nevada), oral health maintenance in long-term care facilities, and tailored oral health education programs to at-risk populations. Summary of service levels for the period July 1, 2004 – June 30, 2005:
Total number of people served 1,500 Units of service – please list ways that the program measures service activity (such as number of patient visits, classes conducted, people screened, sealants applied, etc.) and provide total service levels for the year for each unit of service.
1. Assessment and treatment planning 1,500 patients
2. Periodontal debridement/scaling 1,500 patients
3. Radiographic surveys 3,240 BWX and/or FMX
4. Pit and fissure sealants 748 sealants Program achievements during the period July 1, 2004 – June 30, 2005: Graduation of the 25th Associate degree dental hygiene class in May 2005 Establishment of the Baccalaureate of Science Dental Hygiene Program with 56 students currently enrolled. The program provides two specialty tracks: education and public health. Some students are anticipated to graduate in May 2006 as the program is time flexible in completing the degree requirements. Acquisition of the Seal Nevada South program with contact money from the state to operate the program 4 days a week.
Challenges currently faced in conducting program activities: The program is currently short two full-time faculty members due to promotions and/or relocations. One position is posted and a second will be posted soon.
Huntridge Teen Clinic Dental Program
Program name:
Huntridge Teen Clinic Dental Program
Lead organization:
Huntridge Teen Clinic
Other partner organizations involved in the program:
MAP Coalition via United Way of Southern Nevada, Clark County Health District
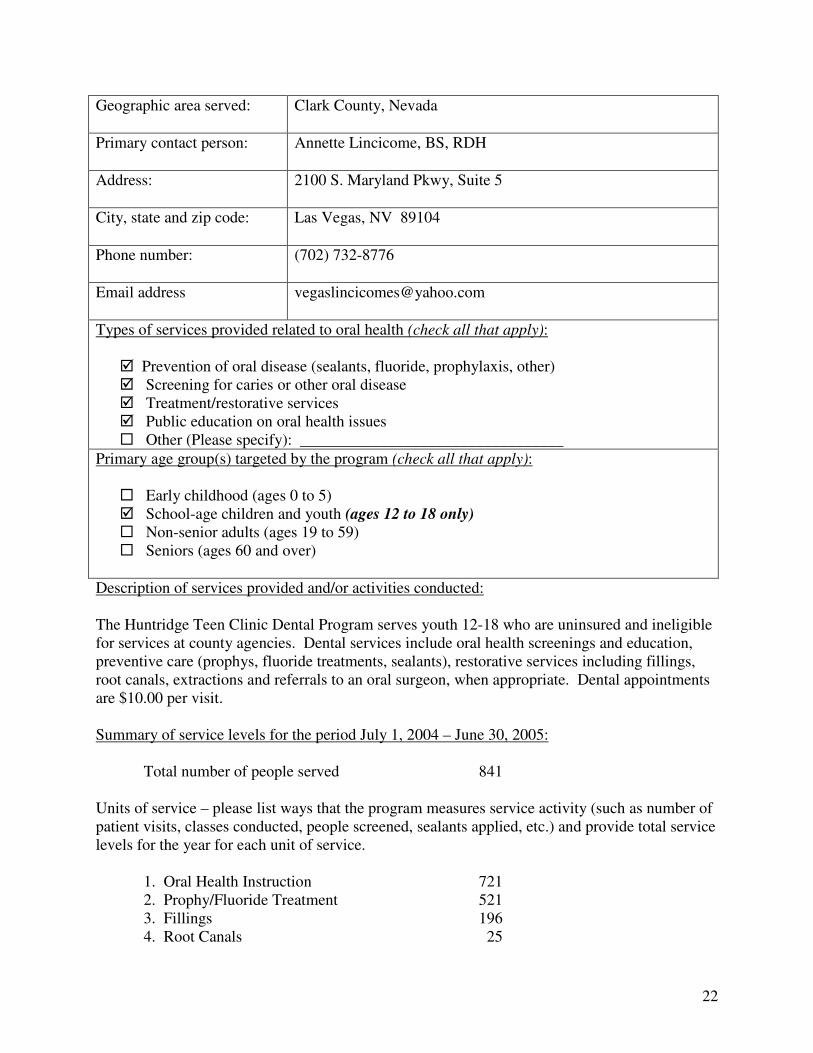
22
Geographic area served:
Clark County, Nevada
Primary contact person:
Annette Lincicome, BS, RDH
Address:
2100 S. Maryland Pkwy, Suite 5
City, state and zip code:
Las Vegas, NV 89104
Phone number:
(702) 732-8776
Email address
Types of services provided related to oral health (check all that apply):
� Prevention of oral disease (sealants, fluoride, prophylaxis, other) � Screening for caries or other oral disease � Treatment/restorative services � Public education on oral health issues � Other (Please specify): _________________________________
Primary age group(s) targeted by the program (check all that apply):
� Early childhood (ages 0 to 5) � School-age children and youth (ages 12 to 18 only) � Non-senior adults (ages 19 to 59) � Seniors (ages 60 and over)
Description of services provided and/or activities conducted: The Huntridge Teen Clinic Dental Program serves youth 12-18 who are uninsured and ineligible for services at county agencies. Dental services include oral health screenings and education, preventive care (prophys, fluoride treatments, sealants), restorative services including fillings, root canals, extractions and referrals to an oral surgeon, when appropriate. Dental appointments are $10.00 per visit. Summary of service levels for the period July 1, 2004 – June 30, 2005:
Total number of people served 841 Units of service – please list ways that the program measures service activity (such as number of patient visits, classes conducted, people screened, sealants applied, etc.) and provide total service levels for the year for each unit of service.
1. Oral Health Instruction 721 2. Prophy/Fluoride Treatment 521
3. Fillings 196 4. Root Canals 25
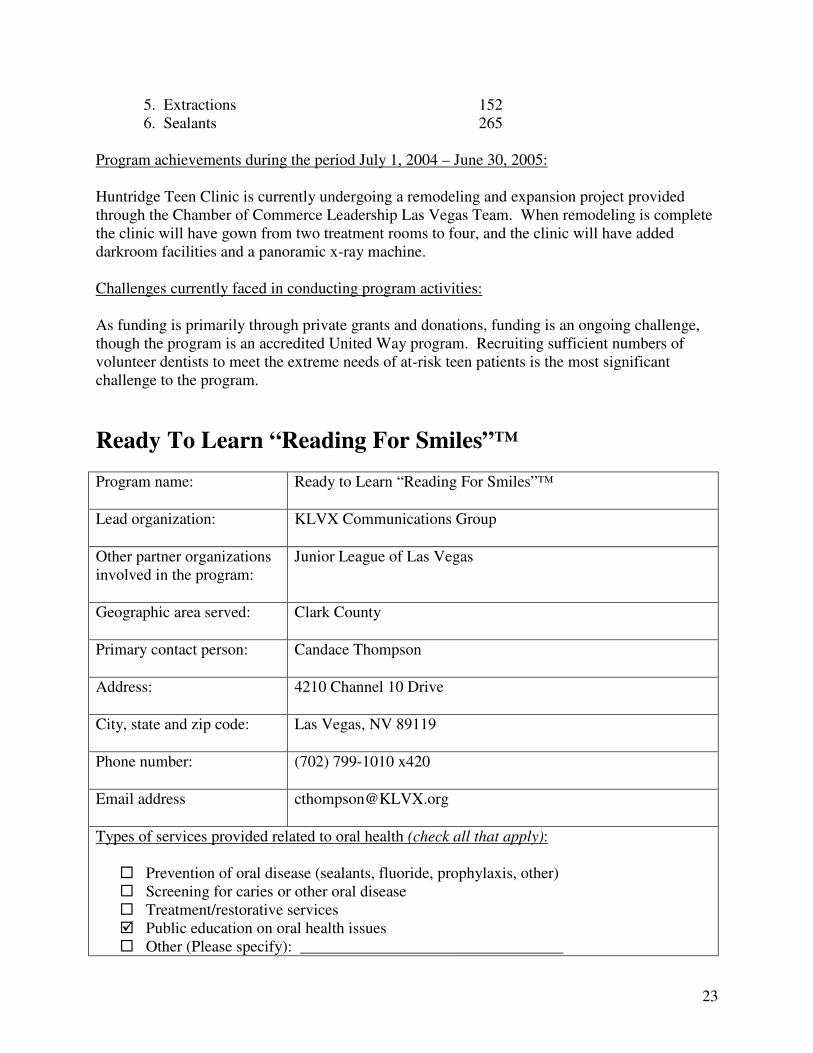
23
5. Extractions 152 6. Sealants 265
Program achievements during the period July 1, 2004 – June 30, 2005: Huntridge Teen Clinic is currently undergoing a remodeling and expansion project provided through the Chamber of Commerce Leadership Las Vegas Team. When remodeling is complete the clinic will have gown from two treatment rooms to four, and the clinic will have added darkroom facilities and a panoramic x-ray machine. Challenges currently faced in conducting program activities: As funding is primarily through private grants and donations, funding is an ongoing challenge, though the program is an accredited United Way program. Recruiting sufficient numbers of volunteer dentists to meet the extreme needs of at-risk teen patients is the most significant challenge to the program.
Ready To Learn “Reading For Smiles”™
Program name:
Ready to Learn “Reading For Smiles”™
Lead organization:
KLVX Communications Group
Other partner organizations involved in the program:
Junior League of Las Vegas
Geographic area served:
Clark County
Primary contact person:
Candace Thompson
Address:
4210 Channel 10 Drive
City, state and zip code:
Las Vegas, NV 89119
Phone number:
(702) 799-1010 x420
Email address
Types of services provided related to oral health (check all that apply):
� Prevention of oral disease (sealants, fluoride, prophylaxis, other) � Screening for caries or other oral disease � Treatment/restorative services � Public education on oral health issues � Other (Please specify): _________________________________
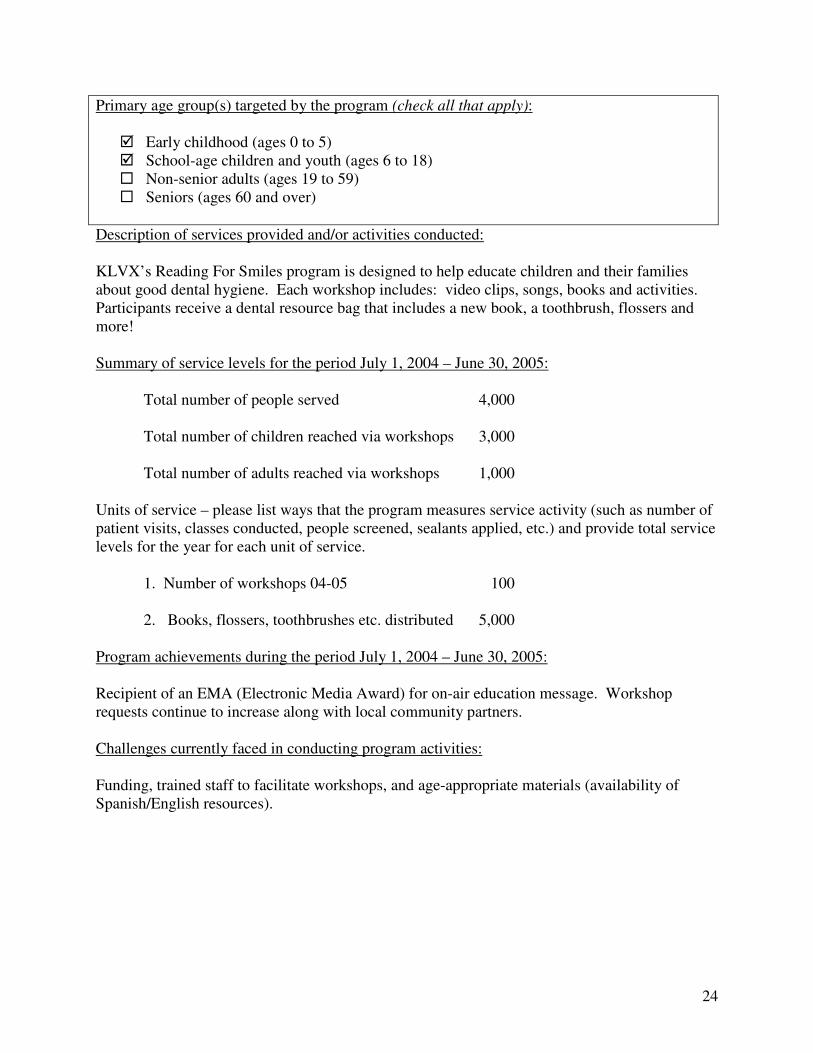
24
Primary age group(s) targeted by the program (check all that apply):
� Early childhood (ages 0 to 5) � School-age children and youth (ages 6 to 18) � Non-senior adults (ages 19 to 59) � Seniors (ages 60 and over)
Description of services provided and/or activities conducted: KLVX’s Reading For Smiles program is designed to help educate children and their families about good dental hygiene. Each workshop includes: video clips, songs, books and activities. Participants receive a dental resource bag that includes a new book, a toothbrush, flossers and more! Summary of service levels for the period July 1, 2004 – June 30, 2005:
Total number of people served 4,000 Total number of children reached via workshops 3,000 Total number of adults reached via workshops 1,000
Units of service – please list ways that the program measures service activity (such as number of patient visits, classes conducted, people screened, sealants applied, etc.) and provide total service levels for the year for each unit of service.
1. Number of workshops 04-05 100
2. Books, flossers, toothbrushes etc. distributed 5,000 Program achievements during the period July 1, 2004 – June 30, 2005: Recipient of an EMA (Electronic Media Award) for on-air education message. Workshop requests continue to increase along with local community partners. Challenges currently faced in conducting program activities: Funding, trained staff to facilitate workshops, and age-appropriate materials (availability of Spanish/English resources).
25
St. Rose Dominican Hospital Positive Impact Dental
Program
Program name:
St. Rose Dominican Hospital Positive Impact Dental Program
Lead organization:
St. Rose Dominican Hospitals
Other partner organizations involved in the program:
Nevada Rural Health Centers, Miles for Smiles, Clark County School District Partnership Office and various private dentists.
Geographic area served:
Southern Nevada, specifically Clark County
Primary contact person:
Melissa Jensen
Address:
Rose De Lima Campus 102 E. Lake Mead Parkway
City, state and zip code:
Henderson, NV. 89015
Phone number: (702) 616-4432
Email address
Types of services provided related to oral health (check all that apply):
� Prevention of oral disease (sealants, fluoride, prophylaxis, other) � Screening for caries or other oral disease � Treatment/restorative services � Public education on oral health issues � Other (Please specify): Prescriptions
Primary age group(s) targeted by the program (check all that apply):
� Early childhood (ages 0 to 5) � School-age children and youth (ages 6 to 18) � Non-senior adults (ages 19 to 59) � Seniors (ages 60 and over)
Description of services provided and/or activities conducted: Since 1988, St. Rose Dominican Hospitals Positive Impact Program has provided emergent and non-emergent dental treatment to the underserved population. Community need is identified by school nurses and social workers at various shelters. Eligible families receive complete dental treatments for the identified child and all school aged siblings. The Miles for Smiles dental bus provides an average of six dental clinics per month, throughout the school year. Four of the monthly clinics are exclusively treatment days while the remaining two are hygiene days.
26
Children in need of specialized dental services are referred to participating dentists within the program who donate their services. Upon completion of treatment, children have noted improvement in oral hygiene habits, which establishes a foundation for continued oral health. Summary of service levels for the period July 1, 2004 – June 30, 2005:
Total number of people served 346 (unduplicated includes siblings from the 116 below)
Units of service – please list ways that the program measures service activity (such as number of patient visits, classes conducted, people screened, sealants applied, etc.) and provide total service levels for the year for each unit of service.
1. Children Screened (Referrals from Schools for dental) 116
2. Treatment and Prescriptions 1,873
3. Education and Dental Kits 1,936
4. Children Screened for Nevada Check Up 145 Program achievements during the period July 1, 2004 – June 30, 2005: 1. Increased dental education and access to dental and hygiene products through oral hygiene
educational presentations within the community. 2. Assisted families in applying for Nevada Check Up. 3. Enabled 346 children to be treated for dental needs by directly providing them with care and
funding prescriptions when necessary. Challenges currently faced in conducting program activities: 1. The identified need for year round dental services and the funding to do so, large number of
students not able to get care as state has cut funding drastically from previous grant cycle and will no longer fund program after FY06. Large number of schools wanting to be added to program that we just cannot service because of cost of program and lack of state funding.
2. Additional dental referral sources.
27
University of Nevada Las Vegas (UNLV) School of Dental
Medicine
Program name:
University of Nevada Las Vegas School of Dental Medicine
Lead organization:
Other partner organizations involved in the program:
Clark County School District; Southern Nevada Dental Society (SNDS); Nevada Dental Hygienists’ Association (NDHA) Student National Dental Association (SNDA); American Student Dental Association (ASDA); Colgate; Crest
Geographic area served:
Clark County
Primary contact person:
Victor A. Sandoval, DDS, MPH
Address:
1001 Shadow Lane, MS 7410
City, state and zip code:
Las Vegas, NV 89106-4124
Phone number:
(702) 774-2641
Email address
Types of services provided related to oral health (check all that apply):
� Prevention of oral disease (sealants, fluoride, prophylaxis, other) � Screening for caries or other oral disease � Treatment/restorative services � Public education on oral health issues � Other (Please specify): _________________________________
Primary age group(s) targeted by the program (check all that apply):
� Early childhood (ages 0 to 5) � School-age children and youth (ages 6 to 18) � Non-senior adults (ages 19 to 59) � Seniors (ages 60 and over)
28
Description of services provided and/or activities conducted: The UNLV School of Dental Medicine remains the preferred provider for Medicaid recipients in Clark County. The program provides a full range of oral health services for qualified recipients, including emergency care on a walk-in basis. Oral health education and disease prevention are primary goals of the program.
Other Services and Activities: � Oral health, nutrition, and prevention instruction (Pre-school and “at-risk” elementary
schools, assisted living centers, Alzheimer patients’ care-givers, parent clubs, Special Olympics);
� Screening for caries and other oral diseases (refer to above examples); � Treatment/restorative services (“Give Kids a Smile” – Children’s Dental Health Month); � Public education (Health Expo 2005 - Las Vegas; Clark County Native American Health
Fair; Las Vegas Detention Center; Culinary Union Health Advocates) Summary of service levels for the period July 1, 2004 – June 30, 2005:
Total number of Patient Visits / People Served 73,189 Units of service – please list ways that the program measures service activity (such as number of patient visits, classes conducted, people screened, sealants applied, etc.) and provide total service levels for the year for each unit of service.
1. Diagnostic 139,539
2. Preventive 113,073
3. Restorative 90,955
4. Endodontics 10,436
5. Periodontics 19,905 6. Removable Prosth 10,522
7. Fixed Prosth. 3,861 8. Oral Surgery 59,553
9. Orthodontics 6,110
10. Adjunct Services 12,172 Total Number of Procedures 466,126
Program achievements during the period July 1, 2004 – June 30, 2005:
� Expanded outreach to more “at-risk” elementary schools and Assisted Living Centers � Hosted local “Give Kids A Smile” Activities (Children’s Dental Health Month) at
UNLV SDM Clinics � Participated in city-wide Health Expo 2004 � Partnered with Colgate “Bright Smiles/Bright Futures” Program � Participated in 1st Nevada Special Olympics / Special Smiles Event � Increased number of clinical services provided � Increased number of patients served
29
Challenges currently faced in conducting program activities:
� Demand for services continues to exceed our capacity � Identification of additional outreach sites � Identification of additional referral sources for those lacking dental insurance or coverage
by Medicaid or Nevada Check-Up � Curriculum density can hinder dental student involvement in some community activities; � Poor oral health of patient population � High no-show rate for scheduled appointments � Transportation problems of patient population affects their ability to keep appointments � Difficulty in contacting patients due to continual changes in addresses / phone numbers � Lack of patient awareness of issues related to maintenance of good oral health
University of Nevada School of Medicine (UNSOM) Dental
General Practice Residency
Program name:
UNSOM Dental General Practice Residency
Lead organization:
University of Nevada School of Medicine
Other partner organizations involved in the program:
University Medical Center – Southern Nevada
Geographic area served:
Las Vegas, Clark County
Primary contact person:
Shannon E. Mills, DDS
Address:
1707 W. Charleston Blvd. Ste 290
City, state and zip code:
Las Vegas, NV 89102
Phone number:
702-671-5046
Email address
Types of services provided related to oral health (check all that apply):
� Prevention of oral disease (sealants, fluoride, prophylaxis, other) � Screening for caries or other oral disease � Treatment/restorative services � Public education on oral health issues � Other (Please specify): _________________________________
30
Primary age group(s) targeted by the program (check all that apply):
� Early childhood (ages 0 to 5) � School-age children and youth (ages 6 to 18) � Non-senior adults (ages 19 to 59) � Seniors (ages 60 and over)
Description of services provided and/or activities conducted: The residency program provides comprehensive dental services to a broad population including medically compromised patients. Services include emergency care, preventive care, periodontics, endodontics, restorative and implant dentistry. Residents learn to provide dental care in a hospital setting. Summary of service levels for the period July 1, 2004 – June 30, 2005:
Total number of people served 1,283 Units of service – please list ways that the program measures service activity (such as number of patient visits, classes conducted, people screened, sealants applied, etc.) and provide total service levels for the year for each unit of service.
1. # of Patient Visits 5,769
Program achievements during the period July 1, 2004 – June 30, 2005: Eight (8) Dental General Practice Residents trained.
Challenges currently faced in conducting program activities: Difficulty hiring and retaining qualified dental assistants.
University of Nevada School of Medicine (UNSOM)
Residency Program in Pediatric Dentistry
Program name:
UNSOM Residency Program in Pediatric Dentistry
Lead organization:
University of Nevada School of Medicine
Other partner organizations involved in the program:
Geographic area served:
Clark County and neighboring areas
31
Primary contact person:
Paul E. Schneider, DDS, MSD
Address:
1707 W. Charleston Blvd., Suite 290
City, state and zip code:
Las Vegas, NV 89102
Phone number:
702-610-8508
Email address
Types of services provided related to oral health (check all that apply):
� Prevention of oral disease (sealants, fluoride, prophylaxis, other) � Screening for caries or other oral disease � Treatment/restorative services � Public education on oral health issues � Other (Please specify): _________________________________
Primary age group(s) targeted by the program (check all that apply):
� Early childhood (ages 0 to 5) � School-age children and youth (ages 6 to 18) � Non-senior adults (ages 19 to 59) � Seniors (ages 60 and over)
Description of services provided and/or activities conducted: Six UNSOM Pediatric Dentistry residents provide preventive, restorative and other dental services to infants and children, birth to age six years. This dental care is supported by the Nevada Medicaid program. Treatments are provided at the UNLV School of Dentistry ambulatory clinic. Children requiring general anesthesia are managed at Sunrise Hospital, Sahara Surgicenter and Flamingo Surgicenter. Summary of service levels for the period July 1, 2004 – June 30, 2005:
Total number of children served 3,500
Units of service – please list ways that the program measures service activity (such as number of patient visits, classes conducted, people screened, sealants applied, etc.) and provide total service levels for the year for each unit of service. Total specific procedures completed at the dental school ambulatory clinic:
1. Composite restorations 1,308 2. Stainless steel crowns 1,400
32
3. Amalgam restorations 620
Program achievements during the period July 1, 2004 – June 30, 2005:
1. Certification of residents. 2. Provision of dental care for more than 3,500 children.
Challenges currently faced in conducting program activities:
1. To obtain an outpatient clinic for residents to provide care for patients. 2. To gain administrative support of the postgraduate program. 3. To locate funds that would allow for the employment of more dental assistants to help in
the provision of patient care.
Washoe County
Health Access Washoe County (HAWC) Community Health
Center
Program name:
Health Access Washoe County Community Health Center
Lead organization:
Health Access Washoe County (HAWC)
Other partner organizations involved in the program:
Geographic area served:
Washoe County
Primary contact person:
Michael Rodolico, Ed.D. MPH
Address: 1055 S. Wells Ave., Ste 120
City, state and zip code:
Reno, NV 89502
Phone number:
(775) 329-6300 HAWC Main (775) 825-6702 HAWC South
Email address
33
Types of services provided related to oral health (check all that apply):
� Prevention of oral disease (sealants, fluoride, prophylaxis, other) � Screening for caries or other oral disease � Treatment/restorative services � Public education on oral health issues � Other (Please specify): _________________________________
Primary age group(s) targeted by the program (check all that apply):
� Early childhood (ages 0 to 5) � School-age children and youth (ages 6 to 18) � Non-senior adults (ages 19 to 59) � Seniors (ages 60 and over)
Description of services provided and/or activities conducted: The HAWC Dental Clinic was formed to provide dental care to the underserved, and currently provides preventive, restorative, and educational dental services. HAWC’s dental services include x-ray, cleanings, sealants, diagnosis, restorative dentistry, endodontic treatments, extractions, education and prevention services. HAWC is the major provider for dental care to underserved children in the community. The HAWC Dental Clinic serves a large portion of the Latino community, sixty percent (60%) of HAWC’s dental patients come from the Hispanic community. In April 2003, HAWC purchased a second dental clinic, HAWC Dental South. Summary of service levels for the period July 1, 2004 – June 30, 2005:
Total number of people served ______7,404____
Units of service – please list ways that the program measures service activity (such as number of patient visits, classes conducted, people screened, sealants applied, etc.) and provide total service levels for the year for each unit of service.
Users Visits 1. Oral Exams 593 707 2. Sealants 746 792 3. Restorative Services 1,989 3,243
4. Rehabilitative Services 929 1,735 (Endo, Perio, Pros) 5. Total visits for all services 17,276
34
Program achievements during the period July 1, 2004 – June 30, 2005:
Successfully completed a year of free Saturday clinics for children under age 18. Conducted and continued the education of high risk pregnant women and young mothers regarding “Baby Bottle Tooth Decay.” Challenges currently faced in conducting program activities: Significant challenges include initiating senior services, continuing the Saturday clinics, and delays in payments from Medicaid.
Northern Nevada Dental Health Program
Program name:
Northern Nevada Dental Health Program
Lead organization:
Saint Mary’s
Other partner organizations involved in the program:
Northern Nevada Dental Society
Geographic area served:
Northern Nevada
Primary contact person:
Mike Johnson
Address:
745 West Moana Lane
City, state and zip code:
Reno, NV 89509
Phone number:
(775) 770-3951
Email address
Types of services provided related to oral health (check all that apply):
� Prevention of oral disease (sealants, fluoride, prophylaxis, other) � Screening for caries or other oral disease � Treatment/restorative services � Public education on oral health issues � Other (Please specify): Referral service to contract providers
Primary age group(s) targeted by the program (check all that apply):
� Early childhood (ages 0 to 5) � School-age children and youth (ages 6 to 18) � Non-senior adults (ages 19 to 59) � Seniors (ages 60 and over)
35
Description of services provided and/or activities conducted: Dental referral service for uninsured and underserved children. Prescreening and referrals to one of 111 Northern Nevada Dental Society contracted providers. Summary of service levels for the period July 1, 2004 – June 30, 2005:
Total number of people served 427 Units of service – please list ways that the program measures service activity (such as number of patient visits, classes conducted, people screened, sealants applied, etc.) and provide total service levels for the year for each unit of service.
1. Diagnostic, Preventive and periodontal procedures 1,032
2. Restorative procedures 672 3. Endodontic, Oral Surgery procedures 442
4. Orthodontic cases 3
Program achievements during the period July 1, 2004 – June 30, 2005: 1. Recruitment program increased provider enrollment by five providers. NNDHP provider
enrollment is now 111 dentists. 2. Developed ortho program, structured client intake, triage and requirements to submit
Medicaid ortho cases and received pre-authorization. 3. Increased the number on children treated in outpatient surgery. When NNDHP reported that
there were a large number of children waiting for sedation care, the program pedodontists scheduled several days to treat only NNDHP children.
Challenges currently faced in conducting program activities: 1. More 1-5 year old children applying for program assistance than pedodontist providers have
contacted to treat. 2. Recruitment of older children (9 – 18 yrs) into program. Older children would allow us to
better utilize providers who only treat adolescents and adults.
36
Reno-Sparks Indian Colony Health and Human Services
Dental Clinic
Program name:
Reno-Sparks Indian Colony Health and Human Services Dental Clinic
Lead organization:
Reno-Sparks Indian Colony Health and Human Services
Other partner organizations involved in the program:
Schurz Service Unit
Geographic area served:
Reno/Sparks
Primary contact person:
Michael W. Johnson
Address:
34 Reservation Rd
City, state and zip code:
Reno, Nevada 89502
Phone number:
(775) 329-5162
Email address
Types of services provided related to oral health (check all that apply):
� Prevention of oral disease (sealants, fluoride, prophylaxis, other) � Screening for caries or other oral disease � Treatment/restorative services � Public education on oral health issues � Other (Please specify): _________________________________
Primary age group(s) targeted by the program (check all that apply):
� Early childhood (ages 0 to 5) � School-age children and youth (ages 6 to 18) � Non-senior adults (ages 19 to 59) � Seniors (ages 60 and over)
Description of services provided and/or activities conducted:
1. Emergency
• Extraction 2. Comprehensive Dental Care
• Operative Silver amalgams for posterior teeth Composite resins for anterior teeth
• Prosthodontics
37
Fixed & Removable
• Endodontics
• Periodontics
• Oral Surgery
• Pedodontics
• Preventive Services Oral Prophylaxis Oral Hygiene Training in preventive dental practices Topical fluoride application Occlusal Sealants
3. Radiology
• Periapical radiographs Occlusal Bitewing Panoramic
Summary of service levels for the period July 1, 2004 – June 30, 2005:
Total number of people served 11,000 Program achievements during the period July 1, 2004 – June 30, 2005: (No information submitted.)
Challenges currently faced in conducting program activities: Decreasing the number of patient no shows and cancellations.
Saint Mary’s Mobile Dental Outreach Preventive Program
Program name:
Saint Mary’s Mobile Dental Outreach Preventive Program
Lead organization:
Saint Mary’s Regional Medical Center
Other partner organizations involved in the program:
Washoe County School District, Lyon County School District, Churchill County School District, Carson City School District
Geographic area served:
A four county area including Washoe, Lyon and Churchill Counties and Carson City.
Primary contact person:
Ginny Cleveland, RDH
Address:
745 W. Moana Lane Suite 100
38
City, state and zip code:
Reno, NV, 89509
Phone number:
(775)770-3559
Email address
Types of services provided related to oral health (check all that apply):
� Prevention of oral disease (sealants, fluoride, prophylaxis, other) � Screening for caries or other oral disease � Treatment/restorative services � Public education on oral health issues � Other (Please specify): Referrals for children identified during screening as needing
treatment � Classroom oral health education
Primary age group(s) targeted by the program (check all that apply):
� Early childhood (ages 0 to 5) � School-age children and youth (ages 6 to 18) � Non-senior adults (ages 19 to 59) � Seniors (ages 60 and over)
Description of services provided and/or activities conducted: The Saint Mary’s Mobile Dental Outreach Preventive Program is a mobile program serving second graders attending “at risk” schools. The services are provided on-site during regular school hours in 48 schools in a four-county area including Washoe, Lyon and Churchill Counties and Carson City. Provided preventive services include classroom oral health instruction, visual dental screening, referral for treatment when necessary, sealant placement and individual oral health instruction. Each child with parental consent is seen on the program vehicle for services and receives a new toothbrush and dental floss. For many of the students, this is their first dental visit and sometimes their first toothbrush belonging only to them. Summary of service levels for the period July 1, 2004 – June 30, 2005: Total number of people served 3,755 (Unduplicated) Units of service – please list ways that the program measures service activity (such as number of patient visits, classes conducted, people screened, sealants applied, etc.) and provide total service levels for the year for each unit of service. 1. Number of children receiving classroom oral health instructions 3,755 2. Number of children screened 2,325
39
3. Number of children receiving sealants 1,977 4. Number of teeth sealed 6,678 5. Number of children seen on the vehicle who 287
did not receive sealants but did receive one on one oral health instructions
6. Number of children referred for dental treatment 1,221 Program achievements during the period July 1, 2004 – June 30, 2005:
• The Preventive Program was awarded a grant by the Centers for Disease Control and Prevention (CDC) to do a longer-term sealant retention study and a cost benefit analysis.
• The Saint Mary’s Mobile Dental Outreach Programs was written up as a “Best Practice” by the CDC.
• Referral of 246 children directly into treatment services through the Saint Mary’s Restorative Program and the Northern Nevada Dental Health Program.
Challenges currently faced in conducting program activities:
• Limited schedule during the summer months due to lack of availability of students.
• Limited funding from existing revenue sources.
• Limited ability to case manage referrals made to parents rather than to a provider. This includes children whose consent form states that the family has a dentist. It is our desire to not sever any existing family/dentist relationships, so when we see a child who needs treatment, but has a dentist, we have limited capabilities to follow-up and see that the child did in fact get a dental appointment.
Saint Mary’s Oral Surgery Program
Program name:
Saint Mary’s Oral Surgery Program
Lead organization:
Saint Mary’s
Other partner organizations involved in the program:
Northern Nevada Dental Health Program, Saint Mary’s Restorative Dental Program
Geographic area served:
Northern Nevada
Primary contact person:
Mike Johnson
Address:
745 West Moana Lane
40
City, state and zip code:
Reno, NV 89509
Phone number:
(775) 770-3951
Email address
Types of services provided related to oral health (check all that apply):
� Prevention of oral disease (sealants, fluoride, prophylaxis, other) � Screening for caries or other oral disease � Treatment/restorative services � Public education on oral health issues � Other (Please specify): Outpatient Surgery
Primary age group(s) targeted by the program (check all that apply):
� Early childhood (ages 0 to 5) � School-age children and youth (ages 6 to 18) � Non-senior adults (ages 19 to 59) � Seniors (ages 60 and over)
Description of services provided and/or activities conducted: Children’s restorative dental services performed at Saint Mary’s Outpatient Surgery Center. When a child cannot receive dental care due to behavioral management issues or full mouth decay, he/she can be referred to the Outpatient Oral Surgery Program. Summary of service levels for the period July 1, 2004 – June 30, 2005:
Total number of people served (program startup 2-05) 57 Units of service – please list ways that the program measures service activity (such as number of patient visits, classes conducted, people screened, sealants applied, etc.) and provide total service levels for the year for each unit of service.
1. Diagnostic, preventive and periodontic procedures 434
2. Restorative procedures 374 3. Endodontic and oral surgery procedures 688
Program achievements during the period July 1, 2004 – June 30, 2005: Program start date, February 2005 1. Through June 2005, our program maintained 100% show rate. 2. Program revenue met expenses.
41
Challenges currently faced in conducting program activities: 1. Parents of program children who lack and understanding of or are indifferent to the child’s
oral health needs. 2. Achieving a zero no-show rate. 3. The program staff dedicates a great deal of time working with patients to ensure timely
completion of paperwork and appointments.
Saint Mary’s Restorative Dental Outreach Program
Program name:
Saint Mary’s Restorative Dental Outreach Program
Lead organization:
Saint Mary’s
Other partner organizations involved in the program:
Northern Nevada Dental Health Program, Head Start, Nevada Urban Indians and Washoe County School District
Geographic area served:
Washoe County and Lyon County
Primary contact person:
Mike Johnson
Address:
745 W. Moana Lane, Suite 100
City, state and zip code:
Reno, NV 89509
Phone number:
(775) 770-3951
Email address
Types of services provided related to oral health (check all that apply):
� Prevention of oral disease (sealants, fluoride, prophylaxis, other) � Screening for caries or other oral disease � Treatment/restorative services � Public education on oral health issues � Other (Please specify): _____Referrals to specialist___________
Primary age group(s) targeted by the program (check all that apply):
� Early childhood (ages 0 to 5) � School-age children and youth (ages 6 to 18) � Non-senior adults (ages 19 to 59) � Seniors (ages 60 and over)
42
Description of services provided and/or activities conducted: Restorative dentistry, serving the uninsured and underserved in our community. Performing general dental services in a mobile dental clinic at nine sites within Washoe and Lyon Counties Summary of service levels for the period July 1, 2004 – June 30, 2005:
Total number of patient visits 3,253 Units of service – please list ways that the program measures service activity (such as number of patient visits, classes conducted, people screened, sealants applied, etc.) and provide total service levels for the year for each unit of service.
1. Diagnostic, Preventive and periodontal procedures 7,178 2. Restorative procedures 1,914
3. Endodontic procedures 373
4. Oral Surgeries 457
Program achievements during the period July 1, 2004 – June 30, 2005: 1. Implementation of a children’s outpatient oral surgery program 2. Addition of case manager position, to ensure follow-up on patient care and patient integration
in all Saint Mary’s Outreach Programs. 3. Adding additional days of service and one additional site. Challenges currently faced in conducting program activities: 1. Higher than program standard for patient no show rate. 2. Long term program vehicle maintenance cost
Truckee Meadows Community College Dental Hygiene
Program
Program name:
Truckee Meadows Community College Dental Hygiene Program
Lead organization:
Truckee Meadows Community College
Other partner organizations involved in the program:
Geographic area served:
Northern Nevada and others
43
Primary contact person:
Janet Storie, Dental Clinic Manager
Address:
7000 Dandini Blvd RDMT 415A
City, state and zip code:
Reno, NV 89512-3999
Phone number:
775-673-8293
Email address
Types of services provided related to oral health (check all that apply):
� Prevention of oral disease (sealants, fluoride, prophylaxis, other) � Screening for caries or other oral disease � Treatment/restorative services � Public education on oral health issues � Other (Please specify): Non surgical periodontal therapies ie: root scaling and root planing procedures
Primary age group(s) targeted by the program (check all that apply):
� Early childhood (ages 0 to 5) � School-age children and youth (ages 6 to 18) � Non-senior adults (ages 19 to 59)
� Seniors (ages 60 and over)
Description of services provided and/or activities conducted:
X-rays and examinations, teeth cleaning, periodontal scaling and root planing, fluoride treatments and pit and fissure sealants as well as nutritional counseling, oral cancer screenings and oral health education. The program charges $10.00 for a set of BWX, $15.00 for an FMX, $15.00 for a Panorex ($25.00 for a Pano and BWX) and $20.00 for a cleaning. They use double films so clients can take a set to HAWC or any other referring dentist at no additional cost. They have appointments available to screen over 150 new clients each semester and they are able to accommodate most returning clients as well.
Summary of service levels for the period July 1, 2004 – June 30, 2005:
Total number of people served approx 500/550
Units of service – please list ways that the program measures service activity (such as number of patient visits, classes conducted, people screened, sealants applied, etc.) and provide total service levels for the year for each unit of service.
1. # of patient cleanings completed approx 375 2. # of x-ray only patients approx 150
44
Program achievements during the period July 1, 2004 – June 30, 2005: 100 % pass rate on the National Dental Hygiene Board. Graduation of 11 students. TMCC Dental Hygiene students participated in many community dental health activities with varied populations. TMCC students conducted pre-deployment dental screenings for the Nevada Army National Guard.
Challenges currently faced in conducting program activities: It continues to be a challenge to find supervising dentists available for clinic sessions at the TMCC Dental Clinic.
45
Balance of the State
The programs in this section operate in the predominantly rural and frontier areas of the state.
Fallon Tribal Health Center Dental Clinic
Program name:
Fallon Tribal Health Center Dental Clinic
Lead organization:
Indian Health Service
Other partner organizations involved in the program:
Schurz Service Unit
Geographic area served:
Fallon, Lovelock, Silver Springs, Fernley, McDermitt, Winnemucca, Yomba
Primary contact person:
Dr. Marlon A. Brown
Address:
1001 Rio Vista
City, state and zip code:
Fallon, NV 89406
Phone number:
775-423-3634
Email address
Types of services provided related to oral health (check all that apply):
� Prevention of oral disease (sealants, fluoride, prophylaxis, other) � Screening for caries or other oral disease � Treatment/restorative services � Public education on oral health issues � Other (Please specify): _________________________________
Primary age group(s) targeted by the program (check all that apply):
� Early childhood (ages 0 to 5) � School-age children and youth (ages 6 to 18) � Non-senior adults (ages 19 to 59) � Seniors (ages 60 and over)
46
Description of services provided and/or activities conducted: Restorative procedures, extractions, endodontics, cleanings, preventive dentistry, and patient education. Summary of service levels for the period July 1, 2004 – June 30, 2005:
Total number of people served 820 Units of service – please list ways that the program measures service activity (such as number of patient visits, classes conducted, people screened, sealants applied, etc.) and provide total service levels for the year for each unit of service.
1. Patient Visits 1,743 2. Sealants 1,421 3. Topical Fluoride 499
Program achievements during the period July 1, 2004 – June 30, 2005: Update of the Infection Control Standards. Implementation of an infection control officer for the Schurz service unit dental program. Initiation of Xylitol program for post-natal mothers to help reduce the occurrence of early childhood caries. Challenges currently faced in conducting program activities: Increasing access to care for diabetics. Decreasing the high caries prevalence in the Native American population. Creating outreach programs to reach the very rural areas that we serve.
Family Resource Centers of Northeastern Nevada
Program name:
Fluoride Varnish Program
Lead organization:
Family Resource Centers of Northeastern Nevada
Other partner organizations involved in the program:
Geographic area served:
Elko County
Primary contact person:
Address:
1401 Ruby Vista Dr. / P.O. Box 2655
City, state and zip code:
Elko, NV 89803
47
Phone number:
(775) 753-7352
Email address
Types of services provided related to oral health (check all that apply):
� Prevention of oral disease (sealants, fluoride, prophylaxis, other) � Screening for caries or other oral disease � Treatment/restorative services � Public education on oral health issues � Other (Please specify): _________________________________
Primary age group(s) targeted by the program (check all that apply):
� Early childhood (ages 0 to 5) � School-age children and youth (ages 6 to 18) � Non-senior adults (ages 19 to 59) � Seniors (ages 60 and over)
Description of services provided and/or activities conducted: Establish sites to perform fluoride varnish, basic dental screenings and application of fluoride varnish. Referrals to private practice dentists or Miles for Smiles program as needed. Summary of service levels for the period July 1, 2004 – June 30, 2005:
Total number of people served 257 Units of service – please list ways that the program measures service activity (such as number of patient visits, classes conducted, people screened, sealants applied, etc.) and provide total service levels for the year for each unit of service.
1. Initial fluoride varnish 257
2. Additional fluoride varnish (duplicate) 144
Program achievements during the period July 1, 2004 – June 30, 2005: See above. Challenges currently faced in conducting program activities: Funding stable through 05-06, uncertain funding thereafter. Primary source of referrals was Elko COW Bus Program which has since closed.
48
Healthy Smiles Family Dentistry
Program name:
Healthy Smiles Family Dentistry
Lead organization:
Great Basin Primary Care Association
Other partner organizations involved in the program:
Geographic area served:
Lyon County
Primary contact person:
Marlena Booth – Dental Director
Address:
120 Bovard Street
City, state and zip code:
Yerington, NV 89447
Phone number:
775-463-1800
Email address
Types of services provided related to oral health (check all that apply):
� Prevention of oral disease (sealants, fluoride, prophylaxis, other) � Screening for caries or other oral disease � Treatment/restorative services � Public education on oral health issues � Other (Please specify): _________________________________
Primary age group(s) targeted by the program (check all that apply):
� Early childhood (ages 0 to 5) � School-age children and youth (ages 6 to 18) � Non-senior adults (ages 19 to 59) � Seniors (ages 60 and over)
Description of services provided and/or activities conducted: Our clinic in Yerington is accepting Medicaid and Nevada Check Up and we have a sliding fee schedule to accommodate lower income families to make it affordable to get dental work completed. We are also doing oral health screenings in schools in Lyon County and some surrounding communities. We do these screenings in our local hospital, long term care and assisted living facility in Yerington.
49
Summary of service levels for the period July 1, 2004 – June 30, 2005:
Total number of patients 1,790 Total number of people served (education programs) 344 Units of service – please list ways that the program measures service activity (such as number of patient visits, classes conducted, people screened, sealants applied, etc.) and provide total service levels for the year for each unit of service.
1. Sealants (# of patients) 292 2. Cleaning and fluoride 451 3. Restorative 866 At education programs: 1. People screened 200 2. 7 education classes conducted, serving 344
Program achievements during the period July 1, 2004 – June 30, 2005:
Setting up time to go to schools and other facilities to do screenings, actually setting up appointments. Training of all personnel involved with senior citizens at facilities on how important oral health is in the health care. Education to parents on oral health in young children with primary and permanent teeth. Most important is all the help we have given our patients in making it easy for them to get dental care.
Challenges currently faced in conducting program activities: The biggest challenge is getting signed permission slips back from parents of students and from caretakers for the elderly to do these free services.
Schurz Service Unit Dental Program
Program name:
Schurz Service Unit Dental Program
Lead organization:
Indian Health Service, U.S. Public Health Service
Other partner organizations involved in the program:
Saint Mary’s Dental Take-Care-A-Van University of MS School of Dentistry UNLV School of Dental Medicine
Geographic area served:
North Central and Northwestern Nevada, from McDermitt (on the Oregon border) to Schurz (40 miles south of Fallon)
Primary contact person:
Tim Ricks, DMD, MPH; Commander, USPHS; Chief, Schurz Service Unit Dental Program
50
Address:
P.O. Box 227
City, state and zip code:
Nixon, NV 89424
Phone number:
(775) 574-1018 ext. 224
Email address
Types of services provided related to oral health (check all that apply):
� Prevention of oral disease (sealants, fluoride, prophylaxis, other) � Screening for caries or other oral disease � Treatment/restorative services � Public education on oral health issues � Other (Please specify): Diabetes perio treatment, clinical research, health literacy and advocacy
Primary age group(s) targeted by the program (check all that apply):
� Early childhood (ages 0 to 5) � School-age children and youth (ages 6 to 18) � Non-senior adults (ages 19 to 59) � Seniors (ages 60 and over)
Description of services provided and/or activities conducted:
1. Public health dentistry – community-based approaches such as school intervention programs, health fairs, water fluoridation, etc.
2. Clinical services – diagnostic, preventive, endodontic, restorative, surgical, periodontal, and prosthodontic.
Summary of service levels for the period July 1, 2004 – June 30, 2005:
Total number of people served 18,000 Units of service – please list ways that the program measures service activity (such as number of patient visits, classes conducted, people screened, sealants applied, etc.) and provide total service levels for the year for each unit of service.
1. Access to care (total 1st visits, 4 clinics), 7/04-6/05 2,660 2. Sealant applications, 7/04-6/05 3,379
3. Fluoride (topical) applications, 7/04-6/05 1,442
4. Systems fluoridated, 7/04-6/05 6 (Pyramid Lake Reservation – 3; Ft. McDermitt – 3)
51
Program achievements during the period July 1, 2004 – June 30, 2005:
1. Optimal fluoridation achieved 100% of the time (0.9-1.2 ppm) at the Ft. McDermitt Paiute-Shoshone Reservation.
2. Pyramid Lake Dental Clinic in Nixon, NV named the Indian Health Service Health Promotion/Disease Prevention Program of the Year in 2004. Dr. Tim Ricks named IHS Dentist of the Year (Clinical Excellence Award) in 2004 (for 2003). Barbara Rosse, DA, named IHS Dental Assistant of the Year in June 2005.
3. Developed working relationships with private and public partners, including Saint Mary’s, UNLV and the Univ. of MS dental schools, etc.
Challenges currently faced in conducting program activities: Access to care continues to be the number one problem at all of our rural facilities, where clinics are staffed for the most part by one dentist and one dental assistant, and the dental assistant is responsible for patient scheduling, chairside assisting, etc.
Seal Nevada – North (Statewide Sealant Program)
Program name:
Seal Nevada – North (Statewide Sealant Program)
Lead organization:
Saint Mary’s Regional Medical Center
Other partner organizations involved in the program:
Nevada Dental Hygienists’ Association, State of Nevada, Seal America, local school districts in areas served
Geographic area served:
Northern Nevada (Eureka, Crescent Valley, Carlin, Owyhee, Jackpot and Gerlach)
Primary contact person:
Ginny Cleveland, RDH
Address:
745 W. Moana Lane Suite 100
City, state and zip code:
Reno, NV, 89509
Phone number:
(775)770-3559
Email address
Types of services provided related to oral health (check all that apply):
� Prevention of oral disease (sealants, fluoride, prophylaxis, other) � Screening for caries or other oral disease � Treatment/restorative services � Public education on oral health issues
52
� Other (Please specify): Referrals for children identified during screening as needing treatment
� Classroom oral health education
Primary age group(s) targeted by the program (check all that apply):
� Early childhood (ages 0 to 5) � School-age children and youth (ages 6 to 18) � Non-senior adults (ages 19 to 59) � Seniors (ages 60 and over)
Description of services provided and/or activities conducted: The Seal Nevada (Statewide Sealant) Program is a two-part mobile program serving second graders attending “at risk” schools. The state is divided into North and South segments and each is served by a different group of providers. The Seal Nevada North program serves the rural areas of Northern Nevada and excludes areas being served by the Saint Mary’s Mobile Dental Outreach Preventive Program. Services are provided on-site during regular school hours in the school using portable equipment. Provided preventive services include visual dental screening, referral for treatment when necessary, sealant placement and individual oral health instruction. Each child with parental consent is seen in the program for services and receives a new toothbrush and dental floss. For many of the students, this is their first dental visit and sometimes their first toothbrush belonging only to them. Summary of service levels for the period July 1, 2004 – June 30, 2005: Total number of people served 87 (Unduplicated) Units of service – please list ways that the program measures service activity (such as number of patient visits, classes conducted, people screened, sealants applied, etc.) and provide total service levels for the year for each unit of service. 1. Number of children screened 87 2. Number of children receiving sealants 53 3. Number of teeth sealed 128 4. Number of children seen in the program who 33
did not receive sealants but did receive one on one oral health instructions
5. Number of children referred for dental treatment 39 Program achievements during the period July 1, 2004 – June 30, 2005:
• Relationships built with school districts previously not served by this type of program.
53
• Relationship and communication with Miles for Smiles increased. This will allow the sealant program to be more successful in the 05-06 school year.
Challenges currently faced in conducting program activities:
• Limited schedule during the summer months due to lack of availability of students.
• It is sometimes difficult to find treatment/referral options for children in the remote areas where there is no dentist available.
• Limited ability to case manage referrals.
• Duplication of services with the Miles for Smiles Program. In the future, scheduling options will be coordinated between the programs to avoid inefficient use of resources.
• Travel distance makes it difficult for program staff to visit the school prior to screening/sealant days to provide classroom education. Working on regional contracts with dental hygienists may make it more likely that all second graders in the school will be reached with the educational portion of the program.
Southern Band Dental Clinic
Program name:
Southern Band Dental Clinic
Lead organization:
Indian Health Service, Elko Service Unit
Other partner organizations involved in the program:
None
Geographic area served:
Northern Eastern Nevada
Primary contact person:
Dr. Larry Brizzee, DDS Jackie Juarez – Appointments
Address:
515 Shoshone Circle
City, state and zip code:
Elko, NV 89801
Phone number:
775-738-2252
Email address
Types of services provided related to oral health (check all that apply):
� Prevention of oral disease (sealants, fluoride, prophylaxis, other) � Screening for caries or other oral disease � Treatment/restorative services � Public education on oral health issues � Other (Please specify): Periodontics, Oral Surgery, Pedodontic, Endodontic, Restorative, Prostodontic
54
Primary age group(s) targeted by the program (check all that apply):
� Early childhood (ages 0 to 5) � School-age children and youth (ages 6 to 18) � Non-senior adults (ages 19 to 59) � Seniors (ages 60 and over)
Description of services provided and/or activities conducted: Prevention of oral disease, periodontic, oral surgery, pedodontic, endodontic, restorative, prostodontic, sealant trip to outside communities. Summary of service levels for the period July 1, 2004 – June 30, 2005:
Total number of people served 700 Units of service – please list ways that the program measures service activity (such as number of patient visits, classes conducted, people screened, sealants applied, etc.) and provide total service levels for the year for each unit of service.
1. All work is computerized, approx 80,000 service minutes.
Program achievements during the period July 1, 2004 – June 30, 2005: Passed Accreditation Association for Ambulatory Health Care (AAAHC) survey with flying colors. Challenges currently faced in conducting program activities: Too many patients, need bigger clinic, not enough funds.
Washoe Tribal Dental Clinic Program name:
Washoe Tribal Dental Clinic
Lead organization:
Washoe Tribal Health Clinic / Washoe Tribe of Nevada
Other partner organizations involved in the program:
National Health Service Corps Indian Health Service Medicaid Head Start
Geographic area served:
Douglas County
Primary contact person:
Dr. Douglas R. Moss, DDS
Address:
1559 Watasheamu
55
City, state and zip code:
Gardnerville, NV 89460
Phone number:
775-265-4215
Email address
Types of services provided related to oral health (check all that apply): � Prevention of oral disease (sealants, fluoride, prophylaxis, other) � Screening for caries or other oral disease � Treatment/restorative services � Public education on oral health issues � Other (Please specify): _________________________________
Primary age group(s) targeted by the program (check all that apply): � Early childhood (ages 0 to 5) � School-age children and youth (ages 6 to 18) � Non-senior adults (ages 19 to 59) � Seniors (ages 60 and over)
Description of services provided and/or activities conducted: Emergency evaluation and exams for Native Americans, Medicaid patients, underserved populations and general family dental services. Sliding fee scale includes: oral surgery and all restorative, fillings, crowns, bridges, partial dentures, root canals, 3rd molar extractions and endodontics. Summary of service levels for the period July 1, 2004 – June 30, 2005: Total number of people served 3,491 Program achievements during the period July 1, 2004 – June 30, 2005: Hired two part-time hygienists, retained two full-time dentists and two full-time assistants. Challenges currently faced in conducting program activities: Underpaid auxiliaries and providers, understaffed.
Yerington Paiute Tribe Dental Clinic
Program name:
Yerington Paiute Tribe Dental Clinic
Lead organization:
Yerington Paiute Tribe
56
Geographic area served:
Yerington, Nevada
Primary contact person:
Darla Emm or Dr. Philip Travis
Address:
171 Campbell Ln.
City, state and zip code:
Yerington, NV 89427
Phone number:
775-463-3335
Email address
Types of services provided related to oral health (check all that apply):
� Prevention of oral disease (sealants, fluoride, prophylaxis, other) � Screening for caries or other oral disease � Treatment/restorative services � Public education on oral health issues � Other (Please specify): _________________________________
Primary age group(s) targeted by the program (check all that apply):
� Early childhood (ages 0 to 5) � School-age children and youth (ages 6 to 18) � Non-senior adults (ages 19 to 59) � Seniors (ages 60 and over)
Description of services provided and/or activities conducted:
N/A Summary of service levels for the period July 1, 2004 – June 30, 2005:
Total number of people served N/A Units of service – please list ways that the program measures service activity (such as number of patient visits, classes conducted, people screened, sealants applied, etc.) and provide total service levels for the year for each unit of service.
1. Preventive (17%) 195 2. Diagnostic (33%) 387 3. Restorative (23%) 275 4. Adjunctive Services (27%) 319
57
Program achievements during the period July 1, 2004 – June 30, 2005:
1) Elder care screening services 2) Head Start examinations and treatment
Challenges currently faced in conducting program activities:
1) High “no show” rate for established appointments. 2) Difficult in establishing service levels to various patients based upon their contract health
service delivery area (CHSDA).
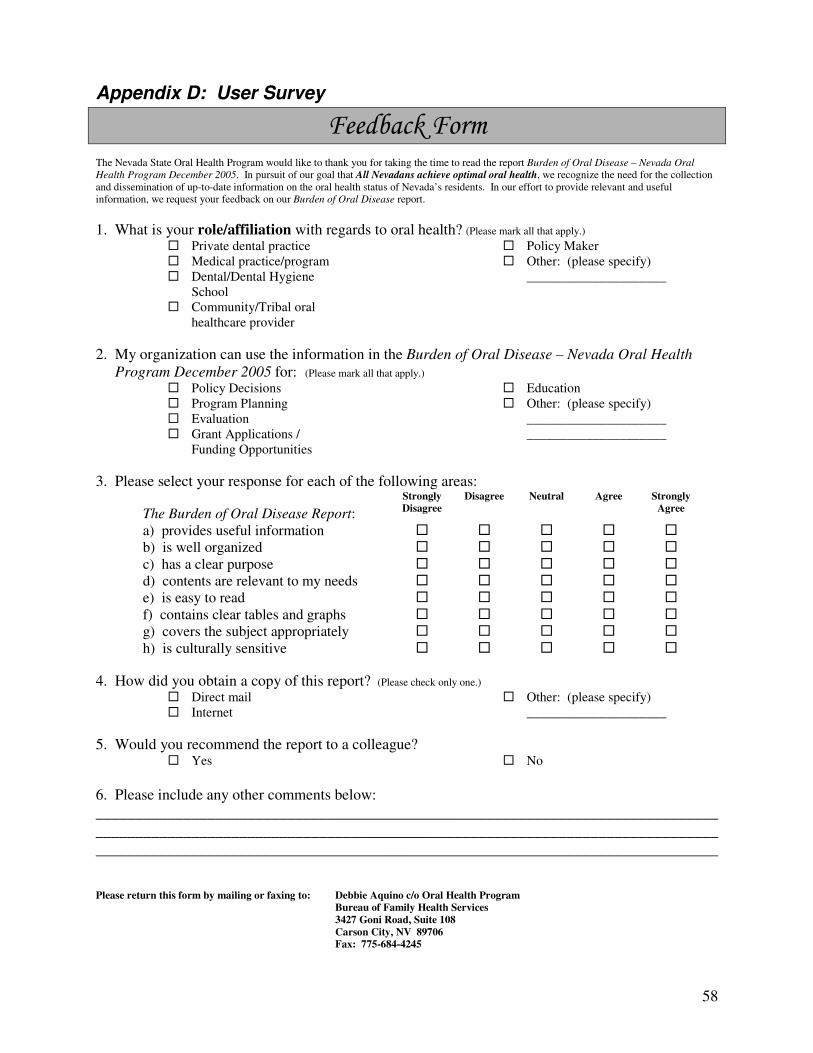
58
Appendix D: User Survey
Feedback Form The Nevada State Oral Health Program would like to thank you for taking the time to read the report Burden of Oral Disease – Nevada Oral
Health Program December 2005. In pursuit of our goal that All Nevadans achieve optimal oral health, we recognize the need for the collection and dissemination of up-to-date information on the oral health status of Nevada’s residents. In our effort to provide relevant and useful information, we request your feedback on our Burden of Oral Disease report.
1. What is your role/affiliation with regards to oral health? (Please mark all that apply.) � Private dental practice � Medical practice/program � Dental/Dental Hygiene
School � Community/Tribal oral
healthcare provider
� Policy Maker � Other: (please specify)
_____________________
2. My organization can use the information in the Burden of Oral Disease – Nevada Oral Health
Program December 2005 for: (Please mark all that apply.) � Policy Decisions � Program Planning � Evaluation � Grant Applications /
Funding Opportunities
� Education � Other: (please specify)
__________________________________________
3. Please select your response for each of the following areas:
The Burden of Oral Disease Report:
Strongly
Disagree
Disagree Neutral Agree Strongly
Agree
a) provides useful information � � � � � b) is well organized � � � � � c) has a clear purpose � � � � � d) contents are relevant to my needs � � � � � e) is easy to read � � � � � f) contains clear tables and graphs � � � � � g) covers the subject appropriately � � � � � h) is culturally sensitive � � � � �
4. How did you obtain a copy of this report? (Please check only one.) � Direct mail � Internet
� Other: (please specify) _____________________
5. Would you recommend the report to a colleague? � Yes � No
6. Please include any other comments below: ____________________________________________________________________________________________________________________________________________________________ ______________________________________________________________________________
Please return this form by mailing or faxing to: Debbie Aquino c/o Oral Health Program
Bureau of Family Health Services
3427 Goni Road, Suite 108
Carson City, NV 89706
Fax: 775-684-4245