
APPLICATION - COnnecting REpositories · PDF fileAPPLICATION OF MEMBRANE TECHNOLOGY ... on a...
177
Transcript of APPLICATION - COnnecting REpositories · PDF fileAPPLICATION OF MEMBRANE TECHNOLOGY ... on a...


APPLICATION OF MEMBRANE TECHNOLOGY
IN MICROFLUIDIC DEVICES
deJongJ
Text Box
Jorrit de Jong Membrane Technology Group Faculty of Science and Technology University of Twente P.O. Box 217 7500AE Enschede, The Netherlands http://www.membrane.nl

The research presented in this thesis has been carried out at the Membrane Technology Group, which participates in the MESA+ Institute for Nanotechnology at the University of Twente, Enschede, The Netherlands. The project was part of the Dutch research initiative “Process on a Chip” (PoaC), part of the framework Advanced Chemical Technologies for Sustainability (ACTS), funded by the Dutch organization for scientific research (NWO).
Committee members
Prof. dr. L. Lefferts (Chairman) University of Twente Prof. dr.‐ing. M. Wessling (Promotor) University of Twente Dr. ir. R.G.H. Lammertink (Assistant‐promotor) University of Twente Prof. dr. J.G.E. Gardeniers University of Twente Prof. dr. ir. J. Huskens University of Twente Prof. dr. M. Köhler Technische Universität Ilmenau Prof. dr. E.M.J. Verpoorte University of Groningen Dr. ir. G.J. Kwant DSM
The cover shows a photograph of a porous microfluidic chip with integrated membrane functionality, prepared by phase separation micromolding. The channels have been filled with a blue dye. The grey images are made by scanning electron microscopy and show close‐ups of cross sections of the chip, revealing the porous structure.
Title: Application of Membrane Technology in Microfluidic Devices PhD thesis, University of Twente
ISBN: 978‐90‐365‐2661‐6
Printing: Print Partners Ipskamp BV, Enschede, The Netherlands
© 2008 Jorrit de Jong, Enschede, The Netherlands

APPLICATION OF MEMBRANE TECHNOLOGY
IN MICROFLUIDIC DEVICES
PROEFSCHRIFT
ter verkrijging van de graad van doctor aan de Universiteit Twente
op gezag van de rector magnificus prof. dr. W.H.M. Zijm
volgens besluit van het College voor Promoties in het openbaar te verdedigen op vrijdag 18 april 2008 om 15:00
door
Jorrit de Jong
Geboren op 17 juni 1978 te Leeuwarden

Dit proefschrift is goedgekeurd door:
Promotor: Prof. dr.‐ing. M. Wessling
Assistent promotor: Dr. ir. R.G.H. Lammertink

i
“I really believe there's, like, an ocean of ideas. And all of the ideas are sitting there. They bob up
from time to time and come into your conscious mind and you know them. When a good idea bobs
up, it really smacks you. It's like a piece of electricity and you see the whole thing and you feel it and
you know what to do. It all comes with the idea.”
David Lynch

ii
SUMMARY
This thesis describes the application of membrane technology in microfluidic systems. The word
‘microfluidic’ refers to the research field that develops methods and devices to control, manipulate,
and analyze flows in sub‐millimeter dimensions. General advantages of this miniaturization strategy
include savings in time, space, materials and/or cost, together with increased performance.
Microfluidics is expected to revolutionize chemistry and biology, just as microelectronics has
revolutionized information technology in the previous century. A trend in the field is to integrate
multiple unit operations in a single device. Many of these operations, such as prefiltration,
separation or contacting, can be carried out by membranes. Additionally, in the field of membrane
technology, a lot of knowledge and experience is available on topics that are also covered by the
field of microfluidics, including: interaction of materials, materials processing, sealing, mass
transport, and module design. The main aim of this thesis is to bridge both fields and show new
opportunities. The content therefore is of a conceptual and explorative nature.
In Chapter 2, an overview of the state‐of‐the‐art in the integration and application of
membranes in microfluidic devices is presented. A special focus is put on devices made of poly
dimethylsiloxane (PDMS). This material has membrane characteristics and is currently one of the
favorite materials in academic microfluidic research.
Chapter 3 describes a new micro replication method for the preparation of microfluidic chips:
phase separation micromolding (PSμM). The method is based on phase separation of a polymer
solution on a microstructured mold, leading to a film with an imprint of the mold features.
Presented images show that the morphology of this film, and hence its membrane characteristics,
can be tuned. After sealing and assembly, a porous microfluidic chip is obtained in which the channel
walls can be used for selective mass transport of gases, liquids and/or solutes. The complete
preparation of a porous PMMA chip is described, and a proof‐of‐principle is provided by visualizing
CO2 transport through the channel walls. It is demonstrated that the gas permeation performance of
microfluidic chips can be enhanced dramatically by a decrease in chip thickness and incorporation of
porosity. This enhancement is so strong that it enables low permeable materials to compete with
PDMS, or even surpass its performance.
iii
Chapter 4 focuses further on fundamental aspects of membrane‐based micro gas‐liquid
contactors. For this purpose, a different type of micro device has been developed, using micro
milling of plastic substrates and clamping of membranes. This approach enables rapid prototyping of
devices, and quick assembling and disassembling. CO2 absorption in water has been chosen as a
model system. No mass transfer resistances are found in the gas phase, but depletion effects can be
observed for low gas / liquid flow rate ratios. The main mass transfer limitation for the system with a
porous membrane is situated in the liquid phase. Subsequent numerical modeling of this phase in
COMSOL shows that the behavior of micro gas liquid systems can be predicted with acceptable
results using a 2D model with very basic assumptions. When a dense membrane is used, an
additional resistance is found. The second part of this chapter concerns the use of gases for control
of micro environments. A specific micro system has been designed that consists of a sensor system
on a dipstick that is sealed by a PDMS slab with integrated gas channels. The internal volume of this
system is only 15 μl. It is demonstrated for aqueous systems and ammonia vapor that within minutes,
the pH can be increased by several pH units. Overshoot of pH values can be compensated for by the
absorption of CO2. Preliminary experiments with Saccharomyces Cerevisiae (bakers yeast) show that
the pH during fermentation of glucose solutions can be increased from 5.5 to 7, opening up the way
for gas based pH control.
In Chapter 5, the approach of gas‐liquid contacting is further exploited for the local creation of
concentration gradients. A multilayer microfluidic device with crossing gas and liquid channels is
used to generate multiple gas‐liquid contacting regions, separated by a hydrophobic membrane.
Each crossing can act as both a micro dosing and micro stripping region, and the liquid and gas
phases can be operated independently of each other. It is demonstrated that by supplying different
types of gases, complex stationary and moving gradients can be created. Furthermore, the method
allows for consecutive gradients in a single channel, in both flowing and stagnant fluid layers. The
emphasis of the chapter is on the generation of pH gradients, by locally supplying acidic or basic
gases/vapors, such as carbon dioxide, hydrochloric acid and ammonia, visualized by pH sensitive
dyes. Achievable concentration ranges depend on contacting time, and are ultimately limited to the
solubility of used components. The reported devices are easy to fabricate, and their application is
not limited to pH gradients. Two proof of principles are demonstrated to indicate new opportunities:
i) local crystallization of NaCl using HCl vapor, and ii) consecutive reactions of ammonia with copper
(II) ions.
Chapter 6 is dedicated to the preparation of thin porous coatings in small channels, based on
phase separation of a polymer solution in contact with a non‐solvent. Such coatings can be beneficial

iv
for use in micro reactors and analysis. It is demonstrated that morphology of films can be tuned and
that particles can be incorporated during phase separation, leading to functionalized coatings. A
proof of principle is demonstrated for a Pt functionalized coating by showing catalytic partial
oxidation of glucose.
During this explorative project, many fabrication methods have been explored or invented, and
new ideas and opportunities have been generated. A selection of tips, tricks and new concepts is
presented in Chapter 7. The focus is on simplicity of fabrication methods, without the need of
expensive dedicated equipment. Simple methods targeting the integration of membrane
functionality in microfluidic devices include the use of hollow fibers and embossing of micro
structures in porous membranes. Furthermore, it is demonstrated that hollow fiber membranes can
be used as an intermediate in the preparation of packed beds and monoliths. After filling, the
porosity of the membrane is removed by a heat treatment. This densification concept also enables
the preparation of optical windows in membrane systems, which can be exploited for study of flow
and fouling behavior. A last example that is shown is the incorporation of membranes in thin PDMS
layers for improvement of mechanical strength and reduction of swelling. The chapter ends with
general guidelines for the use of membranes in microfluidics.
In Chapter 8, an evaluation of the total project is given, in which the basic accomplishments are
summarized, recommendations are given and common pitfalls are identified. In the subsequent
outlook, trends in the field of microfluidics in general are presented, together with the role that
membranes can play in further development. Furthermore, future applications and research
directions for membrane technology on the micro scale are indicated.

v
TABLE OF CONTENTS
Summary i
General Introduction
1.1. Microfluidics 1
1.2. Why membrane technology? 4
1.3. Project description 5
1.4. Outline of the thesis 7
1.5. Cited literature 9
Membranes and microfluidics: a review
2.1. Introduction 12
2.2. Basics of Membrane Technology 13
2.3. Membranes in microfluidics 15
2.3.1. How to integrate membrane functionality on‐chip? 15
2.3.2. Which applications exploit integrated membrane functionality? 22
2.4. Bridge between membrane technology and microfluidics: the case of PDMS 30
2.5. Summary 32
2.6. Cited Literature 33
Fabrication of thin polymeric microfluidic devices with tunable porosity
3.1. Introduction 38
3.2. Background 40

vi
3.2.1. Phase separation micromolding 40
3.2.2. From porous film to chip: Sealing 43
3.2.3. From porous film to chip: Assembly 44
3.3. Experimental 45
3.4. Results & Discussion 47
3.4.1. Film fabrication 47
3.4.2. Sealing 49
3.4.3. Assembly and operation 50
3.4.4. Proof of principle: gas transport through porosity 51
3.5. Conclusions 54
3.6. Cited literature 55
Membrane assisted gas‐liquid contacting in micro devices
4.1. Introduction 58
4.2. Theoretical background 59
4.3. Experimental 62
4.4. Results and discussion 66
4.4.1. Conductivity measurements 66
4.4.2. Gas phase limitations 67
4.4.3. Liquid phase limitations 69
4.4.4. Membrane limitations 70
4.5. Proof of principle: gas based pH control 72
4.5.1. Introduction 72
4.5.2. Materials and methods 73
4.5.3. Results and discussion 76
4.5.4. Towards pH control in micro fermentors 79
4.6. Summary 82
4.7. Acknowledgements 82
4.8. Cited Literature 83

vii
Generation of local concentration gradients by gas‐liquid contacting
5.1. Introduction 86
5.2. Background 87
5.3. Experimental 91
5.4. Results and discussion 92
5.4.1. Single gas experiments 92
5.4.2. Multiple gas experiments 93
5.5. Conclusions and outlook 97
5.6. Cited literature 99
Preparation of porous polymeric coatings in micro channels
6.1. Introduction 102
6.2. Background 104
6.3. Experimental 108
6.4. Results and discussion 111
6.4.1. Coating morphology of porous films 111
6.4.2. Thickness of coating layer 112
6.4.3. Coating adhesion 114
6.4.4. Incorporation of particles 115
6.5. Proof‐of‐principle: porous catalytic layer 116
6.6. Summary 118
6.7. Acknowledgements 119
6.8. Cited literature 120
viii
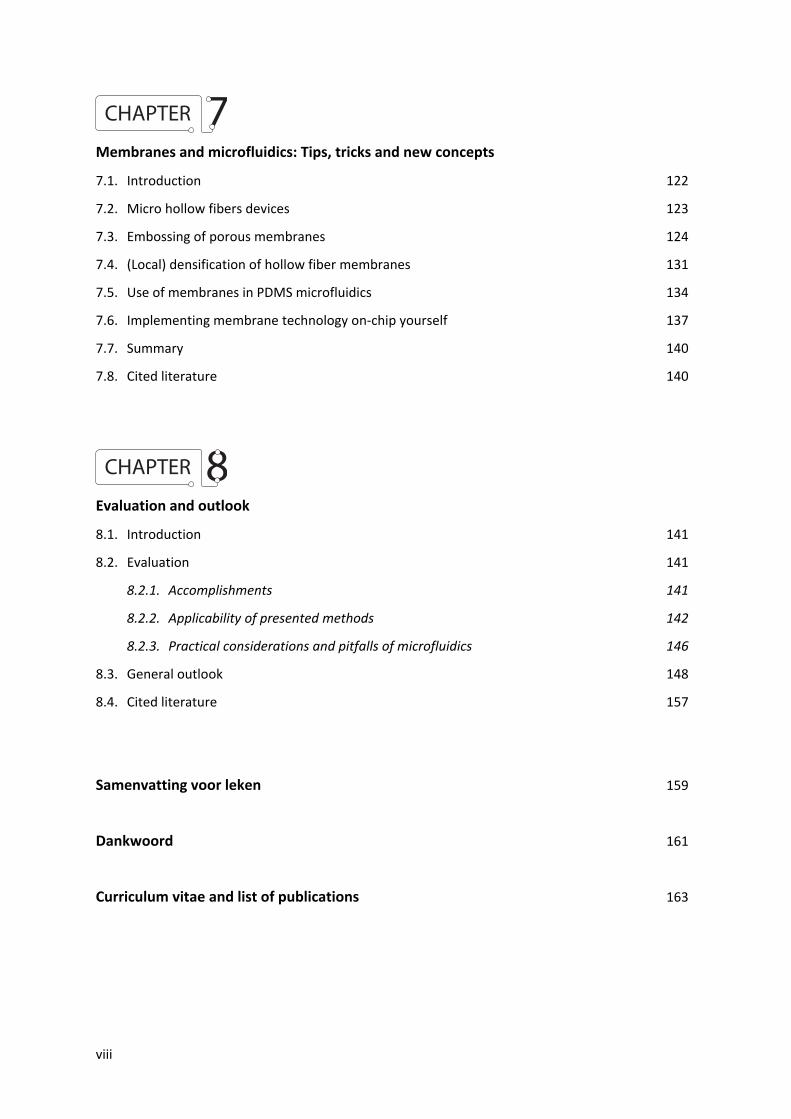
Membranes and microfluidics: Tips, tricks and new concepts
7.1. Introduction 122
7.2. Micro hollow fibers devices 123
7.3. Embossing of porous membranes 124
7.4. (Local) densification of hollow fiber membranes 131
7.5. Use of membranes in PDMS microfluidics 134
7.6. Implementing membrane technology on‐chip yourself 137
7.7. Summary 140
7.8. Cited literature 140
Evaluation and outlook
8.1. Introduction 141
8.2. Evaluation 141
8.2.1. Accomplishments 141
8.2.2. Applicability of presented methods 142
8.2.3. Practical considerations and pitfalls of microfluidics 146
8.3. General outlook 148
8.4. Cited literature 157
Samenvatting voor leken 159
Dankwoord 161
Curriculum vitae and list of publications 163

1
GENERAL INTRODUCTION
1.1. MICROFLUIDICS
The word microfluidic refers to the research field that develops methods and devices to control,
manipulate, and analyze flows on small length scales. A keyword in this development is
miniaturization, which has already proven to be a powerful strategy in many research areas. General
advantages include savings in time, space, materials and/or cost, together with increased
performance. The development of microfluidics can be seen as an analogy of electronics; however,
instead of electrons, here molecules are flowing through the system. These molecules can appear as
a gas, liquid or solid phase and in many cases combinations are made such as dispersions or
emulsions. Microfluidics is expected to revolutionize chemistry and biology, just as microelectronics
has revolutionized information technology in the previous century. Daily life examples of
commercially available microfluidic devices are shown in Figure 1.
Figure 1: Examples of microfluidic devices: a) inkjet cartridge with an incorporated microfluidic dispenser to generate small ink droplets; b) micro fuel cell running on methanol for electricity generation in portable equipment; c) portable analyzer for determination of glucose concentration in blood

Chapter 1
2
When can a device be considered ‘microfluidic’? Although a clear definition of the dimensional range
has not been set, a generally accepted criterion is that studied devices contain fluidic structures with
sub‐millimeter dimensions [1]. At this scale, different physical phenomena become predominant
than on the macroscale, which offers fascinating possibilities [2]. The most exploited characteristic of
microfluidic devices is the well defined flow. This so‐called laminar flow is predictable and, most
importantly, controllable. Another characteristic is the high surface to volume ratio, which scales
inversely proportional to the dimension. The smaller the dimension, the higher the surface to
volume ratio and the more influence surface‐related processes have on the behavior of the system.
In microfluidics, this principle is exploited to obtain highly efficient heat transfer and to increase the
effective surface of adsorbents and catalysts for separation and reactions.
Due to the absence of turbulence, mixing in microfluidic systems is solely governed by diffusion,
which can lead to counterintuitive observations, as depicted in Figure 2.
Figure 2: Demonstration of laminar flow and diffusion controlled mixing in a microfluidic device with a channel width of 100μm. a) optical microscopy image showing the joining of yellow and blue ink. Arrows indicate flow direction; b) result of a simple simulation of this system in COMSOL Multiphysics®, demonstrating the predictability of mass transport.
The image on the left shows a junction, in which two streams of ink are joined. Against daily life
experience, where fluid instabilities play a determining role, the two layers flow nicely together.
Gradually, the distinct interface disappears due to diffusion of the inks. The right image shows the
predictability of such a system. This feature opens up possibilities for numerical prototyping of highly
integrated devices [3]. Both images clearly demonstrate that microfluidics is not a straight‐forward
miniaturization of macroscale processes, and that gut feeling may often be wrong. To quote Squires

General Introduction
3
and Quake: “[…] one must unlearn a life time of high Reynolds intuition in order to effectively think
about microfluidics.” [4]
The development of microfluidics started in the 70’s in the area of analytical chemistry, and still
many applications are related to this field. The small diffusion lengths and small volumes in
microfluidic devices can be effectively exploited to carry out separations and detections with high
resolution and sensitivity, at high speed, low cost and low sample consumption. The field was
relatively dormant until the beginning of the 90’s, when Manz introduced the concept of
miniaturized total analysis systems (μTAS) [5], later on extended to “Lab on a chip”. In these types of
systems, all necessary components, such as mixers, valves, reaction chambers and detectors, are
integrated. Many different microfluidic platforms have been developed for lab on a chip [6, 7], and
the enormous growth of this field is further illustrated by the hundreds of references in yearly
updated reviews [8‐12].
In recent years, chemical engineers working on process intensification have also started to
apply microfluidic technology, expanding its scope to micro reaction engineering. In this field, the
focus is not on analysis of compounds, but on production. The development of microfluidics in the
area of micro reactor engineering, and of micro process engineering in general, has been extensively
reviewed by Hessel [13‐16]. Major drives are speed and control. Massive parallelization of micro
reactors enables high throughput screening that is required in e.g. drug discovery, biotechnology
and combinatorial chemistry. Besides new products, also process conditions can be rapidly screened
in e.g. reactions or crystallizations, leading to improved operation. Control over mass and energy
transport leads to increased conversion and selectivity of chemical reactions, giving higher yields and
purity [17]. As a consequence, less waste is produced and less purification and polishing steps are
required later on in the production process. Due to the good control and small volumes in micro
reactors, reactions can be carried out with explosive, poisonous or other high‐risk chemicals that
would cause major safety issues on the macroscale. The small internal volumes involved are also
beneficial for production and testing of valuable products, such as isotopes and pharmaceuticals. At
this moment, one of the biggest challenges of micro reactors is related to mixing, which is relatively
slow due to a lack of inertia. Different tricks have been reported to enhance mixing, but in many
reactions the mixing step stays rate limiting [18].
The development of microfluidic devices requires microfabrication technologies, which links
microfluidics closely to the field of micro electro mechanical systems (MEMS)[19]. The first
microfabrication methods, such as photolithography and etching, were developed within the semi
conductor industry for the production of integrated circuits. Thus it is not surprising that the first
microfluidic devices were constructed of silicon and glass. Gradually, new methods have been
invented that allow for a broader material choice. Replication techniques such as hot embossing and
injection molding have enabled the use of several polymers [20, 21]. One material has to be

Chapter 1
4
highlighted here specifically, since it has boosted microfluidic research: Poly dimethylsiloxane
(PDMS)[22]. Replication of microstructures with PDMS is extremely simple as it only involves the
cross linking of a prepolymer liquid on a mold, after which the film can be easily peeled off.
Additional advantages of PDMS include: very good sealing properties; transparent; biocompatible;
flexible; and high permeability for gasses and vapors. Integration of valves and pumps can be easily
obtained [23]. In process engineering, more robust materials are required that can withstand high
temperatures and aggressive chemicals. Therefore, in latest years also methods have been
developed for micro structuring of metals [24, 25] and ceramics [26, 27], including micro milling,
injection molding of pastes, and tape casting.
Summarizing, microfluidics is a fascinating research field that offers new possibilities for many
application areas. Already an extensive list of proof‐of‐principles has been demonstrated and
different technologies and materials are available for the fabrication of microfluidic devices.
Although George Whitesides, one of the leading scientists in the field, has claimed in 2006 that
microfluidics “[…] is still in its infancy” [28], more and more companies are founded that sell
microfluidic products, and an increase in patent applications can be detected [29]. According to Yole
Développement, the total accessible market for microfluidics will rise to € 5B in 2012, of which € 1B
is from diagnostic components [30]. However, still major hurdles have to be taken; many issues in
fabrication, sealing and scale‐up but also in further understanding of microfluidic phenomena have
to be addressed. Furthermore, new functionalities are desired, which brings us to the reasons for
applying membrane technology in microfluidics.
1.2. WHY MEMBRANE TECHNOLOGY?
In microfluidic research there is a drive towards integration of multiple unit operations, such as
pretreatment, reaction, separation and purification, in a single device [31]. This is where membrane
technology comes into play. Membranes are nowadays used in a wide range of industrial
applications, such as gas separation; pervaporation; waste water treatment and desalination. Other
topics of membrane technology include energy generation, with emphasis on fuel cells [32], tissue
engineering [33] and biomedical applications such as oxygenation and dialysis [34]. Many macroscale
membrane systems may be transformed to the micro scale, adding options to the existing palette of
unit operations required for microfluidics. Figure 3 shows examples of the possibilities that
membrane technology offers. Already an extensive list of proof‐of‐principles in this area has been
reported [35]. However, still an enormous potential is left unexplored and fundamental knowledge
and understanding is lacking. This project has been initiated to partly fill that gap.

General Introduction
5
Figure 3: Examples of the application of membrane‐based unit operations in microfluidics
Besides experience with the direct application of membranes, also a lot of knowledge is available in
the membrane technology community that can be beneficial for microfluidics. General overlapping
topics include materials science and materials processing, physical chemistry and interface science.
More specific, membrane technology can add knowledge about (functional) coatings; sealing; fouling
and cleaning; and assembly and operation of modules. To this last point the remark can be added
that hollow fiber membranes, which are widely applied around the world, fall within the scale
criterion of microfluidics. Therefore, modules of these fibers may be considered as a successful
example of massive parallelization of microfluidic systems. Also every pore in a membrane, which
can vary from a few microns down to nanometers, can be seen as an individual microfluidic system.
In conclusion, it is clear that the research fields are already linked and that microfluidics can benefit
from membrane technology and vice versa. After this brief introduction on membrane technology
and microfluidics we come to the description of the project, its background and goals.
1.3. PROJECT DESCRIPTION
The research presented in this thesis has been carried out at the Membrane Technology Group,
which participates in the MESA+ Institute. It was one of the projects within the Dutch research
framework “Process on a Chip” (PoaC). In this framework, academia and industry work together on

Chapter 1
6
the mission statement “[…] to take miniaturization research in the Netherlands a step further” [36].
PoaC is divided into 4 pillars: basic expertise, analysis on chip, synthesis on chip and
separation/mixing on chip. Facets of all these pillars have been touched in this project, with an
emphasis on basic expertise.
The incentive for this specific project was a new generic microfabrication method that had been
developed in the Membrane Technology Group, in collaboration with Aquamarijn Microfiltration:
Phase separation micromolding (PSμM) [37]. This replication technology is applicable to many
different materials and enables the preparation of thin microstructured films with membrane
features. Therefore, it was expected to be a suitable method to fabricate porous microfluidic chips
with integrated membrane functionality. Furthermore, the possibility existed to create a continuous
production process, opposite to the batch processes in conventional clean room technologies. Such
a process would be very interesting for scaling‐out of single devices to large scale modules.
The project was carried out in collaboration with Wageningen Research University, which is
specialized in food and enzyme systems. The original title of the project was “Combining Massive
Parallelization of Multi‐Chamber Reaction and Separation with Precise Control of Selectivity in Multi‐
Route Enzyme Systems.” Within the project plan, four bundles of activities were defined: a) Fluid
Dynamics/Virtual prototyping; b) Material Identification / Fabrication; c) Proof‐of‐Concept / Single
Unit Operation; and d) Integration – Towards a Process. Since the nature of this project was highly
explorative, many of the initial goals have been adjusted and new research directions have been
chosen. This has caused the scope of the research to broaden to what the title suggests: the
application of different aspects of membrane technology in microfluidic systems in general. Since
this project was the first of its kind in the Membrane Technology Group, it also served as a platform
to create basic knowledge and to explore opportunities and challenges for future projects related to
microfluidics. Many different fields have therefore been bridged, ranging from materials processing
to fluid dynamics, and from catalysis to gas‐liquid contacting. This thesis contains basic background
information on all of these subjects and so it might serve as a starting point for anyone interested in
applying membranes on the micro scale.

General Introduction
7
1.4. OUTLINE OF THE THESIS
In Chapter 2, an overview of the state‐of‐the‐art in the integration and application of membranes in
microfluidic devices is presented. A special focus is put on devices made of poly dimethylsiloxane
(PDMS), since this material has membrane properties of itself and is also applied in common
membrane technology practice.
Chapter 3 describes the use of phase separation micromolding as a method to fabricate porous
microfluidic chips. The complete preparation process is described, starting from film fabrication, via
a sealing step to an operating porous assembly. Furthermore, the preparation of a multilayer chip is
demonstrated. A proof of principle of the added value of the introduced porosity is given, by
showing fast CO2 transport through the channel walls into a liquid stream. Finally, the gas
permeation properties of produced porous films are compared with dense films comprised of the
same material, and with PDMS, to demonstrate the enhancement by the porosity.
Chapter 4 focuses further on the fundamental aspects of micro gas‐liquid contactors. For this
purpose, a different type of micro device has been developed, based on micro milling of plastic
substrates and clamping of membranes. Again, CO2 absorption has been chosen as a model system.
The results of basic absorption experiments are described and compared with a basic 2D numerical
model to give more insight in the transport limiting steps. The second part of this chapter concerns
the use of gasses for control of micro environments. Control accuracy, power, and speed are
discussed for a model system with water. Furthermore, results of pH control tests in a micro
fermentation system are presented.
In Chapter 5, the approach of gas‐liquid contacting is applied for local generation of concentration
gradients. A multilayer microfluidic device with crossing gas and liquid channels is used to generate
multiple gas‐liquid contacting regions, separated by a hydrophobic membrane. Each crossing can
acts as both a micro dosing and micro stripping region. By supplying different types of gasses,
complex stationary and moving gradients can be created. The chapter focuses on the generation of
pH gradients, by locally supplying acidic or basic gasses/vapors, such as carbon dioxide, hydrochloric
acid and ammonia. At the end, opportunities of the concept are indicated and illustrated with
preliminary examples.

Chapter 1
8
Chapter 6 is dedicated to the preparation of thin porous coatings in small channels, based on phase
separation of a polymer solution in contact with a non‐solvent. After a brief introduction in coating
theory, prepared coatings are discussed in terms of morphology, thickness and adhesion strength.
Furthermore, it is demonstrated that particles can be incorporated during phase separation, leading
to functionalized coatings. A proof of principle is demonstrated for a Pt functionalized coating by
showing partial catalytic oxidation of glucose.
During this explorative project, many fabrication methods have been explored or invented, and new
ideas and opportunities have been generated. A selection of tips, tricks and new concepts is
presented in Chapter 7. The emphasis of this chapter is on practical issues during design, fabrication
and/or sealing of devices. The chapter ends with general guidelines for the use of membranes in
microfluidics.
Finally, in Chapter 8 an evaluation of the total project is given, in which the basic accomplishments
are summarized, recommendations are given and common pitfalls are identified. In the subsequent
outlook, trends in the field of microfluidics in general are presented, together with the role that
membranes can play in further development. Furthermore, future applications and research
directions for membrane technology on the micro scale are indicated.

General Introduction
9
1.5. CITED LITERATURE 1. H.A. Stone, A.D. Stroock, and A. Ajdari, Annu. Rev. Fluid. Mech., 2004, 36, 381‐411. 2. D. Janasek, J. Franzke, and A. Manz, Nature, 2006, 442, 374. 3. D. Erickson, Microfluid. Nanofluid., 2005, 1, 301‐318. 4. T.M. Squires and S.R. Quake, Rev. Mod. Phys., 2005, 77, 977‐1026. 5. A. Manz, N. Graber, and H.M. Widmer, Sens. Act. B, 1990, 1, 244. 6. S. Haeberle and R. Zengerle, Lab Chip, 2007, 7, 1094‐1110. 7. P. Abgrall and A.M. Gue, J. Micromech. Microeng., 2007, 17, R15‐R49. 8. S.C. Jakeway, A.J.d. Mello, and E.L. Russel, Fresenius J. Anal. Chem., 2000, 366, 525‐539. 9. D.R. Reyes, D. Iossifidis, P.A. Auroux, and A. Manz, Anal. Chem., 2002, 74, 2623‐2636. 10. P.A. Auroux, D. Iossifidis, D.R. Reyes, and A. Manz, Anal. Chem., 2002, 74, 2637‐2652. 11. T. Vilkner, D. Janasek, and A. Manz, Anal. Chem., 2004, 76, 3373‐3385. 12. P.S. Dittrich, K. Tachikawa, and A. Manz, Anal. Chem., 2006, 78, 3887‐3908. 13. V. Hessel and H. Lowe, Chem. Eng. Technol., 2003, 26, 13‐24. 14. V. Hessel and H. Lowe, Chem. Eng. Technol., 2003, 26, 391‐408. 15. V. Hessel and H. Lowe, Chem. Eng. Technol., 2003, 26, 531‐544. 16. V. Hessel, S. Hardt, and H. Loewe, Chemical Micro Process Engineering: Fundamentals, Modelling and
Reactions. 2004, Weinheim, Germany: Wiley‐VCH. 17. P. Watts and S.J. Haswell, Chem. Soc. Rev, 2005, 34, 235‐246. 18. J.M. Ottino and S. Wiggins, Phil. Trans. R. Soc. Lond. A., 2004, 923‐935. 19. E. Verpoorte and N.F.d. Rooij, Proc. IEEE, 2003, 91, 930‐953. 20. H. Becker and L.E. Locascio, Talanta, 2002, 56, 267‐287. 21. M. Heckele and W.K. Schomburg, J. Micromech. Microeng., 2004, 14, R1‐R14. 22. D.C. Duffy, J.C. McDonald, O.J.A. Schueller, and G.M. Whitesides, Anal. Chem., 1998, 70, 4974‐4984. 23. M.A. Unger, H.P. Chou, T. Thorsen, A. Scherer, and S.R. Quake, Science, 2000, 288, 113‐116. 24. L. Liu, N.H. Loh, B.Y. Tay, S.B. Tor, Y. Murakoshi, and R. Maeda, Mat. Charact., 2005, 54, 230. 25. J.C. Ganley, E.G. Seebauer, and R.I. Masel, J. Power Sources, 2004, 137, 53. 26. R. Knitter and L. M.A., Lab Chip, 2004, 4, 378‐383. 27. F. Meschke, G. Riebler, V. Hessel, J. Schürer, and T. Baier, Chem. Eng. Technol., 2005, 28, 465‐473. 28. G.M. Whitesides, Nature, 2006, 442, 368‐373. 29. C. Haber, Lab Chip, 2006, 6, 1118‐1121. 30. Emerging markets in microfluidic applications, Business report, Yole Développement, 2007. 31. D. Erickson and D. Li, Anal. Chim. Acta, 2004, 507, 11‐26. 32. N.T. Nguyen and S.H. Chan, J. Micromech. Microeng., 2006, 16, R1‐R12. 33. B.J. Papenburg, L. Vogelaar, L.A.M. Bolhuis‐Versteeg, R.G.H. Lammertink, D. Stamatialis, and M.
Wessling, Biomaterials, 2007, 28, 1998‐2009. 34. D.F. Stamatialis, B.J. Papenburg, M. Girones, S. Saiful, S.N.M. Bettahalli, S. Schmitmeier, and M.
Wessling, J. Membrane Sci., In Press, Corrected Proof. 35. J. de Jong, R.G.H. Lammertink, and M. Wessling, Lab Chip, 2006, 6, 1125‐1139. 36. http://www.poac.nl. 37. L. Vogelaar, J.N. Barsema, C.J.M. van Rijn, W. Nijdam, and M. Wessling, Adv. Mater., 2003, 15, 1385‐
1389.

Chapter 1
10

11
MEMBRANES AND MICROFLUIDICS: A REVIEW
Abstract
The integration of mass transport control by means of membrane functionality into microfluidic
devices has shown substantial growth over the last 10 years. Many different examples of mass
transport control have been reported, demonstrating the versatile use of membranes. This review
provides an overview of the developments in this area of research. Furthermore, it aims to bridge
the fields of microfabrication and membrane science from a membrane point‐of‐view. First the basic
terminology of membrane science will be discussed. Then the integration of membrane
characteristics on‐chip will be categorized based on the used fabrication method. Subsequently,
applications in various fields will be reviewed. A special focus in this review is made on the
membrane properties of poly dimethylsiloxane (PDMS), a material frequently used nowadays in
master replication.

Chapter 2
12
2.1. INTRODUCTION
Since 1990, microfluidics has developed into a versatile technology. While initially focused on flow
through simple channel layouts, designs of chips nowadays are much more complicated. Large effort
has been put into the integration of unit operations on‐chip, e.g. sample pre‐treatment, mixing with
reagents, reaction, and separation/purification of the products [1, 2]. Looking at the methods used
for integration, people have started out with clever designs of silicon chips, using the toolbox of the
semiconductor industry. Lately a shift to new approaches can be recognized, aimed at simple
straightforward integration: application of functionalized coatings, adsorption beads and
membranes. The use of membranes in microfluidics has been a topic of growing interest, as is clearly
illustrated in Figure 1.
0
5
10
15
20
25
30
1996
1997
1998
1999
2000
2001
2002
2003
2004
2005
# ar
ticle
s co
ncer
ning
mem
bran
es a
nd m
icro
fluid
ics
Figure 1: Articles concerning membranes and microfluidics discussed in this review, categorized by year of publication. The graph shows substantial growth over the past 10 years.
Membrane science and technology is a broad and highly interdisciplinary field, where process
engineering, material science and chemistry meet. The interfaces of these fields offer many
opportunities, and membranes have already been used for an impressive range of functions. Most
known is of course separation of components, but also gas‐liquid contacting and emulsification are
possible. Using biocompatible or biodegradable polymers, membranes can be used as culturing
supports or scaffolds for tissue engineering. Furthermore, membranes provide a large internal
surface area that can be used effectively for adsorption or catalysis‐based applications. Due to the
versatility of membranes, related articles in the area of microfluidics are widespread in literature.
Strikingly, in many of these papers the membrane is not recognized for its function. Illustrative for

Membranes and microfluidics
13
the articles discussed in this chapter is the fact that ‘membrane’ is often not in the keyword list. In
many cases an alternative term is used (e.g. filter, sieve, porous support, ‘film’) or the function of the
membrane is given (e.g. separation, purification, sample pre‐treatment, dialysis). Hence, the overall
picture of membrane technology in microfluidics is diffuse. In this chapter we provide a general
overview of the developments at the interface between membrane science and microfluidics, which
has been written from a membrane point of view. The following structure is used: First the
parameters of major importance in membrane technology are defined and explained. Then the
different approaches to integrate membrane functionality in a microfluidic chip are categorized.
Subsequently, an overview of the applications reported in microfluidics literature is presented. A
special focus is made on the use of the highly permeable material poly dimethylsiloxane (PDMS).
This material has already been applied in membrane technology for a long time and the knowledge
created in this field can be very useful for the microfluidic community.
2.2. BASICS OF MEMBRANE TECHNOLOGY
The word ‘membrane’ is used in different situations for different functions and thus a clear
definition is desired. In this review, we define a membrane as a semi‐permeable barrier. Semi‐
permeable implies that in the considered applications, the membrane is used to control transport of
some kind of species. When the transport direction is out of a system we speak of separation; when
it is into the system we speak of membrane contacting. The cause of transport through a membrane
is a difference in chemical potential between both sides. This difference may be due to a gradient in
temperature, (partial) pressure, concentration or electrical potential. The mechanisms for transport
strongly depend on membrane morphology. Two typical morphologies can be distinguished: porous
and dense. Dense membranes are permeable for single molecules (transport of ions is also possible,
but for reasons of simplicity this transport mechanism will not be described here). Transport in such
systems is described by the solution‐diffusion model. According to Wijmans and Baker, this model
has emerged as the most widely accepted explanation of transport in dialysis, reverse osmosis, gas
permeation, and pervaporation [3]. In this model, the permeability P of a component i is related to
its diffusivity D (cm2/s) and solubility S (cm3/cm3.atm) in the membrane material by the following
formula:
Pi = Di * Si (1)
Since both the solubility and diffusivity of a component i depend on its interactions with the
membrane material, transport is clearly material dependent. The permeability of a dense material

Chapter 2
14
equals a flow, normalized for the membrane surface area, the difference in partial pressure and the
membrane thickness. The value of the permeability is an intrinsic property of the membrane
material and gives an indication of the membrane transport capacity.
The second important characteristic of dense membranes is the intrinsic selectivity α. For two
components i and j, the selectivity αi,j is defined as the ratio of the pure permeabilities of i and j. Its
value gives an indication of the separation efficiency of the membrane. The combination of
permeability and selectivity indicates the general performance of the membrane material. It is
important to stress that every material has membrane properties. However, for most materials the
permeability and/or selectivity is too low for practical purposes.
For porous membranes, the transport mechanism is completely different. In this case, transport
occurs through the empty spaces (pores) in the membrane instead of the material itself. Although
the interaction with the internal membrane surface can play a crucial role, the transport is in the
first place governed by the membrane morphology. Morphology includes the surface‐ and volume
porosity (ε), pore size distribution, and tortuosity (τ). Tortuosity is a factor used to correct for the
deviation of pore shape from perfect cylinders. It is defined by the ratio of the average path length
through the pores and the membrane thickness. In porous membranes, again the permeability P is
used to indicate the capacity of the membrane. However, since transport is not an intrinsic
membrane material property, the permeability in porous membranes is not normalized for the
membrane thickness! Pore sizes range from micrometers down to below 1 nanometer. Porosities
range from more than 80% for micrometer‐sized pores to less than 2% for nanometer‐sized pores.
For porous membranes an alternative to the term selectivity has been defined: the retention R.
The retention is measured during actual filtration and is related to the concentration of component i
in permeate and feed, respectively, as is given by Equation 2:
Ri = 1 – (ci,perm/ci,feed) (2)
The retention varies between 0 (no retention of component i) to 1 (component i is completely
retained). It depends on the ratio of molecular size to pore size [4]. A second characteristic of a
porous membrane that indicates whether separation will occur is the molecular weight cut‐off
(MWCO). The MWCO is defined as the molecular weight at which 90% is retained by the membrane
and gives an indication of the pore size. Combining MWCO and permeability, an estimation of the
separation performance of a membrane can be given. Summarizing, the performance of dense
membranes is strictly material dependent, while the performance of porous membranes is
morphology and material dependent.

Membranes and microfluidics
15
Membranes can be operated in two modes. In the so‐called “dead end mode”, a feed stream is
completely transported through the membrane. This operation is always a batch process, since the
components rejected by the membrane will accumulate at the membrane surface. In continuous
mode, the feed is flowing along the membrane. The stream that passes the membrane is called
‘permeate’, whereas the remainder is defined as ‘retentate’. Depending on the application, either
permeate or retentate can be the desired product: e.g. preparation of safe and clean drinking water
(permeate) or concentration of a protein solution (retentate). Similar to heat exchange, continuous
operation can be performed in co‐current, counter‐current and cross flow.
More basic information on membrane transport, processes, fabrication and other membrane
related topics can be found in the standard works of Mulder [5] and Baker [6]. For details on specific
processes we like to refer to the Journal of Membrane Science [7] and a very recent review on
advanced functional polymer membranes [8].
2.3. MEMBRANES IN MICROFLUIDICS
2.3.1. HOW TO INTEGRATE MEMBRANE FUNCTIONALITY ON‐CHIP?
Many different approaches have been reported to combine membranes and microfluidics. A rough
division into four fabrication methods can be made, as is shown in Table 1.
Direct incorporation of (commercial) membranes
First, and most straight‐forward, is the direct incorporation of a membrane into a microfluidic
device, simply by clamping or gluing between plates with microfluidic layouts [7, 9‐40]. The plates
are mostly fabricated by PDMS replication, hot embossing, or CNC milling. The membrane can be
easily prepared in‐home, or directly purchased from a commercial supplier. In many cases
tracketched membranes are used, since a) membrane thickness is in the order of several microns,
and consequenty the internal volume is low; b) pore sizes are very well defined and c) pores are
straight‐through, in only one direction. This last feature avoids leakage or diffusion effects in the
planar direction of the membrane. Modification techniques can be used to functionalize the
membrane, e.g. by immobilization of trypsin [41‐43], bovine serum albumin (BSA) [44] or
impregnation with an extraction fluid [45]. By using multiple membranes in a stack, a certain fraction
of a sample can be collected, as is illustrated in Figure 2a. Instead of flat sheets, also hollow fiber
membranes can be considered. These hollow fibers are available with diameters down to 100 micron
and can be directly connected to silica capillaries in order to make simple devices [41, 46‐51].

Chapter 2
16
Table 1: Categorization of different approaches to integrate membrane functionality on‐chip.
Method
Approach
Direct incorporation of (commercial) membranes
Clamping or gluing of commercial flat membranes [7, 9‐40] ‐ similar, followed by functionalization [41‐45] Incorporation of membrane during micro stereo lithography [52] Use of hollow fiber membranes between capillaries [41, 46‐51]
Membrane preparation as part of the chip fabrication process
Production of sieves with well‐defined pores by etching [53] Thin metal film deposition [54‐57] Growing of zeolite crystals [58‐61] Preparation of porous silicon in wafers [62‐64] Preparation of porous oxide layers [64‐68] Creation of pores by ion track technology [69] Preparation of polymeric membranes by casting [70‐72] Photo polymerization of ion‐permeable hydrogels [73, 74]
In‐situ preparation of membranes Local photo polymerization of acrylate monomers [75‐77] Interfacial polymerization in two‐phase flow [78] Liquid membranes by three‐phase flow [2, 79, 80] Formation of lipid bilayers [81, 82]
Use of membrane properties of bulk chip material
PDMS chips [83‐98] Other polymeric chips [99‐101] Hydrogel based chip [102] Fabrication of completely porous chips [103‐105]
Figure 2: Incorporation of commercial membranes in microfluidic devices: a) clamping of membranes with different MWCO between microfluidic sheets in order to fractionate samples (reprinted with permission from [12], © 1999 American Chemical Society); b) incorporation of a membrane during micro stereo lithography (reprinted with permission from [52], ©1999 IEEE)
A major problem in the direct incorporation of membranes is the sealing step, especially when
inorganic substrates such as glass or silicon are combined with polymeric membranes. Due to
capillary forces, fluids can easily get sucked in between cover plates. Using glue, the same forces can

Membranes and microfluidics
17
cause complete blocking of the membrane due to filling of the pores. An elegant way to overcome
this problem is to make a chip by micro stereo lithography [52]. In this process, a chip is built in 3D
from a photo curable liquid polymer using a focused UV beam. The membrane can be put in the
precursor solution, thereby eliminating the need of a sealing step. Non‐cross linked polymer can be
washed away after chip preparation. The fabrication process is illustrated in Figure 2b.
The largest advantages of directly incorporating membranes are the simplicity of the process
and the wide choice of membrane materials and morphologies. Based on a certain application the
most suitable membrane can be directly selected. If not commercially available it can be prepared in
the lab, or obtained from other research groups. An additional advantage is the flexibility of
configuration. With a standardized ‘clamp‐and‐play’ chip design, many different applications can be
targeted, simply by changing the type of membrane.
Membrane preparation as part of the chip fabrication process
A second approach to integrate membrane functionality is to prepare the membrane during the
fabrication process of the chip. In this case the toolbox of the semiconductor industry can be used.
Examples are presented in Figure 3.
Figure 3: Membrane features introduced during chip fabrication using clean room technology: a) free‐standing layers of porous silicon, prepared by electrochemical etching followed by under etching of the bulk silicon beneath (reprinted with permission from [62], © 2000 IEEE); b) sputtered dense Pd membrane on a microsieve support structure prepared by back etching (reprinted with permission from [56], © 2004 Elsevier ); c) close‐up of a polyimide chip with pores fabricated by ion beam track technology (reprinted with permission from [69], © Institute of Physics Publishing)
According to a recent review of Eijkel and Van den Berg, nanotechnology is at a level that any
structure can be tailor‐made, enabling the integration of membranes with very specific properties
[106]. Many fabrication methods can be applied, e.g. etching for the preparation of microsieves [53]

Chapter 2
18
and thin metallic film deposition [54‐57]. Also porous layers can be fabricated, from materials such
as zeolite [58‐61], silicon [62‐64], silica [65, 66, 68], alumina [64, 67, 68], or titania [68]. These and
other methods are discussed into more detail in the book of Van Rijn about nano and micro
engineered membrane technology [107]. Major advantages of clean room technologies include a)
the immense knowledge already available in this field; b) good control over feature sizes, down to
tens of nanometers; c) chemical/thermal resistance of used materials and d) sealing of the
membrane. In fact the last issue is in many cases avoided, since the membrane is directly made in‐ or
on the wafer. Disadvantages of semi conductor technologies in general are the complexity of the
production process and, related to this, the high price. Especially for single‐use applications the high
price can form an insuperable problem.
Recently, also combinations of semiconductor technology with polymer technologies have been
reported, and even new methods that do not require clean room facilities anymore. Metz et al. used
ion beam track etch technology to create pores in poly imide chips [69]. Moore and co‐workers
prepared a bio anode for a microchip fuel cell based on a membrane with immobilized alcohol
dehydrogenase [72]. In their process, an electrode was covered by a PDMS channel that was filled
with a Nafion suspension containing the enzyme. The membrane was formed by evaporation of the
solvent through the PDMS. Russo et al. prepared membranes on pre‐etched microsieves by casting
a thin layer of cellulose acetate solution, that was phase separated afterwards upon contact with
water [70, 71]. By varying the process conditions they could obtain different values for permeability
and MWCO. Since phase separation is a standard procedure in membrane technology, and very well
documented, their approach may lead to the implementation of a wide range of membrane
materials and morphologies. A key factor for success will then be the adhesion strength between the
silicon structure and the membrane, during preparation, drying and operation of the membrane.
Woolley and co‐workers prepared ion‐permeable membranes by photo polymerization of a
hydrogel in a cavity that was created in a polymer sheet [73, 74]. They reported two possibilities to
interface the membrane with a microfluidic channel. The first option was to thread a thin wire
through capillaries that would be used for connections later on. After polymerization, the wire could
be withdrawn from the membrane, leaving a round channel [73]. The dimensions of this channel
were limited by the minimum diameter of the wire. The second method was to position the cavity
above a microfluidic channel filled with a phase‐changing sacrificial material [74]. After
polymerization, this material was removed by melting. This method allowed for smaller channels
dimensions. Furthermore, it enables the use of specific channel geometries.
In situ preparation of membranes
A third integration approach is to start with a microfluidic chip and fabricate a membrane in situ, as

Membranes and microfluidics
19
illustrated in Figure 4. Moorthy and Beebe prepared porous membranes in microfluidic channels by
emulsion photo polymerization [75]. Song et al. used a laser to induce phase separation
polymerization with acrylate monomers in fused silica chips [76, 77]. This principle offers the
interesting opportunity to control the position and thickness of the membrane, simply by controlling
the position of exposure. Non‐polymerized monomers can be washed out afterwards. The MWCO of
produced membranes can be changed by varying the ratio between monomer and cross linking
agent, as is illustrated in Figure 4b. An additional advantage of this method is its application in
existing chip formats (provided that the used chip material is transparent to UV light). Disadvantages
include complexity and the limited range of materials that can be applied. Furthermore, tailoring of
membranes towards a certain retention or MWCO has to be done by trial and error experiments
based on an educated guess.
Figure 4: Membranes prepared inside fabricated microfluidic devices: a) heptane stream between water flows acting as a liquid membrane (reprinted from [80]); b) membranes formed between pillars by laser induced phase separation of acrylate monomers. The MWCO of the membranes can be varied by changing the monomer/crosslinker ratio (left: low, right: high) (reprinted from [77]); c) membrane formed by a polycondensation reaction at the interface of an organic and aqueous flow (reprinted from [78]); d) schematic of a lipid bilayer membrane, formed by self organization (reprinted from [82]). All images are reprinted with permission, © American Chemical Society

Chapter 2
20
The group of Kitamori has demonstrated the fabrication of membranes by interfacial polymerization
[78]. In this case, an organic and aqueous solution are joined, both containing a certain monomer,
e.g. an acid chloride and an amine. These two monomers can react via a poly condensation reaction
at the interface and form a thin polyamide membrane. Figure 4b illustrates membranes produced by
this method. By alternating water and oil phases, multiple membranes can be prepared next to each
other. However, to obtain defect‐free membranes, a well defined interface is required. Although
flows in microfluidic devices are laminar, this requirement poses a challenge for oil/water based
systems. Preferential wetting of one phase easily results in droplet formation. Either the channel
shape has to be modified, or selective coating of channels walls is needed.
All membranes discussed so far are based on solid materials. However, a liquid can also act as a
membrane (so‐called liquid membranes). In this area the fields of extraction and membrane
technology are combined. A stable three‐layer flow of immiscible fluids is required, where the
middle layer is used for the separation. Examples are systems of water/cyclohexane/water [79],
water/m‐xylene/water [2] and water/n‐heptane/water [80]. In contrast to the membranes discussed
above, the membrane is in this case a dynamic layer. Separation of components is based on a
difference in solubility in the liquid membrane phase. This solubility can be enhanced dramatically by
the addition of carrier molecules, leading to very high selectivities. Another big advantage of liquid
membranes is the ability to simultaneously operate in forward and backward extraction mode: in a
single step components can be removed while others are added. Disadvantages include the difficulty
to obtain a stable interface (as mentioned above), low extraction efficiencies and the limited
knowledge available in this field: stable three layer flow is impossible on the macro‐scale and liquid
membranes can only be formed by either using porous supports or by making double emulsions
followed by an additional separation step.
Finally, a special class of liquid membranes can be prepared in a chip: the so‐called artificial lipid
bilayers, schematically depicted in Figure 4d [81, 82]. These structures mimic cell walls and can be
prepared by contacting lipid solutions with buffers. Artificial lipid bilayers can be used for the study
of transport mechanisms of components in and out of cells.
Use of membrane properties of chip material
The last method for integration of membrane features on‐chip is to choose a chip material that has
the required membrane properties itself. This method is simple but elegant, since no additional
fabrication steps are required. Examples are presented in Figure 5.

Membranes and microfluidics
21
Figure 5: Microfluidic chips in which the membrane characteristics of the bulk chip material are exploited: a) PDMS‐based bioreactor with integrated oxygenation chamber (reprinted with permission from [86], © 2004 American Chemical Society); b) cross section of a porous chip produced by phase separation micromolding. Gasses can be supplied from one channel to the other through the porous matrix (reprinted from [103], © The Royal Society of Chemistry)
A material that has been exploited in microfluidics for its high gas permeability is poly
dimethylsiloxane (PDMS) [83‐98]. Although PDMS is relatively new to the microfluidic community, it
is used for over 20 years in membrane technology, and a lot of knowledge is readily available.
Therefore we will return to PDMS later on in this article and use it as an example to indicate the
importance of bridging scientific fields.
Besides PDMS also other polymeric materials can be used, such as poly imides. Although the gas
permeability of poly imide is much lower than the value for PDMS, this may be compensated by a
lower thickness of the layer through which permeation occurs. Eijkel et al. made nanochannels in a
photo patternable poly imide layer with a 2.3 micron thick polyimide ‘roof’ [99]. Su and Lin prepared
dense cellulose acetate membranes that enabled transport of water into a micro actuator [100,
101]. Cabodi and co‐workers developed microfluidic chips out of a calcium alginate based hydrogel
[102]. They showed that a fluorescent dextran could be both delivered into ‐ and extracted from ‐
the gel matrix. By fitting mass transfer models to their data, they determined values for diffusivity in
the gel that are close to those in free solution.
In our group, completely porous chips have been prepared by adapting the phase separation
method that is used to fabricate membranes on a large scale. When a polymer solutions is phase
separated on a microstructured mold, a membrane is formed with an inverse replication of the mold
features [108, 109]. Using rigs on a mold, we have been able to produce membranes with channel
networks in the lateral direction [103‐105]. The morphology of these ‘membrane chips’ can be tuned

Chapter 2
22
by controlling the parameters of the phase separation process and by changing the composition of
the polymer solution. The channel walls can have pores in the range of a few microns down to
nanometers, or even have dense skin layers. The phase separation micromolding technique (PSμM)
is applicable for many different polymers, since the only requirement is to find a solvent/non‐solvent
system. Besides polymeric structures, also ceramic or metallic structures can be prepared, by adding
powders to the starting solution and performing a pyrolysis/sintering step afterwards.
2.3.2. WHICH APPLICATIONS EXPLOIT INTEGRATED MEMBRANE FUNCTIONALITY?
Although the use of membranes in microfluidics is spreading across many fields, most applications
are found in analytical chemistry. Since analytical equipment is often sensitive to sample
composition, in most cases samples cannot be directly analyzed and need a pre‐treatment. This may
include selective removal of large components, impurities and dust on one side and low molecular
weight components such as salts on the other. Furthermore, in many cases the concentration of the
components of interest is below the detection limit of the analysis equipment. In such cases,
removal of solvent is necessary. Membranes are very suitable for these operations. Next to
analytical applications, also new fields emerge in which membranes are used, such as cell‐based
studies, micro reaction technology and fuel cells.
In the following section examples will be given of both traditional and new applications of
membranes in microfluidics. The aim is to show the versatility of membranes in microfluidics
without discussion in much detail. More in‐dept knowledge can be found in the following reviews:
The use of membranes in analytical chemistry has been described in a comprehensive review of
Moskvin and Nikitina [110]. Wang et al. have written a review specifically aimed at polymeric
membranes in bioanalytical applications [111]. Lichtenberg and co‐workers have discussed
membrane‐based sample pre‐treatment and made a comparison with alternatives such as
electrophoresis or extraction [112]. Peterson has discussed solid supports in micro analytical
processes, comparing beads, gels and monoliths with membranes [113]. Erickson and Li took an
even more general approach in their review about ‘integrated microfluidic devices’, describing all
kinds of unit operations, including membranes [1].
Sample Concentration
Eijkel et al. prepared a 2.3 micron thick polyimide membrane with 500nm high nanochannels by
spinning and thin film deposition [99]. Water could be removed from the channels in two ways:
either by evaporation or by osmosis. In the case of osmosis, a solution with high salt concentration
was placed on top of the membrane. Due to osmotic pressure and the impermeability of polyimide

Membranes and microfluidics
23
for salts, water was transported through the membrane. Next to concentration, the removal of
water from a channel was also mentioned as an effective means to obtain passive pumping. By
fabricating a reservoir with a high surface to volume ratio at the end of a channel, evaporation will
lead to an effective flow from the channel to the reservoir. Timmer and co‐workers applied a
nitrogen flow over a microchannel covered with a hydrophobic Teflon membrane, to concentrate
the solution in the channel by evaporation [19]. A threefold concentration increase was reported.
Ikuta et al. describe a micro concentrator that is based on an ultrafiltration membrane, operated in
dead‐end mode [52]. In time, the signal increases due to a concentrating effect, making the device
suitable for the detection of trace elements. The same principle is also applicable to detect bacterial
cells or spores, eliminating the need for culturing of bacterial colonies and expensive ELISA tests [7].
Jiang et al. combined two membranes in a PDMS chip for drug screening and residue analysis [16]. In
their tests they examined a mixture of aflatoxins and an antibody that specifically binds to a certain
type of aflatoxin. The first membrane was used in dialysis mode for removal of the unbound
aflatoxins, while the second was used for evaporation of water. In this way, the concentration could
be dramatically increased. In the same article the authors also propose a batch process for
barbiturate detection. For this purpose a single ultrafiltration membrane in dead‐end operation was
sufficient. Using a similar complexation reaction with an antibody, a desired barbiturate could be
retained on the membrane. Subsequently, the complex could be dissociated with a buffer and eluted
through the membrane. A concentration increase of 50 times was achieved. A different approach to
obtain very high concentration factors is by applying electric fields, using the principle of
electrophoretic mobility. Molecules can be focused in bands at the location where their
electrophoretic migration velocity matches the applied hydrodynamic flow velocity. These highly
concentrated bands can be collected afterwards. Also in this application membranes have proven
useful. The group of Kirby prepared a nanoporous membrane by photo polymerization of acrylates
in a channel [76]. Proteins were retained by the membrane, while buffer ions were allowed to pass,
leading to concentration factors between 2 and 4. Ramsey’s group achieved even higher
concentration factors for proteins and DNA in a similar system based on porous silica membranes
[65, 66]. Signal enhancements up to two orders in magnitude were reported. In both cases the
electric field gradient was over the membrane. Another possibility is to apply an electric field
gradient in the separation channel itself, by gradually decreasing the buffer conductivity. This
decrease can be achieved by means of dialysis. A dialysis fluid induces a salt concentration gradient,
while proteins and other large molecules are retained in the separation channel by the dialysis
membrane [10, 29, 50]. Related to this application, but using a different working principle, is the
work of Woolley and co‐workers [73, 74]. They applied an ion conducting membrane of increasing
width to create the electric field gradient. The permeability of the polymeric material was in this
case exploited for the supply of new buffer ions from a reservoir to the separation channel, to avoid
depletion in the separation channel. Concentration factors up to 10000 were demonstrated. An

Chapter 2
24
additional advantage of electrophoretic concentration in a field gradient is that the process can be
simultaneously used for separation, based on differences in electrophoretic mobility of species.
Sample filtration
In filtration, porous membranes are applied as barriers and transport occurs by a pressure
difference. Fluids can pass the membrane, while fragments larger than the pore size are retained. In
most cases a dead‐end configuration is applied, because of practical reasons. Membrane filtration
on‐chip is used for separation of cells from whole blood [34, 75], removal of dust or aggregates [7]
and removal of solutes such as proteins [71]. Instead of separation defined by pore size, Lion et al.
exploited the adsorption capacity of PVDF membranes as a means for desalination [25]. In the first
step, a sample solution was filtrated through the membrane. The sample fluid and present salts
were not retained, while drugs, proteins and peptides adsorbed on the internal surface. Desorption
of these components was achieved by flushing the membrane with an elution buffer.
Sample preparation by microdialysis and other liquid‐liquid contacting applications
Membranes can be used as selective barriers between fluid flows in extraction applications, the
most known example being microdialysis. In this application, a dialysis fluid is used to remove
solutes from a sample solution. The driving force is a difference in activity, and separation is
determined by the MWCO of the membrane and differences in diffusion coefficients of components.
Kurita et al. applied a cellulose dialysis membrane between two acrylic plates to directly analyze
lactate concentration in dog whole blood [35]. Xu and co‐workers used a dialysis membrane
between serpentine channels to desalt DNA and protein samples before electrospray ionization
mass spectroscopy (ESI‐MS) [9]. Wu and Pawliszyn used a dialysis hollow fiber membrane to remove
salts from protein solutions prior to capillary isoelectric focusing (CIEF)[47]. Lamoree et al. applied a
cellulose ester based device after CIEF for the online removal of ampholytes that were added for the
CIEF step. In this way, the signal of subsequent ESI‐MS could be greatly improved [11, 46]. Using dual
microdialysis even a double separation step can be integrated [12]. The first dialysis membrane has a
high MWCO in order to remove large components from the sample. The second membrane has a
low MWCO and is used to desalt the sample. Song et al. used dialysis membranes prepared by photo
polymerization to separate salts from proteins, and to separate protein fractions based on size [77].
Torto et al. have examined the performance of many different hollow fiber membranes for
microdialysis sampling of olichosacharides [48]. Hsieh and Zahn prepared a microdialysis device for
fast glucose recovery, which is needed in glucose sensors [30]. Also for pH and pCO2 detection,
miniaturized dialysis devices can be applied [51].

Membranes and microfluidics
25
Instead of the aqueous solutions used in dialysis, organic streams can be used as well. Gao et al.
used a membrane junction based on a polysulfone hollow fiber to acidify a peptide solution and
simultaneously increase organic solvent content by adding methanol. Protonation and ionization
efficiency of the peptides before ESI‐MS could be enhanced significantly [41]. Cai and co‐workers
directly applied a microporous hydrophobic PTFE membrane between microfluidic glass substrates
as a contactor to obtain a stable interface between water and an organic phase (isobutanol) [36].
The chip was used for extraction of a model compound, butyl rhodamine B.
Next to size exclusion (based on the MWCO of a membrane), also a difference in affinity can be
used to obtain a separation. Wang and co‐workers adsorbed BSA on hydrophobic PVDF membranes
in order to obtain high resolution in the chiral separation of racemic mixtures [44].
As discussed in the previous paragraph, liquids themselves can also be used as a membrane.
Surmeian demonstrated a water/cyclohexane/water system, in which methyl red could be rapidly
extracted from the donor to the acceptor phase [79]. The equilibrium time was reported to be in the
range of seconds, compared to tens of minutes in conventional equipment. Maruyama et al. used a
water/heptane/water system to selectively remove Yttrium ions from a Y3+/Zn2+ solution [80]. An
extraction ratio of about 40% could be achieved within seconds. To avoid stability problems in three
phase flow systems, Wang and co‐workers used a supported liquid membrane [45]. For this purpose,
a membrane was soaked in an extraction liquid and clamped between microfluidic channels. The
feasibility of the system was demonstrated by showing enrichment factors of halo acetic acids in
water up to 65. Ismagilov and co‐workers applied single and double membranes between crossing
channels as fluid‐fluid diffusional contacts [15]. Due to the resistance of the membrane, convective
transport was avoided. The concept of diffusional contacts was reported to be feasible as a general
tool in detection.
Gateable interconnects with external control
In the applications discussed so far, transport has been governed by the membrane material and/or
morphology. Sweedler and co‐workers have demonstrated that the pores of membranes can be
used as gateable interconnects that allow for external control over separation characteristics [20‐24,
38]. They incorporated flat track‐etched membranes with nanosized pores between microfluidic
channels. Transport of components in‐ and out of the channels could be controlled by the applied
bias, polarity and density of the immobile surface charge of the membrane. The authors used their
device for sample injection and fraction collection of attomolar quantities. Schmuhl et al. applied
mesoporous and microporous oxide layers as ion‐selective electrophoretic gates in microfluidic
devices [68]. Fickian diffusion of charged and uncharged species was suppressed by the
interconnects, opening the possibility for use as dosing valves or sensors. Selective ion transport

Chapter 2
26
occurred when there was an overlap of the electric double layers in the pores of these membranes,
which could be achieved by a proper choice of pH and electrolyte concentration. Astorga‐Wells et al.
applied conductive fiber junctions made of cation exchange membranes between tubing for the
desalination of protein samples before MALDI‐MS [49]. Proteins and peptides could be retained by
means of an electric field, followed by exchange of the original solution for a solvent suitable for
mass spectrometry.
Gas sensors and other gas‐related applications
Many gas sensors are based on the absorption of gas in an analysis liquid. For this purpose,
membranes can serve as efficient gas‐liquid contactors. PDMS is very well suited material, due to its
high permeability for gasses and vapors. Different groups have used PDMS in oxygen sensors [91, 94,
95] or CO2 sensors [97]. Toda et al. prepared a PDMS membrane of only 7 micron in a micro scrubber
for the continuous detection of H2S traces [87]. The same group also used a porous PTFE membrane
in a PDMS device with honeycomb structures for measurement of H2S and SO2 [32]. In an earlier
publication, several membranes were compared for use in a hybrid microfabricated device for field
measurement of atmospheric SO2 [18].
Next to gas‐liquid contacting, membranes can also be used to remove gas from a channel. The
group of Van den Berg has presented a miniaturized gas sampler for ammonia detection, in which
sample gas is introduced together with an absorption liquid [27]. Excess gas is in this case easily
removed through an incorporated microporous Teflon membrane by pressure generated in the chip.
The adsorption liquid stays in the channel because of the hydrophobic nature of Teflon. Liu and co‐
workers used this principle in PCR chips to avoid problems with filling [17]. Meng et al. fabricated a
micro degassing plate, based on a hydrophobic polypropylene membrane [37]. They showed that
CO2 bubbles that were formed during a reaction in the chip could be effectively removed.
Membrane microreactors
The standard procedure of making a product in chemical engineering used to consist of a reaction
step followed by separation. These operations might be easily integrated on chip. Reaction yields
and selectivity may be pushed to 100% by selectively removing components, thereby shifting the
reaction equilibrium in favor of the end‐product. Although this concept is relatively new in
microfluidics, already quite some examples can be found. Most of them are related to hydrogen and
based on thin foils of noble metals. Cui et al. describe a membrane reactor for the dehydrogenation
of cyclohexane to benzene at 200°C [54]. Hydrogen produced during the reaction is selectively
removed through a 4 micron thick folded Pd film. Karnik and co‐workers used a similar membrane to

Membranes and microfluidics
27
remove hydrogen from a water gas shift reaction [55]. In their microreactor, methanol reacted with
water at 200°C. The palladium membrane was prepared on top of a copper perforated structure,
which acted as a catalyst for the reaction. The group of Yeung worked on the incorporation of
freestanding zeolite membranes in silicon chips [58‐61]. Zeolites have a very well defined pore
network and are therefore extremely effective in separation. Furthermore, they can be easily
functionalized with metal catalysts. The authors report that the equilibrium state in Knoevenagel
condensation reactions can be shifted to higher conversion and better product purity by the
selective removal of water.
Instead of separating reaction products, membranes can also be used for transport of reagents
into a reaction chamber. The advantage of such a system is the ability to supply a reagent in a
controllable way at exactly the position where it is required, for example near a catalyst. As a
consequence, the premixing step that is normally required can be omitted. Furthermore, reactions
can be easily quenched by stopping supply of a reagent, preventing the formation of unwanted by‐
products elsewhere in the system. Hisamoto et al. prepared nylon membranes that were used to
provide hydrogen peroxide for an enzymatic conversion [78]. The enzyme itself was immobilized on
the membrane. Our group has recently demonstrated the formation of carbonic acid in porous
PMMA chips by CO2 absorption [103]. The CO2 was provided through the porous structure of the
chip. Mitrovski and co‐workers present a H2‐O2 fuel cell based on diffusion of both gasses through a
PDMS layer to the cathode and anode, respectively [92, 93]. They report minor problems with cross‐
over of both reagents. Shah et al. Chan et al. made a micro fuel cell where hydrogen was supplied
through a PDMS array of microchannels, enclosed by a proton conducting Nafion membrane [28].
The other side of the membrane directly faced air for the supply of oxygen. Using this approach,
cross‐over problems could be largely avoided. Water produced in the reaction was used to keep the
membrane humidified. Chan and co‐workers reported the fabrication of a similar device out of
PMMA [31].
Porous membranes can also be used for their large internal surface. An example is the
impregnation of membranes with a catalyst, in order to obtain high conversion rates. This concept
has been proven to work for on‐line protein digestion, catalyzed by trypsin adsorbed in a PVDF
microfiltration membrane. Both a dead‐end capillary configuration [42] and a microfluidic PDMS chip
[41, 43] have been described. Moore et al. fabricated a microchip‐based ethanol/oxygen biofuel cell,
by coating Nafion membranes with alcohol dehydrogenase on the carbon anode [72]. Kim et al.
used functionalized membrane pads for the quantitative analysis of cholesterol and high density
lipoproteins (HDL) in blood. First, a separation pad was prepared by treating an anion exchange
membrane with BSA, dextran sulphate and MgCl2 in order to separate HDL from other lipoproteins,
either by precipitation or a difference in charge. The second pad consisted of a glass microfiber
membrane that was impregnated with enzymes and detergents. These components could open the
Chapter 2
28
lipid particles and react with cholesterol/HDL to give a colored reaction product. Since all membrane
pads were used in a dried state, the capillary pressure of the membrane pores could be used for
passive pumping, eliminating the need for external pumping equipment.
Cell related studies
Microfluidic devices provide a general platform for cell culturing experiments. Membranes can act as
porous supports for the cells in such systems, enabling the supply of nutrients and removal of waste
products. Russo et al. prepared porous cellulose acetate membranes on a silicon chip and
demonstrated the possibility to culture lung fibroblasts [70]. Ostrovidov and co‐workers reported on
perfusion of hepatocyte cultures in two types of micro bioreactors, either based on a PDMS or a
commercial polyester membrane [89]. In operation, no large differences were found, but both
systems performed better than static cultures in dishes. Although the PDMS chip has in these cases
been chosen because of its ease of production, it can also be used for its high gas permeability.
Several authors have reported on this principle, mostly for the transport of oxygen and carbon
dioxide in cell bioreactors. Leclerc et al. cultured hepatocyte cells in a PDMS chip [85, 86]. Walker
and co‐workers used a similar device for culturing of ovary cells [96]. Wu et al. have presented a
PDMS based Clark oxygen cell for the supply and direct study of oxygen consumption by E. Coli
bacteria [94]. Zanzotto and co‐workers prepared a PDMS bioreactor, where a 100 micron thick layer
was used for aeration [84]. They provided data for oxygen transport through PDMS and
experimentally determined the oxygen uptake.
A step further than cell culturing is to study the reaction of cells to different environments and
stimuli. Papenburg et al. prepared porous scaffolds with integrated channel structures and
demonstrated alignment of cells to the constrained geometry [105]. The group of Offenhäuser
fabricated silicon‐supported nanoporous membranes on which they cultured neuronal cells. Their
system was used to facilitate control of the biochemical environment of neuronal networks with
cellular resolution. Hediger et al. clamped a 0.4 micron polycarbonate membrane in a PDMS device
to perform electrical characterization of epithelial cell layers [13, 14]. A big advantage of their
system is that the membrane can be easily removed, analyzed and/or replaced. Tokuyama et al.
described a PDMS chip where a nitrocellulose membrane was integrated to retain cells [33]. In their
chip, the response of rat mast cells to histamine could be examined. Other authors have integrated
membranes as flow restrictors in PDMS chips for the generation of flowless concentration gradients
[40] generators for the study of chemotaxis
Biological cells themselves have walls that also show membrane characteristics. These walls
consist of lipid bilayers and membrane proteins that can regulate transport of species such as ions,
glucose, drugs and aminoacids. Different groups have prepared artificial lipid bilayers in PMMA

Membranes and microfluidics
29
microfluidic chips [81, 82]. Membrane proteins are simply build‐in by diffusion, and transport can be
measured by channel currents.
Various
In mass spectroscopy, electrospray ionization tips are used to create a Taylor cone. A problem
encountered in these tips is lateral dispersion of the cone, leading to a decreased signal‐to‐noise
ratio. Wang et al. applied a 50 μm thick hydrophobic PTFE membrane with pores of 0.22 μm at the
end of a poly carbonate (PC) tip [26]. According to the authors, the pores of the membrane can be
perceived as a dense array of nanoscale ESI tips. The new hybrid tip resulted in stable and reliable
Taylor cones at very low flow rates and a large improvement in signal. Su et al. have demonstrated
an effective water‐powered micro actuator, based on osmosis [100]. A salt solution is enclosed in a
compartment with dense walls, impermeable for the ions but permeable for water. Due to the high
activity of the solution, water is transported into the compartment. The volume increase is used to
deform a flexible actuation diaphragm. In a later article they show that the deformation can be used
in a micro drug delivery system [101].
Another practical application of membranes can be found in the improvement of the stability in
applications based on electro‐osmotic flow (EOF). The EOF can be directly related to the zeta
potential of the immobile phase, which can strongly depend on pH. Since the electric fields applied
in EOF surpass the water splitting potentials, reactions at the anode and cathode lead to the
formation of acids and bases. Buffers can be used to delay changes in pH, but at a certain point in
time the EOF will drop. Brask et al. have demonstrated that this time can be extended by placing
anion exchange membranes between pumping compartment and the electrodes [114]. Since this
type of membranes is not permeable for positively charged ions, H+ ions are rejected and the pump
can be operated for hours after the buffer has depleted.

Chapter 2
30
2.4. BRIDGE BETWEEN MEMBRANE TECHNOLOGY AND MICROFLUIDICS: THE CASE OF PDMS
Master replication by PDMS crosslinking has revolutionized microfluidic research. The opportunities
that PDMS offers have been reviewed by the group of Whitesides [115‐118]. The fabrication process
is both simple and cheap and can be performed outside a clean room. Resulting films are
transparent, flexible and biocompatible. Sealing of chips is very straightforward and in many cases
reversible. Furthermore, valves and pumps can be easily integrated [119]. PDMS also has very
interesting properties as a membrane material, and these properties have been utilized for a long
time in membrane technology practice. For example, PDMS coatings are applied on a large scale in
solvent resistant nanofiltration to separate low molecular weight components from organic solvents
such as toluene [120]. Another application can be found in pervaporation, for instance in the
removal of VOC‐components from aqueous streams [3]. Finally, PDMS coatings are applied to plug
defects in gas separation membranes [121]. In all these examples, the high permeability of PDMS is
exploited. Not surprising, this property has been extensively investigated and much knowledge is
readily available (e.g. [122, 123]. Table 2 summarizes permeability and calculated selectivity data
from membrane literature for gasses/vapors that seem directly relevant to microfluidics at this
moment. Data in brackets represent data for polyimide, a typical glassy polymer, to illustrate the
high permeability of PDMS.
Table 2: Permeability and selectivity data of different gasses and vapors in PDMS a (adapted from [124])
Gas/vapor Permeability b
[barrer] c
Ideal Selectivity
Over N2 [‐]
N2 280 (0.6) ‐
O2 600 (3.0) ~ 2
CO2 3.200 (13) ~ 12
H2O 23.000 ~ 80
Ethanol 45.000 ~ 160
Chloroform 283.000 ~ 1000
Toluene 1.460.000 ~ 5200
a PDMS RTV 615, measured at 40°C b Numbers in brackets represent data for a typical glassy polymer to illustrate the high permeability of PDMS (polyimide, Ube Industry, measured at 60°C [6]) c 1 barrer = 1∙10‐10 cm3(STP)∙cm∙cm‐2∙s‐1∙cmHg‐1

Membranes and microfluidics
31
A critical note has to be placed in interpreting the presented permeability data. First, as
mentioned in the background session, permeability is a strongly material dependant property. For
PDMS, this means that the value may vary for different types of prepolymer solution and crosslinking
agent, and the chosen ratio. Secondly, data is also strongly temperature dependent, as was
demonstrated by Hagg [125]. Finally, when using mixed gasses such as air, competition between
species can lead to strong deviations from the pure gas permeabilities. Merkel et al. have extensively
determined permeability, solubility and diffusion data for a wide range of gasses in PDMS, including
fluorinated gasses [126] . In their article also theory, fundamental mechanisms and trends are
reported, making it a suitable starting point for any researcher using PDMS for gas or vapor
transport.
Since the flux of gasses and vapors is inversely proportional to the membrane thickness,
researchers have strived to minimization, only limited by the low mechanical strength of very thin
PDMS films. At this moment, the smallest reported value for free‐standing PDMS membranes is 7
micron [87]. In common membrane technology practice, the mechanical stability issue is avoided by
using porous supports. PDMS prepolymer solutions are diluted with a solvent, typically hexane, and
coated on the support. This approach enables PDMS layers in the sub‐micron range. However, as
Zanzotto et al. concluded, it is important to know which step in the system presents the major
resistance to mass transfer [84]. For PDMS bioreactors, they found that the uptake of oxygen was
limited by absorption in the culture medium rather than diffusion through the membrane. In such
case, a reduction in membrane thickness, which complicates the production process, is not
necessary.
In microfluidic literature, the high permeability of PDMS is mostly exploited for supply of oxygen
or removal of carbon dioxide, especially in cell related experiments. However, as is visible in Table 2,
permeability for water vapor is even 1‐2 orders in magnitude higher. Several authors have pointed
out that evaporation of water can therefore form a serious issue that should be taken into account.
Verneuil et al. demonstrated that the permeation of water through PDMS films can lead to flow
velocities in the channels up to 20 μm/s, depending on channel geometry [88]. Especially in PCR
reactions, where samples are heated for long times, the evaporation may lead to deviations. Randall
and Doyle performed experiments using latex beads, and obtained even higher flow velocities in
microfluidic channels, up to 100 μm/s [83]. They report their method to be suitable for passive
pumping, concentration of chemical species or controlled stacking of microbeads. Zheng and co‐
workers used the permeability of PDMS for the study of protein crystallization [90]. They prepared
water‐in‐oil emulsions in microfluidic channels and induced crystallization by water removal by
evaporation through the PDMS matrix. Leng et al. proposed this ‘crystallization by evaporation’
principle for kinetic exploration of phase diagrams [98]. Several solutions are available for cases
where permeation of water is unwanted. First, the complete chips can be submerged in water,

Chapter 2
32
thereby eliminating the driving force for permeation [83]. This solution is also applied in other
groups [90, 96]. Another possibility, is to work in a closed chamber with high humidity [84].
However, one should be careful when working with concentrated solutions in the chip, since osmotic
pressure effects can lead to transport of water into the chip. Finally, since the evaporation is directly
related to the diffusion distance, one could make very thick chips.
Another difficulty with PDMS is the swelling behavior in organic solvents, and related to this,
high permeability for organic vapors. The values for some typical solvents have also been included in
Table 2. Data for the compatibility of PDMS with a wide range of solvents can be found elsewhere
[127]. The combination of swelling and high permeability makes PDMS chips less suitable for e.g.
organic synthesis, unless the material is chemically or physically modified. Bennett et al. have
published a thorough study on modification of PDMS with a wide range of functionalized groups and
its consequences for permeability [128]. Although the incentive for their research was to increase
solvent permeability, the presented data can also be used to find the functional groups that reduce
swelling and permeability. In their article they also review physical modifications, such as the
addition of fluorinated copolymers or zeolite powders. The last mentioned material causes a
decrease in water sorption and an increase in effective path length, leading to much lower water
evaporation rates. Instead of modifying PDMS, another option is to search for new crosslinkable
polymers with lower swelling degree. Rolland and co‐workers developed a photo curable “liquid
teflon” material that can be used to fabricate chips suitable for organic synthesis [129]. Such
material development within the field of microfluidics may also have its impact on macro scale
membrane technology, where swelling issues lead to decreased membrane selectivity.
2.5. SUMMARY
In this chapter, an overview has been provided of the methods for integration of membrane
technology in microfluidic devices, and of the typical applications in which such membrane
functionality is exploited. The general use of membranes can be found in separation and phase
contacting applications, mostly for analytical purposes. Also the internal surface can be exploited for
catalysis or adsorption. Furthermore, membranes can act as a support for cell culturing experiments,
where the membrane features can be used to supply nutrients and remove waste products. Clear
benefits of membranes include the ease of integration, especially when using a ‘clamp‐and‐play’
type of devices. Combined with the enormous variety of materials, morphologies and fabrication
methods to choose from, devices can be readily tailored to very specific applications. Main
conclusion that can be drawn is that the bond between both fields is vivid and getting stronger every
day, which is illustrated by the substantial growth of publications over the last 10 years.
Membranes and microfluidics
33
2.6. CITED LITERATURE 1. D. Erickson and D. Li, Anal. Chim. Acta, 2004, 507, 11‐26. 2. K. Sato, A. Hibara, M. Tokeshi, H. Hisamoto, and T. Kitamori, Adv. Drug Delivery Rev., 2003, 55, 379. 3. J.G. Wijmans and R.W. Baker, J. Membr. Sci, 1995, 107, 1. 4. A. Mehta and A.L. Zydney, J. Membr. Sci, 2005, 249, 245‐249. 5. M.H.V. Mulder, Basic Principles of Membrane Technology. 2nd ed. 2000, Dordrecht, The Netherlands:
Kluwer Academic Publishers. 6. R.W. Baker, Membrane technology and applications. 2nd ed. 2004, Chichester, England: John Wiley. 7. P.N. Floriano, N. Christodoulides, D. Romanovicz, B. Bernard, G.W. Simmons, M. Cavell, and J.T.
McDevitt, Biosens. Bioelectron., 2005, 20, 2079‐2088. 8. M. Ulbricht, Polymer, 2006, 47, 2217‐2262. 9. N. Xu, Y. Lin, S.A. Hofstadler, D. Matson, C.J. Call, and R.D. Smith, Anal. Chem., 1998, 70, 3553‐3556. 10. R.D. Greenlee and C.F. Ivory, Biotechnol. Prog., 1998, 14, 300‐309. 11. M.H. Lamoree, R.A.M. Van der Hoeven, U.R. Tjaden, and J. Van der Greef, J. Mass Spectro., 1998, 33,
453‐460. 12. F. Xiang, Y. Lin, J. Wen, D.W. Matson, and R.D. Smith, Anal. Chem., 1999, 71, 1485‐1490. 13. S. Hediger, J. Fontannaz, A. Sayah, W. Hunziker, and M.A.M. Gijs, Sens. Act. B, 2000, 63, 63‐73. 14. S. Hediger, A. Sayah, J.D. Horisberger, and M.A.M. Gijs, Biosens. Bioelectron., 2001, 16, 689. 15. R.F. Ismagilov, J.M.K. Ng, P.A. Kenis, and G.M. Whitesides, Anal. Chem., 2001, 73, 5207‐5213. 16. Y. Jiang, P.C. Wang, L.E. Locascio, and C.S. Lee, Anal. Chem., 2001, 73, 2048‐2053. 17. Y. Liu, C.B. Rauch, R.L. Stevens, R. Lenigk, J. Yang, D.B. Rhine, and P. Grodzinski, Anal. Chem., 2002, 74,
3063‐3070. 18. S.I. Ohira, K. Toda, S.I. Ikebe, and P.K. Dasgupta, Anal. Chem., 2002, 74, 5890‐5896. 19. B.H. Timmer, K.M. Van Delft, W. Olthuis, P. Bergveld, and A. Van den Berg, Sens. Act. B, 2003, 91, 342‐
346. 20. T.C. Kuo, D.M. Cannon, Y. Chen, J.J. Tulock, M.A. Shannon, J.V. Sweedler, and P.W. Bohn, Anal. Chem.,
2003, 75, 1861‐1867. 21. D.M. Cannon Jr., T.C. Kuo, P.W. Bohn, and J.V. Sweedler, Anal. Chem., 2003, 75, 2224‐2230. 22. J.J. Tulock, M.A. Shannon, P.W. Bohn, and J.V. Sweedler, Anal. Chem., 2004, 76, 6419‐6425. 23. J.M. Iannacone, J.A. Jakubowski, P.W. Bohn, and J.V. Sweedler, Electrophoresis, 2005, 26, 4684‐4690. 24. K. Fa, J.J. Tulock, J.V. Sweedler, and P.W. Bohn, J. Am. Chem. Soc., 2005, 127, 13928‐13933. 25. N. Lion, J.O. Gellon, H. Jensen, and H.H. Girault, J. Chromatogr. A, 2003, 1003, 11‐19. 26. Y.X. Wang, J.W. Cooper, C.S. Lee, and D.L. DeVoe, Lab. Chip, 2004, 4, 363‐367. 27. B.H. Timmer, W. Olthuis, and A. Van den Berg, Lab. Chip, 2004, 4, 252‐255. 28. K. Shah, W.C. Shin, and R.S. Besser, Sensors and Actuators B: Chemical, 2004, 97, 157. 29. P. Myers and K.D. Bartle, J. Chromatogr. A, 2004, 1044, 253. 30. Y.C. Hsieh and J.D. Zahn, Sens. Act. B, 2005, 107, 649‐656. 31. S.H. Chan, N.T. Nguyen, Z. Xia, and Z. Wu, J. Micromech. Microeng., 2005, 15, 231‐236. 32. S.‐I. Ohira and K. Toda, Lab. Chip, 2005, 5, 1374‐1379. 33. T. Tokuyama, S.i. Fujii, K. Sato, M. Abo, and A. Okubo, Anal. Chem., 2005, 77, 3309‐3314. 34. J.E. Kim, J.H. Cho, and S.H. Paek, Anal. Chem., 2005, 77, 7901‐7907. 35. R. Kurita, N. Yabumoto, and O. Niwa, Biosens. Bioelectron., 2006, 21, 1649. 36. Z.‐X. Cai, Q. Fang, H.‐W. Chen, and Z.‐L. Fang, Anal. Chim. Acta, 2006, 556, 151. 37. D.D. Meng, J. Kim, and C.‐J. Kim, J. Micromech. Microeng., 2006, 16, 419. 38. B.R. Flachsbart, K. Wong, J.M. Iannacone, E.N. Abante, R.L. Vlach, P.A. Rauchfuss, P.W. Bohn, J.V.
Sweedler, and M.A. Shannon, Lab. Chip, 2006, 6, 667‐674. 39. S. Thorslund, O. Klett, F. Nikolajeff, K. Markides, and J. Bergquist, Biomed. Microdev., 2006, 8, 73. 40. V.V. Abhyankar, M.A. Lokuta, A. Huttenlocher, and D.J. Beebe, Lab Chip, 2006, 6, 389‐393. 41. J. Gao, J. Xu, L.E. Locascio, and C.S. Lee, Anal. Chem., 2001, 73, 2648‐2655. 42. J.W. Cooper, J. Chen, Y. Li, and C.S. Lee, Anal. Chem., 2003, 75, 1067‐1074. 43. Y. Jiang and C.S. Lee, J. Chromatogr. A, 2001, 924, 315. 44. P.C. Wang, J. Gao, and C.S. Lee, J. Chromatogr. A, 2002, 942, 115‐122. 45. X. Wang, C. Saridara, and S. Mitra, Anal. Chim. Acta, 2005, 543.

Chapter 2
34
46. M.H. Lamoree, U.R. Tjaden, and J. van der Greef, J. Chromatogr. A, 1997, 777, 31. 47. J. Wu and J. Pawliszyn, Anal. Chem., 1995, 67, 2010‐2014. 48. N. Torto, J. Bang, S. Richardson, G.S. Nilsson, L. Gorton, T. Laurell, and G. Marko‐Varga, J. Chromatogr.
A, 1998, 806, 265‐278. 49. J. Astorga‐Wells, H. Jornvall, and T. Bergman, Anal. Chem., 2003, 75, 5213‐5219. 50. Q. Wang, S.‐L. Lin, K.F. Warnick, H.D. Tolley, and M.L. Lee, J. Chromatogr. A, 2003, 985, 455. 51. C.G. Cooney and B.C. Towe, Sens. Act. B, 2000, 62, 177‐181. 52. K. Ikuta, S. Maruo, T. Fujisawa, and Y. Yamada, MEMS 1999 12th IEEE international conference, 1999,
376‐381. 53. L.J. Heyderman, B. Ketterer, D. Bachle, F. Glaus, B. Haas, H. Schift, K. Vogelsang, J. Gobrecht, L.
Tiefenauer, and O. Dubochet, Microelectronic Engineering, 2003, 67‐68, 208. 54. T. Cui, J. Fang, A. Zheng, F. Jones, and A. Reppond, Sens. Act. B, 2000, 71, 228‐231. 55. S.V. Karnik, M.K. Hatalis, and M.V. Kothare, J. Microelectromech. Sys., 2003, 12, 93. 56. F.C. Gielens, H.D. Tong, C.J.M. Van Rijn, M.A.G. Vorstman, and J.T.F. Keurentjes, J. Membr. Sci, 2004,
243, 203‐213. 57. B.A. Wilhite, M.A. Schmidt, and K.F. Jensen, Ind. Eng. Chem. Res., 2004, 43, 7083‐7091. 58. Y.S.S. Wan, J.L.H. Chau, A. Gavriilidis, and K.L. Yeung, Micropor. and Mesapor. Mat., 2001, 42, 157. 59. J.L.H. Chau, Y.S.S. Wan, A. Gavriilidis, and K.L. Yeung, Chem. Eng. J., 2002, 88, 187. 60. S.M. Lai, C.P. Ng, R. Martin‐Aranda, and K.L. Yeung, Micropor. and Mesapor. Mat., 2003, 66, 239‐252. 61. K.L. Yeung, X. Zhang, W.N. Lau, and R. Martin‐Aranda, Cat. Today, 2005, 110, 26. 62. R.W. Tjerkstra, J.G.E. Gardeniers, J.J. Kelly, and A. Van den Berg, J. Microelectromech. Sys., 2000, 9,
495‐501. 63. K. Grigoras, S. Franssila, T. Sikanen, T. Kotiaho, and R. Kostiainen, Phys. Stat. Sol. A, 2005, 202, 1624‐
1628. 64. B. Wolfrum, Y. Mourzina, F. Sommerhage, and A. Offenhausser, Nano Lett., 2006, 6, 453‐457. 65. J. Khandurina, S.C. Jacobson, L.C. Waters, R.S. Foote, and J.M. Ramsey, Anal. Chem., 1999, 71, 1815‐
1819. 66. R.S. Foote, J. Khandurina, S.C. Jacobson, and J.M. Ramsey, Anal. Chem., 2005, 77, 57‐63. 67. C.S. Toh, B.M. Kayes, E.J. Nemanick, and N.S. Lewis, Nano Lett., 2004, 4, 767‐770. 68. R. Schmuhl, W. Nijdam, J. Sekulic, S.R. Chowdhury, C.J.M. Van Rijn, A. Van den Berg, J.E. Ten Elshof,
and D. Blank, Anal. Chem., 2005, 77, 178‐184. 69. S. Metz, C. Trautmann, A. Bertsch, and P. Renaud, J. Micromech. Microeng., 2004, 14, 324‐331. 70. A.P. Russo, S.T. Retterer, A.J. Spence, M.S. Isaacson, L.A. Lepak, M.G. Spencer, D.L. Martin, R. MacColl,
and J.N. Turner, Sep. Sci. Tech., 2004, 39, 2515‐2530. 71. H. Mohamed, A.P. Russo, D.H. Szarowski, E. McDonnell, L.A. Lepak, M.G. Spencer, D.L. Martin, M.
Caggana, and J.N. Turner, J. Chromatogr. A, 2006, 1111, 214‐219. 72. C.M. Moore, S.B. Minteer, and R.S. Martin, Lab. Chip, 2005, 5, 218‐225. 73. P.H. Humble, R.T. Kelly, A.T. Woolley, H.D. Tolley, and M.L. Lee, Anal. Chem., 2004, 76, 5641‐5648. 74. R.T. Kelly, Y. Li, and A.T. Woolley, Anal. Chem., 2006, 78, 2565‐2570. 75. J. Moorthy and D.J. Beebe, Lab. Chip, 2003, 3, 62‐66. 76. S. Song, A.K. Singh, and B.J. Kirby, Anal. Chem., 2004, 76, 4589‐4592. 77. S. Song, A.K. Singh, T.J. Shepodd, and B.J. Kirby, Anal. Chem., 2004, 76, 2367‐2373. 78. H. Hisamoto, Y. Shimizu, K. Uchiyama, M. Tokeshi, Y. Kikutani, A. Hibara, and T. Kitamori, Anal. Chem.,
2003, 75, 350‐354. 79. M. Surmeian, M.N. Slyadnev, H. Hisamoto, A. Hibara, K. Uchiyama, and T. Kitamori, Anal. Chem., 2002,
74, 2014‐2020. 80. T. Maruyama, H. Matsushita, J.i. Uchida, F. Kubota, N. Kamiya, and M. Goto, Anal. Chem., 2004, 76,
4495‐4500. 81. M.E. Sandison and H. Morgan, J. Micromech. Microeng., 2005, 15, 139‐144. 82. H. Suzuki, K.V. Tabata, H. Noji, and S. Takeuchi, Langmuir, 2006, 22, 1937‐1942. 83. G.C. Randall and P. Doyle, Proc. Nat. Acad. Sci., 2005, 102, 10813‐10818. 84. A. Zanzotto, N. Szita, P. Boccazzi, P. Lessard, A.J. Sinskey, and K.F. Jensen, Biotech. Bioeng., 2004, 87,
243‐254. 85. E. Leclerc, Y. Sakai, and T. Fujii, Biomed. Microdev., 2003, 5, 109‐114.

Membranes and microfluidics
35
86. E. Leclerc, Y. Sakai, and T. Fujii, Biotech. Prog., 2004, 20, 750‐755. 87. K. Toda, S.‐I. Ohira, and M. Ikeda, Anal. Chim. Acta, 2004, 511, 3. 88. E. Verneuil, A. Buguin, and P. Silberzan, Europhysics. Let., 2004, 68, 412‐418. 89. S. Ostrovidov, J. Jiang, Y. Sakai, and T. Fujii, Biomed. Microdev., 2004, 6, 279‐287. 90. B. Zheng, L.S. Roach, and R.F. Ismagilov, J. Am. Chem. Soc., 2003, 125, 11170‐11171. 91. S.M. Mitrovski and R.G. Nuzzo, Lab Chip, 2005, 5, 634‐645. 92. S.M. Mitrovski, L.C.C. Elliot, and R.G. Nuzzo, Langmuir, 2004, 20, 6974‐6976. 93. S.M. Mitrovski and R.G. Nuzzo, Lab. Chip, 2006. 94. C.‐C. Wu, T. Yasukawa, H. Shiku, and T. Matsue, Sens. Act. B, 2005, 110, 342. 95. A.P. Vollmer, R.F. Probstein, R. Gilbert, and T. Thorsen, Lab. Chip, 2005, 5, 1059 ‐ 1066. 96. G.M. Walker, M.S. Ozers, and D.J. Beebe, Biomed. Microdev., 2002, 4, 161. 97. S. Herber, J. Bomer, W. Olthuis, P. Bergveld, and A.v.d. Berg, Biomed. Microdev., 2005, 7, 197. 98. J. Leng, B. Lonetti, P. Tabeling, M. Joanicot, and A. Ajdari, Phys. Rev. Let., 2006, 084503. 99. J. Eijkel, J. Bomer, and A. Van den Berg, Appl. Phys. Let., 2005, 87, 114103. 100. Y.C. Su, L. Lin, and A.P. Pisano, J. Microelectromech. Sys., 2002, 11, 736. 101. Y.C. Su and L. Lin, J. Microelectromech. Sys., 2004, 13, 75‐82. 102. M. Cabodi, N.W. Choi, J.P. Gleghorn, C.S.D. Lee, L.J. Bonassar, and A.D. Stroock, J. Am. Chem. Soc.,
2005, 127, 13788‐13789. 103. J. De Jong, B. Ankone, R.G.H. Lammertink, and M. Wessling, Lab Chip, 2005, 5, 1240‐1247. 104. J. de Jong, M.J. Geerken, R.G.H. Lammertink, and M. Wessling, Chem. Eng. Technol., 2007, 30, 309‐
315. 105. B.J. Papenburg, L. Vogelaar, L.A.M. Bolhuis‐Versteeg, R.G.H. Lammertink, D. Stamatialis, and M.
Wessling, Biomaterials, 2007, 28, 1998‐2009. 106. J. Eijkel and A. Van den Berg, Lab. Chip, 2006, 6, 19‐23. 107. C.J.M.v. Rijn, Nano and micro engineered membrane technology. Membrane Science and Technology
Series. Vol. 10. 2004, Amsterdam: Elsevier. 108. L. Vogelaar, R.G.H. Lammertink, J.N. Barsema, W. Nijdam, L.A.M. Bolhuis‐Versteeg, C.J.M. Van Rijn,
and M. Wessling, Small, 2005, 1, 645‐655. 109. L. Vogelaar, J.N. Barsema, C.J.M. van Rijn, W. Nijdam, and M. Wessling, Adv. Mat., 2003, 15, 1385‐
1389. 110. L.N. Moskvin and T.G. Nikitina, J. Anal. Chem., 2004, 59, 2. 111. P.C. Wang, D.L. DeVoe, and C.S. Lee, Electrophoresis, 2001, 22, 3857‐3867. 112. J. Lichtenberg, N.F. de Rooij, and E. Verpoorte, Talanta, 2002, 56, 233‐266. 113. D.S. Peterson, Lab Chip, 2005, 5, 132‐139. 114. A. Brask, J.P. Kutter, and H. Bruus, Lab. Chip, 2005, 5, 730‐738. 115. J.C. McDonald, D.C. Duffy, J.R. Anderson, D.T. Chiu, H. Wu, O.J.A. Schueller, and G.M. Whitesides,
Electrophoresis, 2000, 21, 27‐40. 116. J.M.K. Ng, I. Gitlin, A.D. Stroock, and G.M. Whitesides, Electrophoresis, 2002, 23, 3461‐3473. 117. J.C. McDonald and G.M. Whitesides, Acc. Chem. Res., 2002, 35, 491‐499. 118. S.K. Sia and G.M. Whitesides, Electrophoresis, 2003, 24, 3563‐3576. 119. M.A. Unger, H.P. Chou, T. Thorsen, A. Scherer, and S.R. Quake, Science, 2000, 288, 113‐116. 120. N. Stafie, D.F. Stamatialis, and M. Wessling, Sep. Pur. Tech., 2005, 45, 220. 121. J.M.S. Henis and M.K. Tripodi, J. Membr. Sci, 1981, 8, 233‐246. 122. E. Favre, P. Schaetzel, Q.T. Nguygen, R. Clement, and J. Neel, J. Membrane Sci., 1994, 92, 169‐184. 123. D.R. Machado, D. Hasson, and R. Semiat, J. Membrane Sci., 1999, 163, 93‐102. 124. I. Blume, P.J.F. Schwering, M.H.V. Mulder, and C.A. Smolders, J. Membr. Sci, 1991, 61, 85. 125. M.‐B. Hagg, J. Membr. Sci, 2000, 170, 173. 126. T.C. Merkel, V.I. Bondar, K. Nagai, B.D. Freeman, and I. Pinnau, J. Pol. Sci. B, 2000, 38, 415‐434. 127. J.N. Lee, C. Park, and G.M. Whitesides, Anal. Chem., 2003, 75, 6544‐6554. 128. M. Bennett, B.J. Brisdon, R. England, and R.W. Field, J. Membr. Sci, 1997, 137, 63. 129. J.P. Rolland, M.v. Dam, D.A. Schorzman, S.R. Quake, and J.M. DeSimone, J. Am. Chem. Soc., 2004, 126,
2322‐2323.

Chapter 2
36

37
FABRICATION OF THIN POLYMERIC MICROFLUIDIC DEVICES
WITH TUNABLE POROSITY
Abstract
In this chapter a new replication method is presented for the fabrication of thin polymeric
microfluidic devices with tunable porosity: phase separation micromolding. This method is based on
phase separation of a polymer solution on a microstructured mold, leading to a polymer film with an
imprint of the mold features. Compared to existing microfabrication techniques the technique offers
four advantages: a) simple and cheap process that can be operated at room temperature outside
clean room facilities; b) very broad range of applicable materials (including materials that could not
be processed before); c) ability to make thin flexible chips; d) ability to introduce and tune porosity
in the chip. By introducing porosity, the channel walls can be used for selective mass transport of
gasses, liquids and solutes. The complete preparation process of a porous PMMA chip is described:
film fabrication, sealing and assembly. A proof‐of‐principle of the added value of the introduced
porosity is given, by demonstrating CO2 transport through the channel walls. Furthermore, it is
shown that the gas permeation performance of microfluidic chips can be enhanced dramatically by a
decrease in chip thickness and incorporation of porosity.

Chapter 3
38
3.1. INTRODUCTION
Microfluidic devices gain attention from various disciplines. Many articles have already been
published on the application of these devices in reaction, separation and analysis. This field of
research is associated with Lab‐on‐a‐chip and Micro Total Analysis Systems (μTAS). The history of
μTAS, its principles and application have been described in extensive reviews by the group of Manz
[1‐4].
For every microfluidic application, a certain optimal construction material exists that matches
the operation criteria. These criteria can range from solvent resistance in organic chemistry to
biocompatibility in cell studying. The possibility to shape the material of choice depends on the
availability of suitable fabrication methods. Unfortunately, these methods are often limiting.
Historically, the field of microfluidics started in the area of microelectronics. Clean room
technologies, such as photolithography and etching, enabled processing of silicon and glass as base
chip materials. These materials still make up for a large part of commercial applications nowadays,
although they do not necessarily possess the best properties. Gradually, new methods have been
invented that allow for a broader material choice [5]. Replication techniques such as hot embossing
and injection molding have enabled the use of thermoplastic polymers [6, 7]. For cheap rapid
prototyping, PDMS and photo curable polymers are widely applied [8]. Although in some cases the
surface properties of the used material are exploited, its main function is to define the 3‐
dimensional microfluidic structure. Illustrative is the amount of articles dedicated to
functionalization and coating of channel walls after fabrication of the chip, indicating the
unsatisfactory properties of the used chip material itself. In practice, the choice for a ‘chip material ‐
fabrication method’ combination is a compromise between material properties, processing time,
processing complexity, fabrication precision and cost. There is clearly room for new fabrication
methods that can improve the compromise and address new materials.
A similar problem with limitations of fabrication techniques is evident for the on‐chip
integration of multiple unit operations, a main focus point in microfluidics research [9]. At the
moment, integration of certain functionality is mostly realized by (a) smart chip layout, (b) the use of
highly sophisticated equipment for post‐treatment of chips and/or (c) the introduction of additional
materials different from the bulk chip material. Examples are (a) fabrication of a gas‐liquid separator
based on capillary forces [10]; (b) fabrication of membranes by anodically etching [11] or laser beam
drilling [12]; and (c) preparation of membranes in a channel [13] and entrapment of absorption
resins [14]. In all these cases, the properties of the chip material itself are hardly exploited. Applied
chip materials are dense, making transport of species through the chip material shear impossible. An
exception is the transport of gasses or vapors through the walls of PDMS‐based chips [15, 16]. Still,
the permeation is low, due to the significant thickness of the chips that is required for mechanical
strength. The introduction of (interconnected) porosity in the chip material would lead to a big

Fabrication of thin polymeric microfluidic devices with tunable porosity
39
improvement. In a porous chip, the channel walls can act as selective barriers for transport of
chemicals in‐ and out of the channel. This principle can be used to integrate different unit operations
in situ, as illustrated in Figure 1.
Figure 1: Conceptual illustration of the opportunities that porous walls can offer in microfluidic systems
The benefit of porosity has been acknowledged by several authors, who applied porous layers
in microfluidic chips. Examples are porous silicon for surface enhancement in catalytic micro reactors
[17, 18], porous coatings used as stationary phase in analysis [19, 20] and the incorporation of
porous membranes [21]. However, to our knowledge, the concept of porosity in the complete chip
itself has not yet been reported in literature. Again, the reason may be found in limitations of
existing microfabrication methods.
Summarizing, a microfabrication method that enables the preparation of porous
microstructured films out of a broad variety of materials, has great potential. In 2002 such a
technique was proposed: Phase Separation Micro Molding (PSμM) [22]. This technique is based on
phase separation of a polymer solution on a microstructured mold and has been described
extensively by Vogelaar [23, 24]. In this chapter we will discuss the applicability of PSμM for the
fabrication of porous microfluidic chips and show opportunities that this approach offers for the
microfluidic community. The complete preparation process will be described. First, the principle of
phase separation micromolding will be explained. Applicable materials will be discussed and an
indication of the limits of the technology will be given. Second, the route from a porous film towards
an operated chip will be described, including more detailed information about sealing methods and
assembly of a chip. In the result section we will demonstrate that film morphologies can be tuned,
and show sealed and operated single and multilayered chips. A proof of principle of the added value
of the introduced porosity will be given, by showing fast CO2 transport through the channel walls.
Finally, the gas permeation properties of produced porous films will be compared with dense films
to demonstrate the enhancement by the porosity.
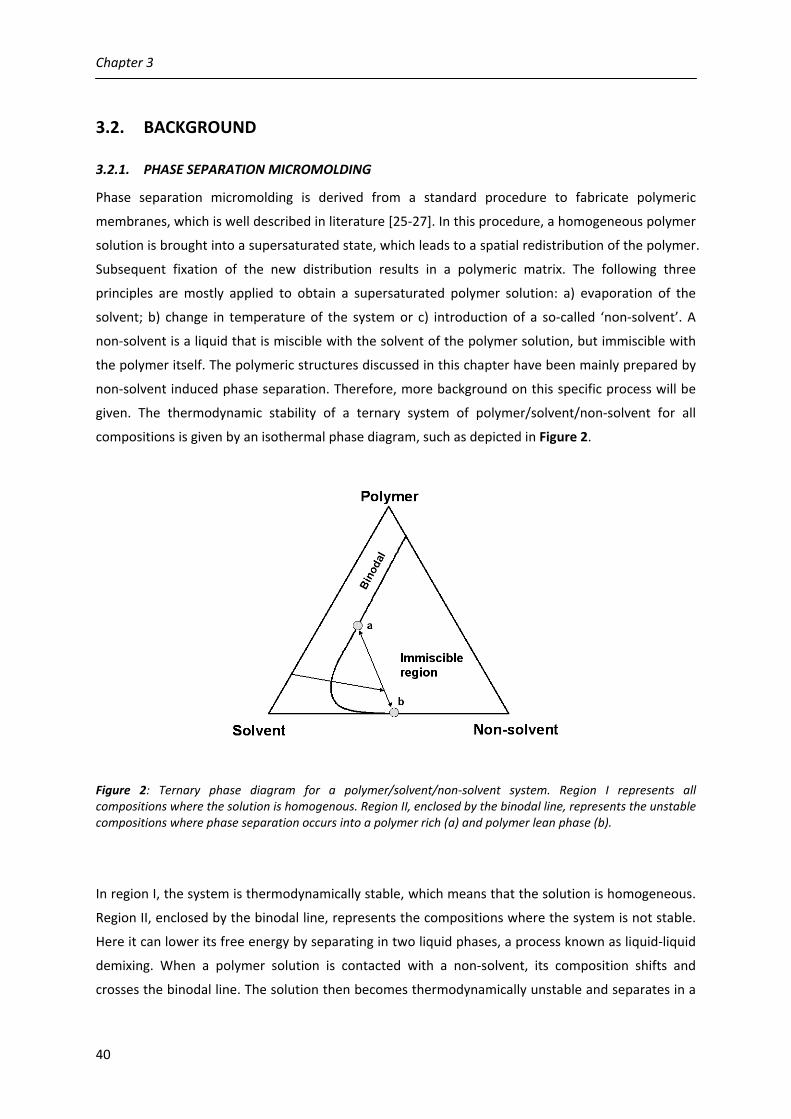
Chapter 3
40
3.2. BACKGROUND
3.2.1. PHASE SEPARATION MICROMOLDING
Phase separation micromolding is derived from a standard procedure to fabricate polymeric
membranes, which is well described in literature [25‐27]. In this procedure, a homogeneous polymer
solution is brought into a supersaturated state, which leads to a spatial redistribution of the polymer.
Subsequent fixation of the new distribution results in a polymeric matrix. The following three
principles are mostly applied to obtain a supersaturated polymer solution: a) evaporation of the
solvent; b) change in temperature of the system or c) introduction of a so‐called ‘non‐solvent’. A
non‐solvent is a liquid that is miscible with the solvent of the polymer solution, but immiscible with
the polymer itself. The polymeric structures discussed in this chapter have been mainly prepared by
non‐solvent induced phase separation. Therefore, more background on this specific process will be
given. The thermodynamic stability of a ternary system of polymer/solvent/non‐solvent for all
compositions is given by an isothermal phase diagram, such as depicted in Figure 2.
Figure 2: Ternary phase diagram for a polymer/solvent/non‐solvent system. Region I represents all compositions where the solution is homogenous. Region II, enclosed by the binodal line, represents the unstable compositions where phase separation occurs into a polymer rich (a) and polymer lean phase (b).
In region I, the system is thermodynamically stable, which means that the solution is homogeneous.
Region II, enclosed by the binodal line, represents the compositions where the system is not stable.
Here it can lower its free energy by separating in two liquid phases, a process known as liquid‐liquid
demixing. When a polymer solution is contacted with a non‐solvent, its composition shifts and
crosses the binodal line. The solution then becomes thermodynamically unstable and separates in a

Fabrication of thin polymeric microfluidic devices with tunable porosity
41
polymer‐rich (a) and polymer‐lean phase (b). The composition of both phases is given by the
intersection points of the tie line and the binodal. Further exchange of solvent and non‐solvent leads
to gelation and solidification of the polymer rich phase. The porosity of the obtained polymer film
stems from the polymer lean phase, which is removed by washing.
Vogelaar et al. found that when the phase separation process was carried out on a
microstructured mold, a negative imprint of the structure of the mold was replicated in the
produced polymer film [23]. They named this process Phase Separation Micromolding (PSμM). This
process is schematically depicted in Figure 3. First a silicon microstructured mold is fabricated using
standard clean room technology. Then a thin layer of polymer solution is cast onto this mold and
subsequently immersed in a bath of non‐solvent. Exchange of solvent and non‐solvent leads to
phase separation and precipitation of the polymer on the mold. After release of the film, the mold
can be cleaned, dried and reused.
Figure 3: Schematic representation of Phase Separation Micro Molding (PSμM)
During the formation of the polymeric matrix, shrinkage occurs in three dimensions. This
shrinkage is intrinsic to the phase separation process. Depending on the exchange rates of solvent
and non‐solvent, produced films can have a thickness of only a fraction of the original casting

Chapter 3
42
thickness. Shrinkage in the lateral direction is generally much smaller. It leads to a small gap
between the mold features and the microstructured film. Release problems, as encountered in hot
embossing, can therefore be largely avoided. Due to the shrinkage phenomena, very thin and
flexible films can be produced, down to a few microns [23, 28]. The size of the replicated features
can be even smaller, down to 150 nm [23]. For microfluidic applications, this range is more than
sufficient.
The membrane characteristics of the microstructured film are defined by aspects of the
morphology, such as pore size distribution, skin thickness, and surface/volume porosity. These
parameters determine the performance of the membrane, which can be expressed in terms of
permeability and selectivity. Phase separation can lead to three basic types of morphology: 1)
completely dense structure; 2) porous substructure with dense skin layer; or 3) completely porous
structure. The porosity may be either interconnected, or found in a closed‐cell structure. The
obtained morphology depends on the dynamic path in the ternary diagram that is followed during
phase separation. This path is related to a large range of parameters, including temperature,
composition of the polymer/solvent/non‐solvent system, casting thickness and pre treatment prior
to immersion (e.g. solvent evaporation, contact with non‐solvent vapor). Furthermore, interactions
between the polymer solution and the mold surface may affect the obtained structure. Finally, the
addition of particles strongly influences the phase separation process, since it changes the viscosity
of the solution and provides starting points for nucleation [29]. Since all these conditions can be
chosen or controlled, the final morphology can be tailored to suit a certain application. Pore sizes
can range from 0 (dense) to several microns, covering separation processes from gas separation to
microfiltration. The maximum achievable porosity is not limited by the process itself but rather by
the mechanical stability of the obtained film.
A very significant advantage of phase separation micromolding is the enormous range of
applicable materials; in principle, any soluble polymer can be used. Vogelaar and coworkers
reported a list of recipes, including Poly methyl methacrylate (PMMA), Polycarbonate (PC),
Polystyrene (PS), Poly vinyl difluoride (PVDF), Polyimide (PI) (high Tg) and polyaniline (conductive
polymer). When PSμM is combined with a subsequent pyrolysis step, carbon films can be prepared.
Also inorganic films can be made, by adding ceramic (e.g. Al2O3) or metallic powder (e.g. silver) to
the polymer solution and performing a pyrolysis and sinter step afterwards [24]. Lately, the use of
biocompatible and biodegradable polymers, such as polylactic acid and poly caprolactone, has been
described [30]. Thus, instead of tuning the surface of a standard chip material, now a material can be
chosen that directly meets the requirements of the application.
Summarizing, Phase Separation Micro Molding offers the following opportunities: a) ability to
produce thin microstructured flexible films with b) tunable porosity and c) broad material choice, d)
in a simple and cheap process outside clean room facilities.

Fabrication of thin polymeric microfluidic devices with tunable porosity
43
3.2.2. FROM POROUS FILM TO CHIP: SEALING
The first step after fabrication of a porous microstructured film is the sealing step. Different
sealing methods for polymer substrates have been described in literature, based on either physical,
chemical or mechanical principles or the use of adhesives. Most methods lead to an irreversible
bond, except for mechanical sealing.
Table 1 gives an overview of sealing principles and methods.
Table 1: Overview of sealing methods for polymeric micro devices
Sealing principle
Method References
Physical (irreversible)
Solvent welding Ultrasonic welding Thermal bonding ‐ oven or hotplate ‐ boiling water Lamination
[31‐33] [34] [35‐40] [41] [12, 42]
Chemical (irreversible)
Crosslinking using monomer solution Crosslinking of partially cured microstructured films * Creation of reactive groups on the surface ‐ plasma treatment* ‐ UV irradiation
[43, 44] [45‐48] [49‐52] [53]
Adhesive (irreversible)
Directly applicable Heat activated UV activated Microwave activated
[54‐56] [57, 58] [59] [60‐62]
Mechanical (reversible)
Use of self‐adhesive properties of chip material * Clamping
‐ Teflon layer ‐ PDMS layer
[63]
[58] [64‐66]
* these methods are especially used for PDMS
Criteria for the selection of a sealing method are largely set by requirements from the application,
such as burst pressure; maximum allowable deformation of the micro channel structures;
biocompatibility; or solvent resistance. The choice is further narrowed by the used chip material(s),
which may not be UV or heat compatible, may have low surface energies, etc. In practice, this means
that a new sealing method and/or procedure might be required when changing the application of a
chip or the chip material. In this work, we decided to focus on PMMA‐based microfluidic films. For
quick testing of prepared structures, i.e. to check liquid intrusion into the porosity, sticky tape

Chapter 3
44
provided sufficient sealing. For the proof‐of‐principle experiments we decided to use transparent
PMMA foils, so that the complete device consisted of a single material. A screening stage of different
sealing methods showed that best results were obtained when using a combination of temperature
and pressure.
3.2.3. FROM POROUS FILM TO CHIP: ASSEMBLY
In order to operate a sealed microstructured film, connections to the macro world are required. In
thick films, as encountered in hot embossing and PDMS replication, connections can be directly
glued to ‐ or screwed into ‐ the polymer substrate itself. However, for the thin films prepared by
phase separation micromolding this approach proved difficult. Therefore, we decided to use a
commercially available pressure chip holder with access holes at standard positions (Micronit
Microfluidics BV, The Netherlands). Specially prepared glass slides with powderblasted holes were
used for making the chip assemblies. Sealing between glass lids and porous films was obtained by
applying a thin polymer coating on the glass lids, followed by thermal bonding under pressure. A
schematic illustration and a photograph of the module are depicted in Figure 4, together with a
typical example of a chip assembly.
Glass
Porous microstructured film
Polymer coating
Glass
Silica capillaries
Rubber ferrules
Figure 4: Overview of used module: a) schematic depiction of a chip assembled in a pressure chip holder. b) porous microfluidic film sealed between glass plates (1 eurocent coin as reference of size). Reservoirs match with powderblasted holes at the back. The combination of glass lids and a transparent coating enable optical inspection; c) photograph of a disassembled module.

Fabrication of thin polymeric microfluidic devices with tunable porosity
45
3.3. EXPERIMENTAL
Materials
Poly methyl methacrylate (PMMA, Mw 100.000 g/mol, Polysciences) and Acrylonitrile‐Butadiene‐
Styrene copolymer (ABS, Magnum, high butadiene content, Dow Chemicals) were used to
demonstrate the phase separation micromolding process. PMMA was chosen since it is already
widely applied in dense microfluidics and therefore interesting for comparison. Initially a high
molecular weight PMMA was used (1.300.000 g/mol), but films prepared from this material became
brittle after drying. Therefore a switch to the lower molecular weight PMMA was made, leading to
flexible films. ABS was chosen to demonstrate the application of a new type of polymer using phase
separation micromolding. The polymers were dissolved in either N‐methyl‐pyrrolidone (NMP,
synthesis grade, Merck) or acetone (synthesis grade, Merck). Non‐ solvents were either tap water or
ethanol (technical grade, Merck). Ecoline ink from Talens was used as a coloring agent. For the
proof‐of‐concept of transport through the porous chip walls, acidification of water by CO2 (Hoek
Loos, 99.996% purity) was chosen. Bromo thymol blue (Aldrich) was dissolved in tap water and used
as a pH indicator. All mentioned chemicals were used without additional pre‐ treatment.
Mold fabrication
Microstructured molds were produced in a clean room out of 4” silicon wafers. The process
consisted of standard photolithography, followed by deep reactive ion etching (DRIE). Molds were
designed with reservoir structures that matched with the connection points of the commercial
module used for operation. Shrinkage effects were taken into account. Several microfluidic designs
were tested, all based on a channel width of 100 μm. The height of the rims on the mold was 50 μm.
A more precise description of the mold fabrication process has been given by Vogelaar [23].
Film casting
Film casting was performed at room temperature using a home made casting device. The height of
the casting knife, and thereby of the casted film, could be controlled by micromanipulators. After
casting, the molds were either placed in the non‐solvent bath directly or exposed to a nitrogen gas
stream saturated with water vapor prior to immersion. Films were washed for 24h in tap water to
remove all remaining solvent and dried in air at room temperature before further processing. Since
many different recipes and process conditions have been applied, we refer to exact preparation
procedures of films in the appropriate captions of figures.

Chapter 3
46
Sealing
Transparent PMMA foil was prepared as cover slip by casting a 25wt% PMMA/Acetone solution on a
glass plate, followed by evaporation of the acetone. Produced porous microstructured films were
sealed to this foil by placing the films for 6 minutes in a standard hot air oven at 80°C, while pressure
was applied by clamping the films in a vise between microscope glass slides.
Assembly and operation
Glass lids with powderblasted holes (Micronit Microfluidics) were coated with a thin polymeric film
by casting of a 5wt% PMMA/Acetone solution, followed by evaporation. After drying overnight, a
porous microstructured film was sandwiched between the coated glass lids and sealed using the
same sealing procedure as mentioned above. The connections to reservoirs were pushed through
prior to sealing. The assembly was operated in a pressure chip holder (Micronit Microfluidics).
Connections and silica glass capillaries were supplied by Upchurch Scientific. A syringe pump
(Harvard Apparatus 11 Picoplus) was used for liquid handling.
Analysis and Characterization methods
Produced replicas were analyzed by optical microscopy (Carl Zeiss Axiovert 40) and scanning
electron microscopy (SEM, JEOL TSM 5600). Cross section samples were prepared by breaking wet
films after immersion in liquid nitrogen. Before SEM analysis, a thin layer of gold was sputtered on
prepared samples to avoid charge‐up during imaging. Photographs were made with a Fujifilm Finepix
401 digital camera in the macro setting. Fluoresence imaging was performed to check if liquid was
wetting the pores of prepared chips. Fluorescein isothiocyanate (FITC, Aldrich) was dissolved in
water and used as a fluorescent marker. Gas permeation measurements were performed in an in‐
home developed low pressure gas permeation set‐up. Unstructured films were prepared by casting
on a flat wafer. After washing for 24h in tap water, the films were dried for 12 hours in air and for 24
hours in a vacuum oven at 30°C. Permeation of carbon dioxide (Hoek Loos, 99.996% purity) was
determined by measuring the pressure increase in time in a calibrated permeate volume at T = 30°C,
Pfeed = 1 bar, Ppermeate = vacuum (< 10‐5 bar).

Fabrication of thin polymeric microfluidic devices with tunable porosity
47
3.4. RESULTS & DISCUSSION
3.4.1. FILM FABRICATION
Images of a typical mold design and resulting replicas made by PSμM are given in Figure 5.
Figure 5: Fabrication of porous microfluidic films: a) photograph of a microfluidic design on a silicon mold; b) SEM image of an ABS copolymer replica made by PSμM, showing a dense skin layer (bar represents 500μm); c) optical image of a close‐up of a channel in the replica, revealing the porosity in the film beneath the skin (bar represents 100μm). The depicted film was prepared from a 25wt% solution of ABS in NMP using ethanol as non solvent.
The image obtained by SEM (b) shows a dense surface of the film and dense channel walls. The
optical image (c) reveals the porous structure beneath the dense layer. As was mentioned in the
background section, the morphology depends on the composition of the polymer starting solution
and the conditions of the phase separation process. This is clearly demonstrated in the images of
ABS films presented in Figure 6. Different shapes and sizes of pores can be observed. The final
morphology can be predicted by rules‐of‐thumb available in the field of membrane preparation.
Knowledge in this field is continuously expanding and already an enormous amount of recipes and
resulting film morphologies has been documented [25‐27] Therefore, tailoring the morphology
towards a certain application can be rather straightforward.
As mentioned in the background section, an important phenomenon in Phase Separation Micro
Molding is shrinkage of the film during exchange of solvent and non‐solvent, in both lateral and
perpendicular direction. Especially in perpendicular direction, large shrinkage can occur. This can be
concluded when comparing the thickness of the films presented in Figure 6 with the original casting
thickness of the polymer solution. Starting out with 250μm of solution, the final film thickness lies
around 150μm, which is 40% lower. The thickness of the final film is determined by a) casting
thickness, b) polymer concentration and c) the in‐diffusion rate of non‐solvent and out‐diffusion rate
of solvent during the phase separation process.

Chapter 3
48
Figure 6: SEM images of cross sections of structured films prepared from an ABS/NMP solution, cast at 250 micron, demonstrating the tunability of the film morphology: a) 25wt%, immersed in water; b) 25wt% immersed in ethanol; c) 17wt%, 5 min. in water vapor before immersion in water; d) close‐up of cross section of the mold for comparison (all bars represent 100 μm).
As can be seen in Figure 6, the parameters of the phase separation process not only determine the
morphology of produced films, but also the replication precision. In Figure 6a, the sidewalls of the
channel are slightly curved. We address this phenomenon to lateral shrinkage of the film after
release from the mold. At this point, still a lot of solvent is present in the film. During the washing
step, this residual solvent is removed and shrinkage occurs. When the film is subsequently dried,
further shrinkage can be observed. Figure 7 shows a typical curve for the lateral shrinkage in time,
during washing and drying of prepared films. This shrinkage was determined by measuring the
change in distance between 4 marked points on a film, and averaging these values for 3 different
films prepared under the same conditions. We have noticed that the shrinkage is specific for any
polymer/solvent/non‐solvent combination and the combination of applied process conditions in the
phase separation process. Vogelaar mentioned that shrinkage can also depend on the distance
between features [24]. Girones et al. observed pore deformations in microsieve fabrication using
phase separation micromolding [28]. So on one side, shrinkage is beneficial as it causes a smooth
release of the film from the mold, while on the other side it might cause deformations and undesired
loss in feature sharpness. For our molds and recipes, we noticed that the shrinkage was in the order

Fabrication of thin polymeric microfluidic devices with tunable porosity
49
of 5‐10% in the film‐plane direction and uniform throughout the film. It was therefore
straightforward to correct for this shrinkage in the original mold design.
Figure 7: Lateral shrinkage in time during washing and subsequent drying of a PMMA film prepared by phase separation of a PMMA/NMP 25wt% solution, coagulated in water.
3.4.2. SEALING
The sealing step was optimized in terms of sealing time and temperature. The principle of thermal
bonding is to increase the temperature above the transition temperature (Tg) of the polymer. At this
point, the mobility of the polymer chains increases dramatically, and entangling of the chains leads
to sealing. The glass transition temperature of the used PMMA was 110°C [67]. However, explorative
tests revealed that the microstructure and porosity of prepared films were destroyed at this
temperature. The optimum sealing conditions for the PMMA porous chips were determined to be 6
minutes at 80°C, a temperature much lower than the Tg of PMMA. A plausible explanation for this
lower temperature might be the presence of residual solvent in the porous film. Solvents are known
for their capability to reduce the Tg of polymers; it is this principle that solvent welding relies on [31].
It is known from membrane preparation experience that the removal of NMP from membranes can
take long times. Since the goal of this research was not to optimize sealing procedures, no additional
research was carried out, and the experimentally determined sealing conditions were used in further
tests.
0
1
2
3
4
5
6
7
8
0 500 1000 1500 2000 2500 3000
Time (min)
Shrin
kage
(%)
Washing stage Drying stage
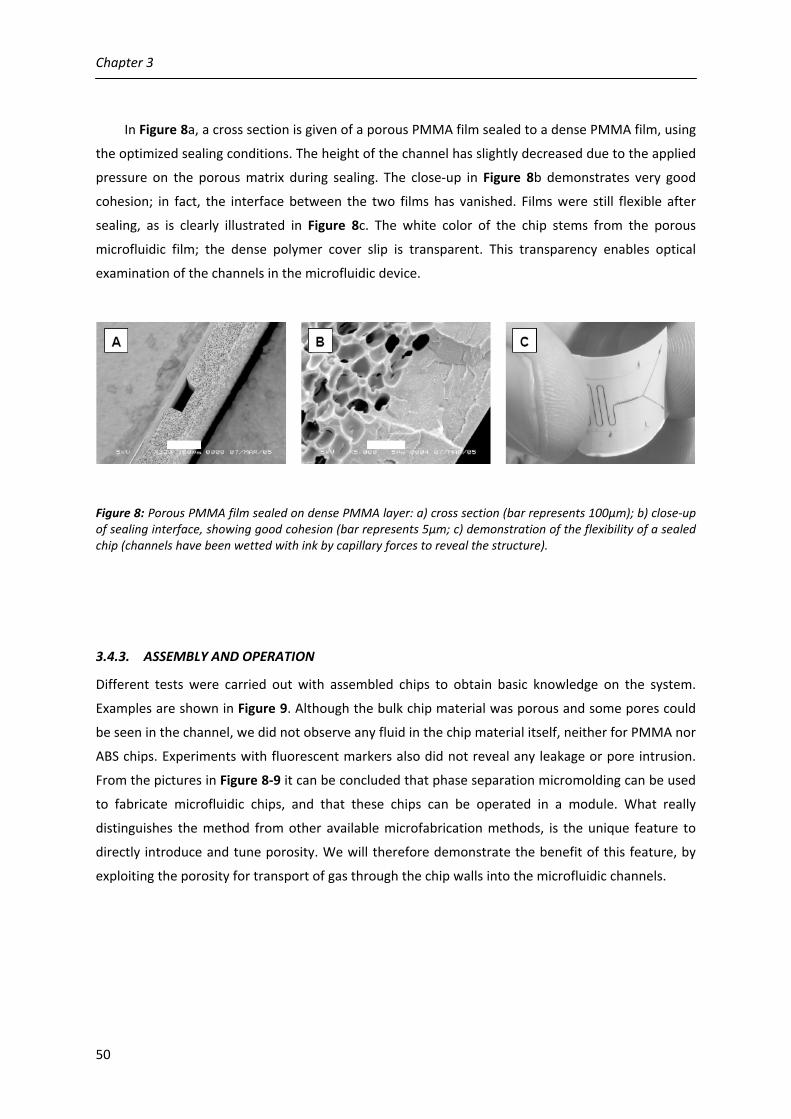
Chapter 3
50
In Figure 8a, a cross section is given of a porous PMMA film sealed to a dense PMMA film, using
the optimized sealing conditions. The height of the channel has slightly decreased due to the applied
pressure on the porous matrix during sealing. The close‐up in Figure 8b demonstrates very good
cohesion; in fact, the interface between the two films has vanished. Films were still flexible after
sealing, as is clearly illustrated in Figure 8c. The white color of the chip stems from the porous
microfluidic film; the dense polymer cover slip is transparent. This transparency enables optical
examination of the channels in the microfluidic device.
Figure 8: Porous PMMA film sealed on dense PMMA layer: a) cross section (bar represents 100μm); b) close‐up of sealing interface, showing good cohesion (bar represents 5μm; c) demonstration of the flexibility of a sealed chip (channels have been wetted with ink by capillary forces to reveal the structure).
3.4.3. ASSEMBLY AND OPERATION
Different tests were carried out with assembled chips to obtain basic knowledge on the system.
Examples are shown in Figure 9. Although the bulk chip material was porous and some pores could
be seen in the channel, we did not observe any fluid in the chip material itself, neither for PMMA nor
ABS chips. Experiments with fluorescent markers also did not reveal any leakage or pore intrusion.
From the pictures in Figure 8‐9 it can be concluded that phase separation micromolding can be used
to fabricate microfluidic chips, and that these chips can be operated in a module. What really
distinguishes the method from other available microfabrication methods, is the unique feature to
directly introduce and tune porosity. We will therefore demonstrate the benefit of this feature, by
exploiting the porosity for transport of gas through the chip walls into the microfluidic channels.

Fabrication of thin polymeric microfluidic devices with tunable porosity
51
Figure 9: Optical images of porous microfluidic chips in operation: a) filling with water; b) removal of liquid with a fluorescent marker, demonstrating that liquid is contained in the channels and not wetting the pores; c) joining of yellow and blue ink flows in a y‐junction, demonstrating laminar flow and a leak‐free sealing; d) close‐up of serpentine channel after y‐junction, showing mixing by diffusion. Flow is from right to left. All channels are about 100 micron in width.
3.4.4. PROOF OF PRINCIPLE: GAS TRANSPORT THROUGH POROSITY
For the proof‐of‐principle experiment we have chosen a simple reaction: the formation of
carbonic acid in water. CO2 is transported through the chip material by diffusion and dissolved in
water flowing through the channels. This process leads to acidification of the water, which can be
easily visualized with a pH indicator. To introduce water and CO2 separately, a double‐layered chip
was prepared. The lay‐out of this chip is illustrated in Figure 10. Two porous PMMA films were
sealed between glass lids coated with a thin layer of PMMA as described before. The connections to
reservoirs had been pushed through prior to sealing. A close‐up of a cross section of the obtained
assembly (without glass lids) is given in Figure 10b. This picture clearly demonstrates the possibility
to stack and seal multiple microfluidic layers, both porous‐to‐dense and porous‐to‐porous.

Chapter 3
52
Water containing a pH indicator was introduced by syringe pumping, while CO2 was manually
introduced with a syringe. No pressure gradient was applied, meaning that gas transport was
governed by diffusion through the porous layer. The flow rate of the water phase was varied from 1
to 3 μl∙min‐1 in order to vary the contact time. The results of the acidification experiments are
presented in Figure 10c. In case of CO2 transport, the acidification would cause a color change of the
pH indicator from blue (pH > 7.8) to yellow (pH < 6.0). Such a change is indeed visible. Therefore, we
can state that the pictures provide a general proof that transport through the channel walls occurs.
Furthermore, the amount of CO2 absorbed can be regulated by the flow rate, and in this way a pH
gradient can be set in the chip.
Figure 10: Proof‐of‐principle of mass transport through the channel walls of a porous chip: a) schematic chip assembly; b) SEM image of a cross section of the sealed assembly (bar represents 100μm), demonstrating the possibility to stack and seal multiple films; c) schematic representation of acidification of water by CO2 absorption, visualized by a pH indicator (blue at pH > 7.8, yellow at pH < 6.0); d) optical images of the chip in operation, all taken at the same position (indicated by the area of interest in c) ). These pictures demonstrate fast CO2 transport and show that the amount of CO2 absorbed can be varied by the flow rate of the water stream.

Fabrication of thin polymeric microfluidic devices with tunable porosity
53
To further investigate the transport properties of produced films, gas permeation experiments were
performed using CO2. In this case the transport was not only driven by a concentration gradient, but
also by a pressure gradient. From the gas permeation data the gas permeance of the film could be
determined, which is defined as a flow normalized for surface area and applied pressure. The
experimental results are presented in Table 2.
Table 2: Comparison of calculated and measured CO2 permeance through dense and porous films
Material
CO2 permeability dfilm [μm]
Pcalculatedc for dense film
[mol∙m‐2∙s‐1∙Pa‐1] Pmeasured for porous film [mol∙m‐2∙s‐1∙Pa‐1]d
Enhancement by porosity [‐]
ABS 1.6∙10‐15 [68] 65 a 2.5∙10‐11 2.2∙10‐9 ~ 100 PMMA
1.1∙10‐16 [69]
150
7.4∙10‐13
3.8∙10‐8
~ 50000
PDMS
8.3∙10‐13 [26]
1000
8.3∙10‐10
‐
‐
a 25 wt% ABS/NMP, coagulated in ethanol, casting thickness 200μm b 25 wt% PMMA/NMP, 5min water vapor, coagulated in water, casting thickness 200μm c P = Permeance, calculated by dividing permeability by the film thickness d T = 30°C, Pfeed = 1bar, Ppermeate < 10
‐5 bar
The theoretical values for CO2 permeance through dense films of similar thickness have been added,
to demonstrate the effect of the porosity. These theoretical values can be calculated by dividing the
permeability, a material dependent constant, by the film thickness. For comparison, also the
theoretical permeance value for a PDMS chip with a typical thickness of 1 mm has been added.
PDMS is well known for its high permeability for gasses and vapors. The permeability of PDMS for
CO2 is around 500 or 7500 times higher than the values reported for ABS and PMMA, respectively.
However, the permeance values for the porous PMMA and ABS films are both higher than the
calculated value for the PDMS film. This difference is partly due to the lower film thickness, but
mostly due to the enhancement effect of porosity. Only when the thickness of the PDMS membrane
is lowered to 20μm, which is state‐of‐the‐art [52], the permeance is equal to the porous PMMA. Of
course the gain in performance by porosity comes at a cost; the trade‐off when going from dense to
porous membranes is that the gas selectivity of the membrane is lost. However, up till now this
selectivity has not been directly exploited, and for standard gas‐liquid contacting applications it is
also not required. From the data in Table 2 an important conclusion can be drawn: the permeation
performance of PDMS chips can be equaled or even surpassed by chips made out of materials with
much lower permeability factors than PDMS, simply by making thinner chips and incorporating
porosity.

Chapter 3
54
3.5. CONCLUSIONS
In this chapter we have presented a new versatile replication method for the fabrication of porous
microfluidic chips: Phase Separation Micro Molding (PSμM). We have demonstrated that PSμM can
be used to fabricate microfluidic ABS copolymer and PMMA films, but many other polymers are
possible as well. Release problems are avoided by small shrinkage in lateral direction that is intrinsic
to the process. During phase separation, porosity is introduced and we have shown that this porosity
can be tuned by varying the parameters of the process. Produced films can be sealed to a
transparent cover slip by a combination of pressure and heat. The resulting sealed films are both
thin and flexible and consist of only a single material. We have demonstrated that stacking and
sealing of multiple layers is also possible. The performance of resulting microfluidic assemblies can
be easily tested in a standardized module. A proof‐of‐concept of the benefit of the incorporated
porosity has been given by showing CO2 transport through the channel walls of a multi‐layer chip.
Finally, it has been demonstrated that the gas permeation performance of chips can be enhanced
dramatically by a decrease in chip thickness and incorporation of porosity. This enhancement is so
strong that it enables low permeable materials to compete with PDMS, or even surpass its
performance. Summarizing, we can state that Phase Separation Micro Molding is a very promising
extension of the existing range of microfabrication methods for microfluidic devices.

Fabrication of thin polymeric microfluidic devices with tunable porosity
55
3.6. CITED LITERATURE 1. D.R. Reyes, D. Iossifidis, P.A. Auroux, and A. Manz, Anal. Chem., 2002, 74, 2623‐2636. 2. P.A. Auroux, D. Iossifidis, D.R. Reyes, and A. Manz, Anal. Chem., 2002, 74, 2637‐2652. 3. T. Vilkner, D. Janasek, and A. Manz, Anal. Chem., 2004, 76, 3373‐3385. 4. P.S. Dittrich, K. Tachikawa, and A. Manz, Anal. Chem., 2006, 78, 3887‐3908. 5. E. Verpoorte and N.F.d. Rooij, Proc. IEEE, 2003, 91, 930‐953. 6. H. Becker and C. Gaertner, Electrophoresis, 2000, 21, 12‐26. 7. M. Heckele and W.K. Schomburg, J. Micromech. Microeng., 2004, 14, R1‐R14. 8. J.C. McDonald, D.C. Duffy, J.R. Anderson, D.T. Chiu, H. Wu, O.J.A. Schueller, and G.M. Whitesides,
Electrophoresis, 2000, 21, 27‐40. 9. D. Erickson and D. Li, Anal. Chim. Acta, 2004, 507, 11‐26. 10. A. Gunther, S.A. Khan, M. Thalmann, F. Trachsel, and K.F. Jensen, Lab Chip, 2004, 4, 278‐286. 11. R.W. Tjerkstra, J.G.E. Gardeniers, J.J. Kelly, and A. Van den Berg, J. Microelectromech. Sys., 2000, 9,
495‐501. 12. S. Metz, C. Trautmann, A. Bertsch, and P. Renaud, J. Micromech. Microeng., 2004, 14, 324‐331. 13. H. Hisamoto, Y. Shimizu, K. Uchiyama, M. Tokeshi, Y. Kikutani, A. Hibara, and T. Kitamori, Anal. Chem.,
2003, 75, 350‐354. 14. K. Sato, A. Hibara, M. Tokeshi, H. Hisamoto, and T. Kitamori, Adv. Drug Del. Rev., 2003, 55, 379‐391. 15. E. Verneuil, A. Buguin, and P. Silberzan, Europhysics Letters, 2004, 68, 412‐418. 16. G.C. Randall and P. Doyle, PNAS, 2005, 102, 10813‐10818. 17. J. Drott, K. Lindstrom, L. Rosengren, and T. Laurell, J. Micromech. Microeng., 1997, 7, 14‐23. 18. M.W. Losey, R.J. Jackman, S.L. Firebaugh, M.A. Schmidt, and K.F. Jensen, J. Microelectromech. Sys.,
2002, 11, 709‐717. 19. D. Clicq, R.W. Tjerkstra, J.G.E. Gardeniers, A. van den Berg, G. Baron, and G. Desmet, J. Chrom. A, 2004,
1032, 185‐191. 20. S. Eeltink, F. Svec, and J.M.J. Frechet, Electrophoresis, 2006, 27, 4249‐4256. 21. J. de Jong, R.G.H. Lammertink, and M. Wessling, Lab Chip, 2006, 6, 1125‐1139. 22. C.J.M.V. Rijn, L. Vogelaar, W. Nijdam, J.N. Barsema, and M. Wessling, patent application WO0243937.
2002. 23. L. Vogelaar, J.N. Barsema, C.J.M. van Rijn, W. Nijdam, and M. Wessling, Adv. Mater., 2003, 15, 1385‐
1389. 24. L. Vogelaar, R.G.H. Lammertink, J.N. Barsema, W. Nijdam, L.A.M. Bolhuis‐Versteeg, C.J.M. Van Rijn,
and M. Wessling, Small, 2005, 1, 645‐655. 25. M.H.V. Mulder, Basic Principles of Membrane Technology. 2nd ed. 2000, Dordrecht, The Netherlands:
Kluwer Academic Publishers. 26. R.W. Baker, Membrane technology and applications. 2nd ed. 2004, Chichester, England: John Wiley. 27. Journal of Membrane Science, http://www.sciencedirect.com/science/journal/03767388 (December
2007). 28. M. Girones, I.J. Akbarsyah, W. Nijdam, C.J.M. van Rijn, H.V. Jansen, R.G.H. Lammertink, and M.
Wessling, J. Membrane Sci., 2006, 283, 411. 29. M.E. Avramescu, M. Girones, Z. Borneman, and M. Wessling, J. Membrane Sci., 2003, 218, 219‐233. 30. B.J. Papenburg, L. Vogelaar, L.A.M. Bolhuis‐Versteeg, R.G.H. Lammertink, D. Stamatialis, and M.
Wessling, Biomaterials, 2007, 28, 1998‐2009. 31. M.A. Girardi, Solvent welding, in Handbook of Adhesion, D.E. Packham, Editor. 1992, Longman
Scientific & Technical. p. 433‐436. 32. L. Brown, T. Koerner, H. Hugh Horton, and R.D. Oleschuk, Lab Chip, 2006, 6, 66‐73. 33. Y.C. Su, L. Lin, and A.P. Pisano, J. Microelectromech. Sys., 2002, 11, 736. 34. S.J. Liu, W.F. Lin, B.C. Chang, and G.M. Wyu, Adv. Pol. Tech., 1999, 18, 125‐135. 35. S.M. Ford, B. Kar, S. McWhorter, J. Davies, S.A. Soper, M. Klopf, G. Calderon, and V. Saile, J.
Microcolumn Sep., 1998, 10, 413‐422. 36. Y. Liu, C.B. Rauch, R.L. Stevens, R. Lenigk, J. Yang, D.B. Rhine, and P. Grodzinski, Anal. Chem., 2002, 74,
3063‐3070.

Chapter 3
56
37. A. Muck, J. Wang, M. Jacobs, G. Chen, M.P. Chatrathi, V. Jurka, Z. Vyborny, S.D. Spillman, G. Sridharan, and M.J. Schoning, Anal. Chem., 2004, 76, 2290‐2297.
38. Y.X. Wang, J.W. Cooper, C.S. Lee, and D.L. DeVoe, Lab Chip, 2004, 4, 363‐367. 39. J.H. Li, D. Chen, and G. Chen, Analytical Letters, 2005, 38, 1127‐1136. 40. D. Paul, A. Pallandre, S. Miserere, J. Weber, and J.L. Viovy, Electrophoresis, 2007, 28, 1115‐1122. 41. R.T. Kelly and A.T. Woolley, Anal. Chem., 2003, 75, 1941‐1945. 42. Y.C. Hsieh and J.D. Zahn, Sens. Act. B, 2005, 107, 649‐656. 43. K. Shah, W.C. Shin, and R.S. Besser, Sens. Act. B, 2004, 97, 157. 44. G. Chen, J.H. Li, S. Qu, D. Chen, and P.Y. Yang, J. Chrom. A, 2005, 1094, 138‐147. 45. B.H. Jo, L.M. Van Lerberghe, K.M. Motsegood, and D.J. Beebe, J. Microelectromech. Sys., 2000, 9, 76‐
81. 46. M.A. Unger, H.P. Chou, T. Thorsen, A. Scherer, and S.R. Quake, Science, 2000, 288, 113‐116. 47. R.J. Jackman, T.M. Floyd, R. Ghodssi, M.A. Schmidt, and K.F. Jensen, J. Micromech. Microeng., 2001,
11, 263‐269. 48. K. Toda, S.‐I. Ohira, and M. Ikeda, Anal. Chim. Acta, 2004, 511, 3. 49. D.C. Duffy, J.C. McDonald, O.J.A. Schueller, and G.M. Whitesides, Anal. Chem., 1998, 70, 4974‐4984. 50. T.C. Kuo, D.M. Cannon, Y. Chen, J.J. Tulock, M.A. Shannon, J.V. Sweedler, and P.W. Bohn, Anal. Chem.,
2003, 75, 1861‐1867. 51. E. Leclerc, Y. Sakai, and T. Fujii, Biomed. Microdev., 2003, 5, 109‐114. 52. A.P. Vollmer, R.F. Probstein, R. Gilbert, and T. Thorsen, Lab Chip, 2005, 5, 1059 ‐ 1066. 53. R. Truckenmuller, P. Henzi, D. Herrmann, V. Saile, and W.K. Schomburg, Microsystem Tech., 2004, 10,
372‐374. 54. A. Zanzotto, N. Szita, P. Boccazzi, P. Lessard, A.J. Sinskey, and K.F. Jensen, Biotechnol. Bioeng., 2004,
87, 243‐254. 55. S.H. Chan, N.T. Nguyen, Z. Xia, and Z. Wu, J. Micromech. Microeng., 2005, 15, 231‐236. 56. R. Kurita, N. Yabumoto, and O. Niwa, Biosens. Bioelectr., 2006, 21, 1649. 57. R.M. McCormick, R.J. Nelson, M.G. AlonsoAmigo, J. Benvegnu, and H.H. Hooper, Anal. Chem., 1997,
69, 2626‐2630. 58. P.M. Martin, D.W. Matson, W.D. Bennett, Y. Lin, and D.J. Hammerstrom, J. Vac. Sci. Technol., 1999, 17,
2264‐2269. 59. F. Dang, S. Shinohara, O. Tabata, Y. Yamaoka, M. Kurokawa, Y. Shinohara, M. Ishikawa, and Y. Baba,
Lab Chip, 2005, 5, 472‐478. 60. P. Kathirgamanathan, Polymer, 1993, 34, 3105‐3106. 61. K.F. Lei, S. Ahsan, N. Budraa, J.L. Wen, and J.D. Mai, Sens. Act. A, 2004, 114, 340‐346. 62. A.A. Yussuf, I. Sbarski, J.P. Hayes, M. Solomon, and N. Tran, J. Micromech. Microeng., 2005, 15, 1692‐
1699. 63. C.M. Moore, S.B. Minteer, and R.S. Martin, Lab Chip, 2005, 5, 218‐225. 64. N. Xu, Y. Lin, S.A. Hofstadler, D. Matson, C.J. Call, and R.D. Smith, Anal. Chem., 1998, 70, 3553‐3556. 65. J.D. Xu, L. Locascio, M. Gaitan, and C.S. Lee, Anal. Chem., 2000, 72, 1930‐1933. 66. S. Hediger, A. Sayah, J.D. Horisberger, and M.A.M. Gijs, Biosens. Bioelectr., 2001, 16, 689. 67. I. Alig, D. Braun, R. Langendorf, H.O. Wirth, M. Voigt, and J.H. Wendorff, J. Mat. Chem., 1998, 8, 847‐
851. 68. Permeability and other film properties of plastics and elastomers. 1995, New York: Plastics Design
Library. 69. C.T. Wright and D.R. Paul, Polymer, 1997, 38, 1871‐1878.

57
MEMBRANE ASSISTED GAS‐LIQUID CONTACTING IN MICRO DEVICES
Abstract
In this chapter, the application of membranes in micro gas liquid contactors is studied. Micro
systems are prepared by CNC milling and clamping of dense or porous membranes. This approach
enables rapid prototyping of devices, and quick assembling and disassembling. The absorption of
CO2 in water is taken as a model system for the investigation of mass transfer limiting steps. No mass
transfer resistance is found in the gas phase, but depletion effects can be observed for low gas to
liquid flow rate ratios. When a porous membrane is used, the main mass transfer limitation is
situated in the liquid phase, which is in agreement with general theory. Numerical modeling of this
phase using COMSOL shows that the behavior of micro gas liquid systems can be predicted with
acceptable results using a 2D model with very basic assumptions. When a dense membrane is used,
an additional resistance is found, which can be related to diffusional effects. As an application of
membrane assisted gas‐liquid contacting, we focus on gas based pH control in micro batch systems.
The development of a suitable micro system with in‐line sensors is described. It is demonstrated that
the pH in this system can be increased by several pH units within minutes, by contacting with
ammonia vapor. Absorption of CO2 can be used to correct for overshoot of pH values. Finally,
preliminary results with bakers yeast indicate the possibility to control pH during micro
fermentations experiments.

Chapter 4
58
4.1. INTRODUCTION
Gas‐liquid reactions form an interesting group of reactions for micro devices. Examples include
hydrogenation and fluorination reactions, which cause safety issues on a large scale due to explosion
risks and toxicity/exothermic reactions. Different approaches for micro gas‐liquid contacting have
been investigated. In academics a focus on segmented flow can be detected, induced by direct
joining of gas and liquid in a junction. This method has been recently reviewed in the group of
Jensen [1]. Depending on the ratio of liquid and gas flow rate, different flow regimes can be
obtained. In the Taylor flow regime, liquid segments alternate with gas bubbles. It has been
demonstrated that Taylor flow induces circulation within the liquid segments and a thin liquid film
between the gas phase and the channel wall [2]. In the annular regime, a thin liquid film is formed
on the channel walls throughout the device, and gas is flowing as a continuous phase in the middle
of the channels [3]. The principle of this system has similarities with the falling film micro reactor,
which was developed at the Institut für Mikrotechnik Mainz (IMM) [4]. This last system relies on the
formation of menisci in open micro channels, which are in direct contact with gas.
The general challenge for G‐L systems is the generation of a stable and controllable interface.
Membranes can be used to stabilize the interface between two phases. This concept is already
applied on a large scale in chemical engineering. Applications can be found in removal of acidic
gasses, such as CO2 or H2S, from exhaust gasses, carbonation of soft drinks and in blood oxygenation
(artificial lungs) [5]. Using selective coatings, alkanes can be separated from alkenes [6]. In
microfluidics, membrane‐based gas‐liquid contacting has been applied for sensing gasses, such as
oxygen [7‐9], CO2 [10], NH3 [11], H2S [12, 13] and SO2 [14]. Another well known example is the supply
of oxygen through the walls of PDMS microchips, as used in cell culturing [15]. Fundamental
differences exist between membrane‐based gas‐liquid contacting and segmented gas‐liquid flow. In
membrane contactors, mixing is generally slow due to relatively long diffusion distances and the
absence of recirculating flows. However, this negative effect is compensated by the following
opportunities:
• Gas can be replenished during reactions
• The type of gas can be switched during reactions
• No gas‐liquid separator is needed, since both phases are already separated by the
membrane
• Liquid can be controllably transported to the gas phase by evaporation

Membrane assisted gas‐liquid contacting in micro devices
59
When membranes with a thin skin or a dense coating are used, additional advantages include:
• Use of selectivity of the membrane material
• Pressure of liquid and gas can be adjusted independently.
The opportunities sketched above lead to an increased set of adjustable process parameters, which
can result in better control of reactions, and consequently higher conversion, selectivity and
efficiency. Besides reaction engineering, also separation technologies and analysis can benefit from
the advantages of membranes in gas‐liquid unit operations.
For the development of micro gas‐liquid contactors, it is important to have knowledge of the
mass transfer principles and the set of parameters that ultimately determine the behavior of the
system. In this chapter we present both theoretical and practical considerations. First, a theoretical
background is given. Subsequently, gas absorption measurements are presented in simple micro gas‐
liquid contactors. These devices consist of a membrane clamped between microstructured polymeric
plates, fabricated by CNC machining. This approach enables rapid assembling and disassembling of
the system. Furthermore, CNC machining is a cheap method and very suitable for rapid prototyping
in polymers [16]. Using transparent materials, optical inspection is enabled, which is helpful to
detect possible leakages, wetting of the membrane or condensation of water in the gas channel. The
absorption of CO2 in water has been chosen as a model system. Concentrations of absorbed CO2 are
determined from conductivity measurements. The results are compared to values obtained from a
simple numerical 2D model made in COMSOL Multiphysics. As an application, we focus on a static
microsystem, in which gas‐liquid contacting is used to control pH in micro environments. Such
systems are especially interesting for screening of fermentation reactions. Explorative
measurements are presented to sketch the opportunities.
4.2. THEORETICAL BACKGROUND
The diffusional mass flux J between regions of different concentration can be described by Fick’s first
law:
dxdc
DJ = (1)
For concentration independent diffusion coefficients, this equation can be solved and rearranged
into the following general equation:

Chapter 4
60
( ) cKcδD
ccxx
DJ ov ΔΔ12
12
⋅=⋅−=−⋅−
−= (2)
δ: diffusion distance (m)
Kov: overall mass transfer coefficient (m/s)
∆c: concentration difference (mol/m3)
The overall mass transfer coefficient Kov can be calculated using a resistances‐in‐series model [17]:
EmkkkK LMGOV
1111++= (3)
kG: mass transfer coefficient in the gas phase (m/s)
kM: mass transfer coefficient through the membrane (m/s)
kL: mass transfer coefficient in the liquid phase (m/s)
m: physical dimensionless solubility constant (‐)
E: enhancement factor
The solubility constant m is defined as cA,L/ cA,G , with cA,L and cA,G the equilibrium concentrations of
component A in the liquid and gas phase, respectively. The enhancement factor Ea is used to correct
for enhanced transport caused by chemical reactions. It can be determined from the Hatta number
(Ha), which indicates the increase in absorption rate, compared to physical absorption, in case of a
subsequent chemical reaction. For an irreversible reaction, Ha is given by:
D
kδ
δD
Dk
k
DkHa rr
L
r =
⎟⎠⎞
⎜⎝⎛
⋅=
⋅=
22 (4)
Ha: Hatta number (Ha2 = max. reaction rate in film / max. flux through film)
kr: reaction rate (moln1‐n m3n‐3 s‐1, n = reaction order)

Membrane assisted gas‐liquid contacting in micro devices
61
For Ha < 0.3, the enhancement factor is 1 and cancelled out of the resistance model. For Ha > 2, the
enhancement factor equals Ha. Ha scales linearly with diffusion distances, which are small in
microfluidics. Therefore, enhancement effects by chemical reactions are generally less pronounced
on this scale.
For the design of gas liquid contactors it is useful to determine the rate limiting step; it is this
step that needs optimization. The membrane resistance 1/kM strongly depends on membrane
morphology. For dense membranes, transport is determined by solubility and diffusivity [18], which
are generally lower in polymers than in liquids. The membrane can thus have considerable influence
on the total mass transfer rate, or even be the rate limiting step. Therefore, in commercial gas‐liquid
contacting applications mostly porous membranes are used. Most efficient operation is obtained
when the gas‐liquid interface is situated at the liquid side of the membrane. Transport through the
membrane is then governed by diffusion in a gas phase, which is about 10000 times faster than
diffusion in a liquid phase. The G‐L interface will be on the liquid side as long as the pressure
difference over the membrane is below the Laplace pressure, given by the Laplace equation:
max
Θcos4Δ
d
γp L ⋅⋅
−= (5)
γL: surface tension of the liquid (N/m)
θ: contact angle of the liquid on the membrane material
dmax: maximum pore diameter in the membrane (m)
When the contact angle is below 90°, the Laplace pressure becomes negative and the membrane will
be directly wetted, unless a counterbalancing gas pressure is applied. From the Laplace equation it is
clear that the choice of the membrane material and pore size is crucial to avoid wetting. In general,
hydrophobic materials are used, such as polypropylene and fluorinated polymers, and applied
membranes have pore sizes in the submicron region. The Laplace pressure for water in such systems
(with γwater = 72∙10‐3 N/m, θ = 120°) is typically in the range of a few bars. It is important to remark
that for small systems, such as microfluidic devices, the pressure drop over a channel can easily
exceed the Laplace pressure. In that case, the application of a thin dense polymeric coating may be
considered, at the cost of increased mass transfer resistance. The application of dense coatings, e.g.
PDMS, has the additional advantage that high gas pressures can be used without bubble formation
in the liquid channel. Furthermore, it enables the use of liquids with contact angles below 90° and
the exploitation of selectivity of the coating material [5].

Chapter 4
62
Once a gas or vapor has been absorbed in the liquid phase, it will diffuse due to a concentration
difference between the liquid‐membrane interface and the bulk liquid. The concentration at the
interface ci can be related to the partial pressure pi of a gas or vapor in the pores of the membrane
by Henry’s law:
iii ckp ⋅= (6)
Where ki is the Henry coefficient (Pa.m3/mol). A practical guide for the application of Henry
constants has been published recently [19]. It is important to remark that Henry’s law is only valid
for dilute systems and does not account for subsequent partitioning or reactions of the dissolved gas
within the liquid. The maximum achievable concentration in the liquid micro channel ci,max is limited
by the solubility of the gas or vapor compound in the used liquid at a certain partial pressure. Data
for a large range of compounds can be found in chemical engineering handbooks, such as Perry [20].
In a static system, the concentration of a component at a certain position x after a certain time
interval t can be calculated using Fick’s second law:
2
2
x
cD
t
c ii
i
∂∂
=∂∂
with solution ⎟⎟⎠
⎞⎜⎜⎝
⎛
⋅⋅=
−−
tD
xerf
cc
txcc
iii
ii
4
),(
0,max,
max, (7)
Where ci,0 is the concentration at t=0. From the analytical solution it is evident that diffusion
distance and diffusion time determine the amount of gas that is absorbed in a static gas‐liquid
contacting process. In a dynamic process, the flow profile in the liquid channel also has to be taken
into account, leading to a more complex system of equations. Numerical models can be very helpful
to calculate local concentrations in time and to visualize concentration gradients, as will be shown in
this chapter.
4.3. EXPERIMENTAL
Materials
Devices were fabricated from 1cm thick transparent PMMA plates. Porous hydrophobic
polypropylene membranes (Accurel, thickness 90 μm, porosity 70%) were supplied by Membrana.
Dense PDMS membranes with a thickness of 60 μm were prepared by casting a prepolymer solution
(Dow Corning Sylgard 184) on a glass plate, followed by curing for one day at 60°C. The ratio of

Membrane assisted gas‐liquid contacting in micro devices
63
prepolymer to crosslinking agent was 10:1, and the mixture was degassed before casting.
Demineralized water was made using a Millipore Q‐water apparatus and degassed under vacuum, to
avoid stripping of dissolved gasses during contacting experiments. Carbon dioxide (99,95% Hoek
Loos) was used as contacting gas.
Chip fabrication
Micro channels with depths of 200, 300 and 400 micron were milled in PMMA with a Ø 0.5mm
double cutter using a Sherline 5410 automated CNC‐mill. A serpentine layout was chosen, to obtain
a compact design. The total contactor length was 20cm. Access holes of Ø 1/16” were drilled, in
which PEEK tubing (inner diameter 0.020”, outer diameter 1/16”, Upchurch) was glued using Araldite
2‐component glue. A piece of either PDMS or Accurel membrane was cut to the right dimensions
and directly clamped between two structured plates, using screws. Analysis by scanning electron
microscopy (SEM) revealed that for Accurel, the morphologies of the two surfaces were different,
although the cross section structure of this membrane looked symmetric. In our case, the most
regular side with the smallest pore size and pore size distribution was facing the liquid channel.
Figure 1 shows a photograph of an assembled system with such a membrane.
Figure 1: Assembled micro gas‐liquid contactor. Channels were filled with a colorant to reveal the layout.
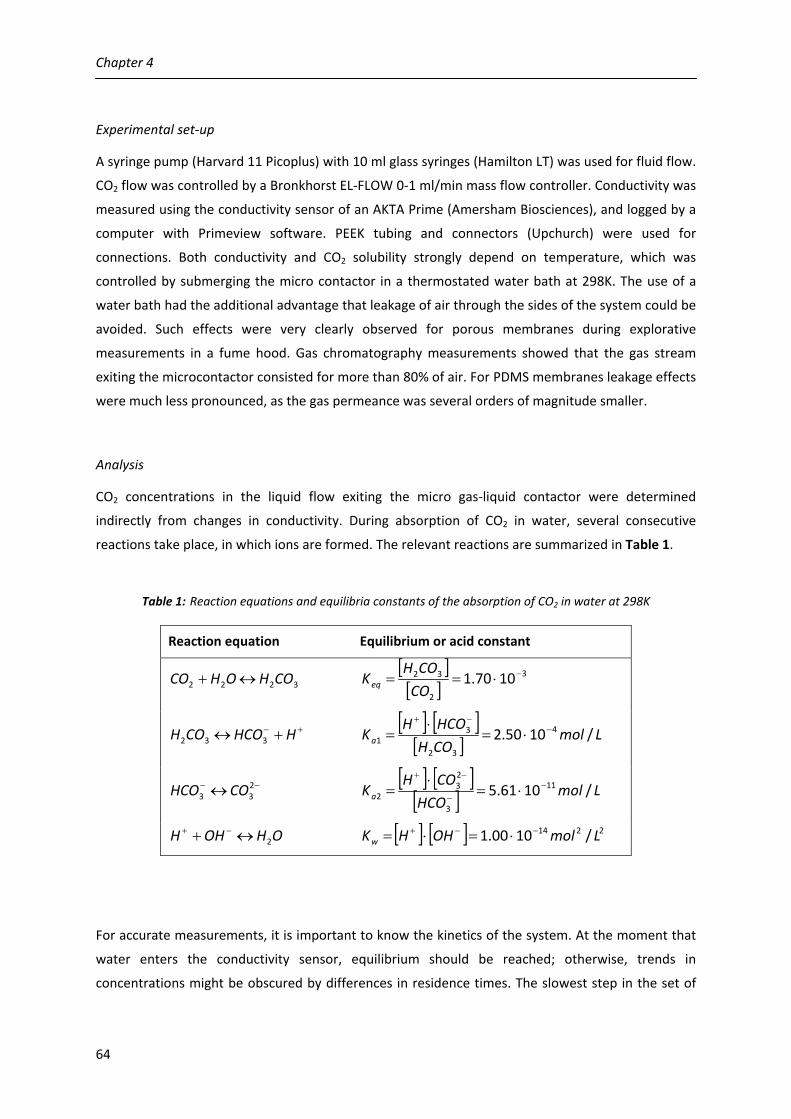
Chapter 4
64
Experimental set‐up
A syringe pump (Harvard 11 Picoplus) with 10 ml glass syringes (Hamilton LT) was used for fluid flow.
CO2 flow was controlled by a Bronkhorst EL‐FLOW 0‐1 ml/min mass flow controller. Conductivity was
measured using the conductivity sensor of an AKTA Prime (Amersham Biosciences), and logged by a
computer with Primeview software. PEEK tubing and connectors (Upchurch) were used for
connections. Both conductivity and CO2 solubility strongly depend on temperature, which was
controlled by submerging the micro contactor in a thermostated water bath at 298K. The use of a
water bath had the additional advantage that leakage of air through the sides of the system could be
avoided. Such effects were very clearly observed for porous membranes during explorative
measurements in a fume hood. Gas chromatography measurements showed that the gas stream
exiting the microcontactor consisted for more than 80% of air. For PDMS membranes leakage effects
were much less pronounced, as the gas permeance was several orders of magnitude smaller.
Analysis
CO2 concentrations in the liquid flow exiting the micro gas‐liquid contactor were determined
indirectly from changes in conductivity. During absorption of CO2 in water, several consecutive
reactions take place, in which ions are formed. The relevant reactions are summarized in Table 1.
Table 1: Reaction equations and equilibria constants of the absorption of CO2 in water at 298K
Reaction equation Equilibrium or acid constant
3222 COHOHCO ↔+ [ ][ ]
3
2
32 1070.1 −⋅==CO
COHKeq
+− +↔ HHCOCOH 332 [ ] [ ][ ] Lmol
COH
HCOHKa /1050.2 4
32
31
−−+
⋅=⋅
=
−− ↔ 233 COHCO
[ ] [ ][ ] LmolHCO
COHKa /1061.5 11
3
23
2−
−
−+
⋅=⋅
=
OHOHH 2↔+ −+ [ ] [ ] 2214 /1000.1 LmolOHHKw−−+ ⋅=⋅=
For accurate measurements, it is important to know the kinetics of the system. At the moment that
water enters the conductivity sensor, equilibrium should be reached; otherwise, trends in
concentrations might be obscured by differences in residence times. The slowest step in the set of

Membrane assisted gas‐liquid contacting in micro devices
65
equilibrium reactions is the formation of H2CO3, which has a forward reaction rate kr1 of 0.039 s‐1 and
a backward reaction rate kr‐1 of 23 s‐1. The increase in H2CO3 concentration in time was estimated
from the equilibrium data and the kinetic data via a mass balance. Within a second, 99.9% of the
equilibrium value was obtained, which was short enough to not influence detection.
The change in conductivity caused by CO2 absorption was related to the CO2 concentration
through a calibration curve. For this curve, the conductivity of pure and CO2‐saturated water was
measured. Assuming a linear relationship between conductivity and total ion concentration, the
amount of CO2 at a certain conductivity increase was calculated using the equilibrium data from
Table 1. The resulting curve is given in Figure 2:
0.000
0.010
0.020
0.030
0.040
0.000 0.010 0.020 0.030 0.040 0.050
Conductivity difference (mS/cm)
[CO2]
Figure 2: Calibration curve for the conversion of measured conductivity differences to CO2 concentration
Numerical modeling
For comparison with the experimental data, a simple 2D model was made using Finite Element
Method software (Comsol Multiphysics 3.3). The following assumptions were made:
• mass transfer resistance is completely located in the liquid phase
• fluid at membrane boundary is saturated with CO2
• parabolic flow profile
• no slip on walls
Maximum concentration for 1 atm, 298K
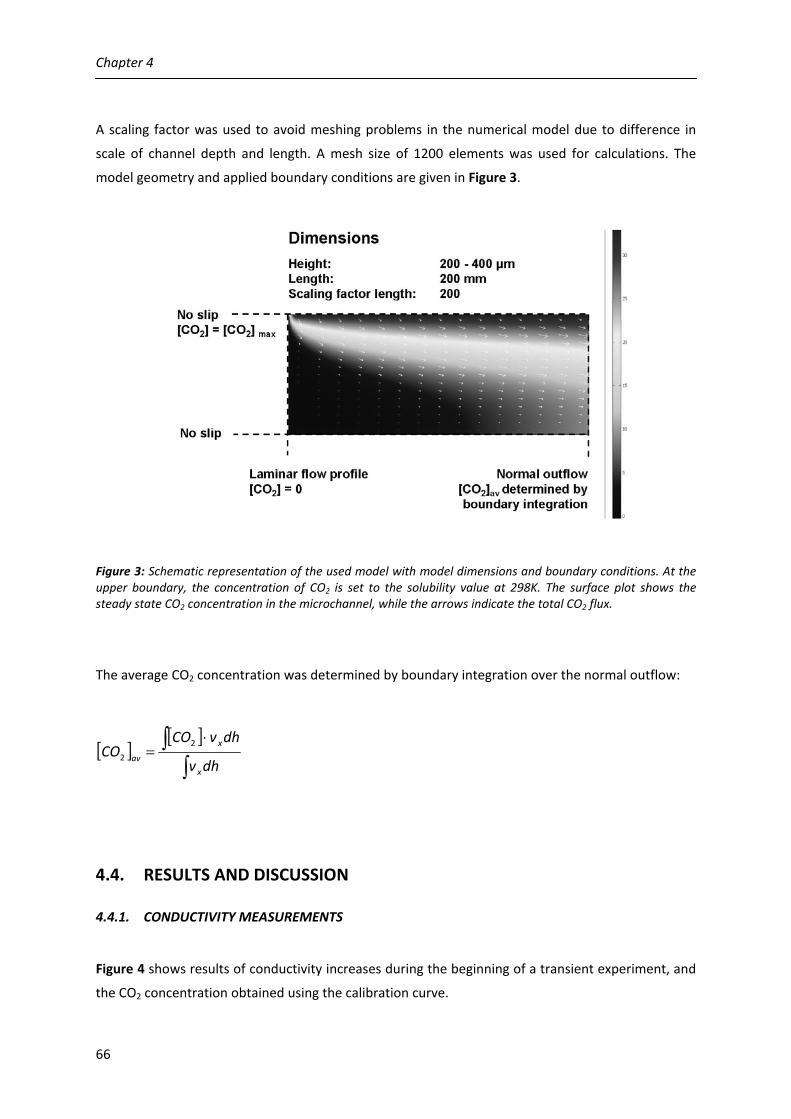
Chapter 4
66
A scaling factor was used to avoid meshing problems in the numerical model due to difference in
scale of channel depth and length. A mesh size of 1200 elements was used for calculations. The
model geometry and applied boundary conditions are given in Figure 3.
Figure 3: Schematic representation of the used model with model dimensions and boundary conditions. At the upper boundary, the concentration of CO2 is set to the solubility value at 298K. The surface plot shows the steady state CO2 concentration in the microchannel, while the arrows indicate the total CO2 flux.
The average CO2 concentration was determined by boundary integration over the normal outflow:
[ ][ ]
∫∫ ⋅
=dhv
dhvCOCO
x
x
av
2
2
4.4. RESULTS AND DISCUSSION
4.4.1. CONDUCTIVITY MEASUREMENTS
Figure 4 shows results of conductivity increases during the beginning of a transient experiment, and
the CO2 concentration obtained using the calibration curve.

Membrane assisted gas‐liquid contacting in micro devices
67
0.000
0.010
0.020
0.030
0.040
0.050
0.060
0.070
0 10 20 30 40 50 60 70 80
time (min)
Con
duct
ivity
(mS/
cm)
0.000
0.005
0.010
0.015
0.020
0.025
0.030
0.035
0 10 20 30 40 50 60 70 80
time (min)
[CO
2] (m
ol/l)
Figure 4: Transient measurement series showing the stabilization of the signal in time. In this specific example, the flow rate was decreased in steps, corresponding to higher residence times and hence higher values. a) conductivity signal; b) calculated CO2 concentration using the calibration curve (Figure 2)
As is visible, the stabilization time during the first measurement was relatively slow, although a high
flowrate of 5 reactor volumes/min was applied. We attribute this to removal of residual air from the
gas side and membrane. When air is present, the effective CO2 concentration is lower. Hence, a
lower conductivity value is found, until the air has been removed. When the same setting was
repeated later in the series, the response was very fast. During measurements, all settings were
randomly repeated, to rule out time dependent effects.
Once the conductivity signal had stabilized, the value was recorded. Stabilization took longer at
low flowrates, as longer times were needed to sweep the hold‐up volume of the micro system,
tubing and conductivity sensor. The sensor had an accuracy of 0.001mS/cm, which was improved by
a factor of 2 by averaging values over time. Drift in sensor signal, determined by measuring the
conductivity of pure water before and after measurement series, proved to be negligible. As is visible
from the calibration curve, the influence of errors in conductivity was the highest when close to the
saturation point.
The following paragraphs describe the results for variations of gas side parameters, liquid side
parameters, and membrane type, in order to determine the mass transfer limiting step.
4.4.2. GAS PHASE LIMITATIONS
Before any measurements can be presented, first some critical considerations and assumptions need
to be discussed. According to theory, pure gasses should not show a limitation in mass transfer in

Chapter 4
68
the gas phase. However, since we apply a non‐humidified gas to an aqueous solution, evaporation of
water will occur. The water vapor effectively decreases the partial pressure of CO2, resulting in a
lower driving force. According to the Antoine equations, the partial pressure of water at standard
conditions is only 0.023 bar, which we consider low enough to neglect. A second risk of evaporation
is that the concentration in the liquid stream is effectively increased, a factor only recently
acknowledged in microfluidics [21, 22]. Assuming ideal gas behavior, a direct link can be made
between the influence of gas flow on liquid evaporation, and consequently, liquid flow. The gas flow
ΦG needed to completely evaporate a liquid flow ΦL:
7000010023.029831.8
181000
Φ
Φ5≈
⋅⋅
⋅=⋅=waterwater
water
L
G
pRT
Mw
ρ
Such values are not realistic for systems were liquid is continuously replenished. In our case, the
highest ratio studied is 40, and evaporation effects on conductivity are thus further neglected. A
third factor that can influence measurements is depletion of gas, if the gas flow rate is not high
enough. The solubility of CO2 in water at room temperature is 33.6 mol/m3, corresponding to a
volume of 0.83 m3 (gas) / m3 (water) when assuming ideal gas behavior. This value is only reached
after sufficient contacting time, and therefore an upper limit; depletion effects are expected below
this ratio. Figure 5 shows the results of gas flow rate variations on CO2 concentration for a fixed
liquid flowrate.

Membrane assisted gas‐liquid contacting in micro devices
69
0.000
0.005
0.010
0.015
0.020
0.025
0.030
0 1 2 3 4 5
Φgas / Φliquid (-)
[CO
2] (m
ol/l)
Accurel
PDMS
Figure 5: Influence of the ratio of gas / liquid flow rate on CO2 absorption for a porous Accurel or dense PDMS membrane. Liquid channel depth 300 μm, Gas channel depth 400 μm. Liquid flow was kept constant at 100 μl/min. The graph shows the independency of CO2 concentration on gas flow rate at ratios > 1. At lower values, depletion effects become visible. Dashed lines are drawn for guidance.
As expected, for both membrane types no influence of gas flow rate can be seen at ratios > 1. For
smaller ratios, depletion effects become visible. To be on the safe side, the gas flow rates in further
experiments were always equal to ‐ or higher than ‐ the liquid flowrate.
4.4.3. LIQUID PHASE LIMITATIONS
To investigate the mass transfer behavior of the liquid side, three reactors with channel depths of
200, 300 and 400 μm were tested for different liquid residence times. The results are shown in
Figure 6:

Chapter 4
70
0.000
0.005
0.010
0.015
0.020
0.025
0.030
0.035
0.040
0 20 40 60 80 100 120 140 160 180
Liquid residence time (s)
[CO
2] (m
ol/l)
200mu
300mu
400mu
comsol 200mu
comsol 300mu
comsol 400mu
Figure 6: Influence of liquid residence time on CO2 absorption for different liquid channel depths, ranging from 200 to 400 μm. Gas channel depth was 400 μm, gas flowrate was 200 μl/min, and a porous Accurel membrane was used. The lines indicate the results from simulations using the 2D COMSOL model.
The presented data show that the saturation value is reached faster for lower channel depths, which
implies shorter diffusion distances. This finding is in agreement with theory, which predicts the main
mass transfer limiting step in the liquid phase. For the same systems, also the calculated values from
the 2D COMSOL model have been plotted. As expected, the values match reasonably, indicating the
feasibility of the use of simple 2D models for screening calculations and prototyping. For practical
applications it is important to realize that residence times and channel dimensions are directly linked
by the flow rate. For a comparison of performance based on equal throughput, the value at a certain
residence time in the 400μm channel should therefore be compared with the value obtained in the
200μm channel at half this time.
4.4.4. MEMBRANE LIMITATIONS
The influence of the membrane on CO2 absorption rate depends on the medium through which CO2
transport occurs. In non‐wetted porous membranes, this is a gas phase. In wetted porous
membranes, it is water, and in dense films it is a polymer. Important parameters for mass transport
are diffusion and solubility. Values for CO2 in PDMS, water and air are given in Table 2.

Membrane assisted gas‐liquid contacting in micro devices
71
Table 2: Diffusion coefficients and solubility values for CO2 in different media at standard conditions
Diffusion coefficients Solubility CO2 in PDMS 5‐30* x 10‐6 cm2/s 1.4 cm3(STP)/cm3.bar CO2 in water [20] 20 x 10‐6 cm2/s 0.8 cm3(STP)/cm3.bar CO2 in air 160000 x 10‐6 cm2/s 1 cm3(STP)/cm3.bar
* diffusion coefficients strongly depend on crosslinking degree
From these values it is clear that transport of CO2 through PDMS and water is comparable in size.
Therefore, the PDMS membrane can be regarded as an additional stagnant fluid layer. For wetted
membranes, where the gas phase in the pores is replaced by liquid, the same argument holds. When
the porous membrane is fabricated out of a material of low permeability, the resistance in the
wetted state can even surpass that of PDMS: the gas liquid contacting region needs to be
compensated by the surface porosity, which is typically in the order of 10%. Assuming that the
Accurel membrane was not wetted during experiments, a better performance is expected compared
to PDMS. This hypothesis is already confirmed by the curves presented in Figure 5, and further
strengthened by the data for different liquid residence times as given in Figure 7.
0.000
0.005
0.010
0.015
0.020
0.025
0.030
0.035
0.040
0 20 40 60 80 100 120 140 160 180
Liquid residence time (s)
[CO
2] (m
ol/l)
comsol
porous membrane
dense membrane
Figure 7: Influence of liquid residence time on CO2 absorption for a porous and a dense membrane. Depth of both liquid and gas channel was 300 μm. The dashed line shows the results obtained from the 2D COMSOL model.

Chapter 4
72
When the Accurel membrane was deliberately wetted with ethanol, absorption measurements
became impossible, as water started to permeate to the gas channel. During normal experiments
with a fresh dry membrane, no permeation was observed, which further indicates the absence of
complete wetting. Nonetheless, partial wetting may have occurred in time, as was recently reported
for similar systems and membranes as the ones used here [23]. The time after which such effects
became apparent was reported to be in the range of hours, similar as in our experiments. However,
in our case, no differences were found in data obtained at equal conditions at the end and beginning
of a measurement series. Still, when developing micro systems for long term testing, it is a factor not
to be overlooked.
Summarizing, the trends that can be distilled from the presented results are similar as are found
on the macro scale: i) the main mass transfer limiting step is found in the liquid phase, ii) dense
membranes contribute to an additional resistance and c) absorption performance is independent of
gas side parameters for a pure gas, except at low ratios of gas/liquid flow rates where depletion
effects can be observed. In the following paragraph, the focus is shifted from obtaining basic
expertise towards a proof‐of‐principle application of gas‐liquid contactors: gas based pH control in
micro environments.
4.5. PROOF OF PRINCIPLE: GAS BASED PH CONTROL
4.5.1. INTRODUCTION
In many gas‐liquid applications, the contacting function is exploited for either analytical purposes or
for reactions. Here, the use of gasses for control of a micro environment is presented. The polymeric
systems that have been described in the previous chapter are especially suited for aqueous
environments. Therefore we decided to focus on pH control by absorption of acidic and/or basic
gasses, with fermentation systems as target application. Historically, fermentation has been used in
beer brewing and wine making. These conventional processes involve the conversion of sugar into
alcohol by micro organisms. With the advances in genetic engineering, the DNA of the used micro
organisms has been succesfully changed, in order to produce specific products. Currently,
fermentation reactors are widely applied for the production of biochemical compounds such as
peptides, vitamins, penicillin and other pharmaceutical ingredients. The modification of micro
organisms is a trial‐and‐error process, as it is very difficult to predict cell behavior based on genetic
sequences only. Numerous experiments are needed for the screening of new strains under different
process conditions and environments. Microsystems are already applied for high throughput
screening and a good candidate for micro bioreactors, as was recognized by several authors [24‐30].

Membrane assisted gas‐liquid contacting in micro devices
73
An important parameter in fermentations is the acidity. During conversion of glucose (a carbon
source), acids and carbon dioxide are produced, while ammonium ions (a nitrogen source) are
consumed. Consequently, the pH of the solution decreases in time, thereby shifting from the ideal
value for cell growth. On the large scale, pH control is easy to achieve, but in microsystems it poses a
serious challenge. The use of buffered media can delay the effects of acidification, but eventually the
pH will drop. Lee et al. demonstrated active pH control, using small reservoirs with acidic or basic
solutions [28]. They showed that cell growth could be maintained for longer times, leading to higher
cell densities. A problem they encountered was related to the fixed volume in microsystems, which
limited the addition of liquids. High base concentrations had to be used, with the risk of damaging
the cells. We propose to control the pH in a microsystem by membrane assisted gas‐liquid
contacting. Currently, membranes are already used to supply oxygen to the micro organisms in
micro fermentors. Our approach offers the following advantages:
• No additional layout required: the same membrane can be used for aeration, supply of acidic
or basic gasses and for removal of gaseous waste products such as CO2. Potentially, also
selective in‐situ removal of (side) products may be achievable.
• No addition of liquid involved, meaning no volume‐based limitations. Therefore:
a) pH can be controlled over longer times
b) gasses can be supplied at concentrations less damaging to the cells
Gasses that are very suitable for pH control are CO2 and NH3, because these are compatible with the
micro organisms. NH3 can simultaneously serve as a nitrogen source for the cells. Moreover, the use
of solutions of NH3 for pH control in micro fermentation reactions has already been successfully
demonstrated [28].
First, the design and fabrication of a suitable micro system is discussed. Subsequently, basic NH3
absorption measurements in this system are presented. Finally, explorative experiments with
Saccharomyces Cerevisiae (bakers yeast) are shown to indicate the possibility to influence pH during
fermentation processes.
4.5.2. MATERIALS AND METHODS
Micro system design
The design of the micro system was largely determined by mass transfer considerations and sensor
dimensions. In a micro fermentor, micro organisms consume oxygen. The oxygen supply rate must at

Chapter 4
74
least equal the consumption rate; otherwise, the cells will change their metabolism and in the worst
case, die. Rapid mixing is desired to enhance oxygen uptake in microsystems. The same reasoning is
valid for the supply of ammonia vapor to control pH. However, rapid mixing is difficult to achieve
due to the lack of turbulence. Some authors have reported on the integration of small mechanical
stirrers [31]. Besides the risk of cell damage by the stirrer blades, there is a practical difficulty with
the integration itself, complicating future scale‐out. Therefore, it was decided not to integrate a
mixer in the system. Consequently, mixing was solely based on diffusion, and a shallow design was
required to obtain small diffusion distances.
A second factor that determined the design, was the sensor system used for analysis. In micro
fermentors, the internal volume is too small to take samples for off‐line analysis. Hence, in‐line
analysis is required. In the electrical engineering department of the University of Twente, an array of
micro sensors was specially designed for fermentation experiments on the micro scale [32]. This
array was chosen for our experiments. It consisted of four sensors integrated onto a silicon‐based
chip. These sensors enabled measurement of temperature, pH, dissolved oxygen concentration (DO)
and viable cell concentration. The chip was sealed to a dipstick using epoxy glue. This glue layer
simultaneously prevented short circuiting, and protected the fragile copper wire bonding between
chip and dipstick. The dimensions of the surrounding glue layer, defined the reactor volume, as is
illustrated in Figure 8.
Figure 8: Schematic of the micro batch system used for pH control
A gas permeable PDMS ‘roof’ with integrated gas channels was used for gas supply. It was
prepared as follows: Accurel polypropylene hollow fibers (inner diameter 0.6mm, outer diameter 1.0
mm) were fixated into polymer tubing (Upchurch, FEP) and placed in a PMMA mold, made by CNC‐
milling. A PDMS prepolymer solution was poured on top (prepolymer: crosslinking agent 10:1) and
subsequently cured for 1 hr at 80oC. Analysis afterwards showed that the PDMS thickness between

Membrane assisted gas‐liquid contacting in micro devices
75
the outer fiber wall and the edge of the PDMS film was in the order of 100 micron. A hole was made
to accommodate the integration of a micro reference electrode. The dipstick and PDMS slab were
mechanically sealed by clamping between PMMA plates, after which. The complete assembled micro
fermentor is depicted in Figure 9.
Figure 9: Schematic 3d representation of the micro fermentor and photograph of the system in operation

Chapter 4
76
Experimental set‐up
Ammonia vapor was generated in a small evaporation unit built in‐house. It consisted of a 20 cm
hollow fiber membrane (Accurel) submerged in an ammonia solution of 25wt% (Merck). Mass flow
controllers (Bronkhorst, EL‐flow series, 0‐1ml/min) were used to control the flow of air, air saturated
with ammonia vapor, and CO2 (Hoek Loos, 99.95%). PEEK Tubing and tube connectors were supplied
by Upchurch Scientific. The analog signal of the pH sensor was amplified by a home made amplifier.
Subsequently, the amplified signal was converted to a digital signal by a data acquisition card
(Labjack U12), connected to a computer with data logging software. The micro reference electrode
(ESA Analytical Ltd, type nr: p/n 66‐EE009FC) was of the Ag/AgCl type. Because fermentation
reactions are temperature sensitive, the fermentor was placed a few centimeters above a water
bath with a constant temperature of 30oC. This also prevented evaporation of water through the
PDMS. The entire setup was covered with aluminum foil to insulate the reactor and shield the pH
sensor from light.
4.5.3. RESULTS AND DISCUSSION
The following three criteria are important for pH control:
• Control accuracy: how accurate can the pH in the reaction volume be measured, and with
what accuracy can NH3 be supplied to the reaction volume?
• Control speed: how long does it take for the sensor to detect changes in pH, taking into
account that pH gradients will exist due to a lack of convective mixing? And how long does it
take for the (extra) NH3 to increase the pH again?
• Control power: is it possible to add sufficient NH3 from the gas phase through the membrane
into the reaction volume to compensate for the consumption of NH3 and the acidification by
cell growth?
Control accuracy
The supply of ammonia vapor could be controled very accurately by mass flow controllers, meaning
that the control accuracy was determined by the accuracy of the ISFET based pH sensor. One of the
disadvantages of such sensors is the liability to drift. This drift was unpredictable at the start of a
measurement, but became linear in the longer term, enabling compensation of data. For dry sensors,
the time to reach the linear drift phase was in the range of hours, but for wet sensors, it was
considerably shorter. Therefore, the ISFET sensor was always stored in water and the micro
reference electrode in 0.1M KCl solution. Furthermore, all pH measurements were performed in the

Membrane assisted gas‐liquid contacting in micro devices
77
dark, because of the sensitivity of the ISFET towards light.
It has been reported that the voltage of the ISFET is by approximation linearly related to pH in
the pH range 4 – 12 . During calibration tests with pH buffers a slope of the pH‐voltage curve was
found of ‐57 ± 2 mV/pH unit, which closely resembles the Nernstian sensitivity value of ‐59.1 mV/pH
unit. The measurement resolution of the AD converter was approximately 5mV. The fluctuations in
measured voltage resulted in an overall sensor accuracy of about 0.2 pH units, which is enough for
fermentation systems.
Control speed
A second factor for the feasibility of gas based pH control is the speed at which a change in pH can
be detected. The control speed is determined by the time delay in the system, which consists of:
• hold‐up time for a pulse of NH3 vapor to get into the system
• diffusion time through the porous membrane and PDMS
• diffusion time through the reaction liquid
• time delay of the sensor
The overall time delay was determined experimentally by monitoring the increase in pH in time
during addition of NH3 vapor to pure water, as shown in Figure 10. It can be seen that the pH started
to increase approximately 60 seconds after the NH3 vapor was introduced into the microsystem. This
is fast enough for pH control in fermentation processes, where pH changes typically occur over
several hours.
Control power
A last factor of importance is the rate at which gasses can be added. To give an indication, an
experiment with pulses of ammonia vapor was carried out. A continuous gas flow of 200 μL/min air
was applied. During three pulses of one minute, 20 μL/min air containing NH3 vapor was introduced.
The stepwise increase in pH induced by absorption of NH3 is illustrated in Figure 11.

Chapter 4
78
6
7
8
9
10
11
0 20 40 60 80 100 120
Time [s]
pH
Figure 10: pH increase due to the absorption of gaseous NH3 into pure water. The air flowrate was 200 μl/min air, mixed with an additional stream of 20 μl/min NH3 vapor. The graph indicates a response time of the system around 1 minute.
6
7
8
9
10
11
0 5 10 15 20 25 30 35
Time [min]
pH
Figure 11: pH control using NH3 and CO2 pulses. Three consecutive pulses of ammonia of 1 minute were given, leading to a stepwise increase in pH from 7 to 10.2. An 8 minute pulse of CO2 reduced the pH again to below 7. Pulses are indicated at the x‐axis.
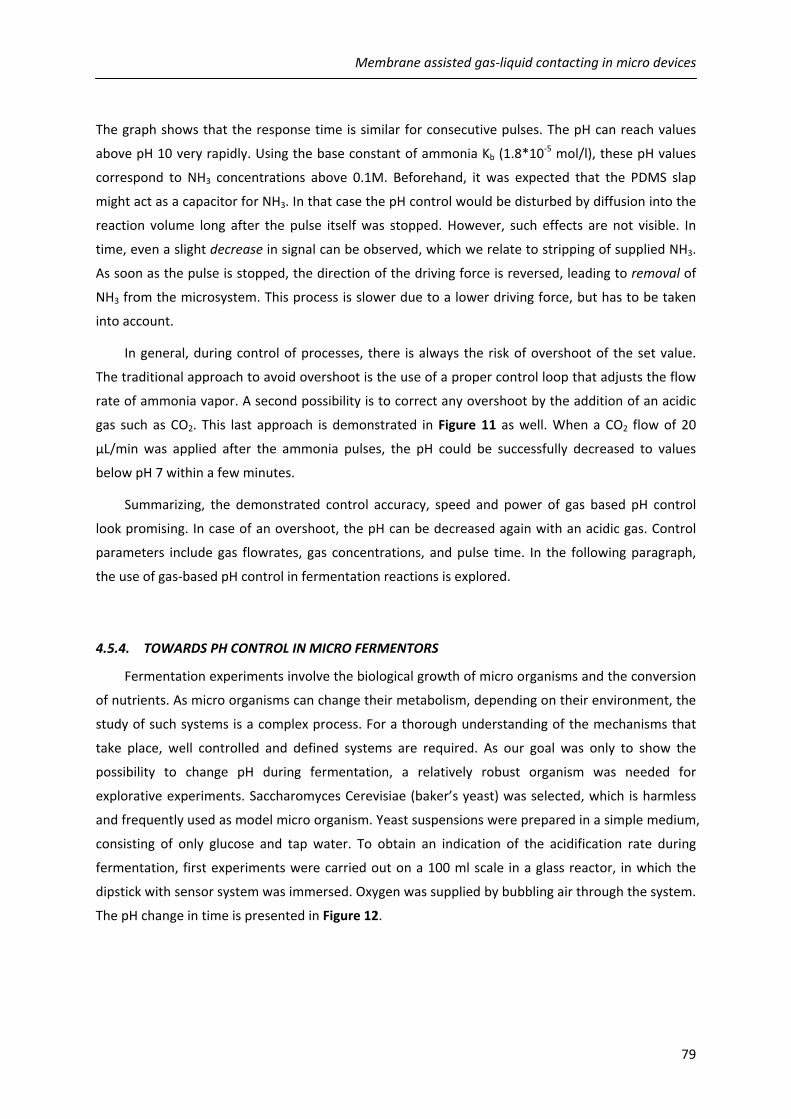
Membrane assisted gas‐liquid contacting in micro devices
79
The graph shows that the response time is similar for consecutive pulses. The pH can reach values
above pH 10 very rapidly. Using the base constant of ammonia Kb (1.8*10‐5 mol/l), these pH values
correspond to NH3 concentrations above 0.1M. Beforehand, it was expected that the PDMS slap
might act as a capacitor for NH3. In that case the pH control would be disturbed by diffusion into the
reaction volume long after the pulse itself was stopped. However, such effects are not visible. In
time, even a slight decrease in signal can be observed, which we relate to stripping of supplied NH3.
As soon as the pulse is stopped, the direction of the driving force is reversed, leading to removal of
NH3 from the microsystem. This process is slower due to a lower driving force, but has to be taken
into account.
In general, during control of processes, there is always the risk of overshoot of the set value.
The traditional approach to avoid overshoot is the use of a proper control loop that adjusts the flow
rate of ammonia vapor. A second possibility is to correct any overshoot by the addition of an acidic
gas such as CO2. This last approach is demonstrated in Figure 11 as well. When a CO2 flow of 20
μL/min was applied after the ammonia pulses, the pH could be successfully decreased to values
below pH 7 within a few minutes.
Summarizing, the demonstrated control accuracy, speed and power of gas based pH control
look promising. In case of an overshoot, the pH can be decreased again with an acidic gas. Control
parameters include gas flowrates, gas concentrations, and pulse time. In the following paragraph,
the use of gas‐based pH control in fermentation reactions is explored.
4.5.4. TOWARDS PH CONTROL IN MICRO FERMENTORS
Fermentation experiments involve the biological growth of micro organisms and the conversion
of nutrients. As micro organisms can change their metabolism, depending on their environment, the
study of such systems is a complex process. For a thorough understanding of the mechanisms that
take place, well controlled and defined systems are required. As our goal was only to show the
possibility to change pH during fermentation, a relatively robust organism was needed for
explorative experiments. Saccharomyces Cerevisiae (baker’s yeast) was selected, which is harmless
and frequently used as model micro organism. Yeast suspensions were prepared in a simple medium,
consisting of only glucose and tap water. To obtain an indication of the acidification rate during
fermentation, first experiments were carried out on a 100 ml scale in a glass reactor, in which the
dipstick with sensor system was immersed. Oxygen was supplied by bubbling air through the system.
The pH change in time is presented in Figure 12.

Chapter 4
80
4
5
6
7
8
9
0 50 100 150 200 250 300 350
Time [min]
pH
Figure 12: Fermentation with saccharomyces cerevisiae on a 100 ml scale, indicating a typical pH drop in time
After a lag phase, in which the cells needed to adept to the environment, the pH slowly dropped to
pH 5.5 over a few hours. As the turbidity increased, it was concluded that cell growth occurred.
Although the fermentation conditions were far from optimal, this showed the possibility to use this
system for explorative testing. Based on the large increase in pH that was obtained in short time
when supplying ammonia to water, as presented in Figure 11, it seemed that the control power of
the micro system was sufficient for fermentations. However, the amount of ammonia needed to
correct for the pH difference cannot be directly calculated from the pH drop, since it is influenced by
multiple factors. First, the fermentation broth has unknown buffering capacity, caused by carbonic
acids produced in glucose conversion. Second, ammonia induces a positive feedback loop: when the
pH is maintained at the ideal value, more cells can grow, which consume more ammonia and cause
higher acidification rates. Consequently, even more ammonia is required. Therefore, the most
practical approach is to provide ammonia in a trial‐and‐error process. Result of micro fermentation
experiments are presented in Figure 13.
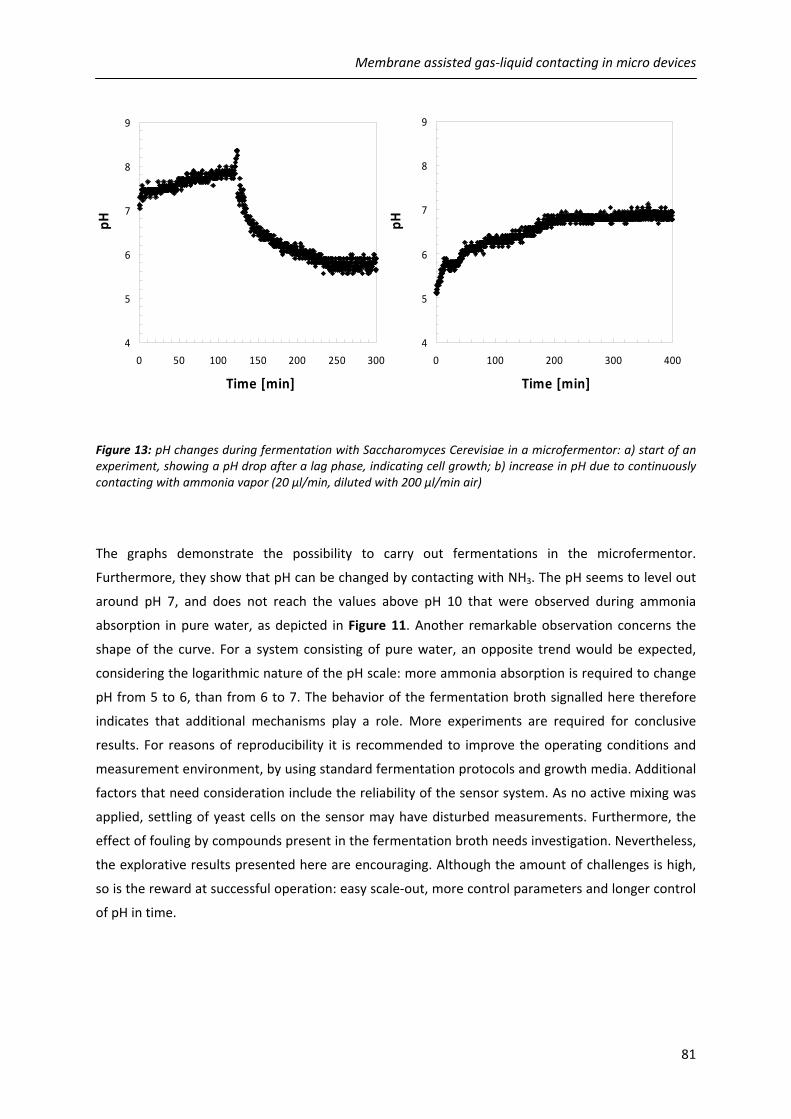
Membrane assisted gas‐liquid contacting in micro devices
81
4
5
6
7
8
9
0 50 100 150 200 250 300
Time [min]
pH
4
5
6
7
8
9
0 100 200 300 400
Time [min]pH
Figure 13: pH changes during fermentation with Saccharomyces Cerevisiae in a microfermentor: a) start of an experiment, showing a pH drop after a lag phase, indicating cell growth; b) increase in pH due to continuously contacting with ammonia vapor (20 μl/min, diluted with 200 μl/min air)
The graphs demonstrate the possibility to carry out fermentations in the microfermentor.
Furthermore, they show that pH can be changed by contacting with NH3. The pH seems to level out
around pH 7, and does not reach the values above pH 10 that were observed during ammonia
absorption in pure water, as depicted in Figure 11. Another remarkable observation concerns the
shape of the curve. For a system consisting of pure water, an opposite trend would be expected,
considering the logarithmic nature of the pH scale: more ammonia absorption is required to change
pH from 5 to 6, than from 6 to 7. The behavior of the fermentation broth signalled here therefore
indicates that additional mechanisms play a role. More experiments are required for conclusive
results. For reasons of reproducibility it is recommended to improve the operating conditions and
measurement environment, by using standard fermentation protocols and growth media. Additional
factors that need consideration include the reliability of the sensor system. As no active mixing was
applied, settling of yeast cells on the sensor may have disturbed measurements. Furthermore, the
effect of fouling by compounds present in the fermentation broth needs investigation. Nevertheless,
the explorative results presented here are encouraging. Although the amount of challenges is high,
so is the reward at successful operation: easy scale‐out, more control parameters and longer control
of pH in time.

Chapter 4
82
4.6. SUMMARY
In this chapter, we have looked into detail at the absorption of gasses in water in membrane assisted
micro gas‐liquid contactors. Microsystems were prepared by CNC milling and clamping of dense and
porous membranes. This approach enabled rapid prototyping of devices, and quick assembling and
disassembling. It was found that sealing issues were very important. Diffusion of air into the system
had a large impact on the measurements. By placing the reactor in a water bath, such leakage effect
could be avoided.
Several parameters were tested to define the mass transfer limiting step for the absorption of
CO2 in water. No mass transfer resistance was found in the gas phase, but depletion effects could be
observed for low gas flow rate / liquid flow rate ratios. The main mass transfer limitation for the
system with a porous membrane was situated in the liquid phase. Subsequent numerical modeling
of this phase in COMSOL showed that the behavior of micro gas liquid systems could be predicted
with acceptable results using a 2D model with very basic assumptions. When a dense membrane was
used, an additional resistance was found.
Gas based pH control in micro batch systems was chosen as a target application, with the
ultimate goal to control fermentation reactions. A suitable microsystem could be fabricated by
sealing a PDMS slap with integrated gas channels to a sensor system. It was demonstrated for
aqueous systems and ammonia vapor that within minutes, the pH could be increased by several pH
units. Overshoot of pH values could be compensated for by the adsorption of CO2. Finally,
preliminary experiments with baker’s yeast provided a proof of principle by showing an increase in
pH during fermentation by contacting with ammonia vapor.
4.7. ACKNOWLEDGEMENTS
The BIOS group is kindly acknowledged for providing the dipstick sensors and the amplifier system.
Furthermore, Erik Krommenhoek is acknowledged for his invaluable help with setting up the
measurements and for fruitful discussions.

Membrane assisted gas‐liquid contacting in micro devices
83
4.8. CITED LITERATURE 1. A. Gunther and K.F. Jensen, Lab on a Chip, 2006. 2. A. Gunther, S.A. Khan, M. Thalmann, F. Trachsel, and K.F. Jensen, Lab Chip, 2004, 4, 278‐286. 3. J. Kobayashi, Y. Mori, K. Okamoto, R. Akiyama, M. Ueno, T. Kitamori, and S. Kobayashi, Science, 2004,
304, 1305‐1308. 4. V. Hessel, P. Angeli, A. Gavriilidis, and H. Lowe, Ind. Eng. Chem. Res., 2005, 44, 9750‐9769. 5. A. Gabelman and S.T. Hwang, J. Membrane Sci., 1999, 159, 61‐106. 6. K. Nymeijer, T. Visser, R. Assen, and M. Wessling, J. Membrane Sci., 2004, 232, 107‐114. 7. S.M. Mitrovski and R.G. Nuzzo, Lab Chip, 2005, 5, 634‐645. 8. C.‐C. Wu, T. Yasukawa, H. Shiku, and T. Matsue, Sens. Act. B, 2005, 110, 342. 9. A.P. Vollmer, R.F. Probstein, R. Gilbert, and T. Thorsen, Lab Chip, 2005, 5, 1059 ‐ 1066. 10. S. Herber, J. Bomer, W. Olthuis, P. Bergveld, and A.v.d. Berg, Biomed. Microdev., 2005, 7, 197. 11. B.H. Timmer, W. Olthuis, and A. Van den Berg, Lab Chip, 2004, 4, 252‐255. 12. K. Toda, S.‐I. Ohira, and M. Ikeda, Anal. Chim. Acta, 2004, 511, 3. 13. S.‐I. Ohira and K. Toda, Lab Chip, 2005, 5, 1374‐1379. 14. S.I. Ohira, K. Toda, S.I. Ikebe, and P.K. Dasgupta, Anal. Chem., 2002, 74, 5890‐5896. 15. G.M. Walker, M.S. Ozers, and D.J. Beebe, Biomed. Microdev., 2002, 4, 161. 16. D. Snakenborg, G. Perozziello, H. Klank, O. Geschke, and J.P. Kutter, J. Micromech. Microeng., 2006, 16,
375‐381. 17. H. Kreulen, C.A. Smolders, G.F. Versteeg, and W.P.M. Vanswaaij, Chem. Eng. Sci., 1993, 48, 2093‐2102. 18. J.G. Wijmans and R.W. Baker, J. Membrane Sci., 1995, 107, 1. 19. F.L. Smith and A.H. Harvey, Chem. Eng. Prog., 2007, 103, 33‐38. 20. Perry's Chemical engineers' Handbook. 6th ed, ed. D.W. Green. 1984: McGraw‐Hill. 21. E. Verneuil, A. Buguin, and P. Silberzan, Europhysics Letters, 2004, 68, 412‐418. 22. G.C. Randall and P. Doyle, PNAS, 2005, 102, 10813‐10818. 23. M. Mavroudi, S.P. Kaldis, and G.P. Sakellaropoulos, J. Membrane Sci., 2006, 272, 103. 24. S. Ostrovidov, J. Jiang, Y. Sakai, and T. Fujii, Biomed. Microdev., 2004, 6, 279‐287. 25. A. Zanzotto, N. Szita, P. Boccazzi, P. Lessard, A.J. Sinskey, and K.F. Jensen, Biotechnol. Bioeng., 2004,
87, 243‐254. 26. E. Leclerc, Y. Sakai, and T. Fujii, Biotechnol. Prog., 2004, 20, 750‐755. 27. F.K. Balagadde, L.C. You, C.L. Hansen, F.H. Arnold, and S.R. Quake, Science, 2005, 309, 137‐140. 28. H.L.T. Lee, P. Boccazzi, R.J. Ram, and A.J. Sinskey, Lab Chip, 2006, 6, 1229‐1235. 29. Z.Y. Zhang, P. Boccazzi, H.G. Choi, G. Perozziello, A.J. Sinskey, and K.F. Jensen, Lab Chip, 2006, 6, 906‐
913. 30. E. Figallo, C. Cannizzaro, S. Gerecht, J.A. Burdick, R. Langer, N. Elvassore, and G. Vunjak‐Novakovic, Lab
Chip, 2007, 7, 710‐719. 31. E.E. Krommenhoek, Integrated electrochemical sensor array for on‐line monitoring micro bioreactors.
2007, PhD thesis, University of Twente. 32. E.E. Krommenhoek, M. van Leeuwen, J.G.E. Gardeniers, W.M. van Gulik, A. van den Berg, X. Li, M.
Ottens, L.A.M. van der Wielen, and J.J. Heijnen, Biotechnol. Bioeng., 2007, 9999, n/a.

Chapter 4
84

85
GENERATION OF LOCAL CONCENTRATION GRADIENTS
BY GAS‐LIQUID CONTACTING
Abstract
In this chapter, a generic concept is presented to create local concentration gradients, based on the
absorption of gasses or vapors in a liquid. A multilayer microfluidic device with crossing gas and
liquid channels is fabricated by micro milling and used to generate multiple gas‐liquid contacting
regions, separated by a hydrophobic membrane. Each crossing can act as both a micro dosing and
micro stripping region. Furthermore, the liquid and gas phases can be operated independently of
each other. The focus of this conceptual chapter is on the generation of pH gradients, by locally
supplying acidic or basic gases/vapors, such as carbon dioxide, hydrochloric acid and ammonia,
visualized by pH sensitive dyes. Complex stationary and moving gradients are presented in devices
with 500 μm channel width, depths of 200‐400 μm and lengths of multiple cm’s. Furthermore, it is
shown that the method allows for multiple consecutive gradients in a single micro channel.
Achievable concentration ranges depend on contacting time, and are ultimately limited to solubility
of used components. The reported devices are easy to fabricate, and their application is not limited
to pH gradients. Two proof of principles are demonstrated to indicate new opportunities: i) local
crystallization of NaCl using HCl vapor, and ii) consecutive reactions of ammonia with copper (II) ions.

Chapter 5
86
5.1. INTRODUCTION
Concentration gradients are present in daily life and can appear when two or more distinct phases
meet. In reaction engineering, these gradients are generally undesired, since they affect selectivity
and conversion. Therefore, emphasis in research is often on rapid mixing. On the other hand,
especially in analysis, concentration gradients can be beneficial. Such gradients are currently used in
separation and fractionation of samples, e.g. in Iso Electric Focusing (IEF) or conductivity gradient
focusing (CGF) [1]. Also in the study of cell responses and in screening of crystallization conditions,
concentration gradients play an important role. Three major categories can be distinguished,
depending on the intended purpose: gradient in concentration of a certain chemical; gradient in
conductivity/ionic strength; and gradient in pH.
The most direct method for creating a concentration gradient in a liquid is by diffusion between
laminar liquid streams with varying concentrations. Different concentration profiles can be obtained,
by using layouts that can vary from simple Y junctions to complex split‐and‐recombine structures [2‐
12]. In these cases, convective mass transport plays a major role, since the streams are directly
linked to each other. Ismagilov and coworkers showed that the convective mass transport could be
ruled out by using polycarbonate membranes as diffusional contacts between two liquids [13]. Due
to the high pressure drop over the membrane, the flow rate of the liquid streams could be varied
independently. Fa et al. used a similar device to selectively introduce protons into a separation
channel [14]. May and Hillier applied a spatially varied electric field to induce local reduction and
oxidation of water into protons (at the anode) and hydroxyl ions (at the cathode) [15]. Disadvantage
of their system was the formation of hydrogen and oxygen gasses due to electrochemical reactions,
leading to undesired bubble formation in the micro channels. Mitrovski and Nuzzo avoided this
problem by using the oxygen reduction reaction (ORR), where oxygen is reduced to hydroxyl ions
[16]. Byers and coworkers immobilized the enzyme urease on a thin membrane. The ammonia that
was produced in the reaction, was neutralized with protons diffusing into the membrane from one
side, thereby forming a pH gradient [17]. A last example was demonstrated by Abhyankar and
coworkers, who reported a flow‐less system where diffusion was used to create chemical gradients
[18].
The methods mentioned above are based on liquid phases only. Gasses or vapors can also be
used to create a concentration gradient in a liquid. Beebe’s group demonstrated a pH gradient
caused by absorption of acetic acid vapor [19]. In previous work we have shown the formation of a
pH gradient in a porous microfluidic device by absorption of carbon dioxide through the channel
walls [20, 21]. This gas‐liquid contacting approach offers several advantages. First, the volume
increase of the liquid stream is negligible, meaning no dilution of samples. Second, since gas
absorption is a reversible process, the absorbed gasses can be removed afterwards. And third, no

Generation of local concentration gradients by gas‐liquid contacting
87
back diffusion of solutes from the liquid stream can occur, an issue encountered in liquid‐liquid
contacting. Here, we extend the approach of using a gas phase to change the composition of a liquid.
Our method is based on multiple gas‐liquid contacting regions, where a liquid in a micro channel is
exposed to different gasses or vapors. This approach enables the formation of several consecutive
gradients in a single channel. A schematic is given in Figure 1.
Figure 1: Schematic of a micro gas‐liquid membrane contactor with multiple contacting regions: a) 3d view; b) top view and c) cross section. Local absorption of different gasses or vapors leads to consecutive concentration gradients.
A hydrophobic membrane is integrated to obtain a stable gas‐liquid interface. Using this
configuration, gas and liquid flows can be regulated independently. Our concept can therefore be
considered as a gas‐liquid analogy to the fluid‐fluid diffusional contacts that were reported by
Whitesides’ group [13].
The goal of this chapter is a) to demonstrate the opportunities that this new approach offers,
and b) to give basic design and operation considerations for future development. We focus on the
creation of multiple repetitive pH gradients in different device lay‐outs and operation modes.
Furthermore, we will provide a basic background on gas‐liquid contacting and mass transfer.
5.2. BACKGROUND
Membrane‐assisted gas‐liquid contacting is well known in chemical engineering. Applications can be
found in removal of acidic gasses, such as CO2 or H2S, from exhaust gasses, carbonation of soft drinks
and in blood oxygenation (artificial lungs) [22]. Using selective coatings, alkanes can be separated
from alkenes [23]. In microfluidics, membrane‐based gas‐liquid contacting has been applied for
sensing gasses, such as oxygen [16, 24, 25], CO2 [26], NH3 [27], H2S [28, 29] and SO2 [30]. Another

Chapter 5
88
well known example is the supply of oxygen through the walls of PDMS microchips, as used in cell
culturing [31]. However, in those examples, the obtained gradient is more an undesired
consequence then a goal; much effort is put in optimizing mass transfer by mixing. In this article, the
concentration gradient is the goal itself. We will first provide some general theory to be able to
understand the physics in a membrane‐based gas‐liquid contactor and how this can be related to
concentration profiles and gradients.
The diffusional mass flux J between regions of different concentration can be described by
Fick’s first law:
dxdc
DJ = (1)
For concentration independent diffusion coefficients, this equation can be solved and rearranged
into the following general equation:
( ) cKcδD
ccxx
DJ ov ΔΔ12
12
⋅=⋅−=−⋅−
−= (2)
δ: diffusion distance (m)
Kov: overall mass transfer coefficient (m/s)
∆c: concentration difference (mol/m3)
The overall mass transfer coefficient Kov can be calculated using a resistances‐in‐series model [32]:
EmkkkK LMGOV
1111++= (3)
kG: mass transfer coefficient in the gas phase (m/s)
kM: mass transfer coefficient through the membrane (m/s)
kL: mass transfer coefficient in the liquid phase (m/s)
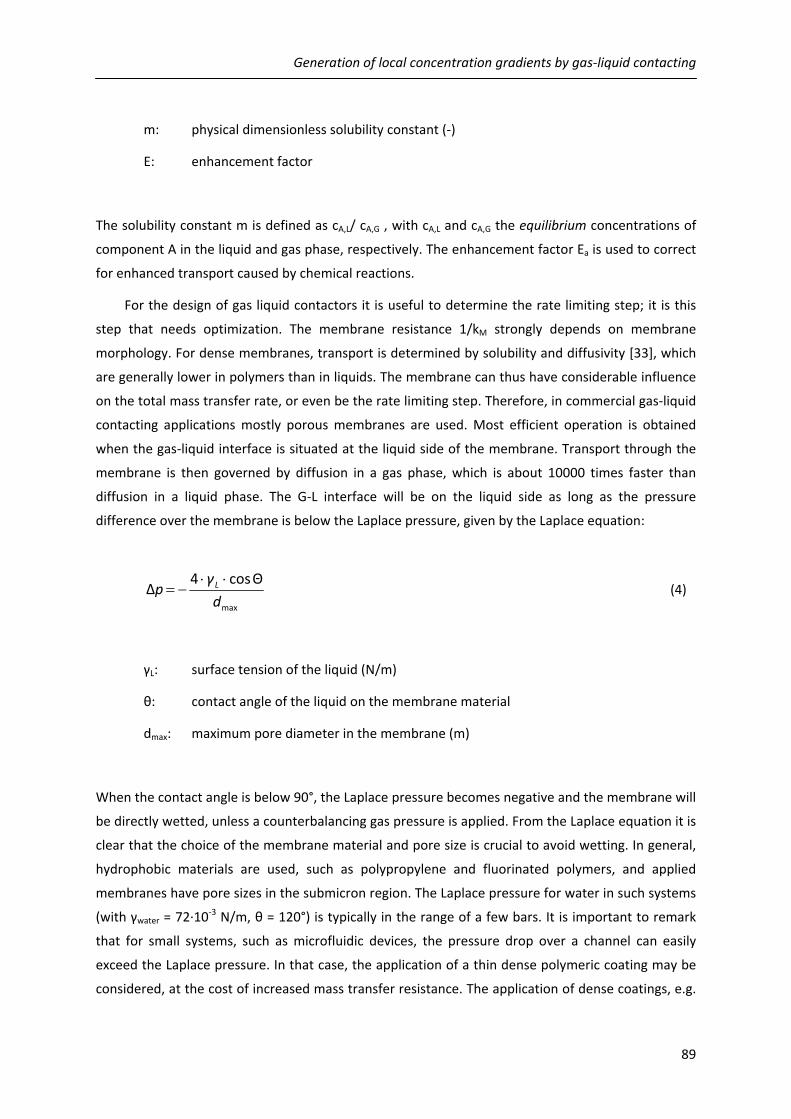
Generation of local concentration gradients by gas‐liquid contacting
89
m: physical dimensionless solubility constant (‐)
E: enhancement factor
The solubility constant m is defined as cA,L/ cA,G , with cA,L and cA,G the equilibrium concentrations of
component A in the liquid and gas phase, respectively. The enhancement factor Ea is used to correct
for enhanced transport caused by chemical reactions.
For the design of gas liquid contactors it is useful to determine the rate limiting step; it is this
step that needs optimization. The membrane resistance 1/kM strongly depends on membrane
morphology. For dense membranes, transport is determined by solubility and diffusivity [33], which
are generally lower in polymers than in liquids. The membrane can thus have considerable influence
on the total mass transfer rate, or even be the rate limiting step. Therefore, in commercial gas‐liquid
contacting applications mostly porous membranes are used. Most efficient operation is obtained
when the gas‐liquid interface is situated at the liquid side of the membrane. Transport through the
membrane is then governed by diffusion in a gas phase, which is about 10000 times faster than
diffusion in a liquid phase. The G‐L interface will be on the liquid side as long as the pressure
difference over the membrane is below the Laplace pressure, given by the Laplace equation:
max
Θcos4Δ
d
γp L ⋅⋅
−= (4)
γL: surface tension of the liquid (N/m)
θ: contact angle of the liquid on the membrane material
dmax: maximum pore diameter in the membrane (m)
When the contact angle is below 90°, the Laplace pressure becomes negative and the membrane will
be directly wetted, unless a counterbalancing gas pressure is applied. From the Laplace equation it is
clear that the choice of the membrane material and pore size is crucial to avoid wetting. In general,
hydrophobic materials are used, such as polypropylene and fluorinated polymers, and applied
membranes have pore sizes in the submicron region. The Laplace pressure for water in such systems
(with γwater = 72∙10‐3 N/m, θ = 120°) is typically in the range of a few bars. It is important to remark
that for small systems, such as microfluidic devices, the pressure drop over a channel can easily
exceed the Laplace pressure. In that case, the application of a thin dense polymeric coating may be
considered, at the cost of increased mass transfer resistance. The application of dense coatings, e.g.

Chapter 5
90
PDMS, has the additional advantage that high gas pressures can be used without bubble formation
in the liquid channel. Furthermore, it enables the use of liquids with contact angles below 90° and
the exploitation of selectivity of the coating material [22].
Once a gas or vapor has been absorbed in the liquid phase, it will diffuse due to a concentration
difference between the liquid‐membrane interface and the bulk liquid. The concentration at the
interface ci can be related to the partial pressure pi of a gas or vapor in the pores of the membrane
by Henry’s law:
iii ckp ⋅= (5)
Where ki is the Henry coefficient (Pa.m3/mol). A practical guide for the application of Henry
constants has been published recently [34]. It is important to remark that Henry’s law is only valid
for dilute systems and does not account for subsequent partitioning or reactions of the dissolved gas
within the liquid. The maximum achievable concentration in the liquid micro channel ci,max is limited
by the solubility of the gas or vapor compound at a certain partial pressure in the used liquid. Data
for a large range of compounds can be found in chemical engineering handbooks, such as Perry [35].
The time needed to reach the equilibrium concentration ci,max at a certain position can be estimated
using Fick’s second law: In a static system, the concentration of a component at a certain position x
after a certain time interval t can be calculated using Fick’s second law:
2
2
x
cD
t
c ii
i
∂∂
=∂∂
with solution ⎟⎟⎠
⎞⎜⎜⎝
⎛
⋅⋅=
−−
tD
xerf
cc
txcc
iii
ii
4
),(
0,max,
max, (6)
Where ci,0 is the concentration at t=0. From the analytical solution it is evident that it takes
infinite time to reach exactly the same concentration at every position. To reduce the time to reach
a certain concentration, one can a) reduce the diffusion distance, by making shallow channels or b)
use gas/vapor streams with partial pressures that correspond to a liquid equilibrium concentration
that is much higher than the required concentration, in order to have a high driving force.
Furthermore, micro mixers may be used to enhance mass transfer in the liquid phase.
In this chapter, we focus on 3 compounds to generate pH gradients: carbon dioxide (CO2),
hydrochloric acid (HCl) and ammonia (NH3). Carbon dioxide is directly supplied as a gas, while NH3
and HCl are obtained from the vapor of solutions of these compounds. For pure CO2, the solubility in
water is 33.6 mol/m3 at 1 bar and 298K, corresponding to a minimum pH of 3.9. The achievable pH

Generation of local concentration gradients by gas‐liquid contacting
91
for HCl and NH3 depends on the composition of the solutions from which the vapor is generated. To
give a rough indication, we tested the change in pH when a piece of wetted pH paper was held
above solutions of 37wt% HCl or 25wt% NH3. Within seconds, the pH dropped to 1 (HCl) or increased
to 10 (NH3), which means that a large part of the total pH range can be covered using these vapors.
5.3. EXPERIMENTAL
Materials
Devices were fabricated from 1cm thick PMMA plates. Hydrophobic polypropylene membranes
(Accurel, porosity 70%) were supplied by Membrana. Demineralized water was made using a
Millipore Q‐water apparatus. A universal pH indicator solution was prepared by dissolving 30.6mg
bromo thymol blue, 2.6 mg tymol blue, and 6.2 mg methyl red in 100ml Q‐water. In standard
procedures for pH indicator solutions often alcohol is added to enhance the dissolution. Since this
compound promotes wetting of the membrane it was left out in our experiments. Furthermore, the
used concentration was relatively high compared to standard procedures in order to obtain good
contrast in the shallow channels. The pH of the indicator solutions was adjusted with 0.1M NaOH
solution or 0.1M HCl. Solutions were sieved through 0.45 micron filters (Spartan, Whatman) before
testing. Carbon dioxide (99,95% Hoek Loos) and nitrogen (99.99% Hoek Loos) were used as
contacting gasses. Nitrogen was bubbled through either an ammonia solution (5wt%, prepared from
25wt% ammonia, Merck) or HCl solution (1M, prepared from 37wt% fuming HCl, Merck) to obtain a
stream of ammonia or HCl vapor, respectively.
Chip fabrication and experimental set‐up
Micro channels with a depth of 300 micron were milled in PMMA with a Ø 0.5mm double cutter
using a Sherline 5410 automated CNC‐mill. Holes of Ø 1mm were drilled from the channel end till
half the thickness of the plate. Then 1/16” access holes were drilled from the side. PEEK tubing
(inner diameter 0.5mm, outer diameter 1/16”, Upchurch) was glued in using Araldite 2‐component
glue and used for connections. A piece of Accurel membrane was cut to the right dimensions and
directly clamped between two structured plates, using screws. Analysis by scanning electron
microscopy (SEM) revealed that the morphologies of the two surfaces were different, although the
cross section structure of this membrane looks symmetric. In our case, the most regular side with
the smallest pore size and pore size distribution was facing the liquid channel. A syringe pump
(Harvard 11 Picoplus) with 1 ml glass syringes (Hamilton TLL) was used for fluid flow. Small vapor
generators were prepared in house. Nitrogen flow was controlled using Bronkhorst EL‐FLOW 0‐1
ml/min mass flow controllers.

Chapter 5
92
Characterization
The prepared micro contactors were characterized in two flow modes, with regards to the liquid
side: stopped‐flow and continuous flow. In both cases, gasses were supplied continuously. Both
single and dual gas experiments were performed. The pH gradients created by absorption and
subsequent reaction of the supplied gasses, were visualized by pH indicator solution. Although this
method does not give very strong quantitative information, it is very powerful to demonstrate the
shape of concentration profiles. The relation between color and pH was determined by titration. For
pH values below 4.5, the color was yellow‐orange, changing via green (pH 7) to blue (pH >8.5). We
designed the experimental conditions in such a way that resulting pH profiles matched with the color
change trajectory of the pH indicator. A Canon IXUS 6.0 digital camera was used for normal imaging.
For closer optical inspection a Zeiss Axiovert 40 optical microscope was used with a polarizer, to
avoid reflections of the PMMA.
5.4. RESULTS AND DISCUSSION
5.4.1. SINGLE GAS EXPERIMENTS
Figure 2 shows pH gradients created in a stopped‐flow microfluidic contactor with multiple
contacting regions. Using this flow mode, the fluid in the liquid channel can be locally saturated with
a certain gas in such a way that plugs are formed. When one gas channel is used for multiple
contacting regions, at every position a certain amount of gas will be absorbed. Therefore, the gas
concentration will decrease in the length of the gas channel, leading to a decreased driving force for
transport, and ultimately different plug lengths in the liquid channel. For ammonia vapors we found
this effect very pronounced. During movement of the plugs, a parabolic flow profile can be observed.
The dispersion generated by the parabolic flow profile leads to different pH profiles.
When the same device is operated in continuous flow, a system is obtained that is more similar
to traditional gas‐liquid membrane contactors. The main difference is that there is no continuous
contact between gas and liquid side, and therefore, the pH profile will change in steps rather than in
a smooth manner. A typical example is given in Figure 3. At every passing over the gas‐liquid
contacting area, ammonia is absorbed, leading to a step wise increase in pH. The maximum pH range
that can be achieved using a single gas depends on the pH of the starting solution and the type and
concentration of applied gas or vapor.

Generation of local concentration gradients by gas‐liquid contacting
93
Figure 2: Stopped‐flow pH gradient. Ammonia vapor is flowing from right to left in a back structure, indicated by the dashed rectangle, at 50μl/min. Since ammonia is absorbed, the concentration in the vapor phase decreases from right to left, leading to a lowered driving force and hence to plugs of different length (A). When the liquid in the device is shortly pumped, the plugs can be shifted (B), and new plugs can be formed (C). Starting pH value 3.5, blue indicates pH > 8.5. Channel width is 500µm
Figure 3: Continuous flow pH gradient. Ammonia vapor is flowing from right to left in a back structure, indicated by the dashed rectangle, at 50μl/min. Fluid flows from left to right with different flow rates: a) 20; b) 10; c) 5 µl/min. Starting pH value: 3.5, blue indicates pH > 8.5. Channel width is 500µm
5.4.2. MULTIPLE GAS EXPERIMENTS
More freedom in operation can be achieved by using multiple gasses. Figure 4 shows images of a
dual‐gas chip operated in continuous mode. The meandering liquid channel is placed on alternating
channels, where either NH3 vapor or CO2 is supplied. Effectively, the liquid is contacted with basic
and acidic environments, thereby creating stagnant reversing pH gradients in a continuous flow,
which we call “pH‐switch”. The flow profile in this device is illustrated by the shape of the color
change trajectory.

Chapter 5
94
Figure 4: Continuous switching pH gradients induced by pure CO2 and NH3 vapor: a) schematic showing the back structure with the gas channels and the flow directions; b) pH profiles for different CO2/NH3 flow ratios. The flow rate of the pH indicator was 4 µl/min for all cases, with a starting pH value of 7. Yellow: pH ~ 5.5; Blue pH > 8.5. Channel width is 500µm.
Figure 5: Variations of pH profile with liquid flow rate, using HCl and NH3 vapor: a) continuous pH switch, at increasing flow rate of the pH indicator solution (HCl vapor 500 µl/min, NH3 vapor 500 µl/min); b) stopped flow pH switch after different contact times (HCl vapor 1000 µl/min, NH3 vapor 100 µl/min). Yellow‐orange: pH <4.5; Blue: pH >8.5. Channel width is 500µm

Generation of local concentration gradients by gas‐liquid contacting
95
This effect enables us to check if a) the fluid in the channel is stagnant or flowing and b) if the
outlining between gas and liquid side is accurate. Besides the ratio and flow rate of the gas streams,
the flow rate of the liquid stream can also be used to manipulate the pH profile, as is illustrated in
Figure 5. Here HCl vapor was used instead of CO2. Since HCl is a much stronger acid, lower pH values
can be reached, as is demonstrated by the images.
The absorption of HCl/NH3 and CO2/NH3 in water, leads to the formation of a buffered solution
as more and more ions are formed. Furthermore, the longer the contact time, the more the
concentration of the components approaches the equilibrium value, and the lower the driving force
for transport. Therefore, the pH gradient in continuous mode is not switching between fixed values
after each repeating structure. Depending on the rate of absorption and the created buffering
strength, the solution might already be stable after a short contacting period. Of course the behavior
strongly depends on the type, concentration and interactions of the chosen gasses and vapors,
combined with residence times in the micro device.
In the examples shown thus far, the pH effect of “gas 1” was compensated by an opposite effect
of “gas 2”, which led to an increase in ionic strength. A different approach is to exploit the
reversibility of absorption: gas 1 can be removed with an inert stripping gas. An example is presented
in Figure 6. Absorption of carbon dioxide leads to the formation of carbonic acid, which acidifies the
water. This reaction is a thermodynamic equilibrium, depending on the carbon dioxide partial
pressure pCO2. Since the pCO2 is zero in the nitrogen section, CO2 is desorbed here, leading to (partial)
restoration of the pH towards the initial value. This desorption process is much slower than the
absorption process, since the driving force is much lower. Furthermore, the subsequent reactions of
CO2 in water need to be reversed before desorption can take place. Therefore, it is not surprising
that the change in pH is limited in continuous flow mode. Optimization of the residence times in the
desorption section is required to increase the effectiveness.
From Figure 4‐6, some more observations can be made about the position of color change. We
have noticed that this position can shift along the channels, even to zones were it would not be
expected. Two effects play a role. First, the observed color is largely determined by the darkest color.
As the gas is supplied from the bottom, a concentration gradient will be created along the depth of
the channel. Mixing by diffusion in perpendicular direction causes leveling of the concentration
gradient, and can lead to a distinct color change. A second factor, which is in our opinion more
important, is interdiffusion of the gasses between the channels, in the planar direction of the
membrane. In the presented experiments, the membrane was hand‐tight clamped by screws,
leading to negative embossing of the structure of the channels in the membrane. Starting out with a
thickness of 90 microns for the fresh membrane, an average thickness of 40 microns was measured
after clamping. The thickness of the freestanding membrane part between the channels remained
around 90 microns.

Chapter 5
96
Figure 6: Creation of pH gradients using absorption and desorption. Absorption of CO2 leads to acidification of the water. Nitrogen is used to shift the equilibrium and to strip the CO2 again, (partly) restoring the pH to the initial value. a) continuous flow mode; b) stopped flow mode. The pH of the starting solution was 9. Yellow: pH ~ 5.5, Blue: pH > 8.5. CO2 flow 100 μl/min, N2 flow 1000 μl/min. Channel width is 500µm.
Figure 7: Demonstration of planar diffusion through the membrane: a) schematic cross section, showing the direction of transport through the embossed porous membrane; b) continuous flow gradient in a device where gas and liquid channels are present in the same plane; c) schematic of a device where cross‐over of gasses is avoided. The liquid channel is meandering through the plate, and two separate membranes are used for gas‐liquid contacting.Channel width is 500µm
Figure 8: Effects of gas absorption on solubility of other compounds: a) precipitation of pH indicator in continuous flow, by absorption of HCl vapor from a 37wt% solution; b) local crystallization in a 2M NaCl solution, by absorption of HCl vapor from a 37wt% solution. The dashed lines indicate the gas channel; c) precipitation of Cu(OH)2 from the reaction of Cu2+ ions with hydroxyl ions, generated by absorption of ammonia. In excess of ammonia, a consecutive reaction leads to dissolution and complexation of the light blue Cu(OH)2 to Cu(NH3)4
2+, which is a dark blue complex. Channel width is 500 μm for all images.

Generation of local concentration gradients by gas‐liquid contacting
97
However, with an initial porosity of 70%, still porosity was left in the compressed parts. Since
there is a clear concentration gradient between the channels for both gasses in our devices, diffusion
will occur. In case of different pressure drops over the gas channels, even convective flux of gasses
may be observed between channels. Practically this means that a certain gas concentration gradient
is created in the membrane, which is then superposed onto the liquid channel. The strong cross‐over
effect is intrinsic to the use of gasses; in liquid‐liquid contacting, its effect is orders of magnitude
lower due to higher viscous forces and lower diffusion coefficients.
Transport of gasses in planar direction was checked by fabricating a single plate device
containing both gas and liquid channels, as is illustrated in Figure 7. Indeed, pH gradients could be
observed, confirming our hypothesis. Although the diffusion effect can simplify the fabrication
process, since only a single plate needs structuring, it may not be desired in every application. A
different device layout, as depicted in Figure 7c, can offer better control. Also the use of stamping
techniques to fill the porosity of the membrane except at the G‐L crossings may be useful [36].
Furthermore, we strongly believe that existing fabrication techniques can be exploited for further
improvement, based on a recent review on membranes and microfluidics [37].
5.5. CONCLUSIONS AND OUTLOOK
In this chapter, a new generic approach has been presented to generate concentration gradients in
microfluidic devices. The method is based on multiple gas‐liquid contacting points where a liquid in a
micro channel is exposed to different gasses or vapors. The contacting regions can be used for both
supply and removal of gasses and volatile components. We have demonstrated proof‐of‐principles
by showing pH gradients in water in different operating modes. Furthermore, we have discussed the
physical processes that take place, and have given practical guidelines for future development,
including design considerations. The reported micro contactors are very easy to fabricate, and we
believe that they can be useful as study tools in different areas. As pH gradient generators, they may
be directly used in analysis methods or cell studies. In biotechnology, basic or acidic gasses may be
used to regulate pH in fermentation experiments. Currently, ammonia is already used in such
systems, but supplied as a liquid [38]. In reaction systems, pH‐dependent reactions may be locally
promoted or quenched. However, the concept of micro gas‐liquid contacting using different gasses
can be applied more generally. The goal does not necessarily have to be a concentration gradient
itself, neither is it limited to pH effects. Gas or vapor flows can be used to locally supply reagents and
remove formed products. In reactor systems with sequential reactions, such a switch may lead to
improved selectivity. The absorption and reactions of compounds like NH3 and CO2 lead to an
effective increase in ionic strength and conductivity that can be exploited, and offer the possibility to
buffer a solution without dilution. Since these compounds behave as volatile electrolytes, they can

Chapter 5
98
be removed afterwards [39]. Furthermore, the solubility of species in the liquid stream can be
changed by the absorption of gasses or vapors, leading to crystallization or salting‐out. In fact, this
last concept was triggered by the observation of small red crystals in the pH indicator experiments
when using concentrated HCl vapor. Figure 8 shows a close‐up of a channel in such an experiment,
together with two conceptual applications: i) local crystallization of NaCl and ii) precipitation
followed by dissolution of Cu2+ ions from a CuSO4 solution, using sequential reactions with NH3. In
this last example, solids can be locally created and redissolved in a switch‐like configuration. The
principle of local precipitation by absorption may be applicable for local patterning. To conclude, we
believe that our method extends the toolbox of microfluidics and can lead to fascinating new
applications.

Generation of local concentration gradients by gas‐liquid contacting
99
5.6. CITED LITERATURE 1. R.D. Greenlee and C.F. Ivory, Biotechnol. Prog., 1998, 14, 300‐309. 2. N.L. Jeon, S.K.W. Dertinger, D.T. Chiu, I.S. Choi, A.D. Stroock, and G.M. Whitesides, Langmuir, 2000, 16,
8311‐8316. 3. S.K.W. Dertinger, D.T. Chiu, N.L. Jeon, and G.M. Whitesides, Anal. Chem., 2001, 73, 1240‐1246. 4. M.A. Holden, S. Kumar, E.T. Castellana, A. Beskok, and P.S. Cremer, Sens. Act. B, 2003, 92, 199‐207. 5. J. Pihl, J. Sinclair, E. Sahlin, M. Karlsson, F. Petterson, J. Olofsson, and O. Orwar, Anal. Chem., 2005, 77,
3897‐3903. 6. J.S.H. Lee, Y.D. Hu, and D.Q. Li, Anal. Chim. Acta, 2005, 543, 99‐108. 7. B.G. Chung, L.A. Flanagan, S.W. Rhee, P.H. Schwartz, A.P. Lee, E.S. Monuki, and N.L. Jeon, Lab Chip,
2005, 5, 401‐406. 8. D. Irimia, D.A. Geba, and M. Toner, Anal. Chem., 2006, 78, 3472‐3477. 9. C.W. Li, R.S. Chen, and M.S. Yang, Lab Chip, 2007, 7, 1371‐1373. 10. W. Saadi, S. Rhee, F. Lin, B. Vahidi, B. Chung, and N. Jeon, Biomed. Microdev., 2007, 9, 627. 11. D. Amarie, J.A. Glazier, and S.C. Jacobson, Anal. Chem., 2007. 12. R.A. Brennen, H. Yin, and K.P. Killeen, Anal. Chem., 2007. 13. R.F. Ismagilov, J.M.K. Ng, P.A. Kenis, and G.M. Whitesides, Anal. Chem., 2001, 73, 5207‐5213. 14. K. Fa, J.J. Tulock, J.V. Sweedler, and P.W. Bohn, J. Am. Chem. Soc., 2005, 127, 13928‐13933. 15. E.L. May and A.C. Hillier, Anal. Chem., 2005, 77, 6487‐6493. 16. S.M. Mitrovski and R.G. Nuzzo, Lab Chip, 2005, 5, 634‐645. 17. J.P. Byers, M.B. Shah, R.L. Fournier, and S. Varanasi, Biotechnol. Bioeng., 1993, 42, 410‐420. 18. V.V. Abhyankar, M.A. Lokuta, A. Huttenlocher, and D.J. Beebe, Lab Chip, 2006, 6, 389‐393. 19. B. Zhao, J.S. Moore, and D.J. Beebe, Science, 2001, 291, 1023‐1026. 20. J. de Jong, B. Ankone, R.G.H. Lammertink, and M. Wessling, Lab Chip, 2005, 5, 1240‐1247. 21. J. de Jong, M.J. Geerken, R.G.H. Lammertink, and M. Wessling, Chem. Eng. Technol., 2007, 30, 309‐315. 22. A. Gabelman and S.T. Hwang, J. Membrane Sci., 1999, 159, 61‐106. 23. K. Nymeijer, T. Visser, R. Assen, and M. Wessling, J. Membrane Sci., 2004, 232, 107‐114. 24. C.‐C. Wu, T. Yasukawa, H. Shiku, and T. Matsue, Sens. Act. B, 2005, 110, 342. 25. A.P. Vollmer, R.F. Probstein, R. Gilbert, and T. Thorsen, Lab Chip, 2005, 5, 1059 ‐ 1066. 26. S. Herber, J. Bomer, W. Olthuis, P. Bergveld, and A.v.d. Berg, Biomed. Microdev., 2005, 7, 197. 27. B.H. Timmer, W. Olthuis, and A. Van den Berg, Lab Chip, 2004, 4, 252‐255. 28. K. Toda, S.‐I. Ohira, and M. Ikeda, Anal. Chim. Acta, 2004, 511, 3. 29. S.‐I. Ohira and K. Toda, Lab Chip, 2005, 5, 1374‐1379. 30. S.I. Ohira, K. Toda, S.I. Ikebe, and P.K. Dasgupta, Anal. Chem., 2002, 74, 5890‐5896. 31. G.M. Walker, M.S. Ozers, and D.J. Beebe, Biomed. Microdev., 2002, 4, 161. 32. H. Kreulen, C.A. Smolders, G.F. Versteeg, and W.P.M. Vanswaaij, Chem. Eng. Sci., 1993, 48, 2093‐2102. 33. J.G. Wijmans and R.W. Baker, J. Membrane Sci., 1995, 107, 1. 34. F.L. Smith and A.H. Harvey, Chem. Eng. Prog., 2007, 103, 33‐38. 35. Perry's Chemical engineers' Handbook. 6th ed, ed. D.W. Green. 1984: McGraw‐Hill. 36. B. Chueh, D. Huh, C.R. Kyrtsos, T. Houssin, N. Futai, and S. Takayama, Anal. Chem., 2007, 79, 3504‐
3508. 37. J. de Jong, R.G.H. Lammertink, and M. Wessling, Lab Chip, 2006, 6, 1125‐1139. 38. H.L.T. Lee, P. Boccazzi, R.J. Ram, and A.J. Sinskey, Lab Chip, 2006, 6, 1229‐1235. 39. E.O. Watanabe, P.D. Pessoa, E.A. Miranda, and R.S. Mohamed, Biochem. Eng. J., 2006, 30, 124‐129.

Chapter 5
100

101
PREPARATION OF POROUS POLYMERIC COATINGS
IN MICRO CHANNELS
Abstract
The use of porous layers in both analytical applications and in micro reactor technology is growing
rapidly. In this chapter a new preparation method is described to create porous polymeric coating
layers in micro channels. The preparation route can be divided into 2 steps: a) coating of the inner
wall with a polymer solution and b) subsequent phase separation induced by a non‐solvent. It is
demonstrated that different coating morphologies can be obtained, depending on the chosen
polymer/solvent/non solvent system. By adding particles to the starting solution, functionalized
coatings can be prepared. The preparation of a porous coating with Pt functionalized silica particles
is presented as a proof‐of‐principle. The catalytic properties of this coating are demonstrated by
showing partial catalytic oxidation of glucose to gluconic acid, analyzed online in continuous mode
by electro spray ionization mass spectrometry (ESI‐MS). From this experiment the conclusion can be
drawn that the catalyst activity was not removed or blocked during the coating procedure.

Chapter 6
102
6.1. INTRODUCTION
After two decades of development, microfluidic systems are entering a mature stage. The precise
control and manipulation of flows on a small scale offers many advantages in terms of heat and mass
transfer management. The small diffusion distances lead to short diffusion times, which can speed
up analyses. Furthermore, the small volumes involved allow for rapid screening of reaction and
process conditions. Commercial applications are emerging in biotechnological areas, such as protein
crystallization and PCR for DNA analysis. Meanwhile, the microfluidic concept has triggered the
chemical engineering community. The benefits of micro reactors include better process control,
higher reaction rates and selectivities, as well as improved safety. More importantly, scaling up
issues of conventional equipment can be avoided, as micro reactors can be scaled out by mass
parallelization.
Many fabrication methods are available for the preparation of microfluidic devices. Applicable
materials include silicon, glass, metals, and polymers. Often, these bulk materials do not have the
required properties for the chosen application, and functionalization of the channel walls is required.
Different approaches have been reported, including chemical modification, physical adsorption and
coatings. The coating approach can lead to both dense and porous layers. Here, we focus on porous
layers.
A key feature of porous layers is their high surface area per unit volume. This surface area can
be exploited in catalysis, leading to highly effective micro reactors. Compared to packed beds, which
have similar features, micro channels with porous layers offer lower pressure drops and better
control over heat transfer [1]. A typical procedure to obtain (meso) porous inorganic coatings with
catalytic activity is by wash coating of slurries, followed by drying and removal of binders [2‐4]. A
different approach was chosen by Drott et al., who used anodical etching of silicon to create porosity
in microfluidic chips [5]. In a second step, an enzyme was immobilized. The productivity of the
porous‐layer device was enhanced by two orders of magnitude compared to the original dense
device. Losey and co‐workers used a similar system with an immobilized Pt catalyst for
hydrogenation of cyclohexene [6]. They demonstrated that a porous layer device could surpass a
packed bed system in performance.
The high surface area of porous coatings also offers opportunities for analytical applications.
Already since the 1960’s so‐called porous layer open tubular columns (PLOT) have been developed
for gas chromatography. Reported coating thicknesses vary between 5‐50 μm and comprise
materials such as alumina, zeolite, carbon, silica, and divinylbenzene‐based polymers [7]. Similar
coating layers are nowadays used for solid phase micro extraction [8‐10] and capillary electro
chromatography (CEC) [11, 12].

Preparation of porous polymeric coatings in micro channels
103
Figure 1: Examples of reported methods to prepare porous layers in micro channels: a) inorganic porous coating, prepared by wash coating (reproduced from [2]); b) Porous silicon, prepared by anodical etching (reproduced from [5]); c) porous polymeric coating prepared by photo polymerization (reproduced from [12]); d) porous PDMS prepared by cross linking of a prepolymer emulsion (reproduced from [13]).
Recently, also the preparation of porous PDMS layers was reported, which were used in gas sensing
[13]. Figure 1 shows images of porous layers obtained with different methods.
Although the benefit of porous coatings is clear, the choice in materials, preparation methods
and the freedom in their applicability is limited. Here, we propose a dynamic coating method based
on phase separation of a polymer solution. Our concept is schematically depicted in Figure 2.
Figure 2: Schematic of the process to create porous layers in micro channels: a micro channel is filled with a polymer solution. The solution is subsequently purged by a gas, leaving a thin film on the wall. A non solvent is introduced, leading to phase separation and the formation of a porous coating.

Chapter 6
104
First, a polymer solution is introduced in a micro channel. Using gas pressure, the solution is purged,
leaving a thin layer on the channel wall. This procedure is known as “gas‐assisted fluid displacement”,
and used in many coating techniques. Instead of the conventional drying step as encountered in
wash coatings, we introduce a so‐called non‐solvent: a fluid that is miscible with the solvent but in
which the polymer is not or hardly soluble. Exchange of non‐solvent and solvent leads to phase
separation of the polymer solution. The polymer‐rich phase forms a matrix, in which the porosity
stems from the polymer‐lean phase. After solidification, a porous layer is obtained on the channel
wall. Our procedure has similarities to the method proposed by Hisamoto et al. for the preparation
of chemicofunctional membranes in squared capillaries [14]. They also started out with a polymer
solution, but applied a drying process instead of phase separation. Consequently, they obtained a
dense coating layer.
The principle of phase separation is generally applied in the fabrication of porous membranes,
and therefore much literature is available (see e.g. [15]). Its main advantage is the amount of
polymers that can be processed; in principle, every soluble polymer can be used, as long as a
miscible solvent/non‐solvent system can be defined. Some of these polymers may offer new
functionalities, such as bio activity, bio degradability or conductivity. The range of features can be
extended even further by addition of particles to the starting solution. These particles are
incorporated in the polymer matrix that is formed during the phase separation process. This so‐
called mixed matrix concept has already been successfully demonstrated on a larger scale. Examples
are membranes with ion exchange capacity, applicable for protein separation [16] and membranes
with adsorption functionality, to remove toxic compounds from blood [17].
In this chapter, we describe the fabrication process of porous coatings in polymeric tubing with
sub millimeter inner diameters, and discuss the requirements and challenges. Then a proof‐of‐
principle of our method is presented: the integration of platinum‐functionalized particles in a porous
coating. The catalytic activity of the porous coating is demonstrated by partial oxidation of glucose,
analyzed by online mass spectrometry in continuous flow mode.
6.2. BACKGROUND
Dynamic coating techniques rely on the principle that when a liquid is forced out of a channel, a thin
liquid layer is left behind on the channel wall. The thickness of this layer is an important parameter:
it largely determines the final coating thickness, and hence the diffusion distance. This distance is
important in analytical applications, as it causes broadening of peaks. In micro reactors, long
diffusion distances can lead to additional mass transfer limitations.

Preparation of porous polymeric coatings in micro channels
105
For the description of the physics of the coating process, it is important to determine which of
the following forces are dominant: inertial, gravitational, capillary and/or viscous forces. Since the
fluid flow in micro channels is in the laminar regime, inertia are absent. Capillary forces σ/r prevail
over gravitational forces ρ∙g∙r, as long as the system dimensions are smaller than the capillary length
κ‐1 given by:
gρσ
κ⋅
=−1 (1)
For liquids, the capillary length is typically in the order of several mm. The systems under
consideration are in the sub millimeter range, meaning that gravitational effects can be neglected.
Consequently, the physics are governed by viscous forces μ∙v/r and capillary forces σ/r. The relation
between these forces is given by the dimensionless capillary number Ca:
σvμ
Ca⋅
= (2)
The capillary number can be correlated to the thickness of the resulting liquid layer h in a tube with
radius r for Newtonian fluids, as was demonstrated by Taylor in the early 60’s [18]:
3
2
)( Cahrkh num ⋅−⋅≈ (3)
where knum is a numerical constant, depending on geometry. Important to remark here is that the
coating thickness is independent of the interactions of the coating liquid with the substrate. For
polymer solutions, the surface tension is mostly determined by the used solvent, while the viscosity
shows a strong dependence on molar mass and concentration of the polymer. Moreover, polymer
solutions often tend to deviate from Newtonian behavior. The viscosity μ then becomes a function
of the shear rate γ& , defined as the velocity gradient in the coating thickness (dv/dh), and can be
represented by a power law:
1−⋅= nγKμ & (4)
n > 1 indicates shear thickening, n < 1 shear thinning and n = 1 Newtonian behavior

Chapter 6
106
De Sousa et al. concluded from numerical experiments that shear thinning liquids give similar trends
between Ca and coating thickness as Newtonian liquids, but at lower absolute values [19]. Their
results and the data of Taylor are reproduced in Figure 3. These data will be used in this chapter for
estimations of coating thickness.
Figure 3: Dependence of the deposited mass fraction on the capillary number of the coating solution (reproduced from [19]) The data of Taylor are applicable to a Newtonian liquid (n=1), while the data of Soares concern a shear thinning liquid with n=0.652.
The first step in the coating process after filling is the gas assisted displacement of the polymer
solution out of the micro channel, for which a certain pressure ΔP is needed. Poseuille’s law gives
the correlation between the required pressure to obtain a velocity v of a liquid with viscosity μ in a
channel with radius r and length L:
⎟⎠⎞
⎜⎝⎛ ⋅⋅=
2
8Δ
rvL
μP (6)
As is evident from this equation, longer channels lead to higher pressure drops. More important is
the effect of downscaling the channel radius; a tenfold decrease in radius leads to a 100‐fold
increase in pressure drop at equal velocity. The allowable pressure is ultimately limited to either the
bursting pressure of the micro device or the maximum pressure that available pumping equipment

Preparation of porous polymeric coatings in micro channels
107
can deliver. One could argue that when going to small channels, simply lower coating velocities
could be applied to avoid high pressures. Unfortunately, there is an opposing trend that has to be
taken into account: the stability of the coating layer in the tubing. In systems where gravitational
aspects can be neglected, as is the case, Plateau‐Raleigh instabilities can be observed, which are
controlled exclusively by surface tension [20]. These instabilities are related to modulations in the
coating thickness. Due to conservation of volume, deformation of the coating surface can lead to a
decreased total surface area and thus a decrease in interfacial energy. In such cases, the layer
destabilizes spontaneously and irregularities in coating thickness are introduced, which can lead to
lens formation. This process is illustrated by the optical images presented in Figure 4:
Figure 4: Illustration of the destabilization of a liquid coating layer in polymeric tubing, leading to lens formation (utmost right picture). Tubing inner diameter was 1mm. The series of screenshots was taken within a second.
The characteristic growth time τ for the instability can be estimated using the following
approximation [20]:
( )30
4012
h
hr
σμ
τ−
⋅≈ (7)
Besides the strong influence of initial coating thickness, this time also depends on the μ/σ ratio of
the coating solution. Given a 500μm inner diameter tubing with a 25μm coating layer, τ lies in the
range of a few minutes for a typical polymer solution (μ/σ of 100 s/m), but is reduced to less than a
second for water (μ/σ of 0.014 s/m).
When the coated tubing is flushed with a non‐solvent, phase separation occurs, and a porous
layer is formed. The thickness of this layer not necessarily equals the original coating thickness of the
polymer solution. During phase separation, deviations can be encountered, depending on the in‐
diffusion rate of non‐solvent and out‐diffusion rate of solvent. Moreover, shrinkage effects during

Chapter 6
108
washing and drying can lead to further differences. More information on the different stages during
wet phase separation and their related mechanisms has been provided elsewhere [21]. It is
important to remark that when the shrinkage forces are strong, the coating can delaminate from the
tubing surface. The choice of polymer/solvent/non‐solvent system and the used tubing material
therefore is critical. We will come back to delamination issues in the results section.
The morphology of obtained porous coating layers depends on interactions of the used
components and on subsequent shrinkage phenomena. Obtained structures are typically
asymmetric, with the smallest pores facing the side of direct contact with the non‐solvent. Pore sizes
can range from 0 (dense) to several microns. The maximum achievable porosity is not limited by the
process itself but rather by the mechanical stability of the obtained film. From membrane practice it
is known that the casting thickness can have an influence on morphology [22]. Other parameters of
influence include a) temperature; b) composition of the casting solution, including the use of
additives (both soluble and insoluble, such as particles [16]), c) choice of non‐solvent or
combinations of non‐solvents. The combination of process parameters opens up the possibility to
tune the porous coating morphology towards a specific application. More detailed information can
be found in the standard works of Baker [23] and Mulder [24].
6.3. EXPERIMENTAL
Materials
Poly ether sulfone (PES, Ultrason) and acrylonitrile‐butadiene‐styrene copolymer (ABS, Dow) were
chosen as coating materials. Solutions were prepared in either DMSO or NMP (Synthesis grade,
Merck). Different types of particles were incorporated, including an ion exchange resin (milled
Lewatit CNP 80, fraction < 10μm), a resin with functional groups for the coupling of biological agents
(Eupergit C, Röhm GmbH) and HPLC silica particles (particle size 5 µm, 380 m2/g, Degussa). Silica
particles were functionalized with platinum before incorporation, using a procedure described
elsewhere [25]. Pure water (prepared by a Millipore Q apparatus) was chosen as non‐solvent to
induce phase separation. Poly ether ether ketone tubing (PEEK, Upchurch) with claimed diameters of
0.006” and 0.020” served as micro channels. The actual diameter was 180 and 500 µm. Plastic
syringes (1ml, BD) and Upchurch connections were used to fill the tubing with solutions, to perform
the gas‐assisted fluid displacement, and to introduce the non‐solvent.

Preparation of porous polymeric coatings in micro channels
109
Preparation and characterization of polymer solutions
Polymer solutions were prepared by mixing polymer and solvent over night on a roller bank. Particle
loaded solutions were prepared by adding particles to a PES/DMSO solution in a test tube. The
mixture was stirred with a glass rod and no special procedure was used to break up any aggregates.
Since some sedimentation of particles could be observed over longer times, coating solutions
containing particles were always stirred shortly before use. The viscosity of PES/DMSO solutions of
different concentration was measured by a Brabender Viscometer at different shear stresses. The
solutions were thermostated at 25°C. The surface tension was determined by tensiometry at 22°C
(Krüss tensiometer K11).
Coating procedure
A 1ml syringe was filled with polymer solution and connected to a piece of tubing using Upchurch
connections. The solution was manually pressed in until flow at the exit could be observed. Then, the
syringe was removed and excess of polymer solution was blown out using air, leaving a thin layer on
the wall. Subsequently, a non‐solvent was introduced to obtain phase separation. The tubing was
rinsed with water and stored in a water bath over night to wash out any residual solvent. The next
day, the tubing was flushed again with water and blown dry using pressurized air.
Analysis
Analysis of coating morphology and thickness was performed using optical microscopy (Zeiss
Axiovert 40) and Scanning Electron Microscopy (JEOL TSM5600). In order to study any possible
delamination in non‐transparent tubing, the preparation method of samples is crucial; observed
delamination should not be caused by this method. Defining a procedure for representative samples
proved difficult, as direct cutting led to deformation and delamination of the coating layer. Best
results were obtained by first making small pre cuts in the coated tubing. The tubing was
subsequently filled with water, and frozen by immersion in liquid nitrogen. After quickly snapping,
samples with a clean cut were obtained.
SEM Samples were dried in a vacuum oven before analysis. A thin layer of gold was sputtered
on the samples to avoid charge‐up during imaging (Baltzers Union SCD 40). For comparison with
morphologies obtained for coatings in round channels, flat sheets were prepared using a home‐
made casting device described elsewhere [26]. Polymer solutions were casted onto a silicon wafer,
and subsequently phase separated in water. The casting thickness was set to 40μm in all cases. The
thickness after drying was measured to give an indication of the shrinkage.

Chapter 6
110
Proof‐of‐principle measurements
Catalytic activity of Pt‐functionalized silica particles, incorporated in a porous PES coating, was
demonstrated by the partial oxidation of glucose. A 50 ppm solution of D‐glucose (Aldrich, 99%) was
prepared in water (LCMS quality, Biosolve). The pH was adjusted with a 0.1M NaOH solution to pH
8.95, in order to avoid inhibition of the catalyst by carbonic acids. Here we only give a short
description of the experimental set‐up and settings of the analysis equipment; more details will be
enclosed elsewhere [27]. A home made set‐up was used comprising 3 stirred vessels, in which gasses
were supplied through bubble dispensers. Gas flow rates and gas composition were controlled by
mass flow controllers. Used gasses were oxygen (Indugas, 99.999%), hydrogen (Indugas, 99.999%)
and argon (Air products BIP, 99.9999%). The oxygen content of the argon was decreased to <10ppb
using an oxygen trap (OxyTrap, Alltech). Liquid flows were regulated by HPLC pumps and an Agilent
multivalve system. Detection of reaction products was carried out online by a mass spectrometry
detector (Agilent SL/G1956B) equipped with an electro spray ionization interface (Agilent G1948A).
The negative ion mode was selected for analysis, meaning that only negatively charged ions were
detected. A 0.45 μm filter (Spartan, Whatman) was placed after the porous layer reactor to prevent
blocking of the analysis system by any loose particles.
The vessels were filled with LCMS water and glucose solution, respectively, and saturated with
argon (200 ml/min, 30 minutes) to remove dissolved gasses. Platinum is naturally covered with
dissociatively chemisorbed oxygen in air at room temperature. The experiments therefore started by
reducing the Pt catalyst with hydrogen, using hydrogen saturated LCMS water (0.3 ml/min, 30
minutes). Subsequently, the system was flushed with Ar‐LCMS water at 1 ml/min until a stable base
signal was obtained. Then the glucose solution was introduced at a flow rate of 300 μl/min. Once the
system was stable again, the oxygen concentration in the solution was changed.
During measurements, the mass fractions between 30‐300 g/mol were monitored. Gluconic
acid was measured in its deprotonated form at 195 g/mol. Glucose was measured in the
deprotonated glucose.2H2O form, as this signal shows a linear dependency with concentration. The
oxidation of glucose can lead to many different compounds, depending on catalyst activity. The
composition of the reaction mixture entering the mass spectroscope can be deduced from the
detected mass fractions. However, the amount of each compound is more difficult to determine,
since the signal of each product can be influenced by the presence of other compounds. Therefore, a
matrix of calibration solutions was tested in order to compensate for cross‐over effects.

Preparation of porous polymeric coatings in micro channels
111
6.4. RESULTS AND DISCUSSION
6.4.1. COATING MORPHOLOGY OF POROUS FILMS
In Figure 5 an example is given of a porous ABS coating prepared in PEEK tubing. The images show a
microporous structure with finger‐shaped macro voids. Such structures are very typical for solvent
induced phase separation processes and often encountered in membrane preparation [28]. The
formation of macro voids not only depends on the speed of phase separation, but also on the
thickness of the polymer solution layer [22]. Within a fixed polymer solution / non‐solvent / tubing
material system, the concentration of the starting polymer solution can also have a strong influence
on the morphology of the final obtained porous coating, as is illustrated in Figure 6. With increasing
polymer concentration, the morphology changes from a) many thin stretched macro voids, to b) less
macro voids with a broader, more droplet‐like shape, to c) even less macro voids with increased size,
surrounded by a porous microstructure, until d) a homogeneous sponge‐like structure is obtained.
Figure 5: SEM images of a porous ABS coating, prepared in PEEK tubing with an inner diameter of 500μm: a) overview; b) close‐up of coating layer; c) close‐up of the tubing‐coating interface, showing good adhesion. Starting solution: 25wt% ABS/NMP.
The surface of these coating layers was examined by preparing transversely cut samples.
Results for the 13wt% PES solution are presented in Figure 7. The used PES‐based recipes typically
yield ultrafiltration membranes, which have pore sizes in the range of 2‐50 nm. These sizes are
below the detection limit of the microscope. Therefore, the images can only be used as a visual aid
to indicate an upper limit of the pore size. Several approaches can be taken to tune the pore size of
the coating: pretreatment with non‐solvent vapor [29], use of different non‐solvents, or dilution of
the non‐solvent with solvent.

Chapter 6
112
Figure 6: Influence of polymer concentration on final coating morphology. PES coating from PES/DMSO solutions in PEEK tubing with an inner diameter of 180μm. a) 13wt%; b) 17wt%; c) 19wt%; d) 21wt%.
Figure 7: SEM images of transversely cut coated tubing, showing the inner surface of a coating layer: a) overview; b) close‐up of the coating layer; c) close up of the coating surface. PES coating from 13wt% PES/DMSO solutions in PEEK tubing with an inner diameter of 180 μm
6.4.2. THICKNESS OF COATING LAYER
To investigate possible relations between capillary number and the thickness of obtained
porous coatings, first the rheological behavior of PES/DMSO solutions with different concentrations

Preparation of porous polymeric coatings in micro channels
113
was screened. The results are presented in Figure 8. The graph shows a clear increase of viscosity
with polymer concentration. Furthermore, it indicates that there is a slight influence of shear rate on
viscosity. The solutions show shear thinning for the concentration range studied.
0
1000
2000
3000
4000
5000
6000
0 10 20 30 40 50
Shear rate [1/s]
Viscosity [m
Pa.s]
21wt%19wt%17wt%15wt%13wt%
Figure 8: Shear rate dependant viscous behavior of PES/DMSO solutions of different concentration
The influence of polymer concentration on surface tension was found to be negligible.
Determined surface tensions for PES/DMSO solutions with concentration ranging from 13 to 21wt%
varied between 44‐46 ± 1 mN/m, where the surface tension of DMSO was 45mN/m. The actual front
velocity during gas assisted liquid displacement could not be measured, but was roughly estimated
at several mm/s, based on the time of break through and the tubing length. Such coating velocities
resulted in values of Ca in the range of 0.02‐0.2. Based on the data of De Sousa et al. [19],
reproduced in Figure 3, coating thicknesses between 7‐20% of the channel radius would be expected.
For micro channels with a radius of 90 μm, this corresponds to a thickness between 6 and 18 μm.
These values are slightly lower than the thicknesses found for the porous layers presented in Figure
6. However, when shrinkage effects are taken into account, the differences become larger. We
suspect that this disagreement between results and coating theory may be an indication of coating
instability before phase separation. Calculated characteristic growth times for the used polymer
solutions are in the range of seconds for a coating thickness of 20% of the channel radius. These
times are shorter than the time between displacement of the polymer solution and coagulation.

Chapter 6
114
Hence, lens formation may have occurred. If that is the case, the micro channel walls have been
effectively ‘recoated’ during flushing, requiring the speed of the non‐solvent to be used for
estimations of the coating thickness. As this speed was more than an order in magnitude higher,
predicted coating thicknesses shifted towards 20‐30% of the channel radius. For the micro channels
with a radius of 90 μm, these values correspond to 18‐27 μm thick layers of polymer solution. Taking
shrinkage effects into account, these values match reasonably with the thicknesses of resulting
porous coatings. However, more optimization is required to obtain good control over the coating
process, and accurately predict coating thickness. Based on the line of progress made in PLOT‐
coatings, where columns up to 100m can nowadays be routinely prepared, we expect this challenge
to be superable.
6.4.3. COATING ADHESION
As is clear from the close‐up images of the tubing‐coating interface presented in Figure 5 and Figure
6, the adhesion in these systems is good. Quantification of the adhesive strength is difficult, but it
can be remarked that the forces applied during sample preparation were not high enough to destroy
the bond. Furthermore, tests with coating on the outside of the tubing showed that the coating
could only be removed by scratching. The adhesive forces of the bond between tubing layer and
coating may be enhanced by entanglement of polymer chains from both materials. PEEK/PES blends
are reported to be partial miscible and to show mechanical compatibility [30]. Entanglement can be
promoted by the solvents used in the coating solution, if they interact with the tubing surface. Tests
with pieces of tubing that were stirred in a flask filled with either DMSO or NMP on a roller bank for
4 days, showed that the tubing could not be dissolved. Furthermore, no visible changes were
detected. However, in the specification of the used PEEK tubing, swelling issues are mentioned for
PEEK/DMSO. We suspect that this swelling may be beneficial for the coating adhesion. For NMP and
ABS/PEEK blends unfortunately no data was supplied.
We have noticed that not every combination of polymer solution / non‐solvent led to an intact
coating on the tubing surface. Delamination was mostly observed for a) low polymer concentrations
and b) high coating thicknesses compared to the channel diameter. Both cases can probably be
related to shrinkage effects. Closer examination of the tubing surface, as illustrated in Figure 9,
revealed that the coating did not completely delaminate from the surface, but ruptured. This finding
supports the hypothesis of shrinkage effects and demonstrates that the interaction between tubing
surface and coating can be stronger than the mechanical strength of the coating itself.

Preparation of porous polymeric coatings in micro channels
115
Figure 9: SEM images showing close‐ups of delaminated coating layers. Surprisingly, shrinkage has not led to complete delamination of the coating layer, but to rupture of this layer itself, demonstrating the strong adhesive force between coating and tubing surface.
6.4.4. INCORPORATION OF PARTICLES
A next step involves the addition of particles to the starting solution, which are incorporated during
phase separation. Examples are illustrated in Figure 10. The incorporated particles had different
functionalities: ion exchange capacity, specific binding sites, and catalytic activity. Ion exchange
resins are normally applied in desalination and separation of proteins. The Eupergit resin contains
functional oxirane groups, to which enzymes and proteins can be coupled. These particles are
generally applied in biotechnological processes, including enzymatic reactions. Finally, the silica
particles are generally applied as packed bed material in chromatography, but also used as a carrier
for heterogeneous catalysts, e.g. Pt nano‐particles.
Figure 10: Incorporation of particles with different size and functionality: a) Lewatit ion exchange resin; b) Eupergit resin with functional groups for coupling of proteins and enzymes; c) HPLC silica, functionalized with a platinum catalyst.

Chapter 6
116
An important factor in the incorporation of particles is their accessibility after the coating procedure:
the particles should not be shielded by a polymer coating layer. Here, we focus on the catalytic
activity of Pt functionalized silica particles after integration in a porous coating to give a proof‐of‐
principle.
6.5. PROOF‐OF‐PRINCIPLE: POROUS CATALYTIC LAYER
For the proof‐of‐principle we have chosen the catalyzed partial oxidation of glucose. Oxidative
conversion of glucose is an important process in view of the anticipated shift from oil chemistry
towards renewable feedstock. Many products can be obtained by sequential oxidation and
isomerization steps, including gluconic acid, tartaric acid, oxalic acid and ultimately, CO2 and water
[31]. A first step in the reaction scheme is the oxidation of the aldehyde group, leading to gluconic
acid. The overall reaction is the following:
C6H12O6 + 0.5 O2 → C6H12O7
Gluconic acid is a compound of specific industrial importance, as it is both a biodegradable chelating
agent and an intermediate in food and pharmaceutical processes. Here we show that our system is
capable of converting glucose into gluconic acid.
A solution comprising 10.0g of a 15wt% PES/DMSO solution and 0.40g of Pt functionalized silica
was prepared for coating of PEEK tubing with an inner diameter of 500 μm. Phase separation was
induced by water. The resulting porous catalytic layer is shown in Figure 11. For the experiments,
140 mm of tubing was used, corresponding to a total internal volume of 27 μl. With an average
coating thickness of 100 μm, the available volume for free flow was 10 μl. The pumps of the set‐up
had a lower limit in flow rate around 300 μl/min, corresponding to an average residence time in the
order of seconds.
Figure 11: SEM images of PEEK tubing coated with a porous PES layer, functionalized with Pt/Silica particles: a) overview; b) close‐up of the coating layer; c) close‐up showing individual silica particles. The tubing diameter was 500 μm.

Preparation of porous polymeric coatings in micro channels
117
Longer residence times were desired, but it was found that lower flow rates induced pulsation in the
flow, leading to problems in detection. Furthermore, low flow rates led to long response times of the
system due to a high ratio of holdup volume / micro reactor volume.
Titration experiments with hydrogen and oxygen were carried out to estimate the amount of Pt
present. This transient analysis method is based on chemisorption and physisorption of gasses on
the surface of the platinum catalyst, combined with reactions [32]. Detection was carried out by
Membrane Inlet Mass Spectrometry (MI‐MS). Unfortunately, the porous reactor system was too
small to obtain conclusive results. A rough estimation based on coating thickness, porosity, and ratio
of polymer/silica led to a value of about 0.02 mg, which is very little indeed. Due to the low amount
of catalyst, conversion was expected to be very low, possibly resulting in poor detection. Therefore,
low glucose concentrations were used. Furthermore, rapid deactivation might occur during
measurements, requiring an accurate online detection method: electro spray ionization mass
spectrometry (ESI‐MS). An additional advantage of this technique is that it is capable of following
multiple reaction products at the same time. Figure 12 shows the signal of gluconic acid during an
experiment with different oxygen concentrations in the glucose solution.
Figure 12: Demonstration of the catalytic activity of a porous coating with incorporated Pt‐functionalized silica particles. Glucose is partially oxidized to gluconic acid, at increasing oxygen partial pressures. Total gas pressure was 1 bar.

Chapter 6
118
The vertical lines in the graph indicate the moment at which the concentration of oxygen was
increased. Due to the equilibration time, low flow rate and relatively large hold‐up, the response of
the system was around 15 minutes. Calibration experiments showed that the oxygen concentration
did not lead to cross‐over effects on the signal for gluconic acid. Therefore, we can conclude from
this graph that there is catalytic activity in the porous layer. Looking closer at the stage where 3%
oxygen was supplied, a sudden decrease in signal is visible: the catalyst seems to be deactivated.
Further increasing the oxygen concentration hardly effected conversion. In the same time frame, no
increase was detected in the signals of other possible products, thereby supporting the deactivation
hypothesis. It is well known that Pt catalysts deactivate via over‐oxidation, i.e. when the reductive
power of the carbohydrate is not able to match the rate of oxygen chemisorption on the Pt surface.
Under the conditions in this study using an extremely low glucose concentration, this imbalance
apparently sets in when increasing the oxygen partial pressure to 0.03 bar. Further investigation and
description of the reaction and deactivation mechanisms are beyond the scope of this chapter. Here
we limit our conclusions to a) the sensitivity of the equipment is sufficient for measurements in
micro systems, even at low residence times and b) porous coatings with catalytic particles still show
activity after the coating procedure.
6.6. SUMMARY
In this chapter we have proposed a new method to produce porous coatings, based on phase
separation of a polymer solution. Different coating morphologies can be obtained, depending on the
chosen polymer/solvent/non solvent system. By adding particles to the starting solution,
functionalized coatings can be prepared. The concept was illustrated by images of ABS and PES
based coatings on PEEK tubing with inner diameters of 500 and 180 μm. Adhesive forces between
the coatings and the tubing surface were not quantified, but SEM analysis revealed that they could
be stronger than the mechanical strength of the coating itself. When the thickness of obtained
porous coating layers was related to general coating theory, indications were obtained of film
instability after gas‐assisted displacement of the polymer solution from the tubing. Further
optimization is required to accurately predict and control coating thickness.
A large benefit of our method is the ability to use new materials and to immobilize
functionalized particles. Furthermore, the morphology of the coating layer can be tuned by a large
number of control parameters. As a proof‐of‐principle we have shown the preparation of a porous
coating with catalytic properties, demonstrated by the partial oxidation reaction of glucose to
gluconic acid. From this experiment the conclusion can be drawn that the catalyst activity was not
removed or blocked during the coating procedure.
Since polymers generally have limited resistance against high temperatures and aggressive

Preparation of porous polymeric coatings in micro channels
119
chemicals or solvents, we expect that the major application of the presented coating method will be
in aqueous systems. More specific, the (particle functionalized) coatings may be especially suited for
sample pretreatment in analytical methods and for biological processes, such as enzymatic reactions,
tissue engineering and cell study.
6.7. ACKNOWLEDGMENTS
Gor Manukyan and Erik Rolevink are acknowledged for their help with the tensiometry and viscosity
measurements, respectively. The catalytic experiments were carried out in collaboration with the
Catalytic Processes and Materials group (CPM) of the University of Twente. Dejan Radivojevic is
acknowledged for his help with the set‐up and for valuable discussion.
Chapter 6
120
6.8. CITED LITERATURE 1. A. Karim, J. Bravo, D. Gorm, T. Conant, and A. Datye, Catalysis Today, 2005, 110, 86. 2. T. Conant, A. Karim, S. Rogers, S. Samms, G. Randolph, and A. Datye, Chem. Eng. Sci., 2006, 61, 5678. 3. T. Conant, A. Karim, and A. Datye, Catalysis Today, 2007, 125, 11. 4. A. Stefanescu, A.C. van Veen, C. Mirodatos, J.C. Beziat, and E. Duval‐Brunel, Catalysis Today, 2007,
125, 16‐23. 5. J. Drott, K. Lindstrom, L. Rosengren, and T. Laurell, J. Micromech. Microeng., 1997, 7, 14‐23. 6. M.W. Losey, R.J. Jackman, S.L. Firebaugh, M.A. Schmidt, and K.F. Jensen, J. Microelectromech. Sys.,
2002, 11, 709‐717. 7. Z.H. Ji, R.E. Majors, and E.J. Guthrie, J. Chrom. A, 1999, 842, 115‐142. 8. X.‐Z. Du, Y.‐R. Wang, X.‐J. Tao, and H.‐L. Deng, Anal. Chim. Acta, 2005, 543, 9. 9. J.‐g. Hou, Q. Ma, X.‐z. Du, H.‐l. Deng, and J.‐z. Gao, Talanta, 2004, 62, 241. 10. W. Hu, B. Hu, and Z. Jiang, Anal. Chim. Acta, 2006, 572, 55. 11. S. Eeltink, F. Svec, and J.M.J. Frechet, Electrophoresis, 2006, 27, 4249‐4256. 12. S. Eeltink and F. Svec, Electrophoresis, 2007, 28, 137‐147. 13. M. Juchniewicz, D. Stadnik, K. Biesiada, A. Olszyna, M. Chudy, Z. Brzozka, and A. Dybko, Sens. Act. B,
2007, 126, 68. 14. H. Hisamoto, Y. Nakashima, C. Kitamura, S. Funano, M. Yasuoka, K. Morishima, Y. Kikutani, T. Kitamori,
and S. Terabe, Anal. Chem., 2004, 76, 3222‐3228. 15. Journal of Membrane Science, http://www.sciencedirect.com/science/journal/03767388 (December
2007). 16. M.E. Avramescu, M. Girones, Z. Borneman, and M. Wessling, J. Membrane Sci., 2003, 218, 219‐233. 17. Saiful, Mixed matrix membrane adsorvers for protein and blood purification. 2007, PhD thesis.
Membrane Technology Group, University of Twente, The Netherlands. 18. G.I. Taylor, J. Fluid Mech., 1961, 10, 161‐165. 19. D.A. de Sousa, E.J. Soares, R.S. de Queiroz, and R.L. Thompson, Journal Of Non‐Newtonian Fluid
Mechanics, 2007, 144, 149‐159. 20. P.G. de Gennes, F. Brochard‐Wyart, and D. Quéré, Capillarity and Wetting Phenomena: Drops, Bubbles,
Pearls, Waves. 2004: Springer. 21. C. Stropnik and V. Kaiser, Desalination, 2002, 145, 1. 22. N. Vogrin, C. Stropnik, V. Musil, and M. Brumen, J. Membrane Sci., 2002, 207, 139. 23. R.W. Baker, Membrane technology and applications. 2nd ed. 2004, Chichester, England: John Wiley. 24. M.H.V. Mulder, Basic Principles of Membrane Technology. 2nd ed. 2000, Dordrecht, The Netherlands:
Kluwer Academic Publishers. 25. D. Radivojevic, K. Seshan, and L. Lefferts, Appl. Cat. A, 2006, 301, 51‐58. 26. L. Vogelaar, R.G.H. Lammertink, J.N. Barsema, W. Nijdam, L.A.M. Bolhuis‐Versteeg, C.J.M. Van Rijn,
and M. Wessling, Small, 2005, 1, 645‐655. 27. D. Radivojevic, M. Ruitenbeek, K. Seshan, and L. Lefferts, Development of a transient response
technique for heterogeneous catalysis in liquid phase, Part 1: applying an Electron Spray Ionization Mass Spectrometry (ESI‐MS) detector., Submitted to J. of Catalysis.
28. C.A. Smolders, A.J. Reuvers, R.M. Boom, and I.M. Wienk, J. Membrane Sci., 1992, 73, 259. 29. H.C. Park, J.M. Hong, S.Y. Ha, Y.S. Kang, and K.H. Ahn, J. Ind. Eng. Chem., 1998, 4, 31‐38. 30. M.M. Tariq, J. Appl. Pol. Sci., 1992, 46, 303‐310. 31. S. Hermans and M. Devillers, Appl. Cat. A, 2002, 235, 253‐264. 32. D. Radivojevic, M. Ruitenbeek, K. Seshan, and L. Lefferts, Development of a transient response
technique for heterogeneous catalysis in liquid phase, Part 2: applying membrane inlet mass spectrometry (MIMS) for detection of dissolved gasses, Submitted to J. of Catalysis.

121
MEMBRANES AND MICROFLUIDICS
TIPS, TRICKS AND NEW CONCEPTS
Abstract
In the previous chapters, different methods have been described to integrate membrane features in
microfluidic devices, including phase separation micromolding, clamp‐and‐play systems and porous
coatings. Due to the explorative nature of this PhD project, more approaches have been chosen and
briefly tested. The results are summarized in this chapter. The focus is not only on introducing
membrane functionality into the devices, but also on methods where a membrane is used as an
intermediate. The goal is twofold: a) to provide tips and tricks that can serve as a starting point for
anyone interested in using membranes on the macroscale and b) to show new opportunities. All
methods are aimed at simple and cheap micro systems, and most of them are based on commercial
membranes. The following concepts are discussed: a) use of hollow fiber membranes in microfluidic
devices; b) micro structuring of porous membranes by embossing; c) (local) densification of porous
hollow fiber membranes; d) use of membranes as support in thin PDMS films; e) coating of
microstructured membranes. At the end of the chapter, general selection criteria are presented for
the choice of membrane material, type and fabrication method.
Chapter 7
122
7.1. INTRODUCTION
Fabrication of microfluidic devices with membrane functionality has been discussed in Chapter 2 and
available methods have been divided into four categories. These methods range from straight‐
forward gluing of membranes to highly complex layouts with well defined membrane areas using
multiple clean‐room steps. In chapter 3, phase separation micro molding has been introduced as a
fabrication method to create membranes with incorporated microfluidic structures. After sealing, a
porous chip is obtained in which the channel walls act as membranes. Although this approach offers
large freedom in morphologies and applicable materials, it is not an easy method for researchers
starting in the field. Furthermore, fabrication and optimization can be time consuming, making the
method less attractive for explorative testing. Simple fabrication methods are required that can be
performed without much experience. An example is the clamp‐and‐play concept that was exploited
in Chapter 4 and 5. Here our goal is to present additional methods and approaches to create simple
microfluidic devices out of commercial membranes. Besides methods that directly exploit membrane
functionality, also concepts are presented where porous membranes are used as an intermediate or
as a support for dense membranes. During the development of the presented fabrication processes,
new ideas for membrane‐based microfluidics have been triggered. These ideas will be discussed
throughout this chapter at the relevant paragraphs. At the end of this chapter we will provide
general considerations and criteria for the selection of membrane material, type, and fabrication
method. The following fabrication procedures will be discussed:
• Use of hollow fiber membranes in microfluidic devices
• Micro structuring of porous membranes by embossing
• (local) Densification of porous hollow fiber membranes
• Use of membranes as support in thin PDMS films
• Coating of microstructured membranes
Each paragraph contains a short description of the concept, followed by illustrating images and
proof‐of‐principles. At the end of this chapter, we will provide generic considerations and selection
criteria for the use of membranes in microfluidics. First, the fabrication of hollow fiber devices will
be discussed.

Tips, tricks and new concepts
123
7.2. MICRO HOLLOW FIBERS DEVICES
Hollow fiber membranes are commonly used in large‐scale membrane processes. Commercial
examples are given in Table 1.
Table 1: Overview of commercial membrane applications using hollow fibers
Membrane function
Type of operation Application area
Contactor
Gas‐liquid contacting
Oxygenizers (artificial lungs) Carbonation of beverages Ozonation of water
Liquid‐liquid contacting Haemodialysis
Separation Solute‐Liquid separation Desalination Filtration Waste water treatment Preparation of drinking water
Gas separation Enrichment of oxygen Removal of CO2 from exhaust gases Separation of CO2 and natural gas
Pervaporation
Separation of water/ethanol
The main advantage of hollow fibers lies in the high surface to volume ratio, which ranges from
1000‐20000 m2/m3 [1]. The inner diameter of commercially available hollow fibers can be as little as
50 µm [1]. Therefore, a hollow fiber can be regarded as a microfluidic channel with integrated
membrane properties. Since hollow fibers have been developed for long time, many different
materials and separation properties are directly available for the microfluidic community.
Furthermore, the integration of fibers into modules has been studied for decades. Challenges
involving sealing, material incompatibilities, and flow mal distribution have largely been tackled. In
conclusion, the fabrication of micro modules from a single hollow fiber can be very straightforward.
Especially in the field of micro dialysis, the use of hollow fibers in probes is very common (see e.g. [2‐
5]). Other less explored areas include gas sensing [6] and ion exchange based sample desalination [7].
Here, we present a simple micro degassing device, based on a hydrophobic hollow fiber membrane.
Degassing of solutions is an important process in microfluidics, as gas bubbles in micro channels
disturb flow profiles. Due to the high stability of micro gas bubbles, they cannot be easily removed
once present; therefore, their formation should be prevented. Degassing is the opposite of gas‐liquid
contacting, and for theory and membrane requirements we therefore refer to Chapter 4. Our system

Chapter 7
124
is based on standard Upchurch barbed Y junctions and tubing, in which a porous hydrophobic hollow
fiber is glued. The internal volume of the obtained device is only a few micro liters, much smaller
than commercial micro degassers (e.g. [8]). The open connection of the Y junction can be used to
apply a vacuum, in order to remove gasses or volatile components from a liquid. To demonstrate a
proof‐of‐principle, we have removed CO2 from water. This process leads to an increase in pH, which
can be visualized by a pH indicator. The device and proof‐of‐principle are shown in Figure 1.
Figure 1: Micro hollow fiber module: a) schematic, showing the small fiber; b) device used as a degasser. A syringe is used to create a light vacuum. Carbon dioxide is removed from water, leading to a loss in acidity. A pH indicator is used for visualization. Orange pH = 4.5, green pH = 7. The inserts show close‐ups of the micro module and the exiting degassed water with a flow rate of 10 μl/min.
Compared to gluing hollow fibers onto silica capillaries, our method automatically protects the fiber.
By varying the type of fiber, different unit operations can be created in short time and at very low
cost.
7.3. EMBOSSING OF POROUS MEMBRANES
Earlier we have reported on the feasibility of phase separation micromolding as a method to create
membranes with integrated microfluidic channel networks in a single step [9, 10]. A different
approach is to separate membrane fabrication and micro structuring into two steps: first a
membrane is prepared or purchased, and secondly, a microfluidic layout is created in these
membranes. The use of embossing tools for the second step seems logical, since hot embossing is a
well known fabrication method in the microfluidic community (see e.g. [11, 12]). Surprisingly, no
literature references could be found regarding micro embossing of porous films. Although the

Tips, tricks and new concepts
125
concept for both methods is similar, i.e. imprinting of mold features in a film, the processes
themselves clearly differ, as is illustrated in Figure 2:
Figure 2: Artist impression of the embossing process in porous and dense films. In dense films, embossing is determined by the conservation of volume; in the picture, it means an equal surface area. In porous embossing, the film can be compacted. Ultimately, a thinner film is obtained. Depending on when the embossing is stopped, membrane characteristics may be still available.
The most striking difference is related to conservation of volume. In embossing of dense films, the
volume is constant and the molding material is redistributed along the mold features. The
temperature required for polymer flow lies at least above the glass transition temperature (Tg) of the
polymeric material. The force which is then needed depends on viscous behavior of the molding
material. At higher temperatures, lower viscosities are observed and hence lower forces are
required for embossing. The highest temperature is limited by the thermal stability of the polymer.
The trade‐off between operating temperature and pressure is found in shrinkage effects due to
temperature gradients. Differences in thermal expansion coefficients of mold and molded material
cause problems in release of embossed films, and embossing cycles therefore need specific heating

Chapter 7
126
and cooling rates. Additionally, the temperature cycle time is essential. Low operating temperatures
are reached faster, but generally lead to longer embossing times.
In porous films, embossing basically implies compaction of the spongy structure by removal of
air, and hence no conservation of total film volume. Consequently, when the starting thickness of
the porous and dense film is similar, a thinner embossed structure is obtained for the porous film.
The limiting compaction degree is determined by porosity. Depending on the feature height and the
maximum reduction in film thickness, the total film may be not or partly compacted: when the mold
feature is embossed in the film, the applied force will deform the film at positions where no direct
force is exerted. At the moment that the complete mold is in contact with the film, more compaction
can occur.
For the porous embossing experiments we have used similar silicon molds as mentioned in
Chapter 3. Both commercial and home made membranes have been tested. Examples of films
embossed at elevated temperature are given in Figure 3.
Figure 3: Porous embossing of commercial and home‐made porous films at elevated temperatures: a) Schleiger & Schull cellulose acetate, embossed for 5 minutes at 100°C; b) home made ABS copolymer film, embossed for 5 minutes at 100°C; c) same film after 35 minutes, showing sharper replication and a lower film thickness. Pressure was applied by clamping the film and mold between glass slides.
When comparing the images of ABS embossing at different embossing times, two observations
can be made. First, the replication precision seems to increase with longer embossing time as the
corners are more sharply defined. Secondly, the total film thickness is reduced, and the porosity is
largely lost. Important in porous embossing is to have non‐elastic deformations, meaning that an
embossed porous film should not regain its original flat shape. The embossed structures were still
present after 2 years, indicating a permanent structural change.
A very interesting feature of porous embossing is the fact that although heat may facilitate the
embossing process, it is not a requirement. Hence, porous films can be processed at room
temperature, including films that consist of materials with a high Tg. compared to heat‐assisted

Tips, tricks and new concepts
127
embossing, higher pressures are needed, which can be supplied by e.g. clamping in a vise or press. A
more dynamic approach is the use of a rolling bar: as the area of direct contact is very low, very high
pressures can be achieved. Figure 4 gives examples of polymers embossed at room temperature.
The smallest feature sizes that could be replicated were in the sub micron range. Here, the
mechanical strength of the silicon molds became limiting, and mold fragments could be found on
prepared samples. Improvement of the mold is expected to lead to a further reduction in feature
size. As an indication, it can be remarked that in the field of nano imprint lithography, the imprint of
features below 10 nanometers in dense polymer layers has already been demonstrated [13].
Figure 4: Examples of embossing in porous films of different materials at room temperature: a) SEM image of Accurel poly propylene with embossed triangles of 150μm; b) SEM image of Accurel poly propylene with embossed wells of 0.5μm, demonstrating the possibility to replicate small features; c) Optical image of Poly L‐lactic acid (PLLA). The picture was made using an optical microscope in reflection mode with a polarizer. Dark triangles indicate transparency, caused by local densification; d) Optical image of Poly ether imide (PEI), a material with a Tg around 210°C. Distance between lines is 75 μm. The image indicates the possibility to structure porous films at temperatures much lower than the Tg of the material.
In the examples above, the mold and porous film were clamped between non‐deformable
plates. This procedure leads to a local decrease in ‐ or loss of ‐ porosity. When a thin slab of PDMS of
around 100 μm was incorporated during clamping, a base relief on both sides was observed, while

Chapter 7
128
the porosity was retained. An example is given in Figure 5 for a porous film made from Poly L‐lactic
acid (PLLA). PLLA is a biocompatible and biodegradable material that is often used in tissue
engineering [14]. Using the structuring method presented above, the possibility is opened to create
3d scaffolds, by stacking porous films with integrated micro channels.
Figure 5: PDMS assisted porous embossing in porous PLLA sheets: a) mold side; b) PDMS side; c) cross section; d) close‐up, showing that the porosity is not lost in the process.
Embossing could also be induced without applying pressure, by heating the mold to values above the
melting temperature. The porous membrane then melted around the features. In these cases, the
membrane properties of the porous film were largely lost, and the film became milky transparent.
This method therefore is more an alternative to standard hot embossing or injection molding: the
porosity of a membrane is only exploited for micro structuring at moderate conditions. As a
reference, similar experiments were carried out using dense films of the same material. In those
cases, no micro structuring was observed without applying pressure. A critical remark should be
placed regarding lift‐off after melting a porous film on a mold; as was mentioned earlier for hot
embossing, also here problems with adhesion and release were encountered. Images of ‘auto
embossed’ PVDF samples, prepared from Millipore GVWP membranes, are given in Figure 6.

Tips, tricks and new concepts
129
Figure 6: Auto embossing of micro pillars in porous PVDF films by heating: a‐b) overview, showing fields of pillar imprints; c‐d) close‐ups of individual imprints, showing both a cross section and surface section. The mold temperature was 170°C, just above the melting temperature of PVDF.
Of course, different embossing methods can be combined, at both sides of a membrane in a
single step or in sequential steps. Furthermore, films can be prepared by phase separation
micromolding and additionally structured by embossing. Both approaches allow for complex new
structures, although the preparation procedure can still be simple. Examples are shown in Figure 7:
Figure 7: Double structured membranes prepared by embossing: a) membrane with 100 μm channel structures on both sides. The image shows the crossing of two perpendicular channels. At the crossing, most force is exerted, and hence the porous layer became dense and transparent; b) channel embossed in a film with micro well structures; c) close‐up, showing that the micro well structures are still present after the embossing step.

Chapter 7
130
After the embossing step, simple microfluidic systems can be obtained by sealing the embossed
membranes with tape. Flow can be induced by capillary force or static pressure, by gluing pieces of
tubing to entry and exit holes. For most applications, more sophisticated chips will be desired, that
can be connected to the macro world. Due to the similarities between embossed films and porous
films prepared by phase separation micromolding, similar sealing and assembly procedures can be
followed as described in Chapter 3.
The major difference compared to phase separation micromolding, is that in embossing,
material is locally compressed. Therefore, it is sheer impossible to obtain a homogeneous pore
morphology. A second difference may be found in replication. Shrinkage phenomena in the planar
direction, as encountered in PSµM, are avoided. Furthermore, the process is much easier to carry
out and preparation times are dramatically reduced, since no washing and drying steps are required.
In the procedures mentioned above, the goal was to obtain a micro pattern in a flat film. A
different idea would be to do the opposite: to start with a micro patterned porous film, prepared by
phase separation micromolding, and to compact this film. In this way, local variations in porosity can
be created. Depending on the porosity, feature heights and compression level, the micro pattern
may be present or completely removed. Figure 8 shows the concept and images from optical
microscopy as a proof‐of‐principle.
Figure 8: Preparation of flat films with differences in morphology, by compacting a porous film made by phase separation micromolding: a) schematic showing the basic principle; b) compacted ABS film with channel structures; c) close‐up, revealing a dense bulk with porous lines where the channels used to be. Channel width is 100 μm.
Summarizing the concepts above, porous embossing is a simple and cheap method that offers loads
of new possibilities. Features sizes down to a sub micron level can be replicated. Although the
incentive of researching this technique was to create porous microstructured films, we have shown
that also (local) dense structures could be prepared. This finding automatically triggered more ideas
for hollow fiber systems, which are discussed in the following paragraph.

Tips, tricks and new concepts
131
7.4. (LOCAL) DENSIFICATION OF HOLLOW FIBER MEMBRANES
The local densification of membranes offers two opportunities that we explore in this paragraph: i)
removal or change of membrane functionality and ii) local transparency, enabling optical inspection.
Visualization of processes can be a powerful tool in membrane development and process
optimization. Currently, many membrane systems can be regarded as black boxes. Indirect methods
are used to generate knowledge on the processes that take place inside. An illustrative example is
fouling of the inner surface of hollow fibers. The build‐up of a fouling layer in such systems is
estimated by measuring the decrease in flux in time. However, the obtained data only give an
average value, and no location‐specific information. Using local densification, process windows can
be created, enabling more insight into processes. The feasibility of this feature strongly depends on
the type of membrane material: not every material can be melted, and not every porous material
becomes transparent after melting. An example of a suitable material is microporous polypropylene,
a material often used in micro filtration and gas‐liquid contacting. Densification is achieved by
contacting the fiber locally with a hot plate. A thin wire is put in the fiber to avoid collapse during
heating, and removed afterwards. Figure 9 illustrates some of the possibilities.
Figure 9: Densification of a polypropylene hollow fiber membrane for optical inspection: a) fluid flow during filling of a completely densified hollow fiber; b) filling of a partly densified hollow fiber; c) flow visualization in a partly densified hollow fiber using latex tracer particles with a 3 micron diameter. The channel wall is visible at the left of the image
Besides the opportunity of transparency, densification can also be used to remove membrane
functionality in order to block mass transfer. The latter may be especially interesting for the
preparation of packed beds, where the conventional procedure consists of the following steps. First,
the end of a glass capillary is blocked with a porous frit. Subsequently, a slurry is introduced and
filtrated. The carrying liquid is pushed through the frit, while the particles are retained in the
capillary, thereby creating an increasing resistance to further filtration. Consequently, pressures
needed for filling can easily increase to tens of bars, and preparation times can be lengthy. When a
porous hollow fiber is used instead of a dense capillary, the permeability of the walls for liquids can

Chapter 7
132
be exploited. The carrying liquid can then be removed at multiple positions. Much lower pressures
are required, and the filling time is drastically reduced. After filling, the walls of the hollow fiber can
be densified, by heating above the melting temperature. The process is illustrated in Figure 10,
together with examples of prepared packed beds.
Figure 10: Packed beds prepared from porous hollow fibers at low pressure: a) schematic of the process. A slurry is pumped into a dead‐end fiber. The liquid can permeate through the walls, while the particles are retained inside. After filling, the walls can be densified by heating; b) SEM image of a packed bed of alumina particles in a densified polypropylene fiber; c) optical image of a packed bed comprising Lewatit ion exchange particles.
The concept of liquid exchange through porous walls, followed by densification, can also be used to
create monoliths, as is illustrated in Figure 11:

Tips, tricks and new concepts
133
Figure 11: Schematic of the preparation procedure of polymeric monoliths in porous hollow fibers
A hollow fiber is first filled with a polymer solution. Then it is placed in a non‐solvent bath. Exchange
of solvent and non‐solvent through the membrane wall leads to phase separation, and the formation
of a porous plug inside the hollow fiber. After drying, the porous hollow fiber walls can be densified
by heat and an enclosed monolithic structure is obtained.
In some cases, we observed shrinkage during phase inversion. Then, the created porous plug
was not attached to the hollow fiber. However, densification of the hollow fiber also induces
shrinkage. Depending on the chosen system, this shrinkage can be sufficient to create a dense layer
around the porous fiber. Examples are given in Figure 12.
The applicability of the densification approach strongly depends on the membrane material
type, and the related minimum temperature required for densification. This temperature should be
low enough to avoid damage of particles or porous polymer monoliths during densification. As an
indication, for the polypropylene fibers a densification temperature of 170°C was used. Furthermore,
filled fibers should be dried before densification, to avoid the formation of gas bubbles due to rapid
evaporation of solvents. The main conclusion we would like to point out here, is that membranes
can also be successfully used as intermediates in the preparation process of other microfluidic
components.

Chapter 7
134
Figure 12: Preparation of monoliths in Accurel polypropylene hollow fibers by phase separation of a polymer solution: a) polyethersulfone (PES); b) polyimide (PI), showing strong shrinkage; c) same poly imide system after densification. Shrinkage of the Accurel fiber during densification has led to good enclosure of the monolith; d) close‐up of the interface between monolith and densified fiber.
7.5. USE OF MEMBRANES IN PDMS MICROFLUIDICS
A next example of new membrane usage in microfluidics is the application of porous membranes as
supports for thin dense PDMS membranes. This approach can serve two goals: i) supplying
mechanical strength and ii) reduction of swelling. Both issues are encountered in PDMS based
microfluidics. The mechanical strength of PDMS is low; furthermore, processing of thin layers is
difficult because of the elasticity of PDMS and its tendency to stick. The thickness of thin
freestanding PDMS films reported in literature is down to 10 micron. This value is in the same range
as commercially available porous supports, such as Nuclepore (Whatman) or Solupor (DSM Solutech).
Swelling of PDMS is especially problematic in organic solvents [15]. Impregnating PDMS into a
porous matrix with low flexibility/elasticity may reduce this behavior. Here we present two methods
to make composite PDMS membranes based on such porous supports: a) coating from a diluted
PDMS prepolymer solution and b) impregnation of prepolymer solution. For the coating experiments,

Tips, tricks and new concepts
135
a 6.5 wt% PDMS/hexane solution was prepared. The ratio of prepolymer solution : crosslinking agent
was 10 : 1. Membranes were manually dip coated in the solution, and the PDMS was crosslinked for
at least 4 hours in a nitrogen oven at 80°C. Multiple coating steps were tested. The time between
coating steps was 30s, in order to evaporate the hexane. Figure 13 presents SEM images of uncoated
and coated Nuclepore membranes, showing both cross sections and surface sections.
Figure 13: SEM images showing results of coating experiments of track‐etched membranes with PDMS: a) uncoated track‐etched membrane; b) after 3 coating steps; c) cross section after 1 coating step; d) cross section after 3 coating steps, showing increased filling of pores.
The images show that increasing the amount of coating steps increases the filing of pores, and
slightly increases the top layer of PDMS on both sides. After coating, the swelling of membranes in
toluene was measured. Contrary to pure PDMS films, which can easily double their size, no swelling
could be measured in any direction. Subsequently, the gas permeance of nitrogen and carbon
dioxide was determined for coated films before and after storage in toluene, to test if the PDMS was
still present. These experiments involved measuring the flow of gasses at different applied pressures
through a defined membrane area in a home‐made set‐up. The ratio of the slopes for both gasses
gives an ideal CO2/N2 selectivity. By comparing this calculated value with literature values for PDMS,

Chapter 7
136
which are typically around 11, an indication can be obtained about the presence of pinholes and
other defects [16]. The permeability for gasses of the polyester Nuclepore membrane is about 3
orders of magnitude lower than for PDMS, meaning that its contribution to gas permeance can be
neglected.
Results showed that a single coating step was insufficient to obtain a selective PDMS composite
membrane. After three coating steps, films were obtained with a CO2/N2 selectivity between 9 and
11, which implied that prepared films were leakage free. Similar selectivities were measured before
and after storage in toluene, from which we conclude that toluene did not remove or damage the
PDMS layer. Based on the permeability of gasses in pure PDMS and the measured gas flow through
the composite membrane, the thickness of the membrane could be estimated. Estimating a surface
porosity of 15% for the track etched membrane, the calculated thickness was between 12 ‐ 14
microns, which corresponded to the thicknesses measured with a micrometer and to the values
obtained from SEM analysis. Compared to pure PDMS films, a decrease in permeability of almost
one order of magnitude was obtained, due to the low permeability of the matrix material polyester
and the low surface porosity. This finding enables the tuning of permeability of a thin PDMS‐based
membrane, simply by choosing the type of support membrane.
An example of a very porous support is Solupor, a polyethylene structure with a porosity of
around 90%. As the pores in this membrane are large, the dipcoating procedure described above
only led to coating of the complete inner polyethylene structure, but not to a completely dense film.
Using a non‐diluted PDMS prepolymer solution, it was possible to impregnate the membrane,
followed by crosslinking. When a mold with microfluidic structures was used, the impregnation step
could be combined with the structuring of PDMS: first a thin layer of prepolymer solution was cast
on a microstructured mold, and then the membrane was placed on top. Using transparency sheets
and little pressure, excess of solution was removed. After crosslinking, the PDMS/membrane
composite could be peeled off the mold. As a reference, we also prepared a PDMS layer on the same
mold without integrating a membrane. It turned out to be impossible to remove this layer without
rupture, demonstrating the enhanced mechanical strength caused by the membrane. Figure 14
shows examples of microfluidic structures in which a Solupor membrane was integrated. An
interesting observation concerns the sticking tendency of the composite PDMS layer. We noticed
that the pure PDMS side could still be reversibly sealed onto glass. On the other hand, the sticking
tendency was drastically reduced at the membrane side. One can envision the development of
sticky‐tape microfluidics through exploitation of these properties.

Tips, tricks and new concepts
137
Figure 14: Enhancing the mechanical strength of thin PDMS‐based devices by integrating a highly porous Solupor membrane: a) cross section, showing a micro channel and the integrated membrane; b) close up of PDMS filled Solupor; c+d) device sealed to a glass slide by adhesion and subsequently filled with ink by capillary force. Picture taken through the glass (c) and through the membrane side (d)
7.6. IMPLEMENTING MEMBRANE TECHNOLOGY ON‐CHIP YOURSELF
In Chapter 2, all kinds of membrane applications and their use in microfluidics have been discussed.
Furthermore, the methods to incorporate membrane features on chip have been categorized and
explained. The following chapters have described new ideas, concepts and applications. Now the fair
question may arise, how do you choose the right membrane material, type and fabrication method
for a certain application? These questions will be addressed below.
Figure 15 shows a scheme with criteria that can be used as a starting point in the selection process.

Chapter 7
138
Figure 15: Selection scheme for implementing membranes in microfluidics
In our opinion, the initial approach should be based on choosing the best membrane material and
type for the targeted application. Subsequently, fabrication methods and practical considerations
can be taken into account. Specific information on membranes can be found in general membrane
literature and in datasheets of membrane suppliers on the internet. In case the desired membrane
properties are not met by any commercial membrane, it is worthwhile to consider in‐house
preparation of membranes. The preparation route is fairly simple and enables the use of more exotic

Tips, tricks and new concepts
139
materials and incorporation of particles. Also functionalization of existing membranes may be a good
option. The following authors have compared different membrane types and materials for
microfluidic systems, and their reasoning can be of interest in the selection process. Ohira and Toda
evaluated different types of Teflon and polypropylene membranes for use in gas sensors, having
pore size and thickness as variables [17]. Cai et al. tested Teflon membranes with pore size of 0.2,
0.45 and 1.0 μm as supports to obtain a stable oil/water interface [18]. They found an improved
extraction efficiency with larger pore size, but the effect was not very strong. Torto et al. have
evaluated different membranes for microdialysis sampling of oligosaccharides [4]. Influence of
membrane material and morphology was evaluated for extraction factors, permeability,
temperature stability and protein interaction. Finally, Thorslund and co‐workers have recently tested
different membrane materials for whole blood filtration [19]. These materials, including
polypropylene, polycarbonate, polyethersulfone, polyvinyldifluoride and cellulose acetate, were
evaluated on the bases of non specific adsorption of free and protein‐bound testosterone.
Since the application of membranes in microfluidic devices is relatively new, the necessary
information for choosing the best membrane type and operating conditions may not be available. In
those cases, modeling and simulation of mass transport can be a very useful tool. Already several
publications can be found in literature on membrane related transport in microfluidic devices.
Examples include a) oxygen transport in PDMS based chips for micro bioreactors [20] or oxygen
sensors [21]; b) oxygen transport through dense perovskite membranes in solid oxide fuel cells [22];
c) hydrogen transport through noble metal membranes in water gas shift reactions [22] or
dehydrogenation reactions [23]; d) fluor transport through porous membranes in direct fluorination
reactions [24]; and e) transport of water through zeolite membranes in condensation reactions [25].
Based on these models the influence of parameters such as permeability, pressure, flow profiles and
concentration on the performance of a microfluidic device with incorporated membrane can be
estimated. But ultimately, often the best thing to do is simply start trying; especially in an
explorative research area, the chances of finding answers in literature are small. Furthermore, we
have noticed in this project that the largest problems arose in the apparent ‘simplest steps’.

Chapter 7
140
7.7. SUMMARY
In this chapter we have discussed and demonstrated tips, tricks and new concepts regarding the use
of membranes in microfluidics. The focus was on simplicity of fabrication methods, without the need
of expensive dedicated equipment. Simple methods targeting the integration of membrane
functionality in chips include: hollow fiber devices, and membrane embossing. Besides the
integration of membrane features as such, we have also shown other opportunities for membrane
exploitation. These range from improvement of mechanical strength and reduction of swelling in
thin PDMS layers, to the preparation of packed beds and monoliths by densification of porous
materials. Furthermore, we have shown that this densification concept enables the preparation of
optical windows in membrane systems, which can be exploited for study of flow and fouling
behavior. Finally, we have provided a short guide with selection criteria for the use of membranes in
microfluidics.
7.8. CITED LITERATURE 1. R.W. Baker, Membrane technology and applications. 2nd ed. 2004, Chichester, England: John Wiley. 2. J. Wu and J. Pawliszyn, Anal. Chem., 1995, 67, 2010‐2014. 3. M.H. Lamoree, U.R. Tjaden, and J. van der Greef, J. Chrom. A, 1997, 777, 31. 4. N. Torto, J. Bang, S. Richardson, G.S. Nilsson, L. Gorton, T. Laurell, and G. Marko‐Varga, J. Chrom. A,
1998, 806, 265‐278. 5. Q. Wang, S.‐L. Lin, K.F. Warnick, H.D. Tolley, and M.L. Lee, J. Chrom. A, 2003, 985, 455. 6. Y. Iida, Y. Suganuma, K. Matsumoto, and I. Satoh, Analytical Sciences, 2006, 22, 173‐176. 7. J. Astorga‐Wells, H. Jornvall, and T. Bergman, Anal. Chem., 2003, 75, 5213‐5219. 8. Boehringer‐Ingelheim, http://www.boehringer‐
ingelheim.de/produkte/mikrosystemtechnik/mikrofluidik/microdegasser.jsp, 2007. 9. J. de Jong, B. Ankone, R.G.H. Lammertink, and M. Wessling, Lab Chip, 2005, 5, 1240‐1247. 10. J. de Jong, M.J. Geerken, R.G.H. Lammertink, and M. Wessling, Chem. Eng. Technol., 2007, 30, 309‐315. 11. H. Becker and C. Gaertner, Electrophoresis, 2000, 21, 12‐26. 12. M. Heckele and W.K. Schomburg, J. Micromech. Microeng., 2004, 14, R1‐R14. 13. S.Y. Chou, P.R. Krauss, and P.J. Renstrom, Science, 1996, 272, 85‐87. 14. B.J. Papenburg, L. Vogelaar, L.A.M. Bolhuis‐Versteeg, R.G.H. Lammertink, D. Stamatialis, and M.
Wessling, Biomaterials, 2007, 28, 1998‐2009. 15. J.N. Lee, C. Park, and G.M. Whitesides, Anal. Chem., 2003, 75, 6544‐6554. 16. M.H.V. Mulder, Basic Principles of Membrane Technology. 2nd ed. 2000, Dordrecht, The Netherlands:
Kluwer Academic Publishers. 17. S.I. Ohira, K. Toda, S.I. Ikebe, and P.K. Dasgupta, Anal. Chem., 2002, 74, 5890‐5896. 18. Z.‐X. Cai, Q. Fang, H.‐W. Chen, and Z.‐L. Fang, Anal. Chim. Acta, 2006, 556, 151. 19. S. Thorslund, O. Klett, F. Nikolajeff, K. Markides, and J. Bergquist, Biomed. Microdev., 2006, 8, 73. 20. A. Zanzotto, N. Szita, P. Boccazzi, P. Lessard, A.J. Sinskey, and K.F. Jensen, Biotech. Bioeng., 2004, 87,
243‐254. 21. A.P. Vollmer, R.F. Probstein, R. Gilbert, and T. Thorsen, Lab. Chip, 2005, 5, 1059 ‐ 1066. 22. S. Goto, T. Tagawa, S. Assabumrungrat, and P. Praserthdam, Cat. Today, 2003, 82, 223‐232. 23. K.A. Alfadhel and M.V. Kothare, Chem. Eng. Sci, 2005, 60, 2911‐2926. 24. A. Schuster, R. Lakshmanan, J. Ponton, and K. Sefiane, J. Chem. Biotech., 2003, 78, 342‐346. 25. K.L. Yeung, X. Zhang, W.N. Lau, and R. Martin‐Aranda, Cat. Today, 2005, 110, 26.

141
EVALUATION AND OUTLOOK
8.1. INTRODUCTION
In this thesis, an overview of the integration of membrane technology in microfluidics has been
provided, and new concepts have been highlighted. In this chapter, an evaluation of the project is
given. Specific conclusions have already been indicated in the previous chapters, and here we focus
on the basic accomplishments of the research project and the applicability of presented methods
and concepts. Furthermore, we discuss typical pitfalls in microfluidic research, based on the
experience gained in this project. This section is written from a membrane technology perspective
and helpful for people who have no background in microfluidics. In the outlook that follows, general
research opportunities are indicated for membrane technology in microfluidics, and vice‐versa. In
this section also a further coupling with the results of this thesis is made.
8.2. EVALUATION
8.2.1. ACCOMPLISHMENTS
Since the nature of this project was explorative, many different approaches have been tested and
many problems and challenges identified. When putting the results in perspective, the following
basic accomplishments can be mentioned:
• First review in which the integration of membrane functionality in microfluidics was
systematically categorized, and where applications were discussed from a membrane
perspective (Chapter 2) [1].
• Development of a preparation method for porous microfluidic devices based on phase
separation micromolding. The membrane functionality of the channel walls of these chips
could be used for transport (Chapter 3) [2, 3].

Chapter 8
142
• Demonstration of a new concept for the local control of liquid composition in micro
environments, based on membrane assisted gas‐liquid contacting. This approach was
applied in pH control in micro batch fermentation experiments (Chapter 4) and for the
generation of pH gradients (Chapter 5)[4].
• Demonstration of the use of phase separation as a new principle to create porous polymeric
coatings in micro channels. Functional particles could be incorporated in these coatings, and
for a Pt functionalized coating catalytic activity could be demonstrated (Chapter 6).
• Development of the ‘porous embossing concept’, a new embossing approach that exploits
the porosity of membranes and enables the micro structuring of porous materials at room
temperature. Furthermore, it was shown that local transparency could be created by
densification (Chapter 7).
• Proof‐of‐principles of new opportunities for (commercial) membranes in microfluidics (all in
Chapter 7):
‐ fabrication of hollow fiber based micro module for degassing
‐ preparation of monoliths and packed beds in hollow fiber membranes, where the
membrane permeability was exploited in an intermediate step and subsequently removed
by a heat treatment.
‐ use of porous membranes to enhance mechanical strength and reduce swelling in thin
PDMS layers
As is clear from this list, most accomplishments concern the development of new concepts and
fabrication methods. In the future, their implementation in specific processes can be expected.
Below we indicate the applicability, by discussing limitations and opportunities
8.2.2. APPLICABILITY OF PRESENTED METHODS
In Chapter 7, tips, tricks and new concepts have been discussed, for which indications of applicability
were already given. Therefore, we focus here mainly on phase separation based fabrication methods
(as used in Chapter 3 and 6) and membrane assisted gas‐liquid contacting (Chapter 4 and 5).
Phase separation based fabrication methods
Both phase separation micromolding and the method to create porous coatings rely on phase
separation of a polymer solution, which intrinsically means that applicable polymers need to be
soluble. Materials such as PEEK and Kapton, which are frequently used in microfluidics, can

Evaluation and outlook
143
therefore hardly be processed, while for PDMS it is even impossible. Fortunately, the remaining list
of suitable polymer‐solvent systems is very large [5]. Some of them are already familiar to
microfluidics, such as PMMA, poly carbonate (PC) and cyclic olefin copolymers (COC), while many are
new. One of the main strengths of phase separation is that it enables the processing of materials at
room temperature, including polymers with a high glass transition temperature and thermally
sensitive polymers. Regarding applications of chips made via phase separation, it must be remarked
that the solubility of the chip material implies a limitation in resistance towards a range of organic
liquids. However, tricks are available to improve solvent resistance, e.g. by thermal annealing or
crosslinking with reactive monomers [6]. Furthermore, phase separation can also be used to process
ceramic and metallic materials via a two‐steps process: first, phase separation of a polymer solution
with added ceramic or metallic particles is performed to create a so‐called ‘green’ structure. In a
subsequent step, the polymer is removed by pyrolysis and the particles are sintered together [7].
This approach was briefly explored for phase separation micromolding, and results are depicted in
Figure 1:
Figure 1: Fabrication of iron structures via phase separation micromolding: a) close up of the surface of a green microstructured film in PMMA, containing carbonyl iron particles. Bar represents 10μm; b) same film after polymer decomposition and sintering, showing the porous structure. Bar represents 10μm; c) cross section of a micro channel with porous walls. Bar represents 20μm
Besides the amount of processable materials, the phase separation approach offers control over
morphology by tuning the process parameters. For phase separation micromolding, this leads to
channel walls with membrane functionality, which can be used for selective transport into and out of
micro channels. In Table 1, opportunities for the technology are indicated, categorized by the type of
morphology. Stacking of films with different morphology can lead to even higher functionalities and
the on‐chip integration of multiple unit operations.

Chapter 8
144
Table 1: Opportunities for porous microfluidic devices prepared by PSμM, based on morphology
Morphology
Film Transparency
Permeable for
Mass Transport
Possible applications
Completely Porous
No* Gas, vapor, liquid, solutes, particles**
++ Liquid‐Liquid / Gas‐Liquid contactor Supported liquid membranes Filtration Solute/particle/cell separation or concentration Easy degassing of chips
Porous with dense skin
No* Gas, vapor +/‐ Pervaporation Concentration by evaporation Gas‐Liquid contactor or separator Gas separation
Completely Dense
Yes Gas, vapor ‐‐ Conventional microfluidics Optical applications
* Unless pore sizes are very small compared to the wavelength of light ** Depending on pore and particle size
For porous coatings, it enables optimization of the total internal surface area, on which e.g.
catalysts can be immobilized. Furthermore, tuning of the pore size in the coating surface may enable
integration of size exclusion mechanisms.
Although non‐solvent induced phase separation of polymer solutions is practically very simple
to perform, understanding of the thermodynamics of the process is complex. Practical knowledge is
required to interpret obtained results and not every polymer/solvent/non‐solvent system has been
described in literature. Consequently, an iterative procedure of trial and error experiments may be
necessary. Fortunately, general rules from membrane preparation practice are available to minimize
the amount of experiments. Furthermore, the method itself is cheap, fast and easy to perform in a
standard lab.
The biggest limitation of phase separation is probably the shrinkage, which is difficult to predict
or control. In phase separation micromolding, shrinkage effects on one hand cause an easy release
of the film from the mold, enabling the fabrication of very thin films. On the other hand, they can
cause deviations from the mold design, leading to flow mal distribution. In porous coatings,
shrinkage can cause rupture of the coating. As shrinkage itself is very dependent on the used
polymer/solvent/non‐solvent system and also on parameters during the phase separation process, it
is difficult to give general guidelines. Also here, trial and error experiments are required.
Still, once the right set of conditions has been found, production is very straight‐forward, cheap
and easy to scale up to large quantities. Furthermore, the opportunity exists for transformation into

Evaluation and outlook
145
a continuous process. We estimate that the key areas for PSμM in the field of micro devices are: a)
improvement of existing applications, enabled by the ability to choose better suited materials; b)
development of new applications, enabled by the use of new materials, such as conductive or
biodegradable polymers; c) commercial areas, where production costs matter: for disposable devices
or industrial‐sized applications, where massive parallelization of multiple micro devices is required.
Membrane assisted gas‐liquid contacting in microsystems
The applicability of membranes in gas liquid contacting depends on the type of membrane: porous
or dense. For porous membranes, an important factor is the wettability, related to liquid‐membrane
interactions. Wetting not only increases the transport resistance of the membrane, but also enables
permeation of liquids to the gas side. To avoid spontaneous wetting, the contact angle of the liquid
on the membrane material should be above 90°. As this requirement is hard to meet for many
organic solvents, porous membranes are especially suited for aqueous systems. But even then, not
every membrane is suitable. Forced wetting can occur if the Laplace pressure, determined by pore
size, is surpassed by the pressure in the liquid channel. This scenario is very plausible for high flow
rates in small channels. In those cases, the application of dense membranes may be considered.
Wetting problems are then avoided, but here the resistance towards mass transfer becomes
apparent. This resistance scales with film thickness, which is currently limited by mechanical
strength and handling issues. We expect that the trick of porous membrane reinforcement, as was
presented in Chapter 7, may contribute to development of thinner membranes. A second option is
the combination of porous and dense membranes: the use of dense coating layers on a porous
support. As the porous support provides mechanical strength, coating layers can be very thin. An
example is given in Figure 2 for a hydrophilic porous poly ether imide (PEI) membrane. The coating
material was a block copolymer (PEBAx), which was applied by dip coating the structured support in
a PEBAx/propanol solution. As is visible, the coating layer covers the original pores and has a low
thickness, below 1 micron.

Chapter 8
146
Figure 2: Coating of a hydrophilic porous support with a thin dense layer, to avoid wetting in gas liquid contacting: a) surface before coating; b) surface after coating; c) cross section, showing the porous support; d) close‐up, revealing that the coating layer has sub micron thickness.
The porous structure in this case was prepared by phase separation micromolding, and Figure 2c in
fact shows a part of a micro channel. This image illustrates how separate parts of this thesis on
fabrication and application can be combined.
8.2.3. PRACTICAL CONSIDERATIONS AND PITFALLS OF MICROFLUIDICS
First of all, we must stress that microfluidics is not an easy and direct translation of macrofluidics to a
smaller scale. Although this is mentioned by many authors over and over again, still the high
Reynolds intuition is hard to beat. An example in this project was encountered while developing the
micro G‐L contactor. The assumption that diffusion of air into the device through the planar
direction of the membrane was negligible, turned out to be wrong. Not only did it influence the
measurements; it in fact completely determined the behavior of the micro system. Only after

Evaluation and outlook
147
immersion of the micro module in water, the problem was tackled. The general lesson to be learned
here is to be suspicious about gut feeling.
A second pitfall is related to small volumes and analysis. The devices discussed in this thesis had
internal volumes in the order of a few micro liters. In standard analysis equipment, the internal
tubing and measurement cells occupy a volume that can easily be orders of magnitude larger. As a
consequence, long delay times can be observed in analysis. Furthermore, the large holdup volumes
can lead to back‐ and forward mixing, causing spreading of peaks, or even the disappearance. New
micro analysis techniques that are tailored for use in microfluidic systems are currently being
developed and implemented. Examples from this thesis include the sensor system and reference
electrode that were applied in the micro fermentation experiments (Chapter 4). However,
troubleshooting of such new systems, calibration procedures, and optimization can easily consume
large parts of available time. No general recommendation can be given which alternative is better,
but the mentioned problems clearly indicate that the choice for analysis is not trivial. Hence,
requirements of analysis methods should be assessed and used as essential criteria for the design of
micro systems. In some cases it may be even a good alternative to scale out multiple chips only for
the sake of good analysis. A similar approach should be taken for other parts that are required in a
typical set‐up, such as pressure and temperature sensors, valves and macro to micro interfaces [8].
A last factor is related to the versatility of developed devices. The micro devices presented in
this thesis were mostly tested with model systems. A necessary future step is the transition towards
real applications. It is important to realize that in microfluidics, a change in application or operation
conditions of a micro device can imply a complete change in fabrication method, device design and
analysis method, for practical reasons. This is best illustrated by showing the typical approach for
developing a polymeric micro system with membrane features for a certain application. First criteria
are related to the construction material of the chip and the membrane material:
• Compatibility with reaction medium, including wettability, swelling issues, fouling and
chemical reactions
• Mechanical and thermal stability
• Available micro fabrication methods for processing
• Available sealing methods and sealing materials, and their compatibility with the reaction
medium

Chapter 8
148
Subsequently, the design of the micro device is determined by factors such as:
• Size and morphology of membrane
• Required residence times
• Allowable pressure drops
• Required throughput (e.g. for good analysis)
• Limitations in micro fabrication methods
This list of criteria leads to a defined design space, in which not every parameter can be freely
adjusted without consequences. Of course, a similar scheme can be made for macro scale
applications. However, a complicating factor for microfluidics is that much less direct experience is
available, making the adaption process of devices and set‐ups towards new applications a time
consuming process. An example is the fabrication of porous chips using phase separation
micromolding, as was demonstrated in Chapter 3. Film morphology, sealing method and assembly
are very material specific and have been tailored to a specific utilization. If the used PMMA was to
be replaced by another polymer, for compatibility reasons with used media, it would essentially
require a complete restart of the whole process. Therefore, it is highly recommended to early
choose a concrete application and define operating conditions, on which the research can be
focused.
8.3. GENERAL OUTLOOK
The overlap between the fields of membrane technology and microfluidics has shown
substantial growth over the last 10 years [1]. Already a lot of the traditional applications of
membranes on the macro scale have been tested on‐chip, with a bias towards sensors and sample
preparation. So what can be expected from the future? Given the fact that microfluidics covers so
many overlapping disciplines, and that a clear definition of microfluidics is still lacking, this outlook is
by no means meant to be comprehensive. It represents our vision on the future of membranes and
microfluidics. As developments of ‘micro membrane technology’ are largely related to progress in
microfluidics itself, future prospects in this area will first be addressed.
Microfluidics is an emerging research field that has delivered many fascinating opportunities in
academic research, of which several have been transformed into commercial applications [9]. One of
the most amazing characteristics of the field is the speed of development. Illustrative is the outlook
in one of the early reviews of the fields from 1993, in which the following remarks are made [10]:

Evaluation and outlook
149
• “[…] the number of fluidic components is limited and the number of microfluidic
systems even smaller”
• “[…] most of what we need to know about fundamental microfluidics has yet to be
learned”
• “[…] there is a need for better design tools making modeling of a complete microfluidic
system possible”
Clearly, a lot of progress has been made over the last 15 years. Even stronger indications of
development speed can be noticed when looking at the level of commercialization. In 1993, only a
few silicon valves for gas flow and pressure where available on the market [10]. At this moment, fully
integrated set‐ups for high throughput screening can be bought for e.g. genomic research or
crystallization, and modular micro systems are available for process optimization in the chemical
industry. According to a recent business report of Yole Développement, the total accessible market
for microfluidics will rise to € 5B in 2012, of which € 1B is from diagnostic components [11].
Summarizing, development of microfluidics shows a positive trend that is based on a solid
foundation and solid principles. Given the fact that the real blockbuster application is still lacking,
the slope of progress can be further boosted in the future.
Within microfluidics, two major contributors can be distinguished: analysis and micro process
technology. It is important to realize that both fields exploit different advantages of microfluidics,
and have different requirements. Below, we shortly analyze both fields.
Analysis
In analysis, the small volumes and diffusion distances are the main advantages, as they lead to faster
detections at higher resolution, while requiring less sample volume. The drive is therefore to further
decrease length scales, down to nanofluidics [12]. Furthermore, the focus is on the integration of all
unit operations in a single device, including sensors, valves, mixers, reactors and separators (the so
called Lab‐on‐a‐chip concept) [13]. The key goal in this area is the generation of information and
knowledge. Complex parallelized systems allow for parallel screening and analysis of huge amounts
of variables, with DNA sequencing and protein crystallization as important applications [14]. The
field has flourished due to demands from genomic and pharmaceutical research. Furthermore, the
9‐11 event and subsequent terrorist threats have provoked an increased need for portable detectors
of explosive materials, compounds for biological or chemical warfare, and their intermediates.
Recently, also forensic sciences have recognized the power of miniaturization [15]. Concluding, the
importance of the field has been realized and the use of microfluidic components is generally
accepted.

Chapter 8
150
Micro process engineering
The field of micro process engineering is with its 10‐15 years history relatively new, and still in a
developing phase. The focus here has shifted from generation of information towards production of
chemicals and process improvement. The intrinsic small volumes of micro systems then become
disadvantageous, and scaling out by mass parallelization is required. In this field the motto is to go as
small as is necessary, in order to benefit from the advantages of microfluidics, while maintaining
reasonable throughput and avoiding blockage of micro channels [16]. A first benefit of microfluidic
systems is related to process safety. Reactions that are too dangerous on a large scale, such as
fluorination reactions [17], can be safely carried out in a micro reactor. Exothermic reactions can be
better controlled due to improved heat transfer, thereby avoiding hot spots. On the other side, the
improved heat transfer also enables reactions at room temperature, which are normally carried out
under cryogenic conditions. Furthermore, the intrinsic high surface to volume ratios can be exploited
in catalysis. Depending on the kinetics of reactions, higher conversions and yields can be obtained in
micro reactors, which can reduce manufacturing costs [18]. An additional advantage is related to
time. As micro reactors can be out scaled by numbering up, the traditional up scaling phases from
lab scale – via pilot plants – to industrial scale can be avoided. The time gained hereby is especially
important for the pharmaceutical industry, where reduced time‐to‐market of new medicines results
in enormous profit increases.
Contrary to the integration trend that is visible in analytical systems, in micro process
technology the KISS adagium is maintained: keep it simple, stupid. Unit operations such as premixing,
reaction, and purification, can be performed in a consecutive series of dedicated micro devices,
reducing complexity and price. In case of failure, only the part causing the problem needs to be
replaced. This modular approach has been chosen in the platforms of technology enablers such as
CPC, Ehrfeld Mikrotechnik, IMM and Syrrix. However, not every unit operation benefits from
miniaturization. It can therefore be expected that implementations of microfluidic systems in
chemical industry will lead to hybrid processes: only the process component where improvement
can be achieved is replaced by micro technology, e.g. a micro heat exchanger, micro mixer, or micro
reactor. As the investment for microfluidic components is relatively low, fast replacement in time by
improved versions can be envisioned. Wolfgang Ehrfeld, one of the founders of the field, even
forecasts market life times of future micro reactors as short as that of current micro processors.
However, current research in this field is still mostly in proof‐of‐principle phase, looking for suitable
reactions. Although microfluidic technology is slowly being established in industry, it is not yet fully
accepted. The opposing trends of both fields are summarized in Table 2.

Evaluation and outlook
151
Table 2: Opposing trends in analysis and micro process engineering regarding the application and development of microfluidic devices
Analysis Micro process engineering
Output focus Information Products
Process improvement
Device dimensions As small as possible
Towards nanofluidics
As small as necessary
Towards millifluidics
System miniaturization Every unit operation Only necessary unit operations
Device Complexity High Low
Acceptance of microfluidics Accepted Close to acceptance*
* Based on reported case studies in literature. However, it must be remarked that a large part of the research is carried out within large global chemical companies, who hardly publish data. Therefore, the image of acceptance is slightly diffuse.
Envisioning a far future application gives an indication where both fields may be heading to. For
analysis it might be: a microfluidic system implanted in the body that registrates different body
functions and automatically doses drugs. A far future application of micro process technology might
be: a miniaturized personal chemical factory in every house hold, where basic food ingredients can
be produced, together with electricity and heat.
Besides the different trends in analysis and micro process engineering, it is important to remark
that also strong differences in research culture can be encountered. Analytical applications (micro
TAS) have traditionally been developed in the disciplines of physics and electronics, while micro
process technology is a typical area for chemical and mechanical engineering. Consequently, a
different mind set can be detected. As current education at universities is picking up on microfluidic
developments, future academics will be better trained to combine benefits from both fields. Now
that biology and chemistry have also acknowledged the power of miniaturization, microfluidics has
become a true multidisciplinary field. The combined knowledge base of these fields is clearly beyond
grasp. Janasek et al. strikingly remarked that “[…] the design of micro TAS has required the use of a
scientific literature spanning 200 years in a range of fields.” [19] However, at the same time it must
be realized that challenges in one subfield may have been solved in the other. An example was given
in Chapter 2 for the modification of PDMS, a hot topic in current microfluidic research that has
already been largely explored in membrane technology. Therefore, strategies for improvement of
microfluidic devices may largely be found in open literature! The further digitalization of publications
will offer easy access to these hidden solutions, while improved search engines enable the effective

Chapter 8
152
handling of the enormous amount of information. Furthermore, closer collaborations in the future
between groups with specific knowledge are inevitable.
For membrane technology and microfluidics, overlapping topics include (functional) coatings;
materials processing; sealing; fouling and cleaning; and assembly and operation of modules. Below it
is indicated how both fields can contribute to each others development.
Changes in material use
In micro process technology, the preferred material currently is stainless steel. One of the main
reasons is the enormous experience that industry has with this material. Stainless steel has good
thermal conductivity and mechanical strength. However, on a micro scale, these material properties
become less important. For example, glass chips can easily withstand pressures up to 100’s of bars
[20]. Due to the large surface/volume ratio and small distances in microfluidic devices, heat transfer
can still be effective with materials of low thermal conductivity. The development of enzyme based
synthesis in the biotech area enables processes to be carried out at moderate temperatures and in
mild solvents, thereby avoiding aggressive chemicals [15]. In that case, the high chemical resistance
of stainless steel is not required anymore. Materials other than steel or metal alloys can thus be very
good alternative construction materials for micro reactors. Proof‐of‐principles will be required to
convince the conservative industry, but ultimately the use of plastic or ceramic micro reactors can be
envisioned. This conversion path can be seen as an analogy to the struggle that membrane
technology has had to convince industry that polymeric and ceramic membranes could withstand
industrial process conditions, and reliably outperform traditional separation processes such as
distillation. But not for naught: nowadays, membranes are used on a large scale in the petrochemical
industry.
In analysis, the initial fabrication materials such as glass and silicon have already been partly
replaced by polymeric materials [21]. Polymers are cheap, easy processable, and available in a wide
range of properties, such as transparency, biocompatibility, biodegradability, high chemical or
thermal resistance, hydrophobicity/hydrophylicity, etc. Hence, polymers can be considered as
suitable candidate materials for many applications. One of the biggest advantages is related to the
total cost of micro devices. Since polymers are applicable for mass replication technologies, such as
injection molding, thermoforming and hot embossing, the cost/micro device can immensely be
reduced. Consequently, development of disposable devices is possible, with huge potential markets
in diagnostics, drug discovery and genomics [11]. We expect that further development of Phase
Separation Micro Molding and embossing of porous membranes, as mentioned in Chapter 3 and 7,
can enable the development of disposable micro devices with membrane characteristics, and extend
the range of processable materials for microfluidics.

Evaluation and outlook
153
When going down in dimensions, surface to volume ratios increase and the influence of surface
interactions on system behavior becomes eminent. Selection of the right construction material is
therefore crucial, and in many cases, coating or surface modifications are required. In this area,
membrane technology can clearly add knowledge. Membranes are used in oxygenizers and
haemodialysis, and successful strategies have been developed to avoid issues such as clogging,
inflammation reactions, and fouling of surfaces. Furthermore, specific cleaning procedures and
cleaning agents have been developed that prolong membrane life time. Such knowledge may be
especially helpful in analysis of biological samples, where cells, DNA, and proteins are encountered.
Module design
Currently, most microfluidic devices consist of stacks of microstructured layers that are sealed
together. This approach leads to several challenges. Dust particles on substrates can cause bad
bonding, requiring expensive clean rooms. Channels can easily be blocked when using glue, due to
capillary forces. Sealing methods based on temperature and pressure can cause deformation of the
channels. Therefore, different module design approaches may be required. In membrane technology,
the switch from flat sheets to different geometries has already been made. An example is the
development of hollow fibers. A typical dialysis module consists of 1000’s of tiny hollow fiber
membranes that define the micro channels. In fact, such modules can be considered as mass
parallelized micro systems. An illustration is given in Figure 3.
Figure 3: Commercial dialysis module consisting of 1000’s of hollow fiber membranes (Ø 5cm, Optiflux 210, Fresenius). The close‐up shows the small fibers, potted in glue. The use of hollow fiber modules may be a good candidate for mass parallelization of micro channels with integrated separation functionality. Instead of hollow fiber membranes, also the use of tubing or capillaries can be envisioned.

Chapter 8
154
The cost price for such modules, including membranes, is typically around 10$. This low price
enables single usage, thereby avoiding cleaning, fouling and channel blocking issues encountered in
long term use of micro systems. Of course the mechanical properties and chemical or thermal
resistance of this module are not optimal for every process. But the point to make here is that the
design has been kept as simple as possible and fulfills all requirements for its application. By taking a
hollow fiber to define a micro channel, separation properties have been automatically built in and
sealing issues have been restricted to the potting. Hollow fibers can be made from a wide range of
polymeric, ceramic and metallic materials. Furthermore, different surface profiles can be generated
by using micro engineered inserts in the spinning process [22]. Integration of functionalized particles
in the membrane wall, chemical surface modification and immobilization techniques enable
integration of absorbents, catalysts, proteins or enzymes [23]. The general application of hollow
fiber membranes is not limited to separation, but can also be applied in reactions, or crystallization
[24].
In microfluidics, several research groups have started to use pieces of tubing or glass capillaries
as simple micro systems. Tubing walls can be functionalized with porous coatings, of which examples
were given in Chapter 6. We predict strong developments in microfluidics towards tubing based
modules for out scaling, based on the success of hollow fiber modules. The shell side of the module
may then be used for heating or cooling liquids. If no specific function is assigned for this shell side, a
hexagonal packing of tubing can be used, leading to a further decrease in module size compared to
hollow fiber modules.
Future applications of membrane technology in microfluidics
The most predictable trend of further membrane application is in analytical areas, where
membranes are already successfully exploited. Especially commercial track etched membranes are
interesting, because of their low price, low thickness and parallel pores. A next boost of membrane
technology can be foreseen in the field of micro process technology. Integration of reaction and
separation is a hot topic in this field, and membranes are interesting candidates to do the job.
Selective removal of reaction products during reactions can shift equilibrium towards higher
conversions [25]. The ability to locally supply and extract reagents, as was demonstrated in chapter 5,
may enable conversion of reagents in small steps for improved selectivities in systems with
sequential reactions.
Progress of micro systems in general has led to the development of portable electronic
equipment, such as cell phones, notebooks and multi media players. All these systems require
energy. A lot of effort is currently put in the realization of micro energy generators, in which a fuel is

Evaluation and outlook
155
oxidized. Membranes are already applied in micro fuel cells [26], and in the future, further
miniaturization and optimization of efficiency can be expected.
Membrane technology can also be used to create new functionality in microfluidic devices. First,
the selectivity of dense membranes, which is exploited on a large scale in gas separation [27], has
not yet been used on the micro scale. Examples for the microfluidic world might be the selective
removal of components from a sample gas stream in gas sensors, in order to increase signal to noise
ratio. Another option may be found in on‐chip pervaporation, where liquids can be selectively
separated. This principle can be used in VOC removal from aqueous streams or in the break‐up of
emulsions by selectively removing one of the phases. PDMS can be an interesting candidate for
future research in this direction, considering the high selectivities achievable and the familiarity in
microfluidic research with its application.
Second, a sub‐field emerging in membrane technology that may be interesting to microfluidics
is the implementation of bipolar membranes [28]. A bipolar membrane consists of a positively and a
negatively charged membrane, with an immobilized catalyst in between. By applying a current,
water splitting occurs at the interface of the membrane. Since the membranes are either permeable
to cations or anions, the protons and hydroxyl ions can be transported to different compartments,
one becoming more acidic while the other becomes basic. To keep electro neutrality, charges are
compensated by electrode reactions. Since the electrodes can be placed outside the chip,
development of gas is not a problem. Therefore, bipolar membranes may be very suitable to create
pH gradients on‐chip.
A final example of membrane technology that may be downscaled to small dimensions is
membrane emulsification in micro channels. In this process, one phase is flowing through the
channel, while the other phase is supplied through the porosity of the membrane. By switching both
phases, both water‐in‐oil and oil‐in‐water emulsions can be prepared. The membrane can be used
simultaneously for filtration purposes, enlarging the range of possible applications. First results have
been recently obtained in our group, using porous chips made by phase separation micromolding [3].
Monodisperse droplets could be prepared with a size that was slightly larger than the micro channel
diameter. Hoppe et al. have shown that the concept can be scaled out using the hollow fiber
approach, leading to much higher production rates [29]. The droplets produced may be used for the
synthesis of monodisperse particles [30] or the study of crystallization [31].
Future application of microfluidic technology in membrane technology
The bridge between microfluidics and membrane technology works in both directions, meaning that
the micro world can also add some advantages of its own to the field of membrane technology. The
high surface to volume ratio achievable in microfluidics is expected to push membranes to maximum

Chapter 8
156
performance. Available micro and nano fabrication technologies enable precise control of pore sizes,
and the deposition of very thin separation layers [32]. The development of solvent resistant
materials for micro reactors for organic synthesis, such as photo curable “liquid Teflon” [33], may
also be applicable as coating material in nanofiltration of organic solvents. Furthermore, the laminar
flows achievable in microfluidic devices can lead to new opportunities, of which unsupported liquid
membranes in three layer flow are a first example [34‐36].
Microfluidic systems can be safely operated at very high pressures. Such systems may therefore
be suitable for explorative testing in high pressure membrane applications, such as reverse osmosis
and separation of natural gas. Also the study of high pressure sorption and plasticization phenomena
in polymers can benefit from this approach. Finally, the high degree of parallelization in microfluidic
systems may be applied for high throughput screening of new membranes and membrane materials,
and the study of fouling behavior under varying conditions.
The ultimate microfluidic system: the human body
Although microfluidics is generally depicted as a high‐tech area that enables new ‘highly complex’
and ‘fully integrated’ micro systems, the most complex microfluidic systems imaginable are already
present for millions of years in nature: animals, plants and ‐ for a shorter time ‐ humans. The human
body consists of a large network of micro channels of different sizes (arteries, veins, blood vessels)
formed by combinations of individual micro reactors (cells). Issues of flow distribution, clogging and
fouling apparently have been solved in this complex system, and study of the body can thus lead to
inspiration for microfluidic systems – Natura docet. Interestingly, it is exactly the development of
microfluidic systems that has enabled such studies. Currently, it is possible to perform experiments
with single cells due to progress in microfluidic techniques for cell trapping, cell manipulation, lysis
and analysis [37]. This development has opened up the way for investigation of the reaction of cells
to medicines, their interactions with surfaces and interaction with other cells, mechanisms for cell
differentiation, etc. Combined with the high degree of parallelization that can be achieved in
microfluidic systems, the impact on human life will be enormous.
The cell wall can be considered as the ultimate dream of membrane scientists, as it selectively
controls active multi component transport in two directions at the same time [38]. It consists of lipid
bilayers with integrated membrane proteins. Further understanding of the membrane transport
properties, including its behavior towards new synthetic chemicals, can help the development of
effective medicines that require penetration of cells. On the other hand, better understanding may
also lead to preparation of a new type of membranes for highly selective separations. The first
examples of simple synthetic bilayers, prepared by self organization, have recently been

Evaluation and outlook
157
demonstrated in microfluidic chips [39‐42]. The biggest issue concerns stability, which has to be
addressed for successful reliable operation.
The combination of membrane technology and microfluidics can also enhance progress in tissue
engineering, the discipline that studies and develops methods for in vitro preparation of
replacement tissue. A starting point is the fabrication of biodegradable porous scaffolds, onto which
isolated cells from a patient can grow to form new tissue. Supply of oxygen and nutrients, and the
removal of waste products are crucial for the survival and growth of seeded cells. Membranes are
already applied as base layers for scaffolds [43]. Their porosity can be used for diffusional transport.
However, when going to 3D structures, diffusion distances become too long, and the integration of
micro channels for active transport is required. It has already been demonstrated that phase
separation micromolding is suitable to make porous scaffolds with integrated micro channels [44]. A
second option is the integration of hollow fibers. Further development of the membranes, combined
with the knowledge from microfluidic cellomics, enables large steps in progress towards the ultimate
goal: in vitro preparation of artificial organs.
In conclusion, with so many opportunities in as numerous areas, the general feeling cannot be
other then optimistic. The future for membranes and microfluidics looks bright.
8.4. CITED LITERATURE 1. J. de Jong, R.G.H. Lammertink, and M. Wessling, Lab Chip, 2006, 6, 1125‐1139. 2. J. de Jong, B. Ankone, R.G.H. Lammertink, and M. Wessling, Lab Chip, 2005, 5, 1240‐1247. 3. J. de Jong, M.J. Geerken, R.G.H. Lammertink, and M. Wessling, Chem. Eng. Technol., 2007, 30, 309‐315. 4. J. De Jong, P.W. Verheijden, R.G.H. Lammertink, and M. Wessling, Generation of local concentration
gradients by gas‐liquid contacting, submitted to Analytical Chemistry. 5. L. Vogelaar, R.G.H. Lammertink, J.N. Barsema, W. Nijdam, L.A.M. Bolhuis‐Versteeg, C.J.M. Van Rijn,
and M. Wessling, Small, 2005, 1, 645‐655. 6. C.N. Dudley, B. Schoberl, G.K. Sturgill, H.W. Beckham, and M.E. Rezac, J. Membrane Sci., 2001, 191, 1‐
11. 7. L. Vogelaar, J.N. Barsema, C.J.M. van Rijn, W. Nijdam, and M. Wessling, Adv. Mater., 2003, 15, 1385‐
1389. 8. C.K. Fredrickson and Z.H. Fan, Lab Chip, 2004, 4, 526‐533. 9. C. Haber, Lab Chip, 2006, 6, 1118‐1121. 10. P. Gravesen, J. Branebjerg, and O.S. Jensen, J. Micromech. Microeng., 1993, 3, 168. 11. Emerging markets in microfluidic applications, Business report, Yole Développement, 2007. 12. D. Mijatovic, J.C.T. Eijkel, and A. van den Berg, Lab Chip, 2005, 5, 492‐500. 13. S. Haeberle and R. Zengerle, Lab Chip, 2007, 7, 1094‐1110. 14. K. Huikko, R. Kostiainen, and T. Kotiaho, Eur. J. Pharm. Sci., 2003, 20, 149‐171. 15. K.M. Horsman, J.M. Bienvenue, K.R. Blasier, and J.P. Landers, J. Forsensic Sci., 2007, 52, 784‐799. 16. V. Hessel and H. Lowe, Chem. Eng. Technol., 2003, 26, 531‐544.

Chapter 8
158
17. N. de Mas, A. Gunther, M.A. Schmidt, and K.F. Jensen, Ind. Eng. Chem. Res., 2003, 42, 698‐710. 18. D.M. Roberge, L. Ducry, N. Bieler, P. Cretton, and B. Zimmermann, Chem. Eng. Technol., 2005, 28,
318‐323. 19. D. Janasek, J. Franzke, and A. Manz, Nature, 2006, 442, 374. 20. R.M. Tiggelaar, F. Benito‐Lopez, D.C. Hermes, H. Rathgen, R.J.M. Egberink, F.G. Mugele, D.N.
Reinhoudt, A. van den Berg, W. Verboom, and H. Gardeniers, Chem. Eng. J., 2007, 131, 163‐170. 21. H. Becker and C. Gaertner, Electrophoresis, 2000, 21, 12‐26. 22. W. Nijdam, J. de Jong, C.J.M. van Rijn, T. Visser, L. Versteeg, G. Kapantaidakis, G.H. Koops, and M.
Wessling, J. Membrane Sci., 2005, 256, 209‐215. 23. M. Miyazaki and H. Maeda, Trends In Biotechnology, 2006, 24, 463‐470. 24. E. Curcio, S. Simone, G.D. Profio, E. Drioli, A. Cassetta, and D. Lamba, J. Membrane Sci., 2005, 257, 134. 25. T. Cui, J. Fang, A. Zheng, F. Jones, and A. Reppond, Sens. Act. B, 2000, 71, 228‐231. 26. N.T. Nguyen and S.H. Chan, J. Micromech. Microeng., 2006, 16, R1‐R12. 27. W.J. Koros and G.K. Fleming, J. Membrane Sci., 1993, 83, 1‐80. 28. Handbook on bipolar membrane technology, ed. A.J.B. Kemperman. 2000, Enschede, The
Netherlands: Twente University Press. 29. J. Hoppe and T. Melin, J. Membrane Sci., 2007, 303, 100‐111. 30. T. Nisisako, T. Torii, and T. Higuchi, Chem. Eng. J., 2004, 101, 23‐29. 31. B. Zheng, J.D. Tice, L. Spencer Roach, and R.F. Ismagilov, Ang. Chem. Int. Ed., 2004, 43, 2508‐2511. 32. J. Eijkel and A. Van den Berg, Lab Chip, 2006, 6, 19‐23. 33. J.P. Rolland, M.v. Dam, D.A. Schorzman, S.R. Quake, and J.M. DeSimone, J. Am. Chem. Soc., 2004, 126,
2322‐2323. 34. M. Surmeian, M.N. Slyadnev, H. Hisamoto, A. Hibara, K. Uchiyama, and T. Kitamori, Anal. Chem., 2002,
74, 2014‐2020. 35. K. Sato, A. Hibara, M. Tokeshi, H. Hisamoto, and T. Kitamori, Adv. Drug Delivery Rev., 2003, 55, 379. 36. T. Maruyama, H. Matsushita, J.i. Uchida, F. Kubota, N. Kamiya, and M. Goto, Anal. Chem., 2004, 76,
4495‐4500. 37. H. Andersson and A. van den Berg, Sens. Act. B, 2003, 92, 315‐325. 38. J.C.T. Eijkel and A. van den Berg, Lab Chip, 2006, 6, 597‐600. 39. M.E. Sandison and H. Morgan, J. Micromech. Microeng., 2005, 15, 139‐144. 40. H. Suzuki, K.V. Tabata, H. Noji, and S. Takeuchi, Langmuir, 2006, 22, 1937‐1942. 41. M. Zagnoni, M.E. Sandison, P. Marius, A.G. Lee, and H. Morgan, Lab Chip, 2007, 7, 1176‐1183. 42. B. Le Pioufle, H. Suzuki, K.V. Tabata, H. Noji, and S. Takeuchi, Anal. Chem., 2008, 80, 328‐332. 43. D.F. Stamatialis, B.J. Papenburg, M. Girones, S. Saiful, S.N.M. Bettahalli, S. Schmitmeier, and M.
Wessling, J. Membrane Sci., In Press, Corrected Proof. 44. B.J. Papenburg, L. Vogelaar, L.A.M. Bolhuis‐Versteeg, R.G.H. Lammertink, D. Stamatialis, and M.
Wessling, Biomaterials, 2007, 28, 1998‐2009.

Samenvatting voor leken
159
SAMENVATTING VOOR LEKEN
Het werk dat in dit proefschrift beschreven wordt, gaat over membranen en membraantechnologie.
Een membraan is een barrière die selectief stoffen door kan laten. Dat kan op basis van grootte zijn,
zoals bij een zeef, maar ook op basis van interacties met het membraanmateriaal. Membranen kun
je als vlakke films, holle vezels of buizen kopen en worden gemaakt van metaal, keramiek en/of
plastic. Omdat je er zowel vaste, vloeibare als gasvormige stoffen mee kunt scheiden, zijn
membranen bijzonder breed inzetbaar. Op dit moment worden membranen op grote schaal
toegepast voor bijvoorbeeld het bereiden van drinkwater en voor scheidingen in de petrochemische
industrie. Het gaat dan om modules van enkele meters lang. Toepassingen op kleinere schaal, met
modules van een aantal decimeter in lengte, zijn nierdialyse en kunstmatige longen. Wanneer we
naar nog kleinere dimensies gaan, komen we terecht in de wereld van de microfluïdische systemen,
wat het onderwerp is van dit proefschrift.
Het woord ‘microfluïdisch’ betekent stroming op kleine schaal. Hoewel er geen strakke definitie
is, wordt met ‘klein’ meestal kleiner dan grofweg een halve millimeter bedoeld. Een bloedvat en de
kop van een inkjet printer zijn voorbeelden van microfluïdische systemen. Het vakgebied
microfluïdica houdt zich bezig met het ontwikkelen van methoden en apparatuur waarmee stroming
op die kleine schaal gecontroleerd, gemanipuleerd en geanalyseerd kan worden. Dit is interessant
om verschillende redenen. Allereerst kunnen op deze schaal vele testen gedaan worden met kleine
hoeveelheden vloeistof, dankzij de kleine interne volumes. Door microfluïdische systemen te
stapelen kan dit ook nog tegelijkertijd, het zogenaamde high throughput screening. Dat betekent dat
je in korte tijd heel veel informatie kan verkrijgen. Deze aanpak biedt grote kansen op het gebied van
DNA testen, het analyseren van bloed, en de ontwikkeling van nieuwe medicijnen. Andere voordelen
liggen in de richting van de reactorkunde. In een microfluïdisch systeem is stroming voorspelbaar en
veel beter te controleren dan op grote schaal. Daarnaast kan warmte veel effectiever aan‐ of
afgevoerd worden. Hierdoor kunnen chemische reacties efficiënter en veiliger uitgevoerd worden,
met betere producten en minder afval als resultaat. Men verwacht dat microfluïdische systemen
voor een revolutie zullen zorgen in de chemie en biologie, met een vergelijkbare impact als die van
micro‐electronica op ICT in de vorige eeuw. Maar voor het zover is, moet nog het nodige
onderzoekswerk gedaan worden.
Waarom zou je eigenlijk membraantechnologie met microfluïdische systemen willen
combineren? Dat heeft te maken met de trend binnen de microfluïdica om standaard laboratorium
handelingen te verkleinen en te integreren in een enkele module: het zogenaamde lab‐op‐een‐chip
concept. Veel van dit soort handelingen, zoals filtratie, mixen van stoffen, reactie, en/of scheiding,
kunnen met behulp van membranen uitgevoerd worden. Daarnaast is er binnen het vakgebied

Samenvatting voor leken
160
membraantechnologie veel kennis en ervaring aanwezig op gebieden die voor de microfluïdica van
nut kunnen zijn, waaronder: stoftransport, interacties tussen verschillende materialen,
materiaalverwerking, afdichting en module‐ontwerp. Het voornaamste doel van dit proefschrift is
daarom om een brug te slaan tussen de vakgebieden membraantechnologie en microfluïdica, en
hierbij nieuwe mogelijkheden te demonstreren. De inhoud is daardoor van een conceptuele en
exploratieve aard. Wat heeft dit werk dan uiteindelijk toegevoegd?
• Gecategoriseerd literatuuroverzicht van hoe membraanfunctionaliteit in een chip
geïntegreerd kan worden en welke mogelijkheden dit biedt. (Hoofdstuk 2).
• Beschrijving van een fabricagemethode om poreuze microfluïdische chips te maken. Een voorbeeld staat op de voorkant van dit proefschrift. In poreuze chips hebben de wanden van de kanaaltjes membraaneigenschappen en deze kunnen voor verschillende doeleinden ingezet worden. Ter illustratie is gastransport door de wand van microkanalen gedemonstreerd (Hoofdstuk 3).
• Fabricage van micro gas‐vloeistof contactoren, waarbij het grensvlak door een membraan gestabiliseerd wordt. Aangetoond is dat gassen gebruikt kunnen worden om lokaal de samenstelling van een vloeistof te beïnvloeden. Dit concept is gebruikt voor de controle van de zuurgraad in micro fermentatie experimenten, waarbij gistcellen suiker omzetten (Hoofdstuk 4) en voor het creëren van lokale concentratiegradiënten (Hoofdstuk 5).
• Ontwikkeling van een nieuwe methode om poreuze coatings aan te brengen in microkanalen door middel van fasescheiding van polymeeroplossingen. Aangetoond is dat functionele microdeeltjes in deze coatings geïntegreerd kunnen worden. Door katalysatordeeltjes te gebruiken kan een soort microreactor gemaakt worden. In samenwerking met de vakgroep katalyse is aangetoond dat in deze microreactoren glucose kan worden omgezet naar gluconzuur, een grondstof voor de chemische industrie (Hoofdstuk 6).
• Ontwikkeling van een concept om membranen snel en bij kamertemperatuur een microstructuur te kunnen geven, gebaseerd op embossen. Daarbij is aangetoond dat lokale verdichting tot transparantie kan leiden, wat visualisatie mogelijk maakt (Hoofdstuk 7).
• Demonstraties van nieuwe mogelijkheden om op basis van commerciële membranen microfluïdische systemen te maken (Hoofdstuk 7): ‐ gebruik van holle vezel membranen; ‐ fabrikage van monolieten en gepakte bedden in holle vezel membranen ‐ integratie van poreuze membranen in dichte films om de neiging om te zwellen in oplosmiddelen te verminderen en de mechanische sterkte te verbeteren.
Behalve een uitleg over het waarom van bovengenoemde punten en de beschrijving van hoe alles gerealiseerd is, is in dit proefschrift ook veel achtergrondinformatie opgenomen. Daarnaast worden diverse suggesties voor mogelijke toepassingen gegeven. Het proefschrift eindigt met een kritische evaluatie van de gepresenteerde concepten en een blik op de toekomst.

Dankwoord
161
DANKWOORD
Het zit er op! De periode van een promotie leek van te voren oneindig lang, maar is toch snel voorbij
gevlogen. Ik kijk met veel plezier terug op de afgelopen jaren: een bijzonder creatieve tijd met veel
vrijheid, congressen in binnen‐ en buitenland, veel uitdaging en omringd door aardige en slimme
mensen. Dit is de juiste plek om een aantal mensen te bedanken.
Allereerst wil ik mijn promotor Matthias Wessling van harte bedanken voor het aanbieden van
de promotieplek. Matthias, ik ben blij dat je me overtuigd hebt om aan dit avontuur te beginnen.
Mede door onze persoonlijke klik zijn het voor mij enorm inspirerende jaren geweest.
Tijdens mijn promotie ben ik door twee personen begeleid. Geert Henk Koops wil ik bedanken
voor de samenwerking op het gebied van stervormige vezels, aan het begin van mijn promotie. Na
een aantal maanden ben ik geswitched naar het project dat in dit proefschrift beschreven staat, en
hierbij werd Rob Lammertink mijn begeleider. Rob, jij bent een ideale sparringpartner voor mij
geweest. Doordat we het persoonlijk ook goed konden vinden, is het project duidelijk naar een
hoger plan getild. Ik wil je bijzonder bedanken voor het snelle correctiewerk, en de coachende
woorden als ik in een motivatiedipje zat. Jij verdient duidelijk een deel van de credits.
Verder wil ik de promotiecommissie bedanken voor het goedkeuren van mijn proefschift, en de
gebruikerscommissie voor hun input tijdens de overlegvergaderingen.
Een promotie doe je zeker niet in je eentje, en ik ben blij dat zoveel mensen mij hierbij
geholpen hebben. In het begin ben ik door Laura Vogelaar ingewijd in de wondere wereld van phase
separation micromolding. Heiko van der Linden, voorheen werkzaam in Groningen, heeft mij op weg
geholpen met de CNC frees. Bij het werk op het lab en de SEM heb ik hulp gehad van de technici.
Voor financiële en arbo technische vragen kon ik bij Antoine terecht (zelfs na 10 uur!). Greet zorgde
intussen voor al het regelwerk op de achtergrond, een praatje, een luisterend oor en ‐niet
onbelangrijk‐ het bijvullen van de snoeppot. Allemaal enorm bedankt!
Daarnaast heb ik ook hulp gehad van een aantal studenten, die een hoop werk voor mij verzet
hebben. Marloes en Greg, jullie werk is niet direct teruggekeerd in dit proefschrift, maar het heeft
wel bijgedragen aan mijn algemene kennis en inzicht in de materie. Pascal en Bouke, jullie bijdrage
heeft zich uitbetaald in twee artikelen, en daar wordt een promovendus als ik natuurlijk erg blij van!
Hartelijk bedankt hiervoor.
Tijdens mijn AIO‐schap heb ik met verschillende mensen mogen samenwerken. Allereerst met
Lidwien van Sprundel en vervolgens Ruben Kolfschoten in Wageningen. Daarnaast met Dejan
Radivojevic van de vakgroep katalyse. Dejan, ik vond onze samenwerking heel prettig, en het is

Dankwoord
162
bijzonder jammer dat we net toen het ging lopen moesten ophouden. Toch is het ons gelukt een
proof‐of‐principle te realiseren, die in hoofdstuk 6 terecht is gekomen. Verder wil ik Erik
Krommenhoek bedanken voor het maken van de sensoren voor de fermentatie experimenten en de
discussie daar omheen.
Samenwerken kan ook op niet‐technisch vlak. Met veel plezier heb ik meegedacht binnen het
promovendinetwerk van de UT (P‐NUT). Daarnaast heb ik als personeelslid in de universiteitsraad
plaats mogen nemen, wat een enorme leerervaring voor mij is geweest. Hoewel de gemoederen
tijdens de discussies met het college dikwijls hoog opliepen, was de sfeer in de CC‐fractie goed. Ik wil
daarom mijn fractiegenoten en de griffie hartelijk bedanken voor de prettige samenwerking.
Tijdens een promotie kan de boog niet altijd gespannen zijn, en is er af en toe tijd nodig voor
ontspanning. Wat dat betreft heb ik het erg getroffen in de membraangroep, waar vele activiteiten
plaatsvonden. Variërend van Batavierenraces, BBQ’s en bruiloften tot AIO uitjes in het buitenland,
verjaardagen, kraamvisites en borrels (picture of the month, vrijdagmiddag, flesjesavond in de Geus).
Dit alles maakte dat ik me altijd thuis voelde. Ik wil al mijn collega’s bedanken voor de enorm leuke
tijd die ik gehad heb en de prettige sfeer in de groep. Dit zal ik zeker gaan missen! Specifiek wil ik
ook mijn kamergenoten bedanken, met wie ik een groot deel van mijn (vrije) tijd heb doorgebracht.
Allereerst in het oude vertrouwde CT gebouw op kamer 1336: Marius, Dana, Joerg, Nilesh, Karina en
Hylke. En in Meander kamer 322: Saiful, Schwan, Szymon en Mayur. Tymen en Hylke, behalve op
het werk hebben we ook daarbuiten vaak afgesproken. Met veel plezier denk ik terug aan
bijvoorbeeld de zeiltochten of het Kubbsen. Hoewel de afstand naar Canada een aardig eind is hoop
ik jullie nog regelmatig te kunnen zien.
Vele lunchpauzes heb ik wandelend doorgebracht met Wilbert en Bernke, en we hebben veel
samen meegemaakt. Ik ben erg blij dat jullie de ‘zware taak’ van paranimf op jullie willen nemen en
tijdens de verdediging achter mij zullen zitten!
Dan wil ik hier ook nog even mijn opa noemen, de ‘andere’ ingenieur in de familie. Omdat hij
een voorbeeld voor mij is geweest vind ik het bijzonder jammer dat hij mijn verdediging niet meer
mee mag maken.
Tot slot wil ik nog mijn oud‐huisgenoten Marcel en Christiaan, al mijn overige vrienden en mijn
familie bedanken voor de interesse in mijn werk of juist de afleiding daarvan. En dan natuurlijk
speciaal Heit, Mem en Elske. Het is altijd fijn om ‘echt’ thuis te komen!
Allemaal nogmaals enorm bedankt!
Jorrit

Curriculum vitae and list of publications
163
CURRICULUM VITAE
Jorrit de Jong was born on the 17th of June 1978 in Leeuwarden, in the north of the Netherlands. In
July 1996, he received his VWO diploma from the OSG Sevenwolden in Heerenveen. In August 1996
he started his study Chemical Engineering at the University of Twente. After his propaedeutic year in
Leeuwarden at the NHL, he moved to Enschede. During his industrial training in 2001 he worked for
three months on ceramic membranes for pervaporation at SINTEF Material Teknologi in Oslo,
Norway. In February 2003, he received his Masters degree. His Master thesis concerned the
fabrication of double‐layer ceramic hollow fibers, for which he was awarded the Unilever Research
Award 2003. After briefly working on the development of membrane adsorbers for Mosaic Systems,
he started his PhD in October 2003 in the Membrane Technology Group of prof. Matthias Wessling.
His project was initially focused on the production of star shaped hollow fiber membranes. In June
2004, a switch was made to membranes and microfluidics, of which the results are described in this
thesis. During his PhD period, he was involved in the PhD network at the University of Twente
(P‐NUT) and an elected member of the University Council.
LIST OF PUBLICATIONS
1. J. de Jong, D. Radivojevic, L. Lefferts, R.G.H. Lammertink, M. Wessling, Preparation of porous polymeric coatings in micro channels, In preparation
2. J. de Jong, P.W. Verheijden, R.G.H. Lammertink, M. Wessling, Generation of local concentration gradients by gas liquid contacting, Accepted for Anal. Chem (2008), DOI: ac7023602
3. J. de Jong, M.J. Geerken, R.G.H. Lammertink, M. Wessling, Porous microfluidic devices ‐ Fabrication and applications, Chem. Eng. Techn.30 (3) (2007), p. 309‐315
4. J. de Jong, R.G.H. Lammertink, M.Wessling, Membranes and microfluidics: a review, Lab Chip 6 (9) (2006), p. 1125‐1139
5. J. de Jong, B. Ankoné, R.G.H. Lammertink, M. Wessling, New replication technique for the fabrication of thin polymeric microfluidic devices with tunable porosity, Lab Chip 5 (11) (2005), p. 1240‐1247. The cover picture of this issue showed a chip prepared by this method.
6. W. Nijdam, J. de Jong, C.J.M. van Rijn, T. Visser, L. Versteeg, G. Kapantaidakis, G.H. Koops, M. Wessling, High performance micro‐engineered hollow fiber membranes by smart spinneret design, J. Membrane Sci. 256 (1‐2) (2005), p. 209‐215
7. J. de Jong, N.E. Benes, G.H. Koops, M. Wessling, Towards single step production of multi‐layer inorganic hollow fibers, J. Membrane Sci. 239 (2) (2004), p. 265‐269

164