An Innovative IR-based Indoor Coordinate Measuring System for Large-Scale Metrology Applications
20
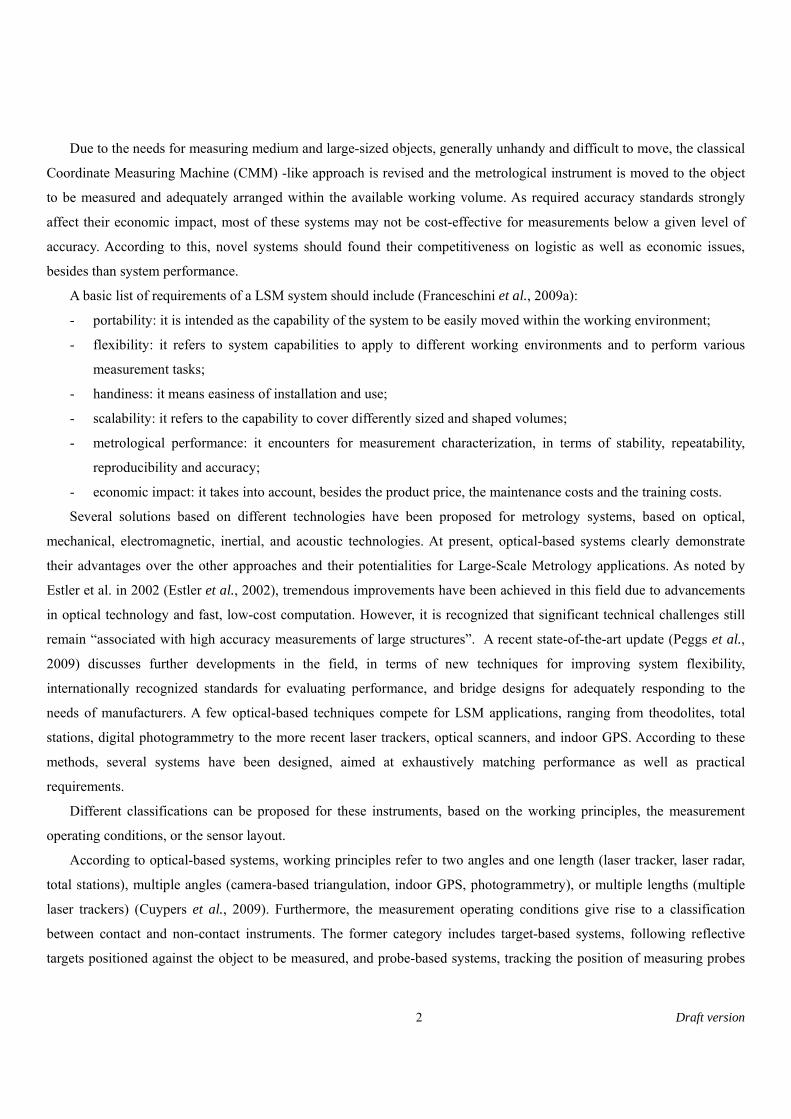
1 Draft version Draft Paper MScMS-II: An Innovative IR-based Indoor Coordinate Measuring System for Large-Scale Metrology Applications Maurizio Galetto, Luca Mastrogiacomo and Barbara Pralio Politecnico di Torino, Dipartimento di Sistemi di Produzione ed Economia dell’Azienda, Corso Duca degli Abruzzi 24, 10129, Torino, Italy KEYWORDS: Large-Scale Metrology, distributed measurement systems, wireless sensor networks, indoor dimensional measurement, infrared-based tracking. ABSTRACT According to the current great interest concerning Large-Scale Metrology applications in many different fields of manufacturing industry, technologies and techniques for dimensional measurement have recently shown a substantial improvement. Ease-of-use, logistic and economic issues, as well as metrological performance, are assuming a more and more important role among system requirements. This paper describes the architecture and the working principles of a novel InfraRed (IR) optical-based system, designed to perform low-cost and easy indoor coordinate measurements of large-size objects. The system consists of a distributed network-based layout, whose modularity allows to fit differently sized and shaped working volumes by adequately increasing the number of sensing units. Differently from existing spatially distributed metrological instruments, the remote sensor devices are intended to provide embedded data elaboration capabilities, in order to share the overall computational load. The overall system functionalities, including distributed layout configuration, network self-calibration, 3D point localization, and measurement data elaboration, are discussed. A preliminary metrological characterization of system performance, based on experimental testing, is also presented. 1. INTRODUCTION The field of Large-Scale Metrology (LSM) applies to angular measurement and alignment techniques as well as length measurement of large machines and structures, whose linear dimensions range from tens to hundreds of meters. Since its definition in the late 70s, this field has been considered as “one which provides a significant challenge to the metrologist since virtually every project is different and, moreover, accuracy requirements are becoming more demanding” (Puttock, 1978). The attention of manufacturers has been focused on the more and more demanding accuracy requirements. As a matter of fact, many different industrial sectors, such as aerospace, automotive, shipbuilding, and railway, demonstrate a great interest in Large-Scale Metrology applications. Reliable and efficient metrological instruments are needed to provide a support in assembly, alignment, measurement inspection, and robot tracking tasks.
Transcript of An Innovative IR-based Indoor Coordinate Measuring System for Large-Scale Metrology Applications
1 Draft version
Draft Paper
MScMS-II: An Innovative IR-based Indoor Coordinate Measuring System for Large-Scale Metrology Applications
Maurizio Galetto, Luca Mastrogiacomo and Barbara Pralio
Politecnico di Torino, Dipartimento di Sistemi di Produzione ed Economia dell’Azienda,
Corso Duca degli Abruzzi 24, 10129, Torino, Italy
KEYWORDS: Large-Scale Metrology, distributed measurement systems, wireless sensor networks, indoor dimensional
measurement, infrared-based tracking.
ABSTRACT
According to the current great interest concerning Large-Scale Metrology applications in many different fields
of manufacturing industry, technologies and techniques for dimensional measurement have recently shown a
substantial improvement. Ease-of-use, logistic and economic issues, as well as metrological performance, are
assuming a more and more important role among system requirements. This paper describes the architecture and
the working principles of a novel InfraRed (IR) optical-based system, designed to perform low-cost and easy
indoor coordinate measurements of large-size objects. The system consists of a distributed network-based layout,
whose modularity allows to fit differently sized and shaped working volumes by adequately increasing the number
of sensing units. Differently from existing spatially distributed metrological instruments, the remote sensor devices
are intended to provide embedded data elaboration capabilities, in order to share the overall computational load.
The overall system functionalities, including distributed layout configuration, network self-calibration, 3D point
localization, and measurement data elaboration, are discussed. A preliminary metrological characterization of
system performance, based on experimental testing, is also presented.
1. INTRODUCTION
The field of Large-Scale Metrology (LSM) applies to angular measurement and alignment techniques as well as length
measurement of large machines and structures, whose linear dimensions range from tens to hundreds of meters. Since its
definition in the late 70s, this field has been considered as “one which provides a significant challenge to the metrologist
since virtually every project is different and, moreover, accuracy requirements are becoming more demanding” (Puttock,
1978). The attention of manufacturers has been focused on the more and more demanding accuracy requirements. As a
matter of fact, many different industrial sectors, such as aerospace, automotive, shipbuilding, and railway, demonstrate a
great interest in Large-Scale Metrology applications. Reliable and efficient metrological instruments are needed to provide
a support in assembly, alignment, measurement inspection, and robot tracking tasks.
2 Draft version
Due to the needs for measuring medium and large-sized objects, generally unhandy and difficult to move, the classical
Coordinate Measuring Machine (CMM) -like approach is revised and the metrological instrument is moved to the object
to be measured and adequately arranged within the available working volume. As required accuracy standards strongly
affect their economic impact, most of these systems may not be cost-effective for measurements below a given level of
accuracy. According to this, novel systems should found their competitiveness on logistic as well as economic issues,
besides than system performance.
A basic list of requirements of a LSM system should include (Franceschini et al., 2009a):
- portability: it is intended as the capability of the system to be easily moved within the working environment;
- flexibility: it refers to system capabilities to apply to different working environments and to perform various
measurement tasks;
- handiness: it means easiness of installation and use;
- scalability: it refers to the capability to cover differently sized and shaped volumes;
- metrological performance: it encounters for measurement characterization, in terms of stability, repeatability,
reproducibility and accuracy;
- economic impact: it takes into account, besides the product price, the maintenance costs and the training costs.
Several solutions based on different technologies have been proposed for metrology systems, based on optical,
mechanical, electromagnetic, inertial, and acoustic technologies. At present, optical-based systems clearly demonstrate
their advantages over the other approaches and their potentialities for Large-Scale Metrology applications. As noted by
Estler et al. in 2002 (Estler et al., 2002), tremendous improvements have been achieved in this field due to advancements
in optical technology and fast, low-cost computation. However, it is recognized that significant technical challenges still
remain “associated with high accuracy measurements of large structures”. A recent state-of-the-art update (Peggs et al.,
2009) discusses further developments in the field, in terms of new techniques for improving system flexibility,
internationally recognized standards for evaluating performance, and bridge designs for adequately responding to the
needs of manufacturers. A few optical-based techniques compete for LSM applications, ranging from theodolites, total
stations, digital photogrammetry to the more recent laser trackers, optical scanners, and indoor GPS. According to these
methods, several systems have been designed, aimed at exhaustively matching performance as well as practical
requirements.
Different classifications can be proposed for these instruments, based on the working principles, the measurement
operating conditions, or the sensor layout.
According to optical-based systems, working principles refer to two angles and one length (laser tracker, laser radar,
total stations), multiple angles (camera-based triangulation, indoor GPS, photogrammetry), or multiple lengths (multiple
laser trackers) (Cuypers et al., 2009). Furthermore, the measurement operating conditions give rise to a classification
between contact and non-contact instruments. The former category includes target-based systems, following reflective
targets positioned against the object to be measured, and probe-based systems, tracking the position of measuring probes
3 Draft version
directly touching the object. On the other hand, due to the pressing need for portable, flexible and scalable systems, the
attention have been recently focused on novel approaches to the sensor displacement. As a consequence, distributed
systems, consisting of multiple units spread out over the working environment, represent a novel alternative to the
classical centralized approach, founding on a stand-alone independent measuring unit.
This paper presents a novel optical-based distributed system (MScMS-II – Mobile Spatial coordinate Measuring
System-II), designed to perform low-cost, simple, and rapid indoor coordinate measurements of large-sized objects.
The novelty of the system is mainly related to its capabilities to extend the measurement domain, being able to cover
large and geometrically complex working volumes by properly distributing the network sensors, and to consistently
reduce the economic impact.
Several optical-based systems are industrially available, providing well-settled solutions to the needs for accurate
and reliable measuring instruments for indoor Large-Scale Metrology applications. The design phase of such systems
has been strongly influenced by the requirements for a portable and flexible system, able to fit more and more different
application scenarios. These requirements are addressed by many manufacturers through the integration of six DoF
probes, able to perform a variety of measurement tasks (such as reconstruction of geometrical features, object shape
definition, and shape changes monitoring) as well as to deal with hardly accessible features.
Laser tracker-based systems are available from many manufacturers (Leica Geosystems, 2009; Faro Technologies,
2009; Automated Precision, 2009) and are the more common and conventional response to the need for a flexible,
portable and highly accurate alternative to CMMs. More recent designs are based on laser tracking and
photogrammetry, by integrating a camera into the laser tracker to measure the 6DoF pose of a mobile contact probe
(Leica Geosystems, 2009). Other hybrid systems combine laser tracker, cameras and tilting sensors to estimate the
probe pose, entrusting range measurements to the laser tracker and angular measurements to the camera-based sensor
set (Automated Precision, 2009).
Theodolites and total stations (Leica Geosystems, 2009), commonly used in surveying and engineering work, are a
portable, easy to use and cheaper alternative to laser trackers but they provide lower accuracy and appear to be
unsuitable to measure complex shapes.
Pure digital photogrammetry-based systems gather images either with a single moving camera (offline
photogrammetry) or with a set of synchronized cameras (online stereo/multi-image photogrammetry) (Luhmann, 2009).
Advanced online camera-based systems, such as (Northern Digital, 2009; Nikon Metrology, 2010; Metronor, 2009;
Axios 3D, 2009), provide capabilities to perform different measurement task, possibly combined with targeted hand-
held probes. These systems, mounting cameras in a fixed bar housing, implement a centralized approach to solve the
sensor displacement problem and hence reduce their scalability properties. System accuracy is strongly related to image
quality (related to the hardware resolution), 3D point reconstruction algorithms (bundle adjustment), and working
environment conditions (lighting effects generating reflections).
4 Draft version
The innovative indoor-GPS (ARC Second, 2009; Nikon Metrology, 2010), performing triangulation of rotating
laser beams emitted by multiple transmitters (reference points), represents a highly accurate metrological solution. It
provides distinguishing flexibility and portability features due to its network-based architecture combined with a mobile
measuring probe.
All these systems, sharing significant capabilities to fulfil design requirements, have also a high economic impact,
mainly related to the sensing hardware.
The proposed IR-based system (MScMS-II), which shares the digital photogrammetry principles with the novel
camera-based solutions (Mikhail et al., 2001), demonstrates to better face with scalability issues, due to its distributed
and modular architecture. Although this system appear to have lower economic impact charged to worse metrological
performance, it is noteworthy that these aspects are strongly related to the technical specifications of sensing devices
(e.g. camera resolution, sample rate, LED intensity). On the other hand, further improvement could be obtained by
integrating the proposed system with other accurate optical-based systems (e.g. instruments using structured light).
Such a multi-resolution integrated solution should be able to exploit the high performance of these centralized systems
within the large working volume covered by the distributed sensor network.
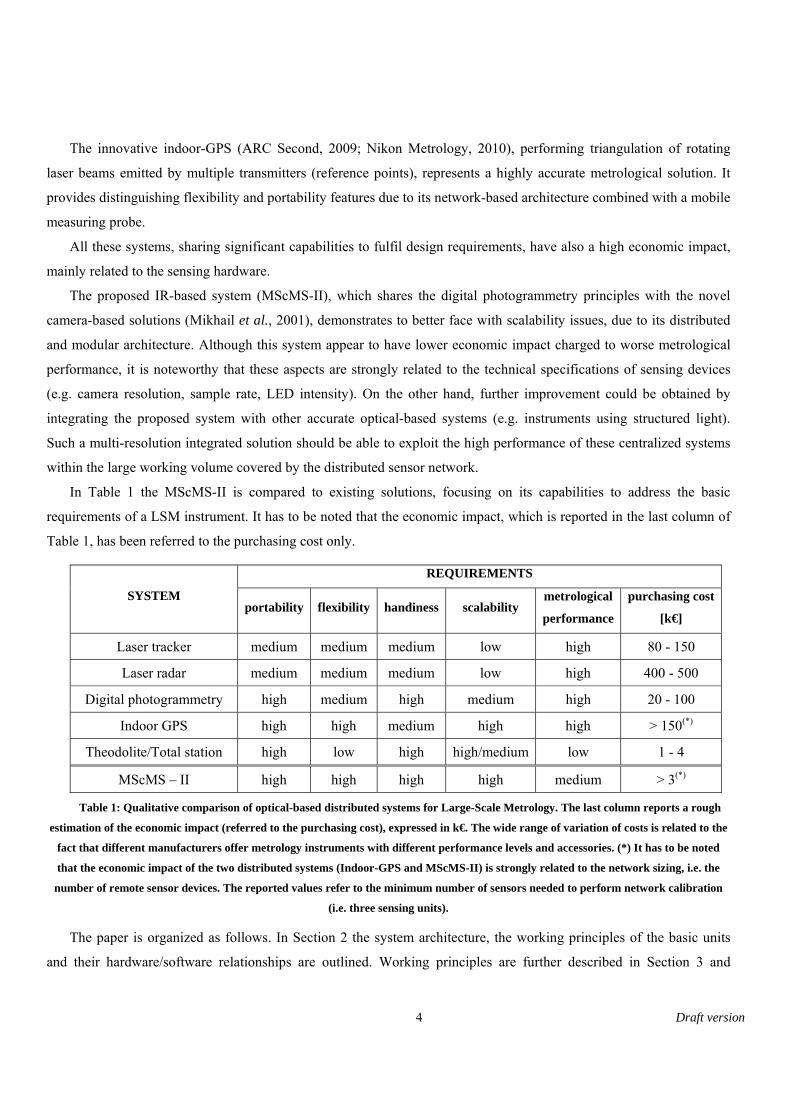
In Table 1 the MScMS-II is compared to existing solutions, focusing on its capabilities to address the basic
requirements of a LSM instrument. It has to be noted that the economic impact, which is reported in the last column of
Table 1, has been referred to the purchasing cost only.
SYSTEM
REQUIREMENTS
portability flexibility handiness scalability metrological
performance
purchasing cost
[k€]
Laser tracker medium medium medium low high 80 - 150
Laser radar medium medium medium low high 400 - 500
Digital photogrammetry high medium high medium high 20 - 100
Indoor GPS high high medium high high > 150(*)
Theodolite/Total station high low high high/medium low 1 - 4
MScMS – II high high high high medium > 3(*)
Table 1: Qualitative comparison of optical-based distributed systems for Large-Scale Metrology. The last column reports a rough
estimation of the economic impact (referred to the purchasing cost), expressed in k€. The wide range of variation of costs is related to the
fact that different manufacturers offer metrology instruments with different performance levels and accessories. (*) It has to be noted
that the economic impact of the two distributed systems (Indoor-GPS and MScMS-II) is strongly related to the network sizing, i.e. the
number of remote sensor devices. The reported values refer to the minimum number of sensors needed to perform network calibration
(i.e. three sensing units).
The paper is organized as follows. In Section 2 the system architecture, the working principles of the basic units
and their hardware/software relationships are outlined. Working principles are further described in Section 3 and
5 Draft version
Section 4, where localization schemes and system calibration are faced through algorithmic implementation. The
system is, then, characterized by a set of experimental tests. The preliminary results, reported in Section 5, aim at
evaluating measurement stability, repeatability, reproducibility and accuracy. Finally, Section 6 reports some
concluding remarks and a brief outline of future research.
2. SYSTEM DESCRIPTION
The MScMS-II is an indoor coordinate measuring system based on IR optical technology, designed for Large-Scale
Metrology applications. The system, developed at the Industrial Metrology and Quality Engineering Laboratory of
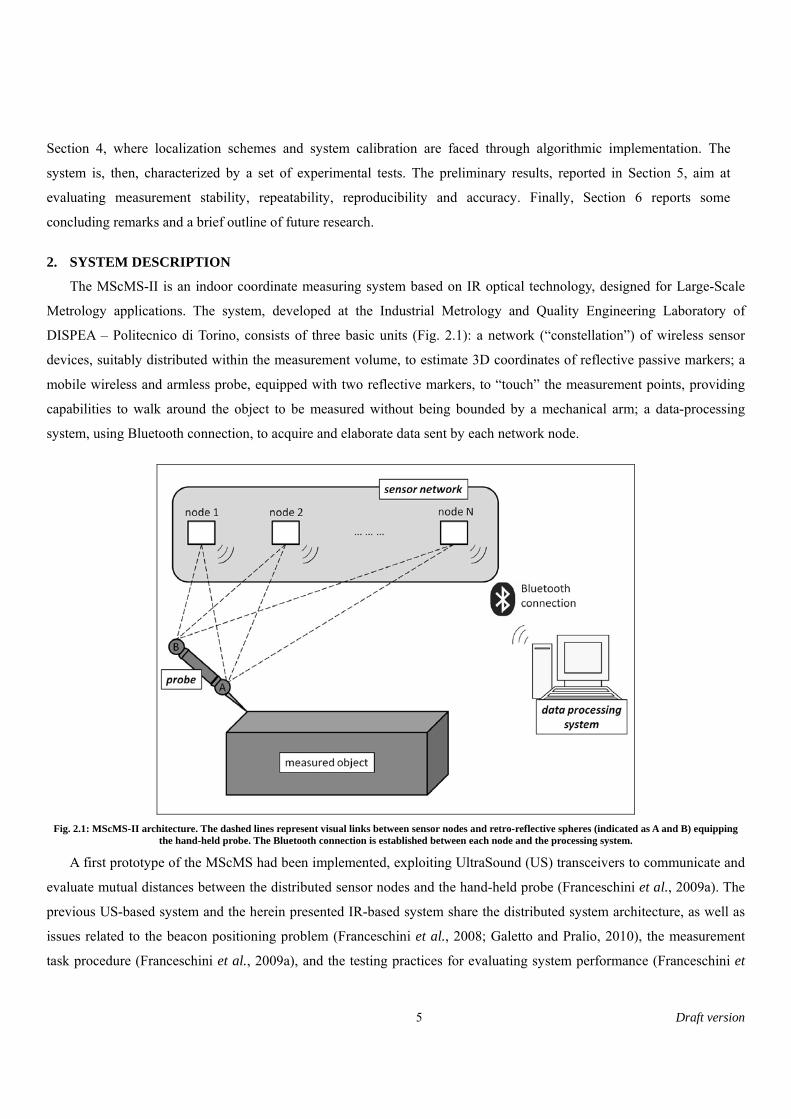
DISPEA – Politecnico di Torino, consists of three basic units (Fig. 2.1): a network (“constellation”) of wireless sensor
devices, suitably distributed within the measurement volume, to estimate 3D coordinates of reflective passive markers; a
mobile wireless and armless probe, equipped with two reflective markers, to “touch” the measurement points, providing
capabilities to walk around the object to be measured without being bounded by a mechanical arm; a data-processing
system, using Bluetooth connection, to acquire and elaborate data sent by each network node.
Fig. 2.1: MScMS-II architecture. The dashed lines represent visual links between sensor nodes and retro-reflective spheres (indicated as A and B) equipping
the hand-held probe. The Bluetooth connection is established between each node and the processing system.
A first prototype of the MScMS had been implemented, exploiting UltraSound (US) transceivers to communicate and
evaluate mutual distances between the distributed sensor nodes and the hand-held probe (Franceschini et al., 2009a). The
previous US-based system and the herein presented IR-based system share the distributed system architecture, as well as
issues related to the beacon positioning problem (Franceschini et al., 2008; Galetto and Pralio, 2010), the measurement
task procedure (Franceschini et al., 2009a), and the testing practices for evaluating system performance (Franceschini et
6 Draft version
al., 2009b). On the other hand, the two systems are based on different calibration procedures and implement different
localization algorithms (triangulation for the IR-based MScMS and trilateration for the US-based MScMS). The MScMS-
II has been designed and developed to represent an improvement as to functional, logistic, economic and metrological
issues. From a functional point of view, the sampling rate, which has been increased from 2 points per second for the US-
based system to up to 100 points per second for the MScMS-II, allows to dynamically tracking moving objects and,
hence, to enhance measurement automation potentialities (Galetto et al., 2010b). The use of lightweight passive reflective
markers instead of energy-consuming US sensing devices allows more flexibility as to probe design and sensor carrying
solutions. Furthermore, due to the size and geometry of the field-of-sensing and the minimum sensor data required for
triangulation, the beacon density for 3D point localization is consistently reduced in the MScMS-II. This issue entails an
improvement as to installation times and overall cost. The higher level of automation and metrological effectiveness,
which characterize the calibration procedure of the MScMS-II, represent a further point for the IR-based system, reducing
setup times and human skills requirements. Whereas some critical features of US devices (non punctiform dimensions,
speed of sound dependence on operating temperature, wave reflection and diffraction, etc.) caused a low accuracy in the
measurement results (Franceschini et al., 2009a; Franceschini et al., 2009b), the MScMS-II provides a consistent
improvement of metrological performance, by increasing position accuracy and measurement reliability.
2.1. Sensor network
Currently, a prototype of the distributed network has been set up by using commercial low-cost IR cameras,
characterized by an interpolated resolution of 1024x768 pixels (native resolution is 128x96 pixels), a maximum sample
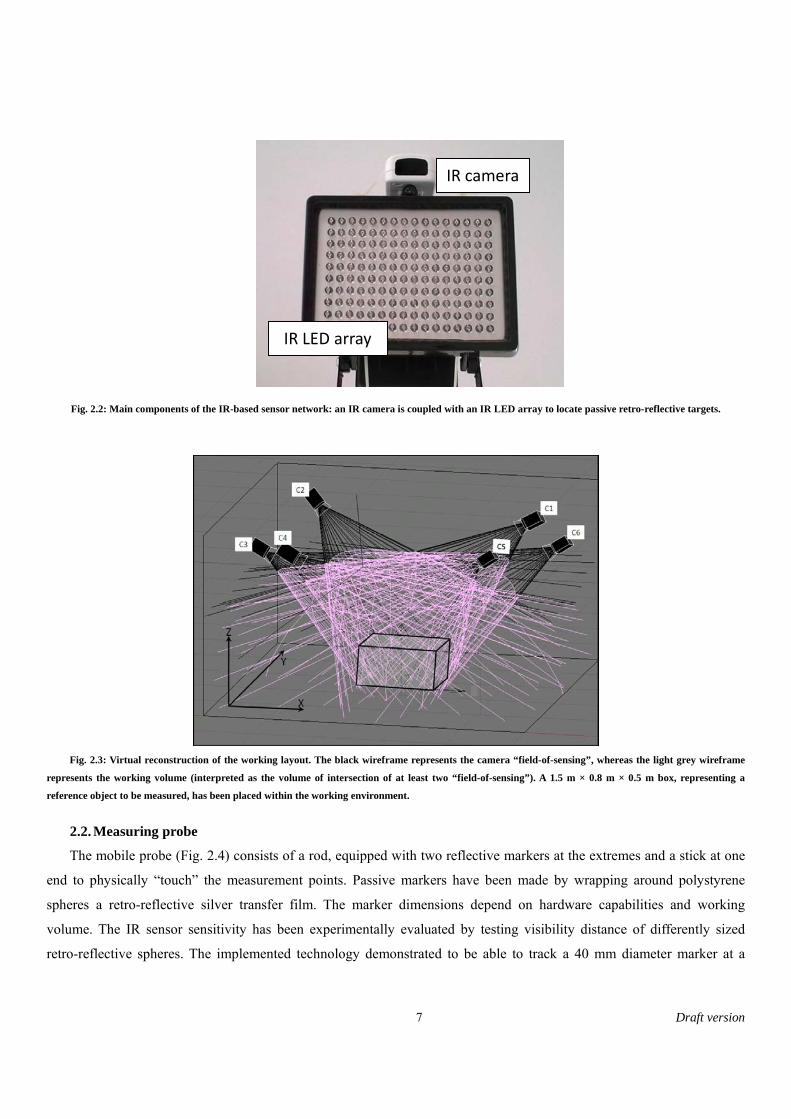
rate of 100 Hz, and a Field of View (FOV) of approximately 45°×30°. Each camera implements a real-time multi-object
tracking engine, allowing to track up to four IR light sources. In order to work with passive markers, each camera was
coupled with a near-IR light source (Fig. 2.2), consisting of a 160-chip LED array with a peak wavelength of 940 nm and
a viewing half-angle of approximately 80°. The overall sensor set (camera and LED array) weights about 500 g and is
13×13×15 cm sized. The IR sensors configuration can be set according to shape and size of the measured object as well as
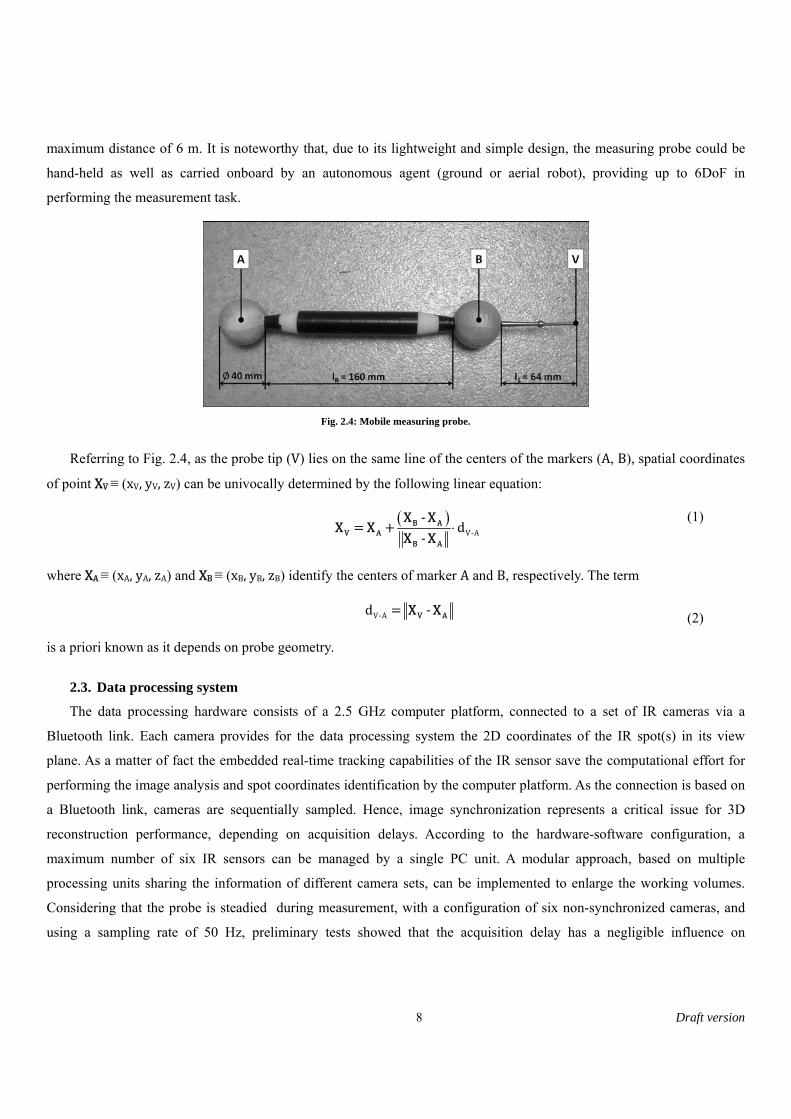
of the working environment (Galetto et al., 2010). Fig. 2.3 provides a virtual reconstruction of the working layout, with
reference to a six cameras configuration.
Given a fixed number of cameras, all operating conditions being unchanged, the actual working volume, intended as
the region within which the spatial position of a single marker can be reconstructed, depends on the technical
specifications of IR cameras (e.g. FOV, sensitivity, pixel resolution and focal length) and light sources (e.g. LED power
and wave length) as well as on the size of the markers. According to triangulation principles, this volume consists of the
volume of intersection of the “field-of-sensing” of at least two cameras. It has to be noted that a network layout consisting
of six commercial low-cost IR sensors, arranged in a 5.0×6.0×3.0 m working environment according to a grid-based
configuration, results in an actual working volume of about 2.0×2.0×2.0 m.
7 Draft version
Fig. 2.2: Main components of the IR-based sensor network: an IR camera is coupled with an IR LED array to locate passive retro-reflective targets.
Fig. 2.3: Virtual reconstruction of the working layout. The black wireframe represents the camera “field-of-sensing”, whereas the light grey wireframe
represents the working volume (interpreted as the volume of intersection of at least two “field-of-sensing”). A 1.5 m × 0.8 m × 0.5 m box, representing a
reference object to be measured, has been placed within the working environment.
2.2. Measuring probe
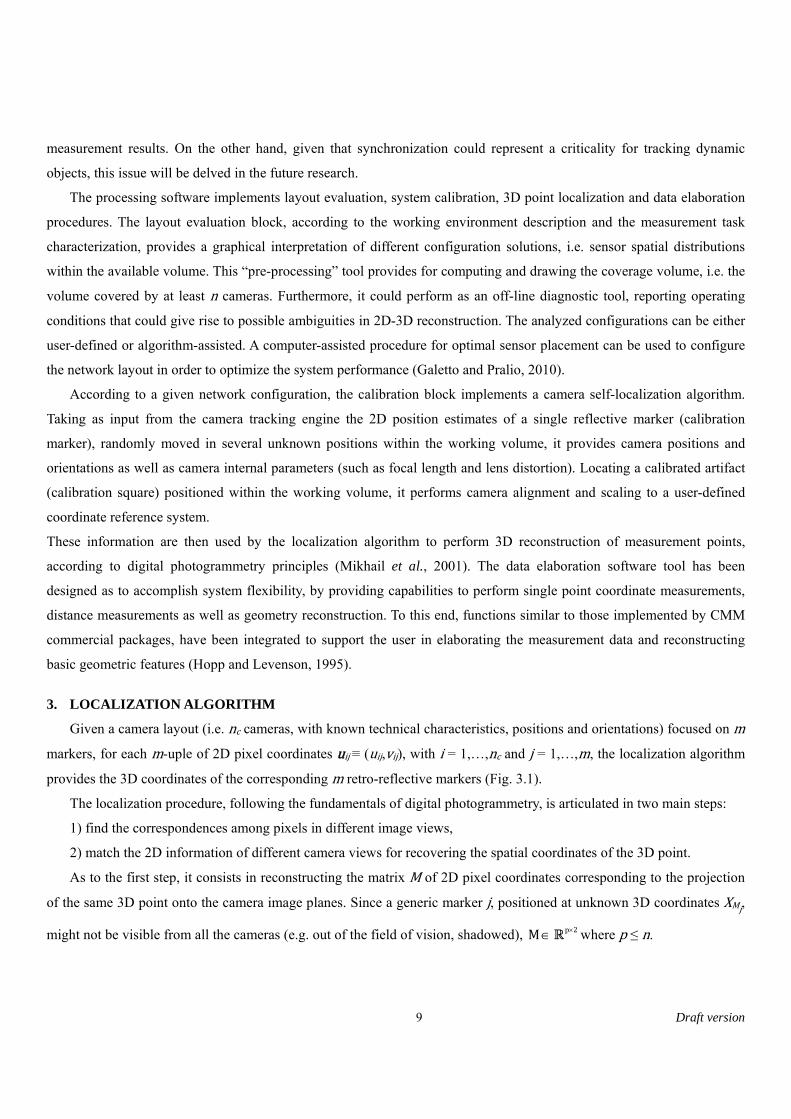
The mobile probe (Fig. 2.4) consists of a rod, equipped with two reflective markers at the extremes and a stick at one
end to physically “touch” the measurement points. Passive markers have been made by wrapping around polystyrene
spheres a retro-reflective silver transfer film. The marker dimensions depend on hardware capabilities and working
volume. The IR sensor sensitivity has been experimentally evaluated by testing visibility distance of differently sized
retro-reflective spheres. The implemented technology demonstrated to be able to track a 40 mm diameter marker at a
IR camera
IR LED array
8 Draft version
maximum distance of 6 m. It is noteworthy that, due to its lightweight and simple design, the measuring probe could be
hand-held as well as carried onboard by an autonomous agent (ground or aerial robot), providing up to 6DoF in
performing the measurement task.
Fig. 2.4: Mobile measuring probe.
Referring to Fig. 2.4, as the probe tip (V) lies on the same line of the centers of the markers (A, B), spatial coordinates
of point XV ≡ (xV, yV, zV) can be univocally determined by the following linear equation:
V‐A
‐d
‐B A
V AB A
X XX X
X X
where XA ≡ (xA, yA, zA) and XB ≡ (xB, yB, zB) identify the centers of marker A and B, respectively. The term
V‐Ad ‐V AX X
is a priori known as it depends on probe geometry.
2.3. Data processing system
The data processing hardware consists of a 2.5 GHz computer platform, connected to a set of IR cameras via a
Bluetooth link. Each camera provides for the data processing system the 2D coordinates of the IR spot(s) in its view
plane. As a matter of fact the embedded real-time tracking capabilities of the IR sensor save the computational effort for
performing the image analysis and spot coordinates identification by the computer platform. As the connection is based on
a Bluetooth link, cameras are sequentially sampled. Hence, image synchronization represents a critical issue for 3D
reconstruction performance, depending on acquisition delays. According to the hardware-software configuration, a
maximum number of six IR sensors can be managed by a single PC unit. A modular approach, based on multiple
processing units sharing the information of different camera sets, can be implemented to enlarge the working volumes.
Considering that the probe is steadied during measurement, with a configuration of six non-synchronized cameras, and
using a sampling rate of 50 Hz, preliminary tests showed that the acquisition delay has a negligible influence on
(1)
(2)
9 Draft version
measurement results. On the other hand, given that synchronization could represent a criticality for tracking dynamic
objects, this issue will be delved in the future research.
The processing software implements layout evaluation, system calibration, 3D point localization and data elaboration
procedures. The layout evaluation block, according to the working environment description and the measurement task
characterization, provides a graphical interpretation of different configuration solutions, i.e. sensor spatial distributions
within the available volume. This “pre-processing” tool provides for computing and drawing the coverage volume, i.e. the
volume covered by at least n cameras. Furthermore, it could perform as an off-line diagnostic tool, reporting operating
conditions that could give rise to possible ambiguities in 2D-3D reconstruction. The analyzed configurations can be either
user-defined or algorithm-assisted. A computer-assisted procedure for optimal sensor placement can be used to configure
the network layout in order to optimize the system performance (Galetto and Pralio, 2010).
According to a given network configuration, the calibration block implements a camera self-localization algorithm.
Taking as input from the camera tracking engine the 2D position estimates of a single reflective marker (calibration
marker), randomly moved in several unknown positions within the working volume, it provides camera positions and
orientations as well as camera internal parameters (such as focal length and lens distortion). Locating a calibrated artifact
(calibration square) positioned within the working volume, it performs camera alignment and scaling to a user-defined
coordinate reference system.
These information are then used by the localization algorithm to perform 3D reconstruction of measurement points,
according to digital photogrammetry principles (Mikhail et al., 2001). The data elaboration software tool has been
designed as to accomplish system flexibility, by providing capabilities to perform single point coordinate measurements,
distance measurements as well as geometry reconstruction. To this end, functions similar to those implemented by CMM
commercial packages, have been integrated to support the user in elaborating the measurement data and reconstructing
basic geometric features (Hopp and Levenson, 1995).
3. LOCALIZATION ALGORITHM
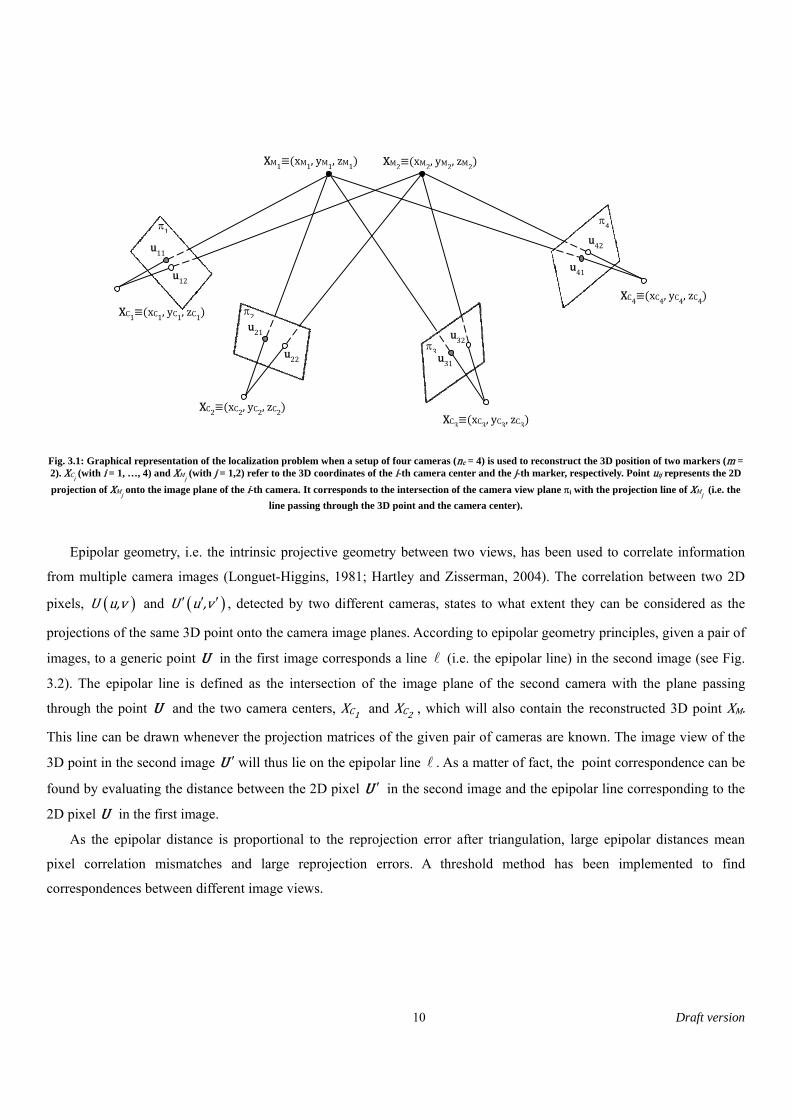
Given a camera layout (i.e. nc cameras, with known technical characteristics, positions and orientations) focused on m
markers, for each m-uple of 2D pixel coordinates uij ≡ (uij,vij), with i = 1,…,nc and j = 1,…,m, the localization algorithm
provides the 3D coordinates of the corresponding m retro-reflective markers (Fig. 3.1).
The localization procedure, following the fundamentals of digital photogrammetry, is articulated in two main steps:
1) find the correspondences among pixels in different image views,
2) match the 2D information of different camera views for recovering the spatial coordinates of the 3D point.
As to the first step, it consists in reconstructing the matrix M of 2D pixel coordinates corresponding to the projection
of the same 3D point onto the camera image planes. Since a generic marker j, positioned at unknown 3D coordinates XMj,
might not be visible from all the cameras (e.g. out of the field of vision, shadowed), p 2M where p ≤ n.
10 Draft version
Fig. 3.1: Graphical representation of the localization problem when a setup of four cameras (nc = 4) is used to reconstruct the 3D position of two markers (m = 2). XCi (with i = 1, …, 4) and XMj (with j = 1,2) refer to the 3D coordinates of the i-th camera center and the j-th marker, respectively. Point uij represents the 2D
projection of XMj onto the image plane of the i-th camera. It corresponds to the intersection of the camera view plane i with the projection line of XMj (i.e. the
line passing through the 3D point and the camera center).
Epipolar geometry, i.e. the intrinsic projective geometry between two views, has been used to correlate information
from multiple camera images (Longuet-Higgins, 1981; Hartley and Zisserman, 2004). The correlation between two 2D
pixels, U u,v and U u ,v , detected by two different cameras, states to what extent they can be considered as the
projections of the same 3D point onto the camera image planes. According to epipolar geometry principles, given a pair of
images, to a generic point U in the first image corresponds a line (i.e. the epipolar line) in the second image (see Fig.
3.2). The epipolar line is defined as the intersection of the image plane of the second camera with the plane passing
through the point U and the two camera centers, XC1 and XC2 , which will also contain the reconstructed 3D point XM.
This line can be drawn whenever the projection matrices of the given pair of cameras are known. The image view of the
3D point in the second image U will thus lie on the epipolar line . As a matter of fact, the point correspondence can be
found by evaluating the distance between the 2D pixel U in the second image and the epipolar line corresponding to the
2D pixel U in the first image.
As the epipolar distance is proportional to the reprojection error after triangulation, large epipolar distances mean
pixel correlation mismatches and large reprojection errors. A threshold method has been implemented to find
correspondences between different image views.
XC2 xC2, yC2, zC2 XC3 xC3, yC3, zC3
XC4 xC4, yC4, zC4XC1 xC1, yC1, zC1
XM2 xM2, yM2, zM2XM1 xM1, yM1, zM1
u11
u12
u21
u22 u31
u32
u41
u42
1
2
3
4
11 Draft version
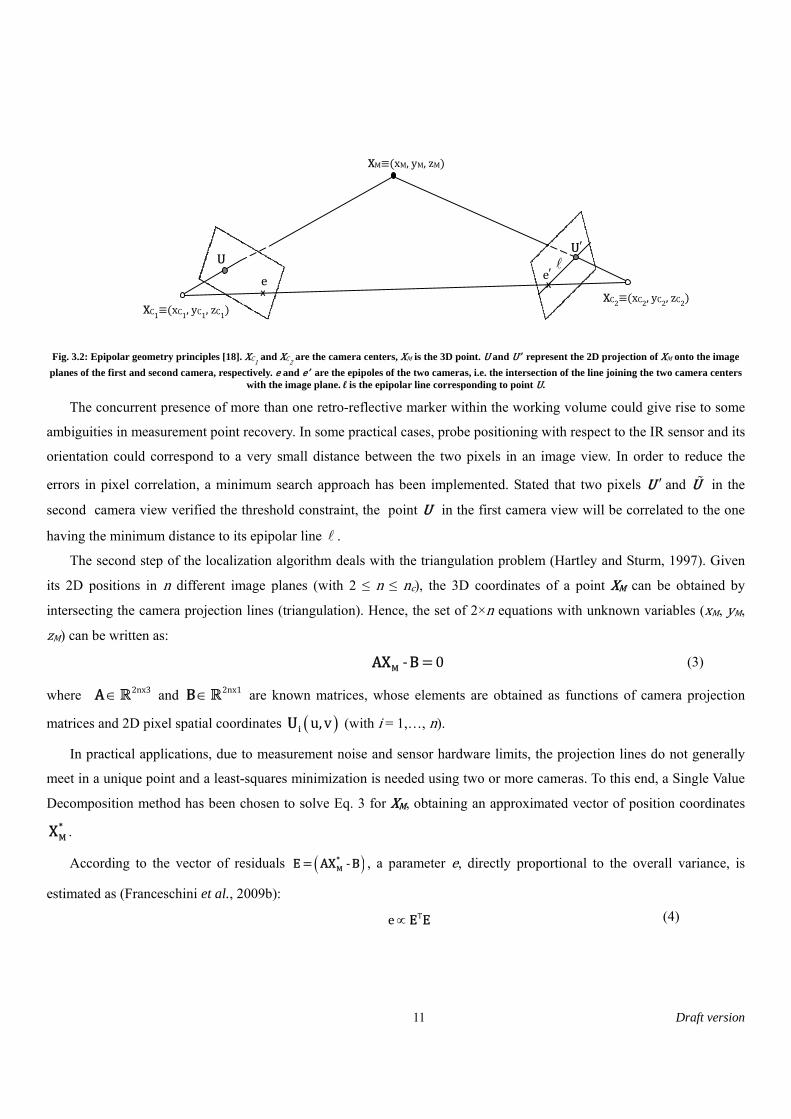
Fig. 3.2: Epipolar geometry principles [18]. XC1 and XC2 are the camera centers, XM is the 3D point. U and U’ represent the 2D projection of XM onto the image
planes of the first and second camera, respectively. e and e’ are the epipoles of the two cameras, i.e. the intersection of the line joining the two camera centers with the image plane. l is the epipolar line corresponding to point U.
The concurrent presence of more than one retro-reflective marker within the working volume could give rise to some
ambiguities in measurement point recovery. In some practical cases, probe positioning with respect to the IR sensor and its
orientation could correspond to a very small distance between the two pixels in an image view. In order to reduce the
errors in pixel correlation, a minimum search approach has been implemented. Stated that two pixels U and U in the
second camera view verified the threshold constraint, the point U in the first camera view will be correlated to the one
having the minimum distance to its epipolar line .
The second step of the localization algorithm deals with the triangulation problem (Hartley and Sturm, 1997). Given
its 2D positions in n different image planes (with 2 ≤ n ≤ nc), the 3D coordinates of a point XM can be obtained by
intersecting the camera projection lines (triangulation). Hence, the set of 2×n equations with unknown variables (xM, yM,
zM) can be written as:
‐ 0MAX B
where 2nx3A and 2nx1B are known matrices, whose elements are obtained as functions of camera projection
matrices and 2D pixel spatial coordinates u,viU (with i = 1,…, n).
In practical applications, due to measurement noise and sensor hardware limits, the projection lines do not generally
meet in a unique point and a least-squares minimization is needed using two or more cameras. To this end, a Single Value
Decomposition method has been chosen to solve Eq. 3 for XM, obtaining an approximated vector of position coordinates
*MX .
According to the vector of residuals ‐*ME AX B , a parameter e, directly proportional to the overall variance, is
estimated as (Franceschini et al., 2009b):
Te E E
XC1 xC1, yC1, zC1 XC2 xC2, yC2, zC2
XM xM, yM, zM
U U
X X e e
(3)
(4)
12 Draft version
This parameter is used as preliminary diagnostics in order to evaluate the correctness of 3D positioning. The estimated
coordinates * * *M M Mx ,y ,z*
MX of the measured point, if characterized by high variance values, are automatically discarded
according to a threshold method.
It has to be noted that, as they are based on the 2D image views of different cameras, the triangulation results are
strongly affected by camera synchronization issues. As a matter of fact, the 3D point reconstruction algorithm should use
the 2D position coordinates of the same point as seen by the different camera sensors at the same time instant
(synchronized camera sampling). Whenever a sequential sampling procedure is implemented, the higher is the number of
sensors the higher is the total acquisition delay and thus possible discrepancies among different image views. Whereas it
could represent a problem for tracking dynamic objects, sequential sampling has negligible influence on measurement
performance as data acquisition is made by keeping the probe in static conditions.
4. SYSTEM CALIBRATION
The multi-camera calibration problem is faced by using a fully automatic single-point self-calibration technique
(Svoboda et al., 2005; Calibration Toolbox, 2008). Differently from other existing calibration methods (Tsai, 1987; Zhang,
2000), the one herein applied does not require to position a 3D calibration object at known 3D coordinates and is able to
reconstruct internal parameters besides than positions and orientations of a camera set. Notwithstanding, this extremely
flexible, fast and easy to use technique requires a minimum of three cameras as the internal parameters are the same for all
cameras but they are completely unknown. The reference system alignment and scaling procedures are carried out by
positioning a calibrated artifact within the working volume. The reference system origin and orientation are thus fixed
according to the measurement task and/or the measured object.
According to the calibration procedure, a single reflective marker is randomly moved in several unknown positions
within the working volume and tracked by the IR camera sensors. Image acquisition and processing are managed by the
camera onboard hardware that directly provides pixel coordinates in the view plane. Modifications to the original
MATLAB calibration toolbox in (Calibration Toolbox, 2008) have been made to provide as input pixel coordinates instead
of pixel images. As a matter of fact the camera on-board tracking capabilities save the automatic spot detection procedure,
which is a computationally expensive operation. On the other hand, camera self-calibration as well as probe localization
are affected by the reliability of the embedded tracking engine, i.e. by its capabilities to correctly identify the bright spot
in the image and to calculate its position in the camera view.
Firstly, the calibration algorithm performs a two-step procedure for discarding outliers, either due to reflections in the
working environment or measurement errors of the tracking engine. False points are removed from the list of visible
points of the IR cameras according to an iterative pair-wise analysis and a 2D reprojection error-based strategy. As to the
former step, image pairs are iteratively selected according to the number of visible corresponding points. Point-to-point
correspondence is analyzed according to epipolar geometry constraints (Longuet-Higgins, 1981; Hartley and Zisserman,
2004) and applying a RANSAC-based technique (Fischler and Bolles, 1981) for discarding outliers. Survived points are
13 Draft version
further evaluated by projecting them back to the camera pairs and applying a threshold method based on 2D reprojection
errors for removing false ones. Then the calibration algorithm implements an iterative procedure that compute the
projective structure (i.e. the projection matrix and the cloud of reconstructed 3D points) until outliers are completely
removed and estimate a nonlinear distortion model of the camera lens until a stopping condition (either based on a user-
defined threshold or a maximum number of iterations) is reached. Finally, this procedure yields five internal camera
parameters (focal length, principal point coordinates, skew coefficient, radial and tangential distortion coefficients) and six
external camera parameters (3D position coordinates of the camera center and orientation angles of its optical axis). As the
external camera parameters are provided in an unknown reference frame, having the origin in the center of the cloud of
points, a further step for aligning and scaling the world coordinate system is needed. To this end, a laser cut aluminum
square (300×400 mm sized), measured to submillimeter accuracy by a CMM, is used as calibrated artifact (see Fig. 6.2-a).
5. PRELIMINARY TESTS
A set of preliminary tests has been carried out to investigate the performance of the overall system, including the
distributed sensor network, the hand-held measuring probe and the data processing system. It is noteworthy that the
experimental results are strongly related to the network configuration, in terms of number of IR cameras, positioning and
orientation. Data discussed hereafter have been obtained by using a set of six IR cameras, arranged in a working
environment similar to the one shown in Fig. 2.3. The resulting measurement volume was about 2.0×2.0×2.0 m wide. A
sampling frequency of 50 Hz has been used for data acquisition.
The system has been evaluated through stability, repeatability and reproducibility tests and characterized by a
preliminary estimation of the measurement accuracy.
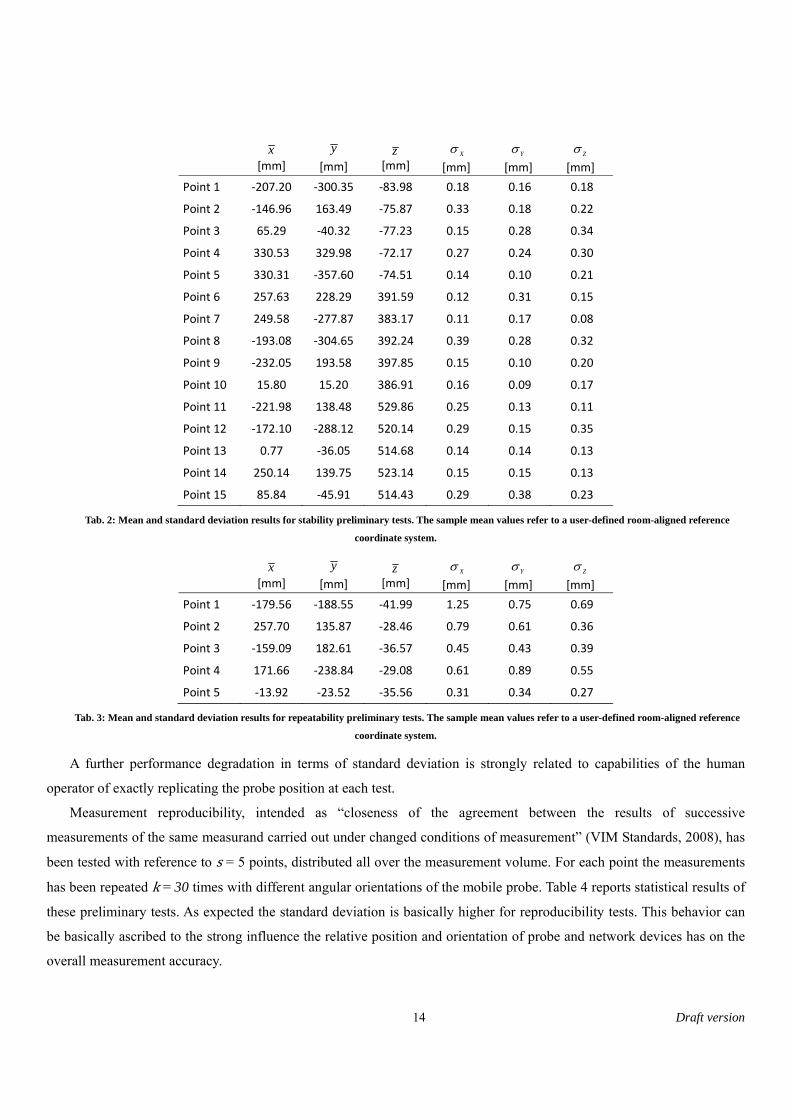
The system stability, i.e. the property of a measuring instrument, whereby its metrological properties remain constant
in time (VIM Standards, 2008), has been evaluated in s = 15 different positions, distributed all over the measurement
volume. For each position the mobile probe has been kept in a stationary condition, replicating the measurement k=30
times, over a span of time of approximately 300 s. Results, which are shown in Table 2, are reported in terms of sample
mean and standard deviation of the reconstructed 3D positions of the probe tip V, referring to a user-defined room-aligned
reference coordinate system. It is noteworthy that the experimental data are related to the IR system stability in measuring
a single point, as well as to the operator skills. As a matter of fact human skills represent an external factor, related to
capabilities in holding the probe in a fixed position during data acquisition.
Repeatability, i.e. “closeness of the agreement between the results of successive measurements of the same measurand
carried out under the same conditions of measurement” (VIM Standards, 2008), has been tested on s = 5 different points,
uniformly distributed within the measurement volume. The test has been carried out by repeating the measurement k = 30
times for each point, repositioning the probe in the same position for each measurement. Results of repeatability tests are
reported in Table 3, in terms of sample mean and standard deviation of the reconstructed 3D positions of the probe tip V.
14 Draft version
x [mm]
y
[mm] z
[mm] X
[mm] Y
[mm] Z
[mm]
Point 1 ‐207.20 ‐300.35 ‐83.98 0.18 0.16 0.18
Point 2 ‐146.96 163.49 ‐75.87 0.33 0.18 0.22
Point 3 65.29 ‐40.32 ‐77.23 0.15 0.28 0.34
Point 4 330.53 329.98 ‐72.17 0.27 0.24 0.30
Point 5 330.31 ‐357.60 ‐74.51 0.14 0.10 0.21
Point 6 257.63 228.29 391.59 0.12 0.31 0.15
Point 7 249.58 ‐277.87 383.17 0.11 0.17 0.08
Point 8 ‐193.08 ‐304.65 392.24 0.39 0.28 0.32
Point 9 ‐232.05 193.58 397.85 0.15 0.10 0.20
Point 10 15.80 15.20 386.91 0.16 0.09 0.17
Point 11 ‐221.98 138.48 529.86 0.25 0.13 0.11
Point 12 ‐172.10 ‐288.12 520.14 0.29 0.15 0.35
Point 13 0.77 ‐36.05 514.68 0.14 0.14 0.13
Point 14 250.14 139.75 523.14 0.15 0.15 0.13
Point 15 85.84 ‐45.91 514.43 0.29 0.38 0.23
Tab. 2: Mean and standard deviation results for stability preliminary tests. The sample mean values refer to a user-defined room-aligned reference
coordinate system.
x [mm]
y
[mm] z
[mm] X
[mm] Y
[mm] Z
[mm]
Point 1 ‐179.56 ‐188.55 ‐41.99 1.25 0.75 0.69
Point 2 257.70 135.87 ‐28.46 0.79 0.61 0.36
Point 3 ‐159.09 182.61 ‐36.57 0.45 0.43 0.39
Point 4 171.66 ‐238.84 ‐29.08 0.61 0.89 0.55
Point 5 ‐13.92 ‐23.52 ‐35.56 0.31 0.34 0.27
Tab. 3: Mean and standard deviation results for repeatability preliminary tests. The sample mean values refer to a user-defined room-aligned reference
coordinate system.
A further performance degradation in terms of standard deviation is strongly related to capabilities of the human
operator of exactly replicating the probe position at each test.
Measurement reproducibility, intended as “closeness of the agreement between the results of successive
measurements of the same measurand carried out under changed conditions of measurement” (VIM Standards, 2008), has
been tested with reference to s = 5 points, distributed all over the measurement volume. For each point the measurements
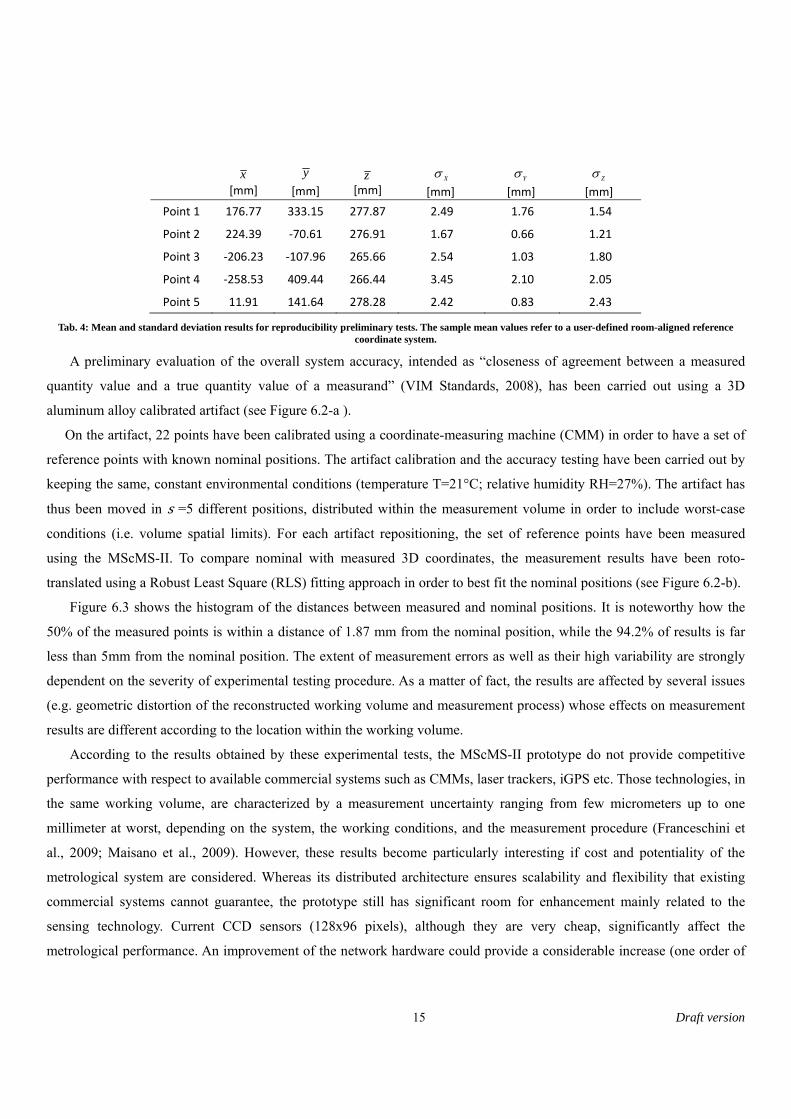
has been repeated k = 30 times with different angular orientations of the mobile probe. Table 4 reports statistical results of
these preliminary tests. As expected the standard deviation is basically higher for reproducibility tests. This behavior can
be basically ascribed to the strong influence the relative position and orientation of probe and network devices has on the
overall measurement accuracy.
15 Draft version
x [mm]
y [mm]
z [mm]
X
[mm] Y
[mm] Z
[mm]
Point 1 176.77 333.15 277.87 2.49 1.76 1.54
Point 2 224.39 ‐70.61 276.91 1.67 0.66 1.21
Point 3 ‐206.23 ‐107.96 265.66 2.54 1.03 1.80
Point 4 ‐258.53 409.44 266.44 3.45 2.10 2.05
Point 5 11.91 141.64 278.28 2.42 0.83 2.43
Tab. 4: Mean and standard deviation results for reproducibility preliminary tests. The sample mean values refer to a user-defined room-aligned reference coordinate system.
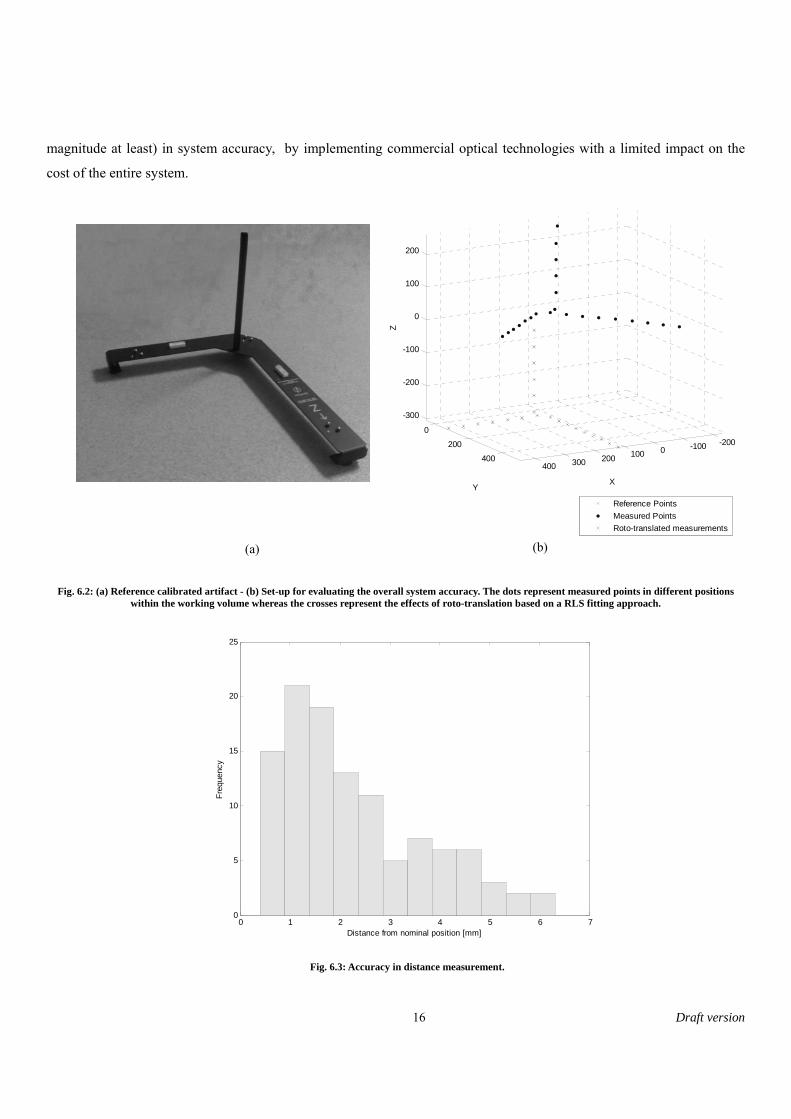
A preliminary evaluation of the overall system accuracy, intended as “closeness of agreement between a measured
quantity value and a true quantity value of a measurand” (VIM Standards, 2008), has been carried out using a 3D
aluminum alloy calibrated artifact (see Figure 6.2-a ).
On the artifact, 22 points have been calibrated using a coordinate-measuring machine (CMM) in order to have a set of
reference points with known nominal positions. The artifact calibration and the accuracy testing have been carried out by
keeping the same, constant environmental conditions (temperature T=21°C; relative humidity RH=27%). The artifact has
thus been moved in s =5 different positions, distributed within the measurement volume in order to include worst-case
conditions (i.e. volume spatial limits). For each artifact repositioning, the set of reference points have been measured
using the MScMS-II. To compare nominal with measured 3D coordinates, the measurement results have been roto-
translated using a Robust Least Square (RLS) fitting approach in order to best fit the nominal positions (see Figure 6.2-b).
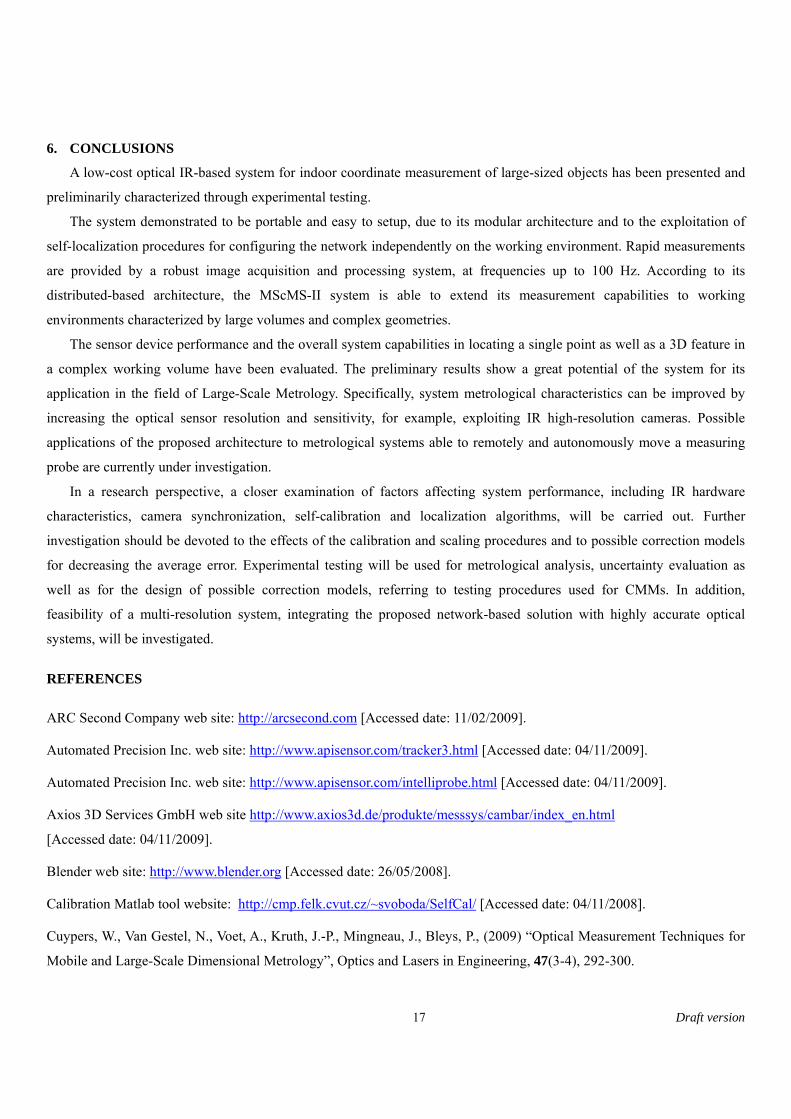
Figure 6.3 shows the histogram of the distances between measured and nominal positions. It is noteworthy how the
50% of the measured points is within a distance of 1.87 mm from the nominal position, while the 94.2% of results is far
less than 5mm from the nominal position. The extent of measurement errors as well as their high variability are strongly
dependent on the severity of experimental testing procedure. As a matter of fact, the results are affected by several issues
(e.g. geometric distortion of the reconstructed working volume and measurement process) whose effects on measurement
results are different according to the location within the working volume.
According to the results obtained by these experimental tests, the MScMS-II prototype do not provide competitive
performance with respect to available commercial systems such as CMMs, laser trackers, iGPS etc. Those technologies, in
the same working volume, are characterized by a measurement uncertainty ranging from few micrometers up to one
millimeter at worst, depending on the system, the working conditions, and the measurement procedure (Franceschini et
al., 2009; Maisano et al., 2009). However, these results become particularly interesting if cost and potentiality of the
metrological system are considered. Whereas its distributed architecture ensures scalability and flexibility that existing
commercial systems cannot guarantee, the prototype still has significant room for enhancement mainly related to the
sensing technology. Current CCD sensors (128x96 pixels), although they are very cheap, significantly affect the
metrological performance. An improvement of the network hardware could provide a considerable increase (one order of
16 Draft version
magnitude at least) in system accuracy, by implementing commercial optical technologies with a limited impact on the
cost of the entire system.
Fig. 6.2: (a) Reference calibrated artifact - (b) Set-up for evaluating the overall system accuracy. The dots represent measured points in different positions within the working volume whereas the crosses represent the effects of roto-translation based on a RLS fitting approach.
0 1 2 3 4 5 6 70
5
10
15
20
25
Distance from nominal position [mm]
Fre
quen
cy
Fig. 6.3: Accuracy in distance measurement.
-200-1000100200300400
0
200
400
-300
-200
-100
0
100
200
XY
Z
Reference Points
Measured Points
Roto-translated measurements
(b) (a)
17 Draft version
6. CONCLUSIONS
A low-cost optical IR-based system for indoor coordinate measurement of large-sized objects has been presented and
preliminarily characterized through experimental testing.
The system demonstrated to be portable and easy to setup, due to its modular architecture and to the exploitation of
self-localization procedures for configuring the network independently on the working environment. Rapid measurements
are provided by a robust image acquisition and processing system, at frequencies up to 100 Hz. According to its
distributed-based architecture, the MScMS-II system is able to extend its measurement capabilities to working
environments characterized by large volumes and complex geometries.
The sensor device performance and the overall system capabilities in locating a single point as well as a 3D feature in
a complex working volume have been evaluated. The preliminary results show a great potential of the system for its
application in the field of Large-Scale Metrology. Specifically, system metrological characteristics can be improved by
increasing the optical sensor resolution and sensitivity, for example, exploiting IR high-resolution cameras. Possible
applications of the proposed architecture to metrological systems able to remotely and autonomously move a measuring
probe are currently under investigation.
In a research perspective, a closer examination of factors affecting system performance, including IR hardware
characteristics, camera synchronization, self-calibration and localization algorithms, will be carried out. Further
investigation should be devoted to the effects of the calibration and scaling procedures and to possible correction models
for decreasing the average error. Experimental testing will be used for metrological analysis, uncertainty evaluation as
well as for the design of possible correction models, referring to testing procedures used for CMMs. In addition,
feasibility of a multi-resolution system, integrating the proposed network-based solution with highly accurate optical
systems, will be investigated.
REFERENCES
ARC Second Company web site: http://arcsecond.com [Accessed date: 11/02/2009].
Automated Precision Inc. web site: http://www.apisensor.com/tracker3.html [Accessed date: 04/11/2009].
Automated Precision Inc. web site: http://www.apisensor.com/intelliprobe.html [Accessed date: 04/11/2009].
Axios 3D Services GmbH web site http://www.axios3d.de/produkte/messsys/cambar/index_en.html
[Accessed date: 04/11/2009].
Blender web site: http://www.blender.org [Accessed date: 26/05/2008].
Calibration Matlab tool website: http://cmp.felk.cvut.cz/~svoboda/SelfCal/ [Accessed date: 04/11/2008].
Cuypers, W., Van Gestel, N., Voet, A., Kruth, J.-P., Mingneau, J., Bleys, P., (2009) “Optical Measurement Techniques for
Mobile and Large-Scale Dimensional Metrology”, Optics and Lasers in Engineering, 47(3-4), 292-300.
18 Draft version
Estler, W.T., Edmundson, K.L., Peggs, G.N., Parker, D.H., (2002) “Large-Scale Metrology - An Update”, Annals of CIRP,
51(2), 587-609.
Faro Technologies Inc. web site: http://www.faro.com/content.aspx?ct=di&content=pro&item=3
[Accessed date: 16/04/2009].
Fischler, M., Bolles, R. (1981) “Random Sample Consensus: A Paradigm for Model Fitting with Applications to Image
Analysis and Automated Cartography”, Communications of the ACM, 24(6), 381–395.
Franceschini, F., Maisano, D., Mastrogiacomo, L., (2009) “Mobile spatial coordinate measuring system (MScMS) and
CMMs: a structured comparison”, International Journal of Advanced Manufacturing Technology, 42(11-12), 1089-1102.
Franceschini, F., Galetto, M., Maisano, D., Mastrogiacomo, L., (2009a) “Mobile Spatial coordinate Measuring System
(MScMS) - Introduction to the System”, International Journal of Production Research, 47(14), 3867-3889.
Franceschini, F., Galetto, M., Maisano, D., Mastrogiacomo, L., (2009b) “On-line Diagnostics in the Mobile Spatial
coordinate Measuring System (MScMS)”, Precision Engineering, 33, 408-417.
Franceschini, F., Galetto, M., Maisano, D., Mastrogiacomo, L. (2009c) “A Review of Localization Algorithms for
Distributed Wireless Sensor Networks in Manufacturing”, International Journal of Computer Integrated Manufacturing,
Special Issue: Wireless Manufacturing, 22(7), 698-716.
Franceschini, F., Galetto, M., Maisano, D., Mastrogiacomo, L., (2008) “The Problem of Distributed Wireless Sensors
Positioning in the Mobile Spatial coordinate Measuring System (MScMS)”, Proceedings of the 9th ASME Engineering
Systems Design and Analysis Conference (ESDA2008), Haifa (Israel), July 07-09.
Galetto, M., Pralio, B., (2010) “Optimal Sensor Positioning for Large Scale Metrology Applications”, Precision
Engineering, 34(3), 563-577.
Galetto M., Mastrogiacomo L., Pralio B., Spagnolo, C., (2010b) “Indoor Environmental Mapping by Means of
Autonomous Guided Agents”, ASME 2010 10th Biennial Conference on Engineering System Design and Analysis
ESDA2010, Istanbul, Turkey, July, 12-14, 2010.
Hartley, R. I., Zisserman, A., (2004) “Multiple View Geometry in Computer Vision”, Cambridge University Press.
Hartley, R. I., Sturm, P., (1997) “Triangulation”, Journal of Computer Vision and Image Understanding, 68(2), 146-157.
Hopp, T.H., Levenson, M.S., (1995) “Performance Measures for Geometric Fitting in the NIST Algorithm Testing and
Evaluation Program for Coordinate Measurement Systems”, Journal of Research of the National Institute of Standards and
Technology, 100(5), 563-574.
How, J. P., Bethke, B., Frank, A., Dale, D., Vian. J., (2008) “Real-Time Indoor Autonomous Vehicle Test Environment”,
IEEE Control Systems Magazine, 28(2), 51-64.
19 Draft version
Leica Geosystems web site http://metrology.leica-geosystems.com/en/Products-Laser-Tracker-Systems_69045.htm
[Accessed date: 04/11/2009].
Leica Geosystems web site http://metrology.leica-geosystems.com/en/Products-Total-Stations-TPS_4207.htm
[Accessed date: 04/11/2009].
Longuet-Higgins, H. C., (1981) “A Computer Algorithm for Reconstructing a Scene from Two Projections”, Nature 293,
133-135.
Luhmann, T., (2009) “Precision Potential of Photogrammetric 6DOF pose estimation with a single camera”, ISPRS
Journal of Photogrammetry and Remote Sensing, 64, 275-284.
Maisano, D., Jamshidi, J., Franceschini, F., Maropoulos, P.G., Mastrogiacomo, L., Mileham, A.R., Owen G.W., (2009)
“Comparison of two distributed large volume measurement systems: MScMS and iGPS”, Proceedings of the Institution of
Mechanical Engineers. Part B. Journal of Engineering Manufacture, 223(5), 511-521.
Metronor Corporate web site: http://www.metronor.com [Accessed date: 10/06/2009].
Mikhail, E.M., Bethel, J.S., McGlone, J.C., (2001) “Introduction to Modern Photogrammetry”, Wiley.
Nikon Metrology web site: http://www.nikonmetrology.com/large_volume_tracking__positioning/igps [Accessed date:
25/02/2010].
Nikon Metrology web site: http://www.nikonmetrology.com/optical__cmm [Accessed date: 25/02/2010].
Northern Digital Inc. web site http://www.ndigital.com/industrial/products-pcmm.php [Accessed date: 04/11/2009].
Peggs, G. N., Maropoulos, P. G., Hughes, E. B., Forbes, A. B., Robson, S., Ziebart, M., Muralikrishnan, B., (2009) “Recent
developments in Large-Scale Dimensional Metrology”, Proceedings of the Institution of Mechanical Engineers, Part B,
Journal of Engineering Manufacture, 223(6), 571-595.
Pintaric, T., Kaufmann, H. (2007) “Affordable Infrared-Optical Pose Tracking for Virtual and Augmented Reality,”
Proceedings of IEEE VR Workshop on Trends and Issues in Tracking for Virtual Environments, 14-17 March 2007,
Charlotte, NC, Aachen: Shaker Verlag, 44-51.
Puttock, M.J., (1978) “Large-Scale Metrology”, Annals of CIRP, 27(1), 351-356.
Svoboda, T., Martinec, D., Pajdla, T., (2005) “A Convenient Multi-camera Self-calibration for Virtual Environments”,
PRESENCE: Teleoperators and Virtual Environments, 14(4), 407-422.
Tsai, R. Y., (1987) “A Versatile Camera Calibration Technique for High-Accuracy 3D Machine Vision Metrology Using
Off-The-Shelf Cameras and Lenses”, IEEE Journal of Robotics and Automation, 3(4), 323 – 344.

20 Draft version
VIM - International Vocabulary of Basic and General Terms in Metrology, International Organization for Standardization,
Geneva, Switzerland, 2004.
Zhang , Z., (2000) “A Flexible New Technique for Camera Calibration”, IEEE Transactions on Pattern Analysis and
Machine Intelligence, 22(11), 1330 – 1334.