A GIS Support System for Road Safety Analysis and...
13
Pertanika J. Sci. & Techno!. 6(1): 81 - 93 (1998) ISS : 0128-7702 © Universiti Pertanian Malaysia Press A GIS Support System for Road Safety Analysis and Management Ahmad Rodzi Mahmud, Radin Umar Radin Sohadi and Shattri Mansor Road Safety Research Centre Faculty of Engineering Universiti Putra Malaysia 43400 UPM Serdang, Selangor, Malaysia Received: 15 May 1998 ABSTRAK Dalam mengenalpasti punca kemalangan jalan raya, jurutera, perancang dan penentu polisi sering memerlukan maklumat terperinci untuk menentukan langkah rawatan cegah yang diperlukan. Selain dari analisis statistik, ia juga memerlukan maklumat geografi yang berkaitan. Kertas ini membincangkan sistem maklumat pakar yang sesuai. Kajian ini merangkumi daerah Majlis Perbandaran Seremban Negeri Sembilan dengan ketjasama Polis Di Raja Malaysia dan Majlis Keselamatan Jalan Raya Malaysia. ABSTRACT In diagnosing the cause traffic accidents, traffic engineers, planners and decision makers often need as much information as possible before deciding the appropriate countermeasure. In road safety analysis apart from producing the most accurate prediction from statistical figures, the need to visualize information geographically i always essential. This paper describes the implementation of SMKJ2, the method used to provide multiple ways of visualising accident data based on certain set of criteria, and the plan to incorporate multiple experts and knowledge base in to the system. The project, presently confined to the area of Seremban City Council of egeri Sembilan, has been carried out in collaboration with The Royal Malaysian Police and The Road Safety Council. Keywords: GIS, Road Safety INTRODUCTION Advances in information technology have brought with them a number of new information systems in Malaysia. One of the most popular systems is the Geographical Information System (GIS). Since the early nineties, a sizeable number of public and private agencies have started to use GIS in managing their information. Developments in local GIS applications have created a new avenue for managing traffic accident information in Malaysia. One of the pioneering GIS researches in traffic safety was a study on linking the flexible Microcomputer Accident Analysis Package (MAAP) data to a DOS version of the MAPI FO package (Ahmad et al. 1993). A study conducted by the Road Safety Research Centre, Faculty of Engineering, Universiti Putra Malay ia was aimed at encouraging GIS users in Malaysia to use the accident data that have been
Transcript of A GIS Support System for Road Safety Analysis and...
Pertanika J. Sci. & Techno!. 6(1): 81 - 93 (1998)ISS : 0128-7702
© Universiti Pertanian Malaysia Press
A GIS Support System for Road SafetyAnalysis and Management
Ahmad Rodzi Mahmud, Radin Umar Radin Sohadi and Shattri MansorRoad Safety Research Centre
Faculty of EngineeringUniversiti Putra Malaysia
43400 UPM Serdang, Selangor, Malaysia
Received: 15 May 1998
ABSTRAKDalam mengenalpasti punca kemalangan jalan raya, jurutera, perancang danpenentu polisi sering memerlukan maklumat terperinci untuk menentukanlangkah rawatan cegah yang diperlukan. Selain dari analisis statistik, ia jugamemerlukan maklumat geografi yang berkaitan. Kertas ini membincangkansistem maklumat pakar yang sesuai. Kajian ini merangkumi daerah MajlisPerbandaran Seremban Negeri Sembilan dengan ketjasama Polis Di RajaMalaysia dan Majlis Keselamatan Jalan Raya Malaysia.
ABSTRACTIn diagnosing the cause traffic accidents, traffic engineers, planners anddecision makers often need as much information as possible before decidingthe appropriate countermeasure. In road safety analysis apart from producingthe most accurate prediction from statistical figures, the need to visualizeinformation geographically i always essential. This paper describes theimplementation of SMKJ2, the method used to provide multiple ways ofvisualising accident data based on certain set of criteria, and the plan toincorporate multiple experts and knowledge base in to the system. The project,presently confined to the area of Seremban City Council of egeri Sembilan,has been carried out in collaboration with The Royal Malaysian Police and TheRoad Safety Council.
Keywords: GIS, Road Safety
INTRODUCTION
Advances in information technology have brought with them a number of newinformation systems in Malaysia. One of the most popular systems is theGeographical Information System (GIS). Since the early nineties, a sizeablenumber of public and private agencies have started to use GIS in managingtheir information.
Developments in local GIS applications have created a new avenue formanaging traffic accident information in Malaysia. One of the pioneering GISresearches in traffic safety was a study on linking the flexible MicrocomputerAccident Analysis Package (MAAP) data to a DOS version of the MAPI FOpackage (Ahmad et al. 1993). A study conducted by the Road Safety ResearchCentre, Faculty of Engineering, Universiti Putra Malay ia was aimed atencouraging GIS users in Malaysia to use the accident data that have been
Ahmad Rodzi Mahmud, Radin Umar Radin Sohadi and Shattri Mansor
compiled nationally in MAAP since 1992 (Radin Umar and Baguley 1994). Thisapproach was taken in view that (i) some geographical and spatial data hadalready been customized in their respective GIS systems and (ii) generalreluctance to change to types of information systems other than that alreadyused by the respective organizations.
With the increasing popularity of the Windows application in Malaysia inearly 1992, many software users had switched from the DOS version to theWindows application. Unfortunately, new routines need to be rewritten to copewith this trend. As a result, the ARC/INFO system was chosen as it offers morefeatures and can easily be linked to other department as the package is beingwidely used in Malaysia.
This paper presents some preliminary results on presenting andincorporating heterogeneous outlays for road safety analysis and management.The system was developed based on the ARC/INFO package and run on theUNIX environment. Accident data were extracted from the pilot project inSeremban (Radin Umar and Aminuddin 1992) and were used for demonstratingthe prototype version of the information system.
DEVELOPMENT OF ROAD ACCIDENT ANALYSISAND MANAGEMENT SYSTEM
The initial system was designed with the intention to display the various sets ofroad accident data in the form of a thematic map. Besides encouraging the GISusers to use the accident data compiled in MAAP, this research was also aimedat supplementing the output of the customized version of the MicrocomputerAccident Analysis Package (Radin Umar et at. 1993). Tools for the system havebeen designed to give the easiest displaying mode for the most frequent queryby the decision maker during the accident investigation processes. Outputs,either in the form of figures, diagrams, graphs or maps can be retrieved withouthaving to issue a long list of commands.
For visualising the detailed situation leading to an accident, a special toolwas created for processing and presenting the accident situation at a certainlocation within a specified period. This was achieved by (i) developing someanalytical routines, (ii) redesigning a special menu and (iii) integrating themas an integral component of the base system. For future development, aknowledge base information will be incorporated to produce an intelligentsystem. This will allow for an automatic judgement in the diagnosis andproposing of an engineering remedial treatment. This full system is in line withthe concept of a "true GIS" application system (Vrana 1989) which is capableof performing a variety of statistical analyses and overlay processing thatintegrate information on several spatially-distributed variables at once.
Source of Accident Data
This study was based primarily on a specially created accident form POL27(Pin1/91) collected by the Royal Malaysian Police (PDRM) in the pilot areas
82 PertanikaJ. Sci. & Technol. Vol. 6 No.1, 1998
A GIS Support System for Road Safety Analysis and Management
Seremban and Shah Alam (Radin mar and Arninuddin 1991,1992). The formwas designed for easier completion and is fully compatible with the TRL's(Transport Research Laboratory) accident analysis package MAAP (RadinUmar et aL 1993). The person filling in this form simply needs to circle therelevant value for each accident parameter, which has been convenientlyclassified into various sections. In a few cases where figures such as year or ageare required, the officers needs to fill up the relevant boxes. This informationis manually keyed in into MAAP using the programme option available inMAAP.
Classification of Textual Data
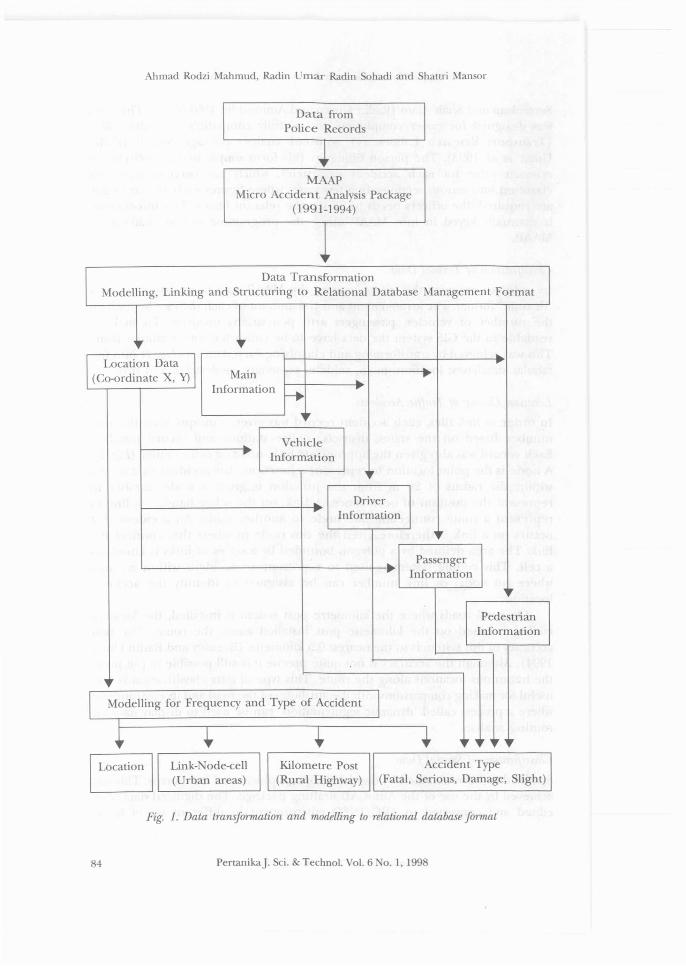
In order to optimize the storage space, the MAAP data were structured in a"flexible" format. The arrangement and the amount of each data set depend onthe number of vehicles, passengers and pedestrians involved. To make itreadable in the GIS system the data have to be converted into a tabular form.This was achieved by transforming and classifying each data set (Fig. 1) into fivetabular databases; location, main, vehicle, passenger, pedestrian and driver.
Location Coding of Traffic Accidents
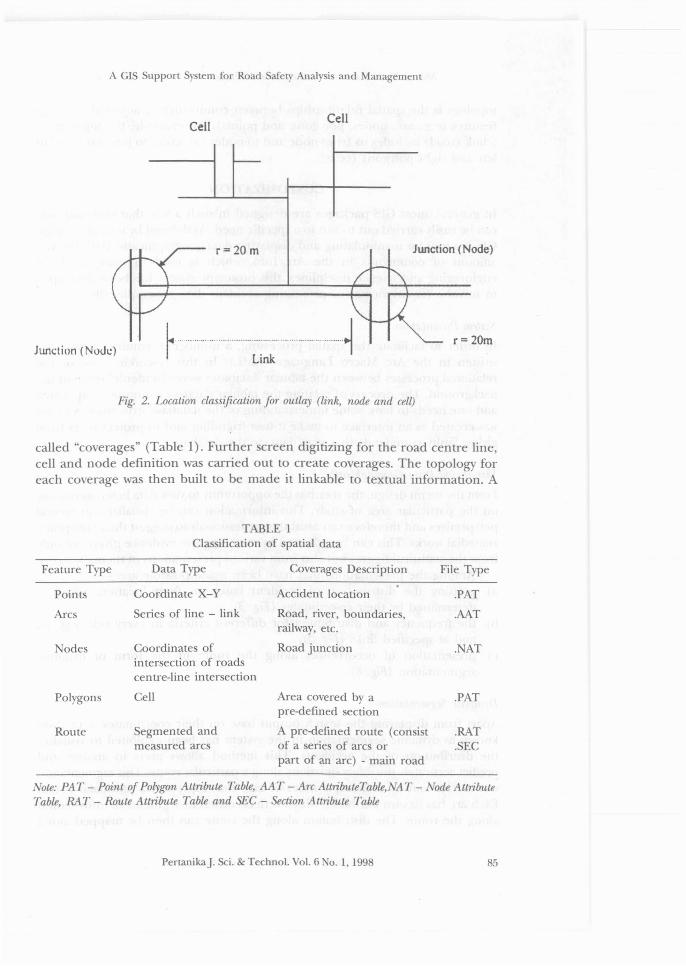
In order to link files, each accident record was given a unique identificationnumber based on the states, districts, police stations and record number.Each record was also given the appropriate link, node or cell number (Fig. 2).A node is the point location to represent a junction. Any accident that occurswithin the radius of 20 m from the junction is given a node number torepresent the position of occurrence. A link, on the other hand, is a line torepresent a route connecting one node to another node. An accident thatoccurs on a link is therefore given the two node numbers that connect thelink. The area defined by a polygon bounded by a series of links is known asa cell. This coding system is used to represent an accident within an areawhere no nodal or link number can be assigned to identify the accidentlocation.
On rural roads where the kilometre post system is installed, the locationcoding is based on the kilometre post installed along the route. The bestaccuracy of this system is to the nearest 0.5 kilometre (Baguley and Radin Umar1994). Although the accuracy is not quite precise it is still possible to pin pointthe hazardous locations along the route. This type of data classification is veryuseful for making comparisons with the attributes of the road and its environmentwhere a process called 'dynamic segmentation' can be used to display data forrouting analysis.
Classification of Spatial Data
Spatial data were obtained by digitizing topographical and road maps. This wasachieved by the use of the AutoCAD drafting package. The digitized data wereedited and converted to ARC/I FO environment in different set of layers
PertanikaJ. Sci. & Technol. Vol. 6 0.1,1998 83
Ahmad Rodzi Mahmud, Radin Vmar Radin Sohadi and Shaw-i Mansor
Data fromPolice Records
MAAPMicro Acciden t Analysis Package
(1991-1994)
Data TransformationModelling, Linking and Structuring to Relational Database Management Format
estrianrmation
.I Location Data I .(Co-ordinate X, Y) Main .. ...
Information r---.,Vehicle...
InformationI'
.. DriverInformation
,r
... Passenger
... Information
PedInfo
,
I Modelling for Frequency and Type of Accident I
• t t • " , ,I Location IL- --'
Kilometre Post(Rural Highway)
Accident Type(Fatal, Serious, Damage, Slight)
Fig. 1. Data transformation and modelling to relational database fonnat
84 PertanikaJ. Sci. & Technol. Vol. 6 0.1,1998
A GIS Support System for Road Safety Analysis and Management
Junction (Node)
Cell
r=20 m
Link
Cell
Junction (Node)
r=20m
Fig. 2. Location classification for outlay (link, node and cell)
called "coverages" (Table 1). Further screen digitizing for the road centre line,cell and node definition was carried out to create coverages. The topology foreach coverage was then built to be made it linkable to textual information. A
TABLE 1Classification of spatial data
Feature Type Data Type Coverages Description File Type
Points Coordinate X-Y Accident location .PAT
Arcs Series of line - link Road, river, boundaries, .AATrailway, etc.
Nodes Coordinates of Road junction .NATintersection of roadscentre-line intersection
Polygons Cell Area covered by a .PATpre-defined section
Route Segmented and A pre-defined route (consist .RATmeasured arcs of a series of arcs or .SEC
part of an arc) - main road
Note: PAT - Point of Polygon Attribute Table, AAT - Arc AttributeTable,NAT - Node AttributeTable, RAT - Route Attribute Table and SEC - Section Attribute Table
PertanikaJ. Sci. & Technol. Vol. 6 o. 1, 1998 85
Ahmad Rodzi Mahmud, Radin Umar Radin Sohadi and Shatu-i Mansor
topology is the spatial relationships between connecting or adjacent coveragefeatures (e.g., arc, nodes, polygons, and points). For example, the topology ofa link (road) includes its from-node and to-nodes Uunction to junction) and itsleft and right polygons (cells).
CUSTOMIZATION
In general, most GIS packages are designed in such a way that customizationcan be easily carried out to suit to a specific need. As defined by its terminology,GIS is a tool for manipulating and displaying data geographically. With the vastamount of commands in the Arc/Info, which is used in many fields ofengineering and science disciplines, this prototype system has been developedto suit the requirements for presenting accident data geographically. .
System Presentation
In order to facilitate the spatial processing, a number of routines have beenwritten in the Arc Macro Language (AML). In this research, most of therelational processes between the tabular databases were "hiddenly" done in thebackground. The process of relating the tabular databases is quite complicatedand one needs to have some understanding of the database structures. A menuwas created as an interface to make it user-friendlier and to protect users fromgiving faulty commands that may damage the database.
Visualising Data Geographically
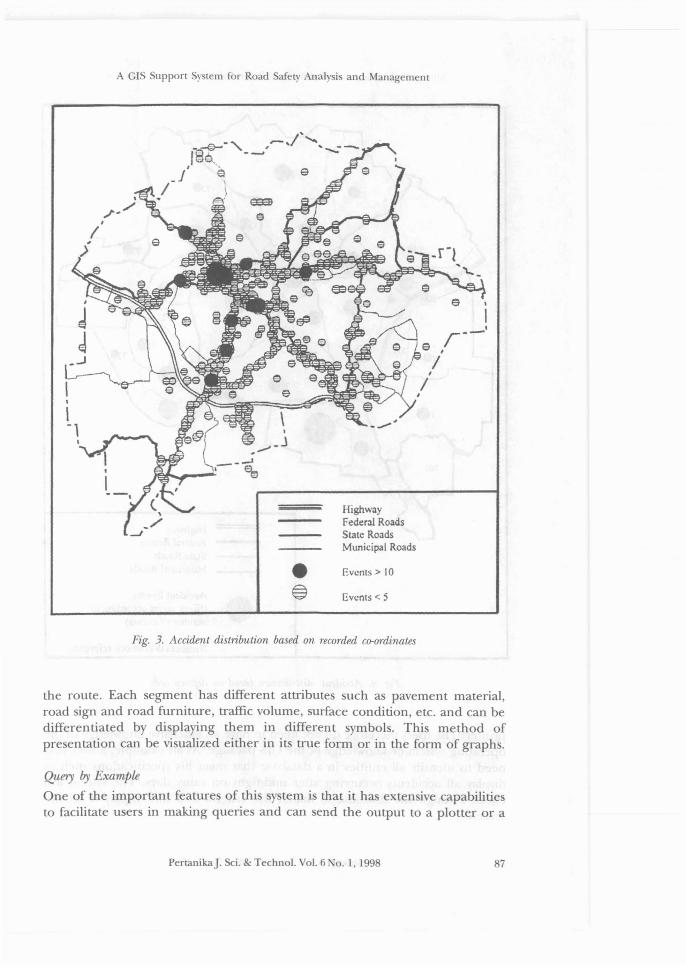
From the menu design, the user has the opportunity to view data heterogeneouslyon the particular area of study. This information can be visualized in severalperspectives and therefore can assist the professionals to suggest the appropriateremedial works. This can be achieved by analysing the evidence given not onlyfrom the statistical figures but also from various presentations of thematic maps.
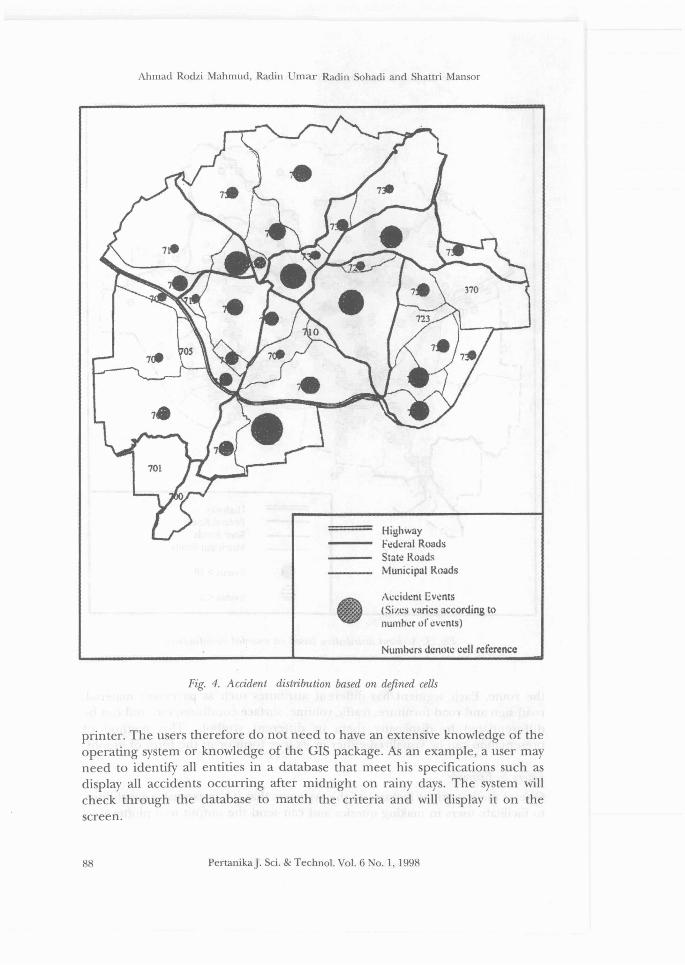
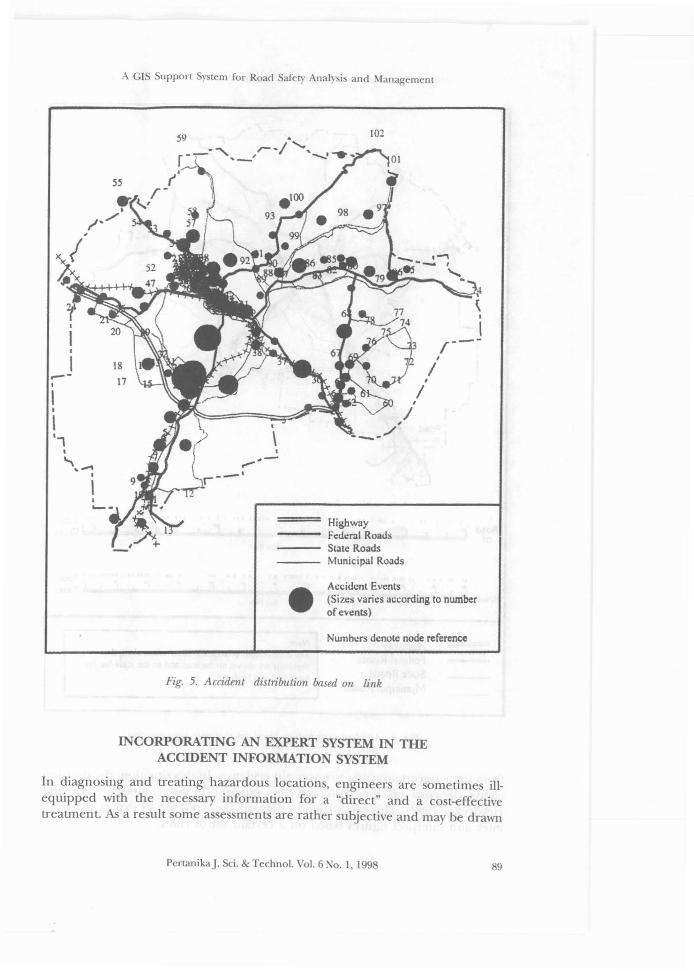
Among the presentations that have been made possible are: -a) plotting the distribution of accident bases on their location, which is
determined by their co-ordinates (Fig. 3),b) the frequency and distribution for different criteria in every cell (Fig. <f),
and at specified links (Fig. 5);c) presentation of occurrences along the route in the form of dynamic
segmentation (Fig. 6).
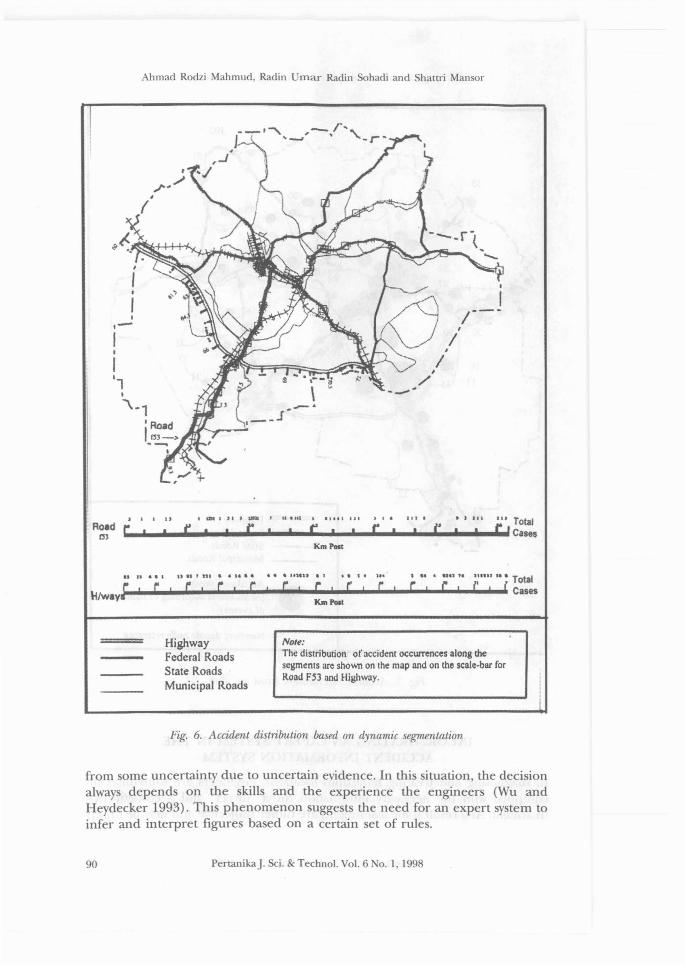
Dynamic Segmentation
Apart from displaying the search output base on their coordinates, a methodknown as dynamic segmentation in the system has been exploited to visualizethe distribution of the accidents. This method allows users to analyse andpredict accurately the safety situations along a particular route. This segmentationwas carried out by defining a series of arcs that represent a particular route.Each arc has its own attributes, which reflects different segments of informationalong the route. The distribution along the route can then be mapped along
86 PenanikaJ. Sci. & Technol. Vol. 6 0.1,1998
A GIS Support System for Road Safety Analysis and Management
•~
HighwayFederal RoadsState RoadsMunicipal Roads
Events> 10
Events < 5
•IIr--
e ,/,
/
Fig. 3. Accident distribution based on recorded co-ordinates
the route. Each segment has different attributes such as pavement material,road sign and road furniture, traffic volume, surface condition, etc. and can bedifferentiated by displaying them in different symbols. This method ofpresentation can be visualized either in its true form or in the form of graphs.
Query lJy Example
One of the important features of this system is that it has extensive capabilitiesto facilitate users in making queries and can send the output to a plotter or a
PertanikaJ. Sci. & Technol. Vol. 6 No. I, 1998 87
Ahmad Rodzi Mahmud, Radin Umar Radin Sohadi and Shattri Mansor
Highwayr.:d.:ral RoadsState RoadsMunicipal Roads
Accident Events(Sizes varies according tonumher or events)
Numh.:rs denote eell reference
Fig. 4. Accident distribution based on defined cells
printer. The users therefore do not need to have an extensive knowledge of theoperating system or knowledge of the GIS package. As an example, a user mayneed to identify all entities in a database that meet his specifications such asdisplay all accidents occurring after midnight on rainy days. The system willcheck through the database to match the criteria and will display it on thescreen.
88 PertanikaJ. Sci. & Techno!. Vo!. 6 No. I, 1998
A GIS Support System for Road Safety Analysis and Management
102
Highway--- Federal Roads--- State Roads
Municipal Roads
Accident Events(Sizes varies according to numberof events)
Nwnbcrs denote node reference
Fig. 5. Accident distribution based on link
INCORPORATING AN EXPERT SYSTEM IN THEACCIDENT INFORMATION SYSTEM
In diagnosing and treating hazardous locations, engineers are sometimes illequipped with the necessary information for a "direct" and a cost-effectivetreatment. As a result some assessments are rather subjective and may be drawn
PertanikaJ. Sci. & Technol. Vol. 6 No.1, 1998 89
Ahmad Rodzi Mahmud, Radin Umar Radin Sohadi and Shattri Mansor
I
I•II,-
II
I"
I
"'\.,I Road1133->---.
•
I/---
I
/I
/I
/--"
111M."'''' , U.U: • J ill II) TotalROldr i' i" t' r i' 1",0) .. .._ _ _ - _ """" __ _ Cases
KmPou
...tI... " •• " .,.
cU."IU ......
C , C , C c, c c c1 ......, u
C ! r , ,u,n ••• TotalC , { Cases
HighwayFederal RoadsState RoadsMunicipal Roads
Note:The distribution. of accident occurrences along thesegments are shown on the map and on the scale-bar forRoad FS3 and Highway.
Fig. 6. Accident distribution based on dynamic segmentation
from some uncertainty due to uncertain evidence. In this situation, the decisionalways depends on the skills and the experience the engineers (Wu andHeydecker 1993). This phenomenon suggests the need for an expert system toinfer and interpret figures based on a certain set of rules.
90 PertanikaJ. Sci. & Technol. Vol. 6 0.1,1998
A GIS Support System for Road Safety Analysis and Management
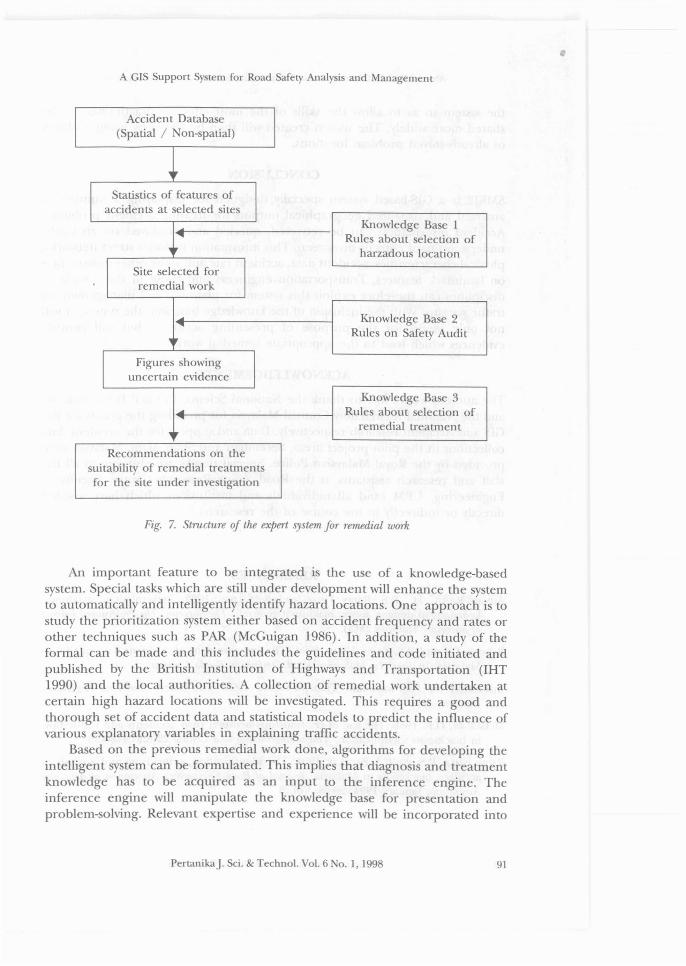
Accident Database(Spatial / on-spatial)
Statistics of features ofaccidents at selected sites
+~Knowledge Base 1
Rules about selection ofharzadous location
Site selected forremedial work
... Knowledge Base 2....Rules on Safety Audit
~,
Figures showinguncertain evidence
Knowledge Base 3.... Rules about selection of~
remedial treatment
Recommendations on thesuitability of remedial treatmentsfor the site under investigation
Fig. 7. Structure of the expert system for remedial work
An important feature to be integrated is the use of a knowledge-basedsystem. Special tasks which are still under development will enhance the systemto automatically and intelligently identify hazard locations. One approach is tostudy the prioritization system either based on accident frequency and rates orother techniques such as PAR (McGuigan 1986). In addition, a study of theformal can be made and this includes the guidelines and code initiated andpublished by the British Institution of Highways and Transportation (IHT1990) and the local authorities. A collection of remedial work undertaken atcertain high hazard locations will be investigated. This requires a good andthorough set of accident data and statistical models to predict the influence ofvarious explanatory variables in explaining traffic accidents.
Based on the previous remedial work done, algorithms for developing theintelligent system can be formulated. This implies that diagnosis and treatmentknowledge has to be acquired as an input to the inference engine. Theinference engine will manipulate the knowledge base for presentation andproblem-solving. Relevant expertise and experience will be incorporated into
•
PertanikaJ. Sci. & Techno!. Vo!. 6 No.1, 1998 91
•Ahmad Rodzi Mahmud, Radin Umat- Radin Sohadi and Shattri Mansor
the system so as to allow the skills of the most effective practitioners to beshared more widely. The system created will then be tested by using a libraryof already-solved problem locations.
CONCLUSION
SMKJ2 is a GIS-based system specially designed for displaying a number ofanalysed and visualized geographical outputs for treating accident problems.Accident information can be retrieved, queried and displayed on an easilyunderstood hard copy or on screen. This information includes street networks,physical characteristics, accident data, accident rate and some other informationon landmark features. Transportation engineers and those in the associateddisciplines can therefore exploit this system for planning and management oftraffic systems. With the inclusion of the knowledge base into the system, it willnot only useful for the purpose of presenting accidents but will provideevidences which lead to the appropriate remedial works.
ACKNOWLEDGEMENTS
The authors would like to thank the National Science Council IRPA Malaysiaand the National Road Safety Council Malaysia for providing the grants for theGIS and Accident research respectively. Data and support for the accident datacollections in the pilot project areas, Seremban and Shah Alam, Malaysia wereprovided by the Royal Malaysian Police. Special thanks are also due to all thestaff and research assistants at the Road Safety Research Centre, Faculty ofEngineering, UPM (and all individuals and institutions which have assisteddirectly or indirectly in the course of the research).
REFERENCES
AHMAD RODZI, M., R.S. RADIN UMAR and S. SALIHA. 1993. Persembahan maklumatkemalangan dengan sistem maklumat geografi. The Surveyor, The ProfessionalJournalof Surveyors Malaysia 28(3):
BAGULEY CJ and R.S, RADIN UMAR. 1994. The improvement of accident data quality inMalaysia. In Proc. 1st Malaysian Road Conference, Kuala Lumpur.
Institution for Highways and Transportation. 1990. The Safety Audit of Highways.London: IHT.
MCGUIGAN, D.R. 1986. The use of relationships between road accidents and traffic flowin blackspots identification. Traffic Engineering and Control 22(8,9):448-453
RADIN UMAR, R.S AND CJ. BAGULEY. 1994. The identification, prioritising and analysis ofaccident blackspots in Malaysia. Joumal of Road Engineering Association of Asia andAustralasia January 1994: 20-28. Vol. 3
92 PertanikaJ. Sci. & Techno!. Vo!. 6 No.1, 1998

A GIS Support System for Road Safety Analysis and Management
RADIN UMAR, R.S., M. AHMAD RODZI AJ'JD A. A.MINUDDIN. 1993. Model diagnosis dan rawatankemalangan jalan raya di Malaysia. Pertanika J. Sci & Technol. 1: 125-151.
RADIN UMAR, R.S. A:'1D A. A.\lI:--iUDDI:'I. 1991. Sistem diagnosis kemalangan jalanraya. InSeminar Tahunan ke 32, Majlis KeselamatanJalan Raya Malaysia, Kuching, Malaysia.
RADI:'I UMAR, R.S. MID A. A.MI:'lUDDIN. 1992. Sistem Diagnosis Kemalangan Jalanraya,Laporan Penyelidikan No 1, Majlis Keselamatan Jalanraya, KementerianPengangkutan Malaysia.
VRA.'JA, R. 1989. Historical data as an explicit component of land information systems.Int. Journal Geographic Information System 3(1): 33-49.
Wu, J. and BJ. HE\DECKER. 1993. A knowledge-based system for road accident remedialwork. Computing Systems in Engineering 4(2-3): 337-348.
PertanikaJ. Sci. & Techno!. Vo!. 6 No.1, 1998 93