2547 ISBN 974-17-6866-4 for ThaiScience... · 2007. 11. 4. · HYDRODEALKYLATION (HDA) PROCESS Mr....
167
การออกแบบโครงสรางควบคุมสําหรับกระบวนการไฮโดรดีอัลคีลเลชันที่พลังงานเบ็ดเสร็จ นาย จักรพงษ ไทยเจริญ วิทยานิพนธนี้เปนสวนหนึ่งของการศึกษาตามหลักสูตรปริญญาวิศวกรรมศาสตรมหาบัณฑิต สาขาวิชาวิศวกรรมเคมี ภาควิชาวิศวกรรมเคมี คณะวิศวกรรมศาสตร จุฬาลงกรณมหาวิทยาลัย ปการศึกษา 2547 ISBN 974-17-6866-4 ลิขสิทธิ์ของจุฬาลงกรณมหาวิทยาลัย
Transcript of 2547 ISBN 974-17-6866-4 for ThaiScience... · 2007. 11. 4. · HYDRODEALKYLATION (HDA) PROCESS Mr....

การออกแบบโครงสรางควบคุมสําหรับกระบวนการไฮโดรดีอัลคีลเลชันที่พลังงานเบด็เสร็จ
นาย จกัรพงษ ไทยเจริญ
วิทยานพินธนี้เปนสวนหนึ่งของการศึกษาตามหลักสูตรปริญญาวิศวกรรมศาสตรมหาบัณฑิต สาขาวิชาวิศวกรรมเคมี ภาควิชาวิศวกรรมเคม ี คณะวิศวกรรมศาสตร จุฬาลงกรณมหาวทิยาลัย
ปการศึกษา 2547 ISBN 974-17-6866-4
ลิขสิทธิ์ของจุฬาลงกรณมหาวิทยาลัย

DESIGN OF CONTROL STRUCTURE FOR ENERGY-INTEGRATED
HYDRODEALKYLATION (HDA) PROCESS
Mr. Chakkraphong Thaicharoen
A Thesis Submitted in Partial Fulfillment of the Requirements
for the Degree of Master of Engineering in Chemical Engineering
Department of Chemical Engineering
Faculty of Engineering
Chulalongkorn University
Academic Year 2004
ISBN 974-17-6866-4

Thesis Title DESIGN OF CONTROL STRUCTURE FOR ENERGY-
INTEGRATED HYDRODEALKYLATION (HDA)
PROCESS By Mr. Chakkraphong Thaicharoen Field of Study Chemical Engineering
Thesis Advisor Montree Wongsri, D.Sc.
Accepted by the Faculty of Engineering, Chulalongkorn Univesity in
Partial Fulfillment of the Requirements for the Master’s Degree
…………………………………… Dean of the Faculty of Engineering
(Professor Direk Lavansiri, Ph.D.)
THESIS COMMITTEE
…………………………………… Chairman
(Professor Piyasan Praserthdam, Dr.Ing.)
…………………………………… Thesis Advisor
(Montree Wongsri, D.Sc.)
…………………………………… Member
(Suphot Phatanasri, D.Eng.)
…………………………………… Member
(Amornchai Arpornwichanop, D.Eng.)

iv
จักรพงษ ไทยเจริญ : การออกแบบโครงสรางควบคุมสําหรับกระบวนการไฮโดรดีอัลคีลเลชันที่พลังงานเบ็ดเสร็จ. (DESIGN OF CONTROL STRUCTURE FOR ENERGY-
INTEGRATED HYDRODEALKYLATION (HDA) PROCESS) อ. ที่ปรึกษา: อ. ดร. มนตรี วงศศรี, 152หนา. ISBN 974-17-6866-4.
การออกแบบโครงสรางควบคุมแบบแพลนทไวด สําหรับกระบวนการทางเคมีที่มีสารปอนกลับและพลังงานเบ็ดเสร็จเปนสิ่งที่สําคัญอยางมากในการบรรลุเปาหมายของการออกแบบกระบวนการ งานวิจัยนี้นําเสนอโครงสรางการควบคุมแบบใหมสําหรับกระบวนการไฮโดรดิแอลคิลเลชันโทลูอีนที่พลังงานเบ็ดเสร็จแบบที่3 5โครงสรางควบคุมไดถูกออกแบบ ทดสอบ และเปรียบเทียบสมรรถนะกับโครงสรางอางอิงของลูเบน (โครงสรางที่1) ผลการจําลองแสดงวากระบวนการไฮโดรดิแอลคิลเลชันโทลูอีนที่พลังงานเบ็ดเสร็จสามารถลดคาใชจายดานพลังงานและยังสามารถดําเนินกระบวนการไดอยางปกติโดยการใชกลยุทธของแพลนทไวดเพื่อออกแบบโครงสรางการควบคุม ซ่ึงโครงสรางการควบคุมที่ออกแบบนี้ใหผลการตอบสนองทางพลวัตรไดใกลเคียงกับโครงสรางการควบคุมอางอิง โครงสรางการควบคุมที่2 มีขอจํากัดเนื่องจากการใชบายพาสทําใหสามารถรองรับตอส่ิงรบกวนระบบไดไมสูง โครงสรางการควบคุมที่3 พัฒนาโครงสรางการควบคุมที่2เพื่อใหสามารถรองรับสิ่งรบกวนระบบไดมากขึ้นโดยการใชหนวยใหความรอนแทนการใชบายพาสในการควบคุมอุณหภูมิหอเสถียร โครงสรางการควบคุมที่4 ใหผลตอบสนองของลูฟควบคุมอุณหภูมิในหอปอนกลับตอส่ิงรบกวนไดดีกวาโครงสรางทั้ง 3 เนื่องจากใชพลังงานหมอตมซ้ําในการควบคุมอุณหภูมิซ่ึงมีประสิทธิภาพการตอควบคุมไดดีกวาการปรับอัตราไหลของสารที่ออกจากกนหอ โครงสรางการควบคุมที่5 มีขอดีในการกําหนดอัตราการผลิต ซ่ึงสามารถกําหนดการผลิตขั้นปลายไดโดยตรง โครงสรางการควบคุมที่6 สามารถทําใหกระบวนการประหยัดพลังงานมากกวาโครงสรางอางอิง และสามารถรองรับสิง่รบกวนระบบไดมากกวาโครงสรางการควบคุมที่2
ภาควิชา วศิวกรรมเคม ี ลายมือช่ือนิสิต......................................................... สาขาวิชา วศิวกรรมเคมี ลายมือช่ืออาจารยที่ปรึกษา........................................ ปการศึกษา 2547

v
# # 4670251321 : MAJOR CHEMICAL ENGINEERING
KEY WORD: HDA / PLANTWIDE / CONTROL STRUCTURE DESIGN / HEAT
INTEGRATED PROCESS / CONTROL
CHAKKRAPHONG THAICHAROEN: DESIGN OF CONTROL STRUCTURE
FOR ENERGY-INTEGRATED HYDRODEALKYLATION (HDA) PROCESS.
THESIS ADVISOR: MONTREE WONGSRI, D.Sc., 152 pp. ISBN 974-17-
6866-4.
Design of plantwide control structures for an entire chemical plant consisting of
recycle streams and energy integration is very important in order to achieve its design
objectives. This work presents the new control structures for the hydrodealkylation of
toluene (HDA) process with energy integration schemes alternative 3. Five control
structures have been designed, tested and compared the performance with Luyben’s
structure (CS1). The result shows that hydrodealkylation of toluene process with heat
integration can reduce energy cost. Furthermore, this process can be operated well by
using plantwide methodology to design the control structure. The dynamic responses of
the designed control structures and the reference structure are similar. The CS2 has been
limited in bypass, so it is able to handle in small disturbance. CS3 has been designed to
improve CS2 in order to handle more disturbances by using auxiliary heater instead of
bypass valve to control temperature of stabilizer column. The recycle column
temperature control response of the CS4 is faster than that of the previous control
structures, because reboiler duty of column can control the column temperature more
effective than bottom flow. CS5 on-demand structure has an advantage when
downstream customer desires immediate responses in the availability of the product
stream from this process. The energy used in CS6 control structure is less than CS1 and
CS4. Because, this control structure has been modified from CS2 and CS4 to optimize
the energy cost.
Department Chemical Engineering Student’s signature................................ Field of study Chemical Engineering Advisor’s signature.................................. Academic year 2004
vi
ACKNOWLEDGEMENTS
The author would like to tanks and express his sincere gratitude to Dr.
Montree Wongsri, thesis advisor, for his valuable suggestions, encouraging guidance
and genius supervision throughout his master program. He is grateful to Professor
Piyasan Praserthdam, chairman of thesis committee, Dr. Supoj Patthanasri and Dr.
Amornchai Arpornwichanop members of thesis committees for many valuable
suggestions.
Many thanks to process control laboratory members, Yulius Deddy
Hermawan, friends, and all those who encouraged over the years of his study.
Most of all, he would like to express the highest gratitude to his mother, and
all of family for their love, inspiration, encouragement and financial support
throughout this study.

CONTENTS
page ABSTRACT (IN THAI)…................................................................................... iv ABSTRACT (IN ENGLISH)............................................................................... v ACKNOWLEDGEMENTS................................................................................. vi CONTENTS.......................................................................................................... vii LIST OF TABLES................................................................................................ x LIST OF FIGURES.............................................................................................. xi NOMENCLATURE............................................................................................. xv CHAPTER
I. INTRODUCTION……………………………………………….………….... 1 1.1 Importance and Reasons for Research………………………............ 1
1.2 Research Objectives………………………………............................. 2
1.3 Scope of Research………………………………………………........... 2
1.4 Contribution of Research………………………………………........... 2
1.5 Procedure Plan……………………………………………………......... 3
II. LITERATURE REVIEW……………………………………………………. 5
2.1 Plantwide Control……………………………………………............... 5
2.2 Control Structure Design………………………………………........... 7
2.3 Heat Integrated Process…………………………............................... 12
III. THEORY……………………………………………………………………… 15
3.1 Integrated Process………………………………………………........... 15
3.1.1 Material recycles……………………………………….............. 15
3.1.2 Energy integration……………………………………………… 17
3.1.3 Chemical component inventories……………….................... 17
3.2 Effects of Recycle………………………………………...................... 18
3.2.1 Snowball effect………………………………........................... 18

viii
page CHAPTER
3.3 Plantwide Control Design Procedures………………………............ 18
3.3.1 Basic Concepts of Plantwide Control………………............. 19
3.3.2 Step of Plantwide Process Control Design Procedure….. 22
3.4 Control Issues for Distillation Column……………………………… 26
3.4.1 Typical Control Schemes of Distillation Column…............ 26
3.4.2 Heat-Integrated Distillation Columns……….………............ 31
3.4.3 Plantwide control issues for distillation column….............. 33
3.5 Heat Exchanger and Energy Management………………............... 34
3.5.1 Heat recovery…………………………………………….......... 34
3.5.2 Control of utility exchangers…………………………............. 34
3.5.3 Control of process-to-process exchanger……………........... 35
3.6 Process Control…………………………………………………............ 38
3.6.1 Cascade Control…………………………………………........... 38
3.6.2 Valve Position Control…………………………………........... 39
IV. HYDRODEALKYLATION PROCESS……………………………........ 42
4.1 Process Description……………………………………….................... 42
4.2 Control Structure Design Consideration………………................... 44
4.3 Steady-State Modeling……………………………………….............. 45
4.4 Plantwide control design procedure…………………………............ 48
4.5 Control Structure Alternatives………………………………….......... 65
4.5.1 Comparison dynamic responses between this work with reference…………………………………………………..................... 65
4.5.2 Reference control structure (CS1) ……………………........... 67
4.5.3 Design Control Structure I (CS2) ……………………............ 71
4.5.4 Design Control Structure II (CS3) ………………….............. 74
4.5.5 Design Control Structure III (CS4) ………………................ 77
4.5.6 Design Control Structure IV (CS5) …………………............ 80
ix
page
CHAPTER
4.5.7 Design Control Structure V (CS6) …………………............. 84
V. CONCLUSIONS AND RECOMMENDATIONS…………………........ 91
5.1 Conclusion………………………........………………………………… 91
5.2 Recommendations………………………………………………........... 92
REFERENCES………………………………………………………………........ 93
APPENDICES……………………………………………………........…………. 98
Appendix A………………………………………………............................ 99
Appendix B…………………………………………………….........………. 109
Appendix C……………………………………………………….........……. 115
Appendix D……………………………………………………….........……. 133
VITA……………………………………………………………………….......….. 152

x
LIST OF TABLES
page Table 4.1 TAC and Utilities Usage of HEN Alternatives of the HDA…... 44
Table 4.2 Component Material Balance…...…...…...…...…...…...…...…. 52
Table 4.3a Integral absolute error of the five control structures when
decrease total toluene flowrate…...…...…...…...…...…...…...... 87
Table 4.3b Integral absolute error of the five control structures when
increase total toluene flowrate…...…...…...…...…...….............. 88
Table 4.3c Integral absolute error of the six control structures when
increase reactor inlet temperature…...…...…...…...…...…........ 89
Table 4.3d Integral absolute error of the six control structures when
decrease reactor inlet temperature…...…...…...…...…...…........ 89
Table 4.4 The energy consumption of the six control structures…...…..... 90
Table A.1 Data of HDA process (alt. 1) for simulation…...…...…............. 99
Table A.2 Data of HDA process (alt. 3) for simulation…...…...…............. 102
Table A.3 Column specifications…...…...…...…...…...…...…...…............ 107
Table A.4 Equipment data…...…...…...…...…...…...…...…...…...……..... 107
Table B.1 Parameter tuning of HDA process (reference, CS1) …...…....... 112
Table B.2 Parameter tuning of HDA process (CS2-6) …...…...…...…....... 113
Table C.1 Integral absolute error of the six plantwide control structures… 132
Table C.2 Dynamic responses of CS6 original and modify CS6 to 5 oF
decrease in reactor inlet temperature at time equal 10 minutes.. 132
Table D.1 IAE of design control structures when decrease total toluene
flowrate. …...…...…...……...…...…...……...…...…...………... 149
Table D.2 IAE of design control structures when decrease reactor inlet
temperature. …...…...…...……...…...…...……...…...…...……. 150

xi
LIST OF FIGURES
page Figure 3.1 Integrated Process flowsheet……………………………………. 15
Figure 3.2 Common control structures for distillation column…………….. 28
Figure 3.3 Common types of columns and controls………………………... 30
Figure 3.4 Control of P/P heat exchangers…………………………………. 35
Figure 3.5 Bypass control of process-to-process heat exchangers…………. 36
Figure 3.6 Cascade control in distillation-column-reboiler………………… 38
Figure 3.7 Use of VPC to minimize energy cost…………………………… 40
Figure 4.1 Hydrodealkylation HDA of toluene process (alternative 1)……. 43
Figure 4.2 HDA process –alternative 3…………………………………….. 44
Figure 4.3 The simulated HDA process (alt.1) at steady-state by HYSYS… 46
Figure 4.4 The simulated HDA process (alt.3) at steady-state by HYSYS... 47
Figure 4.5 Reference control structure (CS1) of HDA process……..……… 53
Figure 4.6 Designed control structure (CS2) of HDA process………….….. 54
Figure 4.7 Enlarged designed control structure (CS2) of HDA process….... 55
Figure 4.8 Designed control structure (CS3) of HDA process……………... 57
Figure 4.9 Enlarged designed control structure (CS3) of HDA process…... 58
Figure 4.10 Designed control structure (CS4) of HDA process……………. 59
Figure 4.11 Enlarged designed control structure (CS4) of HDA process…... 60
Figure 4.12 Designed control structure (CS5) of HDA process…………….. 61
Figure 4.13 Enlarged designed control structure (CS5) of HDA process…... 62
Figure 4.14 Designed control structure (CS6) of HDA process…………….. 63
Figure 4.15 Enlarged designed control structure (CS6) of HDA process…... 64
Figure 4.16 Comparison dynamic responses of step change
in total toluene flowrate………………………………………… 65
Figure 4.17 Comparison dynamic responses of step change in reactor inlet
temperature setpoint…………………………………………….. 66
Figure 4.18 Dynamic response of increase 10 oF in reactor inlet temperature
of CS1…………………………………………………………... 68

xii
page Figure 4.19 Dynamic response of decrease 15 % in total toluene flowrate of
CS1……………………………………………………………… 69
Figure 4.20 Dynamic response of increase 5 oF in reactor inlet temperature
of CS2…………………………………………………………... 72
Figure 4.21 Dynamic response of decrease 10 % in total toluene flowrate of
CS2……………………………………………………………… 73
Figure 4.22 Dynamic response of increase 10 oF in reactor inlet temperature
of CS3…………………………………………………………... 75
Figure 4.23 Dynamic response of decrease 15 % in total toluene flowrate of
CS3……………………………………………………………… 76
Figure 4.24 Dynamic response of increase 10 oF in reactor inlet temperature
of CS4………………………………………………………...… 78
Figure 4.25 Dynamic response of decrease 15 % in total toluene flowrate of
CS4……………………………………………………………… 79
Figure 4.26 Dynamic response of increase 10 oF in reactor inlet temperature
of CS5………………………………………………………...… 81
Figure 4.27 Dynamic response of decrease 25 % in column3 distillate flow
of CS5………………………………………………………...… 82
Figure 4.28 Dynamic response of increase 10 oF in reactor inlet temperature
of CS6……………………………………………………...…… 84
Figure 4.29 Dynamic response of decrease 15 % in total toluene flowrate of
CS6……………………………………………………………… 85
Figure C.1 Dynamic responses of CS1 to 10 oF increase in reactor inlet
temperature……………………………………………………… 115
Figure C.2 Dynamic responses of CS1 to 5 oF decrease in reactor inlet
temperature……………………………………………………… 115
Figure C.3 Dynamic responses of CS2 to 5 oF increase in reactor inlet
temperature……………………………………………………… 116
Figure C.4 Dynamic responses of CS2 to 5 oF decrease in reactor inlet
temperature……………………………………………………… 117
Figure C.5 Dynamic responses of CS3 to 10 oF increase in reactor inlet
temperature……………………………………………………… 118

xiii
page Figure C.6 Dynamic responses of CS3 to 5 oF decrease in reactor inlet
temperature……………………………………………………… 118
Figure C.7 Dynamic responses of CS4 to 10 oF increase in reactor inlet
temperature……………………………………………………… 119
Figure C.8 Dynamic responses of CS4 to 5 oF decrease in reactor inlet
temperature……………………………………………………… 120
Figure C.9 Dynamic responses of CS5 to 10 oF increase in reactor inlet
temperature……………………………………………………… 120
Figure C.10 Dynamic responses of CS5 to 5 oF decrease in reactor inlet
temperature……………………………………………………… 121
Figure C.11 Dynamic responses of CS6 to 10 oF increase in reactor inlet
temperature……………………………………………………… 122
Figure C.12 Dynamic responses of CS6 to 5 oF decrease in reactor inlet
temperature……………………………………………………… 122
Figure C.13 Dynamic responses of CS1 to 15 % increase in total toluene
flowrate…………………………………………………………. 123
Figure C.14 Dynamic responses of CS1 to 15 % decrease in total toluene
flowrate…………………………………………………………. 124
Figure C.15 Dynamic responses of CS2 to 10 % increase in total toluene
flowrate…………………………………………………………. 124
Figure C.16 Dynamic responses of CS2 to 10 % decrease in total toluene
flowrate…………………………………………………………. 125
Figure C.17 Dynamic responses of CS3 to 15 % increase in total toluene
flowrate…………………………………………………………. 126
Figure C.18 Dynamic responses of CS3 to 15 % decrease in total toluene
flowrate…………………………………………………………. 126
Figure C.19 Dynamic responses of CS4 to 15 % increase in total toluene
flowrate…………………………………………………………. 127
Figure C.20 Dynamic responses of CS4 to 15 % decrease in total toluene
flowrate…………………………………………………………. 128
Figure C.21 Dynamic responses of CS6 to 15 % increase in total toluene
flowrate…………………………………………………………. 128
xiv
page Figure C.22 Dynamic responses of CS6 to 15 % decrease in total toluene
flowrate…………………………………………………………. 129
Figure C.23 Dynamic responses of CS6 to 25 % increase in production
flowrate…………………………………………….…………… 130
Figure C.24 Dynamic responses of CS6 to 25 % decrease in production
flowrate………………………………………………….……… 130
Figure C.25 Dynamic responses of CS6 to 10 oF decrease in reactor inlet
temperature……………………………………………………… 131
Figure D.1 First control scheme of Kietawarin (S1)………………………... 133
Figure D.2 Second control scheme of Kietawarin (S2)……………………... 133
Figure D.3 Third control scheme of Kietawarin (S3)………………………. 134
Figure D.4 Dynamic responses of CS1 with S1 to step test………………… 134
Figure D.5 Dynamic responses of CS1 with S2 to step test………………… 135
Figure D.6 Dynamic responses of CS1 with S3 to step test………………… 136

xv
NOMENCLATURES r1 reaction rate of hydrodealkylation of toluene reaction
r1 reaction rate of side reaction of hydrodealkylation of toluene reaction
pT the partial pressure of toluene, psia
pH the partial pressure of hydrogen, psia
pB the partial pressure of benzene, psia
pD the partial pressure of diphenyl, psia
VR reactor volume
T temperature
P pressure
CS1 reference control structure
CS2 design control structure I
CS3 design control structure II
CS4 design control structure III
CS5 design control structure IV
CS6 design control structure V
CHAPTER I
INTRODUCTION
This chapter introduces the importance and reasons for research, research
objectives, scope of research, procedure and method, expected result, and the research
contents.
1.1 Importance and reasons for research
One of the most common, important, and challenging control tasks
confronting chemical engineer is: How do we design the control loops and system
needed to run our processes? Typically processes in many industrials have a
complicated process flowsheet containing several recycle streams, energy integration,
and many different unit operation.
In an industrial environment, a plant’s control strategy should be simple
enough, so that everyone from the operator to the plant manager can understand how
it works. The more complex the process, the more desirable it is to have a simple
control strategy. This view differs radically from much of current academic thinking
about process control, which suggests that a complex process demands complex
control. Plantwide process control involves the system and strategies required to
control an entire chemical plant consisting of many interconnected unit operations.
Most industrial processes contain a complex flowsheet with several recycle
streams, energy integration, and many different unit operations. The economic can be
improved by introducing recycle streams and energy integration into the process.
However, the recycle streams and energy integration introduce a feedback of material
and energy among units upstream and downstream. Therefore, strategies for
plantwide control are required to operate an entire plant safely and achieve its design
objectives. Hydrodealkylation (HDA) process of toluene to benzene consists of a
reactor, furnace, vapor-liquid separator, recycle compressor, heat exchangers and

2
distillations. This plant is a realistically complex chemical process. It is considering
that the energy integration for realistic and large processes is meaningful and useful, it
is essential to design a control strategy for process associate with energy integration,
so it can be operated well. So the main objective of this study is to use plantwide
control strategies to develop the new control structures for the HDA process with
energy integration schemes that are designed by Terrill and Douglas (i.e. alternative 1
and 3). In this work, the commercial software HYSYS is chosen to carry out both
steady state and dynamic simulations.
1.2 Research objectives
1. To design control structures for energy-integrated hydrodealkylation (HDA)
process.
2. To assess performance of the designed control structures.
1.3 Scope of research
1. Simulation of the hydrodealkylation (HDA) of toluene process is performed by
using a commercial process simulator –HYSYS.
2. Description and data of hydrodealkylation (HDA) of toluene process is obtained
from Douglas, J. M. (1988), William L. Luyben, Bjorn D. Tyreus, and Michael L.
Luyben (1998), and William L. Luyben (2002). And the energy integrated
hydrodealkylation (HDA) process is obtained from Terrill and Douglas 1987
(alternative 3) or Ploypaisansang A. (2004).
3. The design control structures are design using Luyben’s method.
1.4 Contribution of Research
New control structures of the HDA process with heat integration of alternative
3 (Terrill and Douglas 1987)

3
1.5 Procedure Plan
1. Steady state modeling and simulation of HDA process with heat integration
(alternative3).
2. Dynamic modeling and simulation.
3. Design of control structures of the HDA process.
4. Simulation of the HDA process with control structures design.
5. Assessment of the performance of the control structure.
6. Analysis of the design and simulation results.
7. Conclusion of the thesis.
This thesis is divided into five chapters.
Chapter I is an introduction to this research. This chapter consists of research
objective, scope of research, contribution of research, and procedure plan.
Chapter II reviews the work carried out on plantwide control, Control
Structure Design and heat integrated processes.
Chapter III covers some background information of plantwide and theory
concerning with plantwide control fundamentals, plantwide control design procedure,
and control structure evaluation.
Chapter IV describes the designed control structures and dynamic simulation
results and compares with control structures of Luyben.

4
Chapter V presents the conclusion of this research and makes the
recommendations for future work.
This is follow by:
References
Appendix A: HDA Process Stream and Equipment Data
Appendix B: Parameter Tuning of Control Structures
Appendix C: Dynamic Responses Graph

CHAPTER II
LITERATURE REVIEW
2.1 Plantwide Control
Plantwide control involved the systems and strategies required to control an
entire chemical plant. Downs and Vogel (1993) described a model of an industrial
chemical process for the purpose of developing, studying and evaluating process
control technology. It consisted of a reactor/separator/recycle arrangement involving
two simultaneous gas-liquid exothermic reactions. This process was well suited for a
wide variety of studies including both plant-wide control and multivariable control
problems.
Price, Lyman and Georgakis' (1994) presented a fundamental characteristic of
a well-designed process plant regulatory control system was effective management of
the rate of product manufacture and regulation of the inventories within the plant.
They proposed guidelines for the development of production rate and inventory
controls. The structures resulted satisfy the control objectives and maintained the
plantwide characteristics of the problem. The applicability of these guidelines was
illustrated using the complex test problem provided by the Tennessee Eastman
Company.
Yi and Luyben (1995) presented a method that was aimed at helping to solve
this problem by providing a preliminary screening of candidate plant-wide control
structures in order to eliminate some poor structures. Only steady-state information
was required. Equation-based algebraic equation solvers were used to find the steady-
state changes that occur in all manipulated variables for a candidate control structure
when load changes occur. Each control structure fixed certain variables: flows,
compositions, temperatures, etc. The number of these fixed variables was equal to the
number of degrees of freedom of the closed-loop system. If the candidate control
structure required large changes in manipulated variables, the control structure was a

6
poor one because valve saturation and/or equipment overloading will occur. The
effectiveness of the remaining structures was demonstrated by dynamic simulation.
Some control structures were found to have multiple steady states and produce closed-
loop instability.
Luyben and Tyreus (1997) constructed nine steps of the proposed procedure
center around the fundamental principles of plantwide control: energy management;
production rate; product quality; operational, environmental and safety constrain;
liquid-level and gas-pressure inventories; makeup of reactants; component balances;
and economic or process optimization. Application of the procedure was illustrated
with three industrial examples: the vinyl acetate monomer process, the Eastman
plantwide control process, and the HDA process.
McAvoy (1999) presented an approach to synthesizing plantwide control
architectures that made use of steady-state models and optimization. The optimization
problem solved was a mixed-integer linear programming (MILP) problem that aimed
at minimizing the absolute value of valve movements when a disturbance occurs.
Results were presented for its application to the Tennessee Eastman process.
Wang and McAvoy (2001) discussed an optimization-based approach to
synthesizing plantwide control architectures. The plantwide controller was
synthesized in three stages involving fast and slow safety variables to be controlled,
followed by product variables. In each stage a mixed integer linear program was
solved to generate candidate architectures. The objective function involved a tradeoff
between manipulated variable moves and transient response area. Controlling
component balances and adding unit operation controls completed the plantwide
control system design. The Tennessee Eastman process was used to illustrate the
synthesis procedure.
Vasbinder and Hoo (2003) presented plantwide method based on a modified
version of the decision-making methodology of the analytic hierarchical process
(AHP). The decomposition utilized a series of steps to select among a set of
competing modules. The control structure for each of the individual modules was
developed using Luyben’s nine steps approach. The decomposition served to make
7
the plantwide control problem tractable by reducing the size of the problem, while the
AHP guarantees consistency. The modular decomposition approach was applied to
the dimethyl ether (DME) process, and the results were compared to a traditional
plantwide design approach. Both methods produced the same control structure that
was shown to be adequate for the process. Satisfactory disturbance rejection was
demonstrated on the integrated flowsheet.
Skogestad (2004) interested in control structure design deals with the
structural decisions of the control system, including what to control and how to pair
the variables to form control loops. He presented a systematic procedure for control
structure design for complete chemical plants (plantwide control). It started with
carefully defining the operational and economic objectives, and the degrees of
freedom available to fulfill them. Other issues, discussed in the paper, include
inventory and production rate control, decentralized versus multivariable control, loss
in performance by bottom-up design, and a definition of a the ‘‘complexity number’’
for the control system.
2.2 Control Structure Design
For control structure design Luyben et al. (1995) presented two workable
control structures for a system with a reactor, two distillation columns, and two
recycle streams. The reaction A +B → C occurred in a reactor, the two distillation
columns recycled components A and B back to the reactor process. One fixed the
flow rates of the two recycle streams and brought in makeup fresh feeds of
components A and B on level control. The other control structure fixed the reactor
effluent flow rate, controlled the composition of one reactant in the reactor by
manipulating one fresh feed, and brought in the other fresh feed on reactor level
control. These two structures have the undesirable feature of not being able to set
directly the production rate and, in the second structure, requiring a reactor
composition measurement, which can be difficult due to the hostile environment and
can require expensive instrument maintenance. After that in 1996 they modified
control structure for this process by designed control structures in which one fresh
feed is fixed and no reactor composition is measured. Their results show that these

8
control structures can work if modifications are made. By changing in reactor holdup
and recycle flow rates away from their values in the economically optimal design
improve the ability of this control strategy to handle large disturbances.
Luyben (2000) studied process which had exothermic, irreversible, gas phase
reaction A + B → C occurring in an adiabatic tubular reactor. A gas recycle returned
unconverted reactants from the separation section. Four alternative plantwide control
structures for achieving reactor exit temperature control were explored. 1 the set point
of the reactor inlet temperature controller was changed (CS1), 2 the recycle flow rate
was changed, 3 the flow rate of one of the reactant fresh feeds was changed (CS3) and
4 used an “on-demand” structure. Manipulation of inlet reactor temperature appeared
to be the last attractive scheme. Manipulation of recycle flow rate gave the best
control but may be undesirable in some system because of compressor limitations.
The on demand structure provided effective control in the face of feed composition
disturbances. And in the same year he considered the design and control aspects of a
ternary system with the gas phase reversible, exothermic reaction A + B ↔ C
occurring in an adiabatic tubular reactor packed with solid catalyst. He designed
different control structure by fresh feed control pressure. The inlet reactor temperature
is fixed. The recycle flowrate is used to indirectly set the production rate (CS1).
Pressure was controlled by recycle flowrate and the production rate was directly set
by the fresh feed flowrate (CS2). Given a control structure where the recycle flowrate
was fixed (CS3). If process had inerts, the additional control loop added is the control
of composition of the inert component in recycle and purge gas. Effective control was
obtained in the face of quite large disturbances.
Geroenendijk et al. (2000) proposed a systematic approach that involves the
combination of steady state and dynamic simulations. Several controllability measures
(relative gain array, singular value decomposition, closed loop disturbance gain, etc.)
are employed to develop the final control structure and to assess its performance. The
systems approach is illustrated with a vinyl chloride monomer (VCM) plant.
Shinnar et al. (2000) introduced the concept of partial control, the
identification of a dominant subset of variables to be controlled such that, by

9
controlling only these variables, a stabilizing affects on the entire system results. The
methodology to find the dominant partial control set relies predominantly on process
experience. The approach was demonstrated on a fluid catalytic cracker unit, not on
an entire plant.
Reyes and Luyben (2001) studied adiabatic tubular reactor systems with liquid
recycles and distillation column used in the separation section. Irreversible and
reversible reaction cases have been explored. Both steady-state economics and
dynamic controllability have been considered in the design. For the numerical case
studied, which is typical of many real chemical system, the liquid recycle system is
more expensive because of the high cost of the distillation column and the need to
vaporize the recycle. The liquid recycle process is also more difficult to control
because the large holdup in the recycle loop produces slow composition changes. For
irreversible reactions, the activation energy is shown to slightly affect the steady-state
design but to drastically impact the dynamic controllability. Steady state economic
designs are shown to very difficult to control because of the severe temperature
sensitivity with high activation energies. Changes in the design conditions and
changes in the control structure can be used to produce a more easily controlled
process. For reversible reactions, the steady-state design is more difficult because of
the additional degrees of freedom, but the dynamic controllability is much better
because of the inherent self-regulation of exothermic reversible reactions as they
encounter chemical equilibrium constraints.
Costin S. Bildea (2002) analyzed the non linear behavior of several recycle
systems involving first-and second-order reaction. The result, presented in term of
dimensionless number, explain some control difficulties. It is shown that conventional
control structure, fixing the flow rate of fresh reactants and relying on self-regulation,
can lead to parametric sensitivity, unfeasibility, state multiplicity, or instability,
particularly at low conversions. These problems can be solved by fixing the flowrate
in the recycle loop, as stated by Luyben’s rule. They was demonstrated that a
particular location for fixing the recycle flow rate is advantageous, i.e. the reactor
inlet. This decouples the reactor from the rest of the plant and avoids undesired
phenomena due to mass recycles. For example, the unstable closed-loop behavior

10
observed with non-isothermal PFRs disappears. The HDA plant case study illustrates
the proposed strategy.
Design a process control structure for complex process was a complicate task.
The designed control loop would affect the operation significantly. Poothanakul
(2002) used plantwide control strategies for designed control structures of butane
isomerization process to achieved impurity of normal butane in product and desired
production rate. First control structure controlled quality of product by fix product
flow, second control structure concerned about reduction of effected of recycle by
controlled temperature inside the distillation which could be controlled by adjusted
distillate rate of column. And the last wanted to reduce effect of recycle indirectly by
controlled temperature inside the distillation with outlet flow of bottom.
Kietawarin (2002) designed 3 control structures for reduced effect from
disturbances that caused production rate change. The first control scheme measured
toluene flow rate in the process and adjusted the fresh toluene feed rate accordingly.
The second was modified from the first scheme by added a cooling unit to controlled
the outlet temperature from the reactor. In the third scheme, a ratio was introduced to
the second control scheme for controlling the ratio of hydrogen and toluene within the
process. These three control structures was compared with reference on plantwide
process control book, Luyben (1999), the result was performance of these structure
higher than reference.
Larsson, Govatsmark, Skogestead (2003) considered control structure
selection for a simple plant with a liquid phase reactor, a distillation column, and
recycle of unreacted reactants. To optimized economics, they needed to control active
constraints. For the cased of both minimizing operating costs (case1) and maximizing
production rate (case2), it was optimal to keep the reactor holdup at its maximum. For
the unconstrained variable, they looked for self-optimizing variables where constant
setpoints gave acceptable economic loss. To avoid the snowball effect, it had been
proposed to fix a flow in a liquid recycle loop. But it had a limit because it could
handle only small feed-rate changes or result in large variations in the reactor holdup.

11
In process which there are three reactions producing components M, D, and T
in Kapilakarn and Luyben L (2003). research. Both steady-state design and dynamic
control are explored for this three product process, which features one reactor, four
distillation columns, and two recycle streams. Several conventional control structures
are studied in which the flow rates of the fresh feed streams are fixed or manipulated
by level or composition/temperature controllers and the production rates are not
directly set. An alternative “on-demand” control structure for “agile” manufacturing is
also developed in which all three product streams are flow-controlled. The control
system adjusts the conditions in the plant and the fresh feed streams to achieve the set
product flow rates. The ratio of the fresh feeds is adjusted to give the desired
production rates of M and T, and the recycles of D and T are adjusted to give the
desired production rate of D.
Qiu, Rangaiah and Krishnaswamy (2003) presented a rigorous model for the
hydrodealkylation of toluene (HDA) process was developed using the commercial
software, HYSYS.PLANT. After reviewing the reported methods for plantwide
control, a systematic method, namely, Control Configuration Design (CCD) method,
was selected for application to the HDA process. The resulting control structures from
the application of this method were evaluated and compared through rigorous
dynamic simulation. The results show that the CCD method successfully yields
workable base-level regulatory control structures for the HDA process.
Tangsombutvisit (2003) developed rigorous model for the hydrodealkylation
of toluene (HDA) process by using the commercial software, HYSYS.PLANT.
Steady-state and dynamic simulations are combined with controllability analysis
tools, both stead-state and in the frequency domain, which extracts more value from
simulation than the usual sensitivity studies. The case of HDA process, the two
control structures designed by Kietawarin (2002) are considered. The steady-state
analysis is confirmed that the second control structure should be used. For using the
controllability analysis it appeared that the problems mainly came from the interaction
between the different units in the flowsheet. Controllability analysis described the
control structure2 could give the result into satisfied bound. That means the effect of
changing setpoint is less than the first one. However, results shown the reference

12
structure and the control structure1 can reject the disturbance better than the second
one.
Kasemchainun (2003) applied plantwide control strategy for designing control
structures of a Vinyl Acetate Monomer plant. Three alternative plantwide control
structures was designed, tested and compared the performance with Luyben’s
structure (1999). For the result, the first control structure used the fresh acetic fed to
manipulated the total acetic feed in vaporizer and controlled the water composition in
overhead column. In the azeotrope column was high boilup ratio so the second
designed control structure modified from the first in column temperature loop. This
scheme measured the tray temperature and adjusted the bottom flowrate to control the
vinyl acetate composition and the level was controlled by changing the reboiler heat
input. The last structure; when the reactant comes from upstream unit, the production
rate was set by changing the fresh ethylene feed. Results shown that all of control
structures achieved a good controllability.
Distillation columns which large temperature differences between the
condenser and reboiler; the base temperature of this type of column was often quite
high. It required the use of expensive high-pressure steam. Luyben L (2004) presented
method to reduce energy costs by using two reboilers. One at the base of the column
used high-pressure steam. A second was at an intermediate tray in the stripping
section. His paper compared the steady-state design and the dynamic control of a
conventional single-reboiler distillation column with a column having both
intermediate and base reboilers. Result shown consumption of high-pressure heat
could be reduced, and the column diameter was also reduced. The economic effect is
a reduction in both energy and capital costs. Dynamic controllability is just as good in
the intermediate reboiler column as it is in the standard column. Average temperature
control should be used in both because of the very sharp temperature profile.
2.3 Heat Integrated Process
Terrill and Douglas (1987) developed a heat exchanger network for HDA
process. The T-H (temperature-enthalpy) diagram was considered and obtained six

13
alternative heat exchanger networks, all of which had close to maximum energy
recovery. Most of the alternatives include a pressure shifting of the recycle column,
and the other distinguishing feature is the number of column reboilers that are driven
by the hot reactor products. The benefit obtained from energy integration with the
base-case flow rates for the six alternatives, the energy saving from the energy
integration fall between 29-43% but cost savings were in the range from –1 to 5%.
The cost savings were not as dramatic because the raw material costs dominate the
process economics.
Kunlawaniteewat (2002) presented rules and procedure for design control
structure of heat exchanger network using heuristic approach. The rules devised in
this work were categorized as following: generals, match pattern, loop placement,
bypass placement, and split fraction rules. In this research, 6 alternative control
structures of 3 networks were designed. It shown that the network with control
structure designed using their procedure gave minimum the integral time absolute
error, compared to the other network found in the literature, while maintained
maximum energy recovery and achieved outlet temperature targets.
Ploypaisansang A. (2003) designed resilient network for the
Hydrodealkylation process (HDA Process). The match pattern heuristic, shift
approach and the heat load propagation technique were essential approach. Six
alternatives for the HDA process were redesign to be the resiliency networks for
maintain target temperature and also reached maximum energy recovery (MER). The
Resiliency Parameters of resilient networks were required to compare and selected the
best resilient network. In order to receive resilient network, a trade-off between cost
and resilient may be needed. The auxiliary unit should be added in the network for
cope safely with variations and easy to design control structure to the network.
In 2003, the controllability of a complex heat-integrated reactor has been
studied by Yih and Yu. In their work the parameter, the ultimate effectiveness, was
defined to indicate the amount of heat that can be recovered via a feed-effluent heat
exchanger (FEHE) before the overall open-loop system becomes unstable. First, a
systematic approach is proposed to model the reactor, the controllability of a
particular flowsheet can then be evaluated on the basis of the stability margin of

14
design. With the evaluated controllability, implications for design are further
explored. Since the loss of controllability comes from the positive feedback loop,
several design parameters are studied, and design heuristics are proposed to improve
the controllability of heat-integration schemes. Two examples, a simple two-FEHE
example and an HDA example, were used to assess the controllability of different
designs. The results show that, contrary to one’s intuition, some of the complex heat-
integrated reactor design alternatives are indeed more controllable than the simpler
schemes.
Shih-Wen Lina, Cheng-Ching Yu (2004) analyzed the tradeoff between
steady-state economics and dynamic controllability for heat-integrated recycle plants.
The process consists of one reactor, two distillation columns, and two recycle streams
first studied by Tyreus and Luyben which the two distillation columns was heat
integrated. Results show that the steady-state controllability deteriorates gradually as
the degree of heat integration increases. However, if the recycle plant is optimally
designed, acceptable turndown ratio is observed and little tradeoff between steady-
state economics and dynamic operability may result. The results reveal that improved
control can be achieved for well-designed heat-integrated recycle plants (compared to
the plants without energy integration). More importantly, better performance is
achieved with up to 40% energy saving and close to 20% saving in total annual cost.
CHAPTER III
THEORY
A typical chemical plant flowsheet has a mixture of multiple units connected
both in series and parallel that consist of reaction sections, separation sections and
heat exchanger network. So Plantwide Process Control involves the system and
strategies required to control entire plant consisting of many interconnected unit
operations.
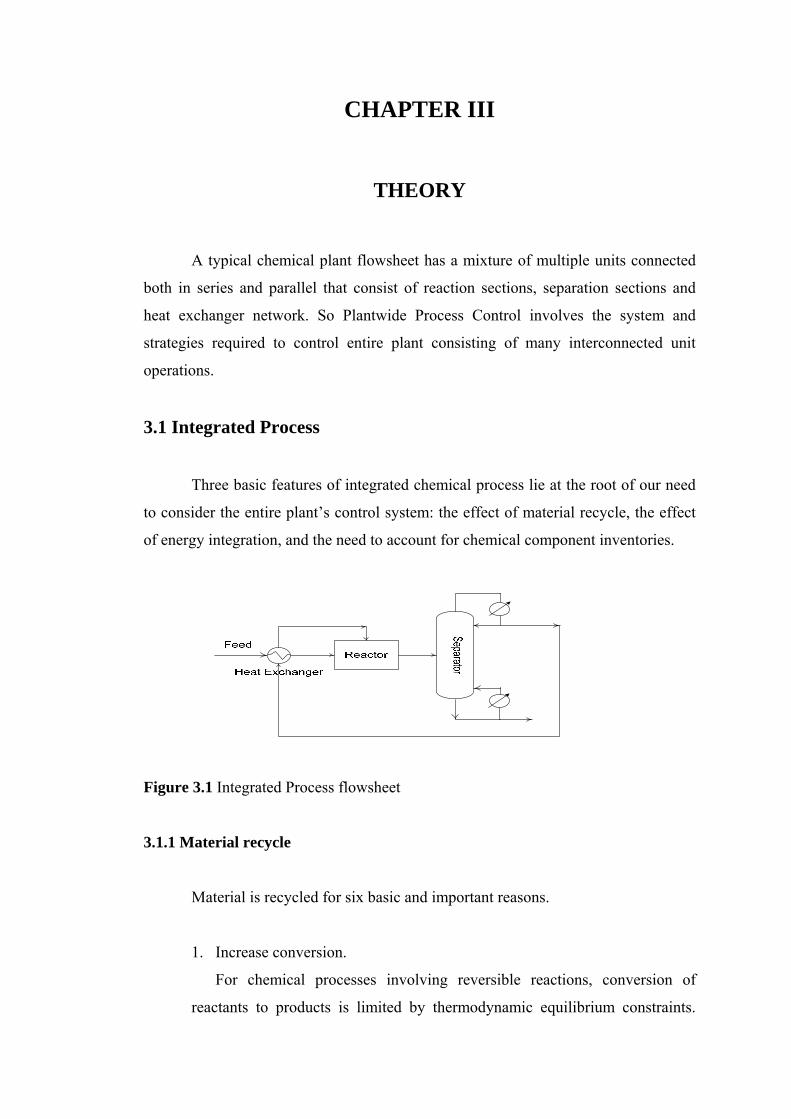
3.1 Integrated Process
Three basic features of integrated chemical process lie at the root of our need
to consider the entire plant’s control system: the effect of material recycle, the effect
of energy integration, and the need to account for chemical component inventories.
Figure 3.1 Integrated Process flowsheet
3.1.1 Material recycle
Material is recycled for six basic and important reasons.
1. Increase conversion.
For chemical processes involving reversible reactions, conversion of
reactants to products is limited by thermodynamic equilibrium constraints.
16
Therefore the reactor effluent by necessity contains both reactants and
products. Separation and recycle of reactants are essential if the process is to
be economically viable.
2. Improve economics.
In most systems it is simply cheaper to build a reactor with incomplete
conversion and recycle reactants than it is to reach the necessary conversion
level in one reactor or several in series. A reactor followed by a stripping
column with recycle is cheaper than one large reactor or three reactors in
series.
3. Improve yields.
In reaction system such as A B C, where B is the desired product,
the per-pass conversion of A must be kept low to avoid producing too much of
the undesirable product C. Therefore the concentration of B is kept fairly low
in the reactor and a large recycle of A is required.
4. Provide thermal sink
In adiabatic reactors and in reactors where cooling is difficult and
exothermic heat effects are large, it is often necessary to feed excess material
to the reactor (an excess of one reactant or a product) so that the reactor
temperature increase will not be too large. High temperature can potentially
create several unpleasant events: it can lead to thermal runaways, it can
deactivate catalysts, it can cause undesirable side reactions, it can cause
mechanical failure of equipment, etc. So the heat of reaction is absorbed by the
sensible heat required to rise the temperature of the excess material in the
stream flowing through the reactor.
5. Prevent side reactions.
A large excess of one of the reactants is often used so that the
concentration of the other reactant is kept low. If this limiting reactant is not
kept in low concentration, it could react to produce undesirable products.
Therefore the reactant that is in excess must be separated from the product
components in the reactor effluent stream and recycled back to the reactor.

17
6. Control properties.
In many polymerization reactors, conversion of monomer is limited to
achieve the desired polymer properties. These include average molecular
weight, molecular weight distribution, degree of branching, particle size, etc.
Another reason for limiting conversion to polymer is to control the increase in
viscosity that is typical of polymer solutions. This facilitates reactor agitation
and heat removal and allows the material to be further processed.
3.1.2 Energy integration
The fundamental reason for the use of energy integration is to improve the
thermodynamics efficiency of the process. This translates into a reduction in utility
cost.
3.1.3 Chemical component inventories
In chemical processes can characterize a plant’s chemical species into three
types: reactants, products, and inerts. The real problem usually arises when we
consider reactants (because of recycle) and account for their inventories within the
entire process. Every molecule of reactants fed into the plant must either be consumed
or leave as impurity or purge. Because of their value so we prevent reactants from
leaving. This means we must ensure that every mole of reactant fed to the process is
consumed by the reactions.
This is an important, from the viewpoint of individual units, chemical
component balancing is not a problem because exit streams from the unit
automatically adjust their flows and composition. However, when connect units
together with recycle streams; the entire system behaves almost like a pure integrator
in terms of reactants. If additional reactant is fed into the system without changing
reactor conditions to consume the reactants, this component will build up gradually
within the plant because it has no place to leave the system.

18
3.2 Effects of Recycle
Most real processes contain recycle streams. In this case the plantwide control
problem becomes much more complex. Two basic effect of recycle is: Recycle has an
impact on the dynamics of the process. The overall time constant can be much
different than the sum of the time constants of the time constants of the individual
units. Recycle leads to the “snowball” effect. A small change in throughput or feed
composition can lead to a large change in steady-state recycle stream flowrates.
3.2.1 Snowball effect
Snowball effect is high sensitivity of the recycle flowrates to small
disturbances. When feed conditions are not very different, recycle flowrates increase
drastically, usually over a considerable period of time. Often the equipment cannot
handle such a large load. It is a steady-state phenomenon but it does have dynamic
implications for disturbance propagation and for inventory control.
The large swings in recycle flowrates are undesirable in plant because they can
overload the capacity of separation section or move the separation section into a flow
region below its minimum turndown. Therefore it is important to select a plantwide
control structure that avoids this effect.
3.3 Plantwide Control Design Procedures
In plantwide control design procedure satisfies the two fundamental chemical
engineering principles, namely the overall conservation of energy and mass.
Additionally, the procedure accounts for nonconserved entities within a plant such as
chemical components (produced and consumed) and entropy (produced).
The goals for an effective plantwide process control system include
1. Safe and smooth process operation.

19
2. Tight control of product quality in the face of disturbances.
3. Avoidance of unsafe process conditions.
4. A control system run in automatic, not manual, requiring minimal operator
attention.
5. Rapid rate and product quality transitions.
6. Zero unexpected environmental releases.
3.3.1 Basic Concepts of Plantwide Control
3.3.1.1 Buckley Basic
Page Buckley (1964) was the first to suggest the idea of separating the
plantwide control problem into two parts:
1. Material balance control.
2. Production quality control.
He suggested looking first at the flow of material through the system. A
logical arrangement of level and pressure control loop is established, using the
flowrates of liquid and gas process streams. He then proposed establishing the
product-quality control loops by choosing appropriate manipulated variables. The
time constants of the closed-loop product-quality loops are estimated as small as
possible. The most level controllers should be proportional-only (P) to achieve flow
smoothing.
3.3.1.2 Douglas doctrines
Jim Douglas (1988) has devised a hierarchical approach to the conceptual
design of process flowsheets. Douglas points out that in the typical chemical plant the
costs of raw materials and the value of the products are usually much greater than the
costs of capital and energy. This leads to two Douglas doctrines.

20
1. Minimize losses of reactants and products.
2. Maximize flowrates through gas recycle systems.
The first implies that we need tight control of stream composition exiting the
process to avoid losses of reactants and products. The second rests on the principle
that yield is worth more than energy.
The control structure implication is that we do not attempt to regulate the gas
recycle flow and we do not worry about what we control with its manipulation. We
simply maximize its flow. This removes one control degree of freedom and simplifies
the control problem.
3.3.1.3 Downs drill
Jim Downs (1992) pointed out the importance of looking at the chemical
component balances around the entire plant and checking to see that the control
structure handles these component balances effectively. We must ensure that all
components (reactants, product, and inerts) have a way to leave or be consumed
within the process. Most of the problems occur in the consideration of reactants,
particularly when several chemical species are involved. Because we usually want to
minimize raw material costs and maintain high-purity products, most of the reactants
fed into the process must be chewed up in the reactions. And the stoichiometry must
be satisfied down to the last molecule. Chemical plants often act as pure integrators in
terms of reactants will result in the process gradually filling up with the reactant
component that is in excess. There must be a way to adjust the fresh feed flowrates so
that exactly the right amounts of the two reactants are fed in.
3.3.1.4 Luyben laws
Three laws have been developed as a result of a number of case studies of
many types of system:
1. All recycle loops should be flow controlled.
21
2. A fresh reactant feed stream cannot be flow-controlled unless there is
essentially complete one-pass conversion of one of the reactants.
3. If the final product from a process comes out the top of a distillation
column, the column feed should be liquid. If the final product comes out
the bottom of a column, the feed to the column should be vapor (Cantrell
et al., 1995). Even if steady-state economics favor a liquid feed stream, the
profitability of an operating plant with a product leaving the bottom of a
column may be much better if the feed to column is vaporized.
3.3.1.5 Richardson rule
Bob Richardson suggested the heuristic that the largest stream should be
selected to control the liquid level in a vessel. (The bigger the handle you have to
affect a process, the better you can control it).
3.3.1.6 Shinskey schemes
Greg Shinskey (1988) has produced a number of “advanced control” structures
that permit improvements in dynamic performance.
3.3.1.7 Tyreus tuning
Use of P-only controllers for liquid levels, turning of P controller is usually
trivial: set the controller gain equal to 1.67. This will have the valve wide open when
the level is at 80 percent and the valve shut when the level is at 20 percent.
For other control loops, suggest the use of PI controllers. The relay-feedback
test is a simple and fast way to obtain the ultimate gain (Ku) and ultimate period (Pu).
Then either the Ziegler-Nichols setting or the Tyreus-Luyben (1992) settings can be
used:
KZN = Ku/2.2 τZN = Pu/1.2

22
KTL = Ku/2.2 τTL = Pu/1.2
The use of PID controllers, the controlled variable should have a very large
signal-to-noise ratio and tight dynamic control is really essential from a feedback
control stability perspective.
3.3.2 Step of Plantwide Process Control Design Procedure
Step1: Establish control objectives
Assess the steady-state design and dynamic control objects for the process.
This is probably the most important aspect of the problem because different control
objectives lead to different control structures. The “best” control structure for a plant
depends upon the design and control criteria established.
These objectives include reactor and separation yields, product quality
specification, product grades and demand determination, environmental restrictions,
and the range of safe operating conditions.
Step 2: Determine control degrees of freedom
This is the number of degrees of freedom for control, i.e., the number of
variables that can be controlled to setpoint. The placement of these control valves can
sometimes be made to improve dynamic performance, but often there is no choice in
their location.
Most of these valves will be used to achieve basic regulatory control of the
process: set production rate, maintain gas and liquid inventories, control product
qualities, and avoid safety and environmental constraints. Any valves that remain
after these vital tasks have been accomplished can be utilized to enhance steady-state
economic objectives or dynamic controllability (e.g. minimize energy consumption,
maximize yield, or reject disturbances).

23
Step 3: Establish energy management system
Make sure that energy disturbances do not propagate throughout the process
by transferring the variability to the plant utility system.
We use the term energy management to describe two functions
1. We must provide a control system that removes exothermic heats of
reaction from the process. If heat is not removed to utilities directly at the
reactor, then it can be used elsewhere in the process by other unit
operations. This heat, however, must ultimately be dissipated to utilities.
2. If heat integration does occur between process streams, then the second
function of energy management is to provide a control system that
prevents the propagation of thermal disturbances and ensure the
exothermic reactor heat is dissipated and not recycled. Process-to-process
heat exchangers and heat-integrated unit operations must be analyzed to
determine that there are sufficient degrees of freedom for control.
Heat removal in exothermic reactors is crucial because of the potential for
thermal runaways. In endothermic reactions, failure to add enough heat simply results
in the reaction slowing up. If the exothermic reactor is running adiabatically, the
control system must prevent excessive temperature rise through the reactor.
Heat integration of a distillation column with other columns or with reactors is
widely used in chemical plants to reduce energy consumption. While these designs
look great in terms of steady-state economics, they can lead to complex dynamic
behavior and poor performance due to recycling of disturbances. If not already
included in the design, trim heater/cooler or heat exchanger bypass line must be added
to prevent this. Energy disturbances should be transferred to the plant utility system
whenever possible to remove this source of variability from the process units.
24
Step 4: Set production rate
Establish the variable that dominate the productivity of the reactor and
determine the most appropriate manipulator to control production rate. To obtain
higher production rate, we must increase overall reaction rates. This can be
accomplished by raising temperature, increasing reactant concentrations, increasing
reactor holdup, or increasing reactor pressure. The variable we select must be
dominant for the reactor
We often want to select a variable that has the least effect on the separation
section but also has a rapid and direct effect on reaction rate in the reactor without
hitting an operational constraint.
Step 5: Control product quality and handle safety, operational, and
environmental constraints
We should select manipulated variables such that the dynamic relationships
between the controlled and manipulated variables feature small time constants and
deadtimes and large steady-state gains.
It should be note that, since product quality considerations have become more
important, so it should be establish the product-quality loops first, before the material
balance control structure.
Step 6: Fix a flow in every recycle loop and control inventories (pressure and
level)
In most process a flow controller should be present in all liquid recycle loops.
This is a simple and effective way to prevent potentially large changes in recycle
flows that can occur if all flows in the recycle loop are controlled by level. We have to
determine what valve should be used to control each inventory variable. Inventories
include all liquid levels (except for surge volume in certain liquid recycle streams)
and gas pressures. An inventory variable should be controlled with the manipulate
variable that has the largest effect on it within that unit (Richardson rule).

25
Gas recycle loops are normally set at maximum circulation rate, as limited by
compressor capacity, to achieve maximum yields (Douglas doctrine)
Proportional-only control should be used in nonreactive level loops for
cascade units in series. Even in reactor level control, proportional control should be
considered to help filter flowrate disturbances to the downstream separation system.
Step 7: Check component balances
Component balances are particularly important in process with recycle streams
because of their integrating effect. We must identify the specific mechanism or
control loop to guarantee that there will be no uncontrollable buildup of any chemical
component within the process (Downs drill).
In process, we don’t want reactant components to leave in the product streams
because of the yield loss and the desired product purity specification. Hence we are
limited to the use of two methods: consuming the reactants by reaction or adjusting
their fresh feed flow. The purge rate is adjusted to control the inert composition in the
recycle stream so that an economic balance is maintained between capital and
operating costs.
Step 8: Control individual unit operations
Establish the control loops necessary to operate each of the individual unit
operations. A tubular reactor usually requires control of inlet temperature. High-
temperature endothermic reactions typically have a control system to adjust the fuel
flowrate to a furnace supplying energy to the reactor.
Step 9: Optimize economics or improve dynamic controllability
After satisfying all of the basic regulatory requirements, we usually have
additional degrees of freedom involving control valves that have not been used and
setpoints in some controllers that can be adjusted. These can be used either to
optimize steady-state economic process performance (e.g. minimize energy,
maximize selectivity) or improve dynamic response.

26
3.4 Control Issues for Distillation Column.
Distillation is the most frequently used separation technique in the chemical
and petroleum industries. The design and control of this important unit operation is
vital for safe and profitable operation of many plants.
Distillation columns are fairly complex units. They have several inputs and
outputs, so they can present challenging multivariable control problems. Their
dynamics are a mixture of very fast vapor flowrate changes, moderately fast liquid
flowrate changes, slow temperature changes and very slow composition changes. The
manipulated variables often have constraints because of column flooding limitations
or heat exchanger limitations. Developing an effective control system for an
individual column is not a trivial job. There are at last six loop involved on even the
most simple column.
3.4.1 Typical Control Schemes of Distillation Column.
A number of alternative structures are used to control distillation columns.
This section presents some of the most commonly employed strategies and discusses
when they are appropriate. The standard terminology is to label a control structure
with the two manipulated variables that are employed to control compositions. For
example, the “R-V” structure refers to a control system in which reflux and vapor
boilup are used to control two composition (or temperature). The “D-V” structure
means distillate and vapor boilup are used.
The simultaneous control of two compositions or temperatures is called dual
composition control. This is ideally what we would like to do in a column because it
provides the required separation with the minimum energy consumption. However,
many distillation columns operate with only one composition controlled, not two.
This is called single-end composition control.
This is due to a variety of reasons. Dual requires two controllers that interact,
making them more difficult to tune. Often the difference in energy consumption
between dual and single-end composition control is quite small and is not worth the
27
additional complexity. Frequently direct measurement of composition is difficult,
expensive and unreliable, so temperatures must be used. The column temperature
profile may permit only one temperature to be used for control because of the
nonuniqueness of temperature in a multicomponent system, resulting in a lack of
sensitivity to changes in column conditions. Perhaps the most important reason that
most columns operate with single-end control is that just one tray temperature is a
dominant variable for column behavior. The dominant temperature usually occurs
either in the stripping or rectifying section where there is a significant variable
generally provides partial control of both product compositions in the column.
Therefore we often use the R-V structure, for example, with reflux flow controlled
and reboiler heat input used to control an appropriate tray temperature.
Figure 3.2 shows a number of control configurations for simple two product
distillation columns.
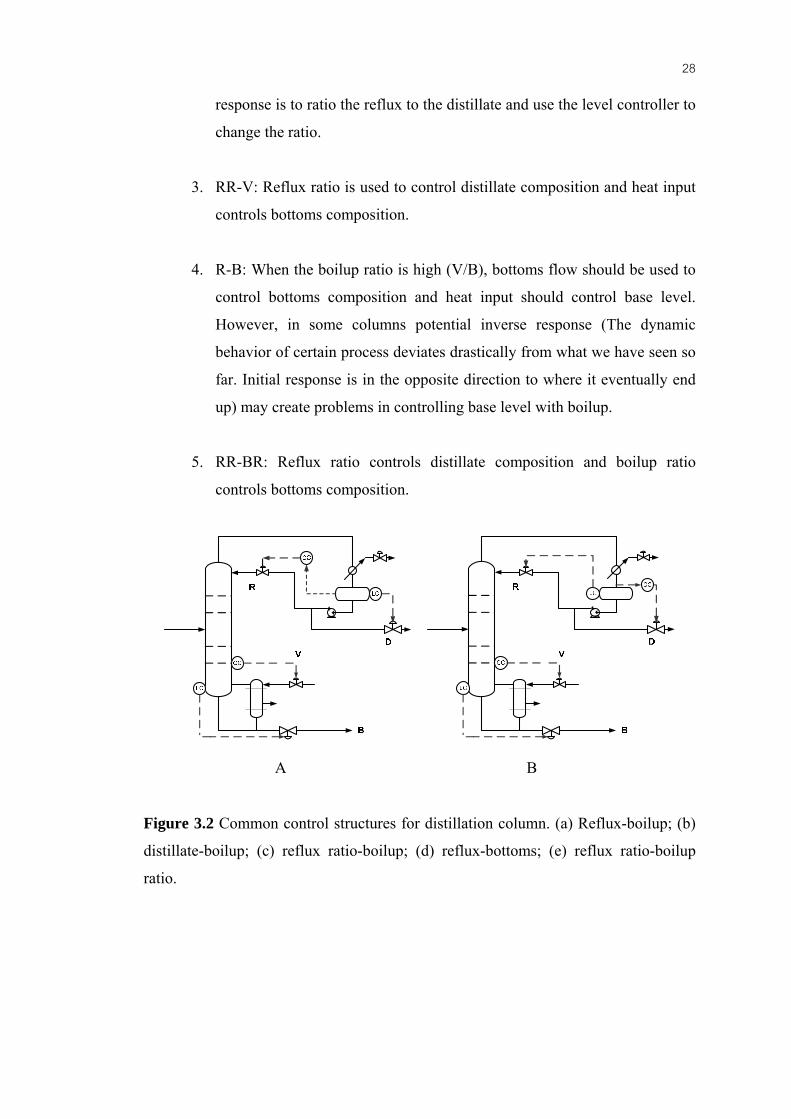
1. R-V: Reflux flow controls distillate composition. Heat input controls
bottoms composition. By default, the inventory controls use distillate
flowrate to hold reflux drum level and bottoms flowrate to control base
level. This control structure (in its single-end control version) is probably
the most widely used. The liquid and vapor flowrates in the column are
what really affect product compositions, so direct manipulations of these
variables make sense. One of the strengths of this system is that it usually
handles feed composition changes quite well. It also permits the two
products to be sent to downstream process on proportional-only level
control so that plantwide flow smoothing can be achieved.
2. D-V: If the column is operating with a high reflux ratio (RR>4), the D-V
structure should be used because the distillate flowrate is too small to
control reflux drum level. Small changes in vapor to the condenser would
require large changes in the distillate flowrate if it is controlling level.
When the D-V structure is used, the tuning of the reflux drum level
controller should be tight so that the changes in distillate flowrate result in
immediate changes in reflux flowrate. If the dynamics of the level loop are
slow, they slow down the composition loop. One way to achieve this quick
28
response is to ratio the reflux to the distillate and use the level controller to
change the ratio.
3. RR-V: Reflux ratio is used to control distillate composition and heat input
controls bottoms composition.
4. R-B: When the boilup ratio is high (V/B), bottoms flow should be used to
control bottoms composition and heat input should control base level.
However, in some columns potential inverse response (The dynamic
behavior of certain process deviates drastically from what we have seen so
far. Initial response is in the opposite direction to where it eventually end
up) may create problems in controlling base level with boilup.
5. RR-BR: Reflux ratio controls distillate composition and boilup ratio
controls bottoms composition.
Figure 3.2 Common control structures for distillation column. (a) Reflux-boilup; (b)
distillate-boilup; (c) reflux ratio-boilup; (d) reflux-bottoms; (e) reflux ratio-boilup
ratio.
A B

29
Figure 3.2 (continue)
Figure 3.3 shows typical control structures for two special types of column.
Figure 3.3a is for a column whose feed contains a small amount of a component that
is much more volatile than the main component. The distillate product is small
fraction of feed stream. It is removed from the reflux drum as a vapor to hold column
pressure. Reflux flow is fixed, and reflux drum level is controlled by manipulating
condenser coolant. In the petroleum industry, this type of column is called a stabilizer.
Figure 3.3b shows a column that is separating a mixture with a low relative
volatility, so the column has a large number of trays and operates with a high reflux
ratio. This type of column is called a superfractionator. Because of the high reflux
C D
E

30
ratio, reflux should be used to control reflux drum level. For the same reason, vapor
boilup should be used to control base level. Therefore the two manipulators left to
control composition are distillate and bottoms flowrates. Obviously these two flows
cannot be set independently for a given feed under steady-state conditions.
Dynamically, however, they can be adjusted independently. This D-B control
structure works well on this type of column. It should be noted that it is quite “fragile”
because if either of the two composition loops is put on manual, the other cannot
work. Override controls must be used to recognize that this situation has occurred and
switch the control structure. For example, if the bottoms composition analyzer fails,
the control structure should be switched so that overhead composition is controlled by
distillate flow, base level is controlled by bottoms flow, and reboiler heat input is a
constant.
Figure 3.3 Common types of columns and controls. (a) Stabilizer (small
distillate flow); (b) superfractionator with distillate-bottoms control structure.

31
3.4.2 Heat-Integrated Distillation Columns
Distillation columns are major energy consumers in many petroleum and
chemical plants. One commonly used method to reduce the energy requirements in
distillation systems is heat-integration. The basic idea is to use the overhead vapor
from one column as a heat source in another column. Multiple-effect evaporators use
the same technique.
The pressure in the two columns are adjusted so that there is a reasonable
differential temperature driving force for heat transfer in the heat exchanger serving as
the condenser for the high-temperature column and the reboiler for the low-
temperature column. A small temperature difference results in lower temperature heat
source in the high-temperature column but a larger heat-transfer area in the
reboiler/condenser. Typical temperature differentials are about 30 to 50 oF, depending
on the relative cost of heat-exchanger area and energy. There are interesting designs
optimization trade-offs that involve the many design degree of freedom: number of
trays in each column, reflux ratios and pressures. The typical system has the low-
pressure column pressure set by the use of cooling water in the condenser. Then the
pressure in high-pressure column is set to a reasonable temperature differential in the
condenser/reboiler.
Heat integration can be used in systems where two columns separating
different chemical components have the required temperature levels. The reflux-drum
temperature of the high-temperature column must be sufficiently higher than the base
temperature of the low-temperature column to give reasonable heat-exchanger area.
Of course, the heat duties of the two columns must be similar. Any differences
between these duties the use of auxiliary condenser and/or reboilers. Even if the duties
are perfectly balanced, auxiliary heat exchangers may be required to improve dynamic
controllability.
Heat integration can also be used to separate a single feed stream. Instead of
using one column with a reboiler and a condenser, two columns are used. One
operates at high pressure and the other column operates at low pressure so that the

32
appropriate temperatures are achieved in the coupled condenser/reboiler heat
exchanger. This type of system is normally limited to
1. Binary systems with no lighter or heavier components. The effect of
lighter-than-light or heavier-than-heavy key components is to lower or
elevate reflux-drum and base temperatures, respectively.
2. Systems in which the components have boiling point those are not very
different.
Systems that do not have these properties may require excessive pressure differences
between the two columns, so the heat-integration economics become unfavorable.
A typical heat-integrated distillation system may involve somewhat higher
capital investment, but the savings in energy costs can usually justify this investment.
There are a number of alternative heat-integration flowsheets. Two of more
widely used are:
1. Feed split: Fresh feed is split between two columns that operate at different
pressures to provide the specified ∆T in the condenser/reboiler.
Specification products are produced at the ends of both columns.
2. Light split: All the fresh feed is introduced into one column. The distillate
from this column contains about half of the lighter component in the feed.
The bottom contains the rest of the lighter component and all of the heavy
component. This is fed into the second column where the lighter
component goes overhead in the distillate and all of the heavy component
goes out in the bottoms. The heat integration can be in the direction of
flow (the first column run at high pressure). One of the factors that
influence this choice is the temperature level of the available heating
medium. The direct scheme has a lower base temperature in the high-
pressure column because the bottoms composition is a mixture of light and
heavy components.

33
3.4.3 Plantwide control issues for distillation column
3.4.3.1 Reflux drum and base level control
When considering a column in isolation, we typically select heat input to
control temperature on an appropriate column tray to achieve good, tight control
composition control. Then we fix the reflux flowrate or ratio it to the feed flowrate.
Finally, we control the level in the reflux drum by manipulating distillate flowrate and
control the level in the column base by manipulating bottoms flowrate. This structure
works well for the column and also fits nicely into a plantwide context because the
proportional-only level controller setting both products provide gradual smooth
flowrate changes to downstream sections of the plant. This type of control scheme
would be used for a column with a liquid distillate product and with a low to moderate
reflux ratio (less than 4).
However, for columns with higher reflux ratios, Richardson’s rule dictates that
we control reflux drum level with reflux, not distillate. The flowrate of distillate
would be used (1) to control distillate product composition or (2) to control a constant
reflux ratio. If the former strategy is used (distillate controls composition or
temperature), there may be significant fluctuations in the distillate flowrate as the
tightly tuned composition controller attempts to achieve good quality control. With
this structure the reflux drum level loop must be tightly tuned (PI control) so that we
do not introduce an additional lag in the composition loop; i.e., changes in distillate
flowrate will result in immediate changes in reflux flowrate.
If the distillate is fed to a downstream unit, the variability in flowrate will be
disturbance. So what can we do? We can make use of feedforward control to
anticipate the required changes in reflux and distillate flowrates (ratio distillate to feed
with the ratio reset by the composition controller).
In the second case (manipulate distillate to control reflux ratio), the variability
of the distillate flow would be greatly reduced. The reflux drum level controller,
manipulating reflux flowrate, is made P-only to get slow change in reflux flowrate
and this give slow change in distillate flowrate in the reflux-ratio control structure.

34
So from a plantwide control perspective, setting distillate flowrate to control
reflux ratio is a better strategy than using distillate to control composition. Of course
similar arguments can be made about bottoms flowrate in the case of a column with a
high boilup ratio.
3.4.3.2 On-demand product
Suppose our plantwide control system requires “on-demand” products. The
fourth step in the plantwide control design procedure is to establish where production
rate is set. If the flowrate of one of product streams leaving the column is fixed by a
down stream unit or customer, the column control structure must be set up in an
appropriate way.
3.5 Heat Exchanger and Energy Management
3.5.1 Heat recovery
We can make great improvements in the plant’s thermal efficiency by
recycling much of the energy needed for heating and cooling process streams. There
is of course a capital expense associated with improved efficiency but it can usually
be justified when the energy savings are accounted for during the lifetime of the
project. Of more interest to us in the current context is how heat integration affects the
dynamics and control of a plant and how we can manage energy in plants with a high
degree of heat recovery.
3.5.2 Control of utility exchangers
Control of Utility Exchangers
Armed with the thermodynamic fundamentals of heat management, we now
take a closer look at the unit operation control loops for heat exchangers. We start
with utility exchangers. These are used when heat is supplied to, or removed from, the

35
TC
TC
process. Examples are steam heated reboilers, electric heaters, fuel-fired furnaces,
water-cooled condensers, and refrigerated coolers.
The purpose of unit operation controls is to regulate the amount of energy
supplied or removed. This is typically done by measuring a temperature in the process
and manipulating the flowrate of the utility. A PI-controller is adequate in most
instances although derivative action can be used to compensate for the lag introduced
by thermowell. The location of the temperature measurement depends upon the
purpose of the heat exchange. For example, when reaction heat is dissipated through a
water cooler, the controlled temperature is in the reactor. Similarly, when the utility
exchanger delivers heat to a separation system, the control point should be located the
effects of the added energy are felt the most. Control of a tray temperature in a
distillation column by manipulation of reboiler stream is a good example. Finally,
when the utility exchanger is used for stream heated or cooled.
3.5.3 Control of process-to-process exchanger
Process-to-process (P/P) exchangers are used for heat recover within a
process. We can control the two exit temperatures provided we can independently
manipulate the two inlet flowrates. However, these flowrates are normally unavailable
for us to manipulate and we therefore give up two degrees of freedom for temperature
control. We can restore one of these degrees of freedom fairly easily. It is possible to
oversize the P/P exchanger and provides a controlled bypass around it as in Fig. 3.4a.
It is possible to combine the P/P exchanger with a utility exchanger as in Fig 3.4b.
Figure 3.4 Control of P/P heat exchangers: (a) Use of bypass; (b) use of auxiliary
utility exchanger.
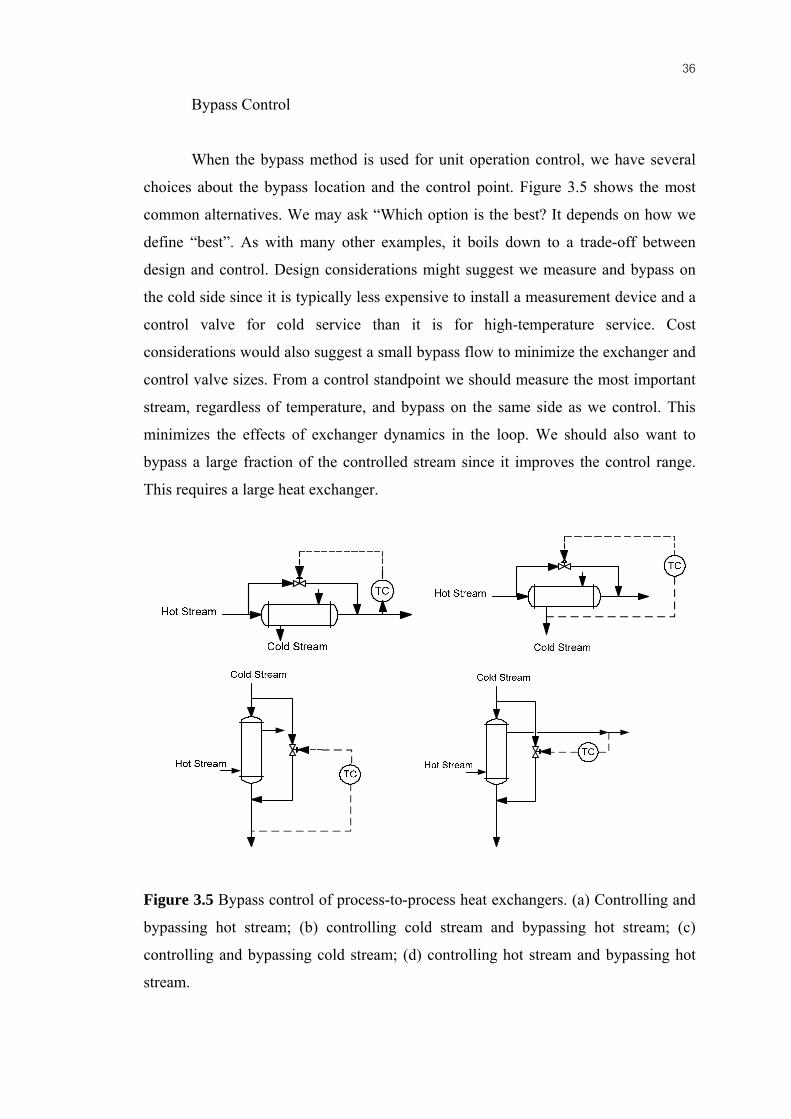
36
Bypass Control
When the bypass method is used for unit operation control, we have several
choices about the bypass location and the control point. Figure 3.5 shows the most
common alternatives. We may ask “Which option is the best? It depends on how we
define “best”. As with many other examples, it boils down to a trade-off between
design and control. Design considerations might suggest we measure and bypass on
the cold side since it is typically less expensive to install a measurement device and a
control valve for cold service than it is for high-temperature service. Cost
considerations would also suggest a small bypass flow to minimize the exchanger and
control valve sizes. From a control standpoint we should measure the most important
stream, regardless of temperature, and bypass on the same side as we control. This
minimizes the effects of exchanger dynamics in the loop. We should also want to
bypass a large fraction of the controlled stream since it improves the control range.
This requires a large heat exchanger.
Figure 3.5 Bypass control of process-to-process heat exchangers. (a) Controlling and
bypassing hot stream; (b) controlling cold stream and bypassing hot stream; (c)
controlling and bypassing cold stream; (d) controlling hot stream and bypassing hot
stream.
37
There are several general heuristic guidelines for heat exchanger bypass
systems. However, this very much remains an open research area since these
guidelines are not always adequate to deal with all of the issues for bypass systems.
We typically want to bypass the flow of the stream whose temperature we want to
control. The bypass should be about 5 to 10 percent of flow to be able to handle
disturbances. Finally, we must carefully consider the fluid mechanics of the bypass
design for the pressure drops through the control valves and heat exchanger.
Use of auxiliary utility exchangers
When the P/P exchanger is combined with a utility exchanger, we also have a
few design decisions to make. We must first establish the relative sizes between the
recovery and the utility exchangers. From a design standpoint we would like to make
the recovery exchanger large and the utility exchanger small. This gives us the most
heat recovery, and it is also the least expensive alternative from an investment
standpoint. However, a narrow control range and the inability to reject disturbances
make this choice the least desirable from a control standpoint.
Next, we must decide how to combine the utility exchanger with the P/P
exchanger. This could be done either in a series or parallel arrangement. Physical
implementation issues may dictate this choice but it could affect controllability.
Finally, we have to decide hoe to control the utility exchanger for best overall control
performance.
Consider a distillation column that uses a large amount of high-pressure
stream in its thermo siphon reboiler. To reduce operating costs we would like to heat-
integrate this column with the reactor. A practical way of doing this is to generate
stream in a waste heat boiler connected to the reactor as suggested. We can then use
some or all of this steam to help reboil the column by condensing the stream in the
tubes of a stab-in reboiler. However, the total heat from the reactor may not be
enough to reboil the column, so the remaining heat must come from the thermo
siphon reboiler that now serves as an auxiliary reboiler. The column tray temperature
controller would manipulate the stream to the thermo siphon reboiler.

38
3.6 Process Control
3.6.1 Cascade Control
One of the most useful concepts in advanced control is cascade control. A
cascade control structure has two feedback controllers with the output of the primary
(or master) controller changing the setpoint of the secondary (or slave) controller. The
output of the secondary goes to the slave.
There are two purposes for cascade control: (1) to eliminate the effects of
some disturbances, and (2) to improve the dynamic performance of the control loop.
To illustrate the disturbance rejection effect, consider the distillation column
reboiler. Suppose the steam supply pressure increases. The pressure drop over the
control valve will be larger, so the steam flow rate will increase. With the single-loop
temperature controller, no correction will be made until the higher steam flow rate
increases the vapor boilup and the higher vapor rate begins to rise the temperature on
tray. Thus the whole system is disturbed by a supply-steam pressure change.
Figure 3.6 Cascade control in distillation-column-reboiler.
With the cascade control system, the steam flow controller will immediately
see the increase in steam flow and will pinch back on the steam valve to return the
39
steam flow rate to its setpoint. Thus the reboiler and the column are only slightly
affected by the steam supply-pressure disturbance.
Figure shows another common system where cascade control is used. The
reactor temperature controller is the primary controller; the jacket temperature
controller is the secondary controller. The reactor temperature control is isolated by
the cascade system from disturbances in cooling-water inlet temperature and supply
pressure.
3.6.2 Valve Position Control
Shinskey (1976) proposed the use of type of control configuration that he
called valve position control. This strategy provides a very simple and effective
method for achieving “optimizing control”. The basic idea is illustrated by several
important applications.
Since relative volatilities increase in most distillation systems as pressure
decrease, the optimum operation would be to minimize the pressure at all times. One
way to do this is to just completely open the control valve on the cooling water. The
pressure would then float up and down as cooling water temperatures changed.
However, if there is a sudden droop in cooling water temperature (as can occur
during a thunder shower or “blue norther”), the pressure in the column can fall
rapidly. This can cause flashing of the liquid on the tray, will upset the composition
and level controls on the column, and could even cause the column to flood.
To prevent this rapid drop, Shinskey developed a “floating-pressure” control
system. A conventional PI pressure controller is used. The output of the pressure
controller goes to the cooling water valve, which is AC so that it will fail open. The
pressure controller output is also sent to another controller, the “valve position
controller” (VPC). This controller looks at the signal to the valve, compares it with
the VPC setpoint signal, and sends out a signal which is the setpoint of the pressure

40
controller. Since the valve is AC, the setpoint of VPC is about 5 percent of scale so as
to keep the cooling water valve almost wide open.
The VPC scheme is a different type of cascade control system. The primary
control is the position of the valve. The secondary control is the column pressure. The
pressure controller is PI and tuned fairly tightly so that it can prevent the sudden drops
in pressure. Its setpoint is slowly changed by the VPC to drive the cooling water valve
nearly wide open. A slow-acting, integral-only controller should be used in the VPC.
Luyben show another of the application of VPC to optimize a process as
figure 3.7. We want to control the temperature of a reactor. The reactor is cooled by
both cooling water flowing through a jacket surrounding the reactor and by
condensing vapor that boil off the reactor in a heat exchanger that is cooled by a
refrigerant. This form of cooling is called “autorefrigeration”.
VPC
TT TC
Vapor
Reactor
CW
SP
Figure 3.7 Use of VPC to minimize energy cost.
From an energy-cost perspective, we would like to use cooling water and not
refrigerant because water is much cheaper. However, the dynamic response of the
temperature to a change in cooling water may be much slower than to a change in
refrigerant flow. This is because the change in water flow must change the jacket
temperature, which then changes the metal wall temperature, which then begins to
change the reaction-mass temperature. Changes in refrigerant flow quickly raise or

41
lower the pressure in the condenser and change the amount of vaporization in the
reactor, which is reflected in reactor temperature almost immediately.
So, from a control point of view, he would like to use refrigerant to control
temperature. Much tighter control could be achieved as compared to using cooling
water. The VPC approach handles this optimization problem very nicely. Simply
control temperature with refrigerant, but send the signal that is going to controller
which will slowly move the cooling water valve to keep the refrigerant valve nearly
closed. Since the refrigerant valve is AC, the setpoint signal to the VPC will be about
5 to 10 percent of full scale.
CHAPTER IV
HYDRODEALKYLATION PROCESS
4.1 Process Description
The hydrodealkylation HDA of toluene process (alternative 1) by Douglas
(1988) on conceptual design as in Fig. 4.1 contain nine basic unit operations: reactor,
furnace, vapor-liquid separator, recycle compressor, two heat exchangers, and three
distillation columns. Two raw materials, hydrogen, and toluene, are converted into the
benzene product, with methane and diphenyl produced as by-products. The two
vapor-phase reactions are
Toluene + H2 → benzene + CH4
2BenZene ↔ diphenyl + H2
The kinetic rate expressions are functions of the partial pressure (in psia) of toluene
pT, hydrogen pH, benzene pB, and diphenyl pD, with an Arrhenius temperature
dependence. Zimmerman and York (1964) provide the following rate expression:
r1 = 3.6858 * 106exp(-25616/T) pT pH1/2
r2 = 5.987 * 104exp(-25616/T) pB2 – 2.553 * 105exp(-25616/T) pD pH
Where r1 and r2 have units of lb*mol/(min*ft3) and T is the absolute temperature in
Kelvin. The heats of reaction given by Douglas (1988) are –21500 Btu/lb*mol of
toluene for r1 and 0 Btu/lb*mol for r2.
The effluent from the adiabatic reactor is quenched with liquid from the
separator. This quenched stream is the hot-side feed to the process-to-process heat
exchanger, where the cold stream is the reactor feed stream prior to the furnace. The

43
reactor effluent is then cooled with cooling water and the vapor (hydrogen, methane)
and liquid (benzene, toluene, diphenyl) are separated. The vapor stream from the
separator is split and the remainder is sent to the compressor for recycle back to the
reactor.
The liquid stream from the separator (after part is taken for the quench) is fed
to the stabilizer column, which has a partial condenser component. The bottoms
stream from the stabilizer is fed to the product column, where the distillate is the
benzene product from the process and the bottoms is toluene and diphenyl fed to the
recycle column. The distillate from the recycle column is toluene that is recycled back
to the reactor and the bottom is the diphenyl byproduct.
Makeup toluene liquid and hydrogen gas are added to both the gas and toluene
recycle streams. This combined stream is the cold-side feed to the process-to-process
heat exchanger. The cold-side exit stream is then heated further up to the required
reactor inlet temperature in the furnace, where heat is supplied via combustion of fuel.
Fig. 4.1 Hydrodealkylation HDA of toluene process (alternative 1)
Component physical property data for the HDA process were obtain from
William L. Luyben, Bjorn D. Tyreus, Michael L. Luyben (1999)

44
4.2 Control Structure Design Consideration
Terrill and Douglas (1987b) design six different energy-saving alternatives to
the base case. The simplest of these designs (alternative 1) recovers an additional 29%
of the base case heat consumption by making the reactor preheater larger and the
furnace smaller.
In alternative 3 part of the heat in the reactor effluent stream is used to drive
the stabilizer reboiler, recycle column was pressure shifted to be above the pinch
temperature, and the condenser for the recycle column is used to drive the product
column reboiler as in Fig. 4.2
Fig. 4.2 HDA process –alternative 3
Table 4.1 TAC and Utilities Usage of HEN Alternatives of the HDA Process
Alternative 1 2 3 4 5 6
utilities usage for alternatives with base-case design values, MW 9.06 7.68 7.39 7.30 7.30 7.30
energy savings from new HEN, % 29 40 42 43 43 43 TAC for alternatives with base-case design values, $106/year 6.40 6.45 6.38 6.11 6.04 6.03
improvement from new HEN, % -0.3 -1 0 4 5 5

45
4.3 Steady-State Modeling
First, a steady-state model is built in HYSYS.PLANT, using the flowsheet and
equipment design information, mainly taken from Douglas (1988); Luyben et al.
(1998) . Table A.1, 4 presents the data and specifications for the equipment employed
other than the three columns. For this simulation, Peng-Robinson model is selected
for physical property calculations because of its reliability in predicting the properties
of most hydrocarbon-based fluids over a wide range of operating conditions. The
reaction kinetics of both reactions are modeled with standard Arrhenius kinetic
expressions available in HYSYS.PLANT, and the kinetic data are taken from Luyben
et al. (1998).
When columns are modeled in steady-state, besides the specification of inlet
streams, pressure profiles, numbers of trays and feed tray, two specifications need to
be given for columns with both reboiler and condenser. These could be the duties,
reflux rate, draw stream rates, composition fractions, etc. We choose reflux ratio and
overhead benzene mole fraction for the stabilizer column. For the remaining two
columns, bottom and overhead composition mole fractions are specified to meet the
required purity of products given in Douglas (1988). The detailed design data and
specifications for the columns are summarized in Table A.3. This table also includes
details of trays, which are required for dynamic modeling. The simulated HDA
process at steady-state by HYSYS is showed in figure 4.3.
In addition, in alternative 3 some data are change from reference due to heat
integration. This alternative has 4 P/P heat exchangers: two heat exchangers for
preheat feed, heat in the reactor effluent stream is used to drive the stabilizer reboiler,
and heat from the top of recycle column is used to drive the product column reboiler.
Recycle column is pressure shifted to be above the pinch temperature. For this
alternative, the three columns have only one specification. We choose overhead
composition mole fraction for the stabilizer column. Product column overhead
composition mole fraction is specified. And bottom composition mole fraction is
specified in recycle column. Table A.2-4 shows the data and specification of this
process. The simulated HDA process (alt. 3) at steady-state by HYSYS is showed in
figure 4.4.

46
Figure 4.3 The simulated HDA process (alt.1) at steady-state by HYSYS
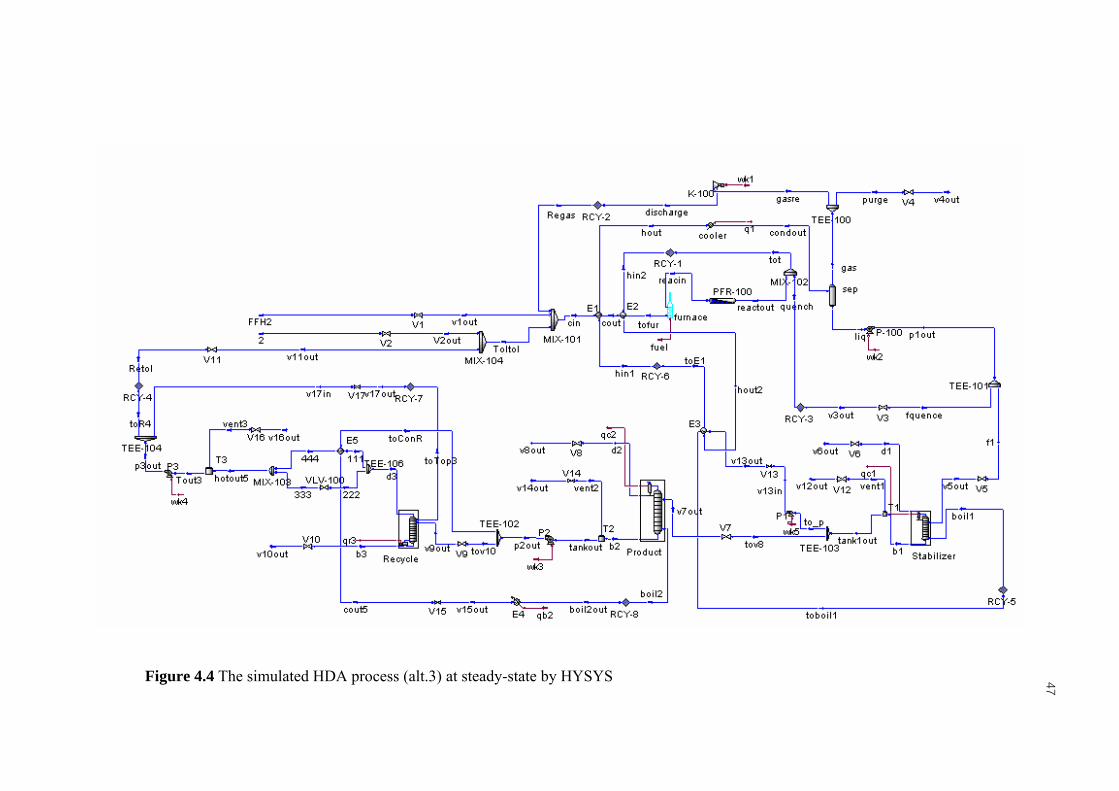
47
Figure 4.4 The simulated HDA process (alt.3) at steady-state by HYSYS

48
4.4 Plantwide control design procedure
Step 1. Establish Control Objectives.
For this process, the essential is to produce pure benzene while minimizing
yield losses of hydrogen and diphenyl. The reactor effluent gas must be quenched to
1150 °F. The design a control structures for process associate with energy integration
can be operated well.
Step 2. Determine Control Degree of Freedom.
There are 21 control degrees of freedom in HDA alternative 3. They include:
two fresh feed valves for hydrogen and toluene, purge valve, separator base and
overhead valves, cooler cooling water valve, liquid quench valve, furnace fuel valve,
stabilizer column steam; reflux; cooling water; and vapor product valves, product
column steam ; bottoms; reflux; distillate; and cooling water valves, and recycle
column steam; bottoms; reflux; and distillate.
Step 3. Establish Energy management system.
The reactor operates adiabatically, so for a given reactor design the exit
temperature depends upon the heat capacities of the reactor gases, reactor inlet
temperature, and reactor conversion. Heat from the adiabatic reactor is carried in the
effluent stream and is not removed from the process until it is dissipated to utility in
the separator cooler.
Energy management of reaction section is handled by controlling the inlet and
exit streams temperature of the reactor. Reactor inlet temperature must be controlled
by adjusting fuel to the furnace and reactor exit temperature must be controlled by
quench to prevent the benzene yield decreases from the side reaction. In the reference
control structure, the effluent from the adiabatic reactor is quenched with liquid from
the separator. This quenched stream is the hot-side feed to the process-to-process heat
exchanger, where the cold stream is the reactor feed stream prior to the furnace. The
reactor effluent is then cooled with cooling water. But in alternative 3 part of the heat
49
in the reactor effluent stream is used to drive the stabilizer reboiler before go to
cooling water. And recycle column is pressure shifted to be above the pinch
temperature, and the condenser for the recycle column is used to drive the product
column reboiler for saving cost from the utility. However, this method gives up
degree of freedom for temperature control. The solutions to restore one degree of
freedom fairly easily have two ways. It is possible to oversize the P/P exchanger and
provides a controlled bypass around it. And it is possible to combine the P/P
exchanger with a utility exchanger.
Step 4. Set Production Rate.
Many control structures, there are not constrained to set production either by
supply or demand. Considering of the kinetics equation is found that the three
variables alter the reaction rate; pressure, temperature and toluene concentration
(limiting agent).
• Pressure is not a variable choice for production rate control because of the
compressor has to operate at maximum capacity for yield purposes.
• Reactor inlet temperature is controlled by specify the reactant fresh feed rate
and reactant composition into the reactor constant. The reactor temperature is
constrained below 1300 °F for preventing the cracking reaction that produce
undesired byproduct.
• Toluene inventory can be controlled in two ways. Liquid level at the top of
recycle column is measured to change recycle toluene flow and total toluene
feed flow in the system is measured for control amount of fresh toluene feed
flow.
For on demand control structure the production rate is set; distillate of product
column is flow control instead of level control so condenser level is controlled by
manipulating the total flow rate of the toluene. This on-demand structure might be

50
used when the downstream customer desires immediate responses in the availability
of the product stream from this unit.
Step 5. Control Product Quality and Handle Safety, Operational, and
Environmental Constraints.
Benzene quality can be affected primarily by two components, methane and
toluene. Any methane that leaves in the bottoms of the stabilizer column contaminates
the benzene product. The separation in the stabilizer column is used to prevent this
problem by using a temperature to set column stream rate (boilup). Toluene in the
overhead of the product column also affects benzene quality. Benzene purity can be
controlled by manipulating the column steam rate (boilup) to maintain temperature in
the column.
Step 6. Control Inventories and Fix a Flow in Every Recycle Loop.
In most processes a flow control should be present in all recycle loops. This is
a simple and effective way to prevent potentially large changes in recycle flows, while
the process is perturbed by small disturbance. We call this high sensitivity of the
recycle flowrates to small disturbances the “snowball effect”.
Four pressures and seven liquid levels must be controlled in this process. For
the pressures, there are in the gas loop and in the three distillation columns. In the gas
loop, the separator overhead valve is opened and run the compressor at maximum gas
recycle rate to improve yield so the gas loop control is related to the purge stream and
fresh hydrogen feed flow. In the stabilizer column, vapor product flow is used to
control pressure. In the product column, pressure control can be achieved by
manipulating cooling water flow, and in the product column pressure control can be
set by bypass valve of P/P heat exchanger to regulate overhead condensation rate.
For liquid control loops, there are a separator and two receivers in each
column (base and overhead). The most direct way to control separator level is with
the liquid flow to the stabilizer column. The stabilizer column overhead level is
controlled with cooling water flow and base level is controlled with bottom flow. In
51
several cases of this research; the product column, distillate flow controls overhead
receiver level but on demand control structure condenser level is controlled by
cascade the total flow rate of the toluene and bottom flow controls base level. In the
recycle column manipulate the total toluene flow to control level. The base level of
recycle column in the reference is controlled by manipulating the column steam flow
because it has much larger effect than bottoms flow. But the column steam flow does
not obtain a good controllability, so base level is controlled with bottom flow.
Step 7. Check Component Balances.
Component balances control loops consists of:
• Methane is purged from the gas recycle loop to prevent it from accumulating
and its composition can be controlled with the purge flow.
• Diphenyl is removed in the bottom stream from the recycle column, where
bottom stream controls base level. And control temperature (or concentration)
with the reboiler steam.
• The inventory of benzene is accounted for via temperature and overhead
receiver level control in the product column. But on demand structure the
inventory of benzene is accounted for via temperature and distillate flow
control in the product column.
• Toluene inventory is accounted for via level control in the recycle column
overhead receiver.
• Gas loop pressure control accounts for hydrogen inventory.
Step 8. Control Individual Unit Operations.
The rest degrees of freedom are assigned for control loops within individual
units. These include:
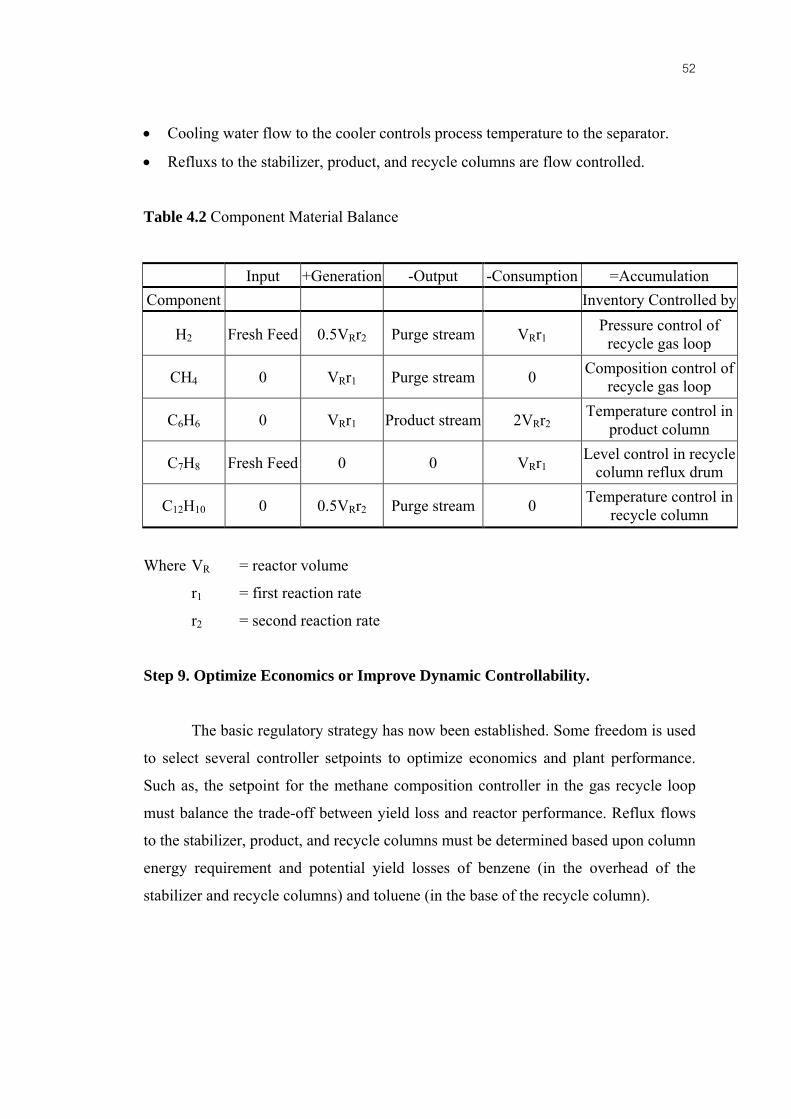
52
• Cooling water flow to the cooler controls process temperature to the separator.
• Refluxs to the stabilizer, product, and recycle columns are flow controlled.
Table 4.2 Component Material Balance
Input +Generation -Output -Consumption =Accumulation Component Inventory Controlled by
H2 Fresh Feed 0.5VRr2 Purge stream VRr1 Pressure control of
recycle gas loop
CH4 0 VRr1 Purge stream 0 Composition control ofrecycle gas loop
C6H6 0 VRr1 Product stream 2VRr2 Temperature control in
product column
C7H8 Fresh Feed 0 0 VRr1 Level control in recycle
column reflux drum
C12H10 0 0.5VRr2 Purge stream 0 Temperature control in recycle column
Where VR = reactor volume
r1 = first reaction rate
r2 = second reaction rate
Step 9. Optimize Economics or Improve Dynamic Controllability.
The basic regulatory strategy has now been established. Some freedom is used
to select several controller setpoints to optimize economics and plant performance.
Such as, the setpoint for the methane composition controller in the gas recycle loop
must balance the trade-off between yield loss and reactor performance. Reflux flows
to the stabilizer, product, and recycle columns must be determined based upon column
energy requirement and potential yield losses of benzene (in the overhead of the
stabilizer and recycle columns) and toluene (in the base of the recycle column).

53
Figure 4.5 Reference control structure (CS1) of HDA process

54
Figure 4.6 Designed control structure (CS2) of HDA process

55
Figure 4.7 Enlarged designed control structure (CS2) of HDA process

56
Figure 4.7 Enlarged designed control structure (CS2) of HDA process (cont.)

57
Figure 4.8 Designed control structure (CS3) of HDA process
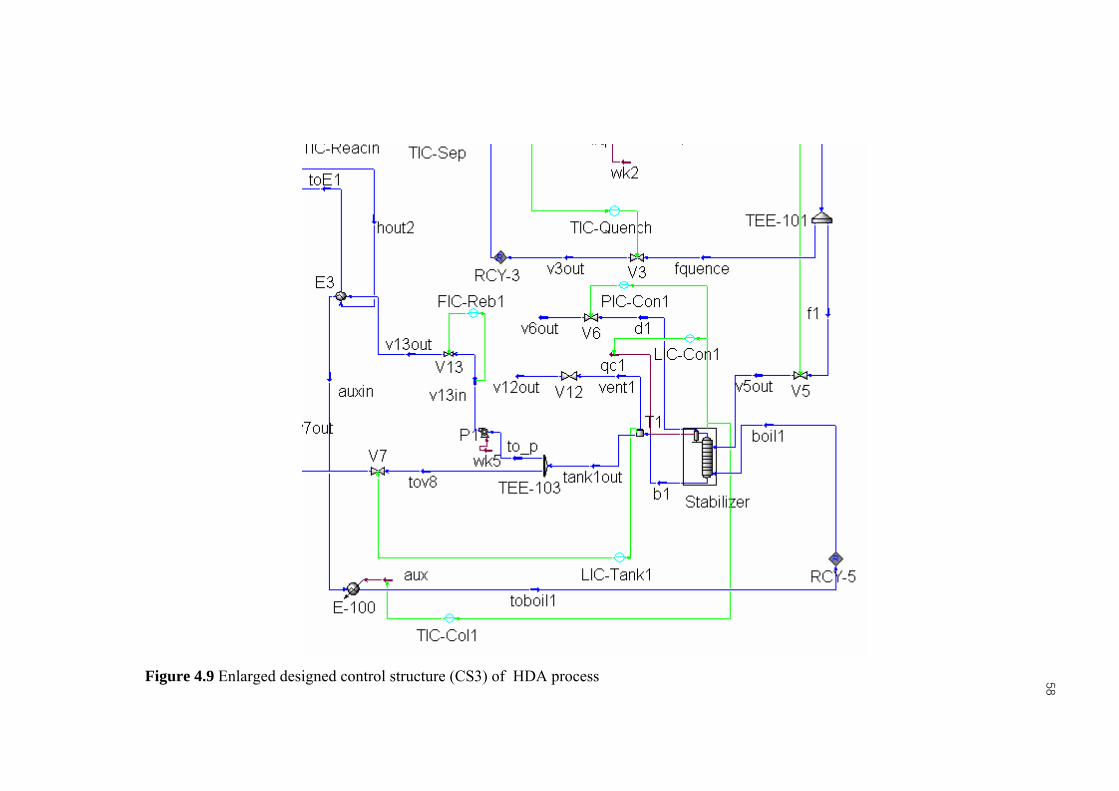
58
Figure 4.9 Enlarged designed control structure (CS3) of HDA process

59
Figure 4.10 Designed control structure (CS4) of HDA process

60
Figure 4.11 Enlarged designed control structure (CS4) of HDA process

61
Figure 4.12 Designed control structure (CS5) of HDA process

62
Figure 4.13 Enlarged designed control structure (CS5) of HDA process

63
Figure 4.14 Designed control structure (CS6) of HDA process

64
Figure 4.15 Enlarged designed control structure (CS6) of HDA process

65
4.5 Control Structure Alternatives
For HDA process alternative 1, Kietawarin (2002) designed 3 control
structures to reduce the effects of disturbances in order to achieve a desired
production rate. The first control scheme measured toluene flow rate in the process
and adjusted the fresh toluene feed rate accordingly. The second was modified from
the first scheme by adding a cooling unit to control the outlet temperature of the
reactor. In the third scheme, a ratio control was introduced to the second control
scheme for controlling the ratio of hydrogen and toluene within the process. These
three control structures were compared with reference on plantwide process control
book by Luyben (1998), the result show that performances of Kietawarin’s structures
were better than Luyben’s structures.
4.5.1 Comparison dynamic responses between this work with reference
The disturbance testing is used to compare the dynamic response of this
simulation (HYSYS) with Kietawarin (2002; Aspen plus) and Luyben (1998;
TMODS, 2002; HYSYS). By step change in reactor inlet temperature setpoint
(increase 5 oF) and step change in total toluene flowrate (decrease 15%).
Figure 4.16 Comparison dynamic responses of step change in total toluene flowrate
(decrease 15%) between: (A) this work, (B) Kietawarin, (C) Luyben
(A) (B) (C)

66
Figure 4.16 Comparison dynamic responses of step change in total toluene flowrate
(decrease 15%) between: (A) this work, (B) Kietawarin, (C) Luyben (cont.)
Figure 4.17 Comparison dynamic responses of step change in reactor inlet
temperature setpoint (increase 5 oF) between: (A) this work, (B) Luyben
In this current work, we apply the first control structure of Kietawarin (2002),
namely control structure 1 (CS1) to the HDA process alternative 1 as shown in Figure
4.5. The new plantwide control structures CS2 to CS6 are designed for the HDA
process alternative 3 as shown in Figure 4.6 to 4.15 respectively. In all of these
control structures, the same loops are used as follows:
(A) (B) (C)
(A) (B)

67
• Valve V1 is manipulated to control separator pressure.
• Valve V2 is manipulated to control total toluene flow.
• Valve V3 is manipulated to control quench temperature.
• Valve V4 is manipulated to control methane in the recycle gas.
• Valve V5 is manipulated to control separator level.
• Valve V6 is manipulated to control column1 pressure.
• Valve V8 is manipulated to control column2 condenser level.
• Valve V10 is manipulated to control column3temperature.
• Cooler duty is manipulated to control separator temperature.
• Furnace duty is manipulated to control reactor inlet temperature.
• Column1 condenser duty is manipulated to control level of column1
condenser.
• Column2 condenser duty is manipulated to control column2 pressure.
• Column3 reboiler duty is manipulated to control level of column3 reboiler.
The main difference between CS1, CS2 to CS6 are explained below:
4.5.2 Reference control structure (CS1)
Based on Fig. 4.5, valve V7 is manipulated to control column1 reboiler level,
column1 reboiler duty is manipulated to control column1 temperature; valve V9 is
manipulated to control column2 reboiler level; column1 reboiler duty is manipulated
to control column2 temperature; valve V11 is manipulated to control column3
condenser level; column3 condenser duty is manipulated to control column3 pressure.
• Increase temperature
The starting conditions are the base-case design where reactor inlet
temperature is 1150 oF. Step change of 10 oF increasing at time 10 minute is made in
the setpoint of the reactor inlet temperature controller.
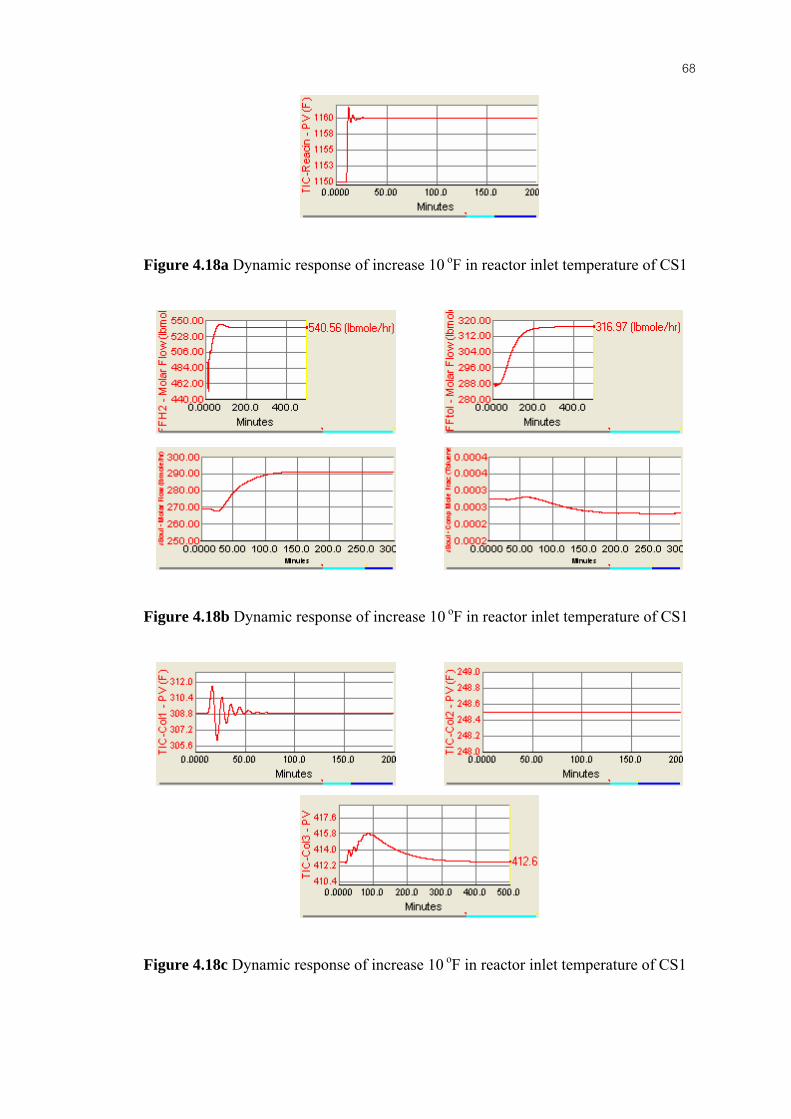
68
Figure 4.18a Dynamic response of increase 10 oF in reactor inlet temperature of CS1
Figure 4.18b Dynamic response of increase 10 oF in reactor inlet temperature of CS1
Figure 4.18c Dynamic response of increase 10 oF in reactor inlet temperature of CS1

69
Figure 4.18a gives simulation result for decreasing the reactor inlet
temperature. The temperature response is oscillatory and it comes to new setpoint
within 20 minutes. Effect from the temperature increase, the rate of reaction of HDA
increase because of increasing temperature can raise the reaction rate. Figure 4.18b
show the fresh feed H2, toluene, benzene product flow, and toluene impurity in
product responses. Fresh feed H2, toluene, benzene product flow are slowly increased
about 120 minute to new steady-state due reaction rate increasing. But toluene
impurity in product is slowly decreased because of increasing temperature increase
conversion of toluene to benzene.
Figure 4.18c show the temperature control in 3 distillation columns. The
temperature response of stabilizer column is oscillatory and it comes to setpoint
within 50 minutes. The temperature response of product column does not see the
changing. But recycle column takes long time to achieve setpoint.
• Decrease total toluene flowrate
Step change of 15 % decreasing at time 10 minute is made in the setpoint of the
total toluene flowrate controller.
Figure 4.19a Dynamic response of decrease 15 % in total toluene flowrate of CS1
Figure 4.19b Dynamic response of decrease 15 % in total toluene flowrate of CS1

70
Figure 4.19b Dynamic response of decrease 15 % in total toluene flowrate of CS1
(cont.)
Figure 4.19c Dynamic response of decrease 15 % in total toluene flowrate of CS1
Figure 4.19a gives the dynamic response of the process for a 15% decrease in
the total toluene flowrate. This flow quickly responses within 10 minute. This step
change affects to the fresh feed H2, toluene, benzene product flow, and toluene
impurity in product. They slowly decrease because decrease total toluene flowrate
affect to the production rate and toluene impurity in product decrease due to reduction
toluene in the process as show in figure 4.19b.
Figure 4.19c show the temperature control in 3 distillation columns. The
temperature response of stabilizer column is oscillatory and it comes to setpoint
within 100 minutes. The temperature response of product column is slight change. But
recycle column takes long time to achieve setpoint.
71
4.5.3 Design Control Structure I (CS2)
This control structure uses bypass method to control the tray temperature in
column1 (Figure 4.6-7). We measure column1 temperature and bypass on the cold
side of heat exchanger since this side has flowrates less than the hot side. That small
bypass flow has minimized the exchanger and control valve size. Valve V7 is
manipulated to control column1 accumulate tank level; valve on the bypass line of E3
valve is manipulated to control column1 temperature; V9 is manipulated to control
column2 tank level, auxiliary E4 duty is manipulated to control column2 temperature,
valve V11 is manipulated to control column3 tank level, bypass valve of E5 is
manipulated to control pressure in column3. In order to accommodate the liquid from
the bottoms of stabilizer and product column, and the condensed vapor from the top
of recycle column, three tanks are installed in the HDA process alternative 3.
• Increase temperature
Step change of 5 oF increasing at time 10 minute is made in the setpoint of the
reactor inlet temperature controller.
Figure 4.20a gives simulation result for decreasing the reactor inlet
temperature. This control structure can handle the changing of step change in inlet
temperature only 5 oF due to limiting of bypass. The temperature response is
oscillatory and it comes to new setpoint within 30 minutes. Effect from the
temperature increase, the rate of reaction of HDA increase because of increasing
temperature can raise the reaction rate. Figure 4.20b show the fresh feed H2, toluene,
benzene product flow, and toluene impurity in product responses. Fresh feed H2,
toluene, benzene product flow are slowly increased about 200 minute to new steady-
state due reaction rate increasing. But toluene impurity in product is slowly decreased
because of increasing temperature increase conversion of toluene to benzene.
Figure 4.20c show the temperature control in 3 distillation columns. The
temperature response of these three columns like as CS1 but stabilizer column can
handle disturbance only 5 oF.

72
Figure 4.20a Dynamic response of increase 5 oF in reactor inlet temperature of CS2
Figure 4.20b Dynamic response of increase 5 oF in reactor inlet temperature of CS2
Figure 4.20c Dynamic response of increase 5 oF in reactor inlet temperature of CS2

73
• Decrease total toluene flowrate
Step change of 10 % decreasing at time 10 minute is made in the setpoint of the total
toluene flowrate controller.
Figure 4.21a Dynamic response of decrease 10 % in total toluene flowrate of CS2
Figure 4.21a gives the dynamic response of the process for a 10% decrease in
the total toluene flowrate. This flow quickly responses within 10 minute. This step
change affects to the fresh feed H2, toluene, benzene product flow, and toluene
impurity in product. They slowly decrease because decrease total toluene flowrate
affect to the production rate and toluene impurity in product decrease due to reduction
toluene in the process as show in figure 4.19b.
Figure 4.19c show the temperature control in 3 distillation columns. The
temperature response of stabilizer column is oscillatory and it slowly comes to
setpoint within 100 minutes. The temperature response of product column is slight
change. But recycle column takes long time to achieve setpoint.
Figure 4.21b Dynamic response of decrease 10 % in total toluene flowrate of CS2

74
Figure 4.21b Dynamic response of decrease 10 % in total toluene flowrate of CS2
(cont.)
Figure 4.21c Dynamic response of decrease 10 % in total toluene flowrate of CS2
4.5.4 Design Control Structure II (CS3)
This control structure adopts Ploypaisansang’s study (2003); the auxiliary
reboiler is additionally installed in the stabilizer to control its tray temperature (Figure
4.8-9). The other control structures are the same as CS2.
• Increase temperature
Step change of 10 oF increasing at time 10 minute is made in the setpoint of the
reactor inlet temperature controller.

75
Figure 4.22 show the dynamic response of the process for 10 oF increase. The
dynamic response of these control structure same as CS2 but can handle more
disturbance and faster than CS2.
Figure 4.22a Dynamic response of increase 10 oF in reactor inlet temperature of CS3
Figure 4.22b Dynamic response of increase 10 oF in reactor inlet temperature of CS3.
Figure 4.22c Dynamic response of increase 10 oF in reactor inlet temperature of CS3

76
Figure 4.22c Dynamic response of increase 10 oF in reactor inlet temperature of CS3
(cont.)
• Decrease total toluene flowrate
Step change of 15 % decreasing at time 10 minute is made in the setpoint of the total
toluene flowrate controller.
Figure 4.22 show the dynamic response of the process for 15 % decrease. The
dynamic response of these control structure same as CS2 but can handle more disturb
and faster than CS2.
Figure 4.23a Dynamic response of decrease 15 % in total toluene flowrate of CS3
Figure 4.23b Dynamic response of decrease 15 % in total toluene flowrate of CS3

77
Figure 4.23b Dynamic response of decrease 15 % in total toluene flowrate of CS3
(cont.)
Figure 4.23c Dynamic response of decrease 15 % in total toluene flowrate of CS3
4.5.5 Design Control Structure III (CS4)
This control structure develops from CS3. Due to both column3 reboiler duty
which is manipulated to control level of column3 reboiler and valve V10 which is
manipulated to control column3 temperature obtain poor performance. Because of
boilup ratio is not high enough. So this control structure switches these two variables
as show in figure 4.10-11.
• Increase temperature
Step change of 10 oF increasing at time 10 minute is made in the setpoint of the
reactor inlet temperature controller.
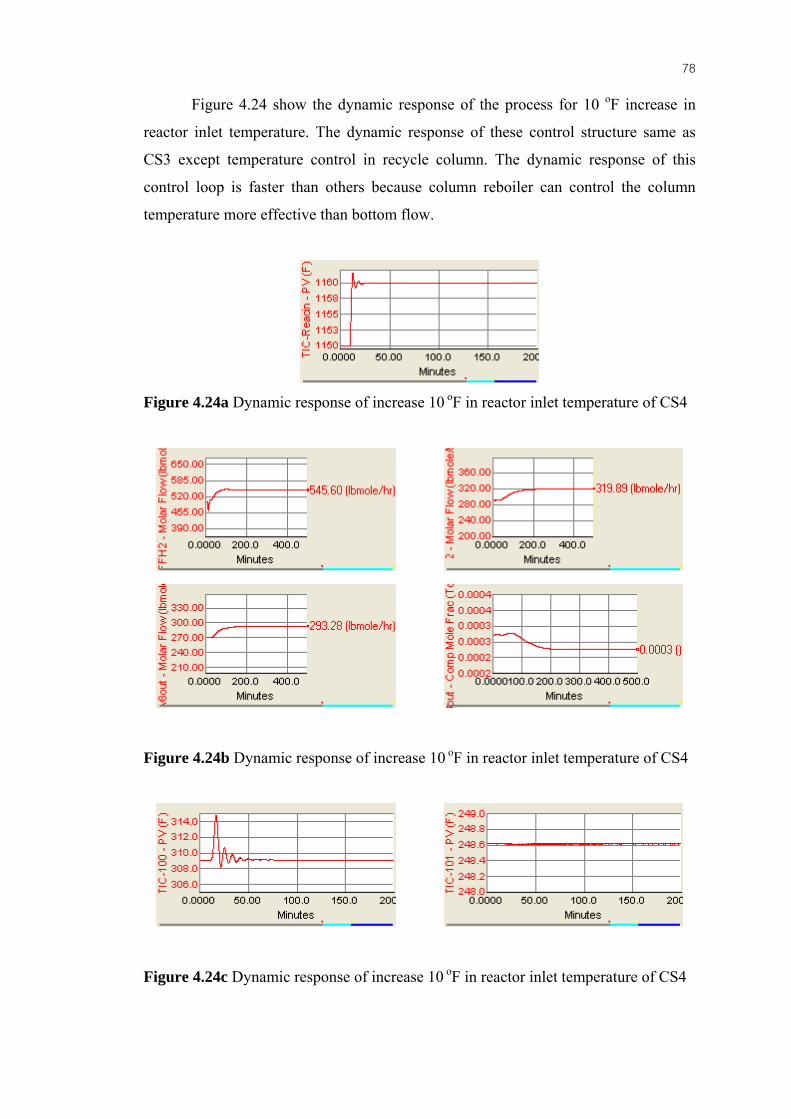
78
Figure 4.24 show the dynamic response of the process for 10 oF increase in
reactor inlet temperature. The dynamic response of these control structure same as
CS3 except temperature control in recycle column. The dynamic response of this
control loop is faster than others because column reboiler can control the column
temperature more effective than bottom flow.
Figure 4.24a Dynamic response of increase 10 oF in reactor inlet temperature of CS4
Figure 4.24b Dynamic response of increase 10 oF in reactor inlet temperature of CS4
Figure 4.24c Dynamic response of increase 10 oF in reactor inlet temperature of CS4

79
Figure 4.24c Dynamic response of increase 10 oF in reactor inlet temperature of CS4
(cont.)
• Decrease total toluene flowrate
Step change of 15 % decreasing at time 10 minute is made in the setpoint of the total
toluene flowrate controller.
Figure 4.25 show the dynamic response of the process for 15 % decrease in
total toluene flowrate. The dynamic response of these control structure same as CS3
except temperature control in recycle column. The dynamic response of this control
loop faster than others.
Figure 4.25a Dynamic response of decrease 15 % in total toluene flowrate of CS4
Figure 4.25b Dynamic response of decrease 15 % in total toluene flowrate of CS4
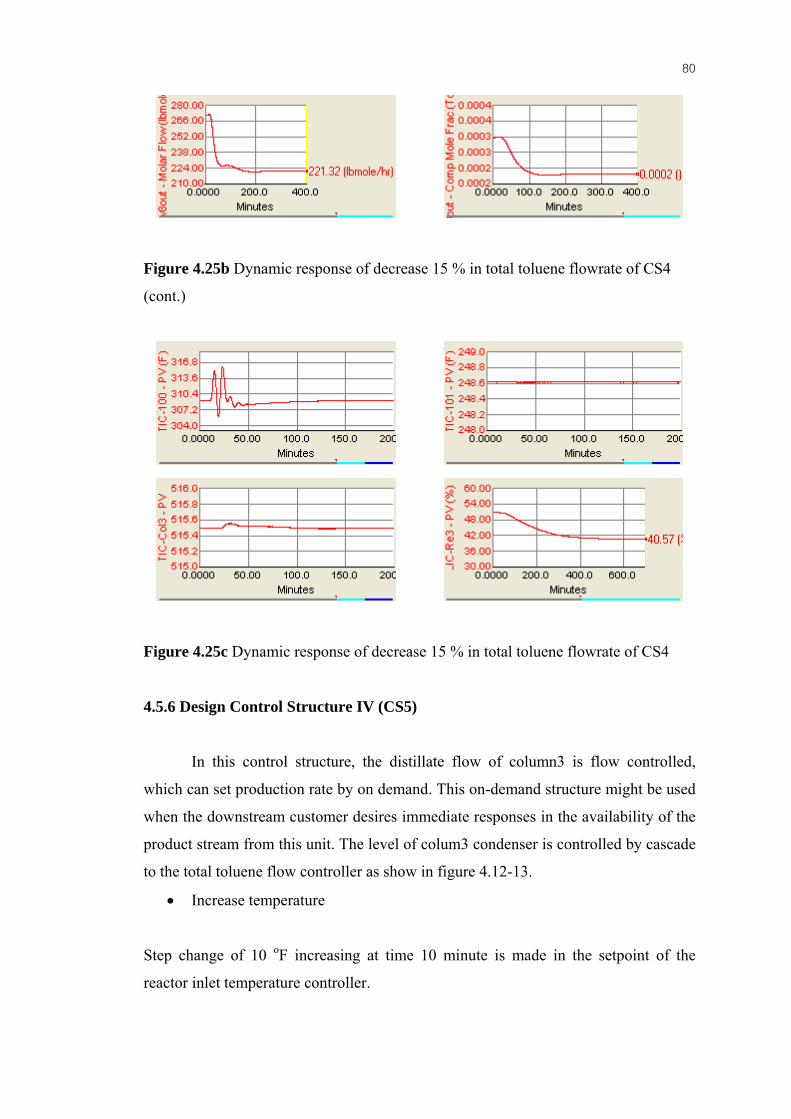
80
Figure 4.25b Dynamic response of decrease 15 % in total toluene flowrate of CS4
(cont.)
Figure 4.25c Dynamic response of decrease 15 % in total toluene flowrate of CS4
4.5.6 Design Control Structure IV (CS5)
In this control structure, the distillate flow of column3 is flow controlled,
which can set production rate by on demand. This on-demand structure might be used
when the downstream customer desires immediate responses in the availability of the
product stream from this unit. The level of colum3 condenser is controlled by cascade
to the total toluene flow controller as show in figure 4.12-13.
• Increase temperature
Step change of 10 oF increasing at time 10 minute is made in the setpoint of the
reactor inlet temperature controller.

81
Figure 4.26a Dynamic response of increase 10 oF in reactor inlet temperature of CS5
Figure 4.26a gives simulation result for decreasing the reactor inlet
temperature. The temperature response is oscillatory and it comes to new setpoint
within 20 minutes. Effect from the temperature increase, the rate of reaction of HDA
increase because of increasing temperature can raise the reaction rate. But this control
structure fix production rate, so this disturbance does not affect to benzene product
flow. Figure 4.18b show the fresh feed H2, toluene, benzene product flow, and toluene
impurity in product responses. Fresh feed H2, and toluene are slightly increased about
1% at new steady-state due reaction rate increasing but production rate of benzene is
fixed. And toluene impurity in product is more decreased than other control structure
because of increasing temperature increase conversion of toluene to benzene at almost
constant feed.
Figure 4.26b Dynamic response of increase 10 oF in reactor inlet temperature of CS5
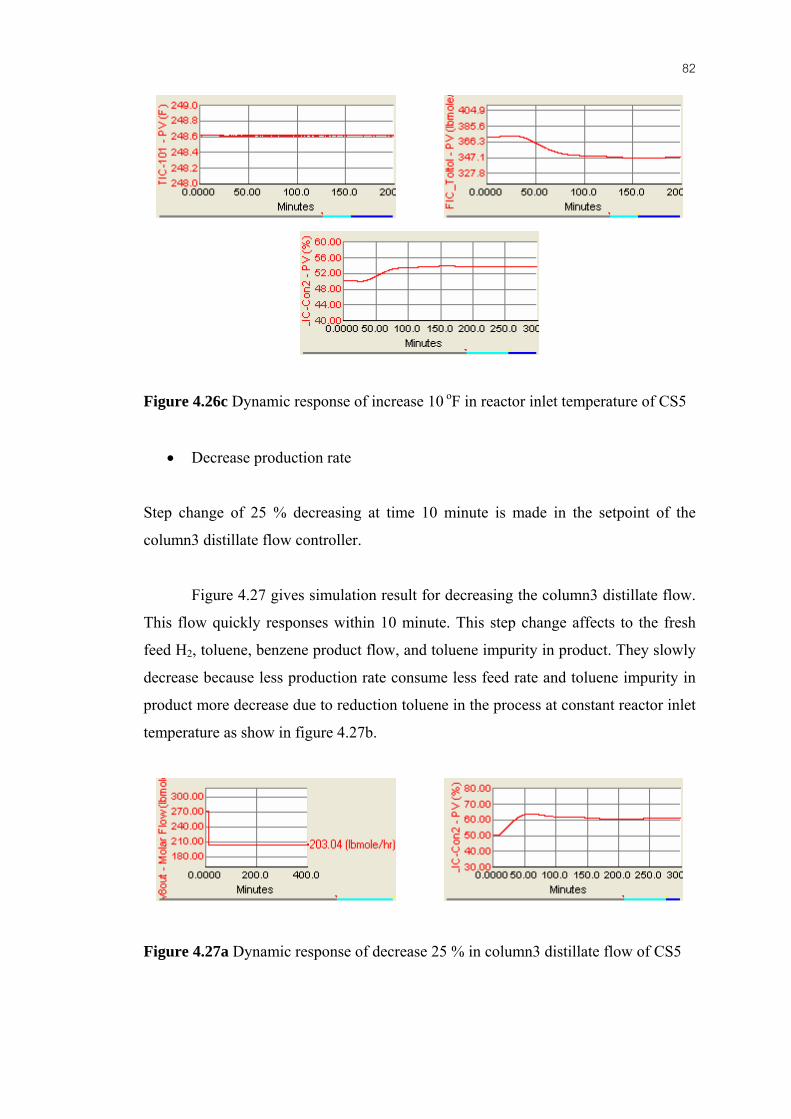
82
Figure 4.26c Dynamic response of increase 10 oF in reactor inlet temperature of CS5
• Decrease production rate
Step change of 25 % decreasing at time 10 minute is made in the setpoint of the
column3 distillate flow controller.
Figure 4.27 gives simulation result for decreasing the column3 distillate flow.
This flow quickly responses within 10 minute. This step change affects to the fresh
feed H2, toluene, benzene product flow, and toluene impurity in product. They slowly
decrease because less production rate consume less feed rate and toluene impurity in
product more decrease due to reduction toluene in the process at constant reactor inlet
temperature as show in figure 4.27b.
Figure 4.27a Dynamic response of decrease 25 % in column3 distillate flow of CS5

83
Figure 4.27a Dynamic response of decrease 25 % in column3 distillate flow of CS5
(cont.)
Figure 4.27b Dynamic response of decrease 25 % in column3 distillate flow of CS5
Figure 4.27c Dynamic response of decrease 25 % in column3 distillate flow of CS5

84
Figure 4.27c show the temperature control in 3 distillation columns. The
temperature response of stabilizer column and recycle are oscillatory and it slowly
comes to setpoint within 200 minutes as a result of slowly change in total flowrate
(cascade from level control of product column). The temperature response of product
column is slight change.
4.5.7 Design Control Structure V (CS6)
This control structure used valve position control concept Luyben (1990)
which can reduce energy-cost of utility. In this control structure both valve bypart of
column1 heat exchanger and column1 auxiliary heater is used to control tray
temperature of stabilizer column. When valve bypart decrease to 5% open but
temperature cannot achieve to its setpoint the auxiliary will operate to control
temperature as show in figure 4.14-15.
• Increase temperature
Step change of 10 oF increasing at time 10 minute is made in the setpoint of the
reactor inlet temperature controller.
Figure 4.28a Dynamic response of increase 10 oF in reactor inlet temperature of CS6
Figure 4.28b Dynamic response of increase 10 oF in reactor inlet temperature of CS6
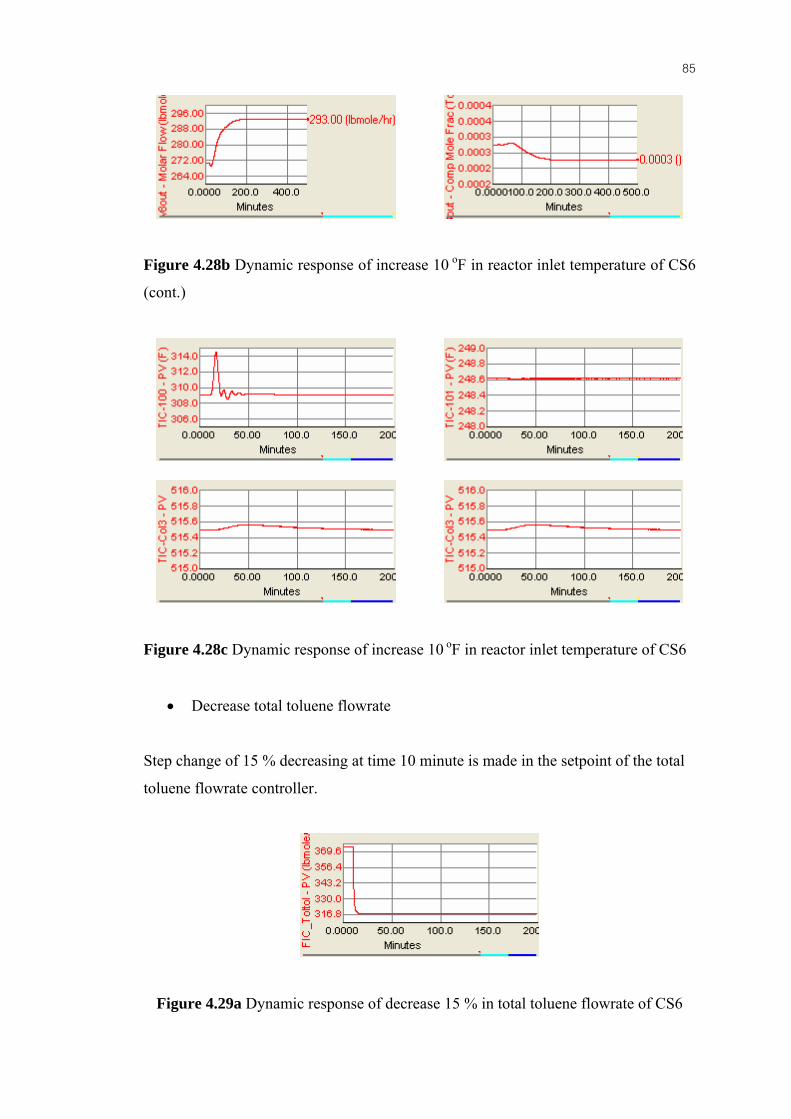
85
Figure 4.28b Dynamic response of increase 10 oF in reactor inlet temperature of CS6
(cont.)
Figure 4.28c Dynamic response of increase 10 oF in reactor inlet temperature of CS6
• Decrease total toluene flowrate
Step change of 15 % decreasing at time 10 minute is made in the setpoint of the total
toluene flowrate controller.
Figure 4.29a Dynamic response of decrease 15 % in total toluene flowrate of CS6

86
Figure 4.29b Dynamic response of decrease 15 % in total toluene flowrate of CS6
Figure 4.29c Dynamic response of decrease 15 % in total toluene flowrate of CS6
(cont.)
Figure 4.28 and 4.29 show the dynamic responses of the process for 10 oF
increase in reactor inlet temperature and 15 % decrease in total toluene flowrate. The
dynamic response of these control structure same as CS4. Because this control
structure modifies CS2 and CS4 to optimize energy cost.
The integral absolute error (IAE) for the six control structures are summarized
in table 4.3.

87
Table 4.3a Integral absolute error of the five control structures when decrease total
toluene flowrate.
Decrease Total Toluene Flowrate5%
CS1 CS2 CS3 CS4 CS6 f_tottol *16.7046 16.8467 17.0188 16.9606 16.782t_col1 33.8958 *31.4283 41.8548 46.1904 41.7358t_col2 *0.0573 0.083 0.1113 0.1147 0.0761t_col3 123.6263 130.6594 134.1722 0.7981 *0.7705t_quench *3.6525 4.7158 3.71 3.7017 4.0008t_reacin *5.7933 8.2733 6.49 6.5133 7.63t_sep 25.3622 18.6854 *17.0026 17.0501 18.1923x_gasre *0.5583 0.835 0.837 0.837 0.8242total 209.6503 211.5269 221.1967 92.1659 *90.0117
Decrease Total Toluene Flowrate10%
CS1 CS2 CS3 CS4 CS6 f_tottol 32.5632 *32.4208 33.4078 33.2332 32.7979t_col1 *63.3114 111.7511 76.3328 74.9459 83.8908t_col2 *0.102 0.1326 0.1536 0.1627 0.1357t_col3 233.5163 245.7238 252.7919 1.5478 *1.5442t_quench *6.9958 8.19 7.2383 7.2283 7.8375t_reacin *11.4442 14.6075 12.6792 12.6758 14.7333t_sep 50.5375 35.1886 33.9293 *33.8712 36.3393x_gasre *1.1253 1.6839 1.6931 1.693 1.6735total 399.5957 449.6983 418.226 *165.3579 178.9522
Decrease Total Toluene Flowrate15%
CS1 CS2 CS3 CS4 CS6 f_tottol *47.5824 - 49.3356 49.0594 48.0783t_col1 108.1415 - 102.1855 *101.2128 124.6101t_col2 *0.1378 - 0.1856 0.1925 0.1683t_col3 330.1441 - 357.2563 2.2746 *2.2712t_quench *10.1958 - 10.3275 10.3175 11.1308t_reacin *16.9225 - 18.7 18.7183 21.305t_sep 75.6252 - 50.8318 *50.747 55.135x_gasre 1.7033 - 2.5696 2.5695 2.5532total 590.4526 - 591.3919 *235.0916 265.2519

88
Table 4.3b Integral absolute error of the five control structures when increase total
toluene flowrate.
Increase Total Toluene Flowrate 5%
CS1 CS2 CS3 CS4 CS6 f_tottol 17.6216 18.5244 17.6693 17.5872 *17.4712t_col1 *31.2903 32.1093 36.2457 37.141 34.9958t_col2 0.0654 0.063 0.0989 0.0945 *0.0593t_col3 138.4164 145.0308 150.473 0.8162 *0.7933t_quench *3.7617 6.3492 4.01 4.0058 4.6t_reacin *5.9883 9.9975 6.4458 6.4442 7.7133t_sep 25.4712 *18.364 16.8936 16.8804 18.0287x_gasre *0.553 0.8106 0.824 0.8239 0.8112total 223.1679 231.2488 232.6603 *83.7932 84.4728
Increase Total Toluene Flowrate 10%
CS1 CS2 CS3 CS4 CS6 f_tottol 36.1991 37.8617 36.2349 *36.0877 36.123t_col1 *62.5587 62.6406 73.9282 74.02 68.8108t_col2 0.1079 0.0987 0.1429 0.1384 *0.0915t_col3 292.7522 306.8865 318.7847 1.6536 *1.6299t_quench *7.725 13.2742 8.1475 8.1575 10.1t_reacin *12.2783 20.4533 13.2408 13.2167 16.3017t_sep 51.0894 35.8922 33.8655 *33.8014 35.9378x_gasre *1.1038 1.6114 1.6401 1.6401 1.6194total 463.8144 478.7186 485.9846*168.7154 170.6141
Increase Total Toluene Flowrate15%
CS1 CS2 CS3 CS4 CS6 f_tottol 55.779 - 55.6679 *55.4633 55.9842t_col1 *94.9682 - 115.128 115.2549 104.372t_col2 0.1449 - 0.1537 0.162 *0.1192t_col3 463.4428 - 504.9943 *2.5165 2.5192t_quench *11.9392 - 12.6158 12.5808 16.1333t_reacin *18.7442 - 20.1783 20.1658 25.3567t_sep 76.6733 - 50.7173 *50.6305 51.2618x_gasre *1.6545 - 2.4517 2.4516 2.4379total 723.3461 - 761.907 259.2254 *258.1843
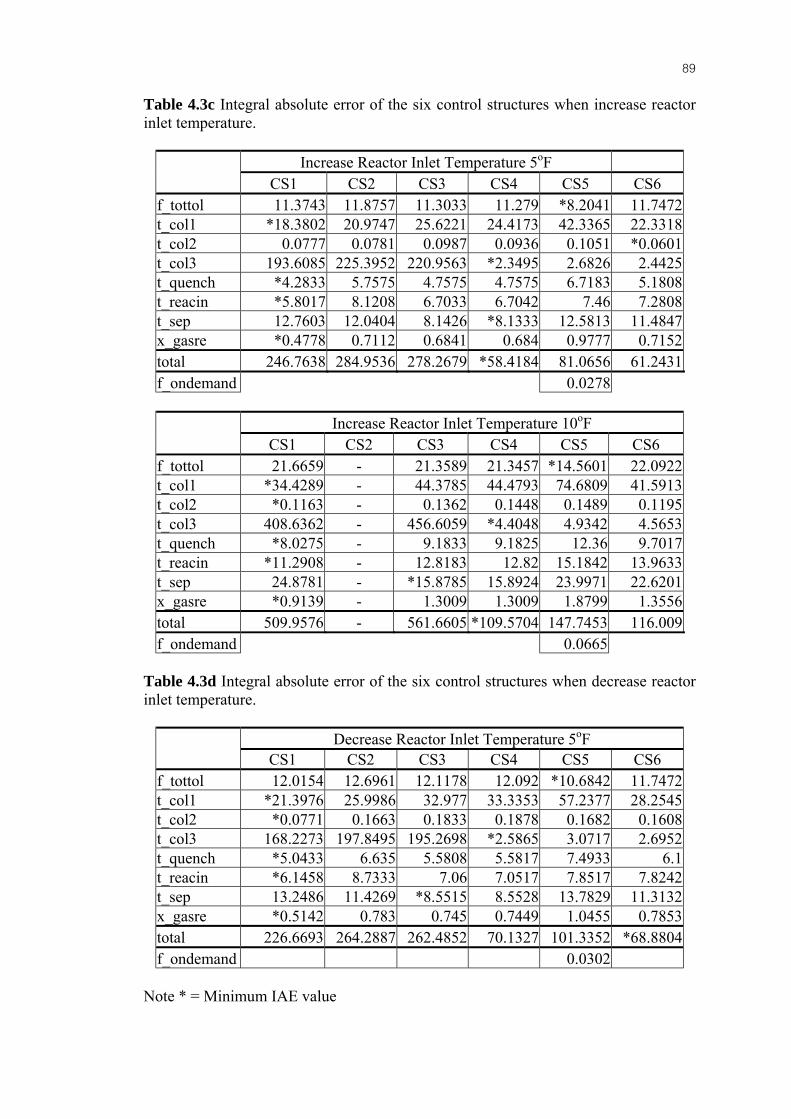
89
Table 4.3c Integral absolute error of the six control structures when increase reactor inlet temperature.
Increase Reactor Inlet Temperature 5oF CS1 CS2 CS3 CS4 CS5 CS6
f_tottol 11.3743 11.8757 11.3033 11.279 *8.2041 11.7472t_col1 *18.3802 20.9747 25.6221 24.4173 42.3365 22.3318t_col2 0.0777 0.0781 0.0987 0.0936 0.1051 *0.0601t_col3 193.6085 225.3952 220.9563 *2.3495 2.6826 2.4425t_quench *4.2833 5.7575 4.7575 4.7575 6.7183 5.1808t_reacin *5.8017 8.1208 6.7033 6.7042 7.46 7.2808t_sep 12.7603 12.0404 8.1426 *8.1333 12.5813 11.4847x_gasre *0.4778 0.7112 0.6841 0.684 0.9777 0.7152total 246.7638 284.9536 278.2679 *58.4184 81.0656 61.2431f_ondemand 0.0278
Increase Reactor Inlet Temperature 10oF
CS1 CS2 CS3 CS4 CS5 CS6 f_tottol 21.6659 - 21.3589 21.3457 *14.5601 22.0922t_col1 *34.4289 - 44.3785 44.4793 74.6809 41.5913t_col2 *0.1163 - 0.1362 0.1448 0.1489 0.1195t_col3 408.6362 - 456.6059 *4.4048 4.9342 4.5653t_quench *8.0275 - 9.1833 9.1825 12.36 9.7017t_reacin *11.2908 - 12.8183 12.82 15.1842 13.9633t_sep 24.8781 - *15.8785 15.8924 23.9971 22.6201x_gasre *0.9139 - 1.3009 1.3009 1.8799 1.3556total 509.9576 - 561.6605 *109.5704 147.7453 116.009f_ondemand 0.0665
Table 4.3d Integral absolute error of the six control structures when decrease reactor inlet temperature.
Decrease Reactor Inlet Temperature 5oF CS1 CS2 CS3 CS4 CS5 CS6
f_tottol 12.0154 12.6961 12.1178 12.092 *10.6842 11.7472t_col1 *21.3976 25.9986 32.977 33.3353 57.2377 28.2545t_col2 *0.0771 0.1663 0.1833 0.1878 0.1682 0.1608t_col3 168.2273 197.8495 195.2698 *2.5865 3.0717 2.6952t_quench *5.0433 6.635 5.5808 5.5817 7.4933 6.1t_reacin *6.1458 8.7333 7.06 7.0517 7.8517 7.8242t_sep 13.2486 11.4269 *8.5515 8.5528 13.7829 11.3132x_gasre *0.5142 0.783 0.745 0.7449 1.0455 0.7853total 226.6693 264.2887 262.4852 70.1327 101.3352 *68.8804f_ondemand 0.0302
Note * = Minimum IAE value

The energy consumption at steady state of the six control structures are summarized in table 4.4.
Table 4.4 The energy consumption of the six control structures
Heat Flow (Btu/hr) CS1 CS2 CS3 CS4 CS5 CS6 Furnace Duty 3.14E+06 5.52E+06 5.33E+06 5.33E+06 5.33E+06 5.51E+06 Cooler Duty 9.03E+06 7.43E+06 8.08E+06 8.08E+06 8.06E+06 7.46E+06
Column1 Condenser Duty 3.86E+05 3.86E+05 3.86E+05 3.86E+05 3.87E+05 3.86E+05 Column1 Reboiler Duty 4.30E+06 - - - -
Column2 Condenser Duty 1.36E+07 1.36E+07 1.37E+07 1.37E+07 1.37E+07 1.36E+07 Column2 Reboiler Duty 1.16E+07 1.03E+07 1.03E+07 1.03E+07 1.03E+07 1.03E+07
Column3 Condenser Duty 1.52E+06 - - - - Column3 Reboiler Duty 1.62E+06 1.86E+06 1.84E+06 1.84E+06 1.84E+06 1.85E+06
Auxiliary Duty - - 8.20E+05 8.19E+05 8.19E+05 4.57E+04 Total 4.52E+07 3.91E+07 4.04E+07 4.05E+07 4.04E+07 3.92E+07

CHAPTER V
CONCLUSIONS AND RECCOMMENDATIONS 5.1 Conclusion
Most industrial processes contain a complex flowsheet with several recycle
streams, energy integration, and many different unit operations. The economic can be
improved by introducing recycle streams and energy integration into the process.
However, the recycle streams and energy integration introduce a feedback of material and
energy among units upstream and downstream. Therefore, strategies for plantwide
control are required to operate an entire plant safely and achieve its design objectives.
Hydrodealkylation (HDA) process of toluene to benzene consists of a reactor, furnace,
vapor-liquid separator, recycle compressor, heat exchangers and distillations. This plant
is a realistic complex chemical process. It is considering that the energy integration for
realistic and large processes is meaningful and useful, it is essential to design a control
strategy for process associate with energy integration, so it can be operated well. For
HDA process alternative 1, three control structures designed by Kietawarin (2002) were
compared with Luyben (1998), the effects of disturbances could be reduced in order to
keep the production rate as desired value.
This work presents five plantwide designed control structures, the control results
of these alternative structures are compared with reference structure (Kietawarin; 2002,
Luyben; 1998 and 2002). The dynamic simulation of this process with various
disturbances is made to evaluate performance of each control structures: increasing and
decreasing the reactor inlet temperature, increasing and decreasing total toluene flowrate,
increasing and decreasing benzene production rate.
The result shows that the dynamic performance of hydrodealkylation of toluene
process deteriorates when the process incorporates complex heat integration. However it
can reduce energy cost and can be operated well by use plantwide methodology to design

92
control structure. The dynamic responses of the proposed control structures compared
with the reference are similar. CS2 has been limited in bypass, so it can handle in small
disturbance. CS3 which is improved from CS2 is able to handle more disturbances by
using auxiliary instead of bypass valve to control stabilizer column temperature. CS4
obtain faster response of temperature of recycle column than the other column because
the column temperature is able to be controlled via using reboiler duty more effectively
than the bottom flow rate. CS5 on-demand structure advantage when the downstream
customer desires immediate responses in the availability of the product stream from this
unit. For CS6, the dynamic responses are same as other but it use energy less than CS1
and CS4. Because this control structure, CS6, is modified from CS2 and CS4 to optimize
energy cost.
The performance of these control structures can be arranged from the best to
lowest performance (error of controllability point of view) as the following sequences:
CS4, CS6, CS5, CS1, CS3, and CS2. For Kietawarin’s control structures performance of
her structures are S2, S3, and S1 respectively.
Nowadays, hydrodealkylation of toluene process (HDA) is out of date; some
industry use disproportionation to produce benzene because this new process achieves
more economically. However control structures of this work still have usefulness because
they can be applied to any heat integrated-process.
5.2 Recommendations
1. Study and design the control structure of other complex heat-exchange
network of HDA or other process in plantwide control point of view.
2. Study and improve the methodology of MPC plantwide control of HDA
process.

REFERENCES
THAI
ไพศาล กิตติศุภกร. เอกสารคําสอนวิชา 2105-619 การควบคุมกระบวนการอัตโนมัติขึ้นสูง. ภาควชิา
วิศวกรรมเคมี จุฬาลงกรณมหาวิทยาลัย, 2545.
ENGLISH
Anton, A.; Costin, S.; Alexandre, C.; and Piet D.. State multiplicity in CSTR–
separator–recycle polymerisation systems. Chemical Engineering Science 57
(2002): 535 – 546.
Douglas, J. M.. Conceptual design of chemical processes. New York: McGraw-Hill,
1988.
Downs, J. J.;and Vogel, E. F.. A Plant-wide Industrial Process Control Problem.
Computers Chem. Eng. 17, 3 (1993): 245-255.
Groenendijk, A. J.; Dimian, A. C.; and Iedema, P. D.. Systems approach for
evaluating dynamics and plant wide control of complex plants. AIChE Journal
46 (2000): 133-145.
Kapilakarn; and Luyben, L.. Plantwide Control of Continuous Multiproduct
Processes:Three-Product Process. Ind. Eng. Chem. Res. 42 (2003): 2809-2825.
Kasemchainun, S. Plantwide Control Design of Vinyl Acetate Monomer Plant.
M.Eng. Chemical Engineering Chulalongkorn University, 2003.
94
Kietawarin, S. Control Structure Design Applied to Hydrodealkylation Process
Plantwide Control Problem. M.Eng. Chemical Engineering Chulalongkorn
University, 2002.
Kunlawaniteewat, J. Heat Exchanger Network Control Structure Design. M.Eng.
Chemical Engineering Chulalongkorn University, 2002.
Larsson, T.; Govatsmark, M. S.; Skogestad, S.; and Yu C. C.. Control Structure
Selection for Reactor, Separator, and Recycle Processes. Ind. Eng. Chem. Res.
42 (2003): 1225-1234.
Luyben, M. L.; Luyben, W. L.. Design and Control of a Complex Process Involving
Two Reaction Steps, Three Distillation Columns and Two Recycle Streams.
Ind. Eng. Chem. Res. 34 (1995): 3885-3898.
Luyben, M. L.; Tyreus, B. D.; and Luyben, W. L.. Analysis of Control Structures for
Reaction/Separation/Recycle Processes with Second-Order Reactions. Ind.
Eng. Chem. Res. 35, (1996): 758-771
Luyben, M. L.; Tyreus, B. D.; and Luyben, W. L.. Plantwide Control Design
Procedure. AIChE Journal. 43, 12 (1997): 3161-3174.
Luyben, M. L.; Bjorn, D. Tyreus; and Luyben, W. L.. Plantwide Process Control
New York: McGraw-Hill, 1999.
Luyben, W. L. Process Modeling, Simulation and Control for Chemical Engineers
New York: McGraw-Hill, 1990.
Luyben, W. L. Control of Outlet Temperature in Adiabatic Tubular Reactors Ind.
Eng. Chem. Res. 39 (2000): 1271-1278.

95
Luyben, W. L. Design and Control of Gas-Phase Reactor/Recycle Processes with
Reversible Exothermic Reactions Ind. Eng. Chem. Res. 39 (2000): 1529-1538.
Luyben, W. L. Getting More Information from Relay-Feedback Tests. Ind. Eng.
Chem. Res. 40 (2001): 4391-4402
Luyben, W. L. Plantwide Dynamic Simulation in Chemical Processing and Control
USA, Marcel Dekker, 2002.
Luyben, W. L.. Design and Control of Distillation Columns with Intermediate
Reboilers. Ind. Eng. Chem. Res. 43 (2004): 8244-8250.
Lyman, P. R.; and Georgakis, C.. Plantwide control of the Tennessee Eastman
problem. Comp. Chem. Eng. 19 (1995): 321-331.
Mayuresh, V.; Reuel; Irven; and Manfred. On Defining the Partial Control Problem:
Concepts and Examples. AIChE Journal 46, Issue 12 (2000): 2456-2474.
McAvoy, T.. Synthesis of plantwide control systems using optimization. Ind. Eng.
Chem. Res. 38 (1999): 2984-2994.
Ploypaisansang, A.. Resilient Heat Exchanger Network Design of Hydrodealkylation
Process. M.Eng. Chemical Engineering Chulalongkorn University, 2003.
Poothanakul, P.. Plantwide Control Design for a Butane Isomerization Process.
M.Eng. Chemical Engineering Chulalongkorn University, 2002.
Price, R. M.; Lyman, P. R.; and Georgakis, C.. Throughput manipulation in plantwide
control structures. Ind. Eng. Chem. Res. 33 (1994): 1197-1207.
Qiu, Q.F.; Rangaiah, G.P.;and Krishnaswamy, P.R.. Application of a plant-wide
control design to the HDA process. Comp. Chem. Eng. 27 (2003): 73-/94.

96
Reyes; and Luyben, W. L.. Design and Control of a Gas-Phase Adiabatic Tubular
Reactor Process with Liquid Recycle. Ind. Eng. Chem. Res. 40 (2001): 3762-
3774.
Shih, W. L.; Cheng, C. Y.. Design and Control for Recycle Plants with Heat-
Integrated Separators. Chemical Engineering Science. 59 (2004): 53 – 70.
Skogestad, S.; and Larsson, T.. A review of plantwide control Department of
Chemical Engineering, Norwegian University of Science and Technology.
(1998): 1-33.
Skogestad, S.. Control structure design for complete chemical plants. Comp. Chem.
Eng. 28 (2004): 219-234.
Tangsombutvisit, P. Evaluating Dynamics and Plantwide Control of
Hydrodealkylation Process. M.Eng. Chemical Engineering Chulalongkorn
University, 2003.
Terrill, D. L.; and Douglas, J. M.. Heat-Exchanger Network Analysis. 1.
Optimization. Ind. Eng. Chem. Res. 26 (1987): 685-691.
Vasbinder, E. M.; and Hoo, K. A.. Decision-Based Approach to Plantwide Control
Structure Synthesis Ind. Eng. Chem. Res. 42 (2003): 4586-4598.
Wang, P.; and McAvoy, T.. Synthesis of plantwide control systems using a dynamic
model and optimization. Ind. Eng. Chem. Res. 40 (2001): 5732-5742.
Wayne, R. Fisher; Michael, F.; Doherty; and James, M. Douglas. The Interface
between Design and Control. 1. Process Controllability. Ind. Eng. Chem. Res.
27, (1988): 597-605.
Wayne, R.; Fisher; Michael, F.; Doherty; and James, M. Douglas. The Interface
between Design and Control. 2. Process Operability. Ind. Eng. Chem. Res. 27,
(1988): 606-611.
97
Wayne, R.; Fisher; Michael, F.; Doherty; and James, M. Douglas. The Interface
between Design and Control. 3. Selecting a Set of Controlled Variables Ind.
Eng. Chem. Res. 27 (1988): 611-615.
Yi, C. K.; and Luyben, W. L.. Evaluation of plant-wide control structures by steady-
state disturbance sensitivity analysis. Ind. Eng. Chem. Res. 34 (1995): 2393-
2405.
Yih, H. Chen; and Cheng, C. Yu.. Design and Control of Heat-Integrated Reactors.
Ind. Eng. Chem. Res. 42 (2003): 2791-2808.

APPENDICES

99
APPENDIX A
Table A.1 Data of HDA process (alt. 1) for simulation
Name FFH2 v1out FFtol v2out Tottol Regas cout hin hout Vapour Fraction 1.0000 1.0000 0.0000 0.0000 0.0000 1.0000 1.0000 1.0000 0.9521 Temperature [oF] 86.0000 85.9936 86.0000 86.4137 136.7109 148.7124 1106.0765 1149.8994 228.7425 Pressure [psia] 605.0000 575.0000 635.0000 575.0000 575.0000 575.0000 512.9964 486.0030 480.0028 Molar Flow [lbmole/hr] 490.3800 490.3800 288.9999 288.9999 373.4282 3519.2000 4383.0082 4492.3479 4492.3479 Comp Mole Frac (Hydrogen) 0.970000 0.970000 0.000000 0.000000 0.000000 0.401969 0.431274 0.357993 0.357993 Comp Mole Frac (Methane) 0.030000 0.030000 0.000000 0.000000 0.000000 0.586840 0.474542 0.528375 0.528375 Comp Mole Frac (Benzene) 0.000000 0.000000 0.000000 0.000000 0.000146 0.009989 0.008033 0.086641 0.086641 Comp Mole Frac (Toluene) 0.000000 0.000000 1.000000 1.000000 0.999850 0.001201 0.086151 0.025194 0.025194 Comp Mole Frac (BiPhenyl) 0.000000 0.000000 0.000000 0.000000 0.000005 0.000000 0.000000 0.001796 0.001796 Name reacin condout gas liq purge gasre v3out v5out d1 Vapour Fraction 1.0000 0.8910 1.0000 0.0000 1.0000 1.0000 0.0000 0.0297 1.0000 Temperature [oF] 1150.0000 113.0000 113.0000 113.0000 113.0000 113.0000 113.8318 114.7485 123.8687 Pressure [psia] 503.0000 476.8033 476.8033 476.8033 476.8033 476.8033 485.9992 150.2591 150.0000 Molar Flow [lbmole/hr] 4383.0082 4492.3479 4002.5994 489.7485 483.3964 3519.2030 108.4994 381.2491 19.7295 Comp Mole Frac (Hydrogen) 0.431274 0.357993 0.401225 0.004670 0.401225 0.401225 0.004670 0.004670 0.090237 Comp Mole Frac (Methane) 0.474542 0.528375 0.587533 0.044890 0.587533 0.587533 0.044890 0.044890 0.867428 Comp Mole Frac (Benzene) 0.008033 0.086641 0.010071 0.712431 0.010071 0.010071 0.712431 0.712431 0.041999 Comp Mole Frac (Toluene) 0.086151 0.025194 0.001170 0.221539 0.001170 0.001170 0.221539 0.221539 0.000336 Comp Mole Frac (BiPhenyl) 0.000000 0.001796 0.000000 0.016470 0.000000 0.000000 0.016470 0.016470 0.000000
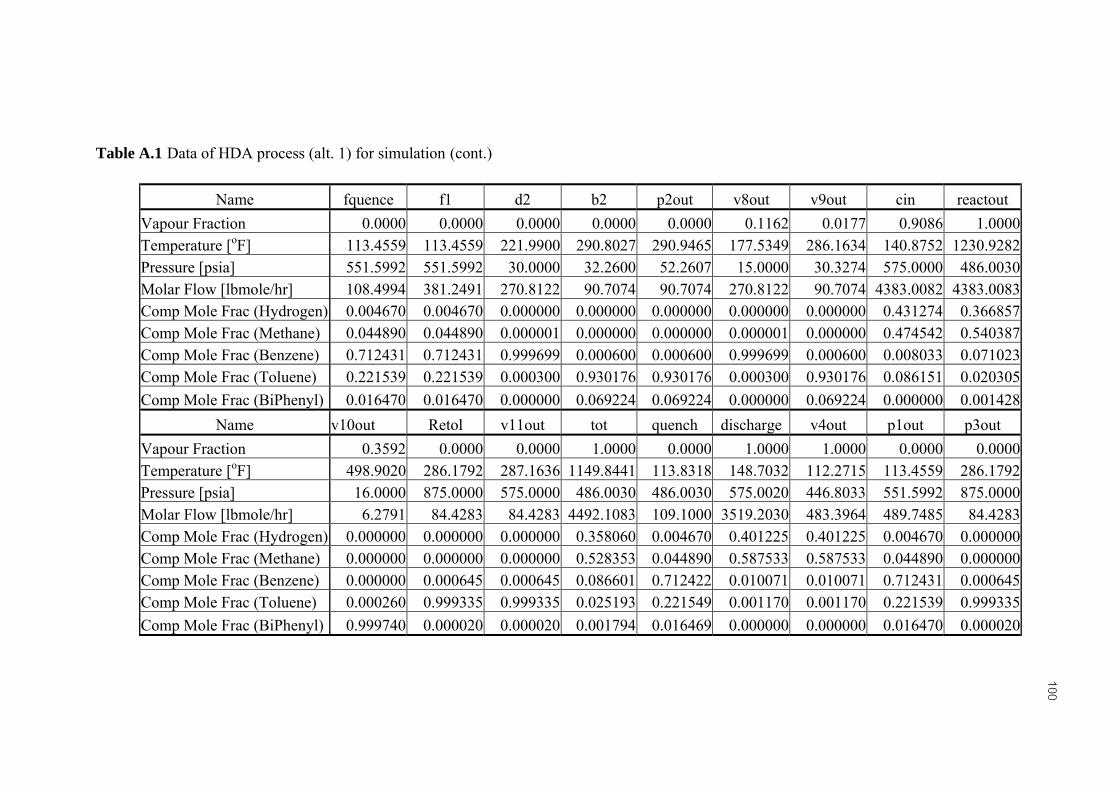
100
Table A.1 Data of HDA process (alt. 1) for simulation (cont.)
Name fquence f1 d2 b2 p2out v8out v9out cin reactout Vapour Fraction 0.0000 0.0000 0.0000 0.0000 0.0000 0.1162 0.0177 0.9086 1.0000 Temperature [oF] 113.4559 113.4559 221.9900 290.8027 290.9465 177.5349 286.1634 140.8752 1230.9282 Pressure [psia] 551.5992 551.5992 30.0000 32.2600 52.2607 15.0000 30.3274 575.0000 486.0030 Molar Flow [lbmole/hr] 108.4994 381.2491 270.8122 90.7074 90.7074 270.8122 90.7074 4383.0082 4383.0083 Comp Mole Frac (Hydrogen) 0.004670 0.004670 0.000000 0.000000 0.000000 0.000000 0.000000 0.431274 0.366857 Comp Mole Frac (Methane) 0.044890 0.044890 0.000001 0.000000 0.000000 0.000001 0.000000 0.474542 0.540387 Comp Mole Frac (Benzene) 0.712431 0.712431 0.999699 0.000600 0.000600 0.999699 0.000600 0.008033 0.071023 Comp Mole Frac (Toluene) 0.221539 0.221539 0.000300 0.930176 0.930176 0.000300 0.930176 0.086151 0.020305 Comp Mole Frac (BiPhenyl) 0.016470 0.016470 0.000000 0.069224 0.069224 0.000000 0.069224 0.000000 0.001428
Name v10out Retol v11out tot quench discharge v4out p1out p3out Vapour Fraction 0.3592 0.0000 0.0000 1.0000 0.0000 1.0000 1.0000 0.0000 0.0000 Temperature [oF] 498.9020 286.1792 287.1636 1149.8441 113.8318 148.7032 112.2715 113.4559 286.1792 Pressure [psia] 16.0000 875.0000 575.0000 486.0030 486.0030 575.0020 446.8033 551.5992 875.0000 Molar Flow [lbmole/hr] 6.2791 84.4283 84.4283 4492.1083 109.1000 3519.2030 483.3964 489.7485 84.4283 Comp Mole Frac (Hydrogen) 0.000000 0.000000 0.000000 0.358060 0.004670 0.401225 0.401225 0.004670 0.000000 Comp Mole Frac (Methane) 0.000000 0.000000 0.000000 0.528353 0.044890 0.587533 0.587533 0.044890 0.000000 Comp Mole Frac (Benzene) 0.000000 0.000645 0.000645 0.086601 0.712422 0.010071 0.010071 0.712431 0.000645 Comp Mole Frac (Toluene) 0.000260 0.999335 0.999335 0.025193 0.221549 0.001170 0.001170 0.221539 0.999335 Comp Mole Frac (BiPhenyl) 0.999740 0.000020 0.000020 0.001794 0.016469 0.000000 0.000000 0.016470 0.000020
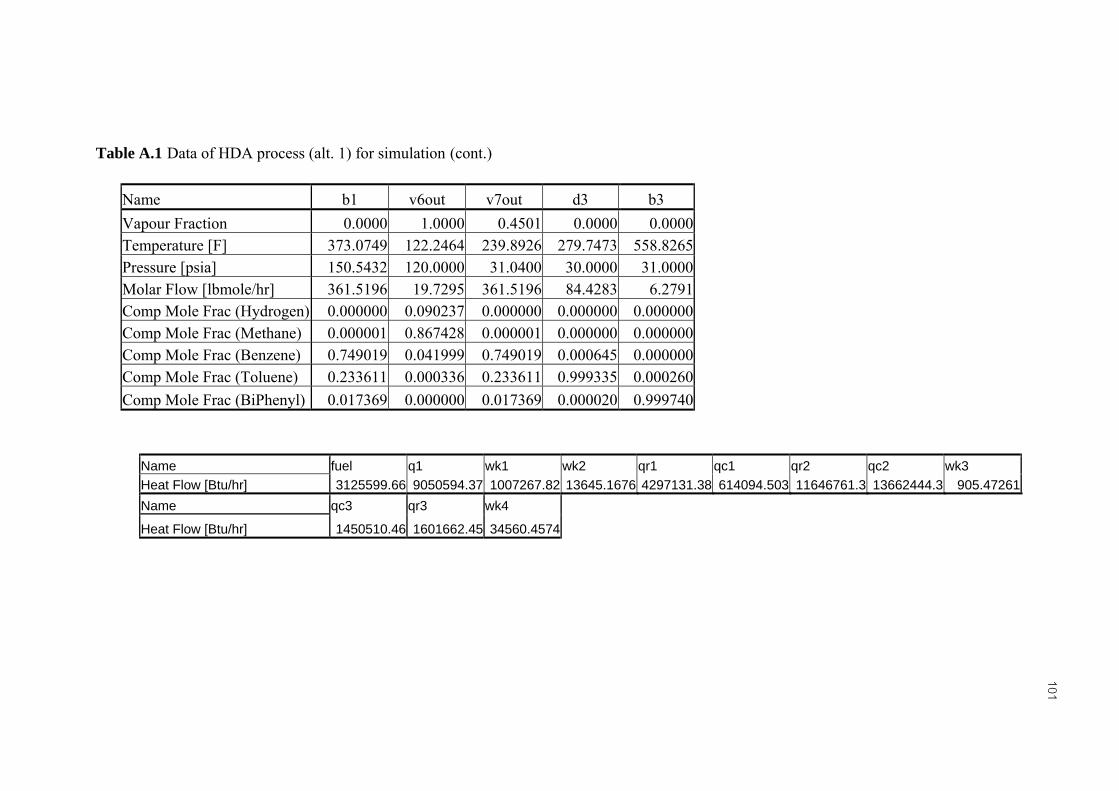
101
Table A.1 Data of HDA process (alt. 1) for simulation (cont.)
Name b1 v6out v7out d3 b3 Vapour Fraction 0.0000 1.0000 0.4501 0.0000 0.0000Temperature [F] 373.0749 122.2464 239.8926 279.7473 558.8265Pressure [psia] 150.5432 120.0000 31.0400 30.0000 31.0000Molar Flow [lbmole/hr] 361.5196 19.7295 361.5196 84.4283 6.2791Comp Mole Frac (Hydrogen) 0.000000 0.090237 0.000000 0.000000 0.000000Comp Mole Frac (Methane) 0.000001 0.867428 0.000001 0.000000 0.000000Comp Mole Frac (Benzene) 0.749019 0.041999 0.749019 0.000645 0.000000Comp Mole Frac (Toluene) 0.233611 0.000336 0.233611 0.999335 0.000260Comp Mole Frac (BiPhenyl) 0.017369 0.000000 0.017369 0.000020 0.999740
Name fuel q1 wk1 wk2 qr1 qc1 qr2 qc2 wk3 Heat Flow [Btu/hr] 3125599.66 9050594.37 1007267.82 13645.1676 4297131.38 614094.503 11646761.3 13662444.3 905.47261 Name qc3 qr3 wk4
Heat Flow [Btu/hr] 1450510.46 1601662.45 34560.4574

102
Table A.2 Data of HDA process (alt. 1) for simulation
Name FFH2 v1out Toltol cin Regas reacin reactout tot quench Vapour Fraction 1.0000 1.0000 0.0000 0.9094 1.0000 1.0000 1.0000 1.0000 0.0000 Temperature [F] 86.0000 85.9936 157.5732 146.0224 148.7100 1149.9980 1230.9399 1149.8646 113.8317 Pressure [psia] 605.0000 575.0000 575.0000 575.0000 575.0000 503.0000 486.0016 486.0016 486.0016 Molar Flow [lbmole/hr] 490.3800 490.3800 373.5522 4383.1351 3519.2030 4383.1351 4383.1352 4492.2352 109.1000 Comp Mole Frac (Hydrogen) 0.970000 0.970000 0.000000 0.431262 0.401969 0.431262 0.366833 0.358037 0.004670 Comp Mole Frac (Methane) 0.030000 0.030000 0.000000 0.474529 0.586841 0.474529 0.540383 0.528350 0.044889 Comp Mole Frac (Benzene) 0.000000 0.000000 0.000252 0.008042 0.009989 0.008042 0.071046 0.086623 0.712432 Comp Mole Frac (Toluene) 0.000000 0.000000 0.999659 0.086160 0.001201 0.086160 0.020305 0.025192 0.221538 Comp Mole Frac (BiPhenyl) 0.000000 0.000000 0.000090 0.000008 0.000000 0.000008 0.001433 0.001798 0.016472 Name condout gasre discharge v4out p1out fquence d1 b1 v6out Vapour Fraction 0.8910 1.0000 1.0000 1.0000 0.0000 0.0000 1.0000 0.0000 1.0000 Temperature [F] 113.0000 113.0000 148.7072 112.2715 113.4559 113.4559 123.9116 372.9882 122.2895 Pressure [psia] 476.7934 476.7934 575.0020 446.7934 551.5894 551.5894 150.0000 150.5400 120.0000 Molar Flow [lbmole/hr] 4492.3510 3519.2030 3519.2030 483.4032 489.7447 108.4994 19.7223 759.6531 19.7223 Comp Mole Frac (Hydrogen) 0.357993 0.401225 0.401225 0.401225 0.004670 0.004670 0.090265 0.000000 0.090265 Comp Mole Frac (Methane) 0.528376 0.587533 0.587533 0.587533 0.044889 0.044889 0.867384 0.000019 0.867384 Comp Mole Frac (Benzene) 0.086641 0.010072 0.010072 0.010072 0.712432 0.712432 0.042002 0.749007 0.042002 Comp Mole Frac (Toluene) 0.025194 0.001170 0.001170 0.001170 0.221538 0.221538 0.000349 0.233604 0.000349 Comp Mole Frac (BiPhenyl) 0.001796 0.000000 0.000000 0.000000 0.016472 0.016472 0.000000 0.017370 0.000000
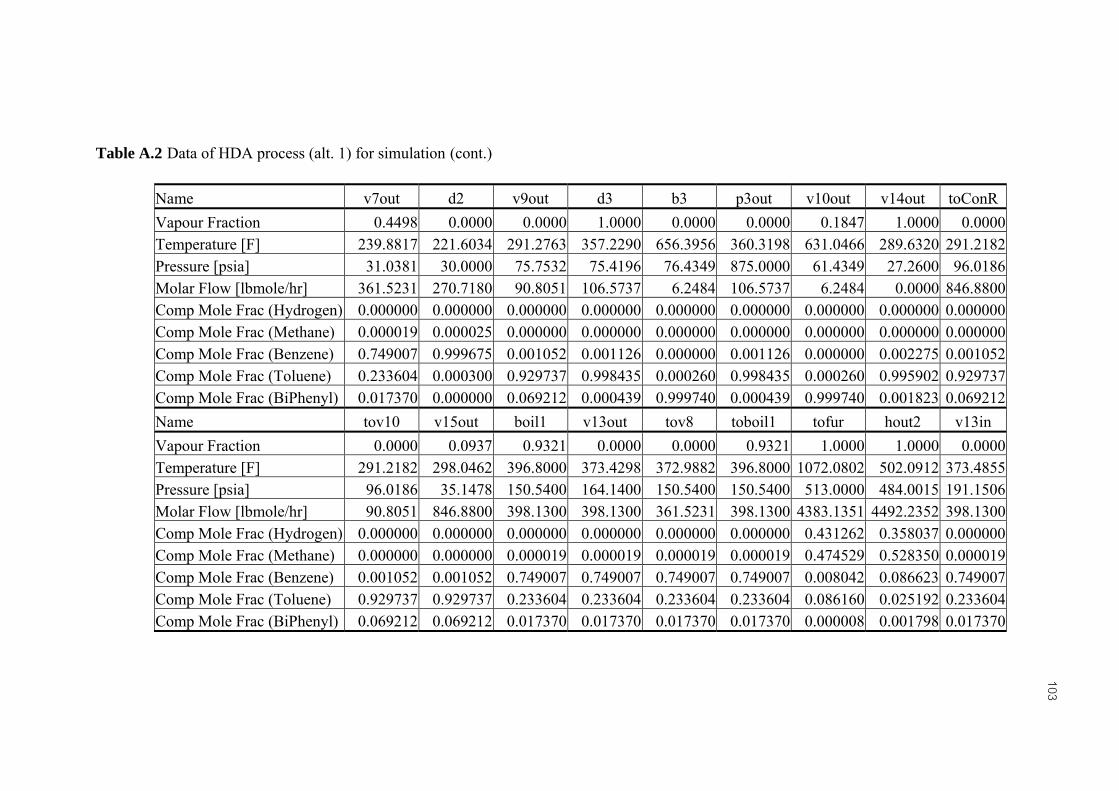
103
Table A.2 Data of HDA process (alt. 1) for simulation (cont.)
Name v7out d2 v9out d3 b3 p3out v10out v14out toConR Vapour Fraction 0.4498 0.0000 0.0000 1.0000 0.0000 0.0000 0.1847 1.0000 0.0000 Temperature [F] 239.8817 221.6034 291.2763 357.2290 656.3956 360.3198 631.0466 289.6320 291.2182 Pressure [psia] 31.0381 30.0000 75.7532 75.4196 76.4349 875.0000 61.4349 27.2600 96.0186 Molar Flow [lbmole/hr] 361.5231 270.7180 90.8051 106.5737 6.2484 106.5737 6.2484 0.0000 846.8800 Comp Mole Frac (Hydrogen) 0.000000 0.000000 0.000000 0.000000 0.000000 0.000000 0.000000 0.000000 0.000000 Comp Mole Frac (Methane) 0.000019 0.000025 0.000000 0.000000 0.000000 0.000000 0.000000 0.000000 0.000000 Comp Mole Frac (Benzene) 0.749007 0.999675 0.001052 0.001126 0.000000 0.001126 0.000000 0.002275 0.001052 Comp Mole Frac (Toluene) 0.233604 0.000300 0.929737 0.998435 0.000260 0.998435 0.000260 0.995902 0.929737 Comp Mole Frac (BiPhenyl) 0.017370 0.000000 0.069212 0.000439 0.999740 0.000439 0.999740 0.001823 0.069212 Name tov10 v15out boil1 v13out tov8 toboil1 tofur hout2 v13in Vapour Fraction 0.0000 0.0937 0.9321 0.0000 0.0000 0.9321 1.0000 1.0000 0.0000 Temperature [F] 291.2182 298.0462 396.8000 373.4298 372.9882 396.8000 1072.0802 502.0912 373.4855 Pressure [psia] 96.0186 35.1478 150.5400 164.1400 150.5400 150.5400 513.0000 484.0015 191.1506 Molar Flow [lbmole/hr] 90.8051 846.8800 398.1300 398.1300 361.5231 398.1300 4383.1351 4492.2352 398.1300 Comp Mole Frac (Hydrogen) 0.000000 0.000000 0.000000 0.000000 0.000000 0.000000 0.431262 0.358037 0.000000 Comp Mole Frac (Methane) 0.000000 0.000000 0.000019 0.000019 0.000019 0.000019 0.474529 0.528350 0.000019 Comp Mole Frac (Benzene) 0.001052 0.001052 0.749007 0.749007 0.749007 0.749007 0.008042 0.086623 0.749007 Comp Mole Frac (Toluene) 0.929737 0.929737 0.233604 0.233604 0.233604 0.233604 0.086160 0.025192 0.233604 Comp Mole Frac (BiPhenyl) 0.069212 0.069212 0.017370 0.017370 0.017370 0.017370 0.000008 0.001798 0.017370

104
Table A.2 Data of HDA process (alt. 1) for simulation (cont.)
Name toTop3 hotout5 cout5 vent3 v17out boil2out v16out v11out 2.0000 Vapour Fraction 0.0189 0.0000 0.0000 1.0000 0.0189 0.8861 1.0000 0.0000 0.0000 Temperature [F] 356.2950 352.6895 322.5725 352.6895 356.2983 330.0000 351.6682 360.6969 86.0000 Pressure [psia] 75.4200 72.5189 93.1178 72.5189 75.4200 32.2600 67.5189 575.0000 635.0000 Molar Flow [lbmole/hr] 22.0170 106.5737 846.8800 0.0000 22.0170 846.8800 0.0000 84.5522 289.0000 Comp Mole Frac (Hydrogen) 0.000000 0.000000 0.000000 0.000000 0.000000 0.000000 0.000000 0.000000 0.000000 Comp Mole Frac (Methane) 0.000000 0.000000 0.000000 0.000000 0.000000 0.000000 0.000000 0.000000 0.000000 Comp Mole Frac (Benzene) 0.001113 0.001126 0.001052 0.002038 0.001126 0.001052 0.002038 0.001113 0.000000 Comp Mole Frac (Toluene) 0.998491 0.998435 0.929737 0.997941 0.998435 0.929737 0.997941 0.998491 1.000000 Comp Mole Frac (BiPhenyl) 0.000396 0.000439 0.069212 0.000020 0.000439 0.069212 0.000020 0.000396 0.000000 Name 222 333 444 cout hin2 hout gas liq purge Vapour Fraction 1.0000 1.0000 0.0000 1.0000 1.0000 0.9374 1.0000 0.0000 1.0000 Temperature [F] 357.2290 356.6400 324.0093 345.5600 1149.8646 211.9567 113.0000 113.0000 113.0000 Pressure [psia] 75.4196 72.5189 72.5189 543.9982 486.0016 480.0434 476.7934 476.7934 476.7934 Molar Flow [lbmole/hr] 10.6574 10.6574 95.9164 4383.1351 4492.2352 4492.3510 4002.6062 489.7447 483.4032 Comp Mole Frac (Hydrogen) 0.000000 0.000000 0.000000 0.431262 0.358037 0.357993 0.401225 0.004670 0.401225 Comp Mole Frac (Methane) 0.000000 0.000000 0.000000 0.474529 0.528350 0.528376 0.587533 0.044889 0.587533 Comp Mole Frac (Benzene) 0.001126 0.001126 0.001126 0.008042 0.086623 0.086641 0.010072 0.712432 0.010072 Comp Mole Frac (Toluene) 0.998435 0.998435 0.998435 0.086160 0.025192 0.025194 0.001170 0.221538 0.001170 Comp Mole Frac (BiPhenyl) 0.000439 0.000439 0.000439 0.000008 0.001798 0.001796 0.000000 0.016472 0.000000
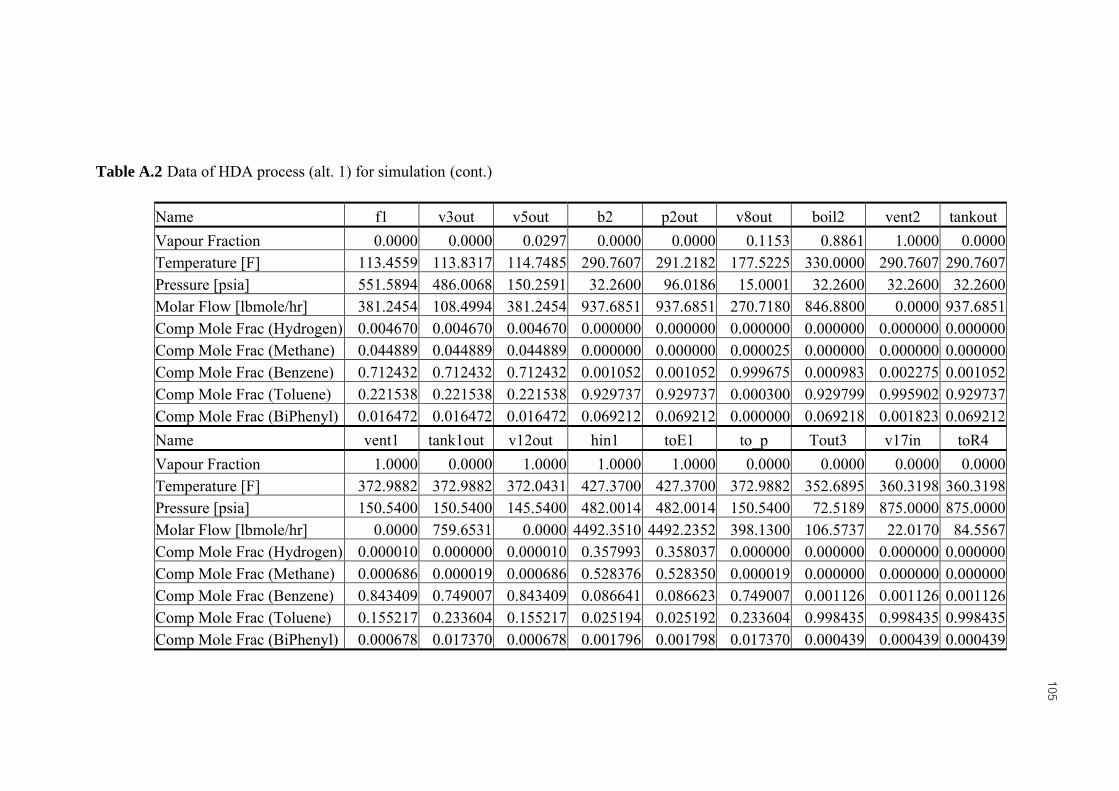
105
Table A.2 Data of HDA process (alt. 1) for simulation (cont.)
Name f1 v3out v5out b2 p2out v8out boil2 vent2 tankout Vapour Fraction 0.0000 0.0000 0.0297 0.0000 0.0000 0.1153 0.8861 1.0000 0.0000 Temperature [F] 113.4559 113.8317 114.7485 290.7607 291.2182 177.5225 330.0000 290.7607 290.7607 Pressure [psia] 551.5894 486.0068 150.2591 32.2600 96.0186 15.0001 32.2600 32.2600 32.2600 Molar Flow [lbmole/hr] 381.2454 108.4994 381.2454 937.6851 937.6851 270.7180 846.8800 0.0000 937.6851 Comp Mole Frac (Hydrogen) 0.004670 0.004670 0.004670 0.000000 0.000000 0.000000 0.000000 0.000000 0.000000 Comp Mole Frac (Methane) 0.044889 0.044889 0.044889 0.000000 0.000000 0.000025 0.000000 0.000000 0.000000 Comp Mole Frac (Benzene) 0.712432 0.712432 0.712432 0.001052 0.001052 0.999675 0.000983 0.002275 0.001052 Comp Mole Frac (Toluene) 0.221538 0.221538 0.221538 0.929737 0.929737 0.000300 0.929799 0.995902 0.929737 Comp Mole Frac (BiPhenyl) 0.016472 0.016472 0.016472 0.069212 0.069212 0.000000 0.069218 0.001823 0.069212 Name vent1 tank1out v12out hin1 toE1 to_p Tout3 v17in toR4 Vapour Fraction 1.0000 0.0000 1.0000 1.0000 1.0000 0.0000 0.0000 0.0000 0.0000 Temperature [F] 372.9882 372.9882 372.0431 427.3700 427.3700 372.9882 352.6895 360.3198 360.3198 Pressure [psia] 150.5400 150.5400 145.5400 482.0014 482.0014 150.5400 72.5189 875.0000 875.0000 Molar Flow [lbmole/hr] 0.0000 759.6531 0.0000 4492.3510 4492.2352 398.1300 106.5737 22.0170 84.5567 Comp Mole Frac (Hydrogen) 0.000010 0.000000 0.000010 0.357993 0.358037 0.000000 0.000000 0.000000 0.000000 Comp Mole Frac (Methane) 0.000686 0.000019 0.000686 0.528376 0.528350 0.000019 0.000000 0.000000 0.000000 Comp Mole Frac (Benzene) 0.843409 0.749007 0.843409 0.086641 0.086623 0.749007 0.001126 0.001126 0.001126 Comp Mole Frac (Toluene) 0.155217 0.233604 0.155217 0.025194 0.025192 0.233604 0.998435 0.998435 0.998435 Comp Mole Frac (BiPhenyl) 0.000678 0.017370 0.000678 0.001796 0.001798 0.017370 0.000439 0.000439 0.000439

106
Table A.2 Data of HDA process (alt. 1) for simulation (cont.)
Name V2out Retol 111 Vapour Fraction 0.0000 0.0000 1.0000Temperature [F] 86.4137 360.3164 357.2290Pressure [psia] 575.0000 875.0000 75.4196Molar Flow [lbmole/hr] 289.0000 84.5522 95.9164Comp Mole Frac (Hydrogen) 0.000000 0.000000 0.000000Comp Mole Frac (Methane) 0.000000 0.000000 0.000000Comp Mole Frac (Benzene) 0.000000 0.001113 0.001126Comp Mole Frac (Toluene) 1.000000 0.998491 0.998435Comp Mole Frac (BiPhenyl) 0.000000 0.000396 0.000439
Name fuel q1 wk1 wk2 qc1 qc2 wk3 qr3 Heat Flow [Btu/hr] 5517949.756 7433657.42 1007381.919 13645.07811 614687.9938 13658547.23 29835.8334 1857622.929 Name wk4 qb2 wk5 Heat Flow [Btu/hr] 44208.62065 10268501 7755.245429
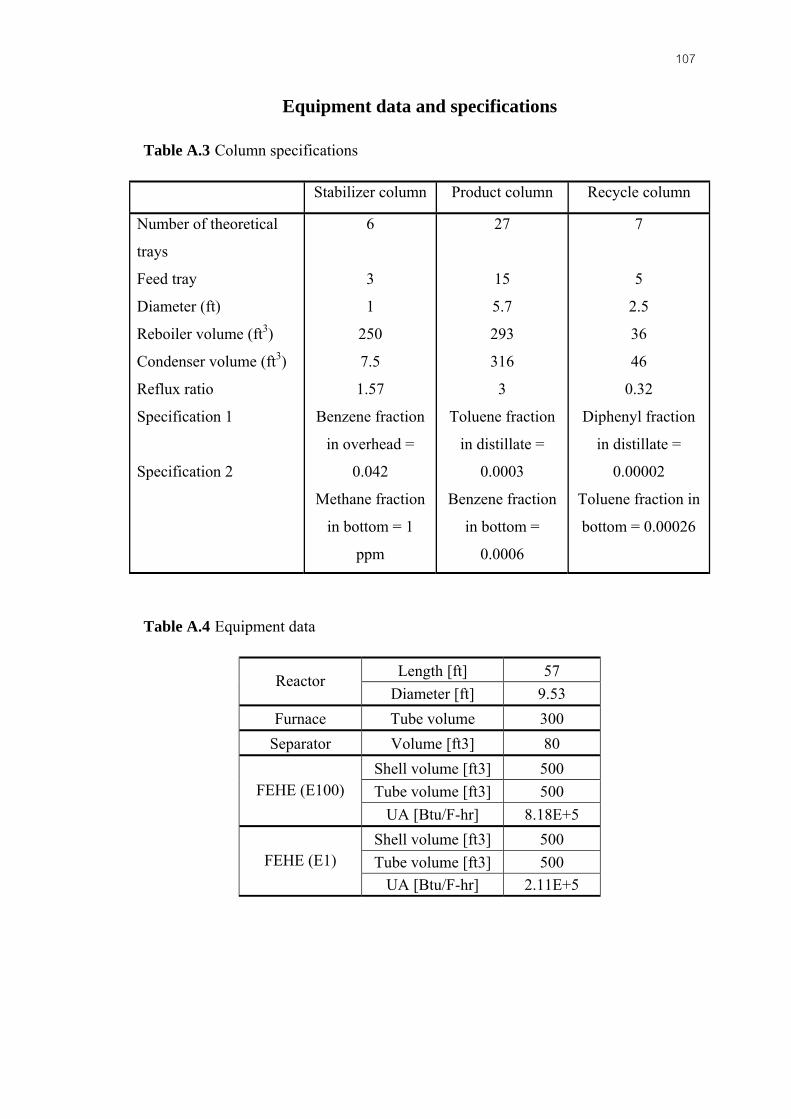
107
Equipment data and specifications
Table A.3 Column specifications
Stabilizer column Product column Recycle column
Number of theoretical
trays
Feed tray
Diameter (ft)
Reboiler volume (ft3)
Condenser volume (ft3)
Reflux ratio
Specification 1
Specification 2
6
3
1
250
7.5
1.57
Benzene fraction
in overhead =
0.042
Methane fraction
in bottom = 1
ppm
27
15
5.7
293
316
3
Toluene fraction
in distillate =
0.0003
Benzene fraction
in bottom =
0.0006
7
5
2.5
36
46
0.32
Diphenyl fraction
in distillate =
0.00002
Toluene fraction in
bottom = 0.00026
Table A.4 Equipment data
Length [ft] 57 Reactor Diameter [ft] 9.53
Furnace Tube volume 300 Separator Volume [ft3] 80
Shell volume [ft3] 500 Tube volume [ft3] 500 FEHE (E100)
UA [Btu/F-hr] 8.18E+5 Shell volume [ft3] 500 Tube volume [ft3] 500 FEHE (E1)
UA [Btu/F-hr] 2.11E+5

108
Table A.4 Equipment data (cont.)
Shell volume [ft3] 500 Tube volume [ft3] 500 FEHE (E2)
UA [Btu/F-hr] 4.1E+5 Shell volume [ft3] 500 Tube volume [ft3] 500 FEHE (E3)
UA [Btu/F-hr] 56290.3608 Shell volume [ft3] 100 Tube volume [ft3] 100 FEHE (E5)
UA [Btu/F-hr] 2.98E+4

109
APPENDIX B
Parameter Tuning of Control Structures
B.1 Tuning Controllers
Notice throughout this work use PI controllers. In theory, control performance
can be improved by the use of derivative action. But in practice the use of derivative
has some significant drawbacks:
1. Three tuning constants must be specified.
2. Signal noise is amplified.
3. Several types of PID control algorithms are used, so important to careful that
the right algorithm is used with its matching tuning method.
4. The simulation is an approximation of the real plant. If high-performance
controllers are required to get good dynamics from the simulation, the real
plant may not work well.
B.1.1 Tuning Flow, Level and Pressure Loops
The dynamics of flow measurement are fast. The time constants for moving
control valves are small. Therefore, the controller can be tuned with a small integral
or reset time constant Iτ . A value of Iτ = 0.3 minutes work in most flow controllers.
The value of controller gain should be kept modest because flow measurement signals
are sometime noisy due to the turbulent flow through the orifice plate. A value of
controller gain of Kc = 0.5 is often used. Derivative action should not be used.
Most level controller should use proportional-only action with a gain of 1 to 2.
This provides the maximum amount of flow smoothing. Proportional control means
there will be steady- state offset (the level will not be returned to its setpoint value).
However, maintaining a liquid level at a certain value is often not necessary when the
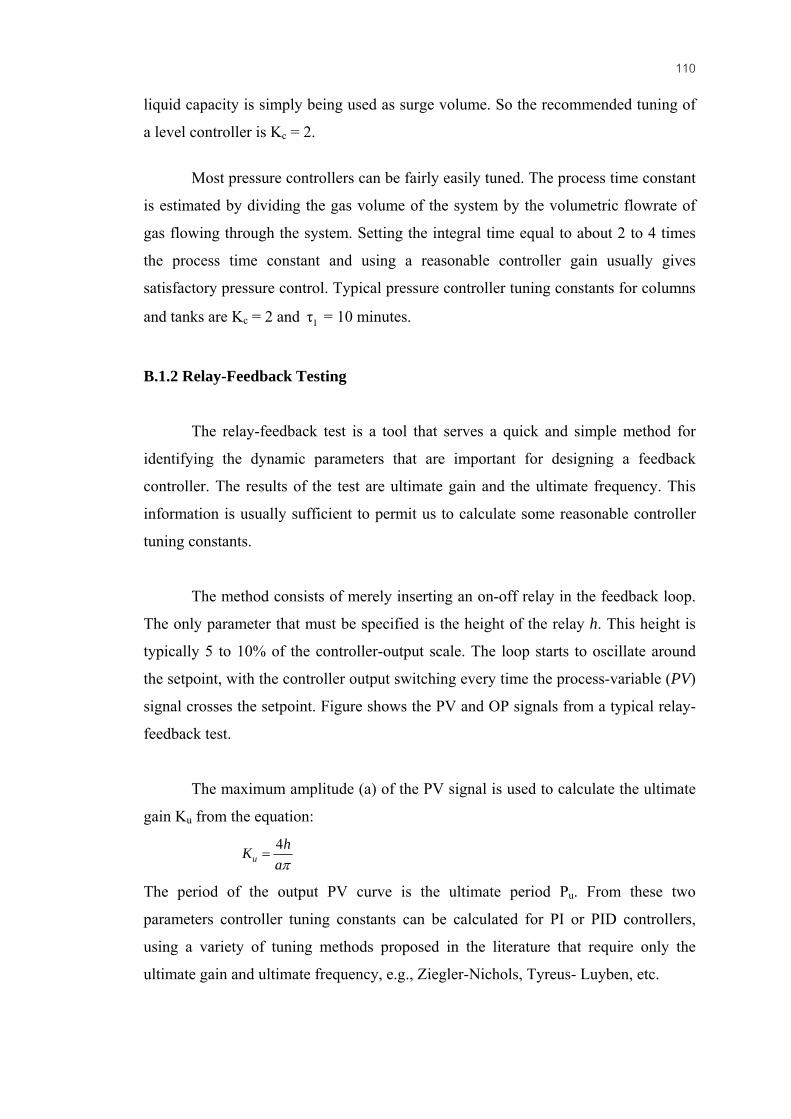
110
liquid capacity is simply being used as surge volume. So the recommended tuning of
a level controller is Kc = 2.
Most pressure controllers can be fairly easily tuned. The process time constant
is estimated by dividing the gas volume of the system by the volumetric flowrate of
gas flowing through the system. Setting the integral time equal to about 2 to 4 times
the process time constant and using a reasonable controller gain usually gives
satisfactory pressure control. Typical pressure controller tuning constants for columns
and tanks are Kc = 2 and Iτ = 10 minutes.
B.1.2 Relay-Feedback Testing
The relay-feedback test is a tool that serves a quick and simple method for
identifying the dynamic parameters that are important for designing a feedback
controller. The results of the test are ultimate gain and the ultimate frequency. This
information is usually sufficient to permit us to calculate some reasonable controller
tuning constants.
The method consists of merely inserting an on-off relay in the feedback loop.
The only parameter that must be specified is the height of the relay h. This height is
typically 5 to 10% of the controller-output scale. The loop starts to oscillate around
the setpoint, with the controller output switching every time the process-variable (PV)
signal crosses the setpoint. Figure shows the PV and OP signals from a typical relay-
feedback test.
The maximum amplitude (a) of the PV signal is used to calculate the ultimate
gain Ku from the equation:
4u
hKaπ
=
The period of the output PV curve is the ultimate period Pu. From these two
parameters controller tuning constants can be calculated for PI or PID controllers,
using a variety of tuning methods proposed in the literature that require only the
ultimate gain and ultimate frequency, e.g., Ziegler-Nichols, Tyreus- Luyben, etc.

111
The test has many positive features that have led to its widespread use in real
plants as well in simulation studies:
1. Only one parameter has to be specified (relay height).
2. The time it takes to run the test is short, particularly compared to the
extended periods required for methods like PRBS.
3. The test is closed loop, so the process is not driven away from the setpoint.
4. The information obtained is very accurate in the frequency range that is
important for the design of a feedback controller (the ultimate frequency).
5. The impact of load changes that occur during the test can be detected by a
change to asymmetric in the manipulated variable.
All these features make relay-feedback testing a useful identification tool.
Knowing the ultimate gain Ku and ultimate period Pu permits us to calculate
controller setting. There are several methods that require only these two parameters.
The Ziegler-Nichols tuning equations for a PI controller are
2.2
1.2
uc
uI
KK
Pτ
=
=
These tuning constants are frequently too aggressive for many chemical engineering
applications. The Tyreus-Luyben tuning method provides more conservative setting
with increased robustness. The TL equations for a PI controller are
3.22.2
uc
I u
KK
Pτ
=
=

112
Table B.1 Parameter tuning of HDA process (reference, CS1)
Controller Process Variable Output Control Action Set point Kc τi (min)
PIC_Sep separator pressure fresh feed hydrogen valve (V1) reverse 476.8 psia 2 10 FIC_Tottol total toluene flow rate fresh feed toluene valve (V2) reverse 373.67 lbmole/hr 0.2 0.1 TIC_Reacin reactor inlet temperature furnace duty (fuel) reverse 1150 oF 0.111 0.323
TIC_Sep separator temperature cooler duty (q1) direct 113 oF 0.129 0.776
TIC_Quench quenched temperature quench valve (V3) direct 1150 oF 0.383 0.148 XIC_Gasre methane purged fraction purge valve (V4) direct 0.5875 0.342 11.7 LIC_Sep separator liquid level column C1 feed valve (V5) direct 50% 2 -
LIC_Con1 column C1 reflux drum level column C1 condenser duty (qc1) reverse 50% 1 - TIC_Col1 column C1 tray temperature column C1 reboiler duty (qr1) reverse 308.94 oF 0.5 2.66 PIC_Con1 column C1 pressure column C1 gas valve (V6) direct 150 psia 1 10 LIC_Re1 column C1 base level column C2 feed valve (V7) direct 50% 2 - LIC-Con2 column C2 reflux drum level column C2 product valve (V8) direct 50% 2 - LIC_Re2 column C2 base level column C3 feed valve (V9) direct 50% 2 - TIC_Col2 column C2 tray temperature column C2 reboiler duty (qr2) reverse 248.5 oF 15 0.803 PIC_Con2 column C2 pressure column C2 condenser duty (qc2) direct 30 psia 2 10 LIC_Con3 column C3 reflux drum level toluene recycle valve (V11) direct 50% 2 - LIC_Re3 column C3 base level column C3 reboiler duty (qr3) direct 50% 3 - TIC_Col3 output of AVG column C3 bottom valve (V10) direct 412.6 oF 1.7 24.5 PIC_Con3 column C3 pressure column C3 condenser duty (qc3) direct 30 psia 2 10

113
Table B.2 Parameter tuning of HDA process (CS2-6)
Controller Process Variable Output Control Action Set point Kc τi (min)
PIC_Sep separator pressure fresh feed hydrogen valve (V1) reverse 476.8 psia 2 10 FIC_Tottol total toluene flow rate fresh feed toluene valve (V2) reverse 373.67 lbmole/hr 0.2 0.1 TIC_Reacin reactor inlet temperature furnace duty (fuel) reverse 1150 oF 9.17E-02 0.374
TIC_Sep separator temperature cooler duty (q1) direct 113 oF 0.121 0.783
TIC_Quench quenched temperature quench valve (V3) direct 1150 oF 0.361 0.21 XIC_Gasre methane purged fraction purge valve (V4) direct 0.5875 0.328 17 LIC_Sep separator liquid level column C1 feed valve (V5) direct 50% 2 -
LIC_Con1 column C1 reflux drum level column C1 condenser duty (qc1) reverse 50% 1 - FIC_Reb1 column C1boilup flowrate column C1 boilup valve (V13) reverse 398.13 lbmole/hr 3.92E-02 9.00E-03
CS2 6 2.91 CS6
exchanger E3 bypart valve (V-bypart1) direct 309.04 oF 2.5 2.91 TIC_Col1 column C1 tray temperature
CS3, 4 auxiliary duty (aux) reverse 309.04 oF 5 3.25 PIC_Con1 column C1 pressure column C1 gas valve (V6) direct 150 psia 1 10 LIC_Tank1 column C1 tank level column C2 feed valve (V7) direct 50% 2 -
CS2, 3, 4, 6 column C2 product valve (V8) direct 50% 2 - LIC-Con2 column C2 reflux drum level
CS5 FIC_Tottol reverse 50% 1 - FIC_Reb2 column C2boilup flowrate column C2 boilup valve (V15) reverse 846.88 lbmole/hr 1.56E-02 9.11E-03 LIC_Tank2 column C2 tank level column C3 feed valve (V9) direct 50% 2 -

114
Table B.2 Parameter tuning of HDA process (CS2-6) (cont.)
Controller Process Variable Output Control Action Set point Kc τi (min)
TIC_Col2 column C2 tray temperature heater E4 duty (qb2) reverse 248.62 oF 25 0.96 PIC_Con2 column C2 pressure column C2 condenser duty (qc2) direct 30 psia 2 10 LIC_Tank3 column C3 tank level toluene recycle valve (V11) direct 50% 2 -
CS2, 3 column C3 reboiler duty (qr3) direct 50% 3 - LIC_Re3 column C3 base level CS4 column C3 bottom valve (V10) direct 50% 2 -
CS2, 3 column C3 bottom valve (V10) direct 515.5 oF 1.5 24.5 TIC_Col3 output of AVG
CS4 column C3 reboiler duty (qr3) reverse 515.5 oF 7 2.83 PIC_Col3 tank column C3 pressure exchanger E3 bypart valve (VLV100) direct 72.52 psia 5 10 FIC_100 C2 production rate column C2 product valve (V8) reverse 270.72 lbmole/hr 0.17 1.76E-02 IC_100 logic output auxilairy duty (aux) direct 0 0.1 5

115
APPENDIX C
Dynamic Responses
C.1 Changing in Reactor Inlet Temperature C.1.1 Control structure 1 (reference) 10 oF increase
Figure C.1 dynamic responses of CS1 to 10 oF increase in reactor inlet temperature at
time equal 10 minutes.
5 oF decrease
Figure C.2 dynamic responses of CS1 to 5 oF decrease in reactor inlet temperature at time equal 10 minutes

116
Figure C.2 dynamic responses of CS1 to 5 oF decrease in reactor inlet temperature at
time equal 10 minutes (cont.).
C.1.2Control structure 2 5 oF increase
Figure C.3 dynamic responses of CS2 to 5 oF increase in reactor inlet temperature at
time equal 10 minutes.

117
Figure C.3 dynamic responses of CS2 to 5 oF increase in reactor inlet temperature at
time equal 10 minutes (cont.).
5 oF decrease
Figure C.4 dynamic responses of CS2 to 5 oF decrease in reactor inlet temperature at
time equal 10 minutes.

118
C.1.3 Control structure 3 10 oF increase
Figure C.5 dynamic responses of CS3 to 10 oF increase in reactor inlet temperature at
time equal 10 minutes (cont.).
5 oF decrease
Figure C.6 dynamic responses of CS3 to 5 oF decrease in reactor inlet temperature at
time equal 10 minutes.

119
Figure C.6 dynamic responses of CS3 to 5 oF decrease in reactor inlet temperature at
time equal 10 minutes (cont.).
C.1.4 Control structure 4 10 oF increase
Figure C.7 dynamic responses of CS4 to 10 oF increase in reactor inlet temperature at
time equal 10 minutes.

120
5 oF decrease
Figure C.8 dynamic responses of CS4 to 5 oF decrease in reactor inlet temperature at
time equal 10 minutes.
C.1.5 Control structure 5 10 oF increase
Figure C.9 dynamic responses of CS5 to 10 oF increase in reactor inlet temperature at
time equal 10 minutes.

121
Figure C.9 dynamic responses of CS5 to 10 oF increase in reactor inlet temperature at
time equal 10 minutes (cont.).
5 oF decrease
Figure C.10 dynamic responses of CS5 to 5 oF decrease in reactor inlet temperature
at time equal 10 minutes.
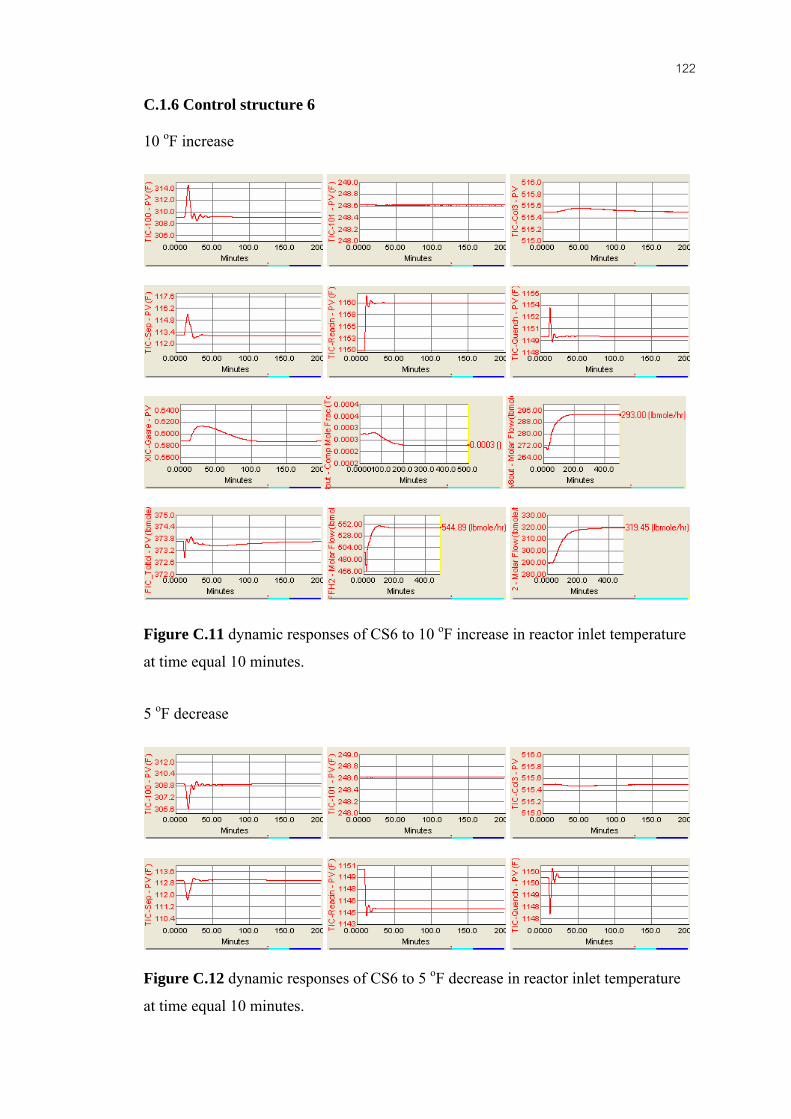
122
C.1.6 Control structure 6 10 oF increase
Figure C.11 dynamic responses of CS6 to 10 oF increase in reactor inlet temperature
at time equal 10 minutes.
5 oF decrease
Figure C.12 dynamic responses of CS6 to 5 oF decrease in reactor inlet temperature
at time equal 10 minutes.

123
Figure C.12 dynamic responses of CS6 to 5 oF decrease in reactor inlet temperature
at time equal 10 minutes (cont.).
C.2 Changing in Total Toluene Flowrate C.2.1 Control structure 1 (reference) 15 % increase
Figure C.13 dynamic responses of CS1 to 15 % increase in total toluene flowrate at
time equal 10 minutes (cont.).
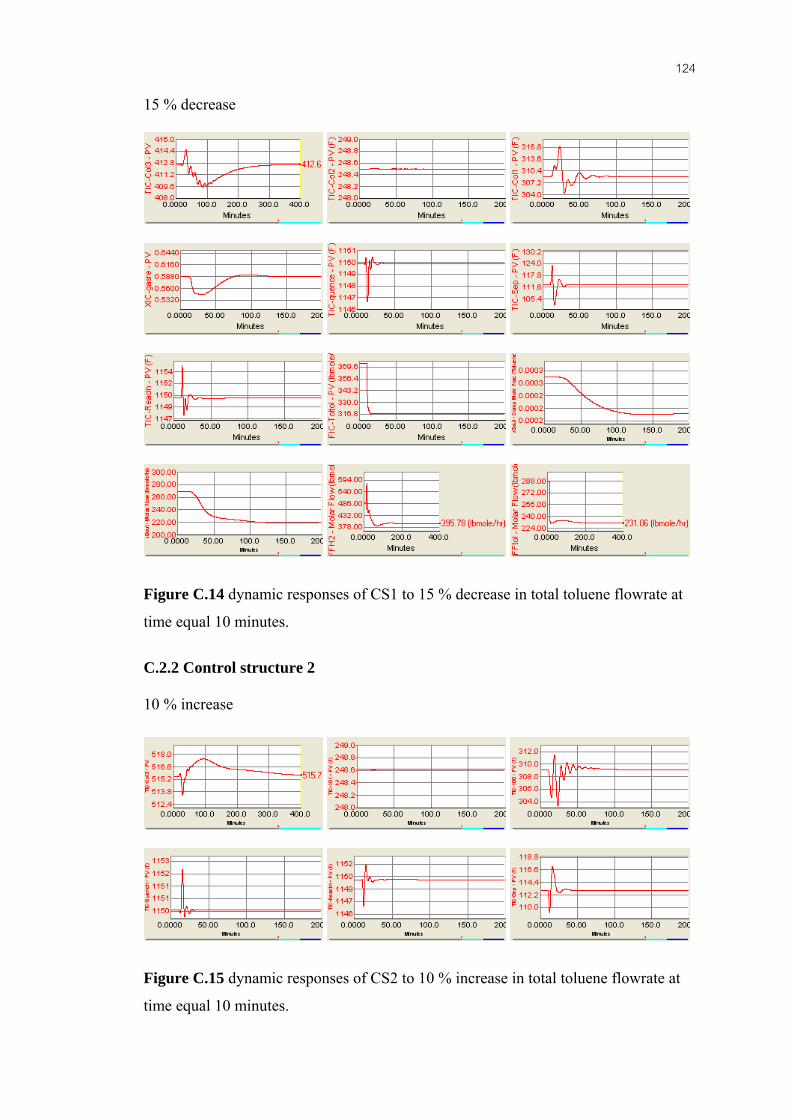
124
15 % decrease
Figure C.14 dynamic responses of CS1 to 15 % decrease in total toluene flowrate at
time equal 10 minutes.
C.2.2 Control structure 2 10 % increase
Figure C.15 dynamic responses of CS2 to 10 % increase in total toluene flowrate at
time equal 10 minutes.

125
Figure C.15 dynamic responses of CS2 to 10 % increase in total toluene flowrate at
time equal 10 minutes (cont.).
10 % decrease
Figure C.16 dynamic responses of CS2 to 10 % decrease in total toluene flowrate at
time equal 10 minutes.

126
C.2.3 Control structure 3 15 % increase
Figure C.17 dynamic responses of CS3 to 15 % increase in total toluene flowrate at
time equal 10 minutes.
15 % decrease
Figure C.18 dynamic responses of CS3 to 15 % decrease in total toluene flowrate at
time equal 10 minutes
127
Figure C.18 dynamic responses of CS3 to 15 % decrease in total toluene flowrate at
time equal 10 minutes (cont.).
C.2.4 Control structure 4 15 % increase
Figure C.19 dynamic responses of CS4 to 15 % increase in total toluene flowrate at
time equal 10 minutes.

128
15 % decrease
Figure C.20 dynamic responses of CS4 to 15 % decrease in total toluene flowrate at
time equal 10 minutes.
C.2.6 Control structure 6 15 % increase
Figure C.21 dynamic responses of CS6 to 15 % increase in total toluene flowrate at
time equal 10 minutes.

129
Figure C.21 dynamic responses of CS6 to 15 % increase in total toluene flowrate at
time equal 10 minutes (cont.).
15 % decrease
Figure C.22 dynamic responses of CS6 to 15 % decrease in total toluene flowrate at
time equal 10 minutes.
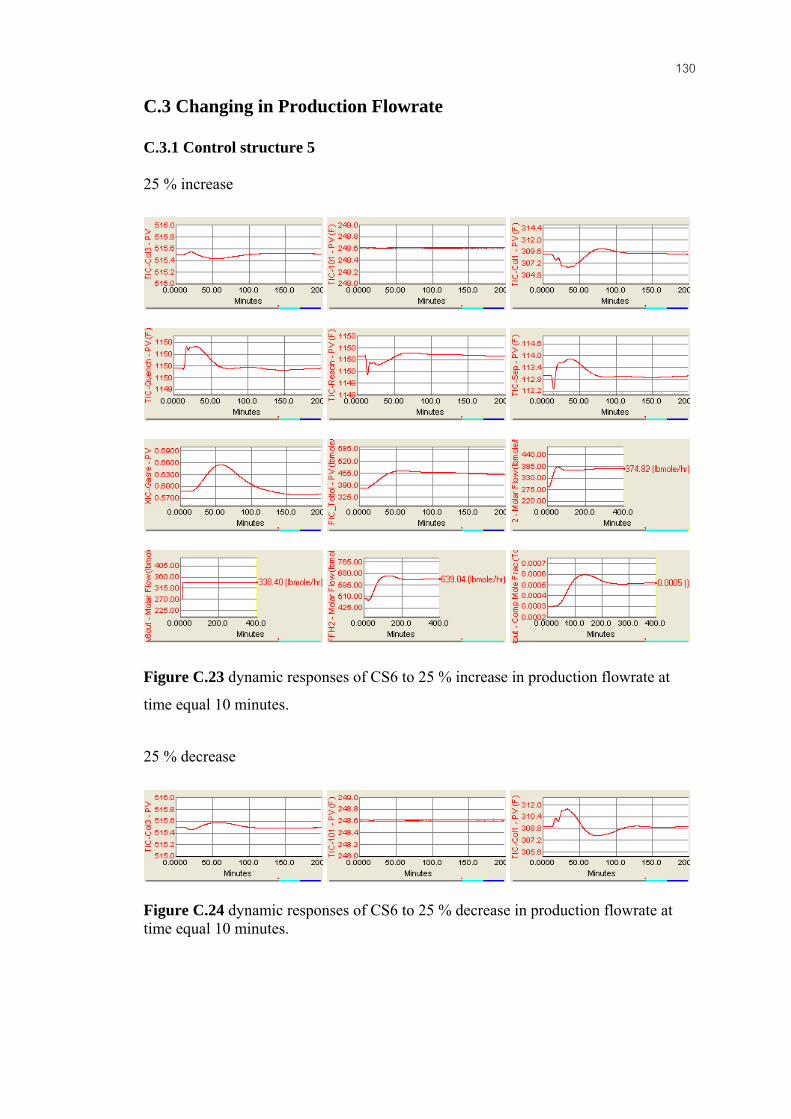
130
C.3 Changing in Production Flowrate C.3.1 Control structure 5 25 % increase
Figure C.23 dynamic responses of CS6 to 25 % increase in production flowrate at
time equal 10 minutes. 25 % decrease
Figure C.24 dynamic responses of CS6 to 25 % decrease in production flowrate at time equal 10 minutes.

131
Figure C.24 dynamic responses of CS6 to 25 % decrease in production flowrate at
time equal 10 minutes (cont.). C.4 Decrease reactor inlet temperature 10 oF
Due to reference data simulation is not designed to handle disturbance in
decrease reactor inlet temperature. So the modification is made by increase size of
valve of recycle column distillate.
Figure C.25 dynamic responses of CS6 to 10 oF decrease in reactor inlet temperature
at time equal 10 minutes.
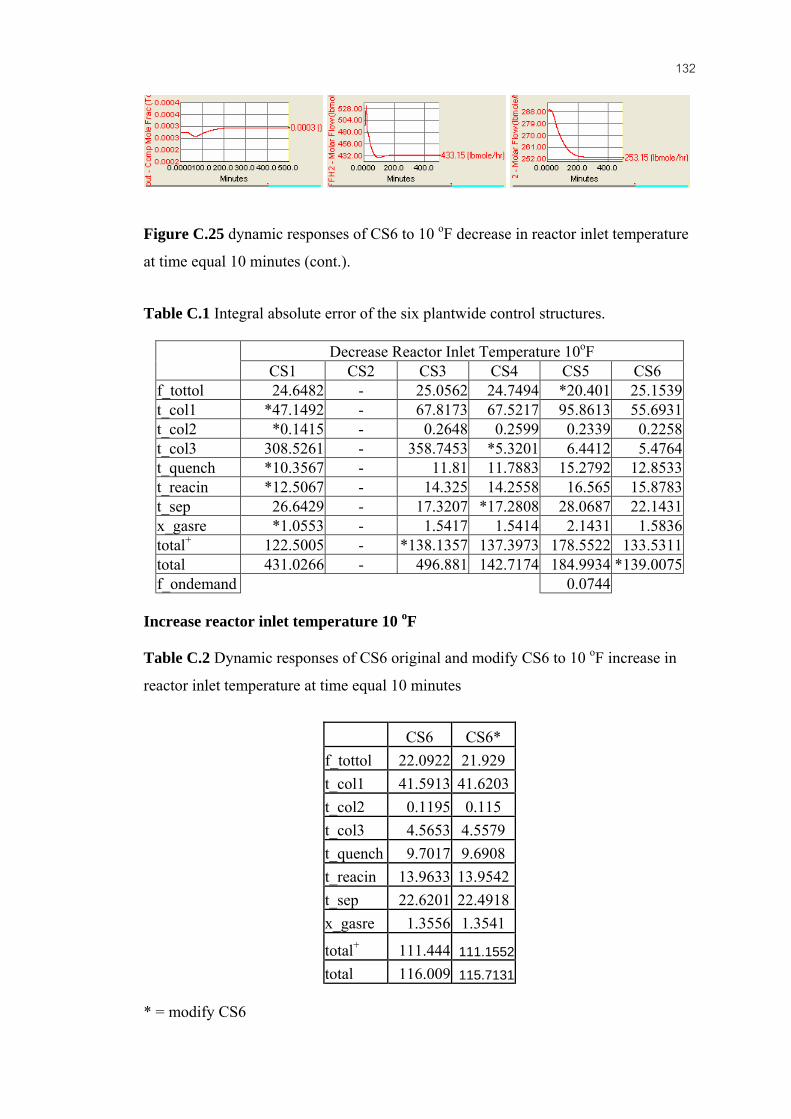
132
Figure C.25 dynamic responses of CS6 to 10 oF decrease in reactor inlet temperature
at time equal 10 minutes (cont.). Table C.1 Integral absolute error of the six plantwide control structures.
Decrease Reactor Inlet Temperature 10oF CS1 CS2 CS3 CS4 CS5 CS6
f_tottol 24.6482 - 25.0562 24.7494 *20.401 25.1539t_col1 *47.1492 - 67.8173 67.5217 95.8613 55.6931t_col2 *0.1415 - 0.2648 0.2599 0.2339 0.2258t_col3 308.5261 - 358.7453 *5.3201 6.4412 5.4764t_quench *10.3567 - 11.81 11.7883 15.2792 12.8533t_reacin *12.5067 - 14.325 14.2558 16.565 15.8783t_sep 26.6429 - 17.3207 *17.2808 28.0687 22.1431x_gasre *1.0553 - 1.5417 1.5414 2.1431 1.5836total+ 122.5005 - *138.1357 137.3973 178.5522 133.5311total 431.0266 - 496.881 142.7174 184.9934 *139.0075f_ondemand 0.0744
Increase reactor inlet temperature 10 oF Table C.2 Dynamic responses of CS6 original and modify CS6 to 10 oF increase in
reactor inlet temperature at time equal 10 minutes
CS6 CS6* f_tottol 22.0922 21.929 t_col1 41.5913 41.6203 t_col2 0.1195 0.115 t_col3 4.5653 4.5579 t_quench 9.7017 9.6908 t_reacin 13.9633 13.9542 t_sep 22.6201 22.4918 x_gasre 1.3556 1.3541
total+ 111.444 111.1552
total 116.009 115.7131
* = modify CS6

133
APPENDIX D
Kietawarin Control Structure
Kietawarin (2002) designed 3 control structures to reduce the effects of
disturbances in order to achieve a desired production rate. The first control scheme
(S1) measured toluene flow rate in the process and adjusted the fresh toluene feed rate
accordingly. The second (S2) was modified from the first scheme by adding a cooling
unit to control the outlet temperature of the reactor. In the third (S3) scheme, a ratio
control was introduced to the second control scheme for controlling the ratio of
hydrogen and toluene within the process.
Figure D.1 First control scheme of Kietawarin (S1).
Figure D.2 Second control scheme of Kietawarin (S2).
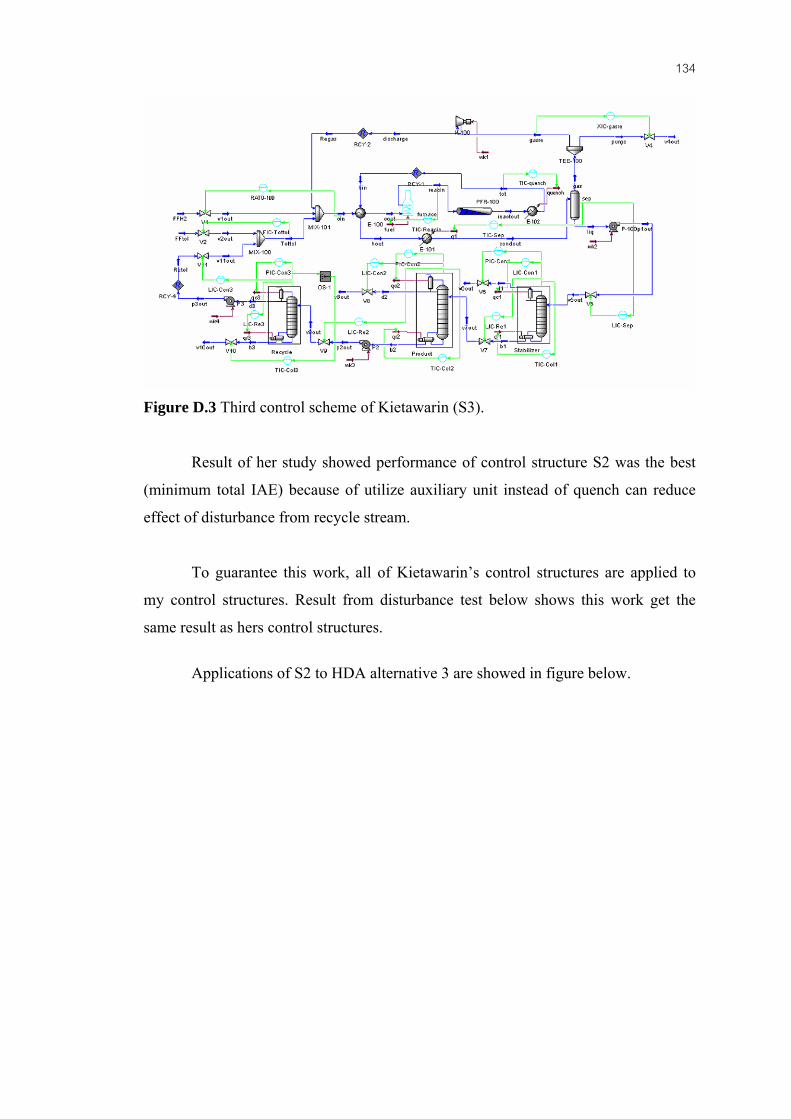
134
Figure D.3 Third control scheme of Kietawarin (S3).
Result of her study showed performance of control structure S2 was the best
(minimum total IAE) because of utilize auxiliary unit instead of quench can reduce
effect of disturbance from recycle stream.
To guarantee this work, all of Kietawarin’s control structures are applied to
my control structures. Result from disturbance test below shows this work get the
same result as hers control structures.
Applications of S2 to HDA alternative 3 are showed in figure below.

135
Figure D.4 Application of S2 of Kietawarin to CS2
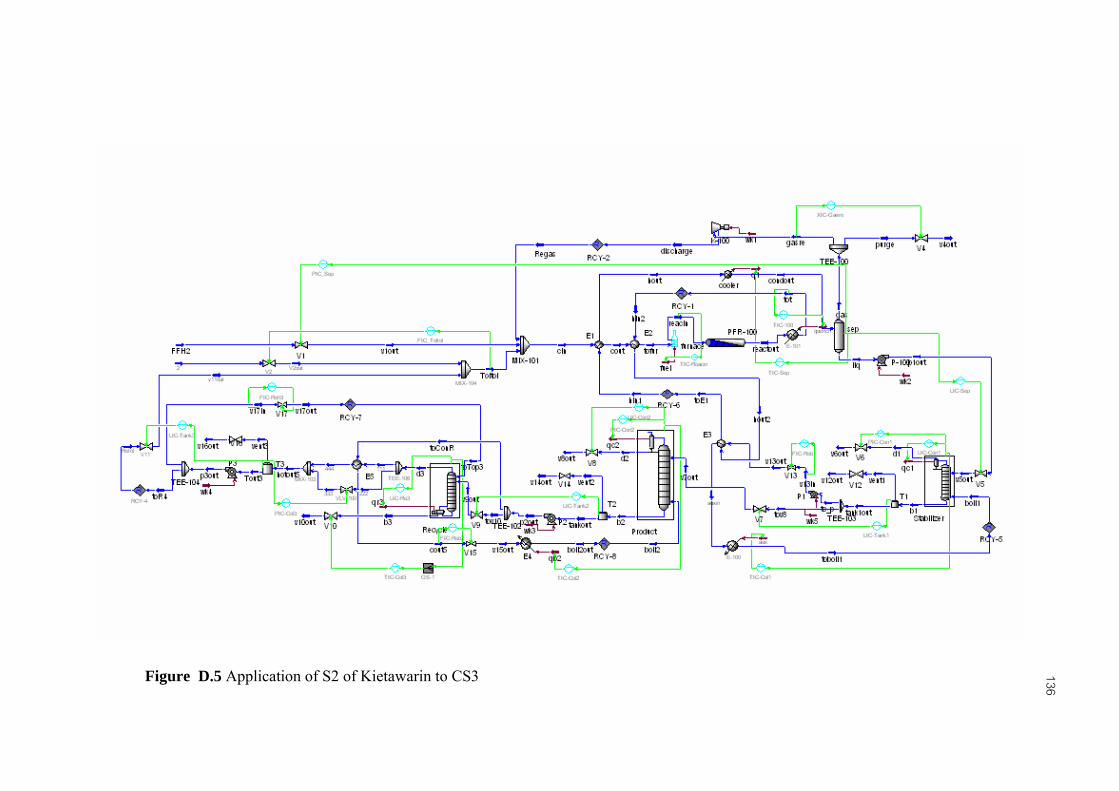
136
Figure D.5 Application of S2 of Kietawarin to CS3

137
Figure D.6 Application of S2 of Kietawarin to CS4
138
Figure D.7 Application of S2 of Kietawarin to CS5

139
Figure D.8 Application of S2 of Kietawarin to CS6

140
And applications of S3 to H
DA
alternative 3 are showed in follow
ing figure.
Figure D.9 Application of S3 of Kietawarin to CS2

141
Figure D.10 Application of S3 of Kietawarin to CS3

142
Figure D.11 Application of S3 of Kietawarin to CS4

143
Figure D.12 Application of S3 of Kietawarin to CS5

144
Figure D.13 Application of S3 of Kietawarin to CS6

145
The dynamic responses of decrease 10% total toluene flowrate step test are as follow:
Figure D.14 Dynamic responses of CS1 with S1 to decrease 10% total toluene
flowrate step test
CS1 with S2
Figure D.15 Dynamic responses of CS1 with S2 to decrease 10% total toluene
flowrate step test.

146
Figure D.15 Dynamic responses of CS1 with S2 to decrease 10% total toluene
flowrate step test (cont.).
CS1 with S3
Figure D.16 Dynamic responses of CS1 with S3 to decrease 10% total toluene
flowrate step test.
147
The dynamic responses of decrease 5oF reactor inlet temperature step test are as
follow:
CS1 with S1
Figure D.17 Dynamic responses of CS1 with S1 to decrease 5oF reactor inlet
temperature step test.
CS1 with S2
Figure D.18 Dynamic responses of CS1 with S2 to decrease 5oF reactor inlet
temperature step test.

148
Figure D.17 Dynamic responses of CS1 with S2 to decrease 5oF reactor inlet
temperature step test (cont.).
CS1 with S3
Figure D.17 Dynamic responses of CS1 with S3 to decrease 5oF reactor inlet
temperature step test.
149
Figure D.17 Dynamic responses of CS1 with S3 to decrease 5oF reactor inlet
temperature step test (cont.).
Integral absolute error of dynamic responses of design control structures
which are applied with Kietawarin’s control structures to decrease 10% total toluene
and decrease 5oF in reactor inlet temperature step tests are below:
Table D.1 IAE of design control structures when decrease total toluene flowrate.
Kietawarin’s control structure 1 CS1 CS2 CS3 CS4 CS6
f_tottol 32.5632 32.4208 33.4078 33.2332 32.7979t_col1 63.3114 111.751 76.3328 74.9459 83.8908t_col2 0.102 0.1326 0.1536 0.1627 0.1357t_col3 233.516 245.724 252.792 1.5478 1.5442t_quench 6.9958 8.19 7.2383 7.2283 7.8375t_reacin 11.4442 14.6075 12.6792 12.6758 14.7333t_sep 50.5375 35.1886 33.9293 33.8712 36.3393x_gasre 1.1253 1.6839 1.6931 1.693 1.6735total 399.596 449.698 418.226 *165.358 178.952
Kietawarin’s control structure 2 CS1 CS2 CS3 CS4 CS6
f_tottol 33.4313 33.1316 34.0017 33.7968 33.274t_col1 56.6742 168.125 75.2488 71.0568 79.4836t_col2 0.1009 0.1687 0.1514 0.1451 0.1456t_col3 230.126 234.141 244.182 1.4867 1.5292t_quench 9.6833 6.3792 6.0875 6.0883 5.9583t_reacin 16.115 14.4325 13.5792 13.4967 15.0767t_sep 28.7128 21.6172 24.0072 23.8918 22.5537x_gasre 1.0843 1.5845 1.5879 1.5879 1.5675total 375.927 479.58 398.846 *151.55 159.589

150
Table D.1 IAE of design control structures when decrease total toluene flowrate
(cont.).
Kietawarin’s control structure 3 CS1 CS2 CS3 CS4 CS6
f_tottol 66.5975 - 72.4926 72.4918 69.4545t_col1 56.5042 - 90.7374 89.7309 119.739t_col2 0.1043 - 0.1749 0.1761 0.1793t_col3 285.21 - 309.395 1.7854 1.7532t_quench 9.7117 - 5.9342 5.9383 5.965t_reacin 17.6925 - 19.4758 19.4667 16.9158t_sep 30.6412 - 24.6455 24.6492 26.7949x_gasre 1.7038 - 1.91 1.9099 2.0758total 468.166 - 524.765 *216.148 242.878
Table D.2 IAE of design control structures when decrease reactor inlet temperature.
Kietawarin’s control structure 1 CS1 CS2 CS3 CS4 CS5 CS6
f_tottol 12.0154 12.6961 12.1178 12.092 10.6842 11.7472t_col1 21.3976 25.9986 32.977 33.3353 57.2377 28.2545t_col2 0.0771 0.1663 0.1833 0.1878 0.1682 0.1608t_col3 168.2273 197.8495 195.2698 2.5865 3.0717 2.6952t_quench 5.0433 6.635 5.5808 5.5817 7.4933 6.1t_reacin 6.1458 8.7333 7.06 7.0517 7.8517 7.8242t_sep 13.2486 11.4269 8.5515 8.5528 13.7829 11.3132x_gasre 0.5142 0.783 0.745 0.7449 1.0455 0.7853total 226.6693 264.2887 262.4852 70.1327 101.3352 68.8804
Kietawarin’s control structure 2 CS1 CS2 CS3 CS4 CS5 CS6
f_tottol 13.1323 12.4414 12.5295 12.5065 11.5853 12.4662t_col1 6.0022 8.3372 27.9997 25.3223 33.3554 9.5175t_col2 0.0814 0.2015 0.18 0.1842 0.1612 0.1697t_col3 164.0398 184.018 186.1523 2.5417 3.0072 2.5537t_quench 6.785 4.7917 4.55 4.5508 5.6117 4.5842t_reacin 8.7033 7.6158 7.2675 7.2683 9.5342 7.4858t_sep 6.353 5.2678 5.5962 5.5322 7.6298 5.1691x_gasre 0.4892 0.7051 0.6874 0.6873 0.9593 0.7027total 205.5862 223.3785 244.9626 58.5933 71.8441 42.6489

151
Table D.2 IAE of design control structures when decrease reactor inlet temperature
(cont.).
Kietawarin’s control structure 3 CS1 CS2 CS3 CS4 CS5 CS6
f_tottol 19.902 20.7123 22.1749 22.1988 58.596 20.6953t_col1 9.5785 18.2892 29.9684 26.0839 45.6693 18.0579t_col2 0.0831 0.1855 0.1738 0.1674 0.1424 0.1593t_col3 152.9937 168.9802 170.37 2.4711 2.4709 2.5373t_quench 7.065 3.865 4.9983 4.6133 5.7592 4.5408t_reacin 9.7258 8.5558 9.9567 10.0692 14.9033 8.8383t_sep 7.399 7.6887 6.7936 6.746 9.7001 7.3155x_gasre 1.5098 1.3234 1.4361 1.4361 1.5662 1.2871total 208.2569 229.6001 245.8718 73.7858 138.8074 63.4315
Note * = Minimum IAE value

152
VITA
Mr. Chakkraphong Thaicharoen was born in Bangkok on September 17, 1981.
He graduated Bachelor Degree in department of Chemical Engineering from Mahidol
University in 2002. After that he studied for Master Degree in Chemical Engineering,
Chulalongkorn University in 2003.