
185회 콜로퀴움 홍성연 박사 발표자료
37
-
Upload
kukto -
Category
Technology
-
view
141 -
download
2
Transcript of 185회 콜로퀴움 홍성연 박사 발표자료
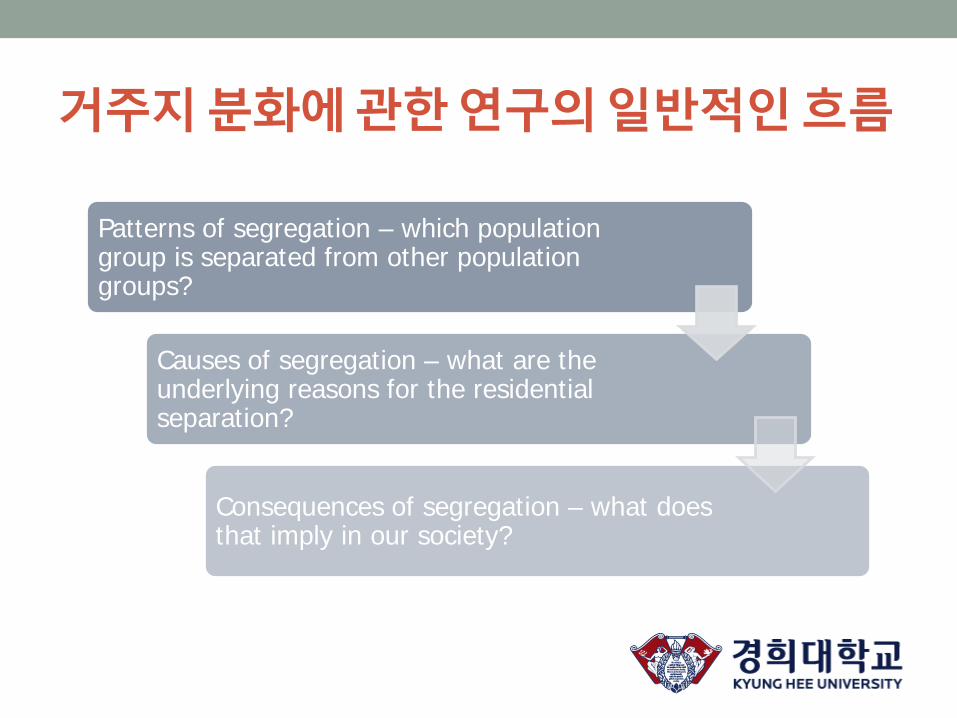
거주지 분화에 관한 연구의 일반적인 흐름
Patterns of segregation – which population group is separated from other population groups?
Causes of segregation – what are the underlying reasons for the residential separation?
Consequences of segregation – what does that imply in our society?

Measures of segregation Duncan and Duncan’s index of dissimilarity
(1955)
White’s index of spatial proximity (1983) Morrill’s adjusted
index of dissimilarity
(1991) Wong’s adjusted index of dissimilarity (1993)
Reardon and O’Sullivan’s spatial segregation indices
(2004)

Enclave vs. Ethnoburb Enclave Ethnoburb
Dynamics Forced segregation Voluntary segregation
Spatial form Small scale Small to medium scale
Population High density Medium density
Location Inner city Suburbs
Economy Labour-intensive sectors Business of all kinds
Internal stratification Minimum Very stratified
Interaction Mainly within group Both within- & inter-groups
Tension Between groups Inter- & intra-group
Community Mainly inward Both inward and outward
Example Traditional Chinatown San Gabriel Valley
Source: Li, 1997

Some candidates …
• GAM and Kulldorff’s scan statistic?
• Originally developed for epidemiological or ecological studies where
clustering is often very rare
• Often utilised in a situation where data are generated from observations,
such as the occurrence of a disease
• Getis-Ord’s local G* statistic and local Moran’s I?
• Designed to detect statistically significant clustering of the sample points
assuming no autocorrelation in the study region
• At least appeared in the relevant literature

기존 방법의 문제점 Source: Poulsen et al., 2010
P(z < –5.17) = 0.000000117047 P(z > 10.32) = 2.861158 x 10⁻²⁵
P(z > 20.64) = 6.003128 x 10–95

거주지 분화에 관한 연구의 특징
• Often employ census data as the primary source of information
• The presence is usually very apparent even on a simple choropleth
map of the population.
• Difficulties arise in delineating the boundaries of residential clusters,
because those located in suburban areas have no clear borders.
• The question that should be addressed by a statistical tool is more
related to the extent of residential clustering than its presence or
approximate location.

최적화 기법의 활용
• Suppose that the study region is divided into n census tracts, Ω = x1,
x2, x3, . . . , xn, and the aim is to identify a particular number of groups
whose data values are distinctively larger than those of the remaining
census tracts.
• The idea behind the proposed clustering method is that the quality of
a given clustering can be represented by numerical indices, and the
best possible subsets can be found by optimising the index values.
• Which index should we use?

최적화 기법의 활용
• Within-group sum of absolute deviations:
𝑤 = 𝑎𝑖𝑖 𝜇𝑖 − 𝑏𝑖𝑖
𝑛𝑖
𝑖=1
𝑔
𝑖=0
where ni is the number of census tracts in Ai, aij is the weight of the
corresponding census tract and bij is the data value of interest, such
as the population density of an ethnic group; μi refers to the
weighted mean of all data values in Ai.
최적화 기법의 활용
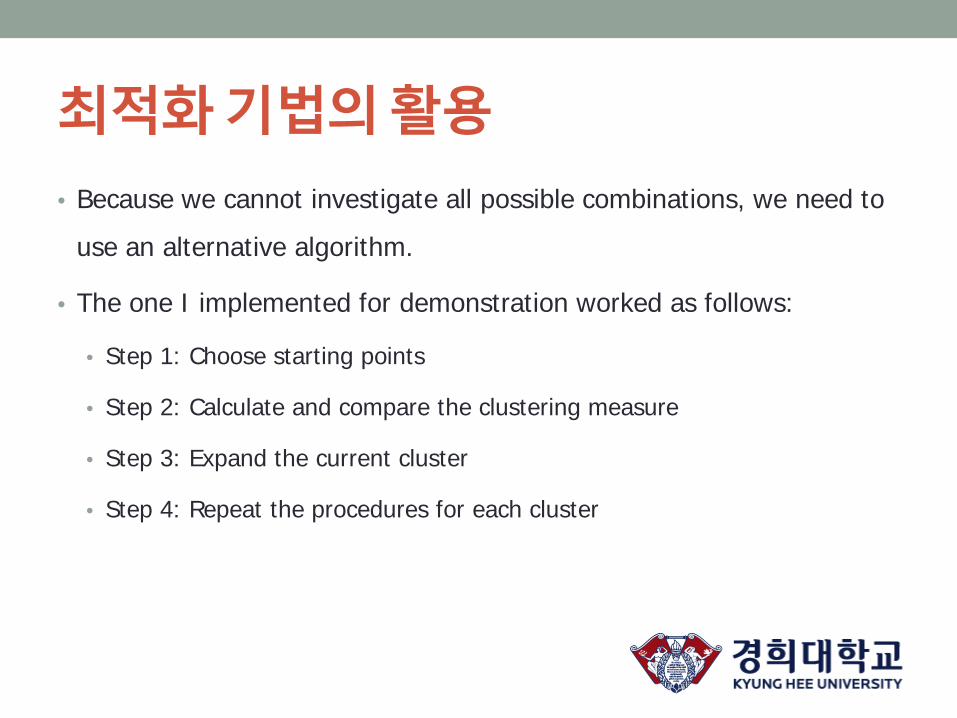
• Because we cannot investigate all possible combinations, we need to
use an alternative algorithm.
• The one I implemented for demonstration worked as follows:
• Step 1: Choose starting points
• Step 2: Calculate and compare the clustering measure
• Step 3: Expand the current cluster
• Step 4: Repeat the procedures for each cluster

• Patterns generated from an exponential distribution with λ = 0.005
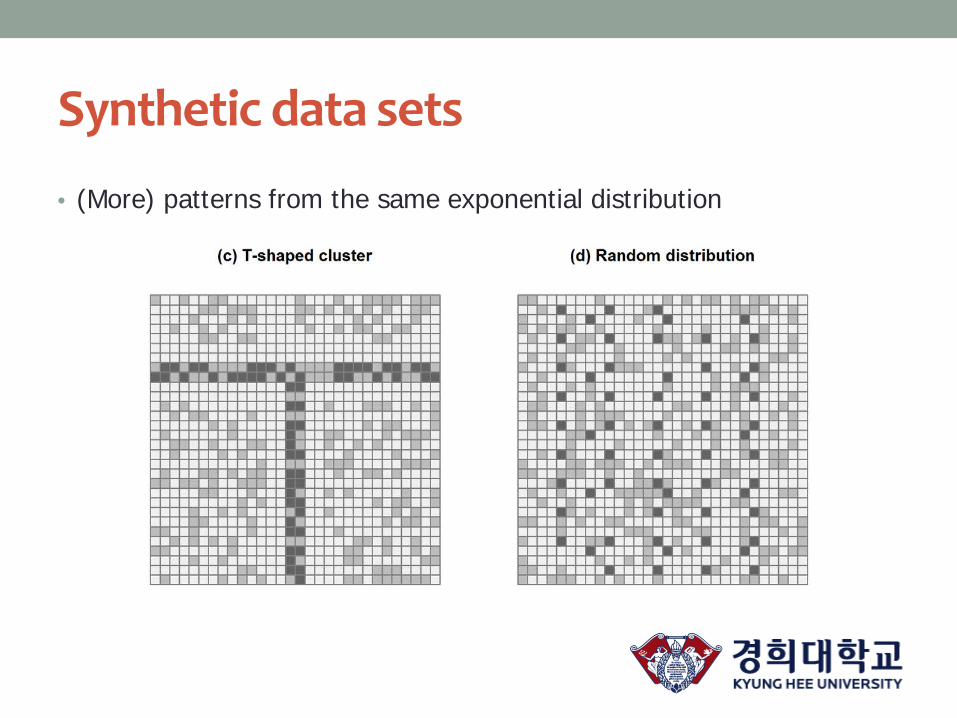
Synthetic data sets
Synthetic data sets
• (More) patterns from the same exponential distribution

Local G* with a distance-based adjacency f.
• Centre-to-centre distance less than 1, 2, 8 m

Local G* with a queen-contiguity matrix
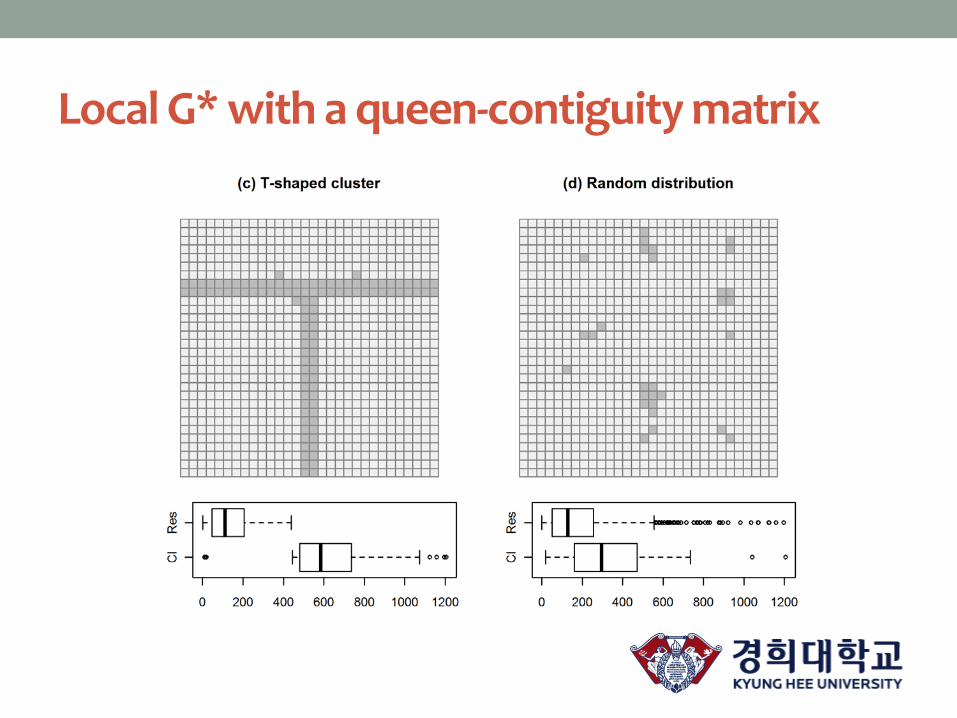
Local G* with a queen-contiguity matrix
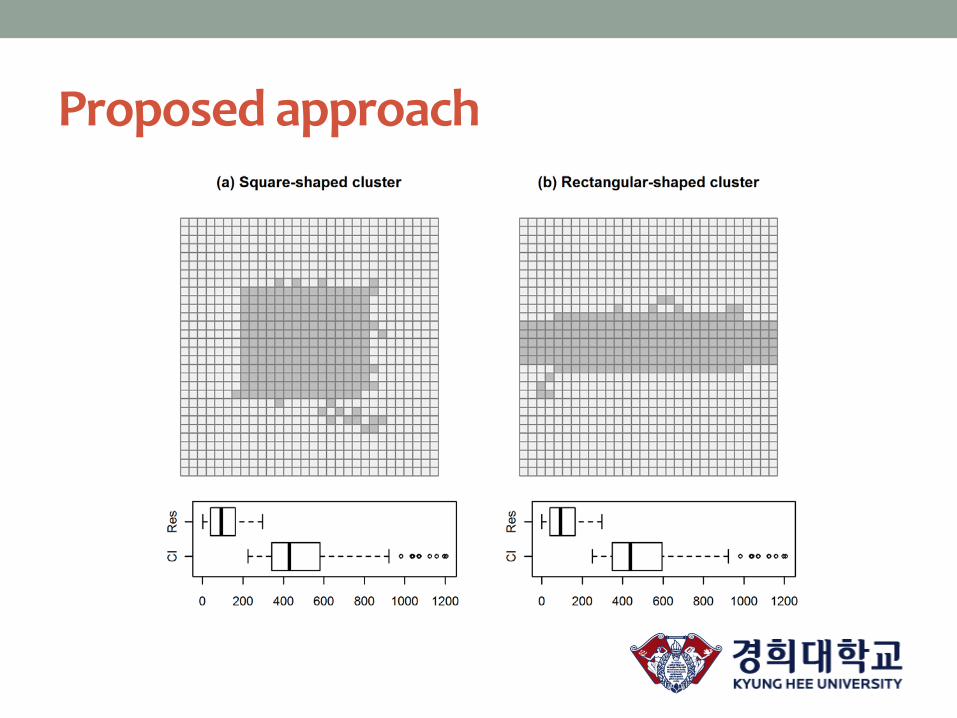
Proposed approach

Proposed approach

Population composition in Auckland
Table 1. Index of dissimilarity (D) for major ethnic groups in Auckland,
2001
Asian
European Chinese Indians Korean All
D 0.387 0.330 0.358 0.453 0.300
Pacific peoples
Māori Samoan Tongan Cook Island All
D 0.321 0.490 0.511 0.484 0.527

Pacific peoples in Auckland
• Geographic distribution of
Pacific peoples in the Auckland
urban areas, 2006

Results
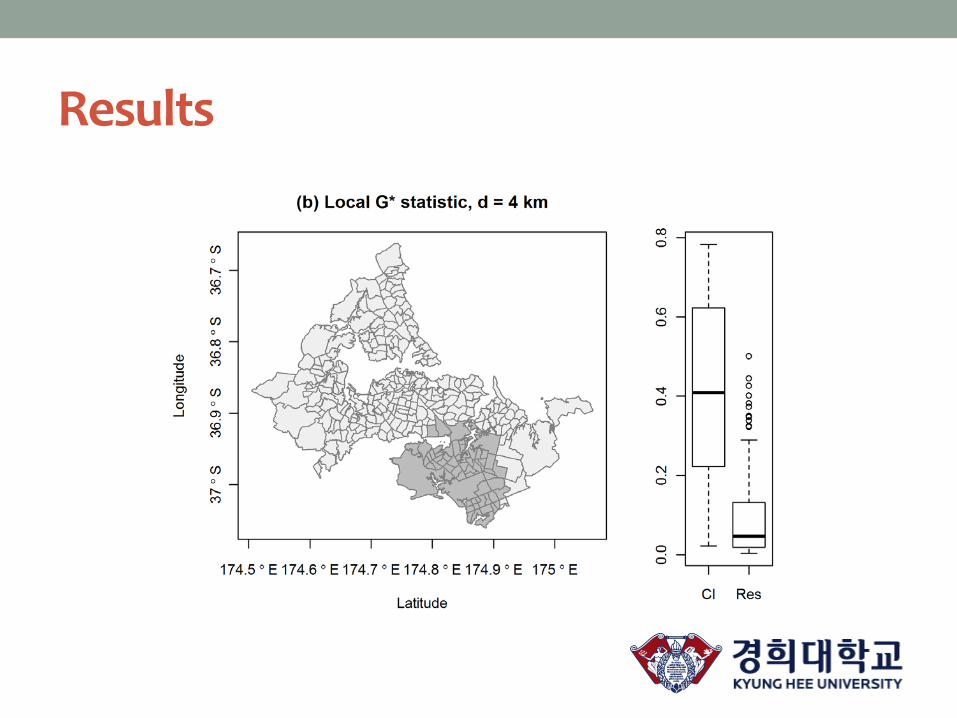
Results

Koreans in Auckland
• Geographic distribution of
Koreans in the Auckland urban
areas, 2006
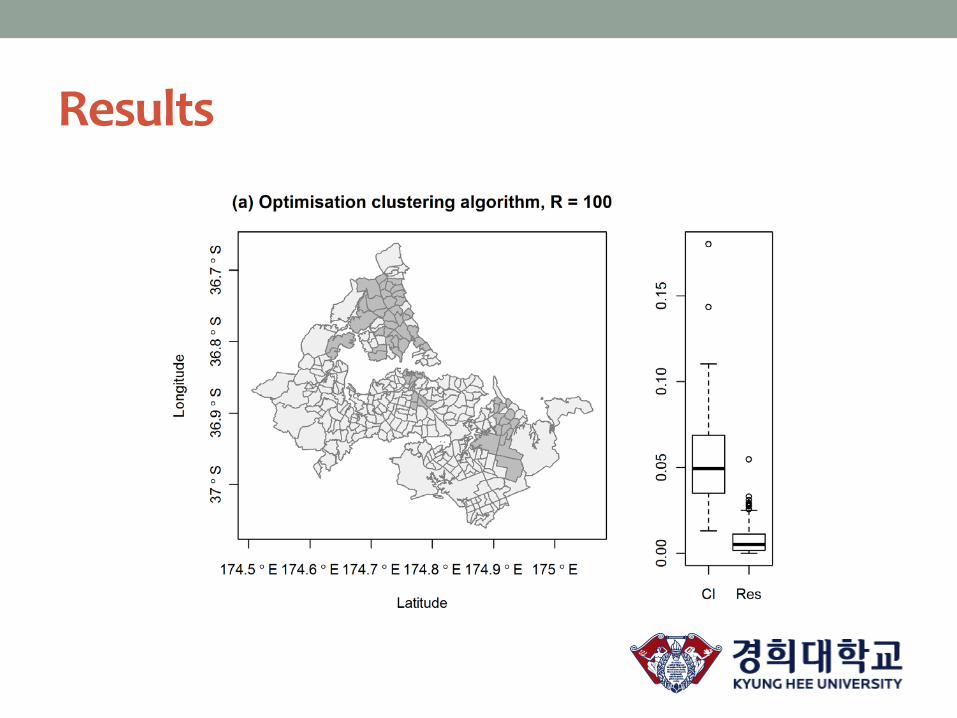
Results
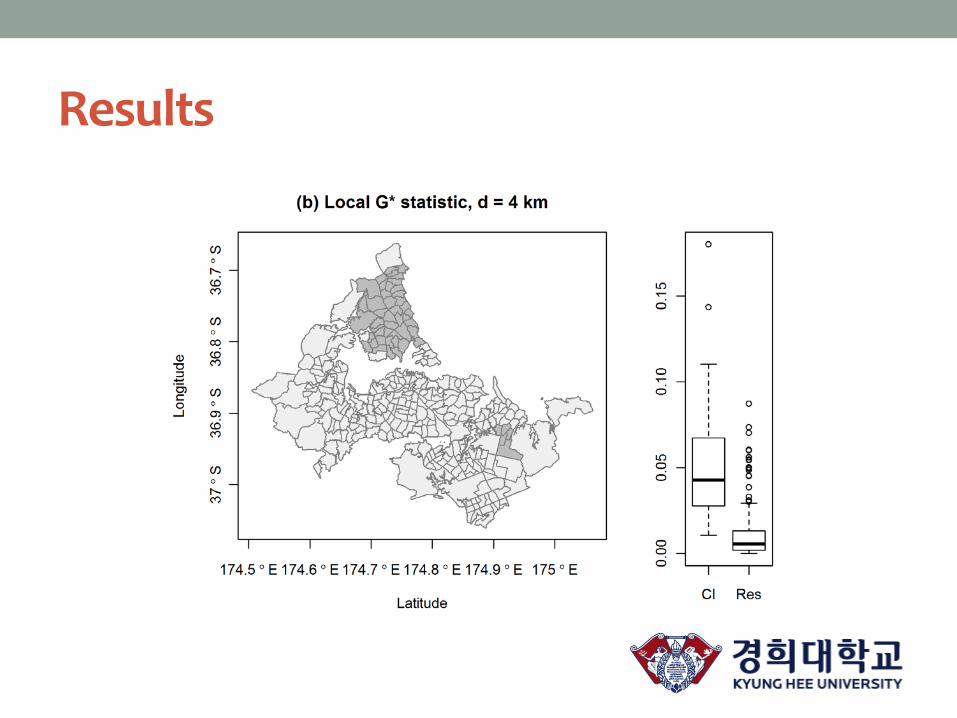
Results
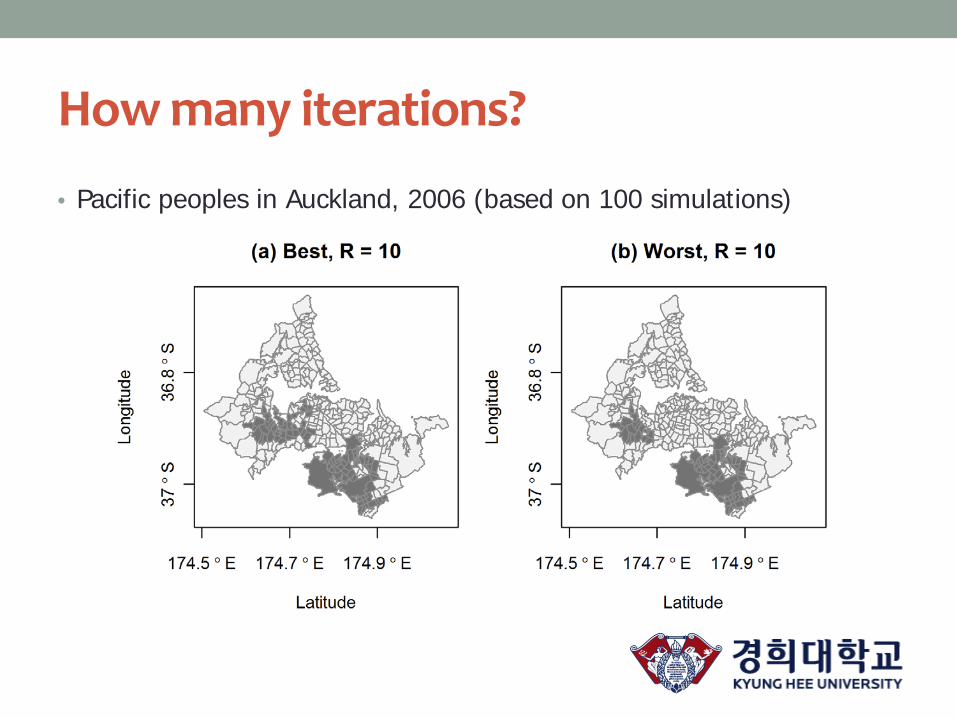
How many iterations?
• Pacific peoples in Auckland, 2006 (based on 100 simulations)

How many iterations?
• Pacific peoples in Auckland, 2006 (based on 100 simulations)

How many iterations?
• Koreans in Auckland, 2006 (based on 100 simulations)

How many iterations?
• Koreans in Auckland, 2006 (based on 100 simulations)
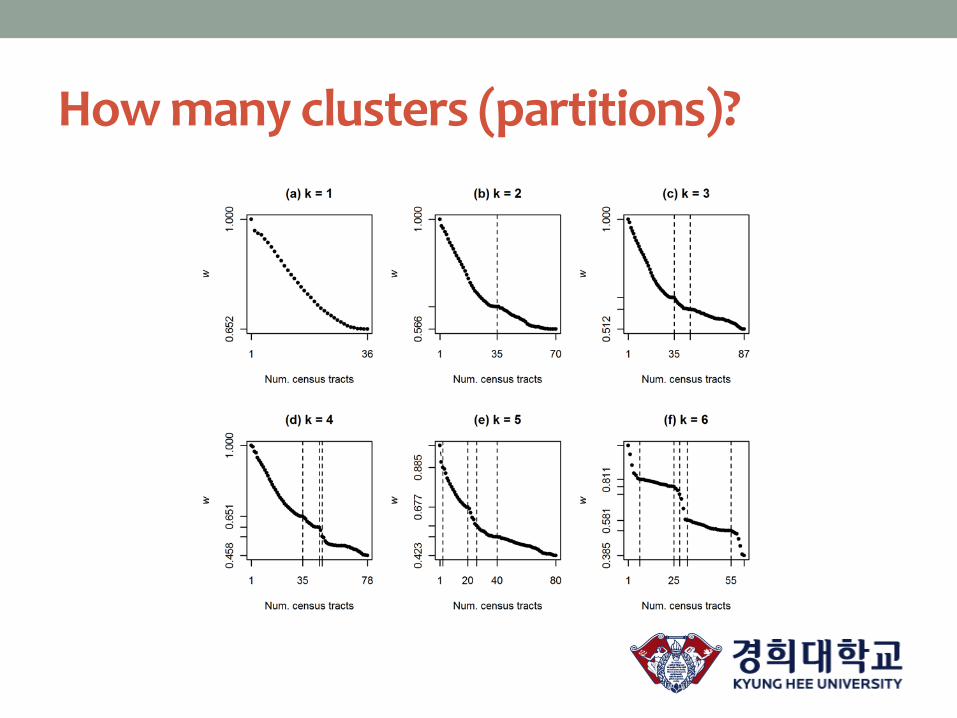
How many clusters (partitions)?

How many clusters (partitions)?

Random seeds vs. manual seeds
• Some unpublished figures for Pacific peoples ...
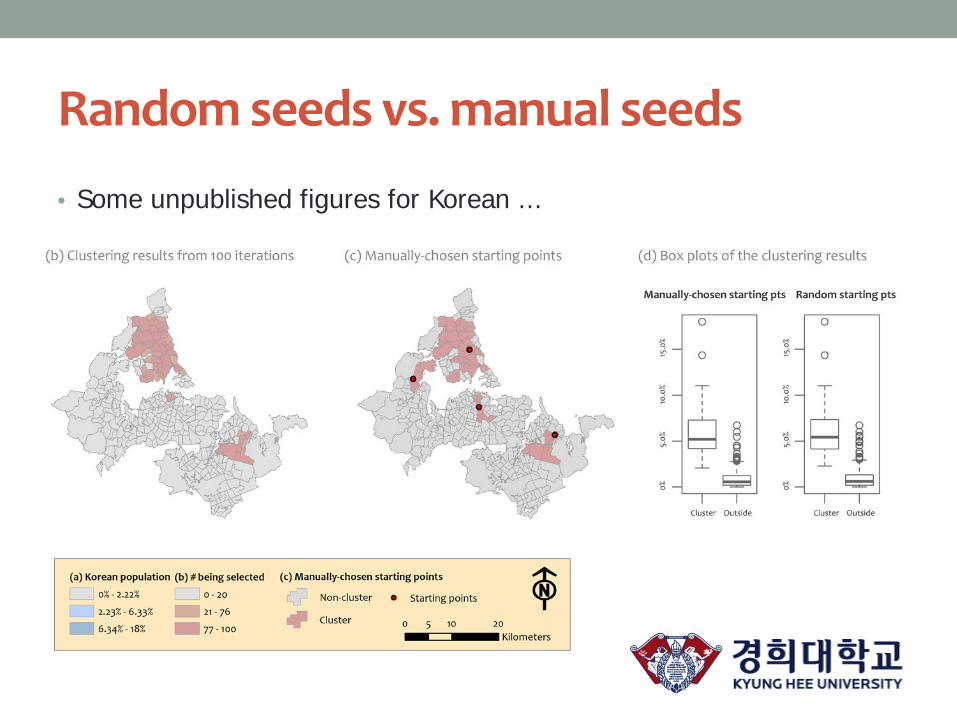
Random seeds vs. manual seeds
• Some unpublished figures for Korean ...

결과 정리
• Same as most other local statistics in the sense that it attempts to
identify a set of geographically close observations with high (or low,
depending on the context) data values in relation to the rest of the
data
• Does not require defining ‘close’ or ‘high’ prior to its application, and
this feature provides an advantage over the other traditional methods
in terms of delineating the boundaries of arbitrarily shaped clusters

결과 정리
• Possible to obtain similar results from other recently developed
clustering methods (e.g. Tango and Takahashi 2005, Mu and Wang
2008, Yao et al. 2011), but they set the upper limit of cluster size for
computational reasons or adopt inferential statistics as a clustering
criterion.
• Maybe reasonable for epidemiological research, where the cluster to be
found can be small and the data are usually derived from samples, but
probably not for residential clusters of population groups
• Computation is more straightforward than the other (scan statistic-based)
‘flexible’ approaches.

• Similar to k-means
Albany Buffalo
Cincinnati Newark
적용가능한 사례
N’hood Type
Albany Buffalo

Computer implementation
• Some ‘proof-of-concept’ level functions have been written in R.
• Working but slow ...
• More stable versions will be included in the ‘seg’ package, hopefully
before August of this year.

참고 문헌 Duncan OD, and Duncan B. 1955. A methodological analysis of
segregation indexes. American Sociological Review 20: 210-217.
White MJ. 1983. The measurement of spatial segregation. The American Journal of Sociology 88: 1008-1018.
Reardon SF, and O'Sullivan D. 2004. Measures of Spatial Segregation Sociological Methodology 34: 121-162.
Poulsen M, Johnston R, and Forrest J. 2010. The intensity of ethnic residential clustering: exploring scale effects using local indicators of spatial association. Environment and Planning A 42: 874-894.
Hong S-Y, and O'Sullivan D. 2012. Detecting ethnic residential clusters using an optimisation clustering method. International Journal of Geographical Information Science: 1-21.


![[전문가 발표] 로.열.모. (김홍석 박사)](https://static.fdocument.pub/doc/165x107/55d1321bbb61ebbe5f8b4739/-55d1321bbb61ebbe5f8b4739.jpg)


![[전문가 발표] DRC참가기 & 로봇 정신 (한재권 박사)](https://static.fdocument.pub/doc/165x107/55d131eebb61ebc35f8b4700/-drc-.jpg)