รอบด้านตลาดหุ้น - Bualuang
32
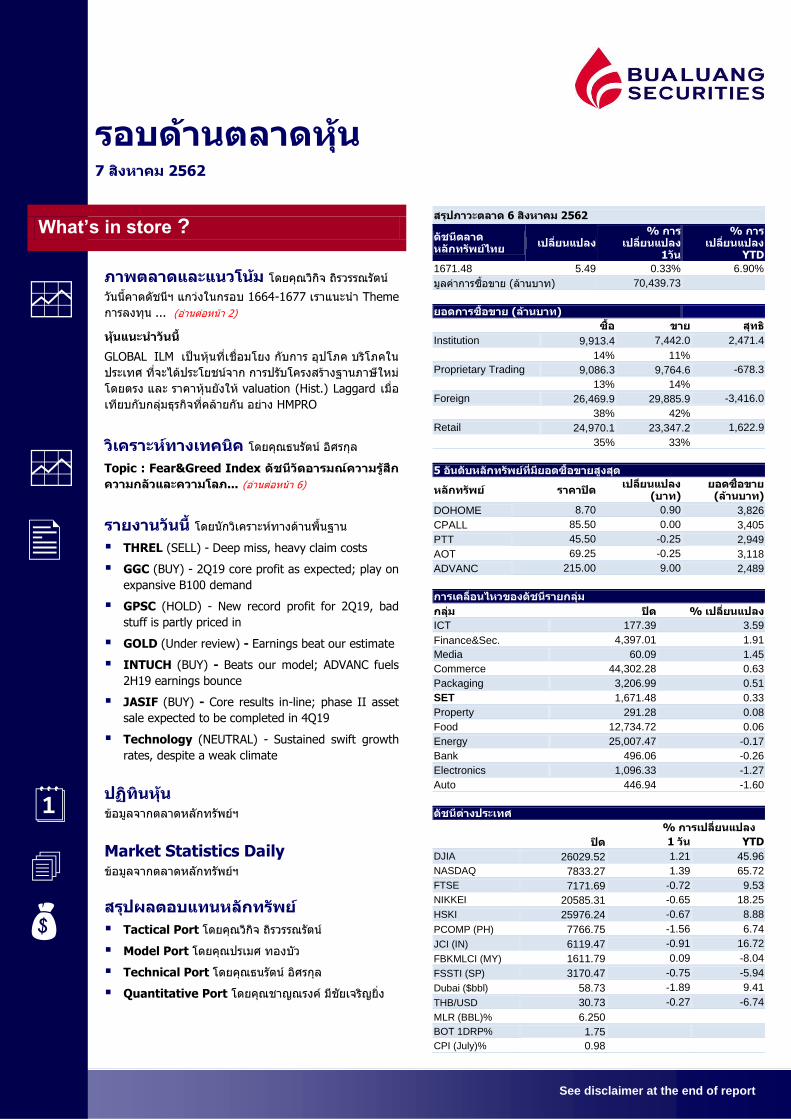
See disclaimer at the end of report รอบด้านตลาดหุ้น 7 สิงหาคม 2562 ส What’s in store ? ภาพตลาดและแนวโน้ม โดยคุณวิกิจ ถิรวรรณรัตน์ วันนี้คาดดัชนีฯ แกว่งในกรอบ 1664-1677 เราแนะนา Theme การลงทุน ... (อ่านต่อหน้า 2) หุ้นแนะนาวันนี้ GLOBAL ILM เป็นหุ้นที่เชื่อมโยง กับการ อุปโภค บริโภคใน ประเทศ ที่จะได้ประโยชน์จาก การปรับโครงสร้างฐานภาษีใหม่ โดยตรง และ ราคาหุ้นยังให้ valuation (Hist.) Laggard เมื่อ เทียบกับกลุ่มธุรกิจที่คล้ายกัน อย่าง HMPRO วิเคราะห์ทางเทคนิค โดยคุณธนรัตน์ อิศรกุล Topic : Fear&Greed Index ดัชนีวัดอารมณ์ความรู้สึก ความกลัวและความโลภ... (อ่านต่อหน้า 6) รายงานวันนี้ โดยนักวิเคราะห์ทางด้านพื้นฐาน THREL (SELL) - Deep miss, heavy claim costs GGC (BUY) - 2Q19 core profit as expected; play on expansive B100 demand GPSC (HOLD) - New record profit for 2Q19, bad stuff is partly priced in GOLD (Under review) - Earnings beat our estimate INTUCH (BUY) - Beats our model; ADVANC fuels 2H19 earnings bounce JASIF (BUY) - Core results in-line; phase II asset sale expected to be completed in 4Q19 Technology (NEUTRAL) - Sustained swift growth rates, despite a weak climate ปฏิทินหุ้น ข้อมูลจากตลาดหลักทรัพย์ฯ Market Statistics Daily ข้อมูลจากตลาดหลักทรัพย์ฯ สรุปผลตอบแทนหลักทรัพย์ Tactical Port โดยคุณวิกิจ ถิรวรรณรัตน์ Model Port โดยคุณปรเมศ ทองบัว Technical Port โดยคุณธนรัตน์ อิศรกุล Quantitative Port โดยคุณชาญณรงค์ มีชัยเจริญยิ่ง สรุปภาวะตลาด 6 สิงหาคม 2562 ดัชนีตลาด หลักทรัพย์ไทย เปลี่ยนแปลง % การ เปลี่ยนแปลง 1วัน % การ เปลี่ยนแปลง YTD 1671.48 5.49 0.33% 6.90% มูลค่าการซื้อขาย (ล้านบาท) 70,439.73 ยอดการซื้อขาย (ล้านบาท) ซื้อ ขาย สุทธิ Institution 9,913.4 7,442.0 2,471.4 14% 11% Proprietary Trading 9,086.3 9,764.6 -678.3 13% 14% Foreign 26,469.9 29,885.9 -3,416.0 38% 42% Retail 24,970.1 23,347.2 1,622.9 35% 33% 5 อันดับหลักทรัพย์ที่มียอดซื้อขายสูงสุด หลักทรัพย์ ราคาปิด เปลี่ยนแปลง (บาท) ยอดซื้อขาย (ล้านบาท) DOHOME 8.70 0.90 3,826 CPALL 85.50 0.00 3,405 PTT 45.50 -0.25 2,949 AOT 69.25 -0.25 3,118 ADVANC 215.00 9.00 2,489 การเคลื่อนไหวของดัชนีรายกลุ่ม กลุ่ม ปิด % เปลี่ยนแปลง ICT 177.39 3.59 Finance&Sec. 4,397.01 1.91 Media 60.09 1.45 Commerce 44,302.28 0.63 Packaging 3,206.99 0.51 SET 1,671.48 0.33 Property 291.28 0.08 Food 12,734.72 0.06 Energy 25,007.47 -0.17 Bank 496.06 -0.26 Electronics 1,096.33 -1.27 Auto 446.94 -1.60 ดัชนีต่างประเทศ % การเปลี่ยนแปลง ปิด 1 วัน YTD DJIA 26029.52 1.21 45.96 NASDAQ 7833.27 1.39 65.72 FTSE 7171.69 -0.72 9.53 NIKKEI 20585.31 -0.65 18.25 HSKI 25976.24 -0.67 8.88 PCOMP (PH) 7766.75 -1.56 6.74 JCI (IN) 6119.47 -0.91 16.72 FBKMLCI (MY) 1611.79 0.09 -8.04 FSSTI (SP) 3170.47 -0.75 -5.94 Dubai ($bbl) 58.73 -1.89 9.41 THB/USD 30.73 -0.27 -6.74 MLR (BBL)% 6.250 BOT 1DRP% 1.75 CPI (July)% 0.98
Transcript of รอบด้านตลาดหุ้น - Bualuang
See disclaimer at the end of report
รอบดานตลาดหน 7 สงหาคม 2562 ส
What’s in store ?
ภาพตลาดและแนวโนม โดยคณวกจ ถรวรรณรตน วนนคาดดชนฯ แกวงในกรอบ 1664-1677 เราแนะน า Theme
การลงทน ... (อานตอหนา 2)
หนแนะน าวนน
GLOBAL ILM เปนหนทเชอมโยง กบการ อปโภค บรโภคใน
ประเทศ ทจะไดประโยชนจาก การปรบโครงสรางฐานภาษใหม
โดยตรง และ ราคาหนยงให valuation (Hist.) Laggard เมอ
เทยบกบกลมธรกจทคลายกน อยาง HMPRO
วเคราะหทางเทคนค โดยคณธนรตน อศรกล
Topic : Fear&Greed Index ดชนวดอารมณความรสก
ความกลวและความโลภ... (อานตอหนา 6)
รายงานวนน โดยนกวเคราะหทางดานพนฐาน
THREL (SELL) - Deep miss, heavy claim costs
GGC (BUY) - 2Q19 core profit as expected; play on
expansive B100 demand
GPSC (HOLD) - New record profit for 2Q19, bad
stuff is partly priced in
GOLD (Under review) - Earnings beat our estimate
INTUCH (BUY) - Beats our model; ADVANC fuels
2H19 earnings bounce
JASIF (BUY) - Core results in-line; phase II asset
sale expected to be completed in 4Q19
Technology (NEUTRAL) - Sustained swift growth
rates, despite a weak climate
ปฏทนหน ขอมลจากตลาดหลกทรพยฯ
Market Statistics Daily ขอมลจากตลาดหลกทรพยฯ
สรปผลตอบแทนหลกทรพย
Tactical Port โดยคณวกจ ถรวรรณรตน
Model Port โดยคณปรเมศ ทองบว
Technical Port โดยคณธนรตน อศรกล
Quantitative Port โดยคณชาญณรงค มชยเจรญยง
สรปภาวะตลาด 6 สงหาคม 2562
ดชนตลาดหลกทรพยไทย
เปลยนแปลง % การ
เปลยนแปลง 1วน
% การเปลยนแปลง
YTD
1671.48 5.49 0.33% 6.90%
มลคาการซอขาย (ลานบาท) 70,439.73
ยอดการซอขาย (ลานบาท)
ซอ ขาย สทธ
Institution 9,913.4 7,442.0 2,471.4
14% 11%
Proprietary Trading 9,086.3 9,764.6 -678.3
13% 14%
Foreign 26,469.9 29,885.9 -3,416.0
38% 42%
Retail 24,970.1 23,347.2 1,622.9
35% 33%
5 อนดบหลกทรพยทมยอดซอขายสงสด
หลกทรพย ราคาปด เปลยนแปลง
(บาท) ยอดซอขาย (ลานบาท)
DOHOME 8.70 0.90 3,826
CPALL 85.50 0.00 3,405
PTT 45.50 -0.25 2,949
AOT 69.25 -0.25 3,118
ADVANC 215.00 9.00 2,489
การเคลอนไหวของดชนรายกลม
กลม ปด % เปลยนแปลง
ICT 177.39 3.59
Finance&Sec. 4,397.01 1.91
Media 60.09 1.45
Commerce 44,302.28 0.63
Packaging 3,206.99 0.51
SET 1,671.48 0.33
Property 291.28 0.08
Food 12,734.72 0.06
Energy 25,007.47 -0.17
Bank 496.06 -0.26
Electronics 1,096.33 -1.27
Auto 446.94 -1.60
ดชนตางประเทศ
% การเปลยนแปลง
ปด 1 วน YTD
DJIA 26029.52 1.21 45.96
NASDAQ 7833.27 1.39 65.72
FTSE 7171.69 -0.72 9.53
NIKKEI 20585.31 -0.65 18.25
HSKI 25976.24 -0.67 8.88
PCOMP (PH) 7766.75 -1.56 6.74
JCI (IN) 6119.47 -0.91 16.72
FBKMLCI (MY) 1611.79 0.09 -8.04
FSSTI (SP) 3170.47 -0.75 -5.94
Dubai ($bbl) 58.73 -1.89 9.41
THB/USD 30.73 -0.27 -6.74
MLR (BBL)% 6.250
BOT 1DRP% 1.75
CPI (July)% 0.98
รอบดานตลาดหน 2
ภาพตลาดและแนวโนม
Earnings Conviction Buy List.
เมอวานหน “Domestic play” บวกยกแผง เชน มอถอ AIS TRUE DTAC INTUCH หลง ADVANC รายงาน
“รายได” เตบโตดเกนคาด+โปรโมชนในการตดราคาลดลงอยางมนยยะ สะทอนการแขงขน (สงคราม
ราคา) ทลดความรนแรงลง, หนไดอานสงส จากการซอหนเสย เชน JMT และ กลมนคมฯ WHA AMATA...
ขณะทหน Mid-small cap สวนใหญมแรง “ซอคน” ดนปดบวกแรง
สวนกลมทลงแยกวาตลาดยงคงเปนกลม ปโตรฯ โรงกลน ถานหน สงออก (Global play) และหน งบ ผด
คาด อยาง TU GGC
วนนคาดดชนฯ แกวงในกรอบ 1664-1677 จด
What to watch:
(+) Earings Conviction Buy List: จากรายงาน งบ 2Q19 บจ. ทเราศกษา กลยทธคาดวา หนทจะรายงาน
ก าไรดกวาคาด/ดตามคาดและมโอกาสต า-ทก าไรจะสรางความผดหวง, ราคาหนมการ Consolidated ลง
มาในระดบหนง หรอ ตลาดแทบไมใหความสนใจกบงบใน บจ.นนๆ (Low expectation on earnings) เรา
แนะน า ซอ TFG CPF BCH JMT TQM M SEAFCO
สวนหนท BLS research มองก าไรจะออกมาด แตกลยทธมองวาราคาหน ณ.ระดบปจจบน ไดสะทอน งบ
ทดไปแลวในระดบหนง หรอ ตลาดรบรอยแลววางบด กลมน ไดแก SAWAD MTC MINT GFPT ADVANC
HMPRO AU PLANB VGI เปนตน
(+) วนน FETCO (สภาธรกจตลาดทนไทย) จะเขาพบ รมว. คลง เพอเสนอรปแบบ กองทนใหม แทน LTF
ทจะหมดอายปลายปน...
หากก าหนดวงเงน เปน 30% ของรายไดพงประเมน และไมเกน 2.5 แสนบาท (จากเดม 15% วงเงน 5
แสนบาท) เรามองวาเปนตวสะทอนทชดเจนวา คอ การรองรบ “การปรบโครงสรางภาษรายไดบคคล
ธรรมดาลง” ตามทรฐบาลหาเสยงไว ซงตอนนอยในชวงของการ ศกษาแนวทางและวธการดงรายไดสวน
อนมาชดเชยการปรบลดภาษบคคลฯ
โครงสรางภาษใหม คาดจะเรมใช กลางปหนา ทนใชรวมกบ LTF ใหม และหนทนาจะไดประโยชน คาดวา
จะเปนกลมคาปลก และ บรโภคในประเทศ ทองกบ ก าลงซอทกกลมโดยเฉพาะ บคคลธรรมดา ในระบบ
ฐานภาษ... หนเชอมโยงโดยตรง เชน TFG ILM M GLOBAL HMPRO BJC CPALL COM7 JMART PLANB
VGI JKN TACC SF ฯลฯ
(0) คนน (7 สค.) MSCI review ทบทวนหนเขาออกในการค านวณ และ น าหนกในการลงทน รอบครงป ม
ผล 27 สค.
(+) เมอวาน ธ.กลางออสเตรเลย ตดสนใจคงดอกเบย 1% ตามตลาดคาด สวนวนน คาด ธนาคารกลาง
อนเดย จะตดสนใจลดดอกเบยลงอก 0.25% เหลอ 5.5% สวนไทยวนน คาด กนง.คงดอกเบยท 1.75%
พรงน คาด ธนาคารกลางฟลปปนส จะลดดอกเบย 0.25% เหลอ 4.25%
(+) พรงน ECB จะรายงานภาวะเศรษฐกจ ตลาดจะรอตความเพอคาดการณ ชวงเวลาในการออก QE รอบ
ใหม (MS ยงคงคาดวา ECB จะออกชวงปลายปน หรอ ตนปหนา)
(+/-) ก าไรแยกวาคาด GGC TU THREL ก าไรดกวาคาด INTUCH (ดรายงานวนน)
หนแนะน า
GLOBAL ILM เปนหนทเชอมโยง กบการ อปโภค บรโภคในประเทศ ทจะไดประโยชนจาก การปรบ
โครงสรางฐานภาษใหมโดยตรง และ ราคาหนยงให valuation (Hist.) Laggard เมอเทยบกบกลมธรกจท
คลายกน อยาง HMPRO
รอบดานตลาดหน 3
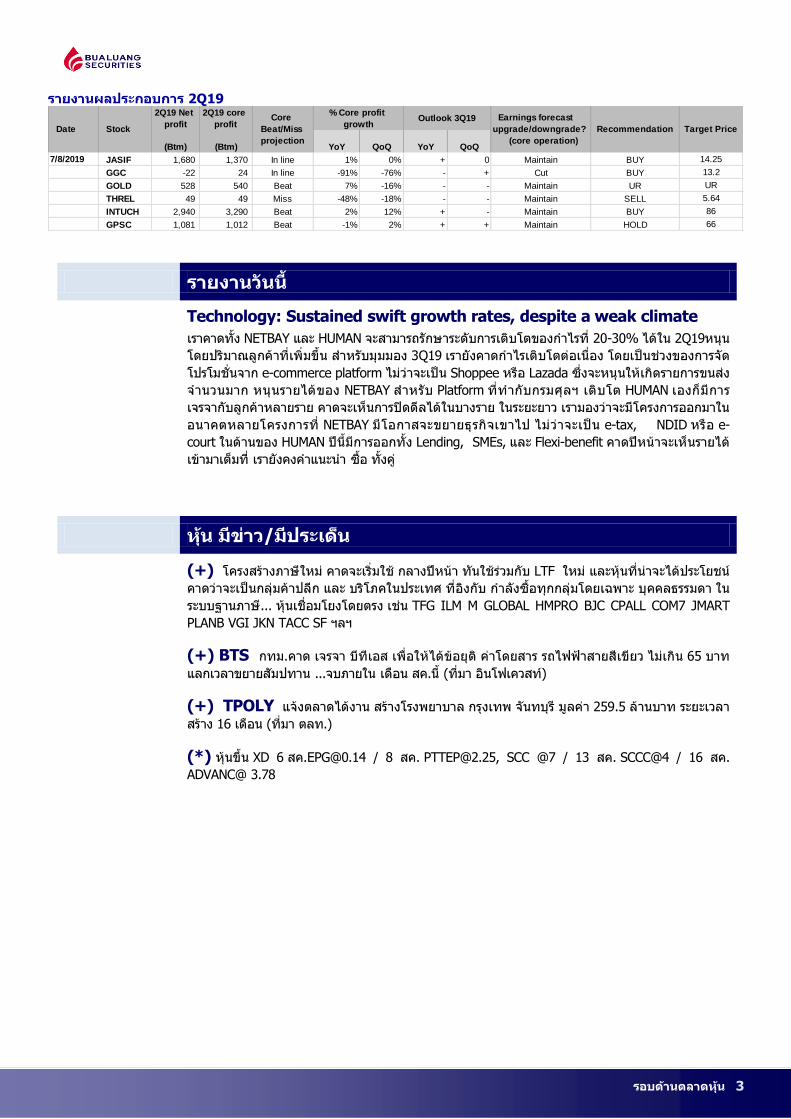
รายงานผลประกอบการ 2Q19
(Btm) (Btm) YoY QoQ YoY QoQ
7/8/2019 JASIF 1,680 1,370 In line 1% 0% + 0 Maintain BUY 14.25
GGC -22 24 In line -91% -76% - + Cut BUY 13.2
GOLD 528 540 Beat 7% -16% - - Maintain UR UR
THREL 49 49 Miss -48% -18% - - Maintain SELL 5.64
INTUCH 2,940 3,290 Beat 2% 12% + - Maintain BUY 86
GPSC 1,081 1,012 Beat -1% 2% + + Maintain HOLD 66
Date Stock
2Q19 Net
profit
2Q19 core
profitCore
Beat/Miss
projection
% Core profit
growthOutlook 3Q19 Earnings forecast
upgrade/downgrade?
(core operation)
Recommendation Target Price
รายงานวนน
Technology: Sustained swift growth rates, despite a weak climate
เราคาดทง NETBAY และ HUMAN จะสามารถรกษาระดบการเตบโตของก าไรท 20-30% ไดใน 2Q19หนน
โดยปรมาณลกคาทเพมขน ส าหรบมมมอง 3Q19 เรายงคาดก าไรเตบโตตอเนอง โดยเปนชวงของการจด
โปรโมชนจาก e-commerce platform ไมวาจะเปน Shoppee หรอ Lazada ซงจะหนนใหเกดรายการขนสง
จ านวนมาก หนนรายไดของ NETBAY ส าหรบ Platform ทท ากบกรมศลฯ เตบโต HUMAN เองกมการ
เจรจากบลกคาหลายราย คาดจะเหนการปดดลไดในบางราย ในระยะยาว เรามองวาจะมโครงการออกมาใน
อนาคตหลายโครงการท NETBAY มโอกาสจะขยายธรกจเขาไป ไมวาจะเปน e-tax, NDID หรอ e-
court ในดานของ HUMAN ปนมการออกทง Lending, SMEs, และ Flexi-benefit คาดปหนาจะเหนรายได
เขามาเตมท เรายงคงค าแนะน า ซอ ทงค
หน มขาว/มประเดน
(+) โครงสรางภาษใหม คาดจะเรมใช กลางปหนา ทนใชรวมกบ LTF ใหม และหนทนาจะไดประโยชน
คาดวาจะเปนกลมคาปลก และ บรโภคในประเทศ ทองกบ ก าลงซอทกกลมโดยเฉพาะ บคคลธรรมดา ใน
ระบบฐานภาษ... หนเชอมโยงโดยตรง เชน TFG ILM M GLOBAL HMPRO BJC CPALL COM7 JMART
PLANB VGI JKN TACC SF ฯลฯ
(+) BTS กทม.คาด เจรจา บทเอส เพอใหไดขอยต คาโดยสาร รถไฟฟาสายสเขยว ไมเกน 65 บาท
แลกเวลาขยายสมปทาน ...จบภายใน เดอน สค.น (ทมา อนโฟเควสท)
(+) TPOLY แจงตลาดไดงาน สรางโรงพยาบาล กรงเทพ จนทบร มลคา 259.5 ลานบาท ระยะเวลา
สราง 16 เดอน (ทมา ตลท.)
(*) หนขน XD 6 สค[email protected] / 8 สค. [email protected], SCC @7 / 13 สค. SCCC@4 / 16 สค.
ADVANC@ 3.78
รอบดานตลาดหน 4
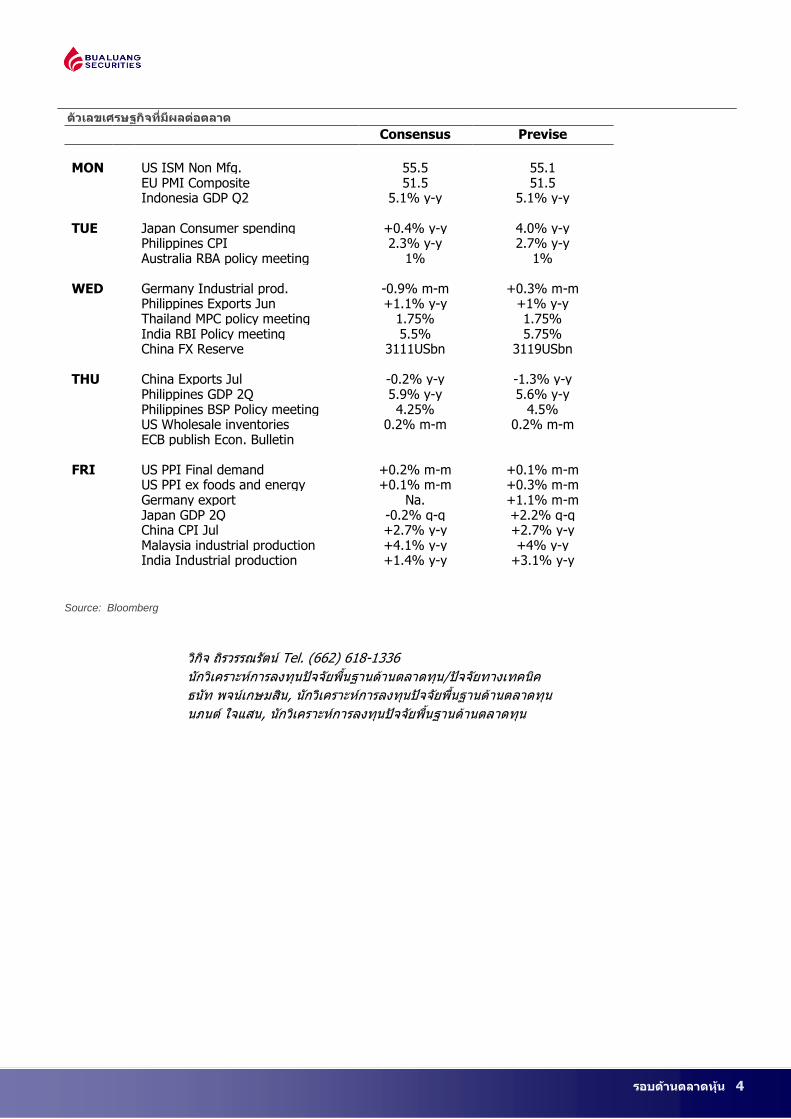
ตวเลขเศรษฐกจทมผลตอตลาด
Consensus Previse
MON
US ISM Non Mfg. 55.5 55.1 EU PMI Composite 51.5 51.5 Indonesia GDP Q2 5.1% y-y 5.1% y-y TUE Japan Consumer spending +0.4% y-y 4.0% y-y Philippines CPI 2.3% y-y 2.7% y-y Australia RBA policy meeting 1% 1% WED Germany Industrial prod. -0.9% m-m +0.3% m-m Philippines Exports Jun +1.1% y-y +1% y-y Thailand MPC policy meeting 1.75% 1.75% India RBI Policy meeting 5.5% 5.75% China FX Reserve 3111USbn 3119USbn THU China Exports Jul -0.2% y-y -1.3% y-y Philippines GDP 2Q 5.9% y-y 5.6% y-y Philippines BSP Policy meeting 4.25% 4.5% US Wholesale inventories 0.2% m-m 0.2% m-m ECB publish Econ. Bulletin FRI US PPI Final demand +0.2% m-m +0.1% m-m US PPI ex foods and energy +0.1% m-m +0.3% m-m Germany export Na. +1.1% m-m Japan GDP 2Q -0.2% q-q +2.2% q-q China CPI Jul +2.7% y-y +2.7% y-y Malaysia industrial production +4.1% y-y +4% y-y India Industrial production +1.4% y-y +3.1% y-y
Source: Bloomberg
วกจ ถรวรรณรตน Tel. (662) 618-1336
นกวเคราะหการลงทนปจจยพนฐานดานตลาดทน/ปจจยทางเทคนค
ธนท พจนเกษมสน, นกวเคราะหการลงทนปจจยพนฐานดานตลาดทน
นภนต ใจแสน, นกวเคราะหการลงทนปจจยพนฐานดานตลาดทน
รอบดานตลาดหน 5
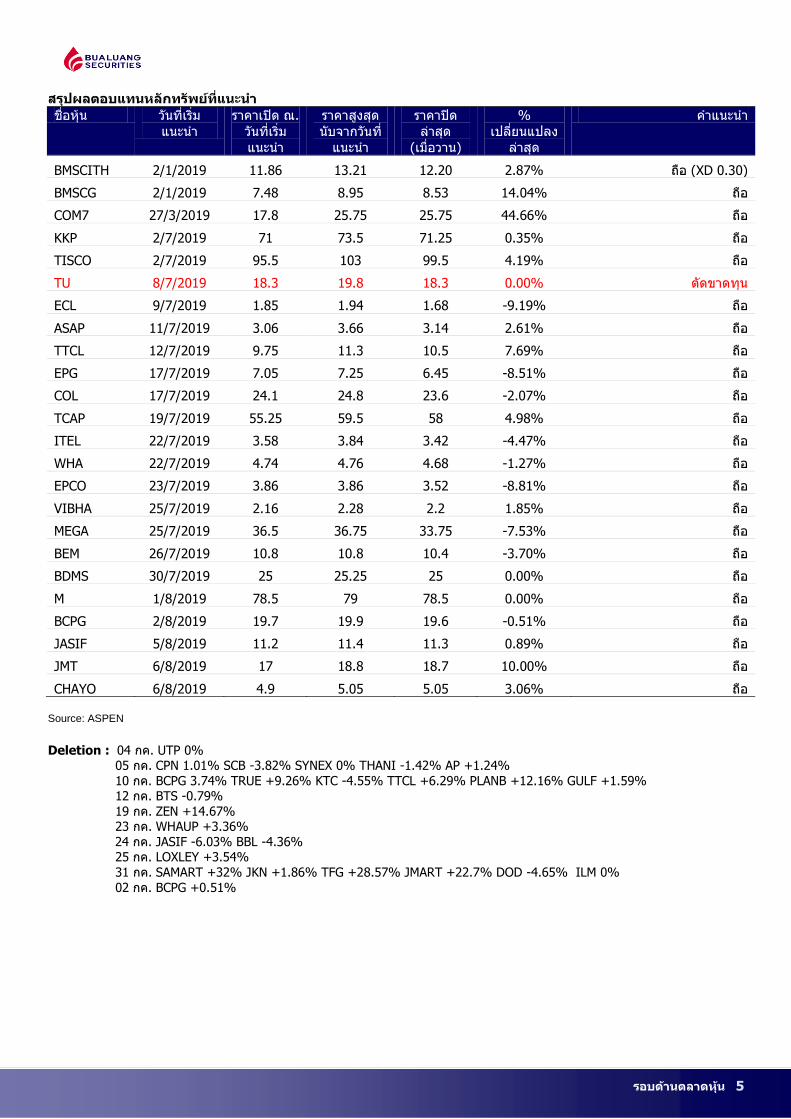
สรปผลตอบแทนหลกทรพยทแนะน า
ชอหน วนทเรม
แนะน า
ราคาเปด ณ.
วนทเรม
แนะน า
ราคาสงสด
นบจากวนท
แนะน า
ราคาปด
ลาสด
(เมอวาน)
%
เปลยนแปลง
ลาสด
ค าแนะน า
BMSCITH 2/1/2019 11.86 13.21 12.20 2.87% ถอ (XD 0.30)
BMSCG 2/1/2019 7.48 8.95 8.53 14.04% ถอ
COM7 27/3/2019 17.8 25.75 25.75 44.66% ถอ
KKP 2/7/2019 71 73.5 71.25 0.35% ถอ
TISCO 2/7/2019 95.5 103 99.5 4.19% ถอ
TU 8/7/2019 18.3 19.8 18.3 0.00% ตดขาดทน
ECL 9/7/2019 1.85 1.94 1.68 -9.19% ถอ
ASAP 11/7/2019 3.06 3.66 3.14 2.61% ถอ
TTCL 12/7/2019 9.75 11.3 10.5 7.69% ถอ
EPG 17/7/2019 7.05 7.25 6.45 -8.51% ถอ
COL 17/7/2019 24.1 24.8 23.6 -2.07% ถอ
TCAP 19/7/2019 55.25 59.5 58 4.98% ถอ
ITEL 22/7/2019 3.58 3.84 3.42 -4.47% ถอ
WHA 22/7/2019 4.74 4.76 4.68 -1.27% ถอ
EPCO 23/7/2019 3.86 3.86 3.52 -8.81% ถอ
VIBHA 25/7/2019 2.16 2.28 2.2 1.85% ถอ
MEGA 25/7/2019 36.5 36.75 33.75 -7.53% ถอ
BEM 26/7/2019 10.8 10.8 10.4 -3.70% ถอ
BDMS 30/7/2019 25 25.25 25 0.00% ถอ
M 1/8/2019 78.5 79 78.5 0.00% ถอ
BCPG 2/8/2019 19.7 19.9 19.6 -0.51% ถอ
JASIF 5/8/2019 11.2 11.4 11.3 0.89% ถอ
JMT 6/8/2019 17 18.8 18.7 10.00% ถอ
CHAYO 6/8/2019 4.9 5.05 5.05 3.06% ถอ Source: ASPEN
Deletion : 04 กค. UTP 0% 05 กค. CPN 1.01% SCB -3.82% SYNEX 0% THANI -1.42% AP +1.24%
10 กค. BCPG 3.74% TRUE +9.26% KTC -4.55% TTCL +6.29% PLANB +12.16% GULF +1.59% 12 กค. BTS -0.79%
19 กค. ZEN +14.67% 23 กค. WHAUP +3.36%
24 กค. JASIF -6.03% BBL -4.36% 25 กค. LOXLEY +3.54%
31 กค. SAMART +32% JKN +1.86% TFG +28.57% JMART +22.7% DOD -4.65% ILM 0%
02 กค. BCPG +0.51%
รอบดานตลาดหน 6
Trend Forecasting | 7 สงหาคม 2562
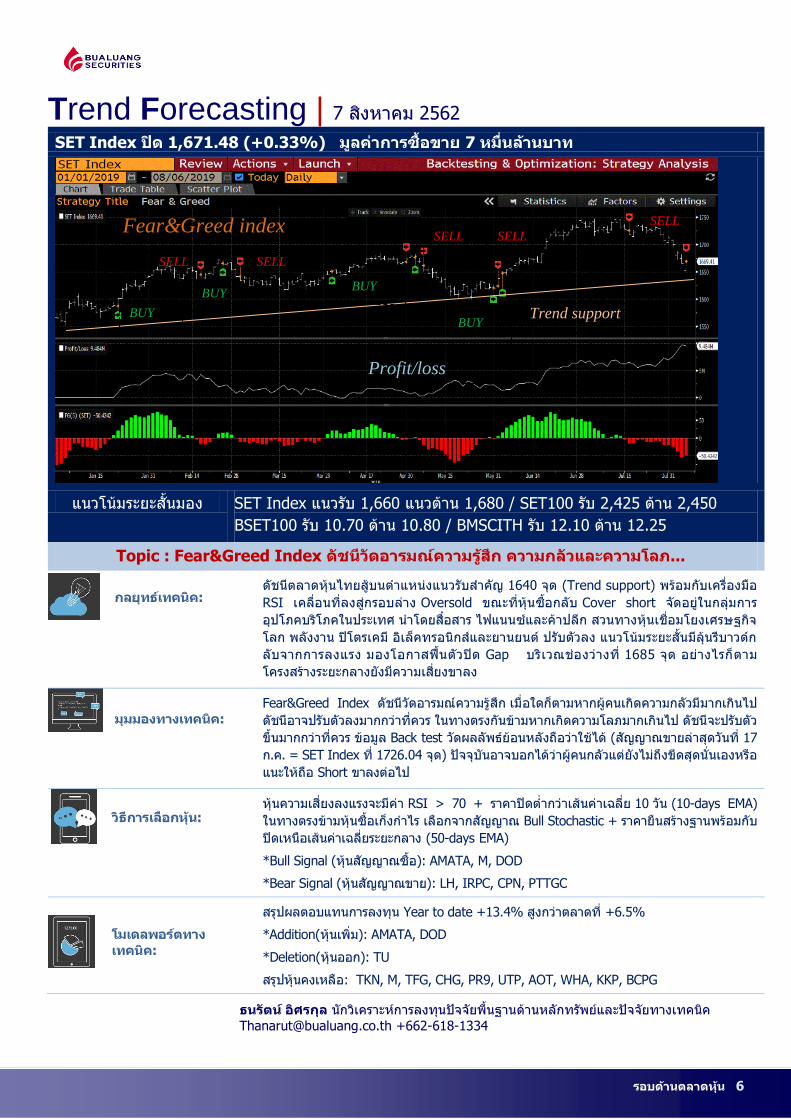
SET Index ปด 1,671.48 (+0.33%) มลคาการซอขาย 7 หมนลานบาท
แนวโนมระยะสนมอง SET Index แนวรบ 1,660 แนวตาน 1,680 / SET100 รบ 2,425 ตาน 2,450
BSET100 รบ 10.70 ตาน 10.80 / BMSCITH รบ 12.10 ตาน 12.25
Topic : Fear&Greed Index ดชนวดอารมณความรสก ความกลวและความโลภ...
กลยทธเทคนค: ดชนตลาดหนไทยสบนต าแหนงแนวรบส าคญ 1640 จด (Trend support) พรอมกบเครองมอ
RSI เคลอนทลงสกรอบลาง Oversold ขณะทหนซอกลบ Cover short จดอยในกลมการ
อปโภคบรโภคในประเทศ น าโดยสอสาร ไฟแนนซและคาปลก สวนทางหนเชอมโยงเศรษฐกจ
โลก พลงงาน ปโตรเคม อเลคทรอนกสและยานยนต ปรบตวลง แนวโนมระยะสนมลนรบาวดก
ลบจากการลงแรง มองโอกาสฟนตวปด Gap บรเวณชองวางท 1685 จด อยางไรกตาม
โครงสรางระยะกลางยงมความเสยงขาลง
มมมองทางเทคนค: Fear&Greed Index ดชนวดอารมณความรสก เมอใดกตามหากผคนเกดความกลวมมากเกนไป
ดชนอาจปรบตวลงมากกวาทควร ในทางตรงกนขามหากเกดความโลภมากเกนไป ดชนจะปรบตว
ขนมากกวาทควร ขอมล Back test วดผลลพธยอนหลงถอวาใชได (สญญาณขายลาสดวนท 17
ก.ค. = SET Index ท 1726.04 จด) ปจจบนอาจบอกไดวาผคนกลวแตยงไมถงขดสดนนเองหรอ
แนะใหถอ Short ขาลงตอไป
วธการเลอกหน: หนความเสยงลงแรงจะมคา RSI > 70 + ราคาปดต ากวาเสนคาเฉลย 10 วน (10-days EMA)
ในทางตรงขามหนซอเกงก าไร เลอกจากสญญาณ Bull Stochastic + ราคายนสรางฐานพรอมกบ
ปดเหนอเสนคาเฉลยระยะกลาง (50-days EMA)
*Bull Signal (หนสญญาณซอ): AMATA, M, DOD
*Bear Signal (หนสญญาณขาย): LH, IRPC, CPN, PTTGC
โมเดลพอรตทาง
เทคนค:
สรปผลตอบแทนการลงทน Year to date +13.4% สงกวาตลาดท +6.5%
*Addition(หนเพม): AMATA, DOD
*Deletion(หนออก): TU
สรปหนคงเหลอ: TKN, M, TFG, CHG, PR9, UTP, AOT, WHA, KKP, BCPG
ธนรตน อศรกล นกวเคราะหการลงทนปจจยพนฐานดานหลกทรพยและปจจยทางเทคนค [email protected] +662-618-1334
Fear&Greed index
Trend support
SELL
BUY
SELL
BUY
SELL
SELL
BUY
BUY
Profit/loss
SELL

รอบดานตลาดหน 7
Back testing: Fear&Greed Index
Winning and Losing chance

รอบดานตลาดหน 8
Track with Technical AMATA(AMAT01C2001A) แนะน า ซอ
รบ 24.30
ตาน 27.00-28.00
เหตผล พบสญญาณซอ
Bullish signal มาก
ทสดในหนขนาด
กลาง SET100 บงช
โอกาสดดตวขน
M แนะน า ซอ
รบ 78.00
ตาน 82.00-83.00
เหตผล M ราคาดดกลบบน
เสนคาเฉลยระยะ
กลาง หนนดวย
เครองมอวด
โมเมนตมหลายชนด
บงชสญญาณกลบตว
ทงระยะสนและกลาง
DOD แนะน า ซอ
รบ 11.50
ตาน 15.00
เหตผล DOD ราคาดดกลบ
บนเสนคาเฉลยระยะ
กลาง หนนดวย
เครองมอวด
โมเมนตมหลายชนด
บงชสญญาณกลบตว
ทงระยะสนและกลาง
Bull Stochastic
50-days EMA
Bull Stochastic
50-days EMA

รอบดานตลาดหน 9
สรปหนแนะน าในรอบ 2 สปดาห
วน/เดอน/ป หนแนะน าซอ หนแนะน าขาย หนคงเหลอในพอรต
23 ก.ค.62 SCB,M,ECL TRUE SAMART,PLANB,TTA,PSL,TU,ASAP,
NER,COL,UTP,ECL,MONO,GUNKUL,TKN
24 ก.ค.62 AOT,KKP,WHA TTA,PSL,SAMART
COL
PLANB,TU,ASAP, NER,UTP,ECL
MONO,GUNKUL, TKN,SCB,M
25 ก.ค.62 CHG,PR9,SAT MONO,GUNKUL,ECL PLANB,TU,ASAP, NER,UTP,TKN,SCB
M,AOT,KKP,WHA
26 ก.ค.62 KKP,TFG,THCOM PLANB TU,ASAP, NER,UTP,TKN,SCB
M,AOT,KKP,WHA,CHG,PR9,SAT
30 ก.ค.62 SAT,CHG,PR9,TKN SCB TU,ASAP, NER,UTP,TKN,M ,AOT
KKP,WHA,CHG,PR9,SAT,TFG,THCOM
31 ก.ค.62 AOT,KKP NER TU,ASAP, UTP,TKN,M ,AOT, KKP
WHA,CHG,PR9,SAT,TFG,THCOM
2 ส.ค.62 BCPG,EA,AOT -ไมม- TU,ASAP, UTP,TKN,M ,AOT, KKP, WHA
CHG,PR9,SAT,TFG,THCOM,BCPG,EA
5 ส.ค.62 KKP,BCPG,EA PTTEP,SPRC,LH TU,UTP,TKN,M,AOT,KKP,WHA,CHG,PR9, SAT,TFG,BCPG,EA
6 ส.ค.62 --ไมม-- INTUCH, SCB, EA TU,UTP,TKN,M,AOT,KKP,WHA,CHG,PR9, SAT
TFG,BCPG
7 ส.ค.62 AMATA,M,DOD TU UTP,TKN,M,AOT,KKP,WHA,CHG,PR9, SAT
TFG,BCPG
รอบดานตลาดหน 10
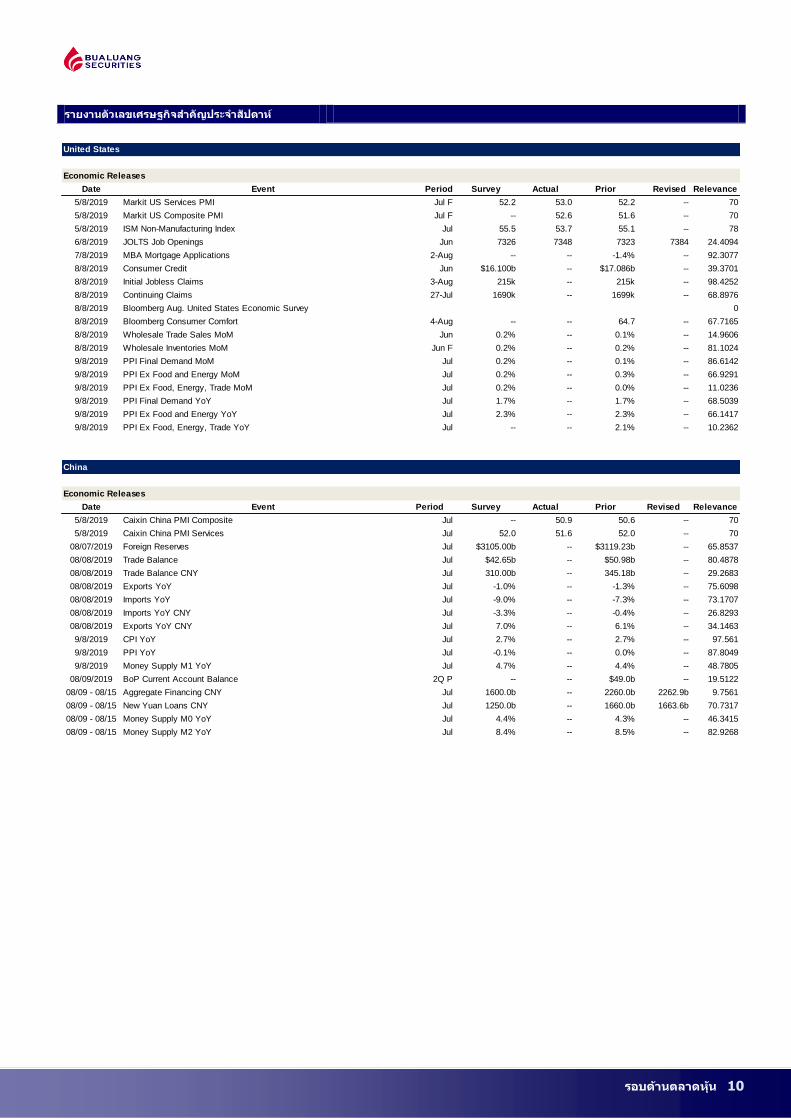
รายงานตวเลขเศรษฐกจส าคญประจ าสปดาห
United States
Economic Releases
Date Event Period Survey Actual Prior Revised Relevance
5/8/2019 Markit US Services PMI Jul F 52.2 53.0 52.2 -- 70
5/8/2019 Markit US Composite PMI Jul F -- 52.6 51.6 -- 70
5/8/2019 ISM Non-Manufacturing Index Jul 55.5 53.7 55.1 -- 78
6/8/2019 JOLTS Job Openings Jun 7326 7348 7323 7384 24.4094
7/8/2019 MBA Mortgage Applications 2-Aug -- -- -1.4% -- 92.3077
8/8/2019 Consumer Credit Jun $16.100b -- $17.086b -- 39.3701
8/8/2019 Initial Jobless Claims 3-Aug 215k -- 215k -- 98.4252
8/8/2019 Continuing Claims 27-Jul 1690k -- 1699k -- 68.8976
8/8/2019 Bloomberg Aug. United States Economic Survey 0
8/8/2019 Bloomberg Consumer Comfort 4-Aug -- -- 64.7 -- 67.7165
8/8/2019 Wholesale Trade Sales MoM Jun 0.2% -- 0.1% -- 14.9606
8/8/2019 Wholesale Inventories MoM Jun F 0.2% -- 0.2% -- 81.1024
9/8/2019 PPI Final Demand MoM Jul 0.2% -- 0.1% -- 86.6142
9/8/2019 PPI Ex Food and Energy MoM Jul 0.2% -- 0.3% -- 66.9291
9/8/2019 PPI Ex Food, Energy, Trade MoM Jul 0.2% -- 0.0% -- 11.0236
9/8/2019 PPI Final Demand YoY Jul 1.7% -- 1.7% -- 68.5039
9/8/2019 PPI Ex Food and Energy YoY Jul 2.3% -- 2.3% -- 66.1417
9/8/2019 PPI Ex Food, Energy, Trade YoY Jul -- -- 2.1% -- 10.2362
China
Economic Releases
Date Event Period Survey Actual Prior Revised Relevance
5/8/2019 Caixin China PMI Composite Jul -- 50.9 50.6 -- 70
5/8/2019 Caixin China PMI Services Jul 52.0 51.6 52.0 -- 70
08/07/2019 Foreign Reserves Jul $3105.00b -- $3119.23b -- 65.8537
08/08/2019 Trade Balance Jul $42.65b -- $50.98b -- 80.4878
08/08/2019 Trade Balance CNY Jul 310.00b -- 345.18b -- 29.2683
08/08/2019 Exports YoY Jul -1.0% -- -1.3% -- 75.6098
08/08/2019 Imports YoY Jul -9.0% -- -7.3% -- 73.1707
08/08/2019 Imports YoY CNY Jul -3.3% -- -0.4% -- 26.8293
08/08/2019 Exports YoY CNY Jul 7.0% -- 6.1% -- 34.1463
9/8/2019 CPI YoY Jul 2.7% -- 2.7% -- 97.561
9/8/2019 PPI YoY Jul -0.1% -- 0.0% -- 87.8049
9/8/2019 Money Supply M1 YoY Jul 4.7% -- 4.4% -- 48.7805
08/09/2019 BoP Current Account Balance 2Q P -- -- $49.0b -- 19.5122
08/09 - 08/15 Aggregate Financing CNY Jul 1600.0b -- 2260.0b 2262.9b 9.7561
08/09 - 08/15 New Yuan Loans CNY Jul 1250.0b -- 1660.0b 1663.6b 70.7317
08/09 - 08/15 Money Supply M0 YoY Jul 4.4% -- 4.3% -- 46.3415
08/09 - 08/15 Money Supply M2 YoY Jul 8.4% -- 8.5% -- 82.9268
รอบดานตลาดหน 11
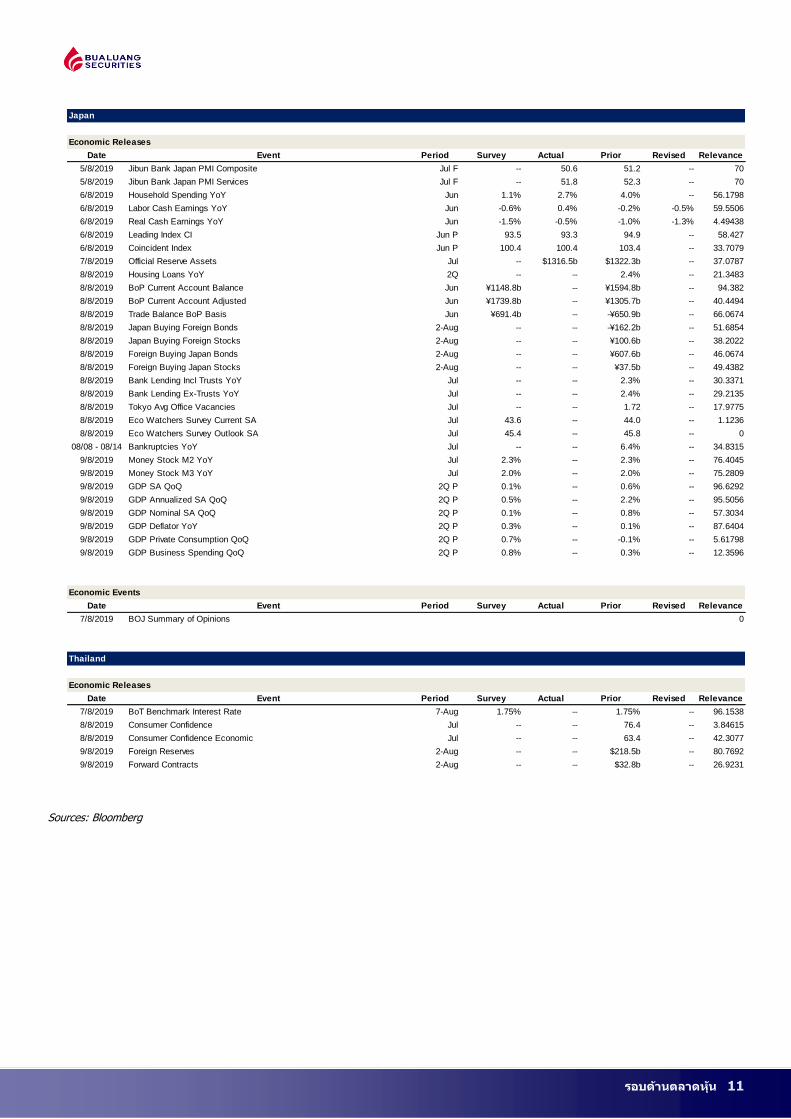
Japan
Economic Releases
Date Event Period Survey Actual Prior Revised Relevance
5/8/2019 Jibun Bank Japan PMI Composite Jul F -- 50.6 51.2 -- 70
5/8/2019 Jibun Bank Japan PMI Services Jul F -- 51.8 52.3 -- 70
6/8/2019 Household Spending YoY Jun 1.1% 2.7% 4.0% -- 56.1798
6/8/2019 Labor Cash Earnings YoY Jun -0.6% 0.4% -0.2% -0.5% 59.5506
6/8/2019 Real Cash Earnings YoY Jun -1.5% -0.5% -1.0% -1.3% 4.49438
6/8/2019 Leading Index CI Jun P 93.5 93.3 94.9 -- 58.427
6/8/2019 Coincident Index Jun P 100.4 100.4 103.4 -- 33.7079
7/8/2019 Official Reserve Assets Jul -- $1316.5b $1322.3b -- 37.0787
8/8/2019 Housing Loans YoY 2Q -- -- 2.4% -- 21.3483
8/8/2019 BoP Current Account Balance Jun ¥1148.8b -- ¥1594.8b -- 94.382
8/8/2019 BoP Current Account Adjusted Jun ¥1739.8b -- ¥1305.7b -- 40.4494
8/8/2019 Trade Balance BoP Basis Jun ¥691.4b -- -¥650.9b -- 66.0674
8/8/2019 Japan Buying Foreign Bonds 2-Aug -- -- -¥162.2b -- 51.6854
8/8/2019 Japan Buying Foreign Stocks 2-Aug -- -- ¥100.6b -- 38.2022
8/8/2019 Foreign Buying Japan Bonds 2-Aug -- -- ¥607.6b -- 46.0674
8/8/2019 Foreign Buying Japan Stocks 2-Aug -- -- ¥37.5b -- 49.4382
8/8/2019 Bank Lending Incl Trusts YoY Jul -- -- 2.3% -- 30.3371
8/8/2019 Bank Lending Ex-Trusts YoY Jul -- -- 2.4% -- 29.2135
8/8/2019 Tokyo Avg Office Vacancies Jul -- -- 1.72 -- 17.9775
8/8/2019 Eco Watchers Survey Current SA Jul 43.6 -- 44.0 -- 1.1236
8/8/2019 Eco Watchers Survey Outlook SA Jul 45.4 -- 45.8 -- 0
08/08 - 08/14 Bankruptcies YoY Jul -- -- 6.4% -- 34.8315
9/8/2019 Money Stock M2 YoY Jul 2.3% -- 2.3% -- 76.4045
9/8/2019 Money Stock M3 YoY Jul 2.0% -- 2.0% -- 75.2809
9/8/2019 GDP SA QoQ 2Q P 0.1% -- 0.6% -- 96.6292
9/8/2019 GDP Annualized SA QoQ 2Q P 0.5% -- 2.2% -- 95.5056
9/8/2019 GDP Nominal SA QoQ 2Q P 0.1% -- 0.8% -- 57.3034
9/8/2019 GDP Deflator YoY 2Q P 0.3% -- 0.1% -- 87.6404
9/8/2019 GDP Private Consumption QoQ 2Q P 0.7% -- -0.1% -- 5.61798
9/8/2019 GDP Business Spending QoQ 2Q P 0.8% -- 0.3% -- 12.3596
Economic Events
Date Event Period Survey Actual Prior Revised Relevance
7/8/2019 BOJ Summary of Opinions 0
Thailand
Economic Releases
Date Event Period Survey Actual Prior Revised Relevance
7/8/2019 BoT Benchmark Interest Rate 7-Aug 1.75% -- 1.75% -- 96.1538
8/8/2019 Consumer Confidence Jul -- -- 76.4 -- 3.84615
8/8/2019 Consumer Confidence Economic Jul -- -- 63.4 -- 42.3077
9/8/2019 Foreign Reserves 2-Aug -- -- $218.5b -- 80.7692
9/8/2019 Forward Contracts 2-Aug -- -- $32.8b -- 26.9231
Sources: Bloomberg

รอบดานตลาดหน 12
สรปผลตอบแทนหลกทรพย As of 6 August 2019
สรปผลตอบแทนหลกทรพยทแนะน า (ส าหรบ Daily - ระยะเวลาลงทน 1-3 เดอน โดยคณวกจ ถรวรรณรตน)
เนนการจบจงหวะ "Timing" ในการลงทนหน โดยพจารณาจากปจจยแวดลอมตางๆ ท "ก าลงจะ หรอ จะม" อทธพลตอราคาหน
สามารถเลอกหนทอยนอกเหนอจาก BLS Universe
ผลตอบแทนวดตาม "Direction" ของราคาหนเปนหลก
สรปผลตอบแทนหลกทรพยทแนะน า (ส าหรบ Model Port - ระยะเวลาลงทน 3-6 เดอนโดยคณปรเมศร ทองบว)
เนนปจจยพนฐานเปนหลก โดยลงทนเฉพาะหนทนกวเคราะหของบล.บวหลวงตดตามและมการออกรายงาน และเลอกลงทนหน 100% ตลอดโดยมจ านวน 10 ตว และใหน าหนกของแตละหนผนแปรตามขนาดของหน

รอบดานตลาดหน 13
สรปผลตอบแทนหลกทรพยทแนะน า (ส าหรบ Technical Port - ระยะเวลาลงทน 1 เดอน โดยคณธนรตน อศรกล)
การวเคราะหทางเทคนค : เปนการวเคราะหรปแบบราคาและสถต ทศกษาพฤตกรรมของราคาหน หรอพฤตกรรมของตลาดใน อดตโดยใชหลกสถต เพอน ามาใชคาดการณพฤตกรรมการ เคลอนไหวของราคาหนในอนาคต วตถประสงคเพอการคาดการณการเคลอนไหวราคาหนในอนาคตและชวยหาจงหวะการลงทนทเหมาะสม
รอบดานตลาดหน 14
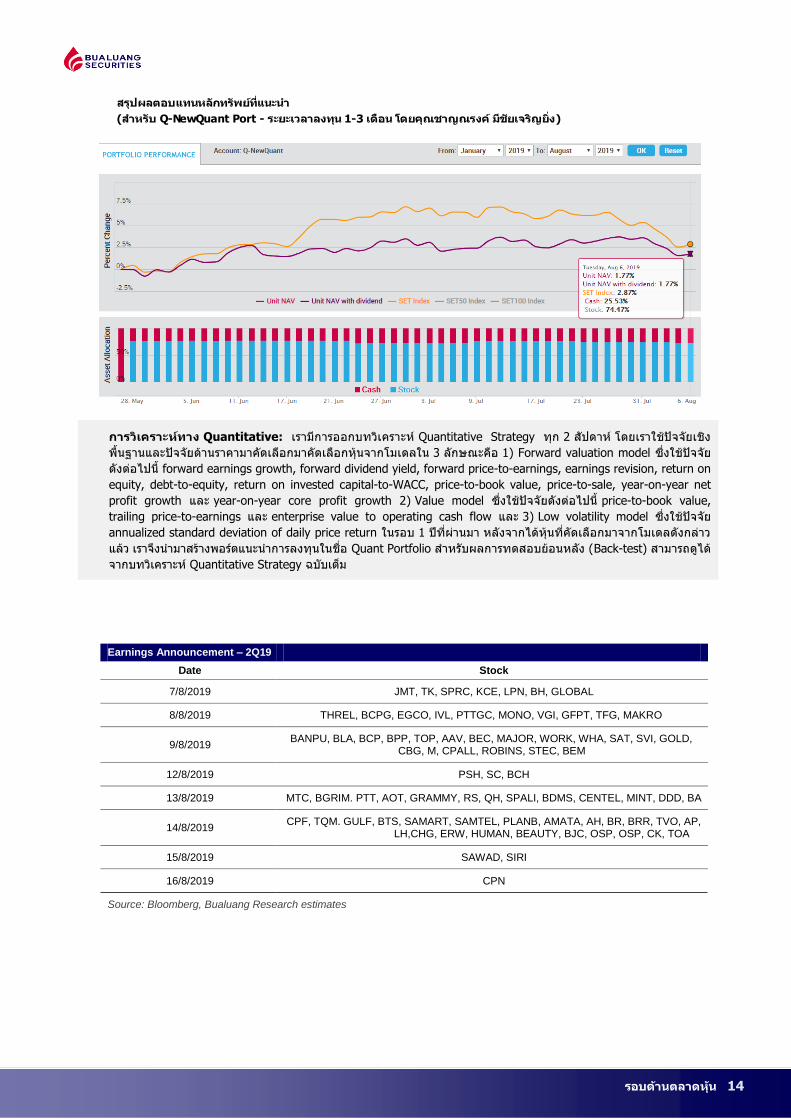
สรปผลตอบแทนหลกทรพยทแนะน า
(ส าหรบ Q-NewQuant Port - ระยะเวลาลงทน 1-3 เดอน โดยคณชาญณรงค มชยเจรญยง)
การวเคราะหทาง Quantitative: เรามการออกบทวเคราะห Quantitative Strategy ทก 2 สปดาห โดยเราใชปจจยเชง
พนฐานและปจจยดานราคามาคดเลอกมาคดเลอกหนจากโมเดลใน 3 ลกษณะคอ 1) Forward valuation model ซงใชปจจย
ดงตอไปน forward earnings growth, forward dividend yield, forward price-to-earnings, earnings revision, return on
equity, debt-to-equity, return on invested capital-to-WACC, price-to-book value, price-to-sale, year-on-year net
profit growth และ year-on-year core profit growth 2) Value model ซงใชปจจยดงตอไปน price-to-book value,
trailing price-to-earnings และ enterprise value to operating cash flow และ 3) Low volatility model ซงใชปจจย
annualized standard deviation of daily price return ในรอบ 1 ปทผานมา หลงจากไดหนทคดเลอกมาจากโมเดลดงกลาว
แลว เราจงน ามาสรางพอรตแนะน าการลงทนในชอ Quant Portfolio ส าหรบผลการทดสอบยอนหลง (Back-test) สามารถดได
จากบทวเคราะห Quantitative Strategy ฉบบเตม
Earnings Announcement – 2Q19
Date Stock
7/8/2019 JMT, TK, SPRC, KCE, LPN, BH, GLOBAL
8/8/2019 THREL, BCPG, EGCO, IVL, PTTGC, MONO, VGI, GFPT, TFG, MAKRO
9/8/2019 BANPU, BLA, BCP, BPP, TOP, AAV, BEC, MAJOR, WORK, WHA, SAT, SVI, GOLD,
CBG, M, CPALL, ROBINS, STEC, BEM
12/8/2019 PSH, SC, BCH
13/8/2019 MTC, BGRIM. PTT, AOT, GRAMMY, RS, QH, SPALI, BDMS, CENTEL, MINT, DDD, BA
14/8/2019 CPF, TQM. GULF, BTS, SAMART, SAMTEL, PLANB, AMATA, AH, BR, BRR, TVO, AP,
LH,CHG, ERW, HUMAN, BEAUTY, BJC, OSP, OSP, CK, TOA
15/8/2019 SAWAD, SIRI
16/8/2019 CPN
Source: Bloomberg, Bualuang Research estimates

รอบดานตลาดหน 15
ปฏทนหน
Sources: SET, Bualuang research
XR B 1 : 10.33 Baht XD WHABT 0.1365 XD AIMIRT 0.243 XD SCC 7
XW B 3 : 1 Baht XD WHART 0.1715 XD DREIT 0.2516 XD PTTEP 2.25
XD EPG 0.14 XD PTL 0.33
XD SCCC 4
XR TSE 5 : 1 Baht
XD DIF 0.3469
XR GPSC 1 : 0.881956
BahtXR NEX 1 : 11 Baht
XR TSI 1 : 2 Baht
Note-XD Cash Dividend, XD (ST) Stock Dividend, PD Payment Date, XR- Right for Common
XW- Right for Warrant XM- Right for meeting
24-Sep-19 25-Sep-19
20-Sep-19
27-Sep-19
15-Sep-19
23-Sep-19
16-Sep-19 17-Sep-19
22-Sep-19
18-Sep-19
14-Sep-19
28-Sep-19
19-Sep-19
12-Sep-19 13-Sep-19
21-Sep-19
26-Sep-19
18-Aug-19 20-Aug-1919-Aug-19 23-Aug-1921-Aug-19
4-Sep-19 5-Sep-19 6-Sep-19
22-Aug-19
8-Sep-19 9-Sep-19 10-Sep-19 11-Sep-19
25-Aug-19
14-Aug-19
26-Aug-19 27-Aug-19 28-Aug-19
11-Aug-19
3-Sep-19
FriThu
24-Aug-19
16-Aug-19
6-Aug-19
Wed
7-Aug-19 8-Aug-19
17-Aug-19
10-Aug-199-Aug-19
15-Aug-19
Sat
1-Sep-19
31-Aug-19
2-Sep-19 7-Sep-19
29-Aug-19 30-Aug-19
Mon
13-Aug-19
Sun Tue
4-Aug-19 5-Aug-19
12-Aug-19
See disclaimer at the end of report
บวหลวงมอนเตอร
7 สงหาคม 2562
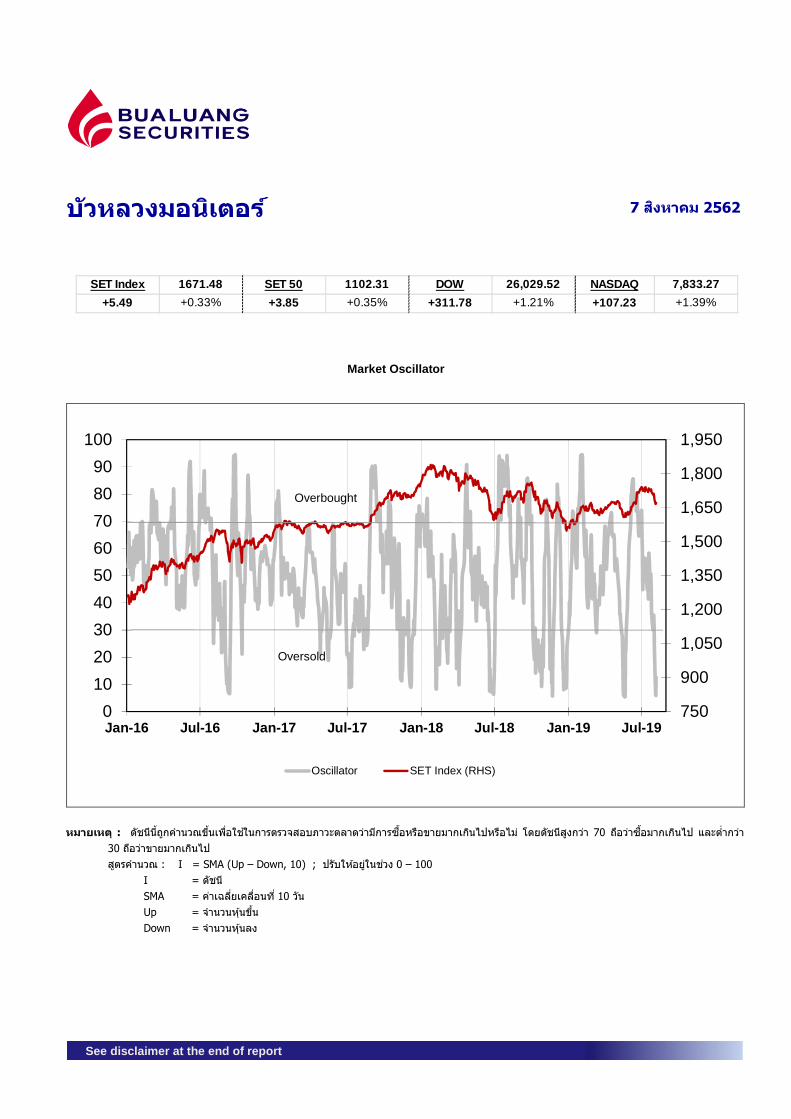
SET Index 1671.48 SET 50 1102.31 DOW 26,029.52 NASDAQ 7,833.27
+5.49 +0.33% +3.85 +0.35% +311.78 +1.21% +107.23 +1.39%
Market Oscillator
750
900
1,050
1,200
1,350
1,500
1,650
1,800
1,950
0
10
20
30
40
50
60
70
80
90
100
Jan-16 Jul-16 Jan-17 Jul-17 Jan-18 Jul-18 Jan-19 Jul-19
Oscillator SET Index (RHS)
Overbought
Oversold
หมายเหต : ดชนน�ถกคานวณข�นเพ�อใชในการตรวจสอบภาวะตลาดวามการซ�อหรอขายมากเกนไปหรอไม โดยดชนสงกวา 70 ถอวาซ�อมากเกนไป และต�ากวา 30 ถอวาขายมากเกนไป
สตรคานวณ : I = SMA (Up – Down, 10) ; ปรบใหอยในชวง 0 – 100 I = ดชน SMA = คาเฉล�ยเคล�อนท� 10 วน Up = จานวนหนข�น Down = จานวนหนลง
บวหลวงมอนเตอร - 2
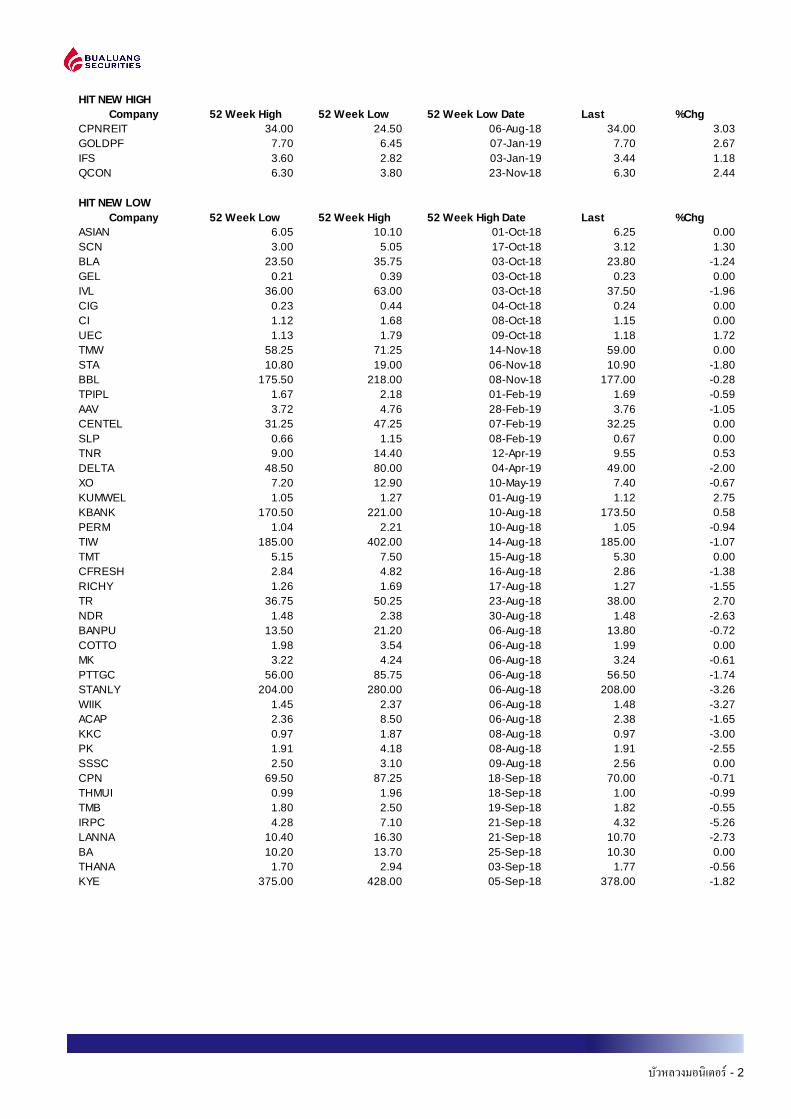
HIT NEW HIGHCompany 52 Week High 52 Week Low 52 Week Low Date Last % Chg
CPNREIT 34.00 24.50 06-Aug-18 34.00 3.03GOLDPF 7.70 6.45 07-Jan-19 7.70 2.67IFS 3.60 2.82 03-Jan-19 3.44 1.18QCON 6.30 3.80 23-Nov-18 6.30 2.44
HIT NEW LOWCompany 52 Week Low 52 Week High 52 Week High Date Last %Chg
ASIAN 6.05 10.10 01-Oct-18 6.25 0.00SCN 3.00 5.05 17-Oct-18 3.12 1.30BLA 23.50 35.75 03-Oct-18 23.80 -1.24GEL 0.21 0.39 03-Oct-18 0.23 0.00IVL 36.00 63.00 03-Oct-18 37.50 -1.96CIG 0.23 0.44 04-Oct-18 0.24 0.00CI 1.12 1.68 08-Oct-18 1.15 0.00UEC 1.13 1.79 09-Oct-18 1.18 1.72TMW 58.25 71.25 14-Nov-18 59.00 0.00STA 10.80 19.00 06-Nov-18 10.90 -1.80BBL 175.50 218.00 08-Nov-18 177.00 -0.28TPIPL 1.67 2.18 01-Feb-19 1.69 -0.59AAV 3.72 4.76 28-Feb-19 3.76 -1.05CENTEL 31.25 47.25 07-Feb-19 32.25 0.00SLP 0.66 1.15 08-Feb-19 0.67 0.00TNR 9.00 14.40 12-Apr-19 9.55 0.53DELTA 48.50 80.00 04-Apr-19 49.00 -2.00XO 7.20 12.90 10-May-19 7.40 -0.67KUMWEL 1.05 1.27 01-Aug-19 1.12 2.75KBANK 170.50 221.00 10-Aug-18 173.50 0.58PERM 1.04 2.21 10-Aug-18 1.05 -0.94TIW 185.00 402.00 14-Aug-18 185.00 -1.07TMT 5.15 7.50 15-Aug-18 5.30 0.00CFRESH 2.84 4.82 16-Aug-18 2.86 -1.38RICHY 1.26 1.69 17-Aug-18 1.27 -1.55TR 36.75 50.25 23-Aug-18 38.00 2.70NDR 1.48 2.38 30-Aug-18 1.48 -2.63BANPU 13.50 21.20 06-Aug-18 13.80 -0.72COTTO 1.98 3.54 06-Aug-18 1.99 0.00MK 3.22 4.24 06-Aug-18 3.24 -0.61PTTGC 56.00 85.75 06-Aug-18 56.50 -1.74STANLY 204.00 280.00 06-Aug-18 208.00 -3.26WIIK 1.45 2.37 06-Aug-18 1.48 -3.27ACAP 2.36 8.50 06-Aug-18 2.38 -1.65KKC 0.97 1.87 08-Aug-18 0.97 -3.00PK 1.91 4.18 08-Aug-18 1.91 -2.55SSSC 2.50 3.10 09-Aug-18 2.56 0.00CPN 69.50 87.25 18-Sep-18 70.00 -0.71THMUI 0.99 1.96 18-Sep-18 1.00 -0.99TMB 1.80 2.50 19-Sep-18 1.82 -0.55IRPC 4.28 7.10 21-Sep-18 4.32 -5.26LANNA 10.40 16.30 21-Sep-18 10.70 -2.73BA 10.20 13.70 25-Sep-18 10.30 0.00THANA 1.70 2.94 03-Sep-18 1.77 -0.56KYE 375.00 428.00 05-Sep-18 378.00 -1.82

บวหลวงมอนเตอร - 3
HIGH VOLUME
Company Last %Chg Volume 52W Low 52W HighTRUE 6.30 0.30 276.0M 4.50 6.85 IRPC 4.32 (0.24) 245.1M 4.28 7.10 SUPER 0.66 - 213.5M 0.51 0.90 WHA 4.68 0.08 119.9M 3.60 4.86 GSTEEL 0.09 - 88.5M 0.04 0.11 LH 10.90 (0.20) 88.4M 9.55 12.20 AQ 0.03 0.01 84.0M 0.02 0.04 PTT 45.50 (0.25) 64.8M 45.00 55.25 TRC 0.15 - 62.0M 0.12 0.54 QH 2.98 - 56.5M 2.58 3.66
บวหลวงมอนเตอร - 4
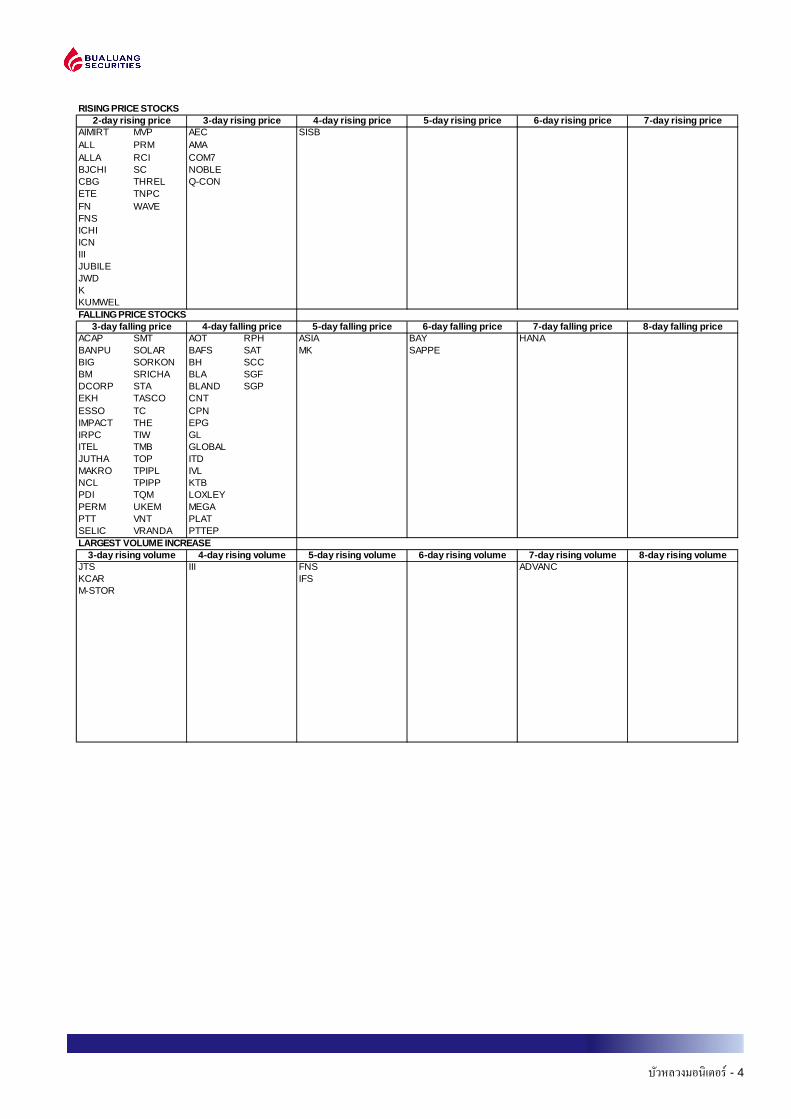
RISING PRICE STOCKS
AIMIRT MVP AEC SISBALL PRM AMAALLA RCI COM7BJCHI SC NOBLECBG THREL Q-CONETE TNPCFN WAVEFNSICHIICNIIIJUBILEJWDKKUMWELFALLING PRICE STOCKS
ACAP SMT AOT RPH ASIA BAY HANABANPU SOLAR BAFS SAT MK SAPPEBIG SORKON BH SCCBM SRICHA BLA SGFDCORP STA BLAND SGPEKH TASCO CNTESSO TC CPNIMPACT THE EPGIRPC TIW GLITEL TMB GLOBALJUTHA TOP ITDMAKRO TPIPL IVLNCL TPIPP KTBPDI TQM LOXLEYPERM UKEM MEGAPTT VNT PLATSELIC VRANDA PTTEPLARGEST VOLUME INCREASE
JTS III FNS ADVANCKCAR IFSM-STOR
3-day rising price
8-day rising volume5-day rising volume 6-day rising volume
7-day rising price
7-day falling price 8-day falling price5-day falling price
2-day rising price
3-day falling price
3-day rising volume 7-day rising volume
6-day rising price4-day rising price 5-day rising price
6-day falling price
4-day rising volume
4-day falling price
บวหลวงมอนเตอร - 5
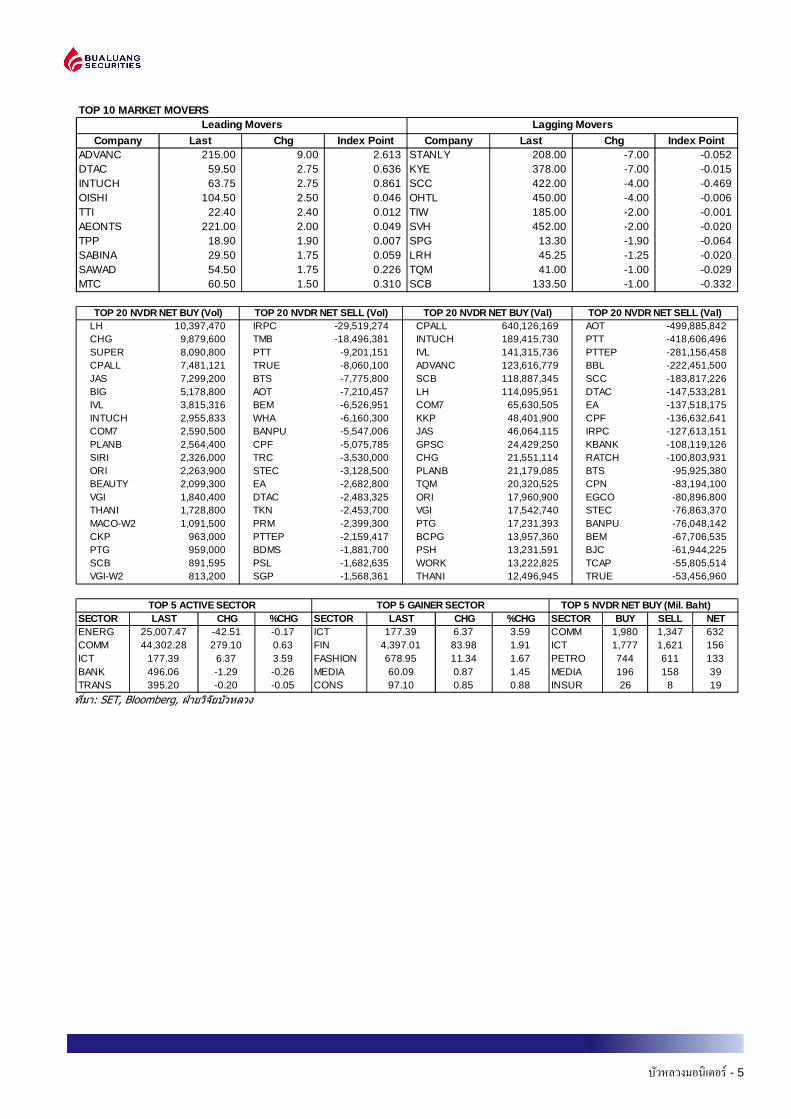
TOP 10 MARKET MOVERS
Company Last Chg Index Point Company Last Chg Index PointADVANC 215.00 9.00 2.613 STANLY 208.00 -7.00 -0.052DTAC 59.50 2.75 0.636 KYE 378.00 -7.00 -0.015INTUCH 63.75 2.75 0.861 SCC 422.00 -4.00 -0.469OISHI 104.50 2.50 0.046 OHTL 450.00 -4.00 -0.006TTI 22.40 2.40 0.012 TIW 185.00 -2.00 -0.001AEONTS 221.00 2.00 0.049 SVH 452.00 -2.00 -0.020TPP 18.90 1.90 0.007 SPG 13.30 -1.90 -0.064SABINA 29.50 1.75 0.059 LRH 45.25 -1.25 -0.020SAWAD 54.50 1.75 0.226 TQM 41.00 -1.00 -0.029MTC 60.50 1.50 0.310 SCB 133.50 -1.00 -0.332
Leading Movers Lagging Movers
LH 10,397,470 IRPC -29,519,274 CPALL 640,126,169 AOT -499,885,842CHG 9,879,600 TMB -18,496,381 INTUCH 189,415,730 PTT -418,606,496SUPER 8,090,800 PTT -9,201,151 IVL 141,315,736 PTTEP -281,156,458CPALL 7,481,121 TRUE -8,060,100 ADVANC 123,616,779 BBL -222,451,500JAS 7,299,200 BTS -7,775,800 SCB 118,887,345 SCC -183,817,226BIG 5,178,800 AOT -7,210,457 LH 114,095,951 DTAC -147,533,281IVL 3,815,316 BEM -6,526,951 COM7 65,630,505 EA -137,518,175INTUCH 2,955,833 WHA -6,160,300 KKP 48,401,900 CPF -136,632,641COM7 2,590,500 BANPU -5,547,006 JAS 46,064,115 IRPC -127,613,151PLANB 2,564,400 CPF -5,075,785 GPSC 24,429,250 KBANK -108,119,126SIRI 2,326,000 TRC -3,530,000 CHG 21,551,114 RATCH -100,803,931ORI 2,263,900 STEC -3,128,500 PLANB 21,179,085 BTS -95,925,380BEAUTY 2,099,300 EA -2,682,800 TQM 20,320,525 CPN -83,194,100VGI 1,840,400 DTAC -2,483,325 ORI 17,960,900 EGCO -80,896,800THANI 1,728,800 TKN -2,453,700 VGI 17,542,740 STEC -76,863,370MACO-W2 1,091,500 PRM -2,399,300 PTG 17,231,393 BANPU -76,048,142CKP 963,000 PTTEP -2,159,417 BCPG 13,957,360 BEM -67,706,535PTG 959,000 BDMS -1,881,700 PSH 13,231,591 BJC -61,944,225SCB 891,595 PSL -1,682,635 WORK 13,222,825 TCAP -55,805,514VGI-W2 813,200 SGP -1,568,361 THANI 12,496,945 TRUE -53,456,960
TOP 20 NVDR NET BUY (Vol) TOP 20 NVDR NET SELL (Vol) TOP 20 NVDR NET BUY (Val) TOP 20 NVDR NET SELL (Val)
SECTOR LAST CHG %CHG SECTOR LAST CHG %CHG SECTOR BUY SELL NETENERG 25,007.47 -42.51 -0.17 ICT 177.39 6.37 3.59 COMM 1,980 1,347 632COMM 44,302.28 279.10 0.63 FIN 4,397.01 83.98 1.91 ICT 1,777 1,621 156ICT 177.39 6.37 3.59 FASHION 678.95 11.34 1.67 PETRO 744 611 133BANK 496.06 -1.29 -0.26 MEDIA 60.09 0.87 1.45 MEDIA 196 158 39TRANS 395.20 -0.20 -0.05 CONS 97.10 0.85 0.88 INSUR 26 8 19
TOP 5 NVDR NET BUY (Mil. Baht)TOP 5 GAINER SECTORTOP 5 ACTIVE SECTOR
ท�มา: SET, Bloomberg, ฝายวจยบวหลวง

See disclaimer at the end of report
Market Statistics Daily
August 7, 2019
Figure 1: Changes in management's securities holdin g
Name of Name of Management Types of Total Volume Price T otal Value Transaction The methods
Company Securities (Shrs) (Bt) (Bt) Date
BEM Mr. Plew Trivisvavet Common Share 100,000 10.40 1,040,000 05/08/2019 Buy
SIMAT Mr. Thanayous Kositsakul Common Share 200,000 1.50 300,000 05/08/2019 Buy
KUMWEL Mr. Damnoen Kaew thaw ee Common Share 200,000 1.18 236,000 01/08/2019 Buy
TTW Mr. Plew Trivisvavet Common Share 200,000 13.95 2,790,000 05/08/2019 Sell
Sources: SEC, Bualuang research
As of 6 August 2019

Market Statistics Daily - 2
Figure 2: Short Sale Trading As of 6 August 2019
Stock Volume (Shares) Turnover (Baht) %Short Sale Volu me
Comparing w ith Main Board
KBANK 1,411,100 243,913,800 16.83%
PTT 4,564,600 207,689,300 7.13%
PTTGC 3,633,600 206,174,575 9.93%
CPALL 2,307,900 197,038,150 5.85%
IVL 4,729,100 173,415,225 9.74%
IVL-R 4,682,100 172,500,000 9.64%
ADVANC 798,800 169,269,800 6.84%
SCC 378,400 160,752,600 9.29%
BDMS 5,438,900 135,131,580 13.91%
CPALL-R 1,435,300 122,927,700 3.64%
EA 2,185,900 112,079,075 12.43%
TRUE 18,068,400 110,015,275 6.55%
SCB 757,400 101,082,650 8.10%
AOT 1,377,600 95,493,950 3.28%
PTT-R 1,933,300 87,965,150 3.02%
GULF 720,100 86,781,700 6.18%
SCC-R 191,700 81,574,200 4.70%
LH 7,275,100 79,568,840 8.54%
BBL 400,600 70,838,700 5.82%
AOT-R 980,000 67,961,525 2.34%
CPN-R 892,000 62,447,100 9.83%
SCB-R 442,600 59,002,700 4.73%
HMPRO-R 3,334,800 56,958,890 8.34%
ADVANC-R 250,300 53,061,700 2.14%
INTUCH 837,900 52,933,300 4.59%
KTB 2,784,200 52,795,540 11.43%
PTTEP 400,300 52,075,850 3.87%
MINT 1,220,000 45,929,200 7.09%
TOP 690,600 45,116,150 7.03%
GPSC 646,200 44,171,975 7.51%
DTAC-R 731,400 42,448,825 4.56%
IRPC-R 9,691,400 41,939,450 3.95%
BTS 3,408,300 41,715,990 6.39%
PTTEP-R 309,400 40,264,450 2.99%
HMPRO 2,323,800 39,426,170 5.81%
IRPC 8,637,900 37,505,108 3.52%
CPF 1,363,000 36,488,725 5.29%
BANPU 2,593,000 35,478,670 7.73%
CPF-R 1,279,700 34,326,350 4.96%
MINT-R 901,500 34,041,550 5.24%
TISCO-R 342,000 33,726,950 6.28%

Market Statistics Daily - 3
Figure 2: Short Sale Trading (Cont’d)
Stock Volume (Shares) Turnover (Baht) %Short Sale Volu me
Comparing w ith Main Board
PTG 1,708,100 33,692,980 3.32%
TRUE-R 5,371,000 33,414,635 1.95%
BEM 3,220,500 33,413,200 5.87%
BDMS-R 1,286,900 32,022,470 3.29%
TOP-R 448,800 29,352,175 4.57%
TU 1,511,400 28,046,540 3.36%
GULF-R 225,700 27,222,950 1.94%
EA-R 524,800 26,841,300 2.98%
DTAC 423,300 24,536,250 2.64%
KTB-R 1,241,100 23,555,700 5.10%
CPN 321,100 22,509,600 3.54%
MTC-R 373,000 22,127,825 6.60%
KTC 480,200 21,913,400 3.77%
CBG 269,100 20,904,350 6.16%
TU-R 1,120,400 20,740,710 2.49%
BJC 400,000 20,335,625 6.03%
BGRIM 547,800 19,049,175 4.14%
TISCO 181,300 17,908,675 3.33%
GPSC-R 259,000 17,729,850 3.01%
KKP 201,900 14,331,425 3.74%
CKP 2,257,100 14,258,015 5.90%
TCAP-R 224,300 12,889,050 3.99%
EGCO-R 39,800 12,549,400 4.79%
EGCO 36,700 11,568,300 4.41%
BTS-R 822,200 10,195,280 1.54%
SUPER 14,949,200 9,576,578 7.00%
MTC 158,600 9,423,725 2.80%
SAWAD 175,000 9,380,000 2.70%
QH 3,117,300 9,279,060 5.51%
COM7 365,400 9,213,850 4.07%
BJC-R 179,300 9,063,050 2.70%
TMB 4,955,800 8,999,356 9.36%
CK 330,000 8,610,625 5.96%
BH-R 46,400 7,758,450 5.23%
TASCO 409,100 7,418,970 2.02%
RATCH 109,800 7,214,400 2.55%
LH-R 656,100 7,173,590 0.77%
BH 42,500 7,107,800 4.79%
BEAUTY 1,902,000 6,941,280 6.52%
TCAP 116,500 6,691,625 2.07%
WHA 1,366,500 6,324,206 1.14%
OSP 178,000 6,211,000 2.54%

Market Statistics Daily - 4
Figure 2: Short Sale Trading (Cont’d) Stock Volume (Shares) Turnover (Baht) %Short Sale Volu me
Comparing w ith Main Board
BPP 265,700 5,738,360 7.79%
ROBINS-R 89,600 5,680,800 2.56%
KCE 321,600 5,052,200 5.42%
JAS 724,000 4,476,780 1.54%
CHG 2,063,900 4,474,608 4.15%
TOA 114,000 4,360,500 9.47%
STPI 500,000 4,201,365 2.12%
TMB-R 2,250,100 4,088,217 4.25%
ROBINS 62,400 3,954,600 1.78%
THAI 398,000 3,940,535 22.51%
ESSO 400,000 3,760,000 2.61%
JMT 205,400 3,724,900 1.15%
BCP 127,500 3,650,000 2.40%
AMATA 150,000 3,625,000 0.62%
GFPT 205,700 3,569,150 5.41%
DELTA 69,600 3,420,900 7.71%
KKP-R 47,800 3,392,800 0.89%
TPIPP 573,300 3,325,140 6.16%
GLOBAL-R 203,800 3,236,760 3.40%
CK-R 124,000 3,234,975 2.24%
SPRC 343,500 3,151,290 1.55%
GLOBAL 196,000 3,120,320 3.27%
INTUCH-R 45,700 2,841,825 0.25%
ORI 356,100 2,821,295 1.93%
BCH 185,500 2,790,590 2.36%
WORK 100,000 2,460,000 0.74%
STEC 100,000 2,440,000 0.73%
CENTEL 76,300 2,432,450 2.34%
AAV 628,900 2,361,960 5.89%
GUNKUL 768,600 2,275,668 1.82%
TPIPL 1,321,500 2,220,120 9.67%
BCPG 108,100 2,098,490 1.30%
SGP 224,000 2,037,200 4.30%
VGI 209,200 1,950,900 0.73%
SIRI 1,400,000 1,937,000 5.25%
BCPG-R 93,400 1,816,150 1.13%
STA 160,000 1,749,000 1.42%
E1VFVN3001 86,016 1,644,349 31.38%
PTTGC-R 28,800 1,627,200 0.08%
HANA 62,200 1,603,850 3.55%
JAS-R 254,100 1,563,965 0.54%
EPG 200,000 1,275,000 3.06%

Market Statistics Daily - 5
Figure 2: Short Sale Trading (Cont’d) Stock Volume (Shares) Turnover (Baht) %Short Sale Volu me
Comparing w ith Main Board
BCP-R 37,800 1,086,750 0.71%
ERW 194,400 1,049,760 2.76%
BEC 100,000 920,000 1.14%
BLA 36,600 867,420 2.60%
SF 120,000 734,000 5.69%
SCN 237,500 731,720 13.46%
UNIQ 67,400 702,140 3.06%
KBANK-R 3,000 517,500 0.04%
TTW 32,600 452,010 0.49%
SAPPE 20,000 418,000 3.00%
BIG 250,000 285,000 0.89%
AH 13,800 249,780 1.94%
PRM 25,000 208,750 0.13%
DIF 11,400 198,360 0.13%
SVI 50,000 192,000 2.25%
TKN 18,600 184,490 0.08%
PSL 16,300 122,895 0.22%
ANAN 35,000 119,040 0.49%
PLANB 13,000 110,900 0.04%
RML 94,300 99,958 4.45%
Sources: SET, Bualuang research
Remark: - Excluding a short sale by a member that is a participating dealer or market maker of the ETF investment units for the company's account, for the purpose of realizing a profit from a price spread (arbitrage), or for the purpose of stabilizing liquidity, as the case may be.
- The record of security symbol ended with "-R" is short sales trading of NVDR
Market Statistics Daily - 6
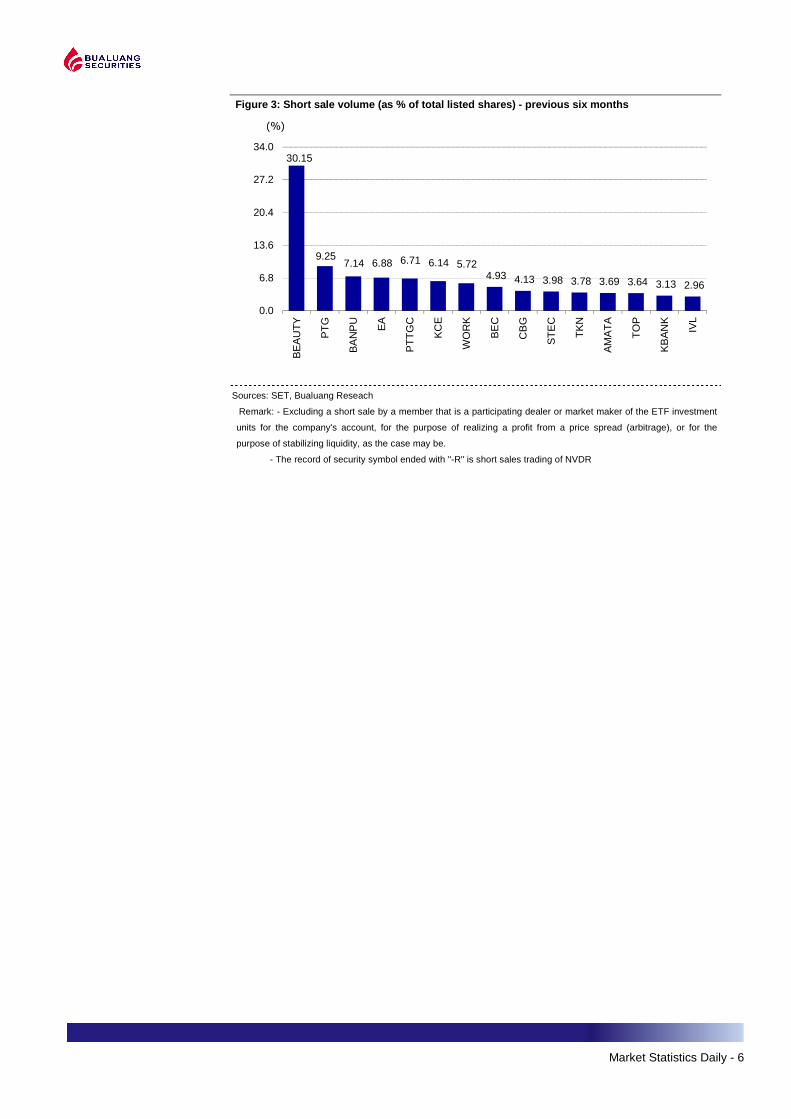
Figure 3: Short sale volume (as % of total listed s hares) - previous six months
Sources: SET, Bualuang Reseach
Remark: - Excluding a short sale by a member that is a participating dealer or market maker of the ETF investment
units for the company's account, for the purpose of realizing a profit from a price spread (arbitrage), or for the
purpose of stabilizing liquidity, as the case may be.
- The record of security symbol ended with "-R" is short sales trading of NVDR
30.15
9.25 7.14 6.88 6.71 6.14 5.72
4.93 4.13 3.98 3.78 3.69 3.64 3.13 2.96
0.0
6.8
13.6
20.4
27.2
34.0
BE
AU
TY
PT
G
BA
NP
U
EA
PT
TG
C
KC
E
WO
RK
BE
C
CB
G
ST
EC
TK
N
AM
AT
A
TO
P
KB
AN
K
IVL
(%)
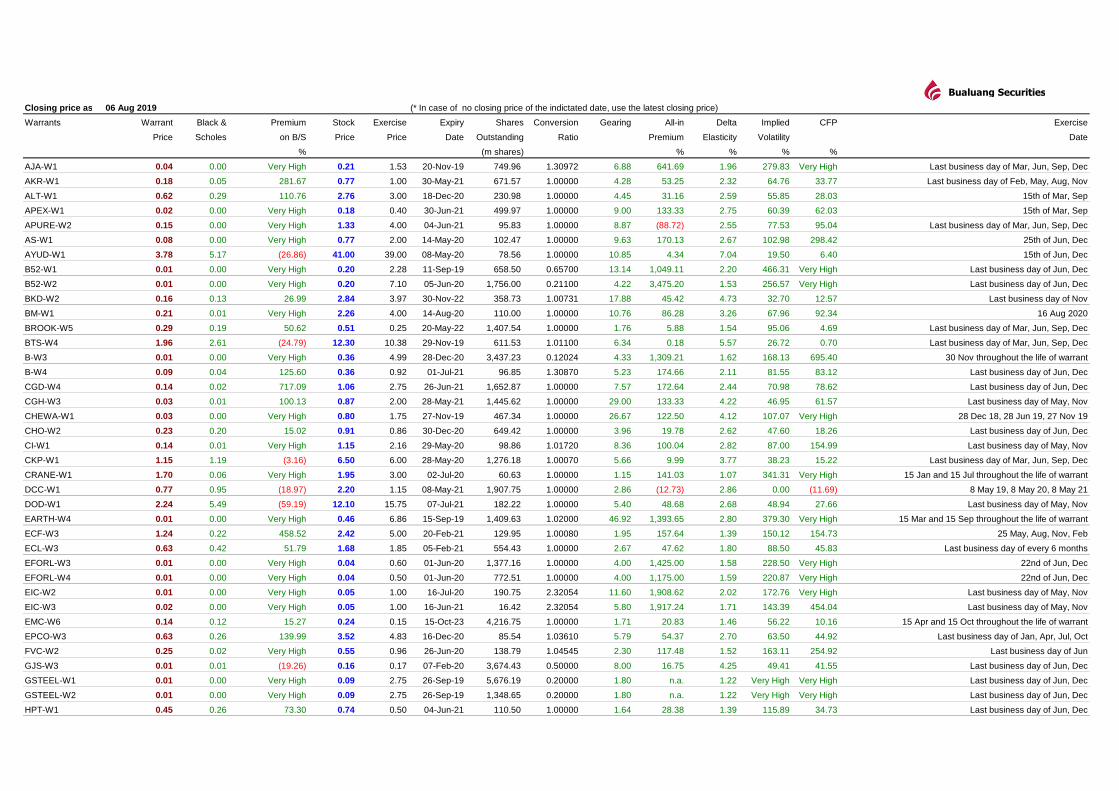
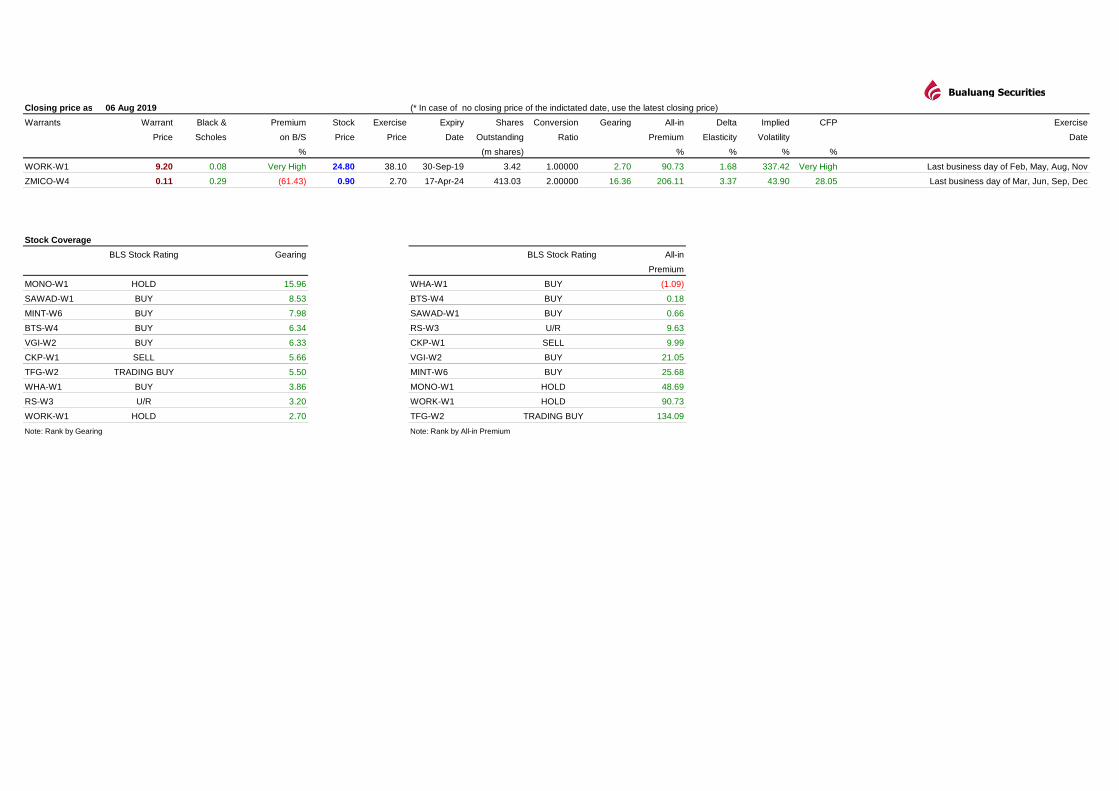
Closing price as of: (* In case of no closing price of the indictated date, use the latest closing price)
Warrants Warrant Black & Premium Stock Exercise Expiry Shares Conversion Gearing All-in Delta Implied CFP Exercise
Price Scholes on B/S Price Price Date Outstanding Ratio Premium Elasticity Volatility Date
% (m shares) % % % %
AJA-W1 0.04 0.00 Very High 0.21 1.53 20-Nov-19 749.96 1.30972 6.88 641.69 1.96 279.83 Very High Last business day of Mar, Jun, Sep, Dec
AKR-W1 0.18 0.05 281.67 0.77 1.00 30-May-21 671.57 1.00000 4.28 53.25 2.32 64.76 33.77 Last business day of Feb, May, Aug, Nov
ALT-W1 0.62 0.29 110.76 2.76 3.00 18-Dec-20 230.98 1.00000 4.45 31.16 2.59 55.85 28.03 15th of Mar, Sep
APEX-W1 0.02 0.00 Very High 0.18 0.40 30-Jun-21 499.97 1.00000 9.00 133.33 2.75 60.39 62.03 15th of Mar, Sep
APURE-W2 0.15 0.00 Very High 1.33 4.00 04-Jun-21 95.83 1.00000 8.87 (88.72) 2.55 77.53 95.04 Last business day of Mar, Jun, Sep, Dec
AS-W1 0.08 0.00 Very High 0.77 2.00 14-May-20 102.47 1.00000 9.63 170.13 2.67 102.98 298.42 25th of Jun, Dec
AYUD-W1 3.78 5.17 (26.86) 41.00 39.00 08-May-20 78.56 1.00000 10.85 4.34 7.04 19.50 6.40 15th of Jun, Dec
B52-W1 0.01 0.00 Very High 0.20 2.28 11-Sep-19 658.50 0.65700 13.14 1,049.11 2.20 466.31 Very High Last business day of Jun, Dec
B52-W2 0.01 0.00 Very High 0.20 7.10 05-Jun-20 1,756.00 0.21100 4.22 3,475.20 1.53 256.57 Very High Last business day of Jun, Dec
BKD-W2 0.16 0.13 26.99 2.84 3.97 30-Nov-22 358.73 1.00731 17.88 45.42 4.73 32.70 12.57 Last business day of Nov
BM-W1 0.21 0.01 Very High 2.26 4.00 14-Aug-20 110.00 1.00000 10.76 86.28 3.26 67.96 92.34 16 Aug 2020
BROOK-W5 0.29 0.19 50.62 0.51 0.25 20-May-22 1,407.54 1.00000 1.76 5.88 1.54 95.06 4.69 Last business day of Mar, Jun, Sep, Dec
BTS-W4 1.96 2.61 (24.79) 12.30 10.38 29-Nov-19 611.53 1.01100 6.34 0.18 5.57 26.72 0.70 Last business day of Mar, Jun, Sep, Dec
B-W3 0.01 0.00 Very High 0.36 4.99 28-Dec-20 3,437.23 0.12024 4.33 1,309.21 1.62 168.13 695.40 30 Nov throughout the life of warrant
B-W4 0.09 0.04 125.60 0.36 0.92 01-Jul-21 96.85 1.30870 5.23 174.66 2.11 81.55 83.12 Last business day of Jun, Dec
CGD-W4 0.14 0.02 717.09 1.06 2.75 26-Jun-21 1,652.87 1.00000 7.57 172.64 2.44 70.98 78.62 Last business day of Jun, Dec
CGH-W3 0.03 0.01 100.13 0.87 2.00 28-May-21 1,445.62 1.00000 29.00 133.33 4.22 46.95 61.57 Last business day of May, Nov
CHEWA-W1 0.03 0.00 Very High 0.80 1.75 27-Nov-19 467.34 1.00000 26.67 122.50 4.12 107.07 Very High 28 Dec 18, 28 Jun 19, 27 Nov 19
CHO-W2 0.23 0.20 15.02 0.91 0.86 30-Dec-20 649.42 1.00000 3.96 19.78 2.62 47.60 18.26 Last business day of Jun, Dec
CI-W1 0.14 0.01 Very High 1.15 2.16 29-May-20 98.86 1.01720 8.36 100.04 2.82 87.00 154.99 Last business day of May, Nov
CKP-W1 1.15 1.19 (3.16) 6.50 6.00 28-May-20 1,276.18 1.00070 5.66 9.99 3.77 38.23 15.22 Last business day of Mar, Jun, Sep, Dec
CRANE-W1 1.70 0.06 Very High 1.95 3.00 02-Jul-20 60.63 1.00000 1.15 141.03 1.07 341.31 Very High 15 Jan and 15 Jul throughout the life of warrant
DCC-W1 0.77 0.95 (18.97) 2.20 1.15 08-May-21 1,907.75 1.00000 2.86 (12.73) 2.86 0.00 (11.69) 8 May 19, 8 May 20, 8 May 21
DOD-W1 2.24 5.49 (59.19) 12.10 15.75 07-Jul-21 182.22 1.00000 5.40 48.68 2.68 48.94 27.66 Last business day of May, Nov
EARTH-W4 0.01 0.00 Very High 0.46 6.86 15-Sep-19 1,409.63 1.02000 46.92 1,393.65 2.80 379.30 Very High 15 Mar and 15 Sep throughout the life of warrant
ECF-W3 1.24 0.22 458.52 2.42 5.00 20-Feb-21 129.95 1.00080 1.95 157.64 1.39 150.12 154.73 25 May, Aug, Nov, Feb
ECL-W3 0.63 0.42 51.79 1.68 1.85 05-Feb-21 554.43 1.00000 2.67 47.62 1.80 88.50 45.83 Last business day of every 6 months
EFORL-W3 0.01 0.00 Very High 0.04 0.60 01-Jun-20 1,377.16 1.00000 4.00 1,425.00 1.58 228.50 Very High 22nd of Jun, Dec
EFORL-W4 0.01 0.00 Very High 0.04 0.50 01-Jun-20 772.51 1.00000 4.00 1,175.00 1.59 220.87 Very High 22nd of Jun, Dec
EIC-W2 0.01 0.00 Very High 0.05 1.00 16-Jul-20 190.75 2.32054 11.60 1,908.62 2.02 172.76 Very High Last business day of May, Nov
EIC-W3 0.02 0.00 Very High 0.05 1.00 16-Jun-21 16.42 2.32054 5.80 1,917.24 1.71 143.39 454.04 Last business day of May, Nov
EMC-W6 0.14 0.12 15.27 0.24 0.15 15-Oct-23 4,216.75 1.00000 1.71 20.83 1.46 56.22 10.16 15 Apr and 15 Oct throughout the life of warrant
EPCO-W3 0.63 0.26 139.99 3.52 4.83 16-Dec-20 85.54 1.03610 5.79 54.37 2.70 63.50 44.92 Last business day of Jan, Apr, Jul, Oct
FVC-W2 0.25 0.02 Very High 0.55 0.96 26-Jun-20 138.79 1.04545 2.30 117.48 1.52 163.11 254.92 Last business day of Jun
GJS-W3 0.01 0.01 (19.26) 0.16 0.17 07-Feb-20 3,674.43 0.50000 8.00 16.75 4.25 49.41 41.55 Last business day of Jun, Dec
GSTEEL-W1 0.01 0.00 Very High 0.09 2.75 26-Sep-19 5,676.19 0.20000 1.80 n.a. 1.22 Very High Very High Last business day of Jun, Dec
GSTEEL-W2 0.01 0.00 Very High 0.09 2.75 26-Sep-19 1,348.65 0.20000 1.80 n.a. 1.22 Very High Very High Last business day of Jun, Dec
HPT-W1 0.45 0.26 73.30 0.74 0.50 04-Jun-21 110.50 1.00000 1.64 28.38 1.39 115.89 34.73 Last business day of Jun, Dec
06 Aug 2019
Bualuang Securities
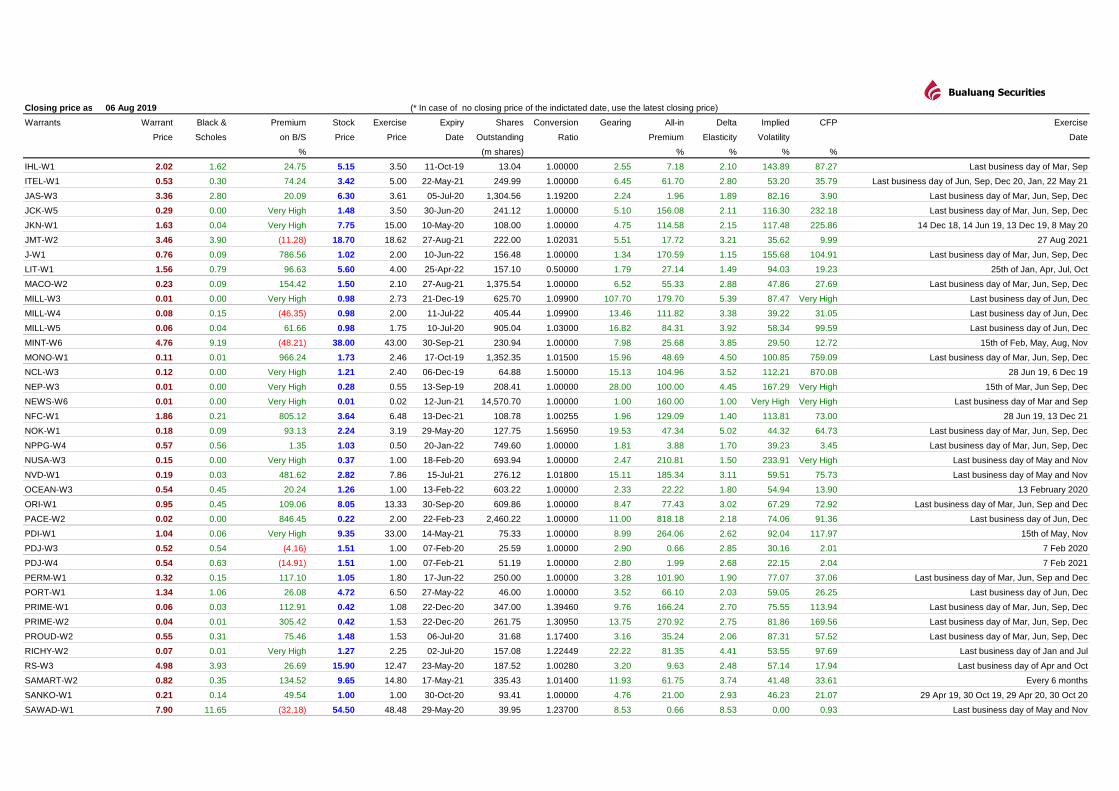
Closing price as of: (* In case of no closing price of the indictated date, use the latest closing price)
Warrants Warrant Black & Premium Stock Exercise Expiry Shares Conversion Gearing All-in Delta Implied CFP Exercise
Price Scholes on B/S Price Price Date Outstanding Ratio Premium Elasticity Volatility Date
% (m shares) % % % %
06 Aug 2019
Bualuang Securities
IHL-W1 2.02 1.62 24.75 5.15 3.50 11-Oct-19 13.04 1.00000 2.55 7.18 2.10 143.89 87.27 Last business day of Mar, Sep
ITEL-W1 0.53 0.30 74.24 3.42 5.00 22-May-21 249.99 1.00000 6.45 61.70 2.80 53.20 35.79 Last business day of Jun, Sep, Dec 20, Jan, 22 May 21
JAS-W3 3.36 2.80 20.09 6.30 3.61 05-Jul-20 1,304.56 1.19200 2.24 1.96 1.89 82.16 3.90 Last business day of Mar, Jun, Sep, Dec
JCK-W5 0.29 0.00 Very High 1.48 3.50 30-Jun-20 241.12 1.00000 5.10 156.08 2.11 116.30 232.18 Last business day of Mar, Jun, Sep, Dec
JKN-W1 1.63 0.04 Very High 7.75 15.00 10-May-20 108.00 1.00000 4.75 114.58 2.15 117.48 225.86 14 Dec 18, 14 Jun 19, 13 Dec 19, 8 May 20
JMT-W2 3.46 3.90 (11.28) 18.70 18.62 27-Aug-21 222.00 1.02031 5.51 17.72 3.21 35.62 9.99 27 Aug 2021
J-W1 0.76 0.09 786.56 1.02 2.00 10-Jun-22 156.48 1.00000 1.34 170.59 1.15 155.68 104.91 Last business day of Mar, Jun, Sep, Dec
LIT-W1 1.56 0.79 96.63 5.60 4.00 25-Apr-22 157.10 0.50000 1.79 27.14 1.49 94.03 19.23 25th of Jan, Apr, Jul, Oct
MACO-W2 0.23 0.09 154.42 1.50 2.10 27-Aug-21 1,375.54 1.00000 6.52 55.33 2.88 47.86 27.69 Last business day of Mar, Jun, Sep, Dec
MILL-W3 0.01 0.00 Very High 0.98 2.73 21-Dec-19 625.70 1.09900 107.70 179.70 5.39 87.47 Very High Last business day of Jun, Dec
MILL-W4 0.08 0.15 (46.35) 0.98 2.00 11-Jul-22 405.44 1.09900 13.46 111.82 3.38 39.22 31.05 Last business day of Jun, Dec
MILL-W5 0.06 0.04 61.66 0.98 1.75 10-Jul-20 905.04 1.03000 16.82 84.31 3.92 58.34 99.59 Last business day of Jun, Dec
MINT-W6 4.76 9.19 (48.21) 38.00 43.00 30-Sep-21 230.94 1.00000 7.98 25.68 3.85 29.50 12.72 15th of Feb, May, Aug, Nov
MONO-W1 0.11 0.01 966.24 1.73 2.46 17-Oct-19 1,352.35 1.01500 15.96 48.69 4.50 100.85 759.09 Last business day of Mar, Jun, Sep, Dec
NCL-W3 0.12 0.00 Very High 1.21 2.40 06-Dec-19 64.88 1.50000 15.13 104.96 3.52 112.21 870.08 28 Jun 19, 6 Dec 19
NEP-W3 0.01 0.00 Very High 0.28 0.55 13-Sep-19 208.41 1.00000 28.00 100.00 4.45 167.29 Very High 15th of Mar, Jun Sep, Dec
NEWS-W6 0.01 0.00 Very High 0.01 0.02 12-Jun-21 14,570.70 1.00000 1.00 160.00 1.00 Very High Very High Last business day of Mar and Sep
NFC-W1 1.86 0.21 805.12 3.64 6.48 13-Dec-21 108.78 1.00255 1.96 129.09 1.40 113.81 73.00 28 Jun 19, 13 Dec 21
NOK-W1 0.18 0.09 93.13 2.24 3.19 29-May-20 127.75 1.56950 19.53 47.34 5.02 44.32 64.73 Last business day of Mar, Jun, Sep, Dec
NPPG-W4 0.57 0.56 1.35 1.03 0.50 20-Jan-22 749.60 1.00000 1.81 3.88 1.70 39.23 3.45 Last business day of Mar, Jun, Sep, Dec
NUSA-W3 0.15 0.00 Very High 0.37 1.00 18-Feb-20 693.94 1.00000 2.47 210.81 1.50 233.91 Very High Last business day of May and Nov
NVD-W1 0.19 0.03 481.62 2.82 7.86 15-Jul-21 276.12 1.01800 15.11 185.34 3.11 59.51 75.73 Last business day of May and Nov
OCEAN-W3 0.54 0.45 20.24 1.26 1.00 13-Feb-22 603.22 1.00000 2.33 22.22 1.80 54.94 13.90 13 February 2020
ORI-W1 0.95 0.45 109.06 8.05 13.33 30-Sep-20 609.86 1.00000 8.47 77.43 3.02 67.29 72.92 Last business day of Mar, Jun, Sep and Dec
PACE-W2 0.02 0.00 846.45 0.22 2.00 22-Feb-23 2,460.22 1.00000 11.00 818.18 2.18 74.06 91.36 Last business day of Jun, Dec
PDI-W1 1.04 0.06 Very High 9.35 33.00 14-May-21 75.33 1.00000 8.99 264.06 2.62 92.04 117.97 15th of May, Nov
PDJ-W3 0.52 0.54 (4.16) 1.51 1.00 07-Feb-20 25.59 1.00000 2.90 0.66 2.85 30.16 2.01 7 Feb 2020
PDJ-W4 0.54 0.63 (14.91) 1.51 1.00 07-Feb-21 51.19 1.00000 2.80 1.99 2.68 22.15 2.04 7 Feb 2021
PERM-W1 0.32 0.15 117.10 1.05 1.80 17-Jun-22 250.00 1.00000 3.28 101.90 1.90 77.07 37.06 Last business day of Mar, Jun, Sep and Dec
PORT-W1 1.34 1.06 26.08 4.72 6.50 27-May-22 46.00 1.00000 3.52 66.10 2.03 59.05 26.25 Last business day of Jun, Dec
PRIME-W1 0.06 0.03 112.91 0.42 1.08 22-Dec-20 347.00 1.39460 9.76 166.24 2.70 75.55 113.94 Last business day of Mar, Jun, Sep, Dec
PRIME-W2 0.04 0.01 305.42 0.42 1.53 22-Dec-20 261.75 1.30950 13.75 270.92 2.75 81.86 169.56 Last business day of Mar, Jun, Sep, Dec
PROUD-W2 0.55 0.31 75.46 1.48 1.53 06-Jul-20 31.68 1.17400 3.16 35.24 2.06 87.31 57.52 Last business day of Mar, Jun, Sep, Dec
RICHY-W2 0.07 0.01 Very High 1.27 2.25 02-Jul-20 157.08 1.22449 22.22 81.35 4.41 53.55 97.69 Last business day of Jan and Jul
RS-W3 4.98 3.93 26.69 15.90 12.47 23-May-20 187.52 1.00280 3.20 9.63 2.48 57.14 17.94 Last business day of Apr and Oct
SAMART-W2 0.82 0.35 134.52 9.65 14.80 17-May-21 335.43 1.01400 11.93 61.75 3.74 41.48 33.61 Every 6 months
SANKO-W1 0.21 0.14 49.54 1.00 1.00 30-Oct-20 93.41 1.00000 4.76 21.00 2.93 46.23 21.07 29 Apr 19, 30 Oct 19, 29 Apr 20, 30 Oct 20
SAWAD-W1 7.90 11.65 (32.18) 54.50 48.48 29-May-20 39.95 1.23700 8.53 0.66 8.53 0.00 0.93 Last business day of May and Nov
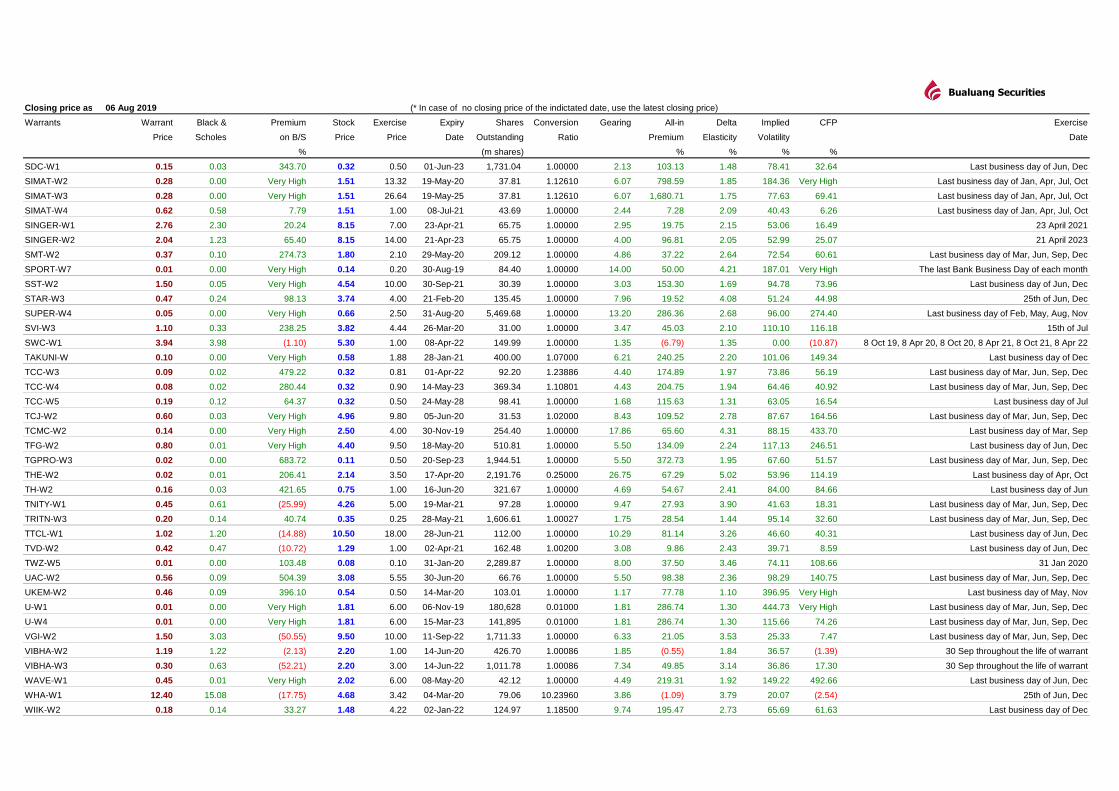
Closing price as of: (* In case of no closing price of the indictated date, use the latest closing price)
Warrants Warrant Black & Premium Stock Exercise Expiry Shares Conversion Gearing All-in Delta Implied CFP Exercise
Price Scholes on B/S Price Price Date Outstanding Ratio Premium Elasticity Volatility Date
% (m shares) % % % %
06 Aug 2019
Bualuang Securities
SDC-W1 0.15 0.03 343.70 0.32 0.50 01-Jun-23 1,731.04 1.00000 2.13 103.13 1.48 78.41 32.64 Last business day of Jun, Dec
SIMAT-W2 0.28 0.00 Very High 1.51 13.32 19-May-20 37.81 1.12610 6.07 798.59 1.85 184.36 Very High Last business day of Jan, Apr, Jul, Oct
SIMAT-W3 0.28 0.00 Very High 1.51 26.64 19-May-25 37.81 1.12610 6.07 1,680.71 1.75 77.63 69.41 Last business day of Jan, Apr, Jul, Oct
SIMAT-W4 0.62 0.58 7.79 1.51 1.00 08-Jul-21 43.69 1.00000 2.44 7.28 2.09 40.43 6.26 Last business day of Jan, Apr, Jul, Oct
SINGER-W1 2.76 2.30 20.24 8.15 7.00 23-Apr-21 65.75 1.00000 2.95 19.75 2.15 53.06 16.49 23 April 2021
SINGER-W2 2.04 1.23 65.40 8.15 14.00 21-Apr-23 65.75 1.00000 4.00 96.81 2.05 52.99 25.07 21 April 2023
SMT-W2 0.37 0.10 274.73 1.80 2.10 29-May-20 209.12 1.00000 4.86 37.22 2.64 72.54 60.61 Last business day of Mar, Jun, Sep, Dec
SPORT-W7 0.01 0.00 Very High 0.14 0.20 30-Aug-19 84.40 1.00000 14.00 50.00 4.21 187.01 Very High The last Bank Business Day of each month
SST-W2 1.50 0.05 Very High 4.54 10.00 30-Sep-21 30.39 1.00000 3.03 153.30 1.69 94.78 73.96 Last business day of Jun, Dec
STAR-W3 0.47 0.24 98.13 3.74 4.00 21-Feb-20 135.45 1.00000 7.96 19.52 4.08 51.24 44.98 25th of Jun, Dec
SUPER-W4 0.05 0.00 Very High 0.66 2.50 31-Aug-20 5,469.68 1.00000 13.20 286.36 2.68 96.00 274.40 Last business day of Feb, May, Aug, Nov
SVI-W3 1.10 0.33 238.25 3.82 4.44 26-Mar-20 31.00 1.00000 3.47 45.03 2.10 110.10 116.18 15th of Jul
SWC-W1 3.94 3.98 (1.10) 5.30 1.00 08-Apr-22 149.99 1.00000 1.35 (6.79) 1.35 0.00 (10.87) 8 Oct 19, 8 Apr 20, 8 Oct 20, 8 Apr 21, 8 Oct 21, 8 Apr 22
TAKUNI-W 0.10 0.00 Very High 0.58 1.88 28-Jan-21 400.00 1.07000 6.21 240.25 2.20 101.06 149.34 Last business day of Dec
TCC-W3 0.09 0.02 479.22 0.32 0.81 01-Apr-22 92.20 1.23886 4.40 174.89 1.97 73.86 56.19 Last business day of Mar, Jun, Sep, Dec
TCC-W4 0.08 0.02 280.44 0.32 0.90 14-May-23 369.34 1.10801 4.43 204.75 1.94 64.46 40.92 Last business day of Mar, Jun, Sep, Dec
TCC-W5 0.19 0.12 64.37 0.32 0.50 24-May-28 98.41 1.00000 1.68 115.63 1.31 63.05 16.54 Last business day of Jul
TCJ-W2 0.60 0.03 Very High 4.96 9.80 05-Jun-20 31.53 1.02000 8.43 109.52 2.78 87.67 164.56 Last business day of Mar, Jun, Sep, Dec
TCMC-W2 0.14 0.00 Very High 2.50 4.00 30-Nov-19 254.40 1.00000 17.86 65.60 4.31 88.15 433.70 Last business day of Mar, Sep
TFG-W2 0.80 0.01 Very High 4.40 9.50 18-May-20 510.81 1.00000 5.50 134.09 2.24 117.13 246.51 Last business day of Jun, Dec
TGPRO-W3 0.02 0.00 683.72 0.11 0.50 20-Sep-23 1,944.51 1.00000 5.50 372.73 1.95 67.60 51.57 Last business day of Mar, Jun, Sep, Dec
THE-W2 0.02 0.01 206.41 2.14 3.50 17-Apr-20 2,191.76 0.25000 26.75 67.29 5.02 53.96 114.19 Last business day of Apr, Oct
TH-W2 0.16 0.03 421.65 0.75 1.00 16-Jun-20 321.67 1.00000 4.69 54.67 2.41 84.00 84.66 Last business day of Jun
TNITY-W1 0.45 0.61 (25.99) 4.26 5.00 19-Mar-21 97.28 1.00000 9.47 27.93 3.90 41.63 18.31 Last business day of Mar, Jun, Sep, Dec
TRITN-W3 0.20 0.14 40.74 0.35 0.25 28-May-21 1,606.61 1.00027 1.75 28.54 1.44 95.14 32.60 Last business day of Mar, Jun, Sep, Dec
TTCL-W1 1.02 1.20 (14.88) 10.50 18.00 28-Jun-21 112.00 1.00000 10.29 81.14 3.26 46.60 40.31 Last business day of Jun, Dec
TVD-W2 0.42 0.47 (10.72) 1.29 1.00 02-Apr-21 162.48 1.00200 3.08 9.86 2.43 39.71 8.59 Last business day of Jun, Dec
TWZ-W5 0.01 0.00 103.48 0.08 0.10 31-Jan-20 2,289.87 1.00000 8.00 37.50 3.46 74.11 108.66 31 Jan 2020
UAC-W2 0.56 0.09 504.39 3.08 5.55 30-Jun-20 66.76 1.00000 5.50 98.38 2.36 98.29 140.75 Last business day of Mar, Jun, Sep, Dec
UKEM-W2 0.46 0.09 396.10 0.54 0.50 14-Mar-20 103.01 1.00000 1.17 77.78 1.10 396.95 Very High Last business day of May, Nov
U-W1 0.01 0.00 Very High 1.81 6.00 06-Nov-19 180,628 0.01000 1.81 286.74 1.30 444.73 Very High Last business day of Mar, Jun, Sep, Dec
U-W4 0.01 0.00 Very High 1.81 6.00 15-Mar-23 141,895 0.01000 1.81 286.74 1.30 115.66 74.26 Last business day of Mar, Jun, Sep, Dec
VGI-W2 1.50 3.03 (50.55) 9.50 10.00 11-Sep-22 1,711.33 1.00000 6.33 21.05 3.53 25.33 7.47 Last business day of Mar, Jun, Sep, Dec
VIBHA-W2 1.19 1.22 (2.13) 2.20 1.00 14-Jun-20 426.70 1.00086 1.85 (0.55) 1.84 36.57 (1.39) 30 Sep throughout the life of warrant
VIBHA-W3 0.30 0.63 (52.21) 2.20 3.00 14-Jun-22 1,011.78 1.00086 7.34 49.85 3.14 36.86 17.30 30 Sep throughout the life of warrant
WAVE-W1 0.45 0.01 Very High 2.02 6.00 08-May-20 42.12 1.00000 4.49 219.31 1.92 149.22 492.66 Last business day of Jun, Dec
WHA-W1 12.40 15.08 (17.75) 4.68 3.42 04-Mar-20 79.06 10.23960 3.86 (1.09) 3.79 20.07 (2.54) 25th of Jun, Dec
WIIK-W2 0.18 0.14 33.27 1.48 4.22 02-Jan-22 124.97 1.18500 9.74 195.47 2.73 65.69 61.63 Last business day of Dec
Closing price as of: (* In case of no closing price of the indictated date, use the latest closing price)
Warrants Warrant Black & Premium Stock Exercise Expiry Shares Conversion Gearing All-in Delta Implied CFP Exercise
Price Scholes on B/S Price Price Date Outstanding Ratio Premium Elasticity Volatility Date
% (m shares) % % % %
06 Aug 2019
Bualuang Securities
WORK-W1 9.20 0.08 Very High 24.80 38.10 30-Sep-19 3.42 1.00000 2.70 90.73 1.68 337.42 Very High Last business day of Feb, May, Aug, Nov
ZMICO-W4 0.11 0.29 (61.43) 0.90 2.70 17-Apr-24 413.03 2.00000 16.36 206.11 3.37 43.90 28.05 Last business day of Mar, Jun, Sep, Dec
Stock Coverage
BLS Stock Rating Gearing BLS Stock Rating All-in
Premium
MONO-W1 HOLD 15.96 WHA-W1 BUY (1.09)
SAWAD-W1 BUY 8.53 BTS-W4 BUY 0.18
MINT-W6 BUY 7.98 SAWAD-W1 BUY 0.66
BTS-W4 BUY 6.34 RS-W3 U/R 9.63
VGI-W2 BUY 6.33 CKP-W1 SELL 9.99
CKP-W1 SELL 5.66 VGI-W2 BUY 21.05
TFG-W2 TRADING BUY 5.50 MINT-W6 BUY 25.68
WHA-W1 BUY 3.86 MONO-W1 HOLD 48.69
RS-W3 U/R 3.20 WORK-W1 HOLD 90.73
WORK-W1 HOLD 2.70 TFG-W2 TRADING BUY 134.09
Note: Rank by Gearing Note: Rank by All-in Premium
Bualuang Securities Public Company Limited
BUALUANG SECURITIES PUBLIC COMPANY LIMITED (BLS) is a subsidiary of BANGKOK BANK PUBLIC COMPANY LIMITED (BBL). This document is produced based upon sources believed to be reliable but their accuracy, completeness or correctness is not guaranteed. The statements or expressions of opinion herein were arrived at after due and careful consideration to use as information for investment. Expressions of opinion contained herein are subject to change without notice. This document is not, and should not be construed as, an offer or the solicitation of an offer to buy or sell any securities. The use of any information shall be at the sole discretion and risk of the user.
BUALUANG SECURITIES PUBLIC COMPANY LIMITED MAY BE IN RELATIONSHIP WITH THE SECURITIES IN THIS REPORT. “Opinions, projections and other information contained in this report are based upon sources believed to be accurate including the draft prospectus, but no responsibility is accepted for any loss occasioned by reliance placed upon the contents hereof. Bualuang Securities Public Company Limited may from time to time perform investment, advisory or other services for companies mentioned in this report, as well as dealing (as principal or otherwise) in, or otherwise being interested in, any securities mentioned herein, This report does not constitute a solicitation to buy or sell any securities”. Investors should carefully read details in the prospectus before making investment decision.
BUALUANG SECURITIES PUBLIC COMPANY LIMITED MAY ACT AS MARKET MAKER AND ISSUER OF DWs, AND ISSUER OF STRUCTURED NOTES ON THESE SECURITIES. The company may prepare the research reports on those underlying securities. Investors should carefully read the details of the derivative warrants and structured notes in the prospectus before making investment decisions.
AAV ADVANC AMATA AOT AP BANPU BCH BCP BCPG BDMS BEAUTY BEM BH BJC BTSCBG CENTEL CHG CK CPALL CPF CPN DTAC EGCO GLOBAL GPSC HANA HMPRO INTUCH IRPCIVL KBANK KCE KKP KTB KTC LH MINT PTG PTT PTTEP PTTGC QH ROBINS SAWADSCB SCC SPALI SPRC STEC TASCO TCAP THANI TISCO TKN TMB TOP TRUE TU WHA
WORK ESSO CKP STA BGRIM TOA AEONTS GULF MTC OSP BEC BPP GUNKUL
BUALUANG SECURITIES PUBLIC COMPANY LIMITED IS OR MAY BE AN UNDERWRITER/CO-UNDERWRITER/JOINT LEAD IN RESPECT OF THE INITIAL PUBLIC OFFERING (IPO) OF SECURITIES.
Financial Advisor Lead underwriter/
Underwriter/ Co-underwriter
ILM ILM
CG Rating
Score Range Score Range Description
90 – 100
Excellent
80 – 89 Very Good
70 – 79 Good
60 – 69 Satisfactory
50 – 00359 Pass
Less than 50 No logo given -
Thailand's Private Sector Collective Action Coalition Against Corruption programme (Thai CAC) under Thai Institute of Directors
companies that have declared their intention to join CAC, and
companies certified by CAC.
DISCLAIMER

CORPORATE GOVERNANCE REPORT DISCLAIMER
This research report was prepared by Bualuang Securities Public Company Limited and refers to research prepared by Morgan Stanley. Morgan Stanley does not warrant or guarantee the accuracy or completeness of its research reports. Morgan Stanley reserves copyright and other proprietary rights in the material reproduced in this report. Morgan Stanley is under no obligation to inform Bualuang Securities or you if the views or information referred to or reproduced in this research report change.
Corporate Governance Report disclaimer
The disclosure of the survey result of the Thai Institute of Directors Association (IOD) regarding corporate governance is made pursuant to the policy of the Office of the Securities and Exchange Commission. The IOD survey is based on the information of a company listed on the Stock Exchange of Thailand and the Market for Alternative Investment disclosed to the public and able to be accessed by a general public investor. The result, therefore, is from the perspective of a third party. It is not an evaluation of operation and is not based on inside information.
The survey result is as of the date appearing in the Corporate Governance Report of Thai Listed Companies. As a result, the survey result may be changed after that date. Bualuang Securities Public Company Limited neither confirms nor certifies the accuracy of such survey results. “Disclaimer: The disclosure of the Anti-Corruption Progress Indicators of a listed company on the Stock Exchange of Thailand, which is assessed by the relevant institution as disclosed by the Office of the Securities and Exchange Commission, is made in order to comply with the policy and sustainable development plan for the listed companies. The relevant institution made this assessment based on the information received from the listed company, as stipulated in the form for the assessment of Anti-corruption which refers to the Annual Registration Statement (Form 56-1), Annual Report (Form 56-2), or other relevant documents or reports of such listed company. The assessment result is therefore made from the perspective of a third party. It is not an assessment of operation and is not based on any inside information. Since this assessment is only the assessment result as of the date appearing in the assessment result, it may be changed after that date or when there is any change to the relevant information. Nevertheless, Bualuang Securities Public Company Limited neither confirms, verifies, nor certifies the accuracy and completeness of the assessment result.”
BUALUANG RESEARCH – RECOMMENDATION FRAMEWORK
STOCK RECOMMENDATIONS BUY: Expected positive total returns of 15% or more over the next 12
months. HOLD: Expected total returns of between -15% and +15% over the next 12
months. SELL: Expected negative total returns of 15% or more over the next 12
months. TRADING BUY: Expected positive total returns of 15% or more over the next
3 months.
SECTOR RECOMMENDATIONS OVERWEIGHT: The industry, as defined by the analyst's coverage universe, is
expected to outperform the relevant primary market index over the next 12 months. NEUTRAL: The industry, as defined by the analyst's coverage universe, is
expected to perform in line with the relevant primary market index over the next 12
months. UNDERWEIGHT: The industry, as defined by the analyst's coverage universe, is
expected to underperform the relevant primary market index over the next 12 months.