


Languages
Pages
Legal


Materials
Materials and Design 25 (2004) 317–329
www.elsevier.com/locate/matdes
&Design
An investigation of microstructure/property relationshipsin dissimilar welds between martensitic and austenitic stainless steels
Ramazan Kac�ar *, Orhan Baylan
Zonguldak Karaelmas €Unıversitesi, Karab€uk Teknik E�gitim Fak€ultesi, Metal-Welding Division, Karab€uk 78100, Turkey
Received 21 May 2003; accepted 15 October 2003
Abstract
The metallurgical characteristics, tensile, hardness, toughness and corrosion resistance of dissimilar welds between X5CrNi18-10
grade austenitic and X20CrMo13 grade martensitic stainless steel have been evaluated. Both austenitic and duplex stainless steel
electrodes were used to join this combination, using multipass manual metal arc welding process. Defect free welds were made with
each welding consumable. It was found that the tensile strength of weldment, which was produced by duplex electrode (E2209-17),
was slightly lower than that of austenitic electrode (E308L-16). The toughness of the both E2209-17 and E308L-16 deposits was
acceptable even at low temperature regardless of heat input. Hardness was increased in both welds made with E2209-17 duplex and
E308L-16 austenitic electrode along the X20CrMo13/weld metal fusion boundary due to heat annealing and then following high
cooling rate. The pitting corrosion resistance of the weld metal made with E308L-16 and E2209-17 filler metal was found acceptable.
Although, heat affected zone in the weldment and X20CrMo13 base metal were affected by electrolytic corrosion. This investigation
has shown that both filler metals can be used to join austenitic stainless steel to the martensitic stainless steel.
� 2003 Elsevier Ltd. All rights reserved.
Keywords: Ferritic and martensitic stainless steel; Weldability; Tensile strength; Toughness; Corrosion resistance
1. Introduction
Because of their acceptable corrosion resistance, good
mechanical properties and becoming economic, mar-
tensitic stainless steel has become increasingly attractiveto a number of industry sectors. Austenitic stainless steel
has been widely preferred by industry due to its good
mechanical properties, outstanding corrosion resistance
in a wide range of environment and good weldability.
Each type of those grades of stainless steel is welded
similarly by using fusion welding technique with or
without requirement of special technique. However,
there is limited information about microstructure/property relationships in dissimilar welds between au-
stenitic and martensitic stainless steel by using duplex
and austenitic stainless steel electrode. Increasing ap-
plication of these steels will require a better under-
standing of the issues associated with welds to dissimilar
* Corresponding author. Tel.: +90-370-433-8200; fax: +90-370-
4338204.
E-mail address: [email protected] (R. Kacar).
0261-3069/$ - see front matter � 2003 Elsevier Ltd. All rights reserved.
doi:10.1016/j.matdes.2003.10.010
metals. The joining of dissimilar materials is generally
more challenging than that of similar materials because
of differences in the physical, chemical and mechanical
properties of the base metals welded. These differences
may also complicate the selection of filler metals com-patible to both base metals [1]. Therefore, filler metal
selection is often compromised between the two dis-
similar metals. There are few constitution diagrams such
as Schaeffler [2], Delong [3] and WRC [4], for similar
and dissimilar metal joining and predicting the micro-
structure. However, most of the diagrams currently
available do not represent the constitution regime for
ferritic and martensitic stainless steel which has theferrite plus martensite region. Since the WRC-1992 [4]
diagram is recommended for ferrite prediction, it is ra-
ther awkward to still rely on the Schaeffler diagram for
martensite prediction; Schaeffler diagram does not ac-
curately predict microstructure. Therefore, a study was
carried out by Kotecki [5] who has investigated the effect
of the higher manganese content of the weld filler metal
on the constitution regime on diagram. To do this, byplotting the Cr- and Ni-equivalents for the materials on

318 R. Kac�ar, O. Baylan / Materials and Design 25 (2004) 317–329
the diagram and connecting the base metals by a tie line,
the microstructure can be estimated by connecting a
point along that tie line (selected as the midpoint) to a
tie line to the filler metal composition. The weld metal
constitution then lies along the line between the fillermetal and base metal midpoint as dictated by the level of
dilution.
The dissimilar materials selected for the overall study
included an X20CrMo13 grade martensitic stainless steel
and X5CrNi18-10 grade austenitic stainless steel. Both
austenitic and duplex stainless steel manual metal arc
welding electrodes were used to join this combination
using multipass manual metal arc welding process. Thus,microstructure/property relationships between austenitic
and martensitic stainless steel dissimilar welds were de-
termined in this study. To do this, relationship between
hardness, pitting corrosion resistance and % ferrite
content related with the weld layer in all weld metal and
weldment was investigated. The relationships between
microstructure and mechanical properties were also
evaluated in detail.
2. Experimental procedure
2.1. Materials and welding procedure
Welding assembly was prepared for dissimilar welds
between austenitic stainless steel (X5CrNi18-10) tomartensitic stainless steel (X20CrMo13). Both E2209-17
duplex and E308L-16 austenitic welding consumable
were selected to join these metals. The chemical com-
position for the base and consumable was listed in
Table 1.
The base materials were supplied in the form of 10-
mm plate. These plates were cut into 50� 150 mm
coupons with a 35� level of each plate to provide 70�groove angle for a single-V-groove butt joint configu-
ration. The root face was 1 mm with root opening of 2.5
mm. All welding was performed using the manual metal
arc welding process with 3.2-mm diameter welding
Table 1
Chemical composition of base and weld metal
C Mn Si S P Cr
Chemical composition base metal and welding consumable (wt%)
X5CrNi18-10 0.040 1.340 0.571 0.035 0.030 17.066
X20CrMo13 0.220 0.360 0.480 0.001 0.018 12.257
E308L-16 0.03 0.8 0.8 – – 19.8
E2209-17 0.03 0.8 0.9 – – 22.5
Cr equivalent Ni equivalent
X5CrNi18-10 18.43 9.47
X20CrMo13 13.014 7.007
E308L-16 21 11.5
E2209-17 27.05 10.3
electrode. E2209-17 and E308L-16 welding consumable
were used in the multipass welds to join X20CrMo13
grade martensitic stainless steel to X10CrNi18-10 grade
austenitic stainless steel. The welding parameters were
used by the suggestion of welding consumable producer.Due to different thermal conductivity between austenitic
and martensitic stainless steel, test samples were preheat
treated at 200 �C. Test samples were joined initially
in the root and then second followed cover pass by,
respectively.
2.2. Mechanical properties
Tensile strength specimens were prepared from
weldment. Samples were prepared in the L–T orienta-
tion as TS 138. Test was performed using Instron tensile
test machine. Scanning electron microscope was utilized
to examine the fracture surface of the test sample.
Charpy V-notch (CVN) specimens were also ma-
chined from the welded coupons. Samples were pre-
pared in the L–T orientation as TS 269. The L–Torientation represents a sample transverse to the welding
direction with the notch located such that testing occurs
through the thickness of the weld from root to the cover
passes. All notches were located at the centre of the weld
deposit. The test was performed at temperature from
)50, 0 and 25 �C in order to define the toughness of weld
metal. Scanning electron microscopy was also utilized to
examine the fracture surfaces of the CVN samples.Moreover, heat affected zone and weld metal hard-
ness of weldment was measured by future Tech model
Vickers micro hardness test machine. Measurement was
carried out through the weldment profile in Fig. 1. A 100
g load was used in the test machine.
2.3. Pitting corrosion resistance
Pitting corrosion test was performed at 50 �C as de-
scribed in ASTM G-48. Two types of samples were
tested. The first type consisted of an entire weldment,
including both base materials and the fusion zone. The
Mo Ni V Al Ti Cu N
0.516 7.6 0.063 0.010 0.007 0.586
0.037 0.227 0.040 0.083 0.007 0.116
– 10.2 – – – –
3.2 9 – – – – 0.15
Cr/Ni equivalent PRE
1.94 –
1.85 –
1.82 –
2.62 35.46

Cover pass
2.Pass
Root pass
Weld metalITAB HAZ
1.5 mm
1.5 mm
15mm
10mm
Fig. 1. Hardness determination profile on the weldment.
R. Kac�ar, O. Baylan / Materials and Design 25 (2004) 317–329 319
second type was an all weld metal sample machined out
of the fusion zone through the thickness. Since the
thickness of the material was 10 mm, standard specimen
could not be used and samples of 10� 33 mm were used.The specimen was ground through the 600 grit SiC and
weighted prior to immersion in solution. The pitting
corrosion solution was 6% FeCl36H2O. Samples were
immersed in this solution for 72 h and removed and
observed every 12 h to note any changes. Following 72 h
test period, the samples were carefully scrubbed under
running water and then ultrasonically cleaned in meth-
anol for approximately 30 min. Evaluation of pittingwas determined by optical microscopy. The pits were
counted at magnifications of 50X and measured at
500X. Pits density was determined by dividing the
number of pits per unit area.
2.4. Metallurgical characterization and prediction of weld
microstructure
Weld cross sections were removed from each combi-
nation and grounded through 200–1200 mesh using
grinding paper and then polished through 1 lm dia-
mond paste. The samples were electronically etched in
10% oxalic acid at 5 V for 45 s. In the present work,
optical examination of samples was carried out using a
Nikon DIC microscope. A Camscan Series 4 scanning
electron microscope (SEM) with a link energy dispersiveX-ray (EDX) analytical system was also used for qual-
itative weld metal analyses.
Weld metal microstructure constitution regime and %
ferrite content can be predicted using Scheaffler diagram
for both weldments. Due to high alloy elements in the
weld metal that was made with E2209-17 weld con-
sumable, ferrite number (FN) must be calculated using
the WRC-1992 diagram [4]. However, this diagram did
not take martensite formation therefore Kotecki was
rearranged to the diagram which is enabling to show
martensite boundary [5]. Therefore, prediction of weld
microstructure was carried out using this diagram(Fig. 2).
Ferrite number measurements were also carried out
using ferritscope (type Fe8e3). All measurements were
obtained on longitudinal sections in the weld metal and
heat affected zone rather than transverse section in order
to better quantify variation within given pass. Three
measurements were taken at three different locations
within each pass. The results were then averaged toobtain ferrite number of each pass. The % ferrite content
was calculated by dividing the ferrite number with 1.4.
3. Results
The dissimilar X5CrNi18-10/X20CrMo13 metal com-
bination was welded with duplex E2209-17 and austen-itic E308L-16 filler metal. Fig. 3(a) and (b) shows
microstructure profile of the X5CrNi18-10/E2209-17/
X20CrMo13 and X5CrNi18-10/E308L-16/X20CrMo13
weldment, respectively. The microstructure of this com-
bination consists of austenite matrix (white) with both
skeletal and acicular ferrite (dark etching).
The relationship between all weld pass and % ferrite
content in the weldment was determined and result isshown in Fig. 4.
Ferrite measurement indicates that 59 FN (42% fer-
rite content) and 17 FN (12% ferrite content) in the weld
metal, which was obtained using E2209-17 and E308L-
16 filler metal, respectively, was measured in the
root pass of the weldment. Based on this modified
WRC-2000 diagram, 20 FN (14% ferrite content) was
calculated in the root pass of E308L-16 weld metal while
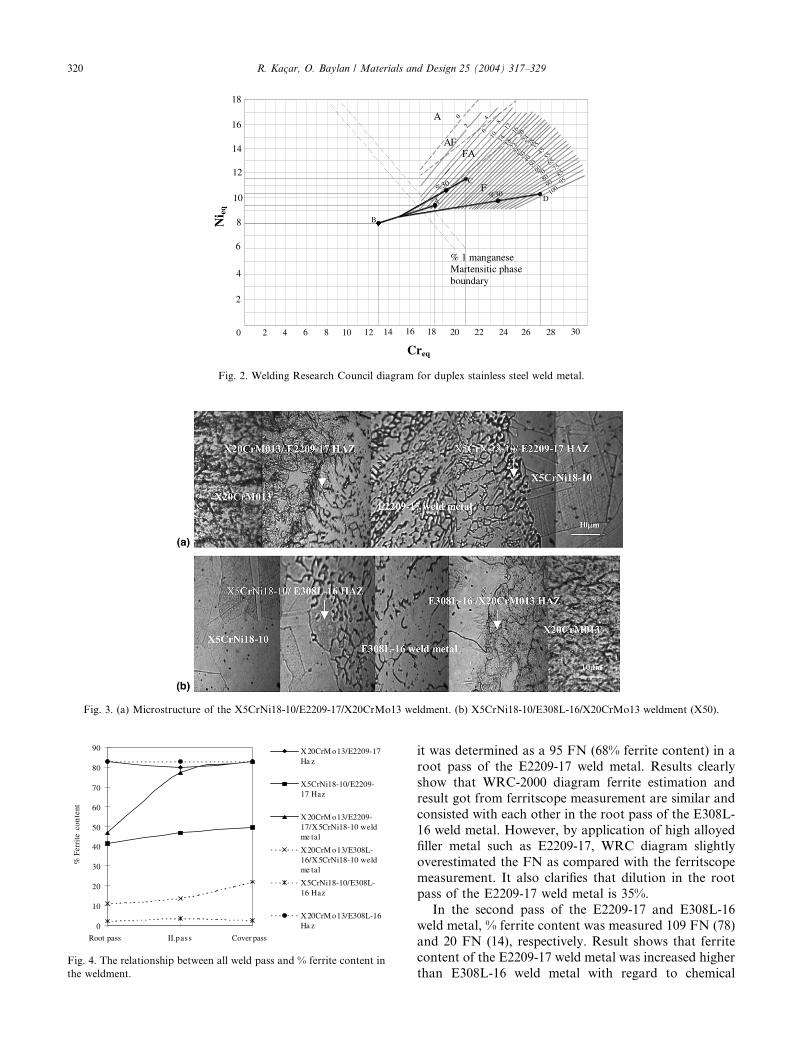
Fig. 3. (a) Microstructure of the X5CrNi18-10/E2209-17/X20CrMo13 weldment. (b) X5CrNi18-10/E308L-16/X20CrMo13 weldment (X50).
0
10
20
30
40
50
60
70
80
90
Root pass II.pass Cover pass
% F
erri
te c
onte
nt
X20CrM o13/E2209-17Ha z
X5CrNi18-10/E2209-17 Haz
X20CrM o13/E2209-17/X5CrNi18-10 weldme tal
X20CrM o13/E308L-16/X5CrNi18-10 weldme tal
X5CrNi18-10/E308L-16 Haz
X20CrM o13/E308L-16Ha z
Fig. 4. The relationship between all weld pass and % ferrite content in
the weldment.
3026
222016
8
4
6
4 6 8 10
2
20
10
1814
812
10
64
20
%30
AF
FC
FA
A
A
B
24222012 14 16 18
D100
9590
8580
7570
6560
55
5045
40352824
302826
12
14
16
18
%30
Ni eq
% 1 manganese Martensitic phase boundary
Creq
Fig. 2. Welding Research Council diagram for duplex stainless steel weld metal.
320 R. Kac�ar, O. Baylan / Materials and Design 25 (2004) 317–329
it was determined as a 95 FN (68% ferrite content) in a
root pass of the E2209-17 weld metal. Results clearly
show that WRC-2000 diagram ferrite estimation and
result got from ferritscope measurement are similar and
consisted with each other in the root pass of the E308L-
16 weld metal. However, by application of high alloyed
filler metal such as E2209-17, WRC diagram slightly
overestimated the FN as compared with the ferritscopemeasurement. It also clarifies that dilution in the root
pass of the E2209-17 weld metal is 35%.
In the second pass of the E2209-17 and E308L-16
weld metal, % ferrite content was measured 109 FN (78)
and 20 FN (14), respectively. Result shows that ferrite
content of the E2209-17 weld metal was increased higher
than E308L-16 weld metal with regard to chemical
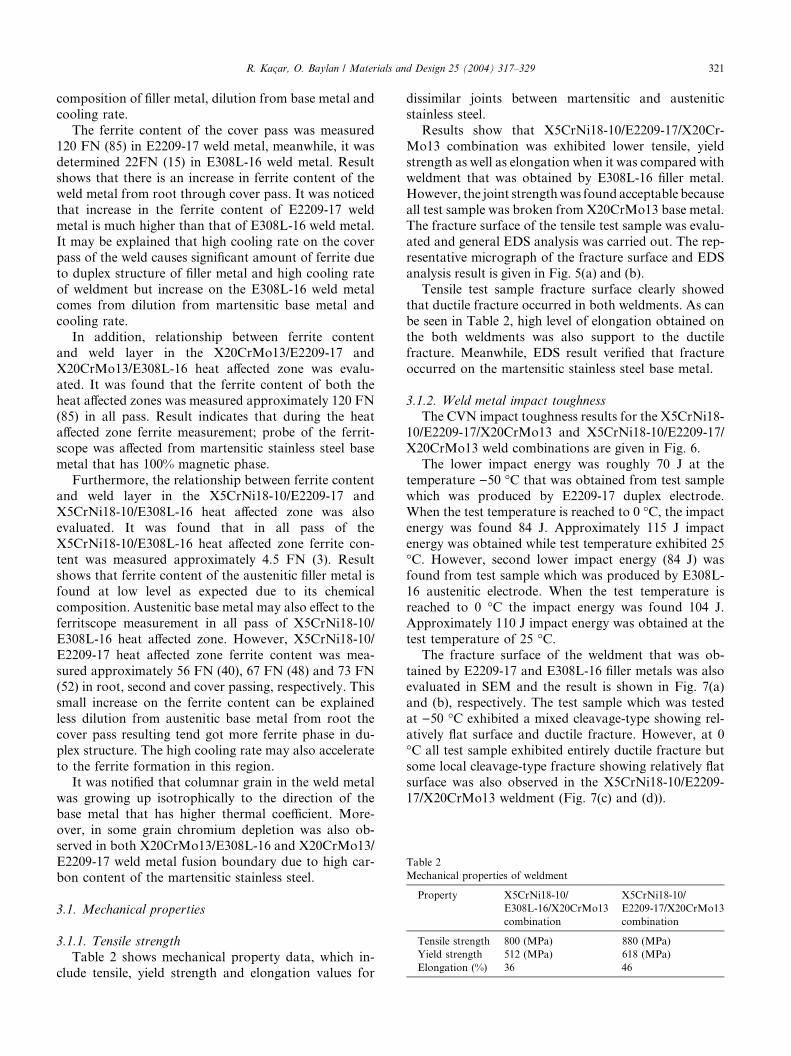
Table 2
Mechanical properties of weldment
Property X5CrNi18-10/
E308L-16/X20CrMo13
combination
X5CrNi18-10/
E2209-17/X20CrMo13
combination
Tensile strength 800 (MPa) 880 (MPa)
Yield strength 512 (MPa) 618 (MPa)
Elongation (%) 36 46
R. Kac�ar, O. Baylan / Materials and Design 25 (2004) 317–329 321
composition of filler metal, dilution from base metal and
cooling rate.
The ferrite content of the cover pass was measured
120 FN (85) in E2209-17 weld metal, meanwhile, it was
determined 22FN (15) in E308L-16 weld metal. Resultshows that there is an increase in ferrite content of the
weld metal from root through cover pass. It was noticed
that increase in the ferrite content of E2209-17 weld
metal is much higher than that of E308L-16 weld metal.
It may be explained that high cooling rate on the cover
pass of the weld causes significant amount of ferrite due
to duplex structure of filler metal and high cooling rate
of weldment but increase on the E308L-16 weld metalcomes from dilution from martensitic base metal and
cooling rate.
In addition, relationship between ferrite content
and weld layer in the X20CrMo13/E2209-17 and
X20CrMo13/E308L-16 heat affected zone was evalu-
ated. It was found that the ferrite content of both the
heat affected zones was measured approximately 120 FN
(85) in all pass. Result indicates that during the heataffected zone ferrite measurement; probe of the ferrit-
scope was affected from martensitic stainless steel base
metal that has 100% magnetic phase.
Furthermore, the relationship between ferrite content
and weld layer in the X5CrNi18-10/E2209-17 and
X5CrNi18-10/E308L-16 heat affected zone was also
evaluated. It was found that in all pass of the
X5CrNi18-10/E308L-16 heat affected zone ferrite con-tent was measured approximately 4.5 FN (3). Result
shows that ferrite content of the austenitic filler metal is
found at low level as expected due to its chemical
composition. Austenitic base metal may also effect to the
ferritscope measurement in all pass of X5CrNi18-10/
E308L-16 heat affected zone. However, X5CrNi18-10/
E2209-17 heat affected zone ferrite content was mea-
sured approximately 56 FN (40), 67 FN (48) and 73 FN(52) in root, second and cover passing, respectively. This
small increase on the ferrite content can be explained
less dilution from austenitic base metal from root the
cover pass resulting tend got more ferrite phase in du-
plex structure. The high cooling rate may also accelerate
to the ferrite formation in this region.
It was notified that columnar grain in the weld metal
was growing up isotrophically to the direction of thebase metal that has higher thermal coefficient. More-
over, in some grain chromium depletion was also ob-
served in both X20CrMo13/E308L-16 and X20CrMo13/
E2209-17 weld metal fusion boundary due to high car-
bon content of the martensitic stainless steel.
3.1. Mechanical properties
3.1.1. Tensile strength
Table 2 shows mechanical property data, which in-
clude tensile, yield strength and elongation values for
dissimilar joints between martensitic and austenitic
stainless steel.
Results show that X5CrNi18-10/E2209-17/X20Cr-
Mo13 combination was exhibited lower tensile, yield
strength as well as elongation when it was compared withweldment that was obtained by E308L-16 filler metal.
However, the joint strengthwas found acceptable because
all test sample was broken from X20CrMo13 base metal.
The fracture surface of the tensile test sample was evalu-
ated and general EDS analysis was carried out. The rep-
resentative micrograph of the fracture surface and EDS
analysis result is given in Fig. 5(a) and (b).
Tensile test sample fracture surface clearly showedthat ductile fracture occurred in both weldments. As can
be seen in Table 2, high level of elongation obtained on
the both weldments was also support to the ductile
fracture. Meanwhile, EDS result verified that fracture
occurred on the martensitic stainless steel base metal.
3.1.2. Weld metal impact toughness
The CVN impact toughness results for the X5CrNi18-10/E2209-17/X20CrMo13 and X5CrNi18-10/E2209-17/
X20CrMo13 weld combinations are given in Fig. 6.
The lower impact energy was roughly 70 J at the
temperature )50 �C that was obtained from test sample
which was produced by E2209-17 duplex electrode.
When the test temperature is reached to 0 �C, the impact
energy was found 84 J. Approximately 115 J impact
energy was obtained while test temperature exhibited 25�C. However, second lower impact energy (84 J) was
found from test sample which was produced by E308L-
16 austenitic electrode. When the test temperature is
reached to 0 �C the impact energy was found 104 J.
Approximately 110 J impact energy was obtained at the
test temperature of 25 �C.The fracture surface of the weldment that was ob-
tained by E2209-17 and E308L-16 filler metals was alsoevaluated in SEM and the result is shown in Fig. 7(a)
and (b), respectively. The test sample which was tested
at )50 �C exhibited a mixed cleavage-type showing rel-
atively flat surface and ductile fracture. However, at 0
�C all test sample exhibited entirely ductile fracture but
some local cleavage-type fracture showing relatively flat
surface was also observed in the X5CrNi18-10/E2209-
17/X20CrMo13 weldment (Fig. 7(c) and (d)).
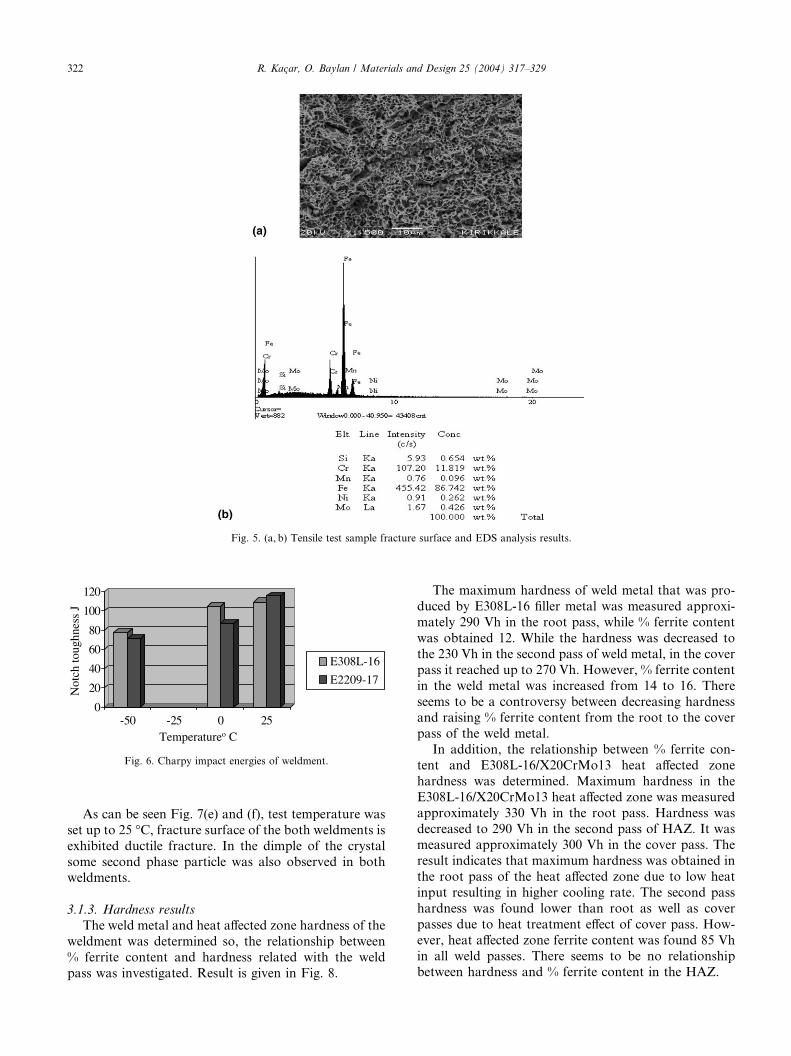
Fig. 5. (a, b) Tensile test sample fracture surface and EDS analysis results.
0
20
40
60
80
100
120
Not
ch to
ughn
ess
J
-50 -25 0 25Temperatureo C
E308L-16
E2209-17
Fig. 6. Charpy impact energies of weldment.
322 R. Kac�ar, O. Baylan / Materials and Design 25 (2004) 317–329
As can be seen Fig. 7(e) and (f), test temperature was
set up to 25 �C, fracture surface of the both weldments is
exhibited ductile fracture. In the dimple of the crystal
some second phase particle was also observed in bothweldments.
3.1.3. Hardness results
The weld metal and heat affected zone hardness of the
weldment was determined so, the relationship between
% ferrite content and hardness related with the weld
pass was investigated. Result is given in Fig. 8.
The maximum hardness of weld metal that was pro-
duced by E308L-16 filler metal was measured approxi-
mately 290 Vh in the root pass, while % ferrite content
was obtained 12. While the hardness was decreased to
the 230 Vh in the second pass of weld metal, in the cover
pass it reached up to 270 Vh. However, % ferrite content
in the weld metal was increased from 14 to 16. There
seems to be a controversy between decreasing hardnessand raising % ferrite content from the root to the cover
pass of the weld metal.
In addition, the relationship between % ferrite con-
tent and E308L-16/X20CrMo13 heat affected zone
hardness was determined. Maximum hardness in the
E308L-16/X20CrMo13 heat affected zone was measured
approximately 330 Vh in the root pass. Hardness was
decreased to 290 Vh in the second pass of HAZ. It wasmeasured approximately 300 Vh in the cover pass. The
result indicates that maximum hardness was obtained in
the root pass of the heat affected zone due to low heat
input resulting in higher cooling rate. The second pass
hardness was found lower than root as well as cover
passes due to heat treatment effect of cover pass. How-
ever, heat affected zone ferrite content was found 85 Vh
in all weld passes. There seems to be no relationshipbetween hardness and % ferrite content in the HAZ.

Fig. 7. (a–f) Fracture surface of the charpy impact test sample.
0
50
100
150
200
250
300
350
400
Root pass II. Pass Cover pass
Mic
ro h
ardn
ess
HV
0.1
0
10
20
30
40
50
60
70
80
90
100
% F
erri
t mik
tarõ
E308L-16 /X5CrNi18-10 HAZhardness
E308L-16 Weldmetal hardness
E308L-16 /X20CrMo13 HAZhardness
E308L-16 /X5CrNi18-10 HAZ% ferite content
% ferrite content inthe weld metal
E308L-16 /X20CrMo13 HAZ% ferrite content
0
50
100
150
200
250
300
350
400
450
Root pass II. Pass Cover pass
Mik
ro h
ardn
ess
HV
0.1
0
10
20
30
40
50
60
70
80
90
% F
erri
te c
onte
nt
E2209-17 / X5CrNi18-10 HAZ hardness
E2209-17 / E308L-16Weld metal hardness
E2209-17 / X20CrMo13HAZ hardness
% ferrite content in theweld metal
E2209-17 / X5CrNi18-10 HAZ % feritecontent
E2209-17 / X20CrMo13HAZ % ferrite content
Fig. 8. Relationship between hardness and % ferrite content related to the weld pass in the weldment.
R. Kac�ar, O. Baylan / Materials and Design 25 (2004) 317–329 323
Meanwhile, hardness in the E308L-16/X5CrNi18-10
heat affected zone was measured approximately 200 Vh
in the root and cover pass, while it was decreased to the
192 Vh in the second pass. Softer regions along this
boundary were found in the second pass of the weld.
However, the heat affected zone % ferrite content was
found approximately 3 in all weld passes. There seems
to be no relationship between hardness and % ferrite
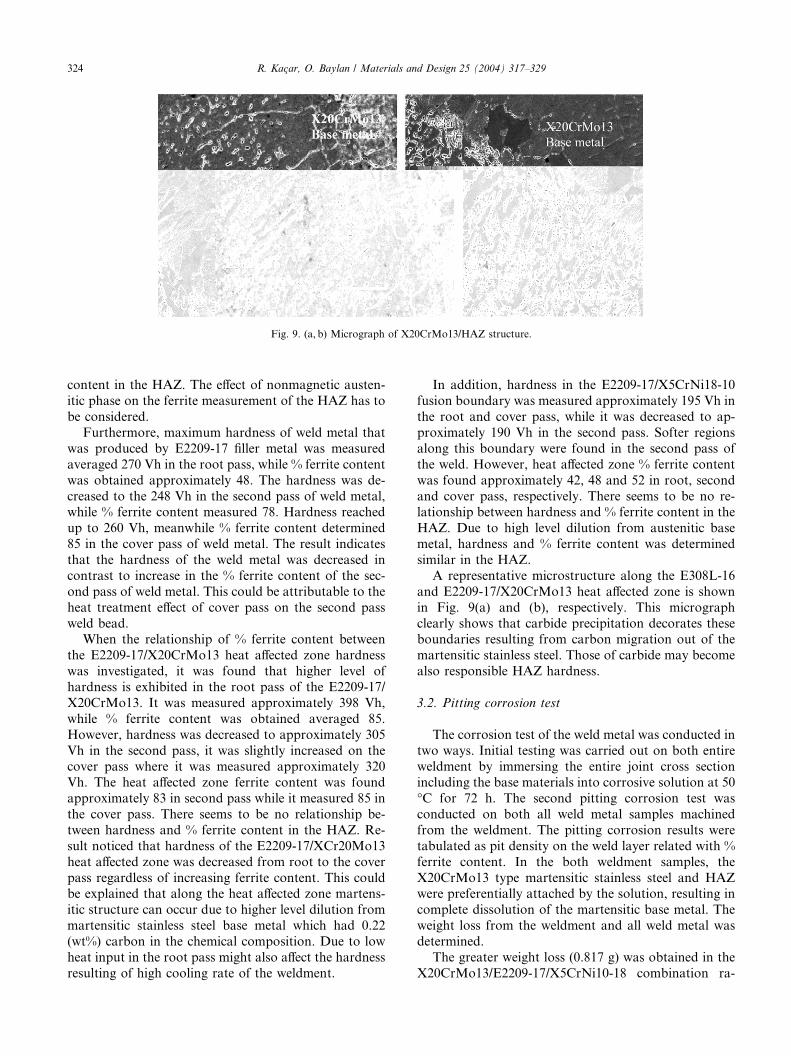
Fig. 9. (a, b) Micrograph of X20CrMo13/HAZ structure.
324 R. Kac�ar, O. Baylan / Materials and Design 25 (2004) 317–329
content in the HAZ. The effect of nonmagnetic austen-
itic phase on the ferrite measurement of the HAZ has to
be considered.
Furthermore, maximum hardness of weld metal that
was produced by E2209-17 filler metal was measured
averaged 270 Vh in the root pass, while % ferrite content
was obtained approximately 48. The hardness was de-
creased to the 248 Vh in the second pass of weld metal,while % ferrite content measured 78. Hardness reached
up to 260 Vh, meanwhile % ferrite content determined
85 in the cover pass of weld metal. The result indicates
that the hardness of the weld metal was decreased in
contrast to increase in the % ferrite content of the sec-
ond pass of weld metal. This could be attributable to the
heat treatment effect of cover pass on the second pass
weld bead.When the relationship of % ferrite content between
the E2209-17/X20CrMo13 heat affected zone hardness
was investigated, it was found that higher level of
hardness is exhibited in the root pass of the E2209-17/
X20CrMo13. It was measured approximately 398 Vh,
while % ferrite content was obtained averaged 85.
However, hardness was decreased to approximately 305
Vh in the second pass, it was slightly increased on thecover pass where it was measured approximately 320
Vh. The heat affected zone ferrite content was found
approximately 83 in second pass while it measured 85 in
the cover pass. There seems to be no relationship be-
tween hardness and % ferrite content in the HAZ. Re-
sult noticed that hardness of the E2209-17/XCr20Mo13
heat affected zone was decreased from root to the cover
pass regardless of increasing ferrite content. This couldbe explained that along the heat affected zone martens-
itic structure can occur due to higher level dilution from
martensitic stainless steel base metal which had 0.22
(wt%) carbon in the chemical composition. Due to low
heat input in the root pass might also affect the hardness
resulting of high cooling rate of the weldment.
In addition, hardness in the E2209-17/X5CrNi18-10
fusion boundary was measured approximately 195 Vh in
the root and cover pass, while it was decreased to ap-
proximately 190 Vh in the second pass. Softer regions
along this boundary were found in the second pass of
the weld. However, heat affected zone % ferrite content
was found approximately 42, 48 and 52 in root, second
and cover pass, respectively. There seems to be no re-lationship between hardness and % ferrite content in the
HAZ. Due to high level dilution from austenitic base
metal, hardness and % ferrite content was determined
similar in the HAZ.
A representative microstructure along the E308L-16
and E2209-17/X20CrMo13 heat affected zone is shown
in Fig. 9(a) and (b), respectively. This micrograph
clearly shows that carbide precipitation decorates theseboundaries resulting from carbon migration out of the
martensitic stainless steel. Those of carbide may become
also responsible HAZ hardness.
3.2. Pitting corrosion test
The corrosion test of the weld metal was conducted in
two ways. Initial testing was carried out on both entireweldment by immersing the entire joint cross section
including the base materials into corrosive solution at 50
�C for 72 h. The second pitting corrosion test was
conducted on both all weld metal samples machined
from the weldment. The pitting corrosion results were
tabulated as pit density on the weld layer related with %
ferrite content. In the both weldment samples, the
X20CrMo13 type martensitic stainless steel and HAZwere preferentially attached by the solution, resulting in
complete dissolution of the martensitic base metal. The
weight loss from the weldment and all weld metal was
determined.
The greater weight loss (0.817 g) was obtained in the
X20CrMo13/E2209-17/X5CrNi10-18 combination ra-
R. Kac�ar, O. Baylan / Materials and Design 25 (2004) 317–329 325
ther than X20CrMo13/E308L-16/X5CrNi10-18 combi-
nation (0.715 g). However, weight loss in X20CrMo13/
E2209-17/X5CrNi10-18 and X20CrMo13/E308L-16/
X5CrNi10-18 all weld metal was found to be 0.278
and 0.257 g, respectively. Result clearly showed thatweight loss was higher in the X20CrMo13/E2209-17/
X5CrNi10-18 weld metal. Average pit density also
supports this result (Fig. 10).
Relationship between pit density and % ferrite con-
tent related with weld layer in the both weldments was
also determined. Results are given in Fig. 10. In the
weldment sample, the martensitic stainless steel base
metal and heat affected zone was preferentially attackedby the solution, resulting in incomplete dissolution of
the martensitic stainless steel base metal and HAZ.
Therefore, the pitting density measurement was carried
out from root to cover pass in the weld metal and
X5CrNi 10-18/weld metal heat affected zone of the
weldment that was obtained by E2209-17 and E308L-16
0
1
2
3
4
5
6
7
8
Root pass II.pass Cove
Den
sity
(p
its/
mm
2)
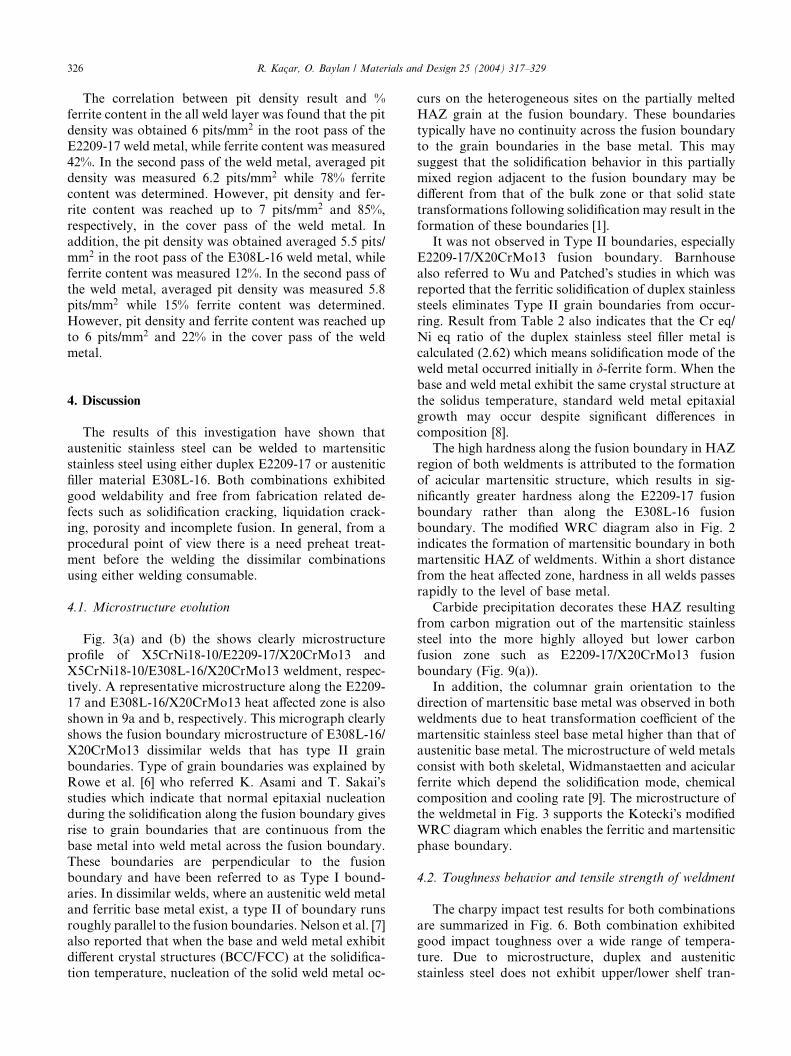
Fig. 11. The relationship between pit density and % ferrite content relate
X20CrMo13/E2209-17/X5CrNi18-10 all weld metal.
0
2
4
6
8
10
12
14
16
18
20
Root pa ss II.pa ss Cover pa ss
Den
sity
(p
its/
mm2
)
0
10
20
30
40
50
60
70
80
90
% F
erri
te c
onte
nt
X5CrNi18-10 / E308L-16HA Z pits content
X5CrNi18-10 / E308L-16weld metal pits content
X5CrNi18-10 / E2209-17HA Z pits content
X5CrNi18-10 / E2209-17weld metal pits content
X5CrNi18-10 / E308L-16HAZ % ferrite content
X5CrNi18-10 / E308L-16weld metal % ferritecontent
X5CrNi18-10 /E2209-17HAZ % ferrite content
X5CrNi18-10 /E2209-17weld metal % ferritecontent
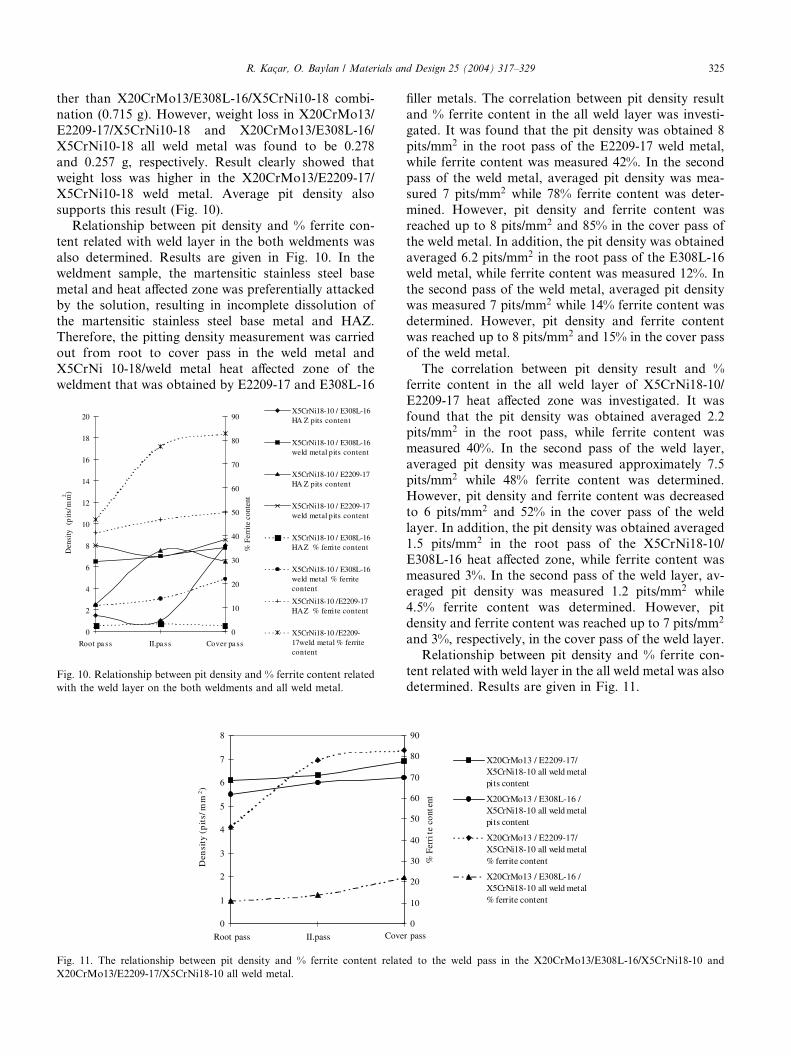
Fig. 10. Relationship between pit density and % ferrite content related
with the weld layer on the both weldments and all weld metal.
filler metals. The correlation between pit density result
and % ferrite content in the all weld layer was investi-
gated. It was found that the pit density was obtained 8
pits/mm2 in the root pass of the E2209-17 weld metal,
while ferrite content was measured 42%. In the secondpass of the weld metal, averaged pit density was mea-
sured 7 pits/mm2 while 78% ferrite content was deter-
mined. However, pit density and ferrite content was
reached up to 8 pits/mm2 and 85% in the cover pass of
the weld metal. In addition, the pit density was obtained
averaged 6.2 pits/mm2 in the root pass of the E308L-16
weld metal, while ferrite content was measured 12%. In
the second pass of the weld metal, averaged pit densitywas measured 7 pits/mm2 while 14% ferrite content was
determined. However, pit density and ferrite content
was reached up to 8 pits/mm2 and 15% in the cover pass
of the weld metal.
The correlation between pit density result and %
ferrite content in the all weld layer of X5CrNi18-10/
E2209-17 heat affected zone was investigated. It was
found that the pit density was obtained averaged 2.2pits/mm2 in the root pass, while ferrite content was
measured 40%. In the second pass of the weld layer,
averaged pit density was measured approximately 7.5
pits/mm2 while 48% ferrite content was determined.
However, pit density and ferrite content was decreased
to 6 pits/mm2 and 52% in the cover pass of the weld
layer. In addition, the pit density was obtained averaged
1.5 pits/mm2 in the root pass of the X5CrNi18-10/E308L-16 heat affected zone, while ferrite content was
measured 3%. In the second pass of the weld layer, av-
eraged pit density was measured 1.2 pits/mm2 while
4.5% ferrite content was determined. However, pit
density and ferrite content was reached up to 7 pits/mm2
and 3%, respectively, in the cover pass of the weld layer.
Relationship between pit density and % ferrite con-
tent related with weld layer in the all weld metal was alsodetermined. Results are given in Fig. 11.
r pass0
10
20
30
40
50
60
70
80
90
% F
erri
te c
onte
nt
X20CrMo13 / E2209-17/X5CrNi18-10 all weld metalpits content
X20CrMo13 / E308L-16 /X5CrNi18-10 all weld metalpits content
X20CrMo13 / E2209-17/X5CrNi18-10 all weld metal% ferrite content
X20CrMo13 / E308L-16 /X5CrNi18-10 all weld metal% ferrite content
d to the weld pass in the X20CrMo13/E308L-16/X5CrNi18-10 and
326 R. Kac�ar, O. Baylan / Materials and Design 25 (2004) 317–329
The correlation between pit density result and %
ferrite content in the all weld layer was found that the pit
density was obtained 6 pits/mm2 in the root pass of the
E2209-17 weld metal, while ferrite content was measured
42%. In the second pass of the weld metal, averaged pitdensity was measured 6.2 pits/mm2 while 78% ferrite
content was determined. However, pit density and fer-
rite content was reached up to 7 pits/mm2 and 85%,
respectively, in the cover pass of the weld metal. In
addition, the pit density was obtained averaged 5.5 pits/
mm2 in the root pass of the E308L-16 weld metal, while
ferrite content was measured 12%. In the second pass of
the weld metal, averaged pit density was measured 5.8pits/mm2 while 15% ferrite content was determined.
However, pit density and ferrite content was reached up
to 6 pits/mm2 and 22% in the cover pass of the weld
metal.
4. Discussion
The results of this investigation have shown that
austenitic stainless steel can be welded to martensitic
stainless steel using either duplex E2209-17 or austenitic
filler material E308L-16. Both combinations exhibited
good weldability and free from fabrication related de-
fects such as solidification cracking, liquidation crack-
ing, porosity and incomplete fusion. In general, from a
procedural point of view there is a need preheat treat-ment before the welding the dissimilar combinations
using either welding consumable.
4.1. Microstructure evolution
Fig. 3(a) and (b) the shows clearly microstructure
profile of X5CrNi18-10/E2209-17/X20CrMo13 and
X5CrNi18-10/E308L-16/X20CrMo13 weldment, respec-tively. A representative microstructure along the E2209-
17 and E308L-16/X20CrMo13 heat affected zone is also
shown in 9a and b, respectively. This micrograph clearly
shows the fusion boundary microstructure of E308L-16/
X20CrMo13 dissimilar welds that has type II grain
boundaries. Type of grain boundaries was explained by
Rowe et al. [6] who referred K. Asami and T. Sakai�sstudies which indicate that normal epitaxial nucleationduring the solidification along the fusion boundary gives
rise to grain boundaries that are continuous from the
base metal into weld metal across the fusion boundary.
These boundaries are perpendicular to the fusion
boundary and have been referred to as Type I bound-
aries. In dissimilar welds, where an austenitic weld metal
and ferritic base metal exist, a type II of boundary runs
roughly parallel to the fusion boundaries. Nelson et al. [7]also reported that when the base and weld metal exhibit
different crystal structures (BCC/FCC) at the solidifica-
tion temperature, nucleation of the solid weld metal oc-
curs on the heterogeneous sites on the partially melted
HAZ grain at the fusion boundary. These boundaries
typically have no continuity across the fusion boundary
to the grain boundaries in the base metal. This may
suggest that the solidification behavior in this partiallymixed region adjacent to the fusion boundary may be
different from that of the bulk zone or that solid state
transformations following solidification may result in the
formation of these boundaries [1].
It was not observed in Type II boundaries, especially
E2209-17/X20CrMo13 fusion boundary. Barnhouse
also referred to Wu and Patched�s studies in which was
reported that the ferritic solidification of duplex stainlesssteels eliminates Type II grain boundaries from occur-
ring. Result from Table 2 also indicates that the Cr eq/
Ni eq ratio of the duplex stainless steel filler metal is
calculated (2.62) which means solidification mode of the
weld metal occurred initially in d-ferrite form. When the
base and weld metal exhibit the same crystal structure at
the solidus temperature, standard weld metal epitaxial
growth may occur despite significant differences incomposition [8].
The high hardness along the fusion boundary in HAZ
region of both weldments is attributed to the formation
of acicular martensitic structure, which results in sig-
nificantly greater hardness along the E2209-17 fusion
boundary rather than along the E308L-16 fusion
boundary. The modified WRC diagram also in Fig. 2
indicates the formation of martensitic boundary in bothmartensitic HAZ of weldments. Within a short distance
from the heat affected zone, hardness in all welds passes
rapidly to the level of base metal.
Carbide precipitation decorates these HAZ resulting
from carbon migration out of the martensitic stainless
steel into the more highly alloyed but lower carbon
fusion zone such as E2209-17/X20CrMo13 fusion
boundary (Fig. 9(a)).In addition, the columnar grain orientation to the
direction of martensitic base metal was observed in both
weldments due to heat transformation coefficient of the
martensitic stainless steel base metal higher than that of
austenitic base metal. The microstructure of weld metals
consist with both skeletal, Widmanstaetten and acicular
ferrite which depend the solidification mode, chemical
composition and cooling rate [9]. The microstructure ofthe weldmetal in Fig. 3 supports the Kotecki�s modified
WRC diagram which enables the ferritic and martensitic
phase boundary.
4.2. Toughness behavior and tensile strength of weldment
The charpy impact test results for both combinations
are summarized in Fig. 6. Both combination exhibitedgood impact toughness over a wide range of tempera-
ture. Due to microstructure, duplex and austenitic
stainless steel does not exhibit upper/lower shelf tran-

R. Kac�ar, O. Baylan / Materials and Design 25 (2004) 317–329 327
stition such as ferritic weld metal. Therefore, charpy
impact test of the weld metal at both combinations was
carried out at a temperature of )50, 0 and 25 �C. Re-
sult indicates that the impact thoughness exhibited
gradual decrease with temperature. It is interesting tonote that the toughness of duplex E2209-17 weld de-
posits exceeds that of E308L-16 deposits at room
temperature. This may be explained by the structure of
duplex weld deposit. Because, duplex stainless steel
contains approximately 50% ferrite phase, which pro-
vides strength, which is embedded by austenite matrix
where ductility comes from. Duplex E2209-17 deposits
also exhibit comparable toughness at temperaturesdown to )50 �C.
Examples of the fracture surface appearance of test
samples are shown in Fig. 7(a)–(f). As seen in Fig. 7(a)
and (b), both weld metals showed predominantly a
ductile fracture appearance of microvoid coalescence
(MVC) at room temperature. The ductility plus the high
toughness of the stainless steel resulted in an impact
toughness of the weld metal approximately 115 J(Fig. 6).
The test samples fractured at 0 �C again showed
cracking only in the ferritic base steel. Fig. 7(c) and (d)
shows ductile fracture behavior in combination of
transgranular fracture and MVC surface. The lower
notch toughness value of approximately 100 J can be
attributed to the change in fracture mode associated
with the lower test temperature (Fig. 6). The secondphase particle in the dimple was also supported by the
ductile fracture behavior.
The fracture surface of test samples broken at )50 �Cagain showed entirely ductile fracture behavior but due
to the low test temperature, some local transgranular
fracture by quasi-cleavage was observed (Fig. 7(e) and
(f)). This fracture appearance is consistent with the low
average impact energy of approximately 80 J (Fig. 6).Tensile test results indicate that X5CrNi18-10/E2209-
17/X20CrMo13 combination exhibited lower tensile,
yield strength as well as elongation when it was com-
pared with weldment that was obtained by E308L-16
filler metal. Although, all test sample was broken from
X20CrMo13 base metal, it can be attributable to the
characteristics of the dissimilar weldment. Because,
during the testing when the strength was reached to theyield point, neck initially occurred on X20CrMo13 base
metal side of the test sample. By increasing applied load
on the another neck started to occur on the austenitic
base metal side of X5CrNi18-10. After a while, the load
on the test sample reached the maximum strength and
all resulting test samples were fractured on the first neck
that occurred on martensitic base metal side. None of
the test samples were broken either in weld metal andmartensitic HAZ of weldment. EDS analysis in Fig. 5(a)
and (b) also supported this result. The lower tensile,
yield strength as well as elongation of X5CrNi18-
10/E2209-17/X20CrMo13 combination rather than
X5CrNi18-10/E308L-16/X20CrMo13 combination can
be explained by ductility of the austenitic filler metal as
well as higher degree of second phase particle in the
martensitic base metal. However, the joint strength wasfound acceptable in both combinations. The represen-
tative micrograph of the fracture surface is given in
Fig. 5(a) and (b) which supports to the higher degree
ductility.
4.3. Hardness measurement
The result from Fig. 8 showed that there is a con-
troversy between hardness raise and % ferrite content in
the root pass of the weld metal that was obtained by
E308L-16 filler metal. It may be concluded that high
level dilution from martensitic stainless steel and lowheat input in the root pass exhibited higher level hard-
ness but decrease on the % ferrite content can be ex-
plained by austenitic stainless steel filler metal that has
normally 3–5% ferrite.
In addition, it seems that there is no relationship
between hardness and % ferrite content in the E308L-
16/X20CrMo13 heat affected zone (Fig. 8). This may be
attributed to heat annealing followed by high coolingrate during the welding process which tends to increase
heat affected zone hardness. Meanwhile, decrease in the
hardness of second pass in the heat affected zone can be
explained by the heat treatment. As known that during
the welding of cover pass, heat generated from arc
makes tempering effect on the second pass weld bead.
Normally, differential on the hardness increasing re-
lated with the % ferrite content may be expected but allweld pass % ferrite content was found similar. It is
evident that the probe of the ferritscope was affected by
martensitic stainless steel due to narrow heat affected
zone.
The result from Fig. 8 also showed that there seems to
be no relationship between hardness and % ferrite con-
tent in the E308L-16/X5CrNi18-10 heat affected zone. It
may be concluded that austenitic stainless steel heataffected zone exhibited lower hardness in all weld pass
when it is compared with martensitic stainless steel heat
affected zone and weld metal due to austenite phase in
their microstructure. Slight decrease in the hardness at
the second pass fusion boundary can be explained by the
heat treatment that comes from tempering effect of
cover pass on it. Differential on the hardness increasing
related with the % ferrite content may also be expectedbut all weld pass % ferrite content was found similar. It
is evident that the probe of the ferritscope was effected
by austenitic stainless steel due to narrow heat affected
zone.
Furthermore, there seems to be a controversy be-
tween hardness raise and % ferrite content in the second

328 R. Kac�ar, O. Baylan / Materials and Design 25 (2004) 317–329
pass of the E2209-17 weld metal (Fig. 8). Slight decrease
in the hardness at the second pass weld metal can be also
explained by the heat treatment that makes tempering
effect of the second pass weld metal.
In addition, result from Fig. 8 also showed that thereis no relationship between hardness and % ferrite con-
tent in the E2209-17/X20CrMo13 heat affected zone.
Normally, differential on the hardness increasing related
to the % ferrite content may be expected but all weld
pass in the fusion boundary, % ferrite content was found
similar. It is evident that the probe of the ferritscope was
affected by martensitic stainless steel due to narrow heat
affected zone. High level hardness exhibited in the fusionboundary can be explained by the heat annealing fol-
lowed by high cooling rate during the welding process
that may increase hardness to maximum level in the root
and cover pass.
No relationship could be found between hardness and
% ferrite content in the E2209-17/X5CrNi18-10 heat
affected zone. It may be concluded that austenitic
stainless steel heat affected zone is exhibited lowerhardness in all weld pass when it is compared with
martensitic stainless steel HAZ and weld metal due to
austenite phase in their structure. Slight decrease in the
hardness at the second pass fusion boundary can be
explained by the heat treatment that makes tempering
effect of cover pass on it. Differential on the hardness
increasing related with the % ferrite content may also be
expected but all weld pass % ferrite content was foundsimilar. It is evident that the probe of the ferritscope was
affected by austenitic stainless steel due to narrow heat
affected zone. High level of % ferrite content in the
weldment, when it is compared with combination that
was obtained by E308L-16 filler metal, can be explained
by increasing ferrite phase due to high cooling rate
during the welding process.
4.4. Pitting corrosion test
The corrosion test of the weld metal interestingly
showed that pit density was increased with higher ferrite
content from root to the cover pass of the E308L-16
weld metal but slightly decreased in the pit density in
contrast to higher ferrite content in the second pass of
the E2209-17 duplex weld metal. Affected, pitting cor-rosion resistance of the weld metal increases by aus-
tenite. The small decrease in the pit density of second
pass of the E2209-17 weld metal may be explained by
chemical composition of the weld metal which has more
impurity or second phase particle.
The correlation between pit density result and %
ferrite content in the all weld layer of X5CrNi18-10/
E2209-17 heat affected zone was investigated. It wasinterestingly noted that pit density was increased with
higher ferrite content from root to the cover pass of the
X5CrNi18-10/E2209-17 HAZ but small decrease was
observed in the pit density in contrast to higher ferrite
content of the cover pass. Normally, pitting corrosion
resistance of the weld metal increases by austenite. The
small decrease in the pit density of cover pass of the
E2209-17 weld metal may be explained by chemicalcomposition of the weld metal which has more Cr2N
precipitation. It was also interestingly noted that huge
increase was observed in the pit density of the cover pass
of the X5CrNi18-10/E308L-16 HAZ in contrast to lower
ferrite content. It may be also explained that the dilution
in the X5CrNi18-10/E308L-16 HAZ occurs higher than
weld metal, therefore austenite amount of this region is
much higher than that of other place. This providessignificant pitting corrosion resistance to the steels.
Higher amount of pit density on the cover pass of the
weld metal can be explained by chemical composition
and high amount of impurity that comes from filler
metal.
The relationship between pit density and % ferrite
content related with weld layer in the all weld metal was
also determined. It was noticed that pit density wasslightly increased with higher ferrite content from root
to the cover pass of the E308L-16 and E2209-17 weld
metal due to increase in the pitting corrosion resistance
of the weld metal by austenite. However, it was noticed
that the pitting density of the E308L-16 weld metal was
lower than E2209-17 weld metal due to higher austenite
content in the matrix.
Consequently, the pitting corrosion resistance of theall weld metal and weldment was obtained with E308L-
16 filler metal slightly better than weld made with
E2209-17 filler metal due to higher level of austenite and
reduced chromium nitride precipitation.
5. Conclusions
On the basis of the research work described in this
paper, the following conclusions can be drawn:
1. The results of this investigation have shown that au-
stenitic stainless steel can be welded to martensitic
stainless steel using either duplex E2209-17 or austen-
itic filler material E308L-16. From a procedural point
of view, there is a need for preheat treatment before
welding the dissimilar combinations using eitherwelding consumable.
2. The tensile strength of weldment, which was pro-
duced by duplex electrode (E2209-17), was slightly
lower than that of austenitic electrode (E308L-16).
However, both dissimilar weldments exhibit an ac-
ceptable joint strength.
3. The microhardness was increased in both welds made
with E2209-17 duplex and E308L-16 austenitic elec-trode along the X20CrMo13/weld metal fusion
boundary due to heat annealing and then follow high
cooling rate.
R. Kac�ar, O. Baylan / Materials and Design 25 (2004) 317–329 329
4. The impact toughness of the both E2209-17 and
E308L-16 deposits was acceptable even at low tem-
perature regardless of heat input. The test sample gi-
ven with all test temperature exhibits ductile fracture
behavior due to the high impact toughness of thestainless steel.
5. Although, the pitting corrosion resistance of the all
weld metal and weldment which was obtained with
E308L-16 filler metal slightly better than weld made
with E2209-17 filler metal due to higher level of aus-
tenite and reduced chromium nitride precipitation.
Consequently, both filler metal pitting corrosion re-
sistance was found acceptable.6. Microstructure of the weldment supports the Ko-
tecki�s modified WRC diagram which enables to ex-
hibit martensitic and ferritic phase boundary.
7. Type II grain boundaries in the E308L-16/XCr20-
Mo13 fusion boundaries occurred in contrast to
E2209-17/XCr20Mo13 fusion zone.
Acknowledgements
The authors thank Mr. Dr. Selc�uk Akt€urk of
Kırıkkale University, Mech. Eng. Mr. Erkan Koc� of
Noksel Company, TR for their kind supply of materials
equipment and staff. The authors would also like to
thank Zonguldak Karaelmas University, Institute of
Science, and the Project and Science Research Com-
mission for their support.
References
[1] Barnhouse EJ, Lippold JC. Microstructure/property relationship
in dissimilar welds between duplex stainless steel and carbon
steels. Welding J 1988;(December):477–87.
[2] Shaeffler AL. Constitution diagram for stainless steel weld metal.
Metal Progr 1949:680B–1B.
[3] Delong WT. Ferrite in austenitic stainless steel weld metal. Welding
J 53(7):273S–85S.
[4] Kotecki DJ, Siewert TA. Constitution diagram for stainless steel
weld metals: a modification of the WRC-1988 diagram. Welding J
1992;5:171S–8S.
[5] Kotecki DJ. A martensite boundary on the WRC-1992 diagram –
Part 2: The effect of manganese. Welding J 2000;(December):346S–
54S.
[6] Rowe MD, Nelson TW, Lippold JC. Hydrogen-induced cracking
along the fusion boundary of dissimilar metal welds. Welding J
1999;(February):31s–7s.
[7] Nelson TW, Lippold JC, Mills MJ. Nature and evolution of the
fusion boundary in ferritic–austenitic dissimilar metal welds – Part
1: Nucleation and growth. Welding J 1999;(October):329–37.
[8] Nelson TW, Lippold JC, Mills MJ. Nature and evolution of the
fusion boundary in ferritic–austenitic dissimilar metal welds –
Part 2: On-cooling transformations. Welding J 2000;(October):
267–77.
[9] T€ulbentc�i K, Kaluc� E. Paslanmaz C�elikler ve Kaynaklanabilirli�giSeminer Notları’’. Kocaeli €Universitesi Kaynak Teknolojisi Ara-
s�trma E�gitim ve Uygulama Merkezi, Haziran, 1995, Kocaeli,
Turkey.
Top Related