


Languages
Pages
Legal

APPROACHES TO ASSESSING
BUSINESS IMPACTS ON DEVELOPMENT
Framework paper
By Caroline Ashley, Carolin Schramm, Karen Ellis Overseas Development Institute
Produced for the Meeting Series on ‘Harnessing the power of the private sector for development’ organised by the Department for International Development, Overseas
Development Institute and Business Action for Africa, 2009

2
Approaches to assessing business impacts on development
Framework paper
By Caroline Ashley, Carolin Schramm and Karen Ellis Overseas Development Institute, June 2009
Produced for the Meeting Series on ‘Harnessing the power of the private sector for development’ organised by the Department for International Development, Overseas Development Institute and Business Action for Africa
‘if you cannot measure it, maybe it is not there’i
‘it is better to be approximately right than precisely wrong’.
‘Oscar Wilde once said “It is a very sad thing that nowadays there is so little useless information.” Unfortunately a look at today’s non-‐financial reporting finds the opposite to be true.’

3
Preface This paper was prepared for the fifth meeting in the series on ‘Harnessing the Power of Business for Development Impact,’ held in May 2009. The fifth meeting explored how we can better understand the impact of business on development, and particularly what companies themselves do in this area. So far, in discussions of business models and corporate innovation, a recurrent theme has been that we need to know which approaches really do contribute effectively to development, or create ‘social value’. But approaches to understanding this are diverse. The purpose of this paper, and of the meeting, is to explore contrasting approaches and to develop key questions for further discussion. This framework paper was published as a Draft in time for the public event and for some time therafter. Given continuing interest in the topic, the authors and BFP have now published it in final form. It is based on experience up until May 2010. An update to this is being prepared for July 2012. Visit www.businessfightspoverty.org/events/2012-‐event-‐series-‐understanding-‐and-‐enhancing-‐business-‐impact-‐on-‐ for further information.
Contents 1. Problem statement: we just don’t know 4 2. Assessing the impacts of business on development: contrasting approaches 6 3. Approach 1: Local assessment 8 4. Approach 2: Value chain maps and poverty footprints 10 5. Approach 3: Assessment of multipliers and contribution to economic activity 12 6. Approach 4: Reporting against scorecards and standardised indicators 13
6.1 Global Reporting Initiative and UN Global Compact 13 6.2 Reporting against more poverty focused indicators 15 6.3 Additional perspectives from verification and assurance 17
7. Insights from donors and economists 17 7.1 Challenges of impact assessment in private sector development 19 7.2 Causality 20 7.3 Cost effectiveness and comparisons 21 7.4 Dynamic impacts 22 7.5 Economists’ assessment of impact and additionality 24
8. Some key issues on corporates’ development impact agenda 26 References and Endnotes 28

4
List of Acronyms AA Anglo American
ADB Asian Development Bank
AfDB African Development Bank
BCTA Business Call to Action
BLCF Business Linkage Challenge Fund
COP Communication on Progress
CSR Corporate Social Responsibility
DEG Deutsche Investitions und Entwicklungsgesellschaft
EBRD European Bank for Reconstruction and Development
ERR Economic Rate of Return
GDP Gross domestic product
GRI Global Reporting Initiative
IFC International Finance Corporation
LBG London Benchmarking Group
MDG Millennium Development Goals
MNE Multinational enterprise
NGO Non-‐governmental organisation
ODI Overseas Development Institute
PSD Private Sector Development
PSOM Programme for Cooperation with Emerging Markets
PwC PricewaterhouseCoopers
SME Small and medium enterprises
SMME Small, medium and micro enterprises
SNV Netherlands Development Organisation
WBCSD World Business Council for Sustainable Development
1. Problem statement: we just don’t know We know surprisingly little about the impact of companies, particularly any specific company, on people and economies in the developing world. Some may ask, ‘does this matter?’ Companies, after all, are busy
generating output and profits and do not need to account for their development impact in the fashion of a development agency funded by tax-‐payers’ money or public donations. Companies will prioritise the reporting of their financial situation to their shareholders rather than their impact on developing countries
to general ‘concerned stakeholders.’ Nevertheless, understanding companies’ impact on development does matter, for 4 reasons.
Firstly, companies simply lack the information needed to improve their own decision-‐making. Many companies have made commitments to responsible business. They pride themselves on their contribution to economic development in their areas of operation and non-‐price competition increasingly includes their
socio-‐economic or environmental performance. They have a range of levers they can use to boost their impact: social investment; in-‐kind donations of facilities and volunteered for local communities; helping

5
entrepreneurs enter the supply or distribution chain; partnerships with government, non-‐governmental
organisation (NGO) or United Nations agencies; developing low-‐cost products for low-‐income consumers; or engaging customers in development campaigns. The decision on how much to invest in what, is based on many factors, such as business structure, local need, and the brand. But usually not on any assessment of
impact that can be achieved because such assessment rarely exists. There is widespread buy-‐in to the idea that corporates should harness their ‘core business’ and not just their Corporate Social Responsibility (CSR) budget to boost development. This premise underlies the commitments made in the Business Call to Action
(BCTA). But there is virtually no analysis to date of how different business models deliver improved impact, either for shareholders or for stakeholders who are the intended beneficiaries.
Secondly, companies are already investing considerably in reporting publicly on issues that go well beyond shareholder value, but this intensive work is not answering key questions about the role they play in supporting developing economies. Most large companies now report in accordance with the Global
Reporting Initiative (GRI), the majority add external assurance to this process, and most also publish sustainability reviews either within or as an addition to their annual reports, and have areas of their web site addressing issues on responsible business. The effort that goes into this is considerable. Yet these
existing efforts simply do not capture key indicators of their contribution to development. Thirdly, it is simply not true that in 2009 business is expected to turn a profit and nothing else. Investors,
customers, staff, and other local stakeholders want to know that business contributes positively to society and the economy, and there is a business case for companies to generate the information to demonstrate that. Making claims without evidence is a risky strategy. Making claims based on anecdote is the norm, but
the appetite for more substantial evidence is growing. Finally, development agencies not only recognise the role of the private sector in driving development but
are increasingly investing donor resources – funded by taxpayers – in enhancing the role of business. This includes work with large corporates and investment funds, which would not be justifiable as beneficiaries of development aid but are justifiable as effective intermediaries for delivering development results. For
public accountability, and for the development community to invest resources most effectively towards the Millennium Development Goals (MDGs), it needs to have a better idea of the return on investment in this and other areas of action.

6
2. Assessing the impacts of business on development: contrasting approaches
Pity the poor executive who is given the job of moving forward a company’s understanding of its impact in developing countries. A quick review of what is out there, and what other companies are doing, gives one
clear response: a wide array of ad hoc approaches, and no discussion of how they compare, what is useful when, or why particular approaches have been chosen.
Existing approaches to understanding the impact of business on development vary in their scope and content, and on what need and whose need they serve. The focus may be a community investment project, or the global business. The user may be a country manager, auditors, or readers of the Annual Report.
There are many possibly ways to categorise assessment. We highlight four main approaches used by companies:
1. Local assessment: livelihood impacts and stakeholder views of a firm or initiative;
2. Value chain footprint: enterprise and poverty impact of the entire value chain within an economy;
3. Economic contribution: multiplier effect of a business in the national economy and
contribution to gross domestic product; 4. Reporting against fixed indicators: performance of a company against a ‘scorecard’ of
indicators.
These approaches tend to be applied at different levels: livelihood impacts are usually used to assess impact of a specific production site, product, or a corporate responsibility initiative. Value chains and
economic contribution tend to measure the contribution of a large business having a significant affect on the regional or national economy. The scorecard approach is often applied at the level of a multinational company, as in the GRI, though is also used (by various development banks) to assess a specific investment.
Table 1 provides an overview, with examples, of the four approaches used by companies No categorisation is perfect, and boundaries necessarily blur. The local level approach (approach 1) rests on
gathering data and perspective from producers and participants in the business. This is also part of the value chain mapping (approach 2), particularly when done as a poverty footprint (as by Oxfam). However, value chain mapping (approach 2) usually goes further, by plotting out the business linkages that extend
through the supply and distribution chain. Links in the chain are also covered in multiplier analysis (approach 3), though the latter tends to make more use of economists’ input-‐output tables and less use of local level informants to quantify those linkages. Scorecard assessments (approach 4) all share a
framework, but the content of this varies enormously and can cover any aspect of impact. We distinguish broadly between two major purposes of impact assessment, but acknowledge overlap, subtlety and diversity in purpose:
• To prove: to demonstrate to partners, the public and other stakeholders that a company is having valuable impacts on development. ‘What’ impacts are achieved is a key question.
• To improve: to base decision-‐making on an informed understanding of current impacts, so as to
further improve them. This requires insights into ‘what’ is achieved but also ‘why.’

7
Table 1: Overview and categorisation of different approaches Approach and example Applied to: 1 Local assessment: Livelihood impact & stakeholder views SABMiller/PwC assessment of ‘enterprise development’ in the
supply chain Diageo/LBG assessment of ‘Water of Life’ projects Body Shop assessment/ verification of Community Trade
Company initiative to boost benefits to the poor
Anglo American Social Economic Assessment Toolbox A mine in a developing country Vodafone assessment of the impact of mobile phones Mobile phone users, aggregated. WBCSD impact assessment framework Scope determined by company 2 Value chain footprinting Unilever/Oxfam assessment of Unilever Indonesia A multinational in one country
(Indonesia) and its entire value chain (supply, distribution, retail)
Oxfam poverty mapping A national or multinational company, impact within one country
ODI, IFC, SNV, pro-‐poor mapping of tourism value chains Tourism sector, comprising multiple firms, in one destination
3. Economic contribution and multipliers
Unilever: economic footprint in South Africa SABMiller: contribution of SAB to South Africa’s economy
A multinational in one country, all direct and indirect affects.
Tourism Satellite Accounts Entire tourism sector in one country 4 Scorecard performance Reporting against GRI indicators. E.g. Barclays, Diageo,
SABMiller etc. Company performance, internationally
SPeAR framework of ARUP and Engineers against Poverty Project-‐specific investment Good for Development ‘badge’ concept Company performance, internationally
Assessment by companies of their contribution to development is relatively new, compared to the substantial experience of various donors in assessing how their investment in private sector generates development impact, and of economists in assessing the economic value of types of investment. There are
valuable lessons to draw from how development banks use a ‘scorecard’ approach to assess the development contribution of an investment along with its financial viability, and how donors seek to capture private sector development impacts, from jobs to livelihoods to market change. Useful insights
from the donor world are covered further in Section 7. Table 2: Foci of assessments by development organisations Foci Used by/ Used for 1 Local assessment: Livelihood impact & stakeholder views Analysis of local impacts of a firm – local employment & wages, skills
developed, enterprise development, cultural/social problems, resource affects.
NGOs To highlight negative impacts or gains to poor from small enterprise devt
2 Additional quantifiable economic activity, ERR Jobs created, SME contracts generated, production volume, exports, tax
revenue Economic Rate of Return (ERR): quantifies incremental economic gain to society, relative to investment cost.
PSD donors & devt banks To quantify or compare additional economic activity from investment
3 Dynamic & structural affects Contribution to development of markets, infrastructure, technology,
skills, innovation, competition, business linkages. Qualitative indicators, except when economists calculate contributions to growth rates through regression analysis.
Development banks and other PSD donors. To capture longer-‐term and structural development contribution

8
3. Approach 1: Local assessment Approach 1 focuses on direct impacts at the local level that accrue mainly to poor people: flows of income,
capacity development and other changes in livelihoods affecting employees, entrepreneurs, residents, participants of local institutions. They rest heavily on gathering the views of local stakeholders or collecting data from local stakeholders, concerning impacts that fall within the defined scope.
This approach can be applied in three ways:
i. to an explicit initiative designed to boost development impact;
ii. to the overall operation of a business or site of operation iii. to a particular product or market system (based on an aggregation of many local impacts)
When companies assess impacts of corporate responsibility initiatives, ranging from community investment donations, to adaptation of their supply chain, assessment is usually based on local stakeholder information. These activities have a specific objective of enhancing social value, so need to be assessed
according to whether they deliver that. Impact here is something additional to normal business, or something that changes compared to previous practice. In this case, the approach does not require assessment of all aspects of core business. It may be done to ‘prove’ value of past work, and equally to
‘improve’ future management by highlighting priority areas. In practice, impact assessment of community investment has tended to be weak, focusing on outputs
(dollars spent, workshops held) not outcomes (livelihoods secured), while more ‘inclusive business approaches’ such as adapting supply chains, tend to be fairly new and not yet assessed. However, examples
are emerging of assessments that go beyond just outputs. These examples also add value because they aggregate results up from several local levels, to build a bigger picture and enable comparison between sites.
• SABMiller’s recent Enterprise Development report summarises findings from assessment of their supply chain initiatives in a number of countries and illustrates the variability in impact supply chain approaches can have (SABMiller 2008).
• The assessment of Diageo’s Water of Life project takes a standard approach to projects in over 30 countries, looking both at the number of beneficiaries reached, and longer lasting impact issues relating to sustainability and community ownership (Diageo 2007).
• Multinational Enterprises (MNEs) that signed up to the Business Call to Action are beginning to look at how results can be monitored and assessed.
Local assessment can also be applied to an entire business operation -‐ such as a mine, hotel, or forest – or a
product – such as mobile phones. Findings from consultation with stakeholders and micro-‐economic data are aggregated to build an overall picture, usually including both positive and negative impacts, and economic and social data.
• A well known example is Anglo-‐American’s (AA) Socio-‐Economic Assessment Toolboxii which is in place at 60 AA sites in 16 countries. This is not so much to assess the ex-‐post impact of an initiative that has happened, but to understand the current impacts of operations and how to enhance them
over time through engagement with stakeholders. It is thus more of a decision-‐making tool, and not a tool for demonstrating a snapshot of results.
Assessment of the impact of a new product or market system can be based on aggregation of livelihood impact and micro-‐economic data from stakeholders at many locations. For example:

9
• The Ethical Trade Initiative (ETI) reviewed impacts of ethical trade, by collecting data directly from
companies and workers involved in ETI. Qualitative and quantitative indicators relevant to the ETI base code aimed to assess direct impacts on workers and companies, and also to measure the broader social impacts (positive and negative) on others (ETI 2003).
• Vodafone’s assessment of the impact of mobile phones in India collates data from many users on how they use their new technology (Vodafone 2009).
• Assessment of the development significance of corporate-‐community joint venture lodges (a
relatively new business model) has been done in Southern Africa by aggregating and comparing results from many such businesses (Massyn and Koch 2004).
Local level assessment is at the heart of the World Business Council for Sustainable Development (WBCSD) new ‘impact assessment framework’ which is designed to be applied by businesses at any level. Step 1 of the WBCSD approach is to define the scope of the assessment (whether a CSR initiative or an entire
business operation), from which it moves on to defining relevant indicators with stakeholders). The Base of the Pyramid Impact Assessment Framework, developed at the William Davidson Institute at the
University of Michigan, similarly focuses on the local assessment of business models serving the so-‐called ‘base of the pyramid’ (BoP). In order to enhance the positive effects of such business initiatives on poverty alleviation the framework’s primary objective is to give managers a detailed understanding about the
positive and negative impacts a BoP venture has on the economics, capabilities, and relationships of three local stakeholder groups: buyers, sellers, and communities (London 2009). Box 1: What does it mean in practice? Example: Diageo, Water of Life Project Examples of impact reported: • In 2008, 1.18 million beneficiaries have been reached, the majority being in Nigeria (420,000) and Kenya
(372,690) and Ghana (158,960) • Water supplies and sanitation close to people’s home has also indirect benefits, for instance an increased sense of
security, particularly among women. Health benefits, increased social harmony and new sources of income Examples of questions asked at community level • Do you have access to water and sanitation in your village? If so, since when? • Did your daily live change with having access to water in your community? • Apart from positive impacts can you think of any problems that arose due to access to water and sanitation? Example: SABMiller, Enterprise Development in their supply chain: The Smallholder Programme Examples of impacts reported • In 2007/08 over 10,500 smallholder farmers engaged in SABMiller programmes in Africa and India. The number is
estimated to reach nearly 17,000 in 2009 • In India, farmers receive a preferential price, which in 2007/08 was around 5% higher than the open-‐market rate Examples of questions asked to farmers • Have you been involved in the SABMiller smallholder programme? • Did the participation enable you to hire additional temporary labour during harvesting? • Did the programme have any long-‐term impact on your business? E.g. more disposable income? Summary: The key feature of this approach is the use of local level information and perspective gathered from firms,
workers, enterprise and residents. Versions of this approach are used by companies, NGOs and project funders, researchers, and business-‐related schemes. It is useful for:
• Either ‘proving’ impact to date, or ‘improving’ future management based on in depth understanding of what works, how;

10
• Grounding the impact assessment in tangible local change and real data, including measurables
such as incomes, jobs. • Covering both measurable economic results with less tangible data on preferences, social, and
environmental issues
• Aggregating and comparing some key data between different sites, to learn more about big picture impacts and areas of high/low performance:
Limitations:
• Unlikely to deliver simple quantitative answers that summarise impact, nor standardised results that enable comparisons such as return on investment, or ranking between sites.
• Requires fieldwork at community level, so cannot be done rapidly from the desk.
• Does not assess impacts at a large scale, such as across a major value chain, or entire economy.
4. Approach 2: Value chain maps and poverty footprints The first approach tends to focus on the most visible, direct and local impacts of an operation. The ‘value chain’ approach explicitly tracks through different nodes and links of the value chain, to consider a wider
range of impacts. The ‘value chain’ includes the supply chain from raw material to processing, the distribution and retail chain, plus final consumption and disposal or recycling. It is thus likely to also cover a range of geographical locations. By including all aspects of supply, distribution, and consumption, it seeks to
build a ‘footprint’ (a concept taken from environmental impact work). A ‘footprint’ is not a single numerical answer, but an overall picture, and because of this it is possible to see which parts of the footprint are most significant in different ways and to whom.
Many sources of data are shared with Approach 1: detailed firm level information on jobs and wages, views of workers, suppliers and other stakeholders. But it also tracks flows at a higher level, such as to
intermediaries, related sectors, shareholders and Treasury, and with more emphasis on aggregated financial data, going beyond individual personal stories. It shares with Approach 3 an emphasis on links to
other sectors and other industries (transport, banking, distribution etc) but generally does not cover macro-‐economic impacts such as contribution to output or growth. This approach can be applied to a sector or a company. Examples include:
• A single large company: Assessment of the impact of Unilever Indonesia, done jointly with Oxfam (Clay 2005). This remains the best known and most detailed example of value chain mapping applied to a single company. It revealed the differential impact of different parts of the production
system. As such it was useful for both ‘proving’ and ‘improving’: it demonstrated to Oxfam and the wider public the considerable positive contribution that this one company made to employment in Indonesia. And because of the disaggregated analysis, it also provides a sound basis for making
decisions on where impact can be further enhanced. For example, it demonstrated the development importance of the distribution chain not just the supply chain, and of actions take during the Asian financial crisis to help suppliers adapt.
• A sector comprising many firms: Value chain mapping of the tourism sector by the ODI, IFC and SNV
tracks the flow of tourist expenditure through all aspects of tourism business in a destination. The resulting ‘map’ assesses the scale and location of income that flows to the poor. Originally they were done to ‘improve’: to contribute to planning as to where interventions can help unblock
further benefits to the poor, and this becomes easier as a pool of comparable studies, with emerging benchmarks, develops. However, they have gone somewhere to also ‘proving’ that

11
tourism can generate substantial pro—poor income of around a quarter of destination spending
(Ashley and Mitchell 2008).
Oxfam and ODI are continuing to develop these approaches, with forthcoming tools for mapping pro poor flows and bottlenecks in tourism value chains (ODI) and for assessing ‘poverty footprints’ (Oxfam) comprising economic and social impacts on poor people across the value chain. As ODI develop their set of
studies, comparison of value chains maps done to date is now also generating ‘benchmarks’ of high and low poverty performance (Mitchell and Ashley 2009). Oxfam’s tool is also developing, and in practice includes a blend of value chain mapping, livelihood information (our category 1) and macro-‐economic analysis (our
category 4). A strength of this approach is that it combines local level data from poor people with a big picture of the
overall impact, making it possible to see and compare areas of high and low impact. It also relates data on impact on poor people to the commercial structures and channels through which the company or sector works. By its nature it therefore lends itself to analysis of ‘core business’ not just community investment. Box 2: What does it mean in practice? Example: Unilever Indonesia (UI) and Oxfam collaborated in a joint research project in 2005. The research considered the impacts of Unilever Indonesia across the entire business value chain. Examples of impact reported • Overall, the research estimates that the full-‐time equivalent (FTE) of about 300,000 people make their livelihoods
from Unilever’s value chain. More than half are within the distribution and retail chain. • Total value generated along the value chain is estimated at US$ 633 million. Of this, UI earns about US$ 212
million; the remaining US$ 421 million is distributed among other actors in the chain with greater concentration among actors who are in direct interaction with UI.
Examples of questions asked to poor consumers • Do you know whether Unilever personal care products are available in your local shops? • Do you buy Unilever products for your personal care? • In how far does using these products have an impact on your daily life?
The Unilever Indonesia work is fairly well known, firstly for generating findings that truly moved
understanding on. It is surprising but true that this provided the first picture of how employment and revenue shares were supported up and down the value chain of an MNE It is also known as an intensive and prolonged effort, which has perhaps deterred others. But comparable work suggests that mapping a
value chain need not be so, particularly as methods are replicated and improved (securing co-‐author agreement between 2 or more institutions is a different issue). Value chain mapping has been done in
around 10 tourism destinations over the past 3 years, and fairly detailed analysis of the participation and earnings of poor people in a tourism value chain along with options for improvement can now be done in around 30 days (10-‐15 days of fieldwork). After completing the Unilever study, Oxfam further systematised
the methodology and is currently carrying out another Poverty Footprint study with two multinationals. The methodology will be open to consultation during July and August 2009 with the official launch planned at the end of this year (Borkenhagen and Zaremba 2009).
Summary: The key feature of this approach is the combination of information from local stakeholders and corporate operations, brought together into a ‘big picture’ covering the entire value chain from material supply to
distribution and consumption. Versions of this approach are used by companies, researchers, NGOs and donors. Companies may do it to either prove or improve. The others do it mainly to assist in diagnosing how to make value chains perform better.
It is useful for:
12
• Both ‘proving’ impact of the entire value chain, and ‘improving’ future management based on
disaggregated analysis. The picture of the entire business or sector can be summarised in a few overall statistics but also contains detail of different parts of the footprint as a basis for decision-‐making.
• Combining assessment of impact with assessment of commercial operation, so the inter-‐dependence of the two are clear.
• Combining tangible data on jobs, wages, enterprises linkages and revenue flows, with potential to
add non-‐financial issues, such as governance within the chain and stakeholder views on social impact, and the ‘big picture’ of national impact.
Limitations
• A significant undertaking requiring fieldwork, detailed corporate data and skilled aggregation and analysis.
• Likely to capture static picture but not dynamic impacts on local development
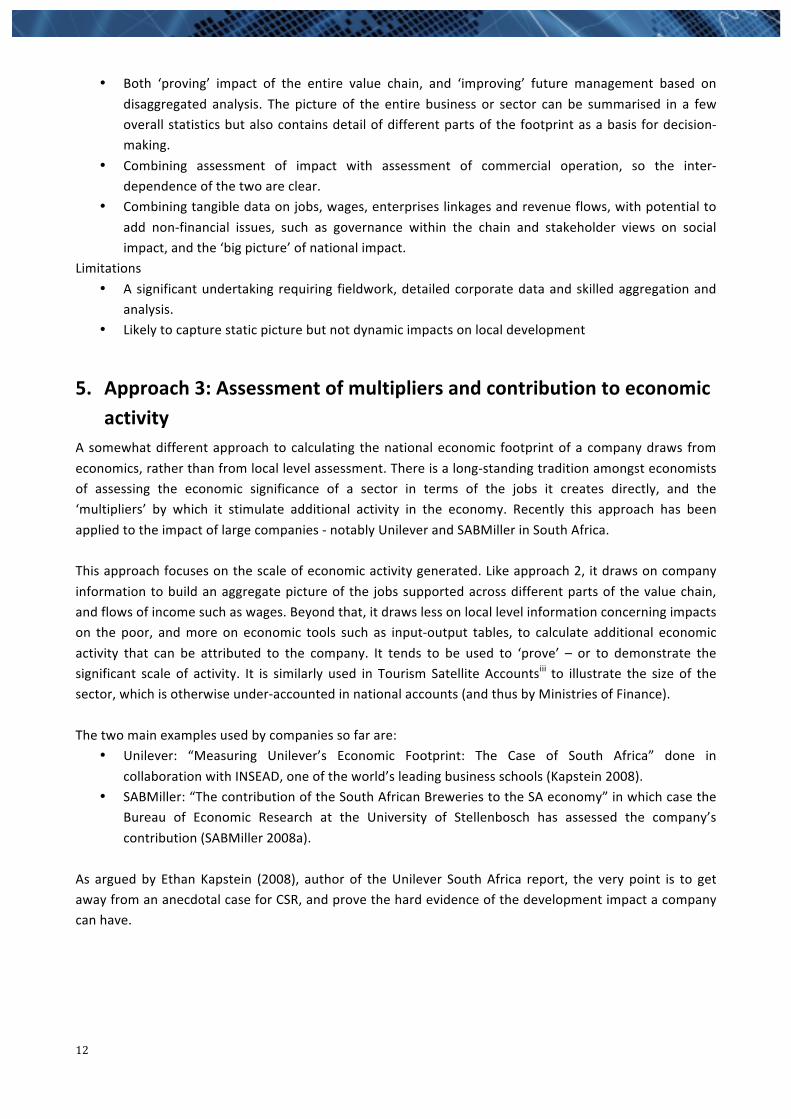
5. Approach 3: Assessment of multipliers and contribution to economic activity
A somewhat different approach to calculating the national economic footprint of a company draws from
economics, rather than from local level assessment. There is a long-‐standing tradition amongst economists of assessing the economic significance of a sector in terms of the jobs it creates directly, and the ‘multipliers’ by which it stimulate additional activity in the economy. Recently this approach has been
applied to the impact of large companies -‐ notably Unilever and SABMiller in South Africa.
This approach focuses on the scale of economic activity generated. Like approach 2, it draws on company
information to build an aggregate picture of the jobs supported across different parts of the value chain, and flows of income such as wages. Beyond that, it draws less on local level information concerning impacts on the poor, and more on economic tools such as input-‐output tables, to calculate additional economic
activity that can be attributed to the company. It tends to be used to ‘prove’ – or to demonstrate the significant scale of activity. It is similarly used in Tourism Satellite Accountsiii to illustrate the size of the sector, which is otherwise under-‐accounted in national accounts (and thus by Ministries of Finance).
The two main examples used by companies so far are:
• Unilever: “Measuring Unilever’s Economic Footprint: The Case of South Africa” done in
collaboration with INSEAD, one of the world’s leading business schools (Kapstein 2008). • SABMiller: “The contribution of the South African Breweries to the SA economy” in which case the
Bureau of Economic Research at the University of Stellenbosch has assessed the company’s
contribution (SABMiller 2008a).
As argued by Ethan Kapstein (2008), author of the Unilever South Africa report, the very point is to get away from an anecdotal case for CSR, and prove the hard evidence of the development impact a company can have.

13
Box 3: What does this mean in practice? Example: SABMillers contribution to the South African economy, assessed by the Bureau of Economic Research at the University of Stellenbosch Examples of impacts reported (economic contribution)
• In 2007, SABMiller’s contributed 3.3% to the South African GDP • In addition to directly employing 8,780 workers, 75% of whom are from disadvantaged groups, SAB’s
operations support an estimated 48,000 jobs at SAB’s first round suppliers. In all, 378 000 full-‐time jobs (or 3.0% of total employment in South Africa) can be directly or indirectly linked back to the production and sale of SAB’s products
Examples of questions: • To managers: what is total spending on each supply component? • To economists: how does $x of spending on transport translate into economic outputs and jobs, according to
the input-‐out tables and Social Accounting Matrix for South Africa?
Summary:
The distinctive elements of this approach are that it uses economic tools to provide clear aggregated data on the economic contribution of a company. It covers the entire corporate value chain, from an economic perspective. Such approaches are often used by economists and so far by few companies.
It is useful to: • quantify and demonstrate the overall economic contribution of a sector or large business; • move beyond anecdote to hard numbers;
• make comparisons between different parts of the business, or between comparable assessments across sectors, countries or companies.
Limitations:
• Less likely to generate disaggregated data for making decisions on specific parts of the business, nor finely textured analysis of causes of impact and areas to develop
• Less likely to include non-‐financial impacts, or reflect non-‐financial issues prioritised by different
stakeholders
6. Approach 4: Reporting against scorecards and standardised indicators
A scorecard or set of indicators is simply a framework for reporting, the coverage of which can vary enormously. At present, we have a set of indicators – from the GRI – that are extremely well used, but are a
poor reflection of development impact. And we have emerging scorecards that seek to better capture development impact, but are not yet established, or are used only by specific development institutions.
6.1 Global Reporting Initiative and UN Global Compact
Most companies do not invest in intensive assessment of the development impacts of specific business
operations, but a great many do report their performance against fixed international indicators, particularly those covered in the Global Reporting Initiative (GRI). The GRI is not a tool for impact assessment in the same way as approaches 1 to 3. But it is a tool that is increasingly used by companies for communicating to
the public concerning their performance as good corporate citizens. According to a global KMPG survey (KPMG 2008) about reporting trends, around three-‐quarters of annual sustainability reports were drawn up with the aid of the GRI guide.

14
GRI indicators are more a reflection of corporate behaviour than impact in Southern economies. They cover
a range of corporate performance issues ranging from generating direct economic value to energy consumption and indigenous rights, with relatively few touching on how the business affects development in the South. The most relevant indicators are
• Labour practices and decent work issues such as offering occupational health and safety, diversity and promotion of equal opportunities
• Community investment
• Anti-‐corruption actions • Investment and procurement practices • Practices regarding child, forced and compulsory labour
• Environmental good practice As currently constructed, GRI indicators are a poor guide to development impact in the South. However, it
is worth considering 2 strengths of GRI in reporting and encouraging enhanced development performance: • The use of standard indicators, guidelines and ratings, plus adoption by many leading companies,
allows comparison of data from different businesses, and thus introduces an element of
competition to do better; • Indicators are clear, and thus easily translated into attainment targets for mangers. Thus to the
extent that they do cover development issues, they can help in translating aims into action.
Examples of GRI reporting used by multinationals that do operate extensively in the South include Barclays, Diageo, and DHL. All three have an advanced GRI performance according to GRI Application levelsiv. For
example: • Barclays publishes a Sustainability Review, and also shows on its website where it provides
information against relevant GRI indicators, whether inside the annual report or elsewhere in its
public information. There is a wealth of information, with an emphasis on ensuring that it is all publically and easily available, but relatively little that relates to impact on developing countries. There are figures for the growth of non-‐UK community investment spending, commitments not to
employ child labour, details of above-‐target sourcing from black empowered enterprises by ABSA in South Africa, and a few worldwide figures on economic impact such as an annual global sourcing spend of £7bn for its 25,000 suppliers. An intention to undertake further research on economic
impact in emerging markets in 2008 is stated (Barclays 2007). It is clear that considerable company investment must have gone into the GRI reporting, which demonstrates performance against a
wide range of issues. But this seems to offer small opportunity for either proving or improving specific development contribution.
• A similar picture emerges from the reporting by Diageo and DHL. Diageo’s 2008 Corporate
Citizenship Report (CCR) includes reporting against GRI indicators. The CCR includes some other data, not required by GRI, but perhaps of more relevance when looking for development impact, such as an in-‐depth assessment of their Water of Life project as a demonstration of the impacts of
community investment (see Approach 1 above). Similarly, DHL (part of the dpwn Group) report against standard GRI indicators, and in their Sustainability Report 2008 also provide detailed information about development related issues, such as their partnership with UNICEF and the
Kenya Ministry of Health to fight against Malaria.

15
Box 4: What does this mean in practice? Example: Barclays, GRI Examples of impacts reported: Community investment: Globally, Barclays invested £52.4million in community projects. Non-‐UK community investment spending grew from 15% of the total (£6.9m) to 26% (£13.5m).
• Sustainable banking services in emerging markets: Barclays emerging market business increased the total number of ATMs to 704, up from 295 in 2006.
• Economic impact: In 2007, Barclays had an annual global sourcing spend of £7bn for its 25,000 suppliers (10,000 making up 90% of their third-‐party spend). An intention to undertake further research on economic impact in emerging markets in 2008 is stated.
Examples of questions asked of managers: • Do our labour standards meet international standards, e.g. International Labour Organisation (ILO) across the
whole value chain? • How many employees have participated in anti-‐corruption workshop? • What percentage of employees participated in volunteering schemes nationally and internationally?
Membership in the UN Global Compact can also be considered as a way for companies to report on how their business operations are aligned with sustainable development principles. Commitment is based on 10 universally accepted principles in the areas of human rights, labour, environment, and anti-‐corruption.
Additionally, one of the explicit commitments that a company makes when it joins the UN Global Compact is to produce an annual Communication on Progress (COP). Since its launch in 2000, the initiative it has become the world’s largest corporate citizenship initiative with currently more than 4,700 corporate
participants and stakeholders from over 130 countries.. However, similar to the GRI the principles are mainly based on company’s general sustainability performance and thus reporting against these does not necessarily give information about direct development impacts in developing countries.
6.2 Reporting against more poverty focused indicators
New initiatives are attempting to combine the indicator reporting and scoring approach of GRI, with a
different range of indicators that better capture development impact. One such under discussion is a ‘Good for Development’ label (Ellis and Keane 2008). Although initially
discussed as a label for products (going beyond fair trade criteria to wider development impacts), the current proposal is for the label or badge to apply to a company. The premise is that current reporting – such as GRI or carbon footprint – are simply inadequate to define whether a company is overall having a
substantially positive impact on development and attainment of the MDGs. The label would rest on a number of criteria related to development impact including:
• Contribution to poverty reduction, via fair pay, use of local suppliers, payment of taxes,
entrepreneurial training, low-‐priced products for poor consumers etc • Contribution other specific MDGS such as universal primary education (via educational investment
and no use of child labour) and improved maternal health (via investment in health and clean
water, female literacy, affordable products). While there are enormous practical problems in developing a methodology that is generally applicable and
genuinely captures ‘development impact’, this is a significant shift in thinking to trying to assess the broader development contribution of an entire company through standard and comparable indicators.
The MDG Scan is another new tool, designed by the Netherlands Committee for International Cooperation and Sustainable Development (NCDO) and Sustainalytics, which enables companies to measure their

16
positive contribution to the eight Millennium Development Goals (MDGs). The tool is designed for medium
and large sized companies with direct operations in developing countries, with more attention to positive than negative contributions, though both can be countedv. So far 34 companies such as Heineken and Philips have registered for the online self assessment tool that, based on key data, estimates the MDG
footprints of a company by measuring the effect of the following factors on a country's economy: value added, employment creation, products & service and community investments.
Another assessment tool, just emerging, is the framework ASPIRE (A Sustainability Poverty and Infrastructure Routine for Evaluation) developed by Arup and Engineers Against Poverty to assist project stakeholders in understanding the relationships between sustainable development, poverty alleviation and
infrastructure in developing countries. ASPIRE is adapted from Arup’s in-‐house appraisal tool SPeAR (Sustainable Project Appraisal Routine)vi, by adding more poverty focus to the range of sustainability issues. SPeAR was developed as a tool that construction firms and other companies can use to assess their
performance against 140 or so indicators that related to environmental protection, social equality, economic vitality and efficient use of natural resources. Due to the greater poverty focus of ASPIRE, ‘institutional structures’ was added as a dimension to the framework. By providing a snapshot of current
performance, it can help guide management attention to areas for improvement, and provide a basis for comparing results over time or across sites. The software tool is designed so that it can be filled in relatively rapidly by a well informed internal manager.
Further information on the scorecards used by development finance institutions is below. These tend to have one or two sections on ‘development impact’ which is combined with scores on financial and
sometimes environmental performance and donor input, in the scorecard. Summary: Scorecards and indicators can be used to report regularly on performance at corporate level, or at a project site. They are good for:
• Capturing fixed information which can be repeated over time and compared across respondents.
GRI and UN Global Compact indicators: • Are used by many large companies • To report publically and transparently on a wide range of issues of corporate performance, not
specifically development impact.
Alternative scorecard approaches could be used to report on a combination of quantitative impacts (jobs, tax payment etc), and more qualitative impacts and contribution to structural change (institutional development, SMME development). They are useful for:
• Trying to capture wider development issues in a standardised way. Standardisation enables diminishing costs of repeat assessments, and comparison between time periods, sites, or respondents.
• The scorecard approach enables numerical indicators to be combined with other important indicators of impact, and can visually be presented as such.
Limitations: • It is difficult to establish fixed indicators that can capture development impact, are applicable in
widely differing circumstances, and can generate scores that can reasonably be compared. • Scores provide a static snapshot. While highlighting areas of weakness, they do not necessarily
explain strong and poor performance, so additional insights are needed for improved decision-‐making.

17
6.3 Additional perspectives from verification and assurance
Verification is not strictly impact assessment as its primary purpose is to verify that the company is doing what it says it is doing. Often it is commissioned to check that what is reported in GRI indicators and annual reviews is valid. However, verification with high added-‐value may well in fact go into some detail on
impacts that are being generated, and should provide insights for future management. Indeed the majority of senior business managers report that they expect more from verification than just a stamp of approval. They are also looking for added value in terms of sharpening internal performance through interrogation of
systems and identification of inefficiencies or weaknesses for future improvement (ENDSdirectory 2009).
The contribution of verification processes is important to consider because it is a practice that is spreading. According to SustainAbility (2002) 68% of the top 50 reports had some form of external assurance, up from 50% in 2000. Mining, oil, gas, and pharmaceuticals have high rates, while verification is increasing in the
financial sector. More recent surveys of their Global Reporters research programme confirm the growing importance of external assurance.
Some verification is strictly procedural. The majority is done by accountancy firms (PwC, Deloitte, KPMG etc), and international standards on verification cover issues such as sampling, completeness, accuracy and responsiveness. However, of 34 verified reports reviewed by SustainAbility (2002), 16 were verified by
specialist consultancies focusing on environmental or social impacts, and 6 were by NGOs. These more specialist approaches to verification can help explore and interrogate the impacts of a company. Verification is not defined by any specific method, but by the purpose for which it is commissioned. While
verification is most often related to reporting against GRI indicators, it can be applied to any type of impact assessment using any of approaches 1 to 4.
7. Summary of pros and cons Box 5 summarises the strengths and weaknesses of the four approaches.
Approach Strengths Weaknesses 1) Local assessment: Livelihood impact & stakeholder views
-‐Combines financial & social impact, combines reasons within results -‐‘Ground-‐truthing’ with stakeholders -‐Some aggregation & comparison at higher level -‐Useful for
- ‘improving’ decisions locally
- ‘proving’ via data & stories
-‐Not difficult
-‐Usually weak on aggregation, benchmarking or comparison -‐Isolated from wider context -‐Limited scale -‐Requires fieldwork on-‐site
2) Value chain footprinting -‐Combines financial & social data; stakeholder & corporate data; local results with the big picture -‐Focus on core business, & supply & distribution chains -‐Useful for ‘improving’ at local &
-‐Information requirements -‐ from stakeholders/firms plus internal corporate info -‐Requires strong analysis

18
strategic level -‐Encourages lateral thinking -‐Big picture results useful for ‘proving’
3) Economic contribution and multipliers
-‐Hard data, beyond anecdote -‐Big picture in national context -‐Useful for ‘proving’ -‐Speaks to Ministry of Finance -‐Focus on normal business – not just CSR – and supply/distribution chains -‐Scaleable, replicable, comparable
-‐Little on stakeholder views, other poverty impacts -‐Less disaggregation or explanation of ‘why‘
4) Scorecard performance -‐Simplifies complexity -‐Combines financial, social & environmental -‐Often includes dynamic & institutional impacts -‐Visual impact -‐Makes comparisons possible -‐Tracks changes over time
-‐It all depends on what is measured -‐Describes not explains -‐Setting standardised development impact indicators is hard
So if the question is ‘which approach is best to use” the answer is always ‘it depends what you need it for. It depends on what you need:
• Insights to boost development impact: at site or country level, within CSR or across the business, strategically?
• Evidence to communicate – to communities, the public, to Finance Ministers? Personal stories, numbers or scores?
• Types of information: financial, social, environmental, or dynamic impact? Causality or description? Data or views?
• Comparisons over time, with others, or a single snapshot? What is manageable and value-‐for-‐money?
• Depends on your skills, time, mandate, & partners So, the choice of approach depends on the business case for assessment and how the findings will be used.
8. Insights from donors and economists Many bilateral donors and development banks invest in private sector development. As users of public money they face stronger pressures to report on the impact and value for money of their investment, but
face similar challenges on how to measure results of private business activity. Given the extensive thinking that they have already had to do, it is useful to draw on donor experience in relation to:
• The standard challenges of conducting impact assessment, such as what and how to measure, and
the heightened challenges relating to private sector impacts; • Understanding resistance to conducting impact assessment; • Assessing and mapping chains of causation;
• Assessing cost-‐effectiveness and comparing efficiency of different interventions • Capturing dynamic impacts and knock-‐on effects on development, of private sector activity
This is not the place for a more in-‐depth review of the many strategic and methodological issues covered in an extensive literature on donor impact assessment. Key issues for private sector development are well summarised by the Donor Committee on Enterprise Development in “The 2008 Reader on Private Sector
Development: Measuring and Reporting Results” (Tanburn 2008).

19
“There are indeed strong disincentives to conduct impact assessments. There is the free rider problem (‘why should I assess my program, let so-‐and-‐so assess theirs?’), a public goods problem (‘why should I invest my money in impact assessment when others benefit from it, let someone else invest in it’), a career problem (‘what if I do an assessment and the results are not favourable, how will that affect my career?’), a cost problem (‘gee, impact assessment sure costs a lot, better to save the money and channel it to program beneficiaries’), and so forth.” Gary Woller, in a recent USAID discussion forum (Tanburn 2008, pp. 24)
8.1 Challenges of impact assessment in private sector development
Box 5 highlights some standard challenges of impact assessment in any arena. The 2008 Reader also highlights some particular challenges of applying it in private sector development:
• The goals of private sector development are ambitious and multi-‐layered. The aims include systemic change, not just operational change, generating ‘copycat’ affects, and second round dynamic effects (further enterprise growth). As such, the intended impacts of PSD are among the
hardest to quantify. • The level at which impact should be measured is debatable: Growth in operations of enterprises
and economic activity? Jobs created and sustained? Or changes in poverty levels and livelihood
indicators among poor households? • The time-‐frame of assessment matters more than with standard delivery of development services
(eg healthcare), as investment of inputs is high at first, while generation of impact start small and rises incrementally over time. The strongest affects may occur after a decade, long after intervention has ceased.
Short term actions, such as rationalisation, may show negative impacts, even though they lay the basis for longer term productivity improvements.
• There is currently little reward for good impact assessment. Spending on assessment adds to overheads, whereas the pressure is to reduce overheads relative to
field inputs. • Currently success stories dominate. There is very little
hard information so minimal baseline for making
comparisons. The main comparable information is cost per job created, but even here, defining the scope of ‘input cost’ and of ‘job created’ are challenging.

20
Box 6: Challenges of impact assessment In any field of development investment, assessment of impact has to deal with these challenges:
• Attribution of causality: If the aim is to assess impacts of an intervention it is important to know whether it actually causes the change that can be observed. Existing trends would have caused some change anyway (this is the ‘deadweight’ impact), and other initiatives may be stronger causal factors.
• Impact assessment vs monitoring: Monitoring tends to be during an intervention, done to improve management. Impact assessment can be done ex ante, based on prediction, to help decide whether to make an investment, and then should also be done ex post, to prove impact, and discover lessons about what worked or did not.
• Rigour and proxies: Rigorous scientific research uses randomised controlled trials, in which impact on the target group is compared with a control group. This rarely being possible in development reality, alternatives include measuring change over time, comparing outcomes with approximate control groups, measuring proxy indicators over time and across groups, and using ranking rather than fixed scoring of outcomes,
• Time-‐frame: A good intervention will continue to generate spin-‐off or knock-‐on impacts after the intervention itself has ceased. At what stage should impact assessment be done, and how many years of spin-‐off impact should be within the scope of assessment?
• Displacement affects: Did others suffer from the intervention? Where benefits simply shifted to the target group at the expense of other groups?
• Effective use of resources: To judge whether an intervention was worth doing, we need to know not just the impact but the impact relative to the cost of intervention, i.e. cost effectiveness. Could the resources have been better used elsewhere? But this requires being able to compare impacts with inputs, and having data that can be compared across interventions.
8.2 Causality Donor assessments of investment in PSD focuses on quantifiable indicators of economic activity: jobs,
wages, numbers of contracts, numbers of small, medium and micro enterprises (SMMEs), rates of business expansion, volume of turnover or investment. In some cases a distributional focus is incorporated, to measure what share of impacts accrue directly to ‘poor’ participants, the unskilled, women, and minorities,
or to small and micro enterprise rather than any-‐sized business. Some project assessments are good at tracing the causal chain by which impact occurs at different levels.
An example from Katalyst, a multi-‐donor programme working to develop value chains and service markets in Bangladesh is shown in Figure 1. One year after training retailers to provide better advice to farmers, around 239,000 farmers had gained. As the causal chain diagram shows, impacts were directly from trained
retailers providing information and from copycat affects on other retailers and other farmers, both of whom adopted some of the good practice.

21
Figure 1: Example of assessing the causal chain, Katalyst, Bangladesh
Source: Tanburn 2008, p. 38
8.3 Cost effectiveness and comparisons
For donors, assessing cost-‐effectiveness is important. Some progress has been made in assessing cost per job created. Results vary enormously, though some variation stems from what is measured, at what point in time, and how.
• Independent evaluation of the Dutch Programme for Cooperation with Emerging Markets (PSOM) in 2005 found that the average costs across different sectors per direct job created was US$ 12,600, but the range was wide, from US$10,700 in agribusiness to US$192,000 in infrastructure (Tanburn
2008). (Whether this means infrastructure investment generates a poor return is a different matter, given its wider role in unblocking development).
• Costs per job are much less if indirect jobs created by an investment are included. Figures from
DfID’s Business Linkage Challenge Fund (BLCF) imply US$ 1,300 per direct job created or retained but only US$ 200 per total job created or retained (Tanburn 2008).
• Although high costs per job created are not on their own an indication of low development value,
assessment of a project that records unusually low costs per job, particularly if jobs are created at

22
scale, is helpful in flagging approaches worth further attention. Various initiatives working with
SMEs, technology, entrepreneurs and value chain development report cost per job in the arena of US$100 to US$700, with the best examples (Mekong Bamboo Consortium and entrepreneurship training in India) at US$50 and US$25 (Tanburn 2008).
These ratios are based on the cost of donor input into the PSD interventions that created new jobs. However, in using such ratios to report and compare the impact of companies, there are big questions over the denominator to use (i.e. what cost to compare to the jobs created):
• When there is a clear budget input, such as within a social investment programme, the ratio of jobs created to the investment cost provides a useful ratio.
• Comparing the development impacts of a US$ 10,000 community investment donation versus a 3-‐year SMME linkage programme of the procurement department would be a useful comparison to
make, and has not been made. But it may be harder to quantify the project input for the linkage programme (because inputs are made by operations staff as part of their work), while it may be unfair to assess corporate investment (CI) return in terms of jobs if other social impacts are
prioritised.
• Jobs created by a business can be compared to capital investment, or annual turnover of the company. These can be useful indicators, for example if a company is seeking to illustrate its social impact credentials to government or funders, or for a Ministry considering alternative investments.
• However, such ratios should not be used as the sole indicator. Investments that make intensive use
of capital and new technology may deliver other substantial gains, and help generate higher-‐productivity growth.
8.4 Dynamic impacts
Beyond the numerics of jobs and SMMEs, donors also try to capture dynamic impacts. Most of the development banks (International Finance Corporation (IFC), Asian Development Bank (ADB), African Development Bank Group (AfDB), Deutsche Investitions und Entwicklungsgesellschaft (DEG), European
Bank for Reconstruction and Development (EBRD)) now use scorecards to assess likely development impact ex ante, when deciding on resource allocation. Financial rate of return is one non-‐negotiable variable. But other scorecard elements include the investments contribution to private sector development, such as
development of markets, the investment climate, small enterprise, technology transfer. As an example, the framework used by IFC, is shown in Figure 2, in which financial return is accompanied by 3 other categories of development impact: economic performance (gains to consumers, government, workers etc);
environmental and social performance (working conditions, pollution abatement etc); and private sector development (market development, assistance to buyers or suppliers). It is this latter category that helps to capture some of the dynamic impacts that are difficult to quantify but reflect high value.

23
Figure 2: IFC Development Outcome Framework
Source: IFC The German Development Bank, DEG, has a broadly similar approach whereby ‘development effects/
sustainability‘ are one of four categories that are scored (the other three are long-‐term profitability, role of (value added by) DEG, and return on DEG equity.) Again, development effects include the static and more quantitative affects (government revenue, employment) and dynamic effects such as transfer of technology
and know-‐how, and market and structural effects (DEG 2008). The EBRD focuses on Central and Eastern Europe and prioritises ‘transition impacts’. Each investment is scored for its impacts on economic transition at three levels: the project level (e.g. market expansion via linkages to suppliers and customers);
contributions to market organisations, institutions and policies (e.g. policies that promote market functions and efficiency); and contributions to business behaviour (e.g. dispersion of skills, innovation, and higher standards of corporate governance), (EBRD 2008).
Three aspects of these scorecard approaches are valuable to note here. Firstly, they combine an assessment of the project’s contribution to development with assessments of how the project also achieves
a return for the donor institution (whether return on equity or additionality of the donor input). A similar approach assessing corporate return and social return could be used by companies. Secondly, the go
beyond measuring static numeric indicators of economic activity that are usually covered in ERR, to score investments on their dynamic contribution to economic development and market development. This is important for any assessment of the impact of business on development, because these spin-‐off effects can
be so significant. Thirdly, the scorecards are applied across hundreds of projects. While details of scoring methods can be discussed in detail (and are), the end result is that these finance institutions can now aggregate and compare scores across their portfolio. Scores for any project can be compared to the sector
average. Graphs compare scores by sector, by year, by region, and also generally highlight improvements in scores over time. It seems likely that the scoring process, particularly as it is rolled out to investment officers for ex ante assessments prior to investment, help focus minds and result in higher scores (as
captured in the adage that what gets measured gets done).

24
Figure 3: Illustration of improved project performance against scorecard assessment of Transition Impact in EBRD
Source: EBRD 2008. Based on 574 post-‐evaluated investment operations in 1996-‐2007
8.5 Economists’ assessment of impact and additionality
Economists traditionally have rather a different way of thinking about the contribution of business to
economic welfare. To date there is rather a gulf between traditional economic thinking on the value of enterprise and its contribution to welfare and growth, on the one hand, and debates around private sector development and development impacts of corporates on the other. While straddling the divide is a larger
challenge than can be done here, it is at least useful to consider the alternative perspectives that come from economics.
Traditionally economists assume, by definition, that business activities are in line with social welfare: business exists to respond to consumers’ needs and provide what they want, which is indicated by consumers’ willingness to pay for them. This is the fundamental principle underlying Adam Smith’s theory
of the Invisible Hand, which says that an individual pursuing his own self-‐interest tends to also promote the good of his community as a whole. “By pursuing his own interest he frequently promotes that of the society more effectually than when he really intends to promote it.” (Smith 1776, p. 456)
From this point of view, the scale of business activity by itself is a measure of its beneficial impact on welfare. One approach to measuring the scale/ welfare impact of business is to measure ‘Value Added’
which equals the value of sales made, minus the cost of inputs. This can be done at a company level – by measuring their inputs and outputs, or at the country level using input-‐output tables. This approach was used for the South African studies of Unilever and SABMiller discussed in section 5 earlier. Links with other
sectors account for a large part of their economic impact. But from a more traditional economics point of view, it is not clear why one company should take credit for the activities of another; all firms are fundamentally interdependent. Why shouldn’t suppliers take credit for the arrival of a large multinational
in the country than the other way round?

25
Conventional economics focuses on the scale of economic activity and not the distribution of jobs,
revenues, or other impact. In the pursuit of higher value added and higher productivity, there is no economic gain from allocating a job to a local resident over a capital city worker, or a supply chain contract to an emerging entrepreneur over an established supplier, unless robust additional economic impacts from
doing so can be demonstrated. In theory, reduced import leakages, reduced pressure on government budgets, higher returns to human capital development, or higher dynamic affects on other enterprise could be illustrated, calculated and incorporated. In practice, such weightings are rare. Economic analysis tends
to assume all welfare gains are equivalent, whosoever gains them, and social or distributional concerns are reflected in separate additional measures.
In economic analysis, but not in the corporate approaches outlined above, question of additionality or the counter-‐factual are key. Economists tend to assume that if one company is not filling the gap in the market, then another one will. This may not be realistic in a development context, where many markets are
extremely under-‐developed, and it is quite common for companies to be the first or only one to enter and operate in a specific market. But in general, measuring the impact of a specific business should focus on its additionality (compared with what would exist if it wasn’t operating in the market). This means taking into
account the likely scope for another competitor to enter the market if it exited. Or taking account of the competitors that have been knocked out by its presence. Assessment of knock-‐on benefits should also take into account the counter-‐factual: does the way it manages its supply chains differ from those of its
competitors, so generating any additional value through its particular business model? The way that economics traditionally assesses these knock-‐on impacts is also somewhat different to the
approaches that have been discussed earlier in this paper. Economic growth theory suggests specific avenues through which business activity contributes to growth:
• Through capital accumulation (either physical capital, or human capital e.g. through training, or on
the job learning);
• Through spillovers such as technological innovation, or managerial best practice which can be copied and adopted by other companies;
The assumption is that these affects are likely to be more beneficial in terms of the long run rate of growth and development, than for example, creating jobs which benefit those individuals only for the period in
which they have the jobs – unless of course those jobs also bring with them on the job training which develop skills that are applied in future. The focus of growth theory is very much on what the long run
benefits will be from the activity. Most studies of these types of effects are done at the macro or sectoral level – they are rarely done at the
company level. At the same time, none of the studies reviewed in this note have taken this approach to assessing business impact. Measuring livelihood impacts, value chain linkages, value-‐added to economic output, or achievement against scorecards generally does not capture these dynamic affects of a business’s
activities for the long run rate of growth. However, it would be easy to imagine ways this could be done at the company level e.g. assessing affects on the skills level of workers by looking at their future wage earning potential, or looking at the extent of technological innovation that a company has brought.
However, this suggests quite a different approach to what has been tried to date.

26
9. Some key issues on corporates’ development impact agenda
1. A range of approaches: diversity or disarray?
The above shows that there is a diversity of methods, and purposes for assessing impact. That in itself is an issue for businesses: what to choose, and how to choose it? The absence of ‘off the shelf’ approaches may
impede application. Companies need to be able to choose approaches that are manageable for them and meet the purpose at hand.
2. Assessing the business case for doing impact assessment
There has been even less attention paid to the business case for impact assessment, than to the methods for doing it. But without a business case, companies will not invest resources. The nature of the business case will determine what impact assessment is done and how. So this area needs attention.
• Demonstrating good citizenship to the public is one business case which does not require very demanding impact assessment. Some good headlines and stories will generally do, and can be related just to community investment initiative, not the core business.
• Substantiating claims about the role of the company or industry in development – particularly in the face of criticisms of the business model – generally requires something more. This business case is more likely to require assessment of the impact of the business (approaches 2, 3, or 4) not
just of CSR projects.
• Demonstrating delivery not just commitment. Given the plethora of commitments that have been made to the MDGs and to development, companies are now reaching the phase where they need to demonstrate results – to local partners, governments, international partners and the public.
Ideally this requires assessment of impact as compared to intention, which is somewhat more demanding that demonstrating good citizenship.
• Making management decisions about commercial strategies that will boost development impact is an emerging business case. Companies are currently innovating in this field (within the Business
Call to Action, harnessing supply chains, reaching bottom of the pyramid consumers etc) but generally in the spirit of innovation rather than based on ex ante assessment of the highest likely returns to either development or themselves. In the next phase, in which implementation spreads
more widely, executives are likely to want more detailed information.
• Matching or beating competitors. The business case for participating in initiatives such as GRI is partly not to be seen to be left out. Companies need to participate in ethical initiatives that competitors engage in, and need to score well. If other methods develop that generate benchmarks
that can be compared across firms (such as value chains, multipliers, or good for development labelling) this would also be a relevant business case.
3. Impacts of business or impacts of business initiatives
In the past, the main emphasis has been on assessing the impact of social investment and community investment. This is shifting for two reasons. Firstly, companies are increasingly using the levers of core
business, not just CSR, for boosting development value. While lauding innovation and impact in this relatively new arena, they and their partners will soon need better information for future resource allocation. Secondly, the wider debate is about the role of business in society, and business models that

27
innovate for the future, in which the argument cannot be won just in terms of CSR. This shift in turn will
require more attention to approaches that map value chain, footprints, and value added, and less to micro level project outcomes.
This shift parallels the shift from measuring outcomes not outputs. As emphasis shifts from measuring numbers of vaccines and workshops to outcomes in terms of poverty reduction, livelihoods supported and growth enhanced, the challenge will get greater, forcing methodological development on proxies and
shortcuts.
4. Assessing both impacts on development and impacts on the company
It could be assumed that companies would at least assess the business benefits to themselves of the investments they make that support poverty reduction, even if they don’t need to actually assess their impact on poverty. In fact, very little is done. It seems that corporate resources are often invested under rules that would not apply to any other part of the business: spend it, do it, and assume the returns are there if not measurable. However, this is beginning to change, and it is likely that successful assessment approaches in future will find ways to combine reporting on returns to shareholders and stakeholders. RioTintoAlcan (2009) has developed a tool, in conjuction with IFC and Deloitte, that measures the net present value of sustainability investments. NPV for the company is based on detailed assessment of impacts at the project-‐level, such as on workers and residents, and their response in turn (such as via productivity or reduced hostility). The tool is unusual in that it allows comparison of the type and timing of the impacts of alternative sustainability investments. As companies seek more information on the commercial returns to inclusive business approaches, this may help drive assessment of their impact on stakeholders, because one helps to deliver the other.
5. Skills and mandates; simple techniques and/or complementary partnerships
Businesses are not development organisations, their primary purpose is commercial operation and their
skill set is not impact techniques. This raises questions about what should be expected from business in their investment in impact assessment, and which skills and resources should be expected from partners. Businesses doing their own impact assessment are clearly going to want relatively simply, manageable,
techniques that do not require massive investment. More complex approaches will provide more richly textured and more useful insights, but the additional gain probably needs investment from the wider development community.

28
References and Endnotes Ashley, C., Haysom, G., Poultney, C., McNab, D., Harris, A. (2005) ‘How to...? Tips and tools for South African tourism companies on local procurement, products and partnerships. Brief 1: Boosting procurement from local businesses’. September 2005. London: Overseas Development Institute. Available at http://www.odi.org.uk/resources/details.asp?id=1517&title=boosting-‐procurement-‐local-‐businesses Ashley, C .and Mitchell, J. (2008) ‘Doing the right thing approximately not the wrong thing precisely: the challenge of monitoring impacts of pro-‐poor interventions in tourism value chains. ODI Working Paper 291. ODI, IFC and SNV. Available at http://www.odi.org.uk/resources/odi-‐publications/working-‐papers/291-‐pro-‐poor-‐interventions-‐tourism-‐value-‐chains.pdf Barclays (2007) ‘Sustainability Review 2007’ Online report available at http://www.barclays.com/sustainabilityreport07/sustainability_barclays.html Borkenhagen, L. and Zaremba, J. (2009) ‘Understanding the business contribution to development: Oxfam’s Poverty Footprint’. Briefing for Business Poverty Footprint Clay, J. (2005) ‘Exploring the Links Between International Business and Poverty Reduction: A Case Study of Unilever in Indonesia’, Oxfam Publications. Available at http://publications.oxfam.org.uk/oxfam/display.asp?K=9780855985660 Conway. T. and Sophal, C. (2007) ‘How does the choice of poverty measure shape our understanding of poverty levels and dynamics?’ Presentation to CDRI National Poverty Workshop, Phnom Penh, November 2007. DEG (2008) ‘Corporate Policy Project Rating (“GPR”)’ Executive Summary (03/2008), DEG, KfW Bankengruppe. Available at http://www.deginvest.de/EN_Home/About_DEG/Our_Mandate/Development_Policy_Mandate/DEG-‐GPR_brief-‐description_english_03-‐2008.pdf Diageo (2007) ‘Evaluation of the 2007 Water of Life Projects in Africa’ Diageo. Available at http://www.diageo.com/NR/rdonlyres/D654A441-‐12EB-‐4BAD-‐8C45-‐F6A72D906603/0/Wateroflifeevaluation.pdf Diageo (2008) ‘Corporate Citizenship Report 2008’ Available at http://www.diageo.com/NR/rdonlyres/D42FB7CE-‐2B65-‐40D7-‐810B-‐EBCDB5906596/0/DIAGEO_CCR_08.pdf DPWN (2008) ‘Sustainability Report 2008’ Available at http://www.dp-‐dhl.de/sustainabilityreport/2008/servicepages/welcome.html EBRG (2008) ‘Annual Evaluation and Overview Report for 2008’ European Bank for Reconstruction and Development, Evaluation Department. June 2008. Available at http://www.ebrd.com/projects/eval/showcase/0806-‐1.pdf Ellis, K. and Keane, J. (2008) How do ethical and fair trade schemes affect poor producers? Do we need a new ‘Good for Development’ label?’ ODI Opinion 125, October. London: Overseas Development Institute. Available at http://www.odi.org.uk/resources/odi-‐publications/opinions/115-‐good-‐for-‐development-‐label.pdf ENDSdirectory (2009) ‘Corporate sustainability reporting – does verification add value?’ Available at http://www.endsdirectory.com/index.cfm?action=articles.view&articleID=200302 ETI (2003) ‘ETI’s Impact Assessment: Terms of Reference’ Ethical Trading Initiative. Available at http://www.ethicaltrade.org/Z/lib/2003/01/ia-‐tor/eti-‐ia-‐tor.pdf Kapstein, E. (2008) ‘Measuring Unilever’s economic footprint: The Case of South Africa’ Unilever. Available at http://www.businessactionforafrica.org/documents/UnileverSAReport.pdf KMPG (2008) ‘International Survey of Corporate Responsibility Reporting’. KMPG international. Available at https://www.kpmg.com/SiteCollectionDocuments/International-‐corporate-‐responsibility-‐survey-‐2008_v2.pdf London, T. (2009) ‘Making Better Investments at the Base of the Pyramid’. Harvard Business Review, May 2009 Massyn, P. and Koch, E. (2004) ‘African Game Lodges and Rural Benefit in Two Southern African Countries’. In Tourism and Development issues in Contemporary South Africa, Rogerson, C. and Visser, G. (ed), Africa Institute of South Africa, Pretoria. Mitchell, J and Ashley, C. (2009) ‘Value Chain analysis and poverty reduction at scale, Evidence from tourism is shifting mindsets’. ODI Briefing Paper 49, March 2009. Available at http://www.odi.org.uk/resources/download/2675.pdf Rebernak, K. (2008) ‘Special report: Reporting – Communications – How to measure what matters’ Ethical Corporation, available at http://www.ethicalcorp.com/content.asp?ContentID=5771 SABMiller (2008) ‘Enterprise Development Report: Making a difference through beer’. Available at http://www.sabmiller.com/files/reports/2008_enterprise_development_report.pdf
SABMiller (2008a) ‘Making a difference through beer: Contributing to the South African economy’. Available at http://www.sabmiller.com/files/makingadifference/Making_A_Difference_SA_Economy.pdf Smith, A. (1776) ‘The Wealth of Nations’ Book IV.ii.6-‐9, Glasgow Edition SustainAbility (2002) ‘Trust Us: The Global Reporters 2002 Survey of Corporate Sustainability Reporting’. SustainAbility and UNEP. Available at http://www.sustainability.com/researchandadvocacy/program_article.asp?id=458

29
RioTintoAlcan, IFC and Deloitte (February 2009). Planning and financial valuation tool for sustainability investments. Listed under background documents on http://www.commdev.org/content/calendar/detail/2381/ Tanburn, J. (2008) ‘The 2008 Reader on Private Sector Development: Measuring and Reporting Results’, International Training Centre of the ILO. Available at http://www.bdsknowledge.org/dyn/bds/docs/detail/649/4 Vodafone (2009) ‘India: The Impact of Mobile Phones’ The Policy Paper Series, Number 9, January 2009, Vodafone Group plc. Available at http://www.vodafone.com/etc/medialib/public_policy_series.Par.56572.File.dat/public_policy_series_9.pdf
i This and the following two quotes are variously attributed but sourced by the author of this paper from Tanburn (2008), Conway and Sophal (2007), and Rebernak (2008)
ii Anglo American has made the toolbox freely available as a contribution to managing the socio-‐economic impacts of extractive, other natural resource and industrial operations. Available at http://www.angloamerican.co.uk/aa/development/society/engagement/seat/seat_overview.pdf iii Used by both the industry body, the World Tourism and Travel Council, and the UN body, the UN-‐World Tourism Organisation. Despite slightly different methodologies, both focus on integrating the multiplier impacts of a wide definition of tourism activity into estimates of the tourism economy. Results on its economic contribution are often four times larger than estimates from the national accounts of the impact of the narrowly-‐defined travel and tourism (hotels and restaurants) account. For further information see “Tourism Satellite Accounts: Recommended Methodological Framework”, (OECD, UN, World Tourism Organization): http://browse.oecdbookshop.org/oecd/pdfs/browseit/7801011E.PDF
iv Barclays (B+) and Diageo (A+), DHL is part of Deutsche Post World Net which scores B+. The GRI reporting framework uses an ‘Application Level’ system: A (advanced reporters), B (somewhere between) and C (beginners). The reporting criteria at each level reflect a measure of the extent of application or coverage of the GRI Reporting Framework. A “plus” (+) is available at each level (ex., C+, B+, A+) if external assurance was utilised for the report. Thus this application level system is not directly related to the actual performance of a company but rather show to what extent the G3 Guidelines have been utilized in the reports. http://www.globalreporting.org/GRIReports/ApplicationLevels/ v http://www.ipsnews.net/2007/02/development-‐mdg-‐scan-‐to-‐benchmark-‐private-‐contribution/
vi SPeAR contains a set of core sectors and indicators that have been derived from the UK Government’s set of sustainability indicators and its sustainability strategy, United Nations Environment Programme (UNEP) indicators, and the Global Reporting Initiative (GRI). SPeAR has been successfully applied on over 100 projects worldwide.
Top Related