
Updated Low Energy Calibration of PandaX-II · Outline 1. Low energy calibration introduction 2....
17
Updated Low Energy Calibration of PandaX-II 燕斌斌, Shandong University On behalf of PandaX collaboration 2018/6/22
Transcript of Updated Low Energy Calibration of PandaX-II · Outline 1. Low energy calibration introduction 2....
Updated Low Energy Calibration of PandaX-II
燕斌斌, Shandong University
On behalf of PandaX collaboration
2018/6/22
Outline
1. Low energy calibration introduction
2. Improved uniformity correction
3. Updated ZLE efficiency study
4. Energy reconstruction and resolution
5. Band and spectrum comparison
6. DM detection efficiency
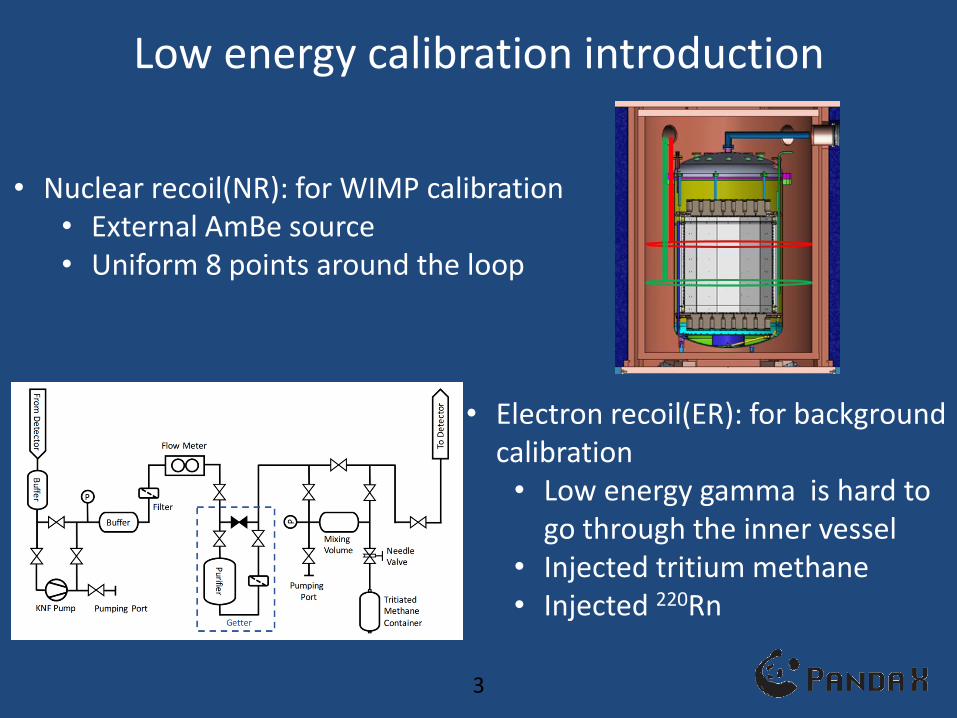
Low energy calibration introduction
• Nuclear recoil(NR): for WIMP calibration • External AmBe source • Uniform 8 points around the loop
• Electron recoil(ER): for background calibration • Low energy gamma is hard to
go through the inner vessel • Injected tritium methane • Injected 220Rn
3
4
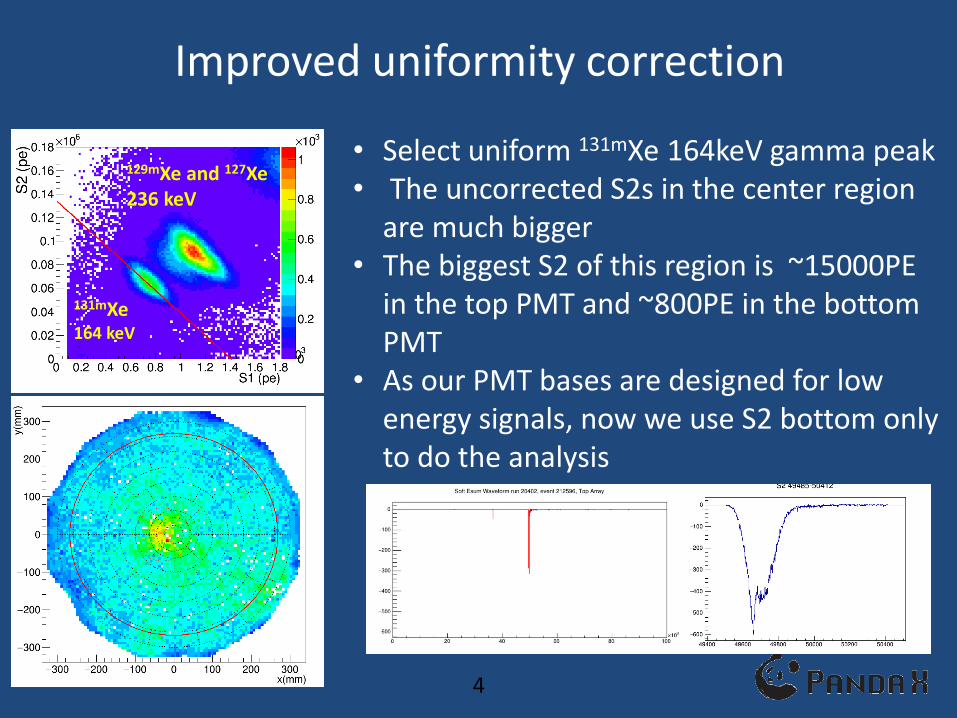
Improved uniformity correction
131mXe 164 keV
• Select uniform 131mXe 164keV gamma peak • The uncorrected S2s in the center region
are much bigger • The biggest S2 of this region is ~15000PE
in the top PMT and ~800PE in the bottom PMT
• As our PMT bases are designed for low energy signals, now we use S2 bottom only to do the analysis
129mXe and 127Xe 236 keV
5
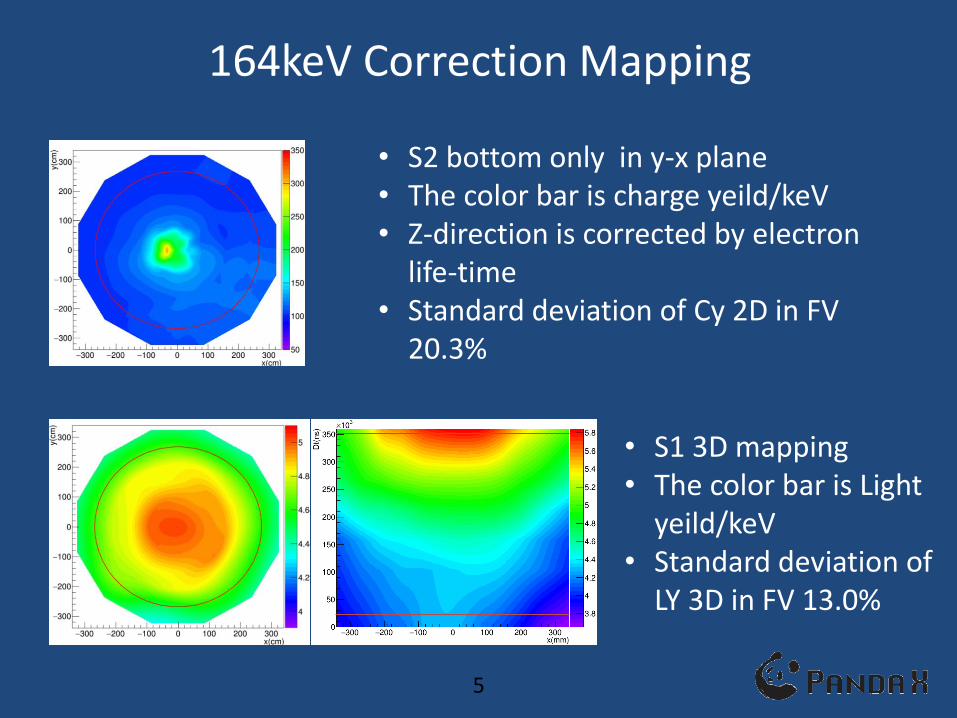
164keV Correction Mapping
• S2 bottom only in y-x plane • The color bar is charge yeild/keV • Z-direction is corrected by electron
life-time • Standard deviation of Cy 2D in FV
20.3%
• S1 3D mapping • The color bar is Light
yeild/keV • Standard deviation of
LY 3D in FV 13.0%
6
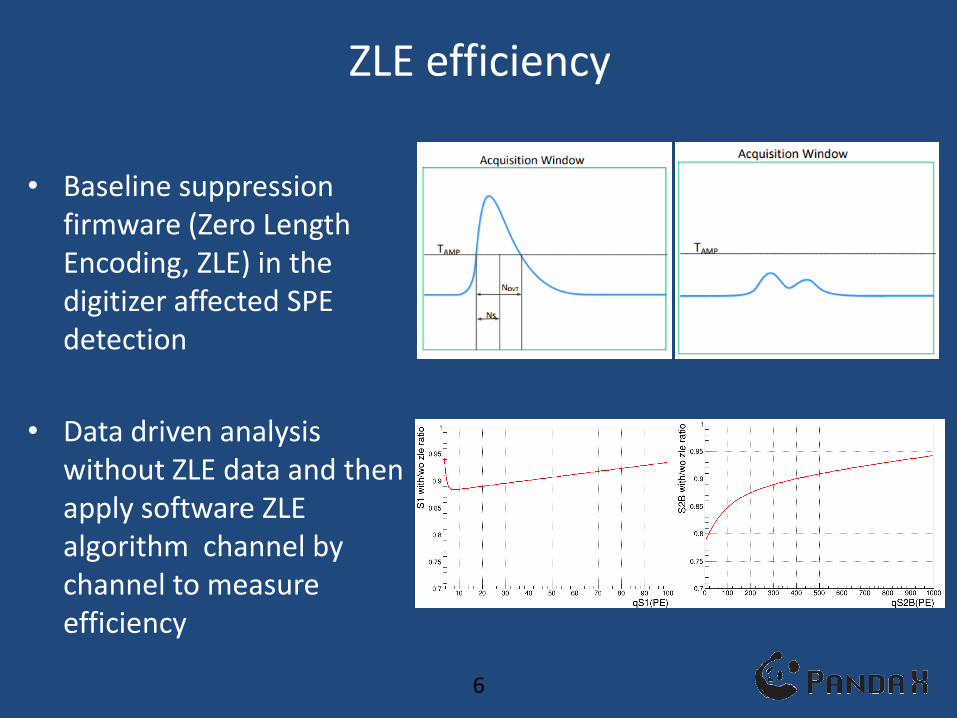
ZLE efficiency
• Baseline suppression firmware (Zero Length Encoding, ZLE) in the digitizer affected SPE detection
• Data driven analysis without ZLE data and then apply software ZLE algorithm channel by channel to measure efficiency
7
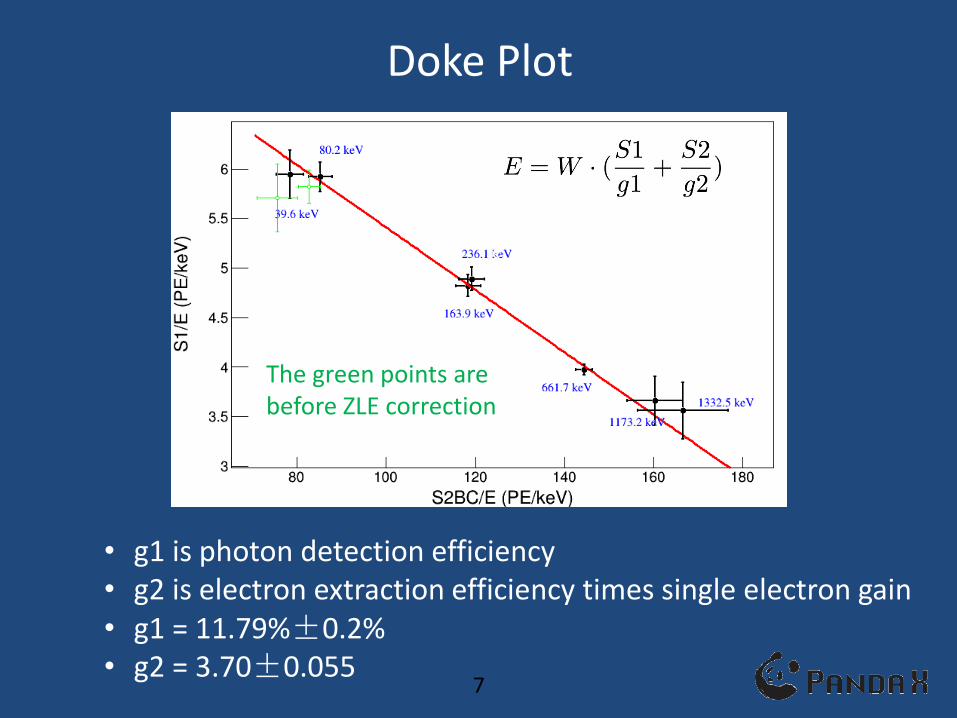
Doke Plot
𝑒 =
• g1 is photon detection efficiency • g2 is electron extraction efficiency times single electron gain • g1 = 11.79%±0.2% • g2 = 3.70±0.055
The The green points are before ZLE correction
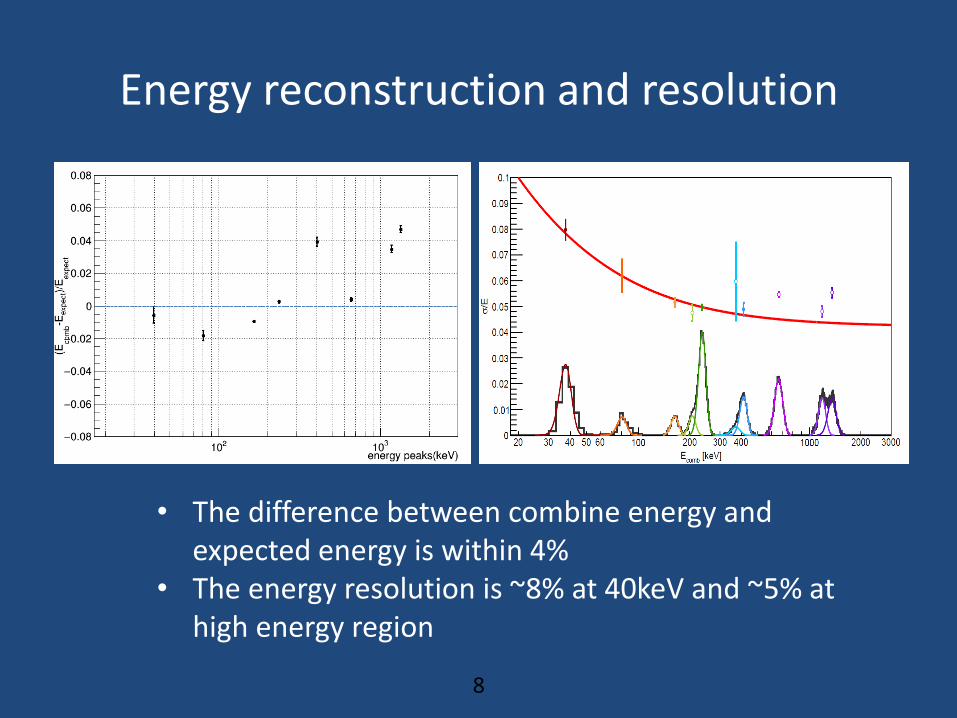
Energy reconstruction and resolution
8
• The difference between combine energy and expected energy is within 4%
• The energy resolution is ~8% at 40keV and ~5% at high energy region
9
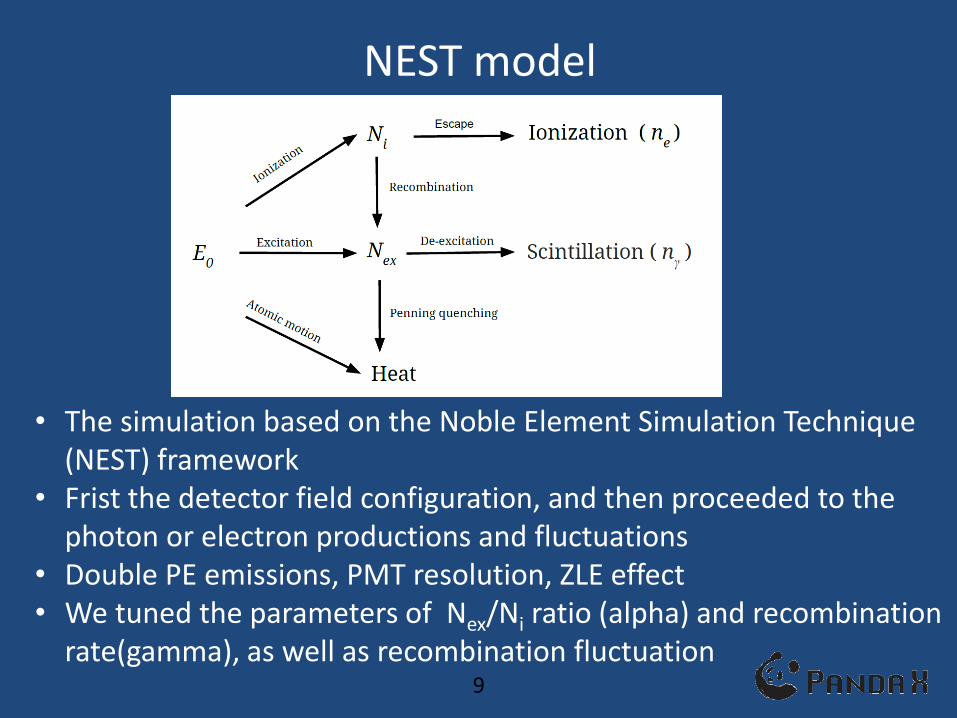
NEST model
• The simulation based on the Noble Element Simulation Technique (NEST) framework
• Frist the detector field configuration, and then proceeded to the photon or electron productions and fluctuations
• Double PE emissions, PMT resolution, ZLE effect • We tuned the parameters of Nex/Ni ratio (alpha) and recombination
rate(gamma), as well as recombination fluctuation
10
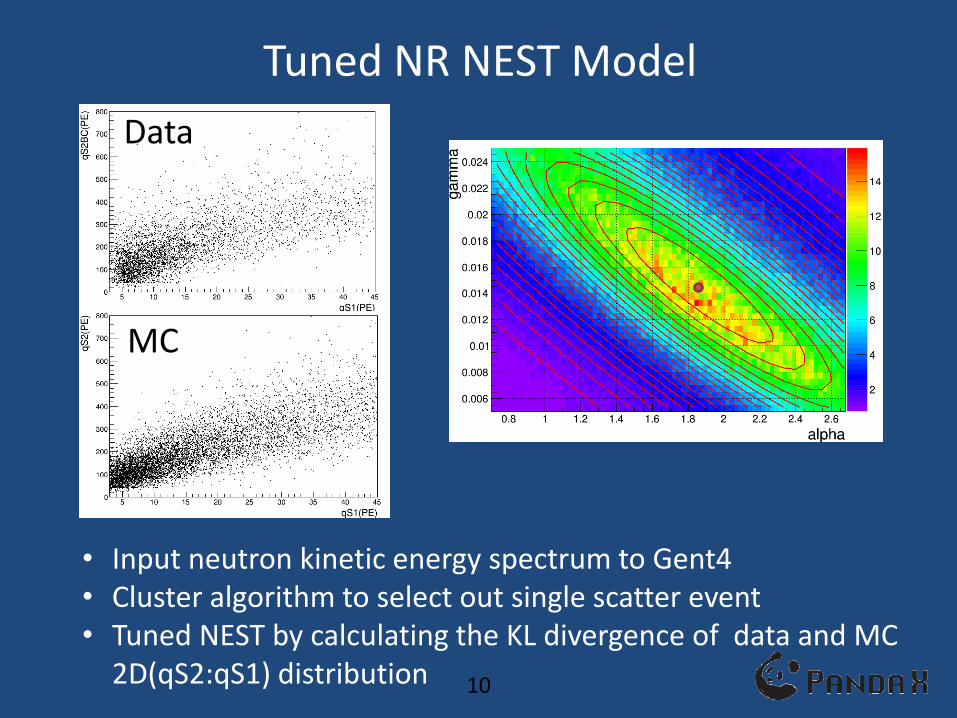
Tuned NR NEST Model
• Input neutron kinetic energy spectrum to Gent4 • Cluster algorithm to select out single scatter event • Tuned NEST by calculating the KL divergence of data and MC
2D(qS2:qS1) distribution
Data
MC
11
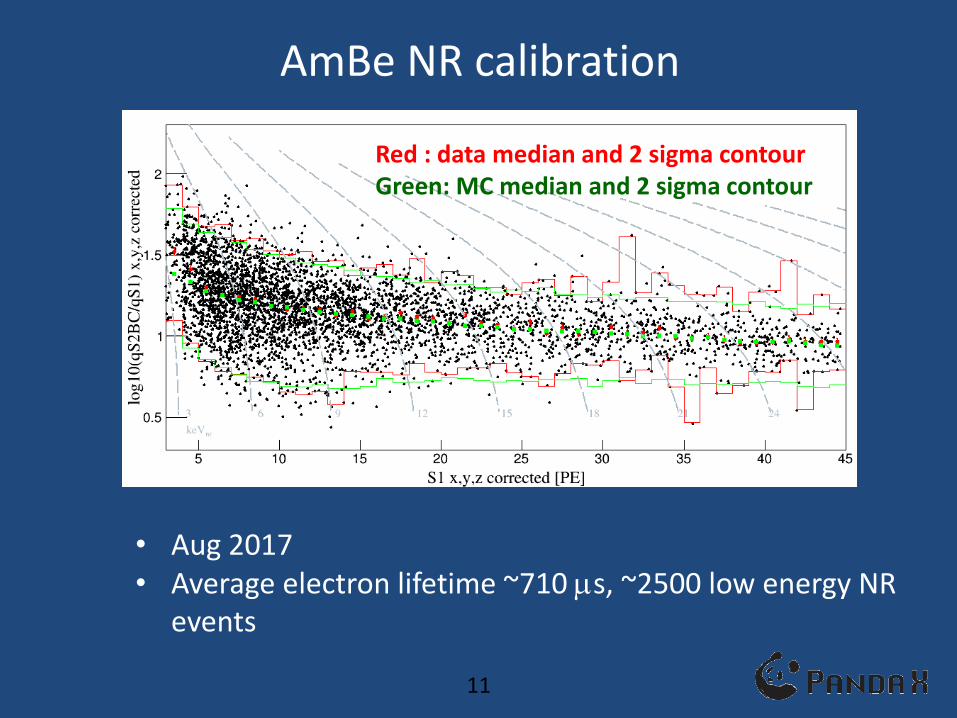
AmBe NR calibration
Red : data median and 2 sigma contour Green: MC median and 2 sigma contour
• Aug 2017 • Average electron lifetime ~710 s, ~2500 low energy NR
events
12
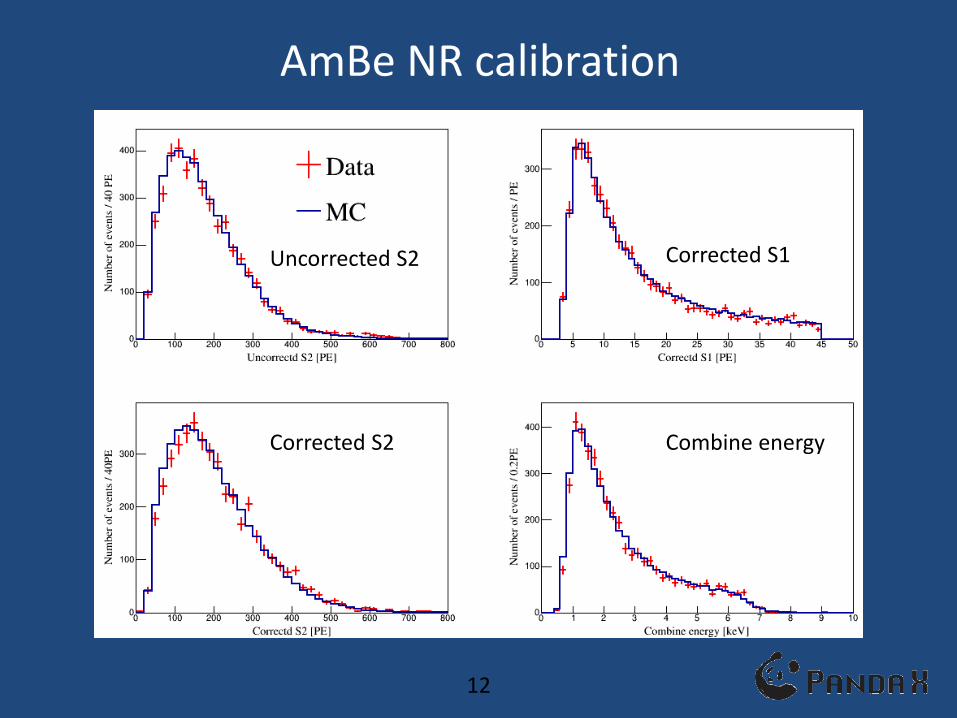
AmBe NR calibration
Uncorrected S2 Corrected S1
Corrected S2 Combine energy
13
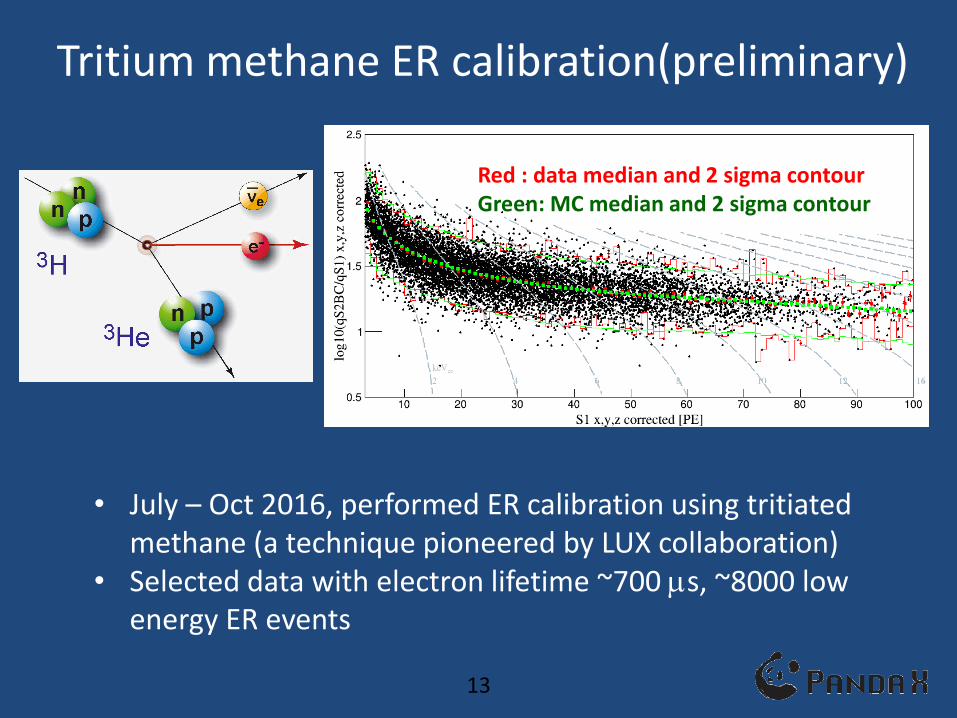
Tritium methane ER calibration(preliminary)
Red : data median and 2 sigma contour Green: MC median and 2 sigma contour
• July – Oct 2016, performed ER calibration using tritiated methane (a technique pioneered by LUX collaboration)
• Selected data with electron lifetime ~700 s, ~8000 low energy ER events
14
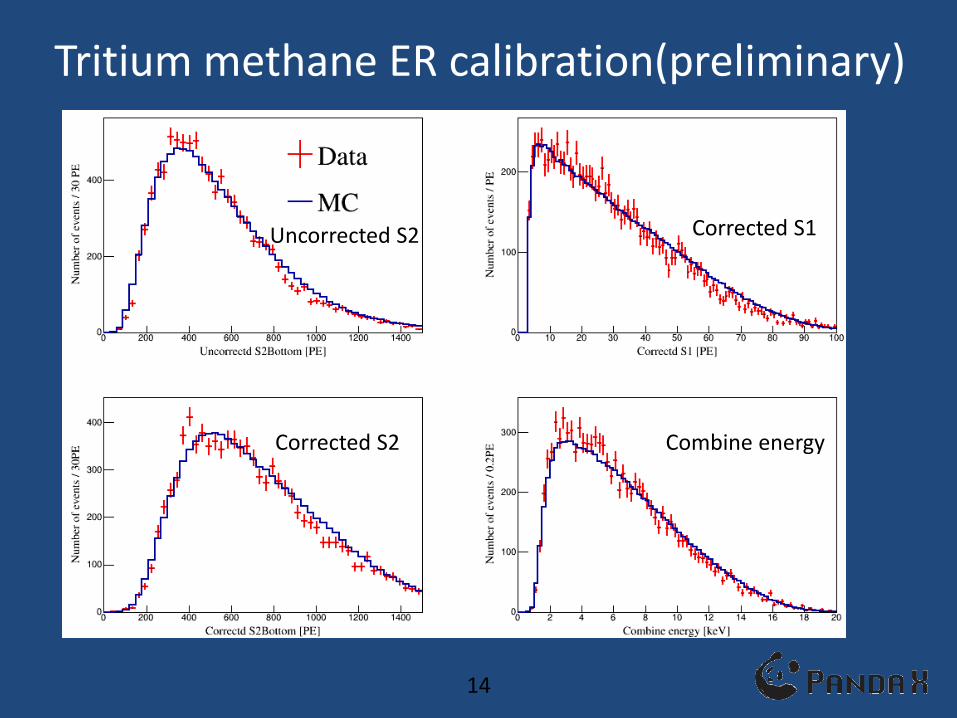
Tritium methane ER calibration(preliminary)
Uncorrected S2 Corrected S1
Corrected S2 Combine energy
15
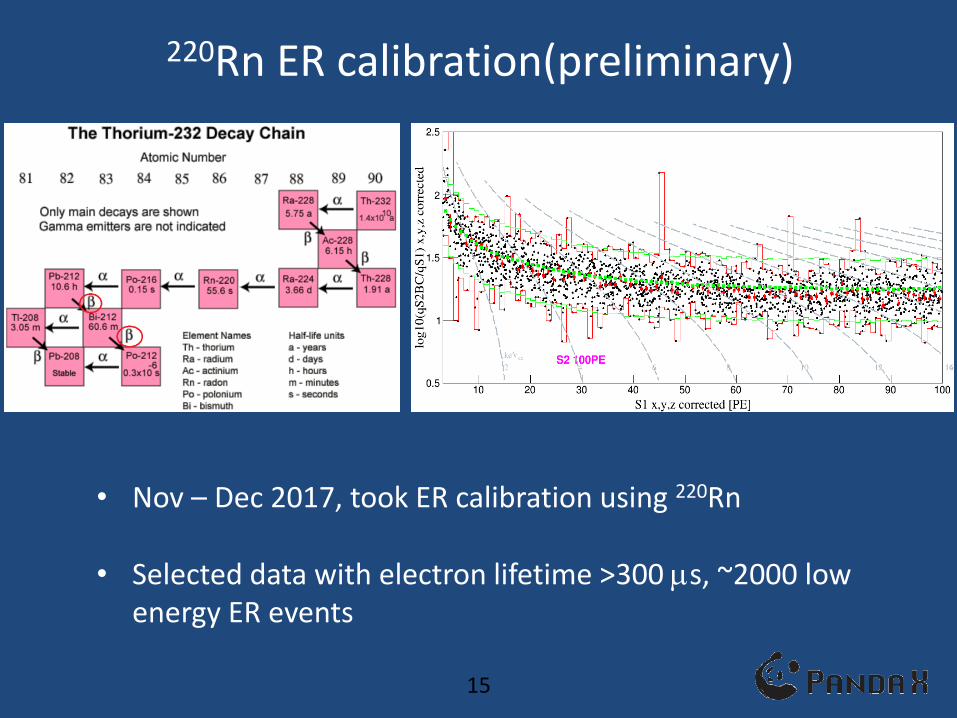
220Rn ER calibration(preliminary)
• Nov – Dec 2017, took ER calibration using 220Rn
• Selected data with electron lifetime >300 s, ~2000 low energy ER events
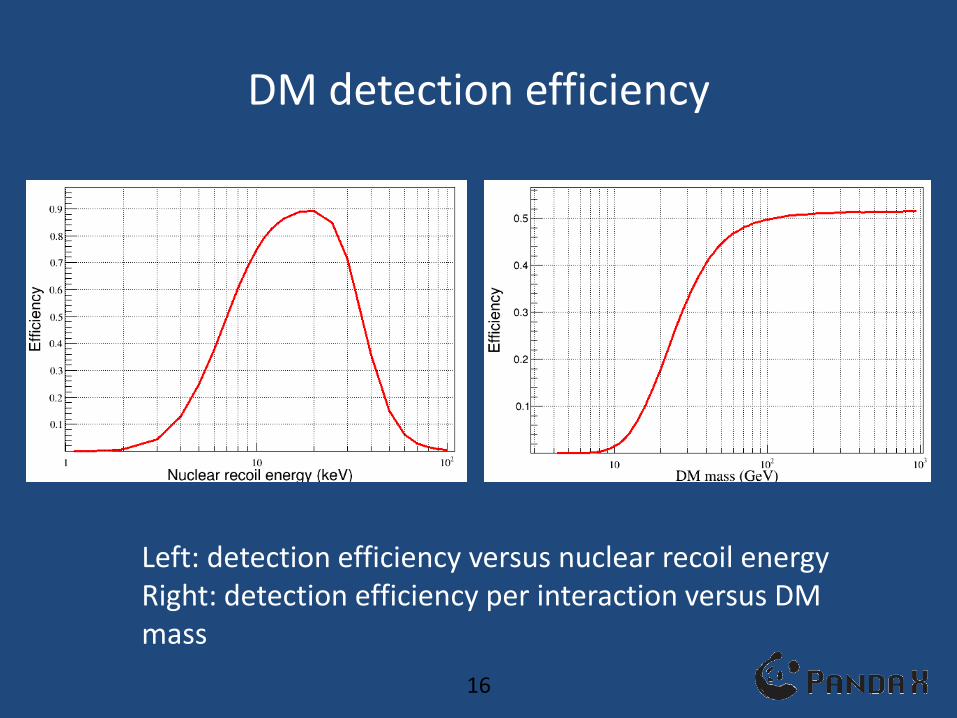
DM detection efficiency
16
Left: detection efficiency versus nuclear recoil energy Right: detection efficiency per interaction versus DM mass


![Calibration [Compatibility Mode]](https://static.fdocument.pub/doc/165x107/55cf8e0c550346703b8df7ca/calibration-compatibility-mode.jpg)


