Učinci askorbinske kiseline na matične stanice osteosarkoma
41
Učinci askorbinske kiseline na matične stanice osteosarkoma Skube, Karlo Master's thesis / Diplomski rad 2018 Degree Grantor / Ustanova koja je dodijelila akademski / stručni stupanj: University of Zagreb, Faculty of Science / Sveučilište u Zagrebu, Prirodoslovno-matematički fakultet Permanent link / Trajna poveznica: https://urn.nsk.hr/urn:nbn:hr:217:264434 Rights / Prava: In copyright Download date / Datum preuzimanja: 2021-10-15 Repository / Repozitorij: Repository of Faculty of Science - University of Zagreb
Transcript of Učinci askorbinske kiseline na matične stanice osteosarkoma
Učinci askorbinske kiseline na matične staniceosteosarkoma
Skube, Karlo
Master's thesis / Diplomski rad
2018
Degree Grantor / Ustanova koja je dodijelila akademski / stručni stupanj: University of Zagreb, Faculty of Science / Sveučilište u Zagrebu, Prirodoslovno-matematički fakultet
Permanent link / Trajna poveznica: https://urn.nsk.hr/urn:nbn:hr:217:264434
Rights / Prava: In copyright
Download date / Datum preuzimanja: 2021-10-15
Repository / Repozitorij:
Repository of Faculty of Science - University of Zagreb
University of Zagreb
Faculty of Science
Department of Biology
Karlo Skube
The effects of ascorbic acid on osteosarcoma stem cells.
Učinci askorbinske kiseline na matične stanice osteosarkoma.
Graduation thesis
Zagreb, 2018

This research is performed at Division of Molecular Biology of Faculty of Science, University of Zagreb,
under the supervision of Inga Marijanović, PhD, Assist. Prof. Thesis is submitted on evaluation to Department
of Biology of Faculty of Science, University of Zagreb in order to acquire the academic title of Master of
molecular biology.
I would like to thank my mentors. Inga, Maja, Kate and Majica. Thank you for guiding me through the last
year. You were my second family. I can only hope to work with people like you one day.
I particularly want to thank my parents, Branka and Zoran, my sister Lea and my grandma Tajica. Your
unconditional love and support throughout my life helped me learn true values in life. You made me a better
person and without you, none of this would be possible. I love you.
I thank my friends. Ana, Helena, Margi and Martina. I’ve known you for 17 years and you’ve always been
here. Thanks for sticking around. To my molecool girls, Adri, Ana, Anja, Lea, Luce and Viki. We made it. We
survived. To my Spanish crew, Dora, Juran and Lucija for having the best semester of our lives.
Special thanks to Bianca Abreu, Julia Kee and Nina Yao whom I’ve met in Madrid, had kremšnitas in
Samobor, ate steak in New York City and took a swim in the ocean in East Hamptons. You are an
inspiration.
TEMELJNA DOKUMENTACIJSKA KARTICA
Sveučilište u Zagrebu
Prirodoslovno - matematički fakultet
Biološki odsjek Diplomski rad
UČINCI ASKORBINSKE KISELINE NA MATIČNE STANICE OSTEOSARKOMA
Karlo Skube
Rooseveltov trg 6, 10 000 Zagreb, Hrvatska
Matične stanice raka su stanice raka koje imaju karakteristike zdravih matičnih stanica u ljudskom organizmu.
Mogućnost samoobnavljanja i diferencijacije u različite tipove stanica osiguravaju im tumorigenost, dok niska
stopa proliferacije uz aktivne membranske pumpe i enzime popravka osigurava otpornost na konvencionalne
kemoterapeutike. Njihova prisutnost je dokazana u osteosarkomima te se mogu izdvojiti iz tumorske mase na
osnovi sposobnosti rasta u sferama - sarkosferama. S obzirom da se radi o izuzetno malignim tumorima, razvoj
specifičnih terapija koje ciljaju tu populaciju stanica neophodan je za poboljšanje preživljenja pacijenata. S
obzirom na njihove mehanizme otpornosti teško ih je selektivno ciljati. Ovim istraživanjem ispitan je utjecaj
askorbinske kiseline na matične stanice osteosarkoma te njezina selektivnost u ovisnosti o koncentraciji
askorbinske kiseline te broju i porijeklu stanica. Djelovanje askorbinske kiseline utvrdili smo testovima
vijabilnosti, esejom inhibicije rasta sarkosfera, protočnim citometrom, western blotom i mjerenjem razine
reaktivnih kisikovih vrsta. Zaključno, askorbinska kiselina uzrokuje apoptozu te je njena letalna koncentracija
ovisna o broju matičnih stanica osteosarkoma. Također, razina GAPDH proteina je nedetektibilna što ukazuje
na inhibiciju glikolize. Razina reaktivnih kisikovih vrsta povišena je kod stanica tretiranih askorbinskom
kiselinom te se može zaključiti da djeluje kao oksidans.
(32 stranice, 11 slika, 38 literaturnih navoda, jezik izvornika: engleski)
Rad je pohranjen u Središnjoj biološkoj knjižnici.
Ključne riječi: sarkosfere, vijabilnost, GAPDH, tumor, glikoliza
Voditelj: doc. dr. sc. Inga Marijanović
Neposredni voditelj: dr. sc. Maja Antunović
Ocjenitelji: doc. dr. sc. Inga Marijanović, doc. dr. sc. Ivan Radosavljević, izv. prof. dr. sc. Damjan
Franjević
Rad prihvaćen: 8.1.2018.
BASIC DOCUMENTATION CARD
University of Zagreb
Faculty of Science
Division of Biology Graduation thesis
THE EFFECTS OF ASCORBIC ACID ON OSTEOSARCOMA STEM CELLS
Karlo Skube
Rooseveltov trg 6, 10 000 Zagreb, Croatia
Cancer stem cells are cancer cells that have the characteristics of healthy stem cells in the human body. The
possibility of self-replication and differentiation in different cell types ensures their tumorigenicity while low
proliferation rates with active membrane pumps and repair enzymes provide resistance to conventional
chemotherapy. Their presence is proven in osteosarcoma and can be extracted from tumor mass based on the
ability to grow in spheres - sarcospheres. Given that it is an extremely malignant tumor, the development of
specific therapies targeting that population of cells is necessary to improve patient survival. Due to their
resistance mechanisms, it is difficult to selectively target them. This study investigated the effect of ascorbic
acid on osteosarcoma stem cells and its selectivity depending on the concentration of ascorbic acid and the
number and origin of cells. The effects of ascorbic acid have been determined by viability tests, sarcosphere
growth inhibition assays, flow cytometry, western blot and measurement of reactive oxygen species. In
conclusion, ascorbic acid causes apoptosis and its lethal concentration is dependent on the number of
osteosarcoma stem cells. Also, the level of GAPDH protein is undetectable, which suggests that ascorbic acid
inhibits the pathway of glycolysis. The level of reactive oxygen species is increased in cells treated with
ascorbic acid and it can be concluded that it acts as an oxidant.
(32 pages, 11 figures, 38 references, original in English)
Thesis archived in the Central Biological Library.
Keywords: sarcospheres, viability, GAPDH, tumor, glycolysis
Supervisor: Inga Marijanović, Asst. Prof.
Assistant Supervisor: Maja Antunović, PhD
Reviewers: Inga Marijanović, Asst. Prof., Ivan Radosavljević, Asst. Prof., Damjan Franjević, Assoc.
Prof.
Thesis accepted: January 8th, 2018
Table of Contents
1. INTRODUCTION ..................................................................................................................... 1
1.1. Osteosarcoma ................................................................................................................................... 1 1.1.1. Etiology ............................................................................................................................................ 1 1.1.2. Treatment ......................................................................................................................................... 2
1.2. Cancer Stem Cells ........................................................................................................................... 2 1.2.1. Stochastic versus CSC theory .......................................................................................................... 3 1.2.2. Therapeutic targets ........................................................................................................................... 4 1.2.3. Metabolism as a target ..................................................................................................................... 5
1.3. Ascorbic acid and cancer ................................................................................................................ 6
2. OBJECTIVE OF THE STUDY ................................................................................................ 8
3. MATERIALS AND METHODS .............................................................................................. 9
3.1. Sarcosphere formation assay .......................................................................................................... 9 3.2. Sarcosphere isolation and adhesion ............................................................................................... 9 3.3. MTT viability assay ......................................................................................................................... 9 3.4. Sarcosphere inhibition assay ........................................................................................................ 10 3.5. Western blot analysis of GAPDH expression .............................................................................. 10
3.5.1. Cell seeding and treatment ............................................................................................................. 10 3.5.2. Cell lysis and protein isolation ....................................................................................................... 11 3.5.3. Bicinchoninic acid (BCA) assay for determination of protein concentration ................................ 11 3.5.4. Protein separation by polyacrylamide gel electrophoresis (PAGE) and protein transfer .............. 11 3.5.5. Antibody incubation and detection ................................................................................................ 12 3.5.6. Membrane stripping ....................................................................................................................... 13
3.6. Detection of reactive oxygen species by DCFH-DA assay ......................................................... 13 3.7. Determination of cell death type by Annexin V and PI assay ................................................... 14
4. RESULTS ................................................................................................................................. 15
4.1. Sarcosphere formation and adhesion .......................................................................................... 15 4.2. Ascorbic acid effect on cell viability ............................................................................................. 17 4.3. Sarcosphere growth inhibition in the presence of AA ............................................................... 20 4.4. Effects of AA on glycolytic cycle .................................................................................................. 21 4.5. Determination of cell death type .................................................................................................. 22 4.6. The effects of AA on redox state of OS-CSCs ............................................................................. 24
5. DISCUSSION ........................................................................................................................... 25

6. CONCLUSION ........................................................................................................................ 28
7. REFERENCES ......................................................................................................................... 29
1
1. INTRODUCTION 1.1. Osteosarcoma
Osteosarcoma is a malignant tumor of mesenchymal origin. Immature osteoid, which
is the non-mineralized, organic portion of the bone matrix, is produced by the tumor cells. The
occurrence of osteosarcoma is bimodal. It is being found predominantly in children and young
adults and in elderly individuals which makes it the most common primary sarcoma. Depending
on the degree of aggressiveness, there are several different types of osteosarcoma. Most of the
patients, 80% of them, have micro-metastatic or metastatic disease at diagnosis which makes
the treatment strategies very similar among them. Therapies are consisting of multiagent
chemotherapy in addition to surgical removal of the affected area. The number of amputations
has decreased significantly with the advances in surgical treatment. Since the description of
osteosarcoma in 1800’s until today, the prognosis for patients has improved from less than 30%
survival rate to more than 70%. Considering the anatomic location of osteosarcoma, it seems it
has a preference for the metaphyseal part of the long bones (Peabody & Attar, 2014).
1.1.1. Etiology
The problem with osteosarcoma is that it’s true etiology is unknown. It is considered to
be multifactorial and while some sarcomas have demonstrated consistent chromosomal
translocations or abnormalities, the majority of osteosarcomas are aneuploid (Kansara &
Thomas, 2007). Ottaviani & Jaffe (2002) did a clinical and pathologic study of brother and
sister with osteosarcoma and concluded that there seems to be a molecular basis for the
development of osteosarcoma. For example, Hansen et al. showed that RB gene who regulates
the transition between G0/G1 and S phase of the cell cycle increased the risk of osteosarcoma
for 500 times. Wadayama et al. (1994) detected mutations in RB1 gene in sporadic cases of
osteosarcoma. Other mutations that can predispose a person to develop osteosarcoma include
inactivation of the p53 tumor suppressor, MDM2, p14ART and CDK4 (Kansara & Thomas,
2007). Wang reported that DNA helicase abnormalities caused by mutations in RECQL2,
RECQL3, and RECQL4 have also been associated with osteosarcoma. On the other hand,
osteosarcoma can be environmentally caused and the most common cause is ionizing radiation
(Peabody & Attar, 2014).

2
1.1.2. Treatment
Before the 1970s the outcome for patients with osteosarcoma was not so bright. Only
about 20% of affected people had a 5-year survival rate. With the discovery of methotrexate
(MTX) survival rates have improved significantly, up to 65%. MTX is antifolate which means
it functions as a folic acid antagonist. It suppresses dihydrofolate reductase (DHFR) whose role
is to catalyze tetrahydrofolate synthesis and therefore inhibits the synthesis of RNA, DNA and
proteins (Friedman & Carter, 1972; Goorin et al., 1987; Sutow, 1980). Today, there is no
singular regimen for osteosarcoma. Agents that are most commonly used include MTX,
doxorubicin, cisplatin and ifosfamide. Also, other agents include vincristine, bleomycin and
cyclophosphamide (Maki, 2012).
Effectiveness of the chemotherapy is highly dependent on the surgical restriction of the
tumor as well as the reconstruction of the resulting anatomical defect. Wide excisions are
becoming more and more popular because they keep the local disease controlled in 95% of the
time and decrease recurrence possibility. They are used when there is no threat to neurovascular
structures (Bacci et al., 2006).
1.2. Cancer Stem Cells Stem cells, cancer or not, have two main properties. One of them being the ability to
self-renew and the second one, the ability to give rise to progenitors of differentiated cell types
of one or more lineages. The self-renewal feature rises two proposals that are important to stem
cell carcinogenesis. The first one states that the self-renewal property increases the
opportunities for cancer to accumulate more carcinogenic changes, while the second one
suggests that altered self-renewal regulation directly underlies carcinogenesis. Being able to
self-renew gives cells enough time to accumulate mutations and pass them to daughter cells.
Losing the balance between self-renewal and differentiation can lead to unregulated self-
renewal which is a hallmark of cancer. On the other hand, Takahashi et al. (2007) showed that
differentiated cells can undergo the mutation that reactivates a self-renewing program and in
that way cause cancer. These proposals are supported by the identification of cancer stem cells
- a very small population of cells within a tumor with the ability to self-renew and give rise to
all cell types found in a tumor and therefore cause tumor recurrence. That ability makes them
tumorigenic or tumor-forming, in contrast to other non-tumorigenic cancer cells. Metabolism
in CSCs is altered as well and can be used as a therapeutic target. CSCs switch mainly to aerobic

3
glycolysis (Pecorino, 2012). Markers specific for healthy stem cells are used for identification
of CSCs. Markers that showed good results in isolating CSC-enriched populations are CD133,
CD44, CD24, THY1, ABCB5 and CD200 (Al-Hajj et al., 2003). CSCs can be identified by
other methods as well. Fluorescence-activated cell sorting (FACS) is used to identify CSCs by
fluorescently bound antibodies that are directed on cell markers. Hoechst dye is removed from
CSCs by ATP-binding cassette (ABC) transporters and is used as well for identification of
CSCs. Sphere formation is the ability of CSCs to grow in non-adherent conditions and these
assays are used to isolate CSCs from other cancer cells (Nicolis, 2007).
1.2.1. Stochastic versus CSC theory
Anti-cancer therapy has been directed by stochastic, or clonal evolution, theory for
decades (Fig. 1). It states that at least five mutations are needed to occur in healthy somatic cells
for them to gain cancer phenotype such as enhanced proliferation, reduced capacity to undergo
apoptosis and inhibition of differentiation (Hanahan, 2011). The drawback of this theory is that
somatic cells have limited lifespan and it would be almost impossible for them to acquire all
Figure 1. Stochastic theory of cancer development states that each cell in tumor has similar
tumorigenic capacity. A - transformation of normal cell into tumor cell (red). B - cancer cell
proliferates and produces clones, but because of genetic instability produces various other clones.
C - a selective pressure such as hypoxia or chemotherapy eliminates badly adapted clones. D -
additional selection gives rise to new cancer cells (Clone 6) with aggressive phenotype and ability
to metastasize. Adapted from Wang et al., 2015.
4
the necessary mutations for them to become cancer cells. The explanation of this could be that
the first mutation that hits the cell is the one that gives the cell the ability to be immortal
(Tomasetti et al., 2013). Following this leads to the conclusion that every viable tumor cell has
the same capability of forming a new tumor. This, on the other hand, contradicts the well-known
fact that it usually takes more than 10 000 cancer cells to initiate tumor in immunocompromised
mice. This led to new ideas proposed by the CSC theory (Wang et al., 2015).
1.2.2. Therapeutic targets
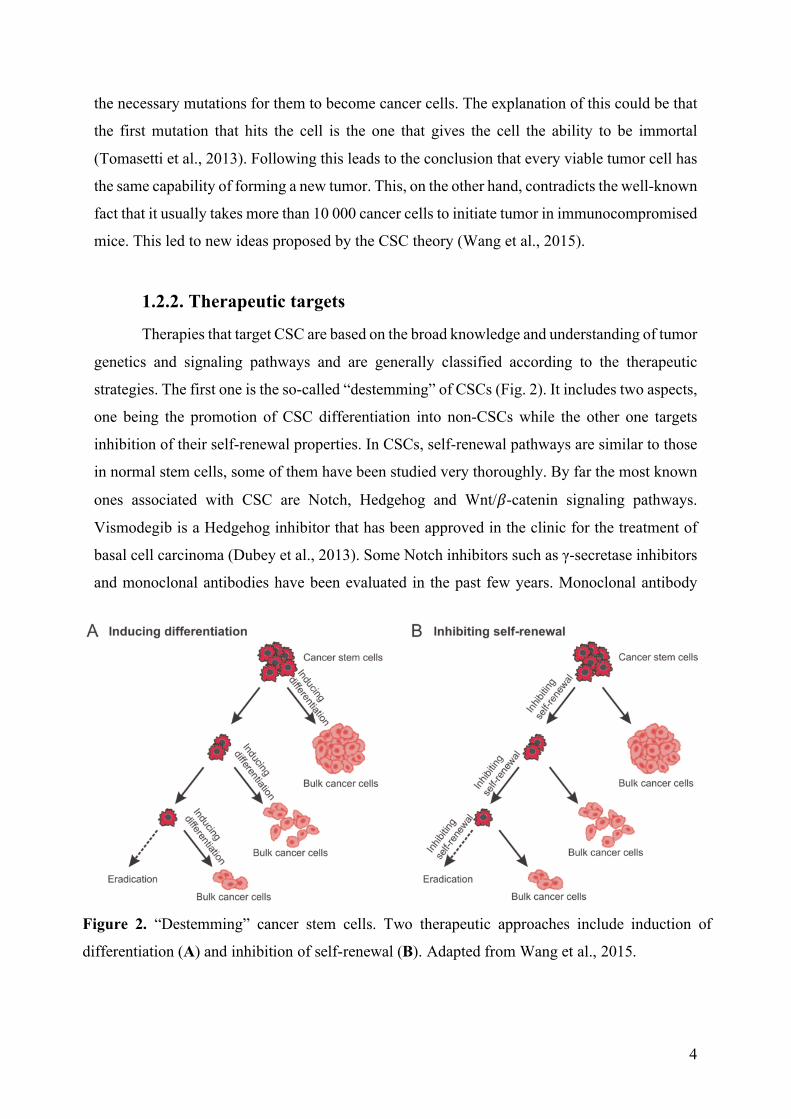
Therapies that target CSC are based on the broad knowledge and understanding of tumor
genetics and signaling pathways and are generally classified according to the therapeutic
strategies. The first one is the so-called “destemming” of CSCs (Fig. 2). It includes two aspects,
one being the promotion of CSC differentiation into non-CSCs while the other one targets
inhibition of their self-renewal properties. In CSCs, self-renewal pathways are similar to those
in normal stem cells, some of them have been studied very thoroughly. By far the most known
ones associated with CSC are Notch, Hedgehog and Wnt/𝛽-catenin signaling pathways.
Vismodegib is a Hedgehog inhibitor that has been approved in the clinic for the treatment of
basal cell carcinoma (Dubey et al., 2013). Some Notch inhibitors such as γ-secretase inhibitors
and monoclonal antibodies have been evaluated in the past few years. Monoclonal antibody
Figure 2. “Destemming” cancer stem cells. Two therapeutic approaches include induction of
differentiation (A) and inhibition of self-renewal (B). Adapted from Wang et al., 2015.
5
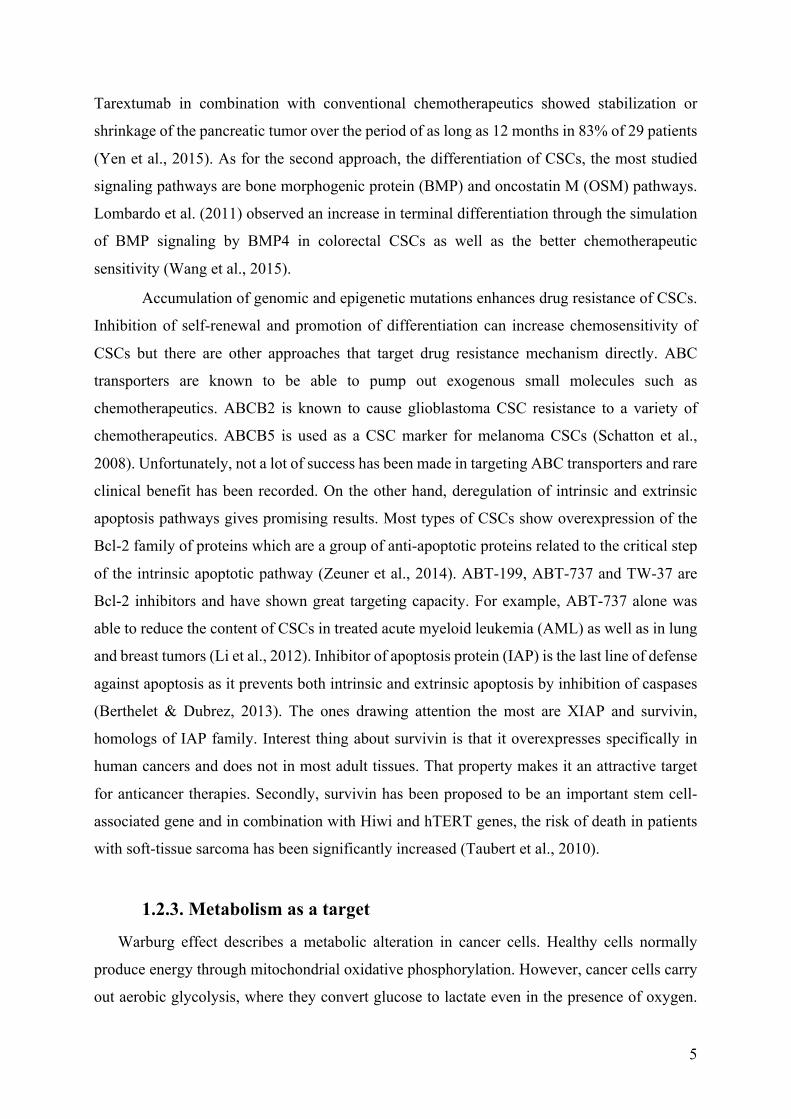
Tarextumab in combination with conventional chemotherapeutics showed stabilization or
shrinkage of the pancreatic tumor over the period of as long as 12 months in 83% of 29 patients
(Yen et al., 2015). As for the second approach, the differentiation of CSCs, the most studied
signaling pathways are bone morphogenic protein (BMP) and oncostatin M (OSM) pathways.
Lombardo et al. (2011) observed an increase in terminal differentiation through the simulation
of BMP signaling by BMP4 in colorectal CSCs as well as the better chemotherapeutic
sensitivity (Wang et al., 2015).
Accumulation of genomic and epigenetic mutations enhances drug resistance of CSCs.
Inhibition of self-renewal and promotion of differentiation can increase chemosensitivity of
CSCs but there are other approaches that target drug resistance mechanism directly. ABC
transporters are known to be able to pump out exogenous small molecules such as
chemotherapeutics. ABCB2 is known to cause glioblastoma CSC resistance to a variety of
chemotherapeutics. ABCB5 is used as a CSC marker for melanoma CSCs (Schatton et al.,
2008). Unfortunately, not a lot of success has been made in targeting ABC transporters and rare
clinical benefit has been recorded. On the other hand, deregulation of intrinsic and extrinsic
apoptosis pathways gives promising results. Most types of CSCs show overexpression of the
Bcl-2 family of proteins which are a group of anti-apoptotic proteins related to the critical step
of the intrinsic apoptotic pathway (Zeuner et al., 2014). ABT-199, ABT-737 and TW-37 are
Bcl-2 inhibitors and have shown great targeting capacity. For example, ABT-737 alone was
able to reduce the content of CSCs in treated acute myeloid leukemia (AML) as well as in lung
and breast tumors (Li et al., 2012). Inhibitor of apoptosis protein (IAP) is the last line of defense
against apoptosis as it prevents both intrinsic and extrinsic apoptosis by inhibition of caspases
(Berthelet & Dubrez, 2013). The ones drawing attention the most are XIAP and survivin,
homologs of IAP family. Interest thing about survivin is that it overexpresses specifically in
human cancers and does not in most adult tissues. That property makes it an attractive target
for anticancer therapies. Secondly, survivin has been proposed to be an important stem cell-
associated gene and in combination with Hiwi and hTERT genes, the risk of death in patients
with soft-tissue sarcoma has been significantly increased (Taubert et al., 2010).
1.2.3. Metabolism as a target
Warburg effect describes a metabolic alteration in cancer cells. Healthy cells normally
produce energy through mitochondrial oxidative phosphorylation. However, cancer cells carry
out aerobic glycolysis, where they convert glucose to lactate even in the presence of oxygen.
6
The Warburg effect has been studied, but it’s true nature still remains unknown.
Reprogramming energy metabolism is one of the hallmarks of cancer and 60-90% of tumors
switch to glycolysis. It is proposed that the metabolism of cancer cells resembles the
metabolism of proliferating cells. Some think that the shift is time-dependent, while the others
suggest it may be cell-type-dependent as they both cancer cells and proliferating cells need to
adapt to the anabolic need for proliferation. Knowing this, glycolysis is a popular target for
blocking the main energy metabolism pathway in tumor cells. There is evidence that response
to hypoxia via AMP-activated protein kinase (AMPK) contributes to altered metabolism.
AMPK senses the increased levels of AMP and decreased levels of ATP which is a sign of
starvation and hypoxia. AMP binds to the ɣ regulatory subunit of AMPK and uncovers the
phosphorylation site on the α subunit of AMPK. LKB1 phosphorylates the α subunit and thus
activates AMPK. AMPK then acts as a transcriptional factor and inhibits ATP-consuming
pathways and activates ATP-generating pathways such as glucose (Pecorino, 2015).
1.3. Ascorbic acid and cancer Ascorbic acid (AA), L-ascorbic acid or vitamin C is a vitamin found in food and used
as a dietary supplement (Fig 3.). It is absorbed in the body by active transport and simple
diffusion. Hexose transporters GLUT1, GLUT3 and GLUT4 are used for import of
dehydroascorbic acid (DHA) and then it is reduced to ascorbic acid by different enzymatic
systems. Sodium-dependent vitamin C transporters (SVCT1 and SVCT2) are used to transport
ascorbate and are used more than GLUT transporters (Savini et al., 2008). Bonuccelli et al.
(2015) showed that AA acts as a glycolysis inhibitor in CSC. It induces oxidative stress which
inhibits the activity of glyceraldehyde 3-phosphate dehydrogenase (GAPDH), a key glycolytic
enzyme.
Ascorbic acid has been widely used as an antitumor agent but comprehensive clinical
results are still not existing. Mata et al. (2015) did a systematic review of clinical and non-
clinical studies about the role of AA in the prevention and/or treatment of cancer between 2011
and 2015. The study was split into two categories. The first one summed up studies that
described AA as an antioxidant, preventing oxidation which induces apoptosis. Clinical studies
(2) involved different types of cancers and doses of AA from 0.04-10 mM. Non-clinical studies
(10) involved different types of cell lines, one of them being osteosarcoma 143-B cell line. AA
doses ranged from 0.05-4 mM. Mentioned mechanism of action includes decreased levels of C-
reactive protein and proinflammatory cytokines, obstruction of metastases and tumor growth,
7
protection against lung injury induced by smoking by inhibiting the expression of cyclin D1,
decreased the production of reactive oxygen species and limitation of the invasive potential.
The second category consists of studies that describe AA as pro-oxidant. High concentrations
of AA may increase the production of adenosine triphosphate (ATP) inducing apoptosis. Only
one of these is a clinical study on patients with metastatic pancreatic cancer. They were treated
with 0.28, 0.34 and 0.56 mM doses of AA and decrease in tumor size has been reported.
Regarding the non-clinical studies (17), different cell lines were used and AA concentrations
ranging from 5 µM to 28.39 mM. Low, micromolar, concentration of AA was able to kill cell
lines in vitro, while in vivo it generated hydrogen peroxide, superoxide radicals and
extracellular ascorbyl that are responsible for its cytotoxic activity. Interestingly, concentrations
as high as 20 mM did not harm non-malignant cells. Regarding the mechanisms of action,
increased levels of H2O2 were reported, as well as interference with cell cycle (G0/G1),
decreased cell growth, induction of apoptosis, aponecrosis and autophagy and increased
expression of p53.
To summarize, AA can act as both reducing and oxidizing agent, depending on the
concentration and the environment in which the vitamin is present. At lower concentrations,
ascorbic acid displays antioxidant properties, while at higher concentrations it induces
apoptosis in malignant cell lines via its pro-oxidant action (González et al., 2010). The specific
mechanism still remains unclear. This study will examine the effects of ascorbic acid on OS-
CSCs and try to propose a possible mechanism.
Figure 3. Atomic structure of ascorbic acid
8
2. OBJECTIVE OF THE STUDY
The primary goal of this study is to find a way to eliminate osteosarcoma cancer stem
cells (OS-CSCs). Their ability to self-renew and differentiate into different types of malignant
cells ensures them tumorigenicity while the low proliferative rate, active pumps and DNA repair
enzymes makes them resistant to conventional chemotherapeutics. There is controversial data
considering the effects of ascorbic acid on prevention and treatment of tumors and based on
differences in metabolic pathways between healthy cells and tumor stem cells we hypothesize
that the effect of ascorbic acid could be lethal to tumor stem cells.
The specific goals of this research are:
๏ To expand isolated osteosarcoma stem cells from patient’s tumor in vitro as adherent
culture and as sarcospheres
๏ To test the effect of ascorbic acid on viability of osteosarcoma stem cells and
determine the IC50 value by 3-(4,5-dimethylthiazol-2-yl)-2,5-diphenyltetrazolium
bromide (MTT) assay
๏ To test if osteosarcoma stem cells grown in low attachment conditions are susceptible
to ascorbic acid and if they will be able to form sarcospheres
๏ To test which type of cell death is triggered by ascorbic acid by flow cytometry
๏ To analyze the mechanism of cell death induction
๏ To test if ascorbic acid changes the redox state of the OS-CSCs
9
3. MATERIALS AND METHODS 3.1. Sarcosphere formation assay
Cells used were previously isolated from patient’s tumor and grown in growth medium
(GM, 10% FBS, 1% Pen/Strep in F12/HAM). The medium is removed by aspiration.
Osteosarcoma stem cells were washed with phosphate buffer saline, (PBS, Gibco). 3 mL of
trypsin-EDTA (Sigma) was added to each plate. A plate was shaken gently and trypsin was
immediately removed by aspiration. The process was repeated. Cells were incubated for 4
minutes at 37 ºC, 5% CO2 (Panasonic). Trypsin reaction was stopped by adding 10 mL of
growth medium (GM, 10% fetal bovine serum (FBS, Gibco), 1% Penicillin/Streptomycin
(Lonza) in F12/HAM (Biological Industries)). Cells were counted using the hemocytometer.
Methyl-cellulose (MC, 2% in miliQ-H2O, Sigma) was prepared 3 days in advance and stirred
for 2 days at 4 ºC and autoclaved. Sarcosphere growth medium was prepared (SGM, 20%
knockout serum replacement Gibco, 1% Pen/Strep, 0.01% EGF (Gibco), 0.01% bFGF (Gibco)
in F12/HAM). MC and SGM were combined in the equal ratio to the final concentration of 1%
MC. 40 000 cells/well were seeded in 6-well ultra-low attachment plates in 5 mL of MC-SGM.
Every three days growth factors were added to the final concentration of 10 ng/mL. Sarcosphere
formation was recorded by photography in the period of 31 days.
3.2. Sarcosphere isolation and adhesion After 31 days of sarcosphere growth, they were isolated and seeded under adherent
conditions to form a monolayer. GM was prepared. Sarcospheres were transferred into 40 µm
nylon cell strainers (Thermo Fisher Scientific, USA) and MC-SGM was left to drip off using
only gravitational force. Wells were washed 2 times with 5 mL of GM which was transferred
to cell strainers as well. Cell strainer was washed with extra 10 mL of GM to wash away all
single cells that remained. Cell strainer was transferred to a petri dish, rotated for 180º, washed
with 10 mL of GM and gently shaken to release the sarcospheres into the petri dish. Cell strainer
was observed under the microscope to make sure all the sarcospheres were transferred. Cells
were incubated at 37 ºC and 5% CO2.
3.3. MTT viability assay Cells were seeded on the 96-well plate at the cell density of 0.25 x 10⁴ cells/well in stem
cell growth medium (SCGM, 10% FBS 1% Pen/Strep, 0.01% bFGF). After 24 hours cells were
10
treated with ascorbic acid (AA) in a concentration ranging from 2.5 µg/mL to 55 µg/mL in
quadruplicates. Control cells had their medium refreshed without the addition of AA. Cells
were incubated for 72 hours at 37 ºC and 5% CO2. After incubation, the medium was removed
by aspiration and 40 µL of 1x MTT (Sigma) was added to each well and cells were incubated
for 3.5 h at 37 ºC and 5% CO2. After MTT incubation, 170 µL of dimethyl sulfoxide (DMSO,
Roth) was added to each well and incubated at 37 ºC for 30 minutes. After the dissolution of
formazan in DMSO, the intensity of purple color was measured on GloMax microplate reader
(Promega), λ = 560 nm. Inhibition concentration where 50% of the cells are dead (IC50) was
calculated. The same procedure was done with HEK293, hMSC and U2OS cell lines. To test
the effects of AA depending on cell density, the experiment was carried out one more time with
seeding densities of 0.25 x 10⁴, 0.5 x 10⁴ and 1 x 10⁴ cells/well. Concentrations of AA were the
same and only osteosarcoma stem cells were used.
3.4. Sarcosphere inhibition assay One 6-well ultra-low attachment plate was seeded with osteosarcoma stem cells as
described in paragraph 3.1. MTT assay results were used to calculate the amount of AA that
was absorbed by each cell at AA concentration of 30 µg/mL and 40 µg/mL which was 0.0048
µg/cell and 0.192 µg/cell, respectively. Each treatment was done in duplicates and two control
wells were untreated. Cells were incubated at 37 ºC and 5% CO2. Every three days, the
concentrations of AA were replenished and sarcosphere growth progression was photographed.
3.5. Western blot analysis of GAPDH expression
3.5.1. Cell seeding and treatment
Cells were seeded on the 6-well plate at the cell density of 2 x 10⁵ cells/well. Cells in
each well had its own treatment. First, two wells were treated with 30 µg/mL and 40 µg/mL,
respectively. Next two wells were treated with the same concentration of AA as the first two
with added 10 µM of cisplatin (Sigma). The fifth well was treated only with 10 µM cisplatin
while the last one was untreated and used as a control. Cells were incubated at 37 ºC and 5%
CO2.
11
3.5.2. Cell lysis and protein isolation
After 72 hours of incubation, cells were lysed using CellLytic™ M (Sigma, USA)
reagent. The medium from each well was transferred to a different tube, washed with 2 mL of
PBS and transferred as well. 1 mL of trypsin-EDTA solution was added to each well and
incubated for 4 min. Trypsin was neutralized with 1 mL of medium and transferred to tubes.
Wells were once again washed with 2 mL of PBS and transferred to tubes. Tubes were
centrifuged for 10 min at 450 x g (Universal 320R, Hettich) at 4 ºC. The supernatant was
aspirated. In a separate tube, 400 µL of CellLytic™ M reagent was mixed with 4 µL of Protease
Inhibitor Cocktail. 30 µL of CellLytic™ M and Protease Inhibitor Cocktail mix was added to
each pellet, resuspended well, transferred to clean tubes and frozen at -20 ºC. Proteins were
isolated using the freeze-thaw method. Cell lysates are defrosted on the ice, transferred to liquid
nitrogen and defrosted again. The process was repeated three times vortexing the samples each
time before freezing. Tubes were centrifuged 15 min at 20 000 x g at 4 ºC. The supernatant was
transferred to clean tubes.
3.5.3. Bicinchoninic acid (BCA) assay for determination of protein
concentration
BCA assay (Santa Cruz) was used to determine protein concentration in each sample.
Working reagent (WR) volume was calculated based on the number of standards (9) and
samples (six samples times two replicas). Reagent A and B were mixed in 50:1 ratio and kept
in the dark. Standards and samples are diluted 5 times in miliQ water. 10 µL of diluted samples
and 200 µL of WR is added to each well in 96-well plate. Samples are incubated at 37 ºC for
30 min. Color intensity was measured on GloMax microplate reader, λ = 560 nm and protein
concentration was calculated.
3.5.4. Protein separation by polyacrylamide gel electrophoresis
(PAGE) and protein transfer
The volume needed for 5 µg of protein was calculated from the BCA assay. Stock
volume was mixed with the equal amount of protease inhibitor and lysis buffer cocktail. Double
the volume of protein stock of sample buffer was added to the mixture. Total dilution is 4 times.
Samples are incubated at 95 ºC for 5 min in thermoblock (Eppendorf). Samples were chilled on
ice and spun down. Total volume was transferred to the wells. The gel used was Amersham
12
ECL Gel 4-20% with 10 wells (GE Healthcare Life Sciences). 1x running buffer was prepared
by diluting 19 mL of 10x Amersham ECL Gel Running Buffer (GE Healthcare Life Sciences)
in 171 mL of water. 90 mL of 1x running buffer was added to each tank of Amersham ECL Gel
Box (GE Healthcare Life Sciences). Gel cassette was rinsed with distilled water and placed in
gel box so that the well side of the cassette faces toward the cathode. Gel was pre-run for 12
min at 160 V. After the pre-run, comb was removed and 6 mL of 1x running buffer was added
to the well container. Samples were loaded onto the gel. Gel has been running for 60 min at 160
V at 4 ºC. Once the run completed the stacking gel and the front were cut off. The gel is gently
laid down on a pre-soaked filter paper in transfer buffer (3.35 g TRIS, 14.4 g Glycine, 100 mL
methanol in 1 L of deH2O) and covered with transfer buffer to keep its moisture. Pre-soaked
nitrocellulose membrane (GE Healthcare Life Sciences) in transfer buffer is placed on top of
the gel. Air bubbles were removed by gently rolling a glass pipette over the membrane surface.
Another pre-soaked filter paper is placed on top of the membrane. Four soaked blotting pads
are placed into the cathode core of the XCell II™ Blot Module (Invitrogen). The gel-membrane
“sandwich” is carefully placed on top of the blotting pads, such that the gel is closest to the
cathode plate. Four blotting pads are added on top of the “sandwich.” Anode core is placed on
top of the pads and the whole blot module is placed into the guide rails on the lower buffer
chamber. Blot module is filled with transfer buffer until the sandwich is covered. The outer,
buffer, chamber is filled with distilled water to the designated mark. The lid is placed on top of
the unit and the whole unit is placed in styrofoam box filled with ice. The transfer was done at
10 V overnight.
3.5.5. Antibody incubation and detection
After the transfer has completed, blot module was disassembled and the membrane was
incubated with Ponceau S (Sigma) dye for 5 min to visualize the proteins. The membrane is
destained by washing in distilled water 3 times for 3 min and once in PBS. Blocking was done
in 5% non-fat dry milk dissolved in TBST for 1 hour. The membrane was washed in TBST two
times for 5 min. Primary GAPDH antibody (Sigma) was diluted in 0.5% non-fat milk in TBST
in ratio 1:10000. The membrane was covered with primary antibody aliquot and incubated
overnight at 4 ºC. The membrane was washed 3 times with TBST for 5 min. 5 mL of 5% non-
fat dry milk was prepared. Milk was added to the membrane and 2.5 µL (1:2000 dilution) of
secondary anti-rabbit IgG, HRP-linked antibody (Cell Signaling, prod. #7074) was added to
milk TBST solution. The membrane was incubated for 1 hour at room temperature. The
13
membrane was washed 3 times with TBST for 5 min. Clarity Western Peroxide Reagent and
Clarity Western Luminol/Enhancer Reagent (Biorad) were mixed in the equal ratios and kept
in dark at room temperature. The membrane was dried on a paper towel after washing and
placed on plastic wrapping foil. The membrane was covered with Clarity mixture, covered with
another layer of plastic foil and incubated for 3 minutes in the cassette. Excess Clarity mixture
was removed but the membrane remained wet, wrapped in clean plastic foil and placed in the
cassette. It needs to be sure that there are no air bubbles trapped between the membrane and the
foil. X-ray film (Kodak) was placed on top of the membrane under the red light and exposed
for 20 min. In the meantime, 22 mL of the developer (Sigma) was mixed with 100 mL of water.
The same was done with the fixer (Sigma). Both were placed in separated plastic containers
while the third one contained only water. After exposure, X-ray film is washed in the developer
until the bends are starting to appear. The film is then quickly washed in the water and the
development reaction is stopped in the fixer. The whole procedure was repeated with actin H-
196 primary antibody (Santa Cruz) diluted 1:500 in 0.5% non-fat milk in TBST after stripping
the membrane as described in paragraph 3.5.6.
3.5.6. Membrane stripping
Stripping is done to make sure there are no leftover primary antibodies bound to the
membrane. The membrane is incubated in mild stripping buffer (15 g glycine, 1 g SDS, 10 mL
Tween 20 in 1 L of distilled water, pH 2.2) two times for 10 min. Following, the membrane is
incubated two times for 10 min in PBS after which is incubated two times for 5 min in TBST.
When the stripping process is done, the membrane is ready for blocking stage as described in
paragraph 3.5.5.
3.6. Detection of reactive oxygen species by DCFH-DA assay Intracellular ROS generation was determined by a fluorometric microplate assay by
assessing oxidation of 2′, 7′-dichlorofluorescein-diacetate (DCFH-DA) (Sigma-Aldrich). In
brief, cells were incubated with 200 µM DCFH-DA in PBS at 37°C for 30 min in the dark and
then washed with PBS to remove excess dye. Fluorescence was measured using Glomax
microplate reader (Promega). Cells were seeded on the 96-well opaque plate at the cell density
of 0.25 x 10⁴ cells/well. Cells were treated with 30 µg/mL and 40 µg/mL concentrations of AA.
Time of incubation was 24 h. Only propidium iodide (PI) negative cells were considered.

14
3.7. Determination of cell death type by Annexin V and PI assay Cells were seeded on the 6-well plate at the cell density of 2 x 10⁵ cells/well. Cells were
treated with 30 µg/mL and 40 µg/mL of ascorbic acid and 10 µM cisplatin. Control cells were
untreated. All treatments were done in duplicates and incubated for 24 h. After incubation, the
medium was transferred to 15 mL tubes, wells were washed with 1 mL PBS which was
transferred to the tubes as well. 1 mL of trypsin was added and cells were incubated for 4 min
at 37 ºC and 5% CO2. Trypsin was neutralized with 1 mL of GM. Everything from the wells
was transferred to the tubes. Wells were washed with 2 mL of PBS which was transferred to
the tubes. Tubes were centrifuged for 10 min at 400 x g and 4 ºC. Tubes are kept on ice. The
supernatant is aspirated and the pellet is resuspended in 1 mL of PBS. Tubes are again
centrifuged for 10 min at 400 x g and 4 ºC. The supernatant is aspirated and the pellet is
resuspended in 1 x Annexin binding buffer (BD Pharmingen). 5 µL of PI and Annexin V (BD
Pharmingen) are added to each tube except the unstained sample. One sample contained only
PI and one only Annexin V and were used for calibration of the flow cytometer.
15
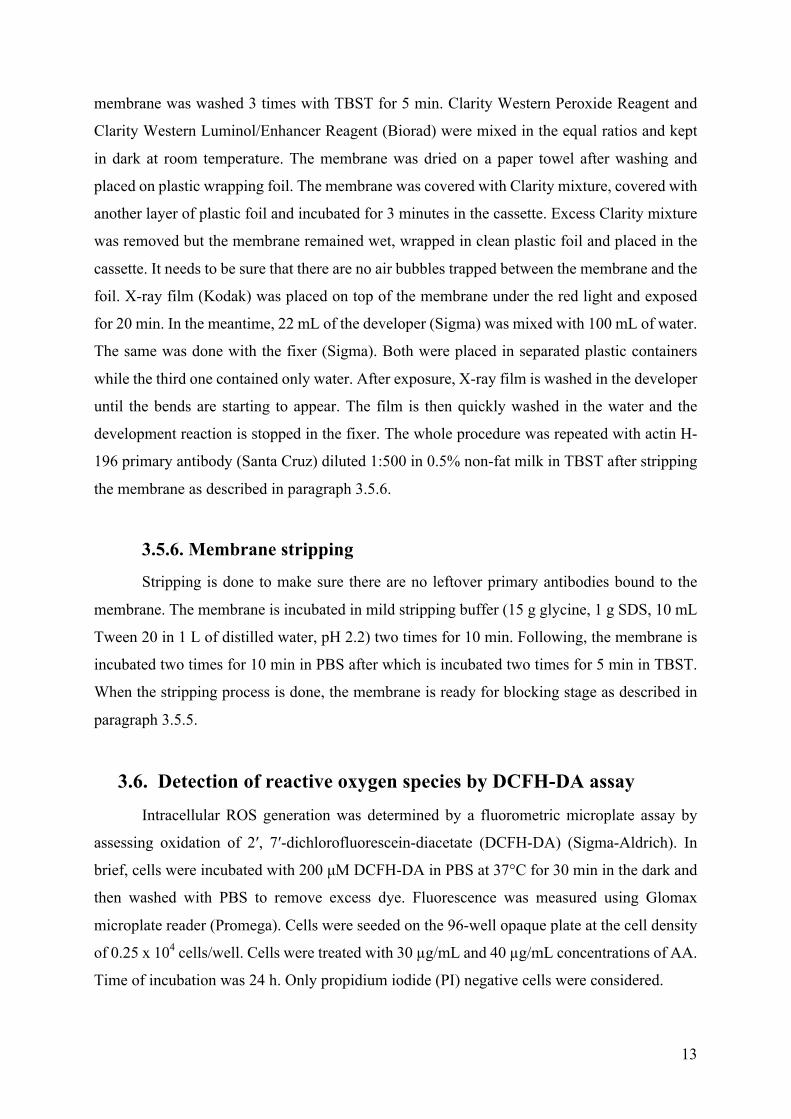
4. RESULTS 4.1. Sarcosphere formation and adhesion
OS-CSCs were isolated from patient’s tumor and grown in growth medium as adherent
culture. 40 000 cells/well was transferred in sarcosphere growth medium in 1% methyl-
cellulose with presence of EGF and bFGF. Growth factors were added every three days to
maintain the concentration of 10 ng/mL. OS-CSCs start as a single cell, dividing and clumping
together forming a larger, oval structures. Figure 4. shows the formation and growth of
sarcospheres. On day 7, sarcospheres are small (50 µm in diameter) consisting of 6-30 cells.
After 14 days, they become larger, approximately 150-200 µm in diameter, while after a month,
they become around 300 µm wide in diameter. After 31 days of growth, sarcospheres were
transferred into a 40 nm nylon cell strainer and washed with GM so that excess methyl-cellulose
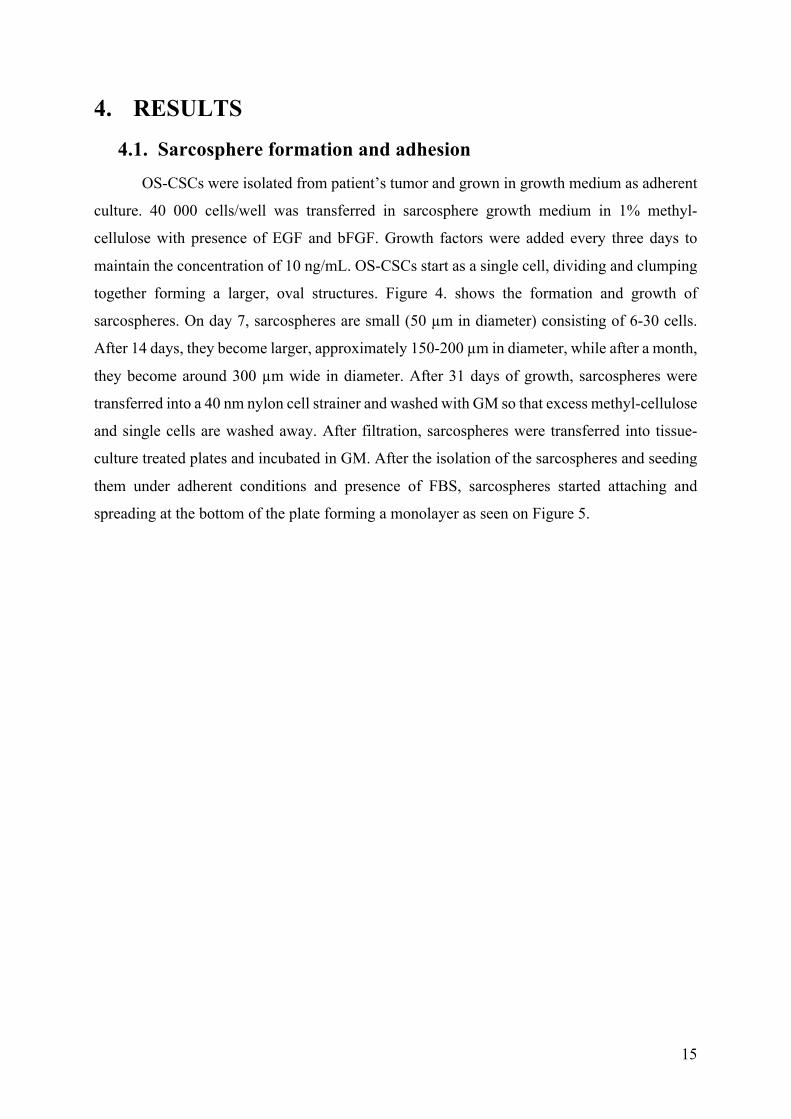
and single cells are washed away. After filtration, sarcospheres were transferred into tissue-
culture treated plates and incubated in GM. After the isolation of the sarcospheres and seeding
them under adherent conditions and presence of FBS, sarcospheres started attaching and
spreading at the bottom of the plate forming a monolayer as seen on Figure 5.
16
14th day 31st day 7th day
Figure 4. Sarcosphere growth in the period of 31 days. After 7 days, they are approx. 50 µm in
diameter and over the period of 1 month they grow up to 300 µm wide, mag. 400x
Figure 5. OS-CSCs adhesion and monolayer formation from sarcospheres, mag. 400x
1st day 2nd day 4th day
7th day 13th day 13th day
17
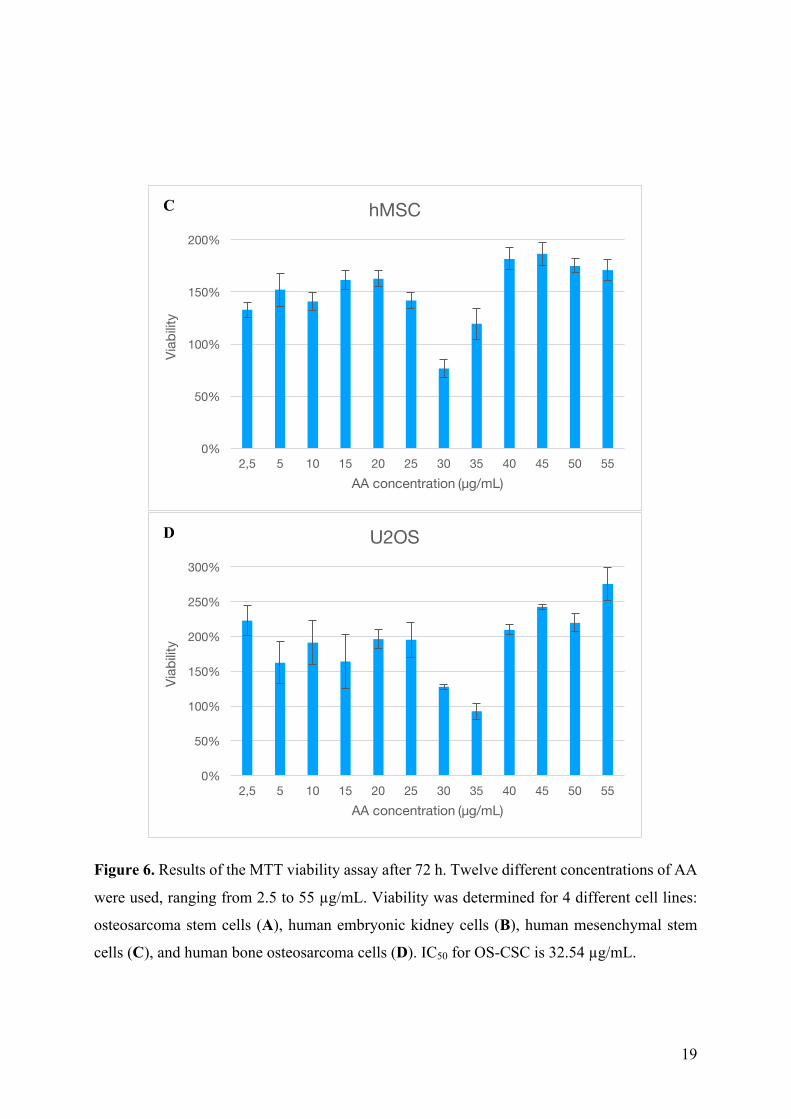
4.2. Ascorbic acid effect on cell viability MTT assay was conducted to see the effects of AA on OS-CSC viability, to compare it
to HEK293, hMSC and U2OS cell lines and to determine the concentration of AA that kills
50% of the cell population (IC50) (Fig. 6). Cells were treated with 12 different concentrations of
AA (from 2.5 µg/mL to 55 µg/mL) and incubated for 72 h. Cell density was 0.25 x 10⁴
cells/well. Viability of each sample is determined in comparison with control cells. IC50 is
calculated and for OS-CSC it is 32.54 µg/mL. The rest of the cell lines do not show viability
less than 100% except in concentration of 35 µg/mL AA. Concentrations 2.5 µg/mL, 10 µg/mL,
15 µg/mL and 20 µg/mL do not cause a big difference in cell viability as it is above 100%
comparing to control cells. Concentrations 25 µg/mL, 30 µg/mL and 35 µg/mL cause a
significant decrease in cell viability as the viability drops below 50% in each sample. AA
concentrations of 40 µg/mL, 45 µg/mL, 50 µg/mL and 55 µg/mL are killing all the cells in the
samples. The viability of those samples is below 0%. HEK293 cell line shows increase in
viability in samples treated with 2.5 µg/mL, 10 µg/mL, 15 µg/mL, 20 µg/mL, 25 µg/mL, 30
µg/mL, 40 µg/mL, 45 µg/mL, 50 µg/mL and 55 µg/mL concentrations of AA. The only drop
in viability is recorded in sample treated with 35 µg/mL (80.21% viability comparing to control
group). hMSC cell line shows increase in viability in samples treated with 2.5 µg/mL, 10
µg/mL, 15 µg/mL, 20 µg/mL, 25 µg/mL, 35 µg/mL, 40 µg/mL, 45 µg/mL, 50 µg/mL and 55
µg/mL concentrations of AA. The only drop in viability is recorded in sample treated with 30
µg/mL (76.58% viability comparing to control group). U2OS cell line shows increase in
viability in samples treated with 2.5 µg/mL, 10 µg/mL, 15 µg/mL, 20 µg/mL, 25 µg/mL, 30
µg/mL, 40 µg/mL, 45 µg/mL, 50 µg/mL and 55 µg/mL concentrations of AA. The only drop
in viability is recorded in sample treated with 35 µg/mL (92.32% viability comparing to control
group). Concentrations of AA used for further experiments are 30 µg/mL and 40 µg/mL to
exclude the variability of cytotoxicity due to cell number variability.

18
0%
50%
100%
150%
200%
250%
2,5 5 10 15 20 25 30 35 40 45 50 55
Viab
ility
AA concentration (µg/mL)
HEK293B
-30%
-10%
10%
30%
50%
70%
90%
110%
130%
150%
2,5 5 10 15 20 25 30 35 40 45 50 55
Viab
ility
AA concentration (µg/mL)
OS-CSCA
19
Figure 6. Results of the MTT viability assay after 72 h. Twelve different concentrations of AA
were used, ranging from 2.5 to 55 µg/mL. Viability was determined for 4 different cell lines:
osteosarcoma stem cells (A), human embryonic kidney cells (B), human mesenchymal stem
cells (C), and human bone osteosarcoma cells (D). IC50 for OS-CSC is 32.54 µg/mL.
0%
50%
100%
150%
200%
2,5 5 10 15 20 25 30 35 40 45 50 55
Viab
ility
AA concentration (µg/mL)
hMSCC
0%
50%
100%
150%
200%
250%
300%
2,5 5 10 15 20 25 30 35 40 45 50 55
Viab
ility
AA concentration (µg/mL)
U2OSD
20
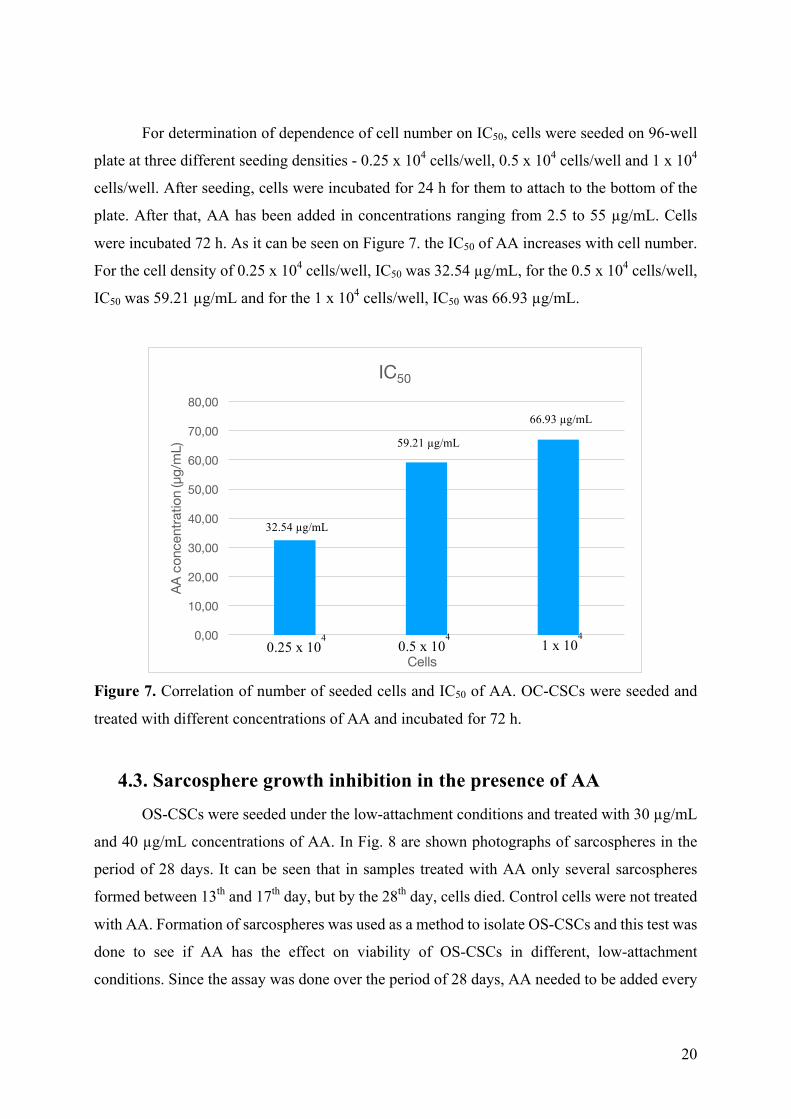
For determination of dependence of cell number on IC50, cells were seeded on 96-well
plate at three different seeding densities - 0.25 x 10⁴ cells/well, 0.5 x 10⁴ cells/well and 1 x 10⁴
cells/well. After seeding, cells were incubated for 24 h for them to attach to the bottom of the
plate. After that, AA has been added in concentrations ranging from 2.5 to 55 µg/mL. Cells
were incubated 72 h. As it can be seen on Figure 7. the IC50 of AA increases with cell number.
For the cell density of 0.25 x 10⁴ cells/well, IC50 was 32.54 µg/mL, for the 0.5 x 10⁴ cells/well,
IC50 was 59.21 µg/mL and for the 1 x 10⁴ cells/well, IC50 was 66.93 µg/mL.
Figure 7. Correlation of number of seeded cells and IC50 of AA. OC-CSCs were seeded and
treated with different concentrations of AA and incubated for 72 h.
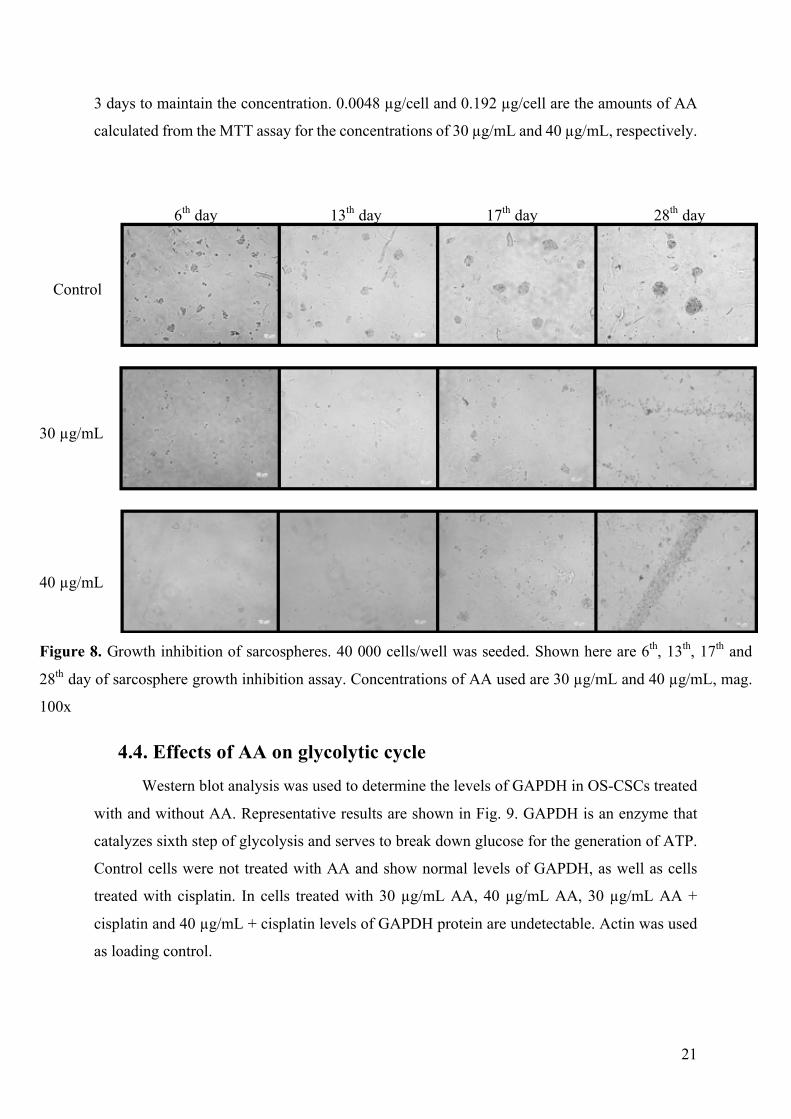
4.3. Sarcosphere growth inhibition in the presence of AA OS-CSCs were seeded under the low-attachment conditions and treated with 30 µg/mL
and 40 µg/mL concentrations of AA. In Fig. 8 are shown photographs of sarcospheres in the
period of 28 days. It can be seen that in samples treated with AA only several sarcospheres
formed between 13th and 17th day, but by the 28th day, cells died. Control cells were not treated
with AA. Formation of sarcospheres was used as a method to isolate OS-CSCs and this test was
done to see if AA has the effect on viability of OS-CSCs in different, low-attachment
conditions. Since the assay was done over the period of 28 days, AA needed to be added every
0,00
10,00
20,00
30,00
40,00
50,00
60,00
70,00
80,00
AA c
once
ntra
tion
(µg/
mL)
Cells
IC50
0.5 x 10⁴ 1 x 10
4
32.54 µg/mL
59.21 µg/mL 66.93 µg/mL
0.25 x 10⁴
21
3 days to maintain the concentration. 0.0048 µg/cell and 0.192 µg/cell are the amounts of AA
calculated from the MTT assay for the concentrations of 30 µg/mL and 40 µg/mL, respectively.
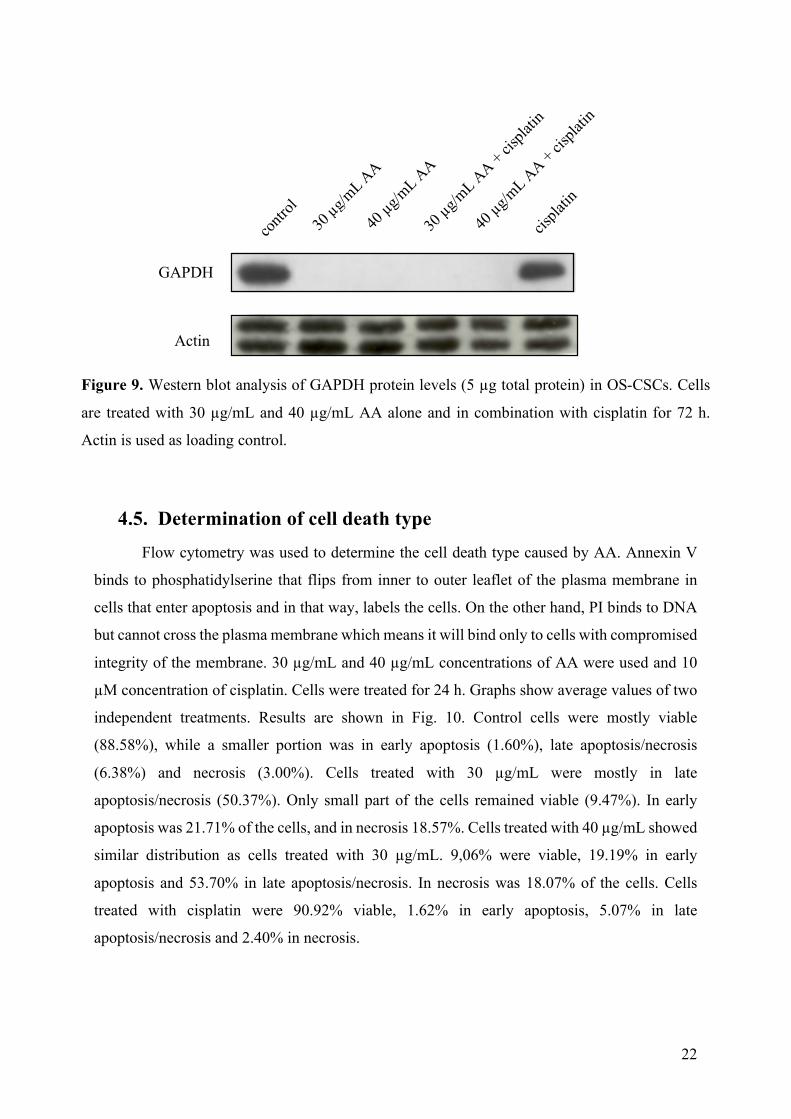
4.4. Effects of AA on glycolytic cycle Western blot analysis was used to determine the levels of GAPDH in OS-CSCs treated
with and without AA. Representative results are shown in Fig. 9. GAPDH is an enzyme that
catalyzes sixth step of glycolysis and serves to break down glucose for the generation of ATP.
Control cells were not treated with AA and show normal levels of GAPDH, as well as cells
treated with cisplatin. In cells treated with 30 µg/mL AA, 40 µg/mL AA, 30 µg/mL AA +
cisplatin and 40 µg/mL + cisplatin levels of GAPDH protein are undetectable. Actin was used
as loading control.
6th day 13th day 17th day 28th day
Control
30 µg/mL
40 µg/mL
Figure 8. Growth inhibition of sarcospheres. 40 000 cells/well was seeded. Shown here are 6th, 13th, 17th and
28th day of sarcosphere growth inhibition assay. Concentrations of AA used are 30 µg/mL and 40 µg/mL, mag.
100x
22
4.5. Determination of cell death type Flow cytometry was used to determine the cell death type caused by AA. Annexin V
binds to phosphatidylserine that flips from inner to outer leaflet of the plasma membrane in
cells that enter apoptosis and in that way, labels the cells. On the other hand, PI binds to DNA
but cannot cross the plasma membrane which means it will bind only to cells with compromised
integrity of the membrane. 30 µg/mL and 40 µg/mL concentrations of AA were used and 10
µM concentration of cisplatin. Cells were treated for 24 h. Graphs show average values of two
independent treatments. Results are shown in Fig. 10. Control cells were mostly viable
(88.58%), while a smaller portion was in early apoptosis (1.60%), late apoptosis/necrosis
(6.38%) and necrosis (3.00%). Cells treated with 30 µg/mL were mostly in late
apoptosis/necrosis (50.37%). Only small part of the cells remained viable (9.47%). In early
apoptosis was 21.71% of the cells, and in necrosis 18.57%. Cells treated with 40 µg/mL showed
similar distribution as cells treated with 30 µg/mL. 9,06% were viable, 19.19% in early
apoptosis and 53.70% in late apoptosis/necrosis. In necrosis was 18.07% of the cells. Cells
treated with cisplatin were 90.92% viable, 1.62% in early apoptosis, 5.07% in late
apoptosis/necrosis and 2.40% in necrosis.
GAPDH
Actin
Figure 9. Western blot analysis of GAPDH protein levels (5 µg total protein) in OS-CSCs. Cells
are treated with 30 µg/mL and 40 µg/mL AA alone and in combination with cisplatin for 72 h.
Actin is used as loading control.

23
Necrosis
Late Apoptosis/Necrosis
Early Apoptosis
Viable
Figure 10. Annexin V/PI flow cytometry assay for cell death type determination. Graphs
show average values of two independent experiments, percentage of cells out of all in the
sample. Control cells were not treated. 30 µg/mL and 40 µg/mL concentrations of AA were
used and 10 µM concentration of cisplatin. Cells were treated for 24 h.
24 h

24
4.6. The effects of AA on redox state of OS-CSCs
This assay was done to examine the effects of AA on the amount of reactive oxygen
species in OS-CSC. Cells were incubated for 72 h with 30 µg/mL and 40 µg/mL concentrations
of AA. The results are normalized to the number of PI negative cells. PI negative cells include
population of live cells and cells in early apoptosis, because the integrity of their membranes is
still intact. Control cells show basal levels of ROS, and compared to them it can be seen that
osteosarcoma stem cells treated with 30 µg/mL AA and 40 µg/mL AA show 2.44 increase in
fluorescence intensity which means they have 2.44 times more ROS (Fig. 11). These results are
suggesting pro-oxidative effect of AA in osteosarcoma stem cells.
Figure 11. Results of the ROS fluorometric assay. Control cells were untreated and used as
basal level of ROS in the cell. Cells were incubated for 72 h with 30 µg/mL and 40 µg/mL
concentrations of AA. The results are normalized to the number of PI negative cells.
0,342
0,826 0,830
0
0,1
0,2
0,3
0,4
0,5
0,6
0,7
0,8
0,9
Control 30 µg/mL AA 40 µg/mL AA
Flou
resc
ence
uni
ts
Reactive Oxygen Species

25
5. DISCUSSION After isolation of sarcospheres from the patient’s tumor, they were successfully
transferred from adherent to low-attachment conditions. Incubating them with growth factors,
EGF and bFGF, in low-attachment conditions resulted in them forming sarcospheres. MTT
assay was done to confirm selectivity of AA to OS-CSCs, determine if cell density affects IC50
and to determine IC50 for OS-CSCs. Selectivity is confirmed, IC50 for OS-CSCs is 32.54 µg/mL
for the cell density of 0.25 x 10⁴ cells/well, 59.21 µg/mL for the cell density of 0.5 x 10⁴ µg/mL
and 66.93 µg/mL for the cell density of 1 x 10⁴ cells/well. AA inhibited the formation of
sarcospheres and GAPDH levels in cells treated with AA were not detectable. Flow cytometry
showed that type of death caused by AA is either necrosis and/or apoptosis. ROS levels in cells
treated with AA are elevated and the results suggest that AA is acting as a pro-oxidant.
As mentioned before, CSCs have the ability to form sarcospheres under low-attachment
conditions. This property of OS-CSCs was used to isolate them from the tumor mass. Reynolds
and Weiss (1992) were the first to describe the establishment of CSCs as spheres. Palmini et al.
(2016) determined that 40 000 cells/well is optimal number of cells to maintain isolation
between them at the beginning of the experiment. It is crucial to avoid the possibility that the
sarcospheres formed due to cell aggregation. Single CSC has the ability to grow under low-
attachment conditions and form a spherical colony. After the cells were transferred to adherent
conditions, they attached to the bottom of the plate and started spreading, forming a monolayer.
The process of forming sarcospheres was repeated a couple of times and each time the cells
successfully formed sarcospheres as well as monolayer. With that, we can conclude that the
isolated cells really are OS-CSCs. Targeting CSCs is important as they are responsible for
tumor relapse. There are 2 strategies for eradicating CSCs. Induction of differentiation forces
CSC to become differentiated cancer cells which can then be targeted with conventional
therapeutics. Inhibition of self-renewal insures inability of CSCs to divide and thus forcing
them in apoptosis (Wang et al., 2015).
MTT viability assay was done to determine the IC50 value of ascorbic acid. Furthermore,
the assay was done on three more cell lines to prove selectivity to OS-CSCs and to see if there
is a difference in IC50 values if the cell density is higher. Selectivity is confirmed which can be
seen from the data collected. HEK293, hMSC and U2OS cell lines did not have viability levels
lowered by the increased concentrations of AA while OS-CSCs showed an increase in mortality
with the increased concentrations of AA. Concentrations from 2.5 µg/mL to 20 µg/mL do not
cause a big difference in cell viability as it is above 100% comparing to control cells.
26
Concentrations 25 µg/mL, 30 µg/mL and 35 µg/mL cause a significant decrease in cell viability
as the viability drops below 50% in each sample. AA concentrations from 40 µg/mL to 55
µg/mL are killing all the cells in the samples. The viability of those samples is below 0%.
Considering the dependence of the cell density on the IC50 value, it can be seen that the more
cells are seeded the higher the IC50 value is. With the cell density of 0.25 x 10⁴ cells/well, IC50
is 32.54 µg/mL, for the 0.5 x 10⁴ cells/well, IC50 is 59.21 µg/mL and for the 1 x 10⁴ cells/well,
IC50 is 66.93 µg/mL. The reason behind this changeable IC50 might be because every cell
uptakes certain amount of AA and the more cells there are, the more AA is needed for them to
die. This needs to be taken into account for further experiments. AA also inhibited the formation
of sarcospheres. Xu et al. (2017) reported that SATB2 plays an important role in regulating OS-
CSC properties and tumor growth. They isolated OS-CSCs by sarcosphere formation assay and
conducted sarcosphere inhibition assay as well. Knockdown of the SATB2 disabled CSC
properties in vitro, evidenced by the reduction of sarcosphere formation and cell proliferation.
For further studies, it should be considered to test the combined effects of AA and SATB2
targeted therapies. Wu et al. (2015) showed that curcumin impairs tumor sphere formation of
NCI-H460 lung cancer cells in vitro. Their results suggested that spheres reduced in size in a
dose-dependent manner, the opposite of traditional chemotherapy drug Taxol, which could not
decrease tumor spheres.
To try to understand the mechanism of action by which AA induces cell death, we
conducted a series of experiments. To see if AA affects glycolytic cycle, we measured the level
of GAPDH using western blot. It can be seen that the levels of GAPDH in cells treated only
with AA and with AA in combination with cisplatin are not detectable. Another interesting
result is that cisplatin alone did not cause any down-expression of GAPDH. Yun et al. (2015)
tested if AA selectively kills KRAS and BRAF mutant colorectal cancer cells by targeting
GAPDH. They investigated the mechanism based on the changes in metabolomic profile
following the treatment with AA. Glycolytic intermediates upstream of GAPDH started
accumulating, while the ones downstream depleted. Also, oxidative pentose phosphate pathway
(PPP) metabolites increased which indicates that the GAPDH blockage causes shift from the
glycolytic flux to the oxidative-PPP flux.
Another method used for clearing up the mechanism of action was the determination of
reactive oxygen species in cells treated with AA. ROS levels in OS-CSCs treated with AA
showed 2.44 times increase in respect to untreated cells. The reason behind the increase of ROS
could be the decreased levels of NADPH/NADP+. NADPH/NADP+ decrease activates glucose-
6-phosphate dehydrogenase (G6PD) to enhance oxidative-PPP flux. Continuing, as DHA
27
uptake (GLUT-mediated) depletes cellular glutathione (GSH) and NADPH, as they are needed
in reducing DHA in AA, capacity of the GSH restoration pathway is exceeded and ROSs begin
to accumulate (Yun et al., 2015). Schoenfeld et al. (2017) reported that in non-small-cell lung
cancer (NSCLC) and glioblastoma (GBM) GLUT-mediated DHA demonstrated a minimal role
in AA toxicity. Their results suggested that because of increased mitochondrial O2.- and H2O2,
levels of labile iron pool (LIP) increased as well. Their theoretical model suggests that increased
LIP in cancer cells results in increased oxidation of AA that generates H2O2 capable of further
worsening the difference in labile iron in cancer cells as oppose to normal cells. Increase in
H2O2 in the presence of increased labile iron results in generation of hydroxyl radicals causing
oxidative damage. Furthermore, De Francesco et al. (2015) developed a synthetic lethal strategy
for eradication of CSCs. They first reduced cellular respiration and targeted mitochondrial
protein translation with doxycycline and with that metabolically synchronized the surviving
cancer cell sub-population to predominantly use glycolysis. Following, treatment with AA
blocks the glycolysis by inhibition of GAPDH and successfully eradicates CSCs.
Flow cytometry was used to determine which type of cell death is triggered by AA.
Control cells and cells treated with cisplatin do not show any signs of reduced viability which
was expected and confirms that OS-CSC are resistant to conventional chemotherapeutics due
to its high activity of ABC transporters. Cells treated with AA are mostly in late
apoptosis/necrosis. There is a population of cells in necrosis and early apoptosis which suggests
that certain portion of the cells dies through apoptotic pathway. Mata et al. (2015) reported from
different sources that AA can activate apoptosis, necrosis and aponecrosis. Further studies
should be conducted to see if there are one or more death types caused by AA.
28
6. CONCLUSION
CSCs have the ability of self-replication and differentiation in different cell types which
ensures them tumorigenicity. Active membrane pumps and repair enzymes provide them
resistance to conventional chemotherapy. Osteosarcoma is a malignant tumor and development
of selective therapies for OS-CSCs eradication is necessary to improve patient survival. The
goal of this study was to investigate the effects of AA on OS-CSCs.
Based on the obtained results, it can be concluded that AA selectively kills OS-CSCs. It
prevents formation of sarcospheres and its IC50 is dependent on the number of cells. The
mechanism of death is based on the blockage of glycolytic cycle and increased intracellular
levels of ROS which triggers either apoptosis and/or necrosis.
This research provides an insight into the effects of AA on OS-CSCs. Targeting CSCs
in tumor is necessary to eradicate the tumor and this research showed that AA, indeed,
selectively kills OS-CSCs.

29
7. REFERENCES
Al-Hajj, M. et al., 2003. Prospective identification of tumorigenic breast cancer cells.
Proceedings of the National Academy of Sciences, 100(7), pp.3983–3988.
Bacci, G. et al., 2006. Influence of local recurrence on survival in patients with extremity
osteosarcoma treated with neoadjuvant chemotherapy: The experience of a single institution
with 44 patients. Cancer, 106(12), pp.2701–2706.
Berthelet, J. & Dubrez, L., 2013. Regulation of Apoptosis by Inhibitors of Apoptosis (IAPs).
Cells, 2, pp.163–187.
Bonuccelli, G. et al., 2015. NADH autofluorescence, a new metabolic biomarker for cancer
stem cells: Identification of Vitamin C and CAPE as natural products targeting “stemness.”
Oncotarget, 8(13), pp.20667–20678.
De Francesco, E.M. et al., 2015. Vitamin C and Doxycycline: A synthetic lethal combination
therapy targeting metabolic flexibility in cancer stem cells (CSCs). Oncotarget, 8(60),
pp.67269–67286.
Dubey, A. K. et al., 2013. Vismodegib: The first drug approved for advanced and metastatic
basal cell carcinoma. J Postgrad Med, 59(1), pp.48-50.
Friedman, M.A. & Carter, S.K., 1972. The therapy of osteogenic sarcoma: Current status and
thoughts for the future. Journal of Surgical Oncology, 4(5–6), pp.482–510.
González, M.J. et al., 2010. Mitochondria, Energy and Cancer: The Relationship with Ascorbic
Acid. Journal of orthomolecular medicine, 25(1), pp.29–38.
Goorin, A.M. et al., 1987. Weekly high-dose methotrexate and doxorubicin for osteosarcoma:
the Dana-Farber Cancer Institute/the Children’s Hospital– study III. Journal of Clinical
Oncology, 5(8), pp.1178-1184.
30
Hanahan, D. & Weinberg, R.A., 2011. Hallmarks of cancer: The next generation. Cell, 144(5),
pp.646–674.
Hansen, M.F. et al., 1985. Osteosarcoma and retinoblastoma: a shared chromosomal
mechanism revealing recessive predisposition. Proceedings of the National Academy of
Sciences of the United States of America, 82(18), pp.6216–20.
Kansara, M. & Thomas, D.M., 2007. Molecular pathogenesis of osteosarcoma. DNA and cell
biology, 26(1), pp.1–18.
Li, J. et al., 2012. ABT-737 reverses the acquired radioresistance of breast cancer cells by
targeting Bcl-2 and Bcl-xL. J Experimental Clinical Cancer Research, 31(102), pp.1–8.
Lombardo, Y. et al., 2011. Bone morphogenetic protein 4 induces differentiation of colorectal
cancer stem cells and increases their response to chemotherapy in mice. Gastroenterology,
140(1), pp.297–309.
Maki, R.G., 2012. Ifosfamide in the neoadjuvant treatment of osteogenic sarcoma. Journal of
Clinical Oncology, 30(17), pp.2033–2035.
Maramag, C. et al., 1997. Effect of vitamin C on prostate cancer cells in vitro: effect on cell
number, viability, and DNA synthesis. The Prostate, 32(3), pp.188–95.
Mata, A.M.O.F. da et al., 2016. Ascorbic acid in the prevention and treatment of cancer. Revista
da Associação Médica Brasileira, 62(7), pp.680–686.
Nicolis, S.K., 2007. Cancer stem cells and “stemness” genes in neuro-oncology. Neurobiology
of Disease, 25(2), pp.217–229.
31
Ottaviani, G. & Jaffe, N., 2002. Clinical and pathologic study of two siblings with
osteosarcoma. Medical and Pediatric Oncology, 38(1), pp.62–64.
Palmini, G. et al., 2016. Establishment of Cancer Stem Cell Cultures from Human Conventional
Osteosarcoma. J. Vis. Exp, 53884(11610), pp.1–17.
Peabody, T.D. & Attar, S., 2014. Orthopaedic Oncology. Vol. 162, Springer.
Pecorino, L., 2012. Molecular Biology of Cancer Mechanisms. 3rd ed., Oxford University
Press.
Reynolds, B.A. & Weiss, S., 1992. Generation of Neurons and Astrocytes from Isolated Cells
of the Adult Mammalian Central Nervous System. Science, 255(5052), pp.1707–1710.
Savini, I. et al., 2008. SVCT1 and SVCT2: Key proteins for vitamin C uptake. Amino Acids,
34(3), pp.347–355.
Schatton, T. et al., 2008. Identification of cells initiating human melanomas. Nature, 451(7176),
pp.345-349.
Schoenfeld, J.D. et al., 2017. O2⋅− and H2O2-Mediated Disruption of Fe Metabolism Causes the
Differential Susceptibility of NSCLC and GBM Cancer Cells to Pharmacological Ascorbate.
Cancer Cell, 31, pp.1-14.
Sutow, W.W., 1980. Multidrug chemotherapy in osteosarcoma. Clin Orthop, 153, pp.67–72.
Takahashi, K. et al., 2007. Induction of Pluripotent Stem Cells from Adult Human Fibroblasts
by Defined Factors. Cell, 131(5), pp.861–872.
Taubert, H. et al., 2010. Expression of survivin detected by immunohistochemistry in the
cytoplasm and in the nucleus is associated with prognosis of leiomyosarcoma and synovial
sarcoma patients. BMC Cancer, 10(65), pp.1-7.
32
Tomasetti, C., Vogelstein, B. & Parmigiani, G., 2013. Half or more of the somatic mutations in
cancers of self-renewing tissues originate prior to tumor initiation. Proceedings of the National
Academy of Sciences, 110(6), pp.1999–2004.
Wadayama, B. et al., 1994. Mutation spectrum of the retinoblastoma gene in osteosarcomas.
Cancer Research, 54(11), pp.3042–3048.
Wang, L.L., 2005. Biology of osteogenic sarcoma. Cancer J, 11(4), pp.294–305.
Wang, T. et al., 2015. Cancer stem cell targeted therapy: progress amid controversies.
Oncotarget, 6(42), pp.44191–44206.
Wu, L. et al., 2015. Curcumin suppresses stem-like traits of lung cancer cells via inhibiting the
JAK2/STAT3 signaling pathway. Oncology Reports, 34(6), pp.3311–3317.
Xu, H.Y. et al., 2017. Metformin reduces SATB2-mediated osteosarcoma stem cell-like
phenotype and tumor growth via inhibition of N-cadherin / NF- k B signaling., European
Review for Medical and Pharmacological Sciences, 21, pp.4516–4528.
Yen, W.C. et al., 2015. Targeting notch signaling with a Notch2/Notch3 antagonist
(Tarextumab) inhibits tumor growth and decreases tumor-initiating cell frequency. Clinical
Cancer Research, 21(9), pp.2084–2095.
Yun, J. et al., 2015. Vitamin C selectively kills KRAS and BRAF mutant colorectal cancer cells
by targeting GAPDH. Science, 350(6266), pp.1391–1396.
Zeuner, A. et al., 2014. Elimination of quiescent / slow-proliferating cancer stem cells by Bcl-
X L inhibition in non-small cell lung cancer. Cell Death and Differentiation, 21(12), pp.1877–
1888.

CURRICULUM VITAE
I was born on March 28th, 1994, in Zagreb, Croatia. I completed my high school
education in my hometown. In 2012, I enrolled in the Undergraduate program of Molecular
biology at the Faculty of Science, University of Zagreb. I completed laboratory practice under
supervision of Dubravko Pavoković, Asst. Prof., at the Division of Molecular Biology and
received a Rector’s Award. During my final year of undergraduate studies, I was part of the 9th
International Society for Applied Biological Sciences (ISABS) Conference on Forensic and
Anthropologic Genetics and Mayo Clinic Lectures in Individualized Medicine. I was a teaching
assistant for Zoology and Laboratory Animals in Biological Research courses. I graduated from
the undergraduate program by writing a final paper titled «The role of hair in forensic analysis”
under supervision of Inga Marijanović, Asst. Prof. and obtained a title of bacc. mol. biol.
In September of 2015, I enrolled in the Graduate program of Molecular Biology. I was
a teaching assistant for Introduction to Forensic Biology, Molecular Genetics, Research
Methods in Molecular Biology, Mutagenesis and Carcinogenesis, Biology of Stem Cells and
Cell Biology courses. In 2017, I was part of the 10th ISABS Conference on Forensic and
Anthropologic Genetics and Mayo Clinic Lectures in Individualized Medicine. I organized an
event for popularization of science “Night of Biology” in 2013, 2014 and 2016. I spent 4th
semester in Madrid, Spain as an Erasmus+ student. After returning to Zagreb, I started working
on my Master’s thesis under supervision of Inga Marijanović, Asst. Prof.