TOURISM AND HOSPITALITY - IBEF Tourism and Hospitality For updated information, please visit...
43
For updated information, please visit www.ibef.org July 2017 TOURISM AND HOSPITALITY
Transcript of TOURISM AND HOSPITALITY - IBEF Tourism and Hospitality For updated information, please visit...
For updated information, please visit www.ibef.org July 2017
TOURISM AND
HOSPITALITY
Table of Content
Executive Summary……………….….…….3
Advantage India…………………..….……..4
Market Overview …………………….……..6
Recent Trends and Strategies …...……..18
Growth Drivers…………………….............21
Opportunities…….……….......……………30
Industry Associations……………....……...38
Case Studies….……………....……………34
Useful Information……….......…………….40
For updated information, please visit www.ibef.org Tourism and Hospitality 3
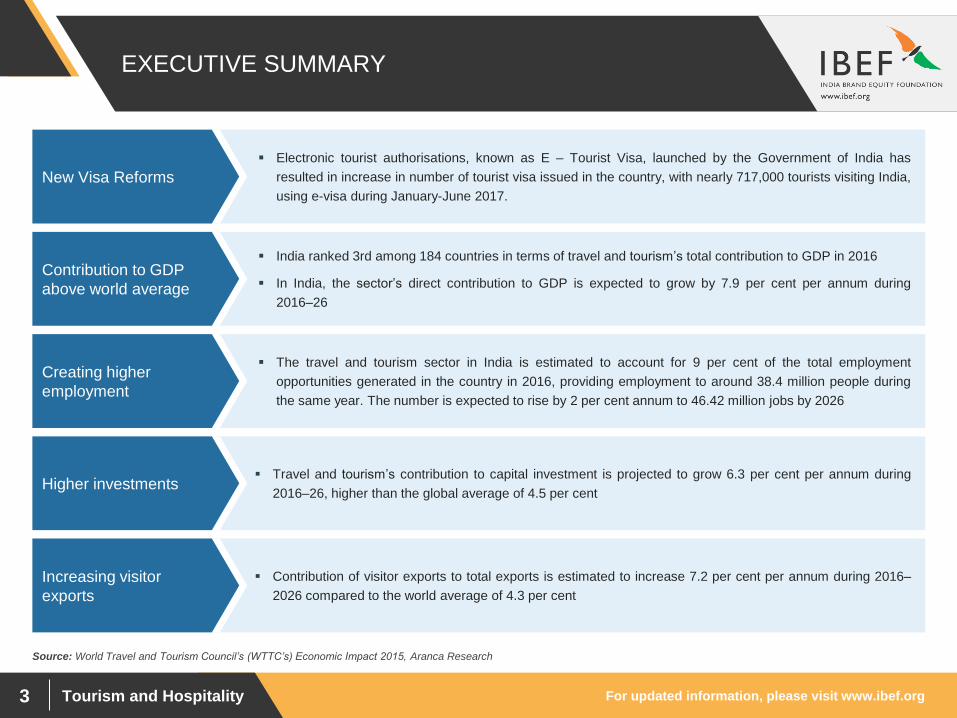
Electronic tourist authorisations, known as E – Tourist Visa, launched by the Government of India has
resulted in increase in number of tourist visa issued in the country, with nearly 717,000 tourists visiting India,
using e-visa during January-June 2017.
India ranked 3rd among 184 countries in terms of travel and tourism’s total contribution to GDP in 2016
In India, the sector’s direct contribution to GDP is expected to grow by 7.9 per cent per annum during
2016–26
Travel and tourism’s contribution to capital investment is projected to grow 6.3 per cent per annum during
2016–26, higher than the global average of 4.5 per cent
The travel and tourism sector in India is estimated to account for 9 per cent of the total employment
opportunities generated in the country in 2016, providing employment to around 38.4 million people during
the same year. The number is expected to rise by 2 per cent annum to 46.42 million jobs by 2026
Contribution of visitor exports to total exports is estimated to increase 7.2 per cent per annum during 2016–
2026 compared to the world average of 4.3 per cent
EXECUTIVE SUMMARY
New Visa Reforms
Source: World Travel and Tourism Council’s (WTTC’s) Economic Impact 2015, Aranca Research
Contribution to GDP
above world average
Higher investments
Creating higher
employment
Increasing visitor
exports

Tourism and Hospitality
ADVANTAGE INDIA
For updated information, please visit www.ibef.org Tourism and Hospitality 5
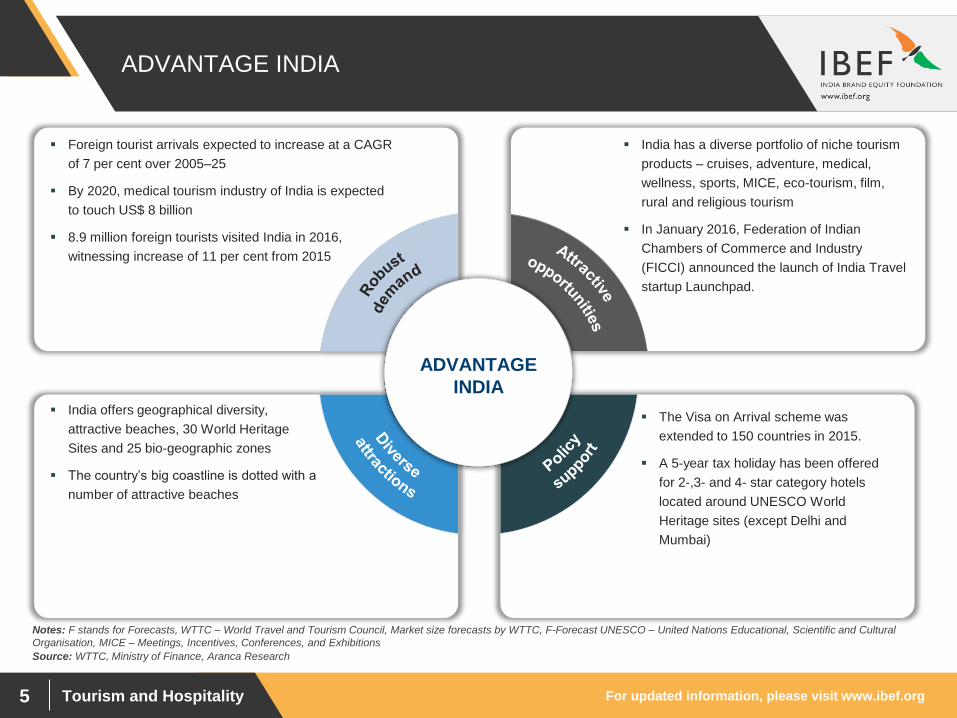
ADVANTAGE INDIA
Foreign tourist arrivals expected to increase at a CAGR
of 7 per cent over 2005–25
By 2020, medical tourism industry of India is expected
to touch US$ 8 billion
8.9 million foreign tourists visited India in 2016,
witnessing increase of 11 per cent from 2015
India has a diverse portfolio of niche tourism
products – cruises, adventure, medical,
wellness, sports, MICE, eco-tourism, film,
rural and religious tourism
In January 2016, Federation of Indian
Chambers of Commerce and Industry
(FICCI) announced the launch of India Travel
startup Launchpad.
India offers geographical diversity,
attractive beaches, 30 World Heritage
Sites and 25 bio-geographic zones
The country’s big coastline is dotted with a
number of attractive beaches
The Visa on Arrival scheme was
extended to 150 countries in 2015.
A 5-year tax holiday has been offered
for 2-,3- and 4- star category hotels
located around UNESCO World
Heritage sites (except Delhi and
Mumbai)
ADVANTAGE
INDIA
Source: WTTC, Ministry of Finance, Aranca Research
Notes: F stands for Forecasts, WTTC – World Travel and Tourism Council, Market size forecasts by WTTC, F-Forecast UNESCO – United Nations Educational, Scientific and Cultural
Organisation, MICE – Meetings, Incentives, Conferences, and Exhibitions
Tourism and Hospitality
MARKET OVERVIEW
For updated information, please visit www.ibef.org Tourism and Hospitality 7
EVOLUTION OF THE INDIAN TOURISM AND
HOSPITALITY SECTOR
Source: WTTC, Ministry of Tourism, Aranca Research
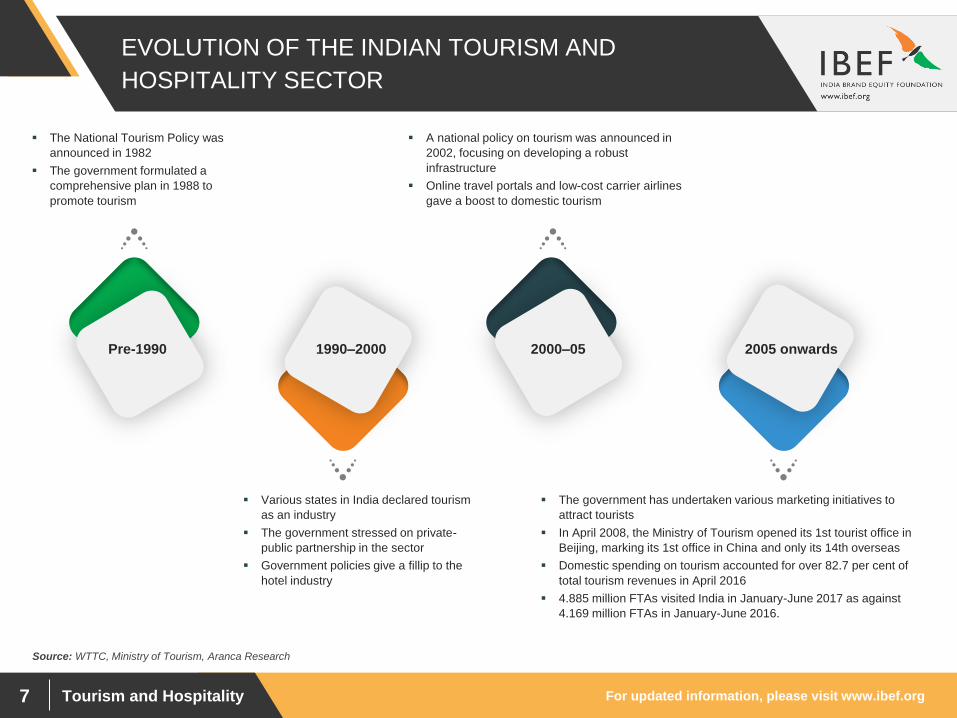
The National Tourism Policy was
announced in 1982
The government formulated a
comprehensive plan in 1988 to
promote tourism
The government has undertaken various marketing initiatives to
attract tourists
In April 2008, the Ministry of Tourism opened its 1st tourist office in
Beijing, marking its 1st office in China and only its 14th overseas
Domestic spending on tourism accounted for over 82.7 per cent of
total tourism revenues in April 2016
4.885 million FTAs visited India in January-June 2017 as against
4.169 million FTAs in January-June 2016.
A national policy on tourism was announced in
2002, focusing on developing a robust
infrastructure
Online travel portals and low-cost carrier airlines
gave a boost to domestic tourism
Various states in India declared tourism
as an industry
The government stressed on private-
public partnership in the sector
Government policies give a fillip to the
hotel industry
Pre-1990 1990–2000 2000–05 2005 onwards
For updated information, please visit www.ibef.org Tourism and Hospitality 8
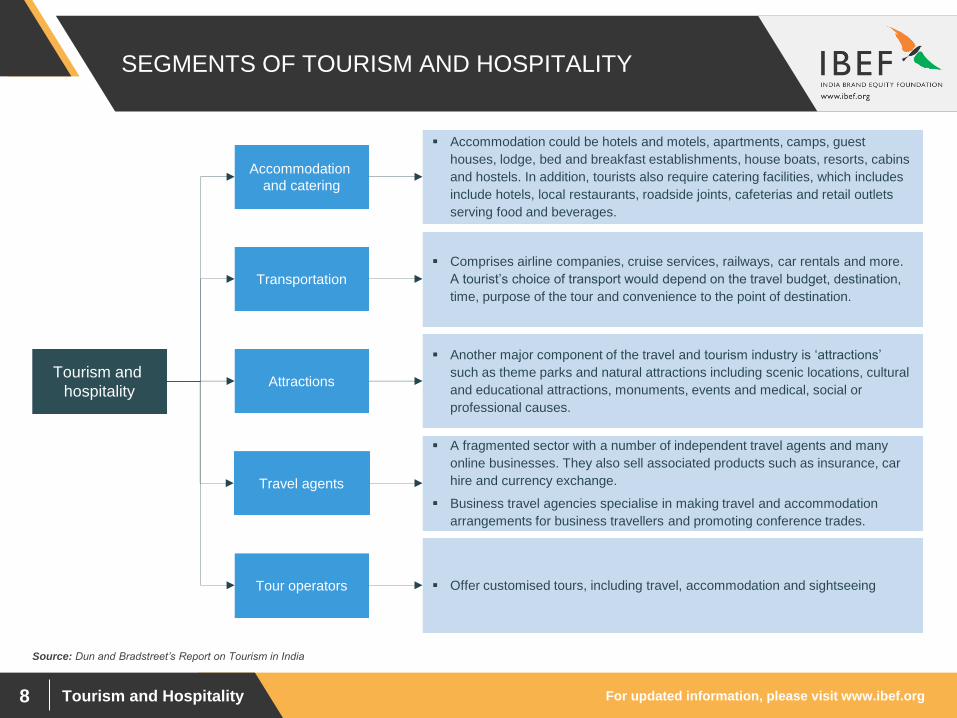
SEGMENTS OF TOURISM AND HOSPITALITY
Source: Dun and Bradstreet’s Report on Tourism in India
Accommodation could be hotels and motels, apartments, camps, guest
houses, lodge, bed and breakfast establishments, house boats, resorts, cabins
and hostels. In addition, tourists also require catering facilities, which includes
include hotels, local restaurants, roadside joints, cafeterias and retail outlets
serving food and beverages.
Comprises airline companies, cruise services, railways, car rentals and more.
A tourist’s choice of transport would depend on the travel budget, destination,
time, purpose of the tour and convenience to the point of destination.
Another major component of the travel and tourism industry is ‘attractions’
such as theme parks and natural attractions including scenic locations, cultural
and educational attractions, monuments, events and medical, social or
professional causes.
A fragmented sector with a number of independent travel agents and many
online businesses. They also sell associated products such as insurance, car
hire and currency exchange.
Business travel agencies specialise in making travel and accommodation
arrangements for business travellers and promoting conference trades.
Offer customised tours, including travel, accommodation and sightseeing
Accommodation
and catering
Transportation
Attractions
Travel agents
Tour operators
Tourism and
hospitality
For updated information, please visit www.ibef.org Tourism and Hospitality 9
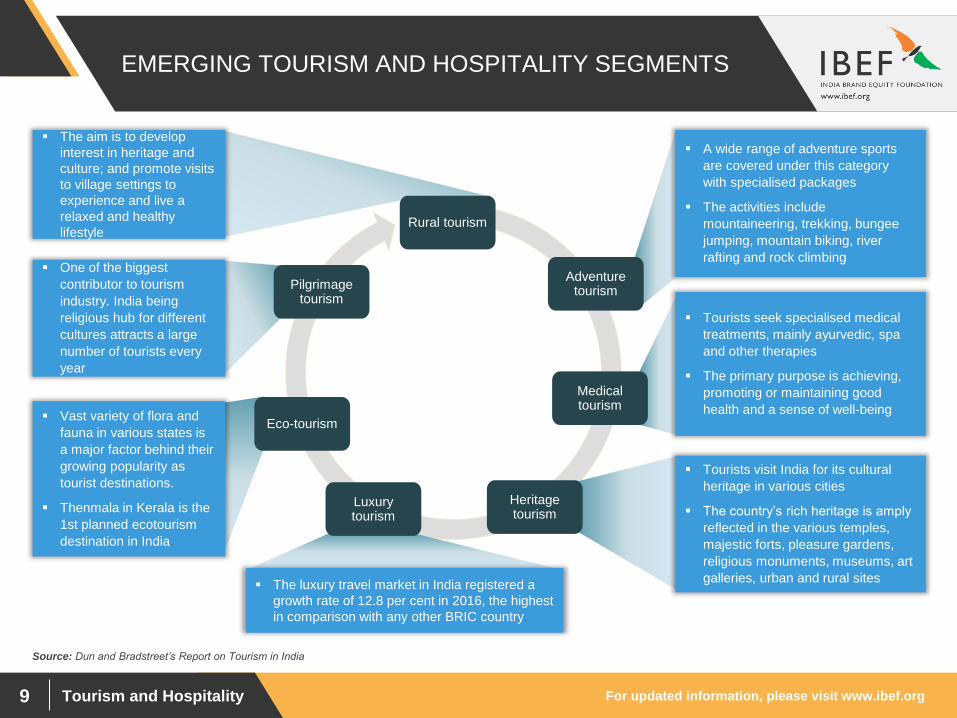
EMERGING TOURISM AND HOSPITALITY SEGMENTS
Source: Dun and Bradstreet’s Report on Tourism in India
Adventure tourism
A wide range of adventure sports
are covered under this category
with specialised packages
The activities include
mountaineering, trekking, bungee
jumping, mountain biking, river
rafting and rock climbing
Medical tourism
Tourists seek specialised medical
treatments, mainly ayurvedic, spa
and other therapies
The primary purpose is achieving,
promoting or maintaining good
health and a sense of well-being
Heritage tourism
Tourists visit India for its cultural
heritage in various cities
The country’s rich heritage is amply
reflected in the various temples,
majestic forts, pleasure gardens,
religious monuments, museums, art
galleries, urban and rural sites
Luxury tourism
The luxury travel market in India registered a
growth rate of 12.8 per cent in 2016, the highest
in comparison with any other BRIC country.
Eco-tourism Vast variety of flora and
fauna in various states is
a major factor behind their
growing popularity as
tourist destinations.
Thenmala in Kerala is the
1st planned ecotourism
destination in India.
Pilgrimage tourism
One of the biggest
contributor to tourism
industry. India being
religious hub for different
cultures attracts a large
number of tourists every
year
Rural tourism
The aim is to develop
interest in heritage and
culture; and promote visits
to village settings to
experience and live a
relaxed and healthy
lifestyle
For updated information, please visit www.ibef.org Tourism and Hospitality 10
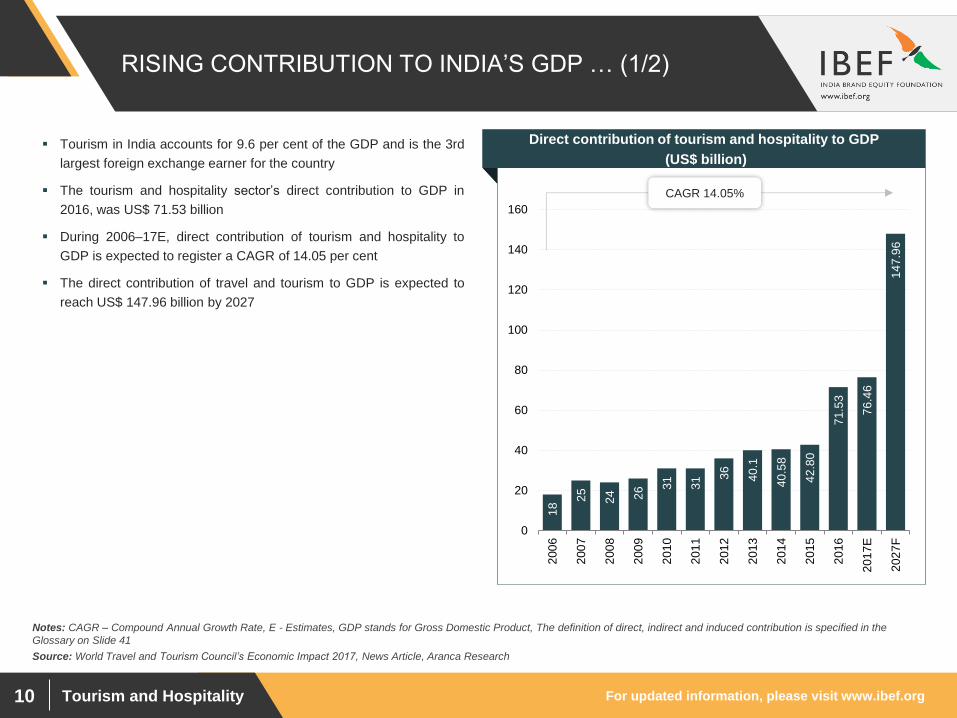
RISING CONTRIBUTION TO INDIA’S GDP … (1/2)
18
25
24
26
31
31
36
40
.1
40
.58
42
.80
71
.53
76
.46
14
7.9
6
0
20
40
60
80
100
120
140
160
200
6
200
7
200
8
200
9
201
0
201
1
201
2
201
3
201
4
201
5
201
6
201
7E
202
7F
Source: World Travel and Tourism Council’s Economic Impact 2017, News Article, Aranca Research
Tourism in India accounts for 9.6 per cent of the GDP and is the 3rd
largest foreign exchange earner for the country
The tourism and hospitality sector’s direct contribution to GDP in
2016, was US$ 71.53 billion
During 2006–17E, direct contribution of tourism and hospitality to
GDP is expected to register a CAGR of 14.05 per cent
The direct contribution of travel and tourism to GDP is expected to
reach US$ 147.96 billion by 2027
Visakhapatnam port traffic (million tonnes) Direct contribution of tourism and hospitality to GDP
(US$ billion)
CAGR 14.05%
Notes: CAGR – Compound Annual Growth Rate, E - Estimates, GDP stands for Gross Domestic Product, The definition of direct, indirect and induced contribution is specified in the
Glossary on Slide 41
For updated information, please visit www.ibef.org Tourism and Hospitality 11
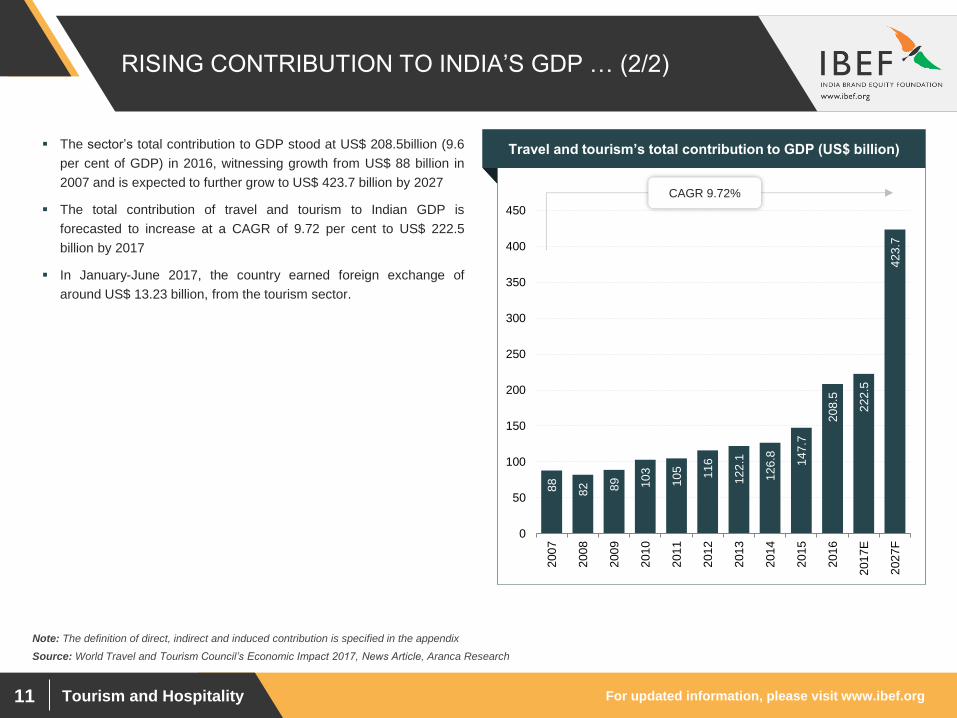
RISING CONTRIBUTION TO INDIA’S GDP … (2/2)
88
82
89
10
3
10
5
11
6
12
2.1
12
6.8
14
7.7
20
8.5
22
2.5
42
3.7
0
50
100
150
200
250
300
350
400
450
200
7
200
8
200
9
201
0
201
1
201
2
201
3
201
4
201
5
201
6
201
7E
202
7F
Source: World Travel and Tourism Council’s Economic Impact 2017, News Article, Aranca Research
The sector’s total contribution to GDP stood at US$ 208.5billion (9.6
per cent of GDP) in 2016, witnessing growth from US$ 88 billion in
2007 and is expected to further grow to US$ 423.7 billion by 2027
The total contribution of travel and tourism to Indian GDP is
forecasted to increase at a CAGR of 9.72 per cent to US$ 222.5
billion by 2017
In January-June 2017, the country earned foreign exchange of
around US$ 13.23 billion, from the tourism sector.
Visakhapatnam port traffic (million tonnes) Travel and tourism’s total contribution to GDP (US$ billion)
CAGR 9.72%
Note: The definition of direct, indirect and induced contribution is specified in the appendix
For updated information, please visit www.ibef.org Tourism and Hospitality 12
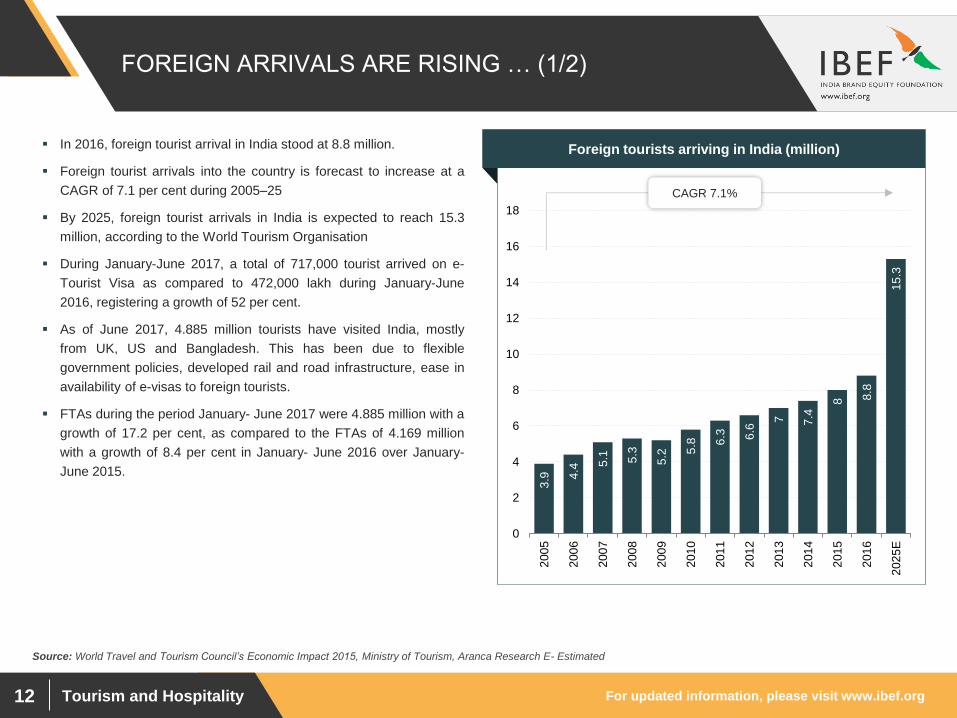
FOREIGN ARRIVALS ARE RISING … (1/2)
3.9
4.4
5.1
5.3
5.2
5.8
6.3
6.6
7
7.4
8 8.8
15
.3
0
2
4
6
8
10
12
14
16
18
200
5
200
6
200
7
200
8
200
9
201
0
201
1
201
2
201
3
201
4
201
5
201
6
202
5E
Source: World Travel and Tourism Council’s Economic Impact 2015, Ministry of Tourism, Aranca Research E- Estimated
In 2016, foreign tourist arrival in India stood at 8.8 million.
Foreign tourist arrivals into the country is forecast to increase at a
CAGR of 7.1 per cent during 2005–25
By 2025, foreign tourist arrivals in India is expected to reach 15.3
million, according to the World Tourism Organisation
During January-June 2017, a total of 717,000 tourist arrived on e-
Tourist Visa as compared to 472,000 lakh during January-June
2016, registering a growth of 52 per cent.
As of June 2017, 4.885 million tourists have visited India, mostly
from UK, US and Bangladesh. This has been due to flexible
government policies, developed rail and road infrastructure, ease in
availability of e-visas to foreign tourists.
FTAs during the period January- June 2017 were 4.885 million with a
growth of 17.2 per cent, as compared to the FTAs of 4.169 million
with a growth of 8.4 per cent in January- June 2016 over January-
June 2015.
Visakhapatnam port traffic (million tonnes) Foreign tourists arriving in India (million)
CAGR 7.1%
For updated information, please visit www.ibef.org Tourism and Hospitality 13
FOREIGN ARRIVALS ARE RISING … (2/2)
8.6
10
.7
11
.8
11
.4
14
.2
16
.6
17
.7
18
.4 2
0.2
21
.1 23
.15
0
5
10
15
20
25
2006 2007 2008 2009 2010 2011 2012 2013 2014 2015 2016
Source: Ministry of Tourism, Aranca Research
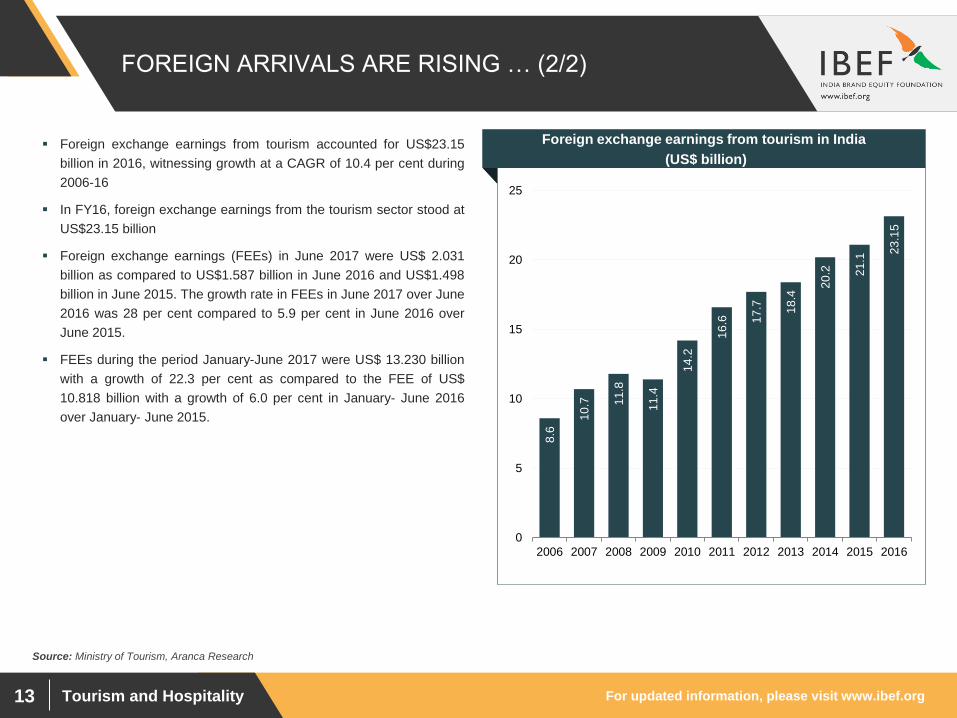
Foreign exchange earnings from tourism accounted for US$23.15
billion in 2016, witnessing growth at a CAGR of 10.4 per cent during
2006-16
In FY16, foreign exchange earnings from the tourism sector stood at
US$23.15 billion
Foreign exchange earnings (FEEs) in June 2017 were US$ 2.031
billion as compared to US$1.587 billion in June 2016 and US$1.498
billion in June 2015. The growth rate in FEEs in June 2017 over June
2016 was 28 per cent compared to 5.9 per cent in June 2016 over
June 2015.
FEEs during the period January-June 2017 were US$ 13.230 billion
with a growth of 22.3 per cent as compared to the FEE of US$
10.818 billion with a growth of 6.0 per cent in January- June 2016
over January- June 2015.
Visakhapatnam port traffic (million tonnes) Foreign exchange earnings from tourism in India
(US$ billion)
For updated information, please visit www.ibef.org Tourism and Hospitality 14
MAJOR COMPANIES ACROSS SEGMENTS
Source: Respective company websites
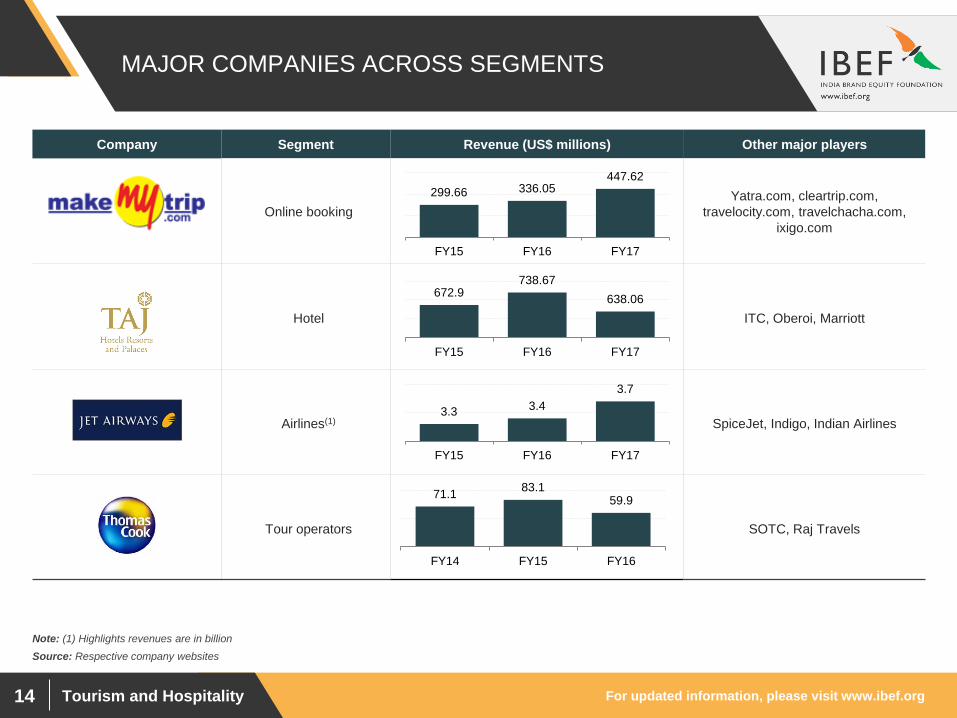
Company Segment Revenue (US$ millions) Other major players
Online booking
Yatra.com, cleartrip.com,
travelocity.com, travelchacha.com,
ixigo.com
Hotel ITC, Oberoi, Marriott
Airlines(1) SpiceJet, Indigo, Indian Airlines
Tour operators SOTC, Raj Travels
Note: (1) Highlights revenues are in billion
672.9 738.67
638.06
FY15 FY16 FY17
299.66 336.05 447.62
FY15 FY16 FY17
3.3 3.4
3.7
FY15 FY16 FY17
71.1 83.1
59.9
FY14 FY15 FY16
For updated information, please visit www.ibef.org Tourism and Hospitality 15
DOMESTIC CONSUMERS TO LEAD GROWTH
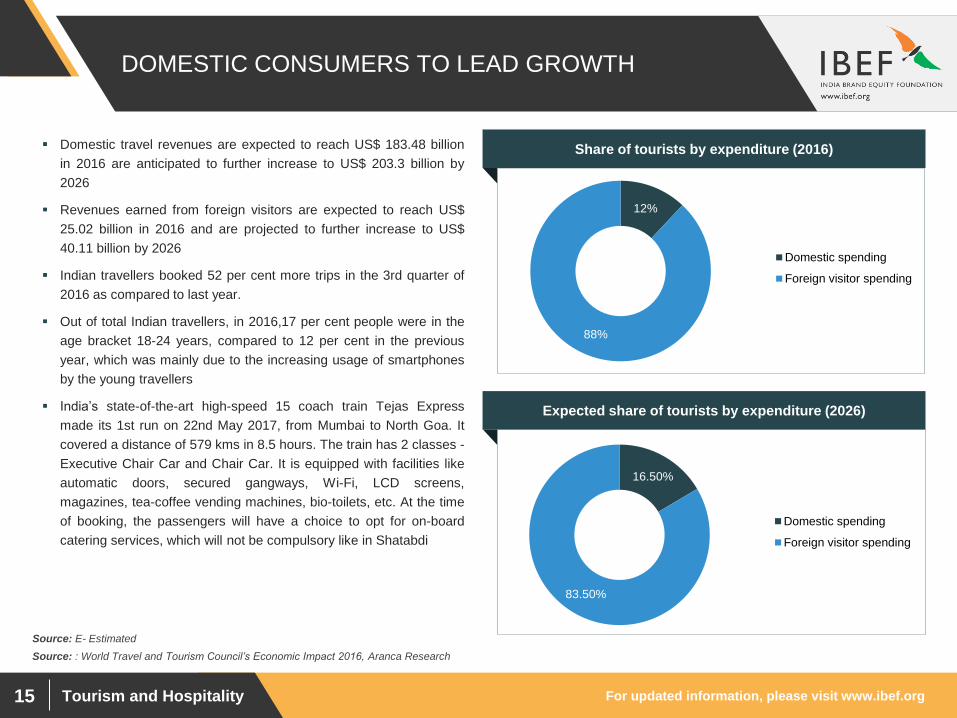
12%
88%
Domestic spending
Foreign visitor spending
Source: : World Travel and Tourism Council’s Economic Impact 2016, Aranca Research
Domestic travel revenues are expected to reach US$ 183.48 billion
in 2016 are anticipated to further increase to US$ 203.3 billion by
2026
Revenues earned from foreign visitors are expected to reach US$
25.02 billion in 2016 and are projected to further increase to US$
40.11 billion by 2026
Indian travellers booked 52 per cent more trips in the 3rd quarter of
2016 as compared to last year.
Out of total Indian travellers, in 2016,17 per cent people were in the
age bracket 18-24 years, compared to 12 per cent in the previous
year, which was mainly due to the increasing usage of smartphones
by the young travellers
India’s state-of-the-art high-speed 15 coach train Tejas Express
made its 1st run on 22nd May 2017, from Mumbai to North Goa. It
covered a distance of 579 kms in 8.5 hours. The train has 2 classes -
Executive Chair Car and Chair Car. It is equipped with facilities like
automatic doors, secured gangways, Wi-Fi, LCD screens,
magazines, tea-coffee vending machines, bio-toilets, etc. At the time
of booking, the passengers will have a choice to opt for on-board
catering services, which will not be compulsory like in Shatabdi
Source: E- Estimated
Share of tourists by expenditure (2016)
Expected share of tourists by expenditure (2026)
16.50%
83.50%
Domestic spending
Foreign visitor spending
For updated information, please visit www.ibef.org Tourism and Hospitality 16
RISING REVENUES FROM LEISURE AND BUSINESS
SEGMENTS
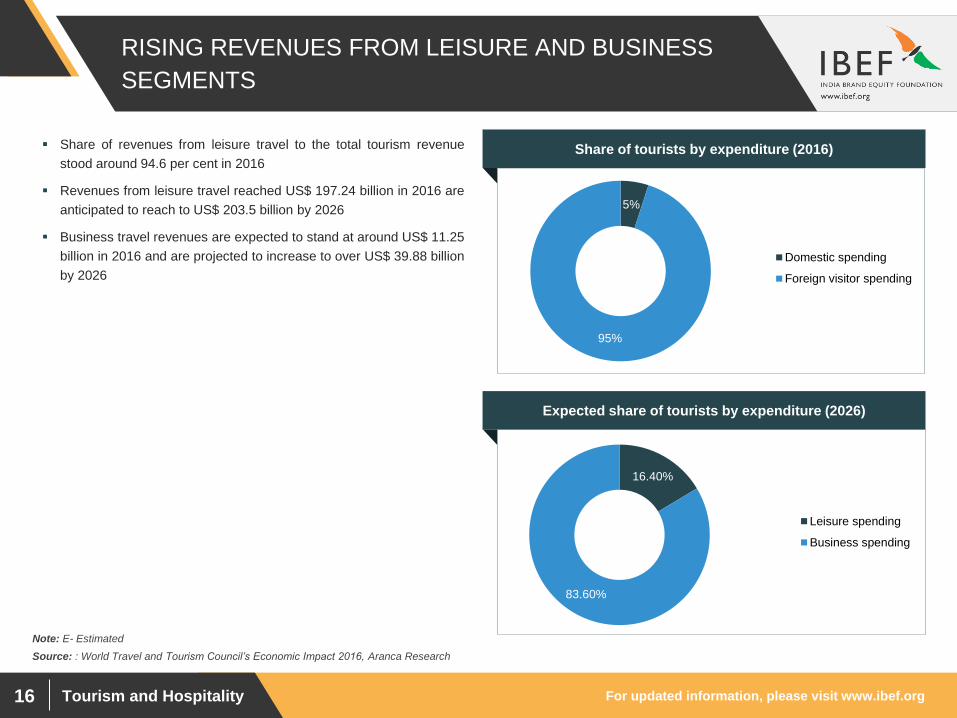
Share of revenues from leisure travel to the total tourism revenue
stood around 94.6 per cent in 2016
Revenues from leisure travel reached US$ 197.24 billion in 2016 are
anticipated to reach to US$ 203.5 billion by 2026
Business travel revenues are expected to stand at around US$ 11.25
billion in 2016 and are projected to increase to over US$ 39.88 billion
by 2026
Source: : World Travel and Tourism Council’s Economic Impact 2016, Aranca Research
Note: E- Estimated
5%
95%
Domestic spending
Foreign visitor spending
Share of tourists by expenditure (2016)
Expected share of tourists by expenditure (2026)
16.40%
83.60%
Leisure spending
Business spending
For updated information, please visit www.ibef.org Tourism and Hospitality 17
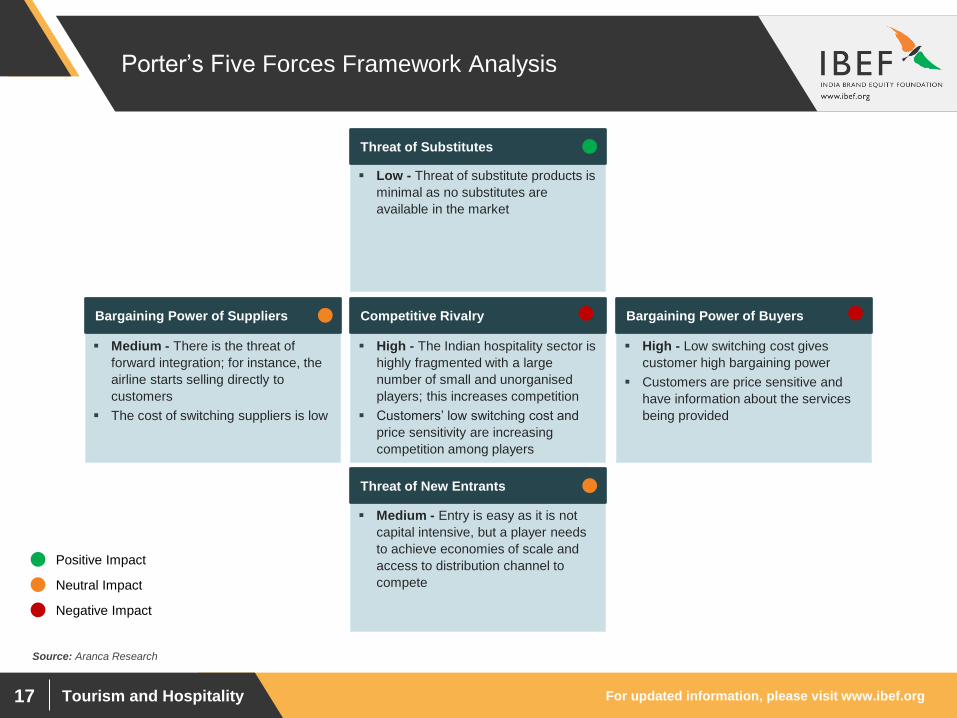
Porter’s Five Forces Framework Analysis
Medium - There is the threat of
forward integration; for instance, the
airline starts selling directly to
customers
The cost of switching suppliers is low
Bargaining Power of Suppliers
Low - Threat of substitute products is
minimal as no substitutes are
available in the market
Threat of Substitutes
High - The Indian hospitality sector is
highly fragmented with a large
number of small and unorganised
players; this increases competition
Customers’ low switching cost and
price sensitivity are increasing
competition among players
Competitive Rivalry
Medium - Entry is easy as it is not
capital intensive, but a player needs
to achieve economies of scale and
access to distribution channel to
compete
Threat of New Entrants
High - Low switching cost gives
customer high bargaining power
Customers are price sensitive and
have information about the services
being provided
Bargaining Power of Buyers
Positive Impact
Neutral Impact
Negative Impact
Source: Aranca Research

Tourism and Hospitality
RECENT TRENDS
AND STRATEGIES
For updated information, please visit www.ibef.org Tourism and Hospitality 19
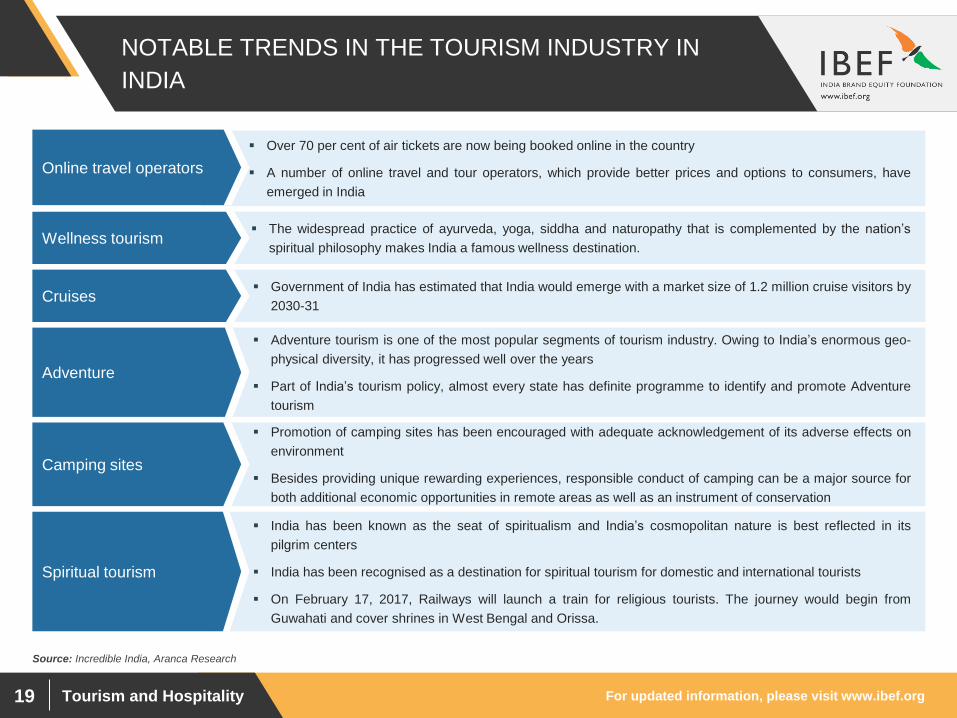
Over 70 per cent of air tickets are now being booked online in the country
A number of online travel and tour operators, which provide better prices and options to consumers, have
emerged in India
The widespread practice of ayurveda, yoga, siddha and naturopathy that is complemented by the nation’s
spiritual philosophy makes India a famous wellness destination.
Government of India has estimated that India would emerge with a market size of 1.2 million cruise visitors by
2030-31
Adventure tourism is one of the most popular segments of tourism industry. Owing to India’s enormous geo-
physical diversity, it has progressed well over the years
Part of India’s tourism policy, almost every state has definite programme to identify and promote Adventure
tourism
Promotion of camping sites has been encouraged with adequate acknowledgement of its adverse effects on
environment
Besides providing unique rewarding experiences, responsible conduct of camping can be a major source for
both additional economic opportunities in remote areas as well as an instrument of conservation
India has been known as the seat of spiritualism and India’s cosmopolitan nature is best reflected in its
pilgrim centers
India has been recognised as a destination for spiritual tourism for domestic and international tourists
On February 17, 2017, Railways will launch a train for religious tourists. The journey would begin from
Guwahati and cover shrines in West Bengal and Orissa.
NOTABLE TRENDS IN THE TOURISM INDUSTRY IN
INDIA
Online travel operators
Source: Incredible India, Aranca Research
Wellness tourism
Cruises
Adventure
Camping sites
Spiritual tourism
For updated information, please visit www.ibef.org Tourism and Hospitality 20
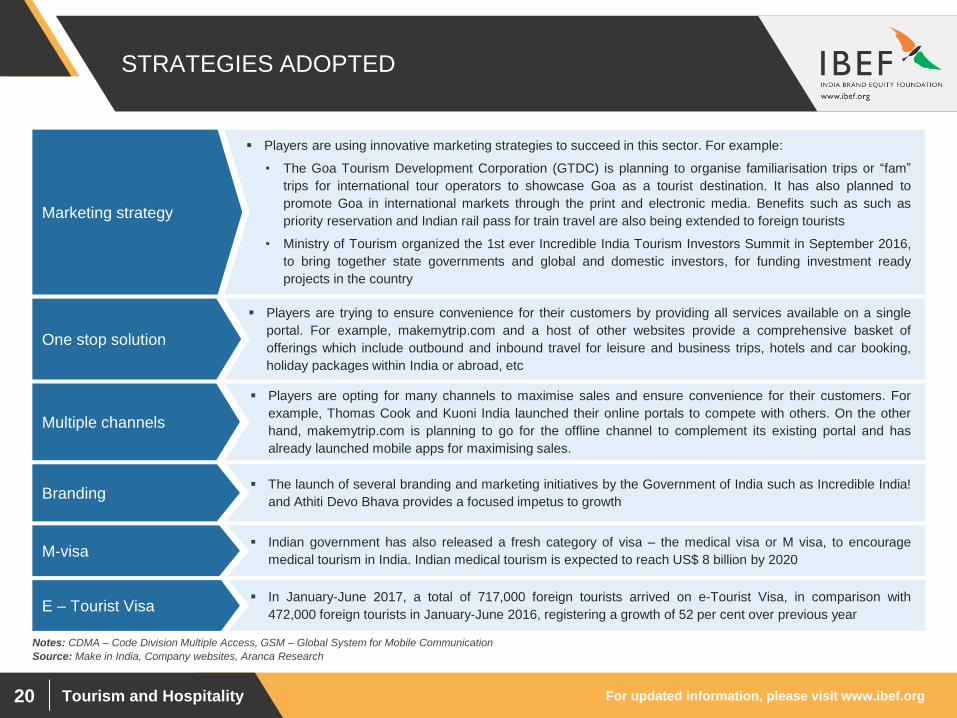
Players are opting for many channels to maximise sales and ensure convenience for their customers. For
example, Thomas Cook and Kuoni India launched their online portals to compete with others. On the other
hand, makemytrip.com is planning to go for the offline channel to complement its existing portal and has
already launched mobile apps for maximising sales.
The launch of several branding and marketing initiatives by the Government of India such as Incredible India!
and Athiti Devo Bhava provides a focused impetus to growth
Indian government has also released a fresh category of visa – the medical visa or M visa, to encourage
medical tourism in India. Indian medical tourism is expected to reach US$ 8 billion by 2020
In January-June 2017, a total of 717,000 foreign tourists arrived on e-Tourist Visa, in comparison with
472,000 foreign tourists in January-June 2016, registering a growth of 52 per cent over previous year
Players are trying to ensure convenience for their customers by providing all services available on a single
portal. For example, makemytrip.com and a host of other websites provide a comprehensive basket of
offerings which include outbound and inbound travel for leisure and business trips, hotels and car booking,
holiday packages within India or abroad, etc
Players are using innovative marketing strategies to succeed in this sector. For example:
• The Goa Tourism Development Corporation (GTDC) is planning to organise familiarisation trips or “fam”
trips for international tour operators to showcase Goa as a tourist destination. It has also planned to
promote Goa in international markets through the print and electronic media. Benefits such as such as
priority reservation and Indian rail pass for train travel are also being extended to foreign tourists
• Ministry of Tourism organized the 1st ever Incredible India Tourism Investors Summit in September 2016,
to bring together state governments and global and domestic investors, for funding investment ready
projects in the country
STRATEGIES ADOPTED
Marketing strategy
Source: Make in India, Company websites, Aranca Research
One stop solution
Notes: CDMA – Code Division Multiple Access, GSM – Global System for Mobile Communication
Multiple channels
Branding
M-visa
E – Tourist Visa

Tourism and Hospitality
GROWTH DRIVERS
For updated information, please visit www.ibef.org Tourism and Hospitality 22
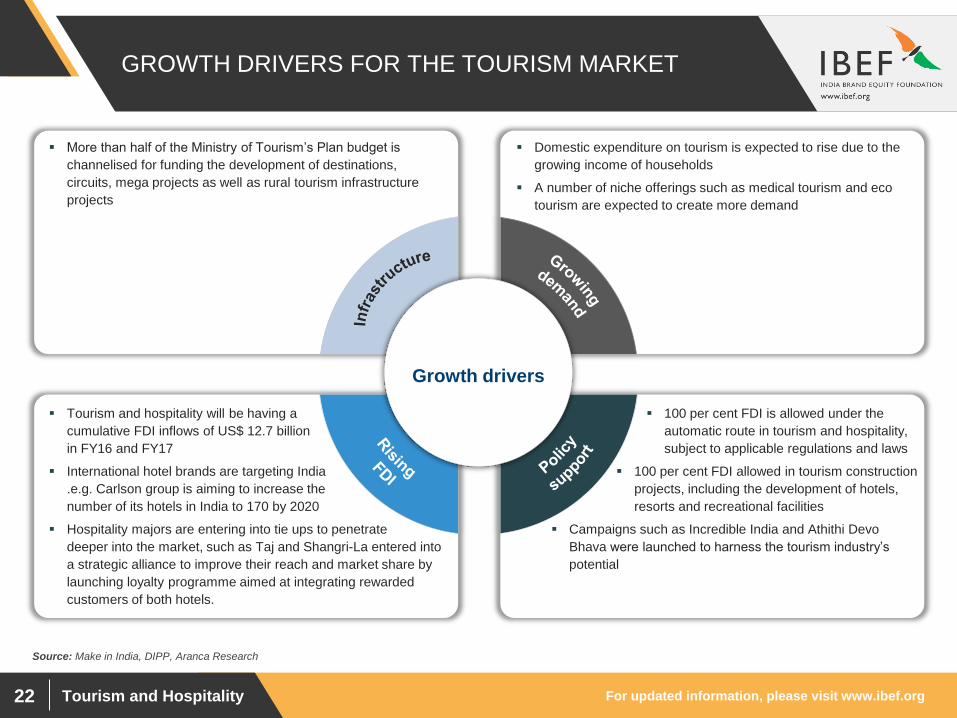
GROWTH DRIVERS FOR THE TOURISM MARKET
More than half of the Ministry of Tourism’s Plan budget is
channelised for funding the development of destinations,
circuits, mega projects as well as rural tourism infrastructure
projects
Domestic expenditure on tourism is expected to rise due to the
growing income of households
A number of niche offerings such as medical tourism and eco
tourism are expected to create more demand
Tourism and hospitality will be having a
cumulative FDI inflows of US$ 12.7 billion
in FY16 and FY17
International hotel brands are targeting India
.e.g. Carlson group is aiming to increase the
number of its hotels in India to 170 by 2020
Hospitality majors are entering into tie ups to penetrate
deeper into the market, such as Taj and Shangri-La entered into
a strategic alliance to improve their reach and market share by
launching loyalty programme aimed at integrating rewarded
customers of both hotels.
100 per cent FDI is allowed under the
automatic route in tourism and hospitality,
subject to applicable regulations and laws
100 per cent FDI allowed in tourism construction
projects, including the development of hotels,
resorts and recreational facilities
Campaigns such as Incredible India and Athithi Devo
Bhava were launched to harness the tourism industry’s
potential
Growth drivers
Source: Make in India, DIPP, Aranca Research
For updated information, please visit www.ibef.org Tourism and Hospitality 23
RISE IN INCOME AND CHANGING DEMOGRAPHICS
BOOSTING DEMAND
14
30
.2
15
52
.5
15
14
.8
15
04
.5
16
00
.9
16
17
.3
17
47
.5
18
74
.9
20
26
.7
22
07
.6
0
500
1,000
1,500
2,000
2,500
FY
10
FY
11
FY
12
FY
13
FY
14
FY
15
FY
16
FY
17
F
FY
18
F
FY
19
F
Source: IMF, Aranca Research
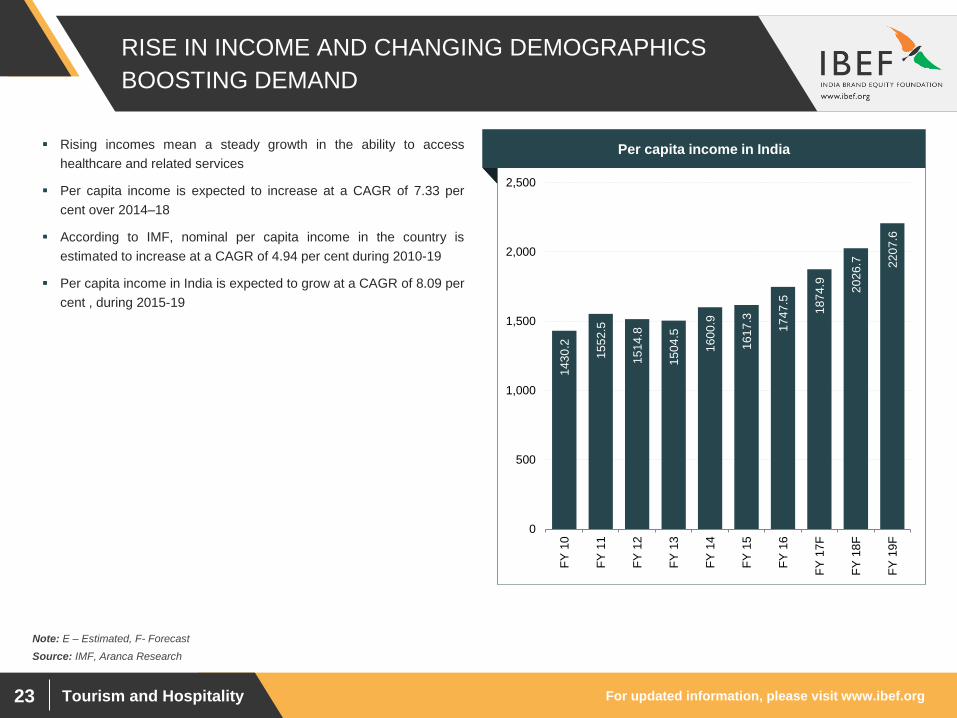
Rising incomes mean a steady growth in the ability to access
healthcare and related services
Per capita income is expected to increase at a CAGR of 7.33 per
cent over 2014–18
According to IMF, nominal per capita income in the country is
estimated to increase at a CAGR of 4.94 per cent during 2010-19
Per capita income in India is expected to grow at a CAGR of 8.09 per
cent , during 2015-19
Visakhapatnam port traffic (million tonnes) Per capita income in India
Note: E – Estimated, F- Forecast
For updated information, please visit www.ibef.org Tourism and Hospitality 24
INCREASING SPENDING ON TOURISM
62
.9
58
.6
66
.1
79
.7
89
.7
85
.7
89
96
.70
16
7.1
7
17
8.8
4
35
6.1
3
0
50
100
150
200
250
300
350
400
200
8
200
9
201
0
201
1
201
2
201
3
201
4
201
5
201
6
201
7E
202
7F
Source: WTTC - Travel and Tourism Economic Impact 2017, Aranca Research
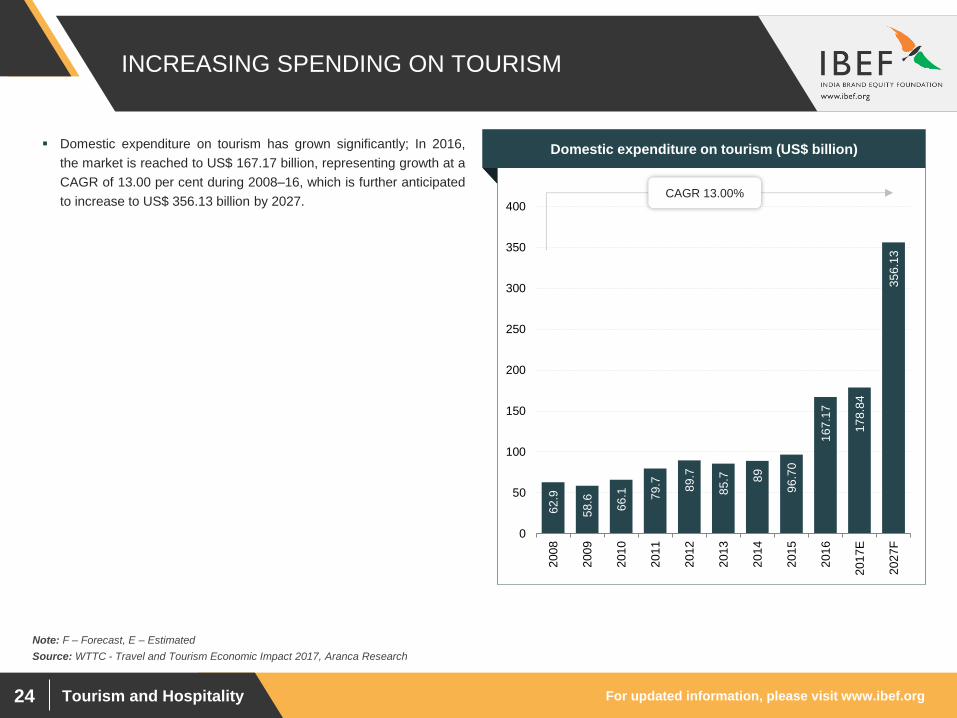
Visakhapatnam port traffic (million tonnes) Domestic expenditure on tourism (US$ billion)
CAGR 13.00%
Domestic expenditure on tourism has grown significantly; In 2016,
the market is reached to US$ 167.17 billion, representing growth at a
CAGR of 13.00 per cent during 2008–16, which is further anticipated
to increase to US$ 356.13 billion by 2027.
Note: F – Forecast, E – Estimated
For updated information, please visit www.ibef.org Tourism and Hospitality 25
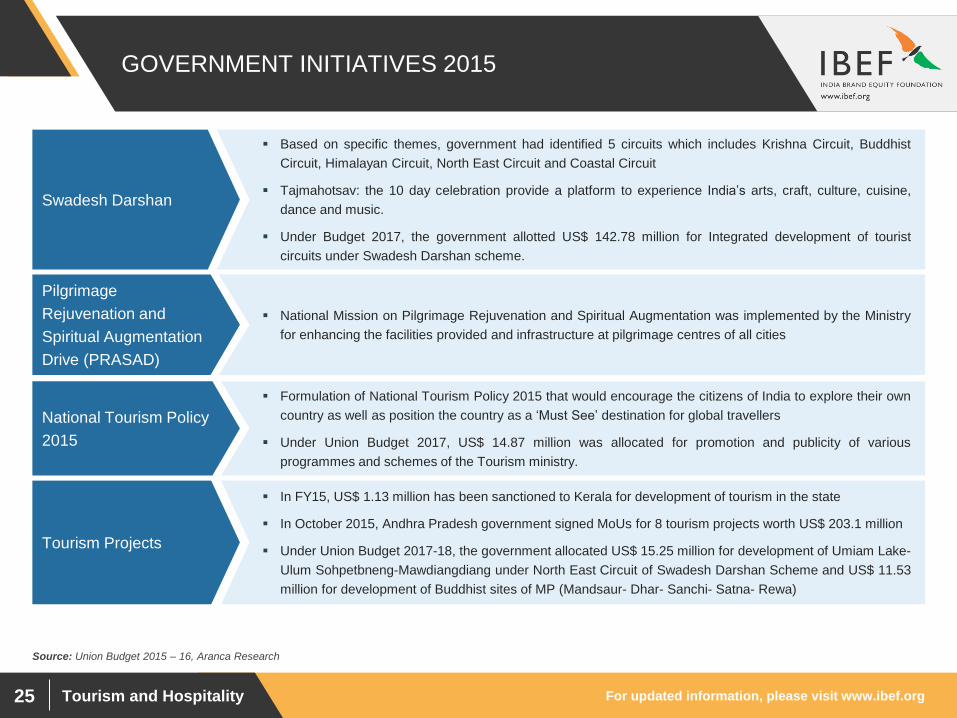
National Mission on Pilgrimage Rejuvenation and Spiritual Augmentation was implemented by the Ministry
for enhancing the facilities provided and infrastructure at pilgrimage centres of all cities
Formulation of National Tourism Policy 2015 that would encourage the citizens of India to explore their own
country as well as position the country as a ‘Must See’ destination for global travellers
Under Union Budget 2017, US$ 14.87 million was allocated for promotion and publicity of various
programmes and schemes of the Tourism ministry.
In FY15, US$ 1.13 million has been sanctioned to Kerala for development of tourism in the state
In October 2015, Andhra Pradesh government signed MoUs for 8 tourism projects worth US$ 203.1 million
Under Union Budget 2017-18, the government allocated US$ 15.25 million for development of Umiam Lake-
Ulum Sohpetbneng-Mawdiangdiang under North East Circuit of Swadesh Darshan Scheme and US$ 11.53
million for development of Buddhist sites of MP (Mandsaur- Dhar- Sanchi- Satna- Rewa)
GOVERNMENT INITIATIVES 2015
Based on specific themes, government had identified 5 circuits which includes Krishna Circuit, Buddhist
Circuit, Himalayan Circuit, North East Circuit and Coastal Circuit
Tajmahotsav: the 10 day celebration provide a platform to experience India’s arts, craft, culture, cuisine,
dance and music.
Under Budget 2017, the government allotted US$ 142.78 million for Integrated development of tourist
circuits under Swadesh Darshan scheme.
Swadesh Darshan
Source: Union Budget 2015 – 16, Aranca Research
Pilgrimage
Rejuvenation and
Spiritual Augmentation
Drive (PRASAD)
National Tourism Policy
2015
Tourism Projects
For updated information, please visit www.ibef.org Tourism and Hospitality 26
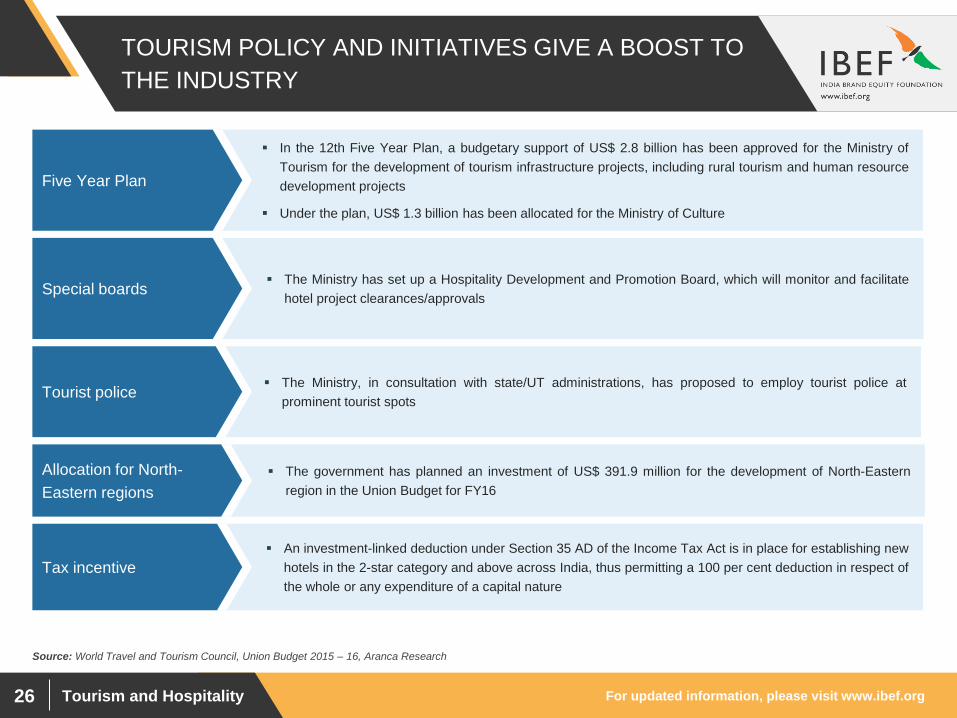
An investment-linked deduction under Section 35 AD of the Income Tax Act is in place for establishing new
hotels in the 2-star category and above across India, thus permitting a 100 per cent deduction in respect of
the whole or any expenditure of a capital nature
The government has planned an investment of US$ 391.9 million for the development of North-Eastern
region in the Union Budget for FY16
Allocation for North-
Eastern regions
The Ministry, in consultation with state/UT administrations, has proposed to employ tourist police at
prominent tourist spots Tourist police
The Ministry has set up a Hospitality Development and Promotion Board, which will monitor and facilitate
hotel project clearances/approvals
TOURISM POLICY AND INITIATIVES GIVE A BOOST TO
THE INDUSTRY
In the 12th Five Year Plan, a budgetary support of US$ 2.8 billion has been approved for the Ministry of
Tourism for the development of tourism infrastructure projects, including rural tourism and human resource
development projects
Under the plan, US$ 1.3 billion has been allocated for the Ministry of Culture
Five Year Plan
Source: World Travel and Tourism Council, Union Budget 2015 – 16, Aranca Research
Special boards
Tax incentive
For updated information, please visit www.ibef.org Tourism and Hospitality 27
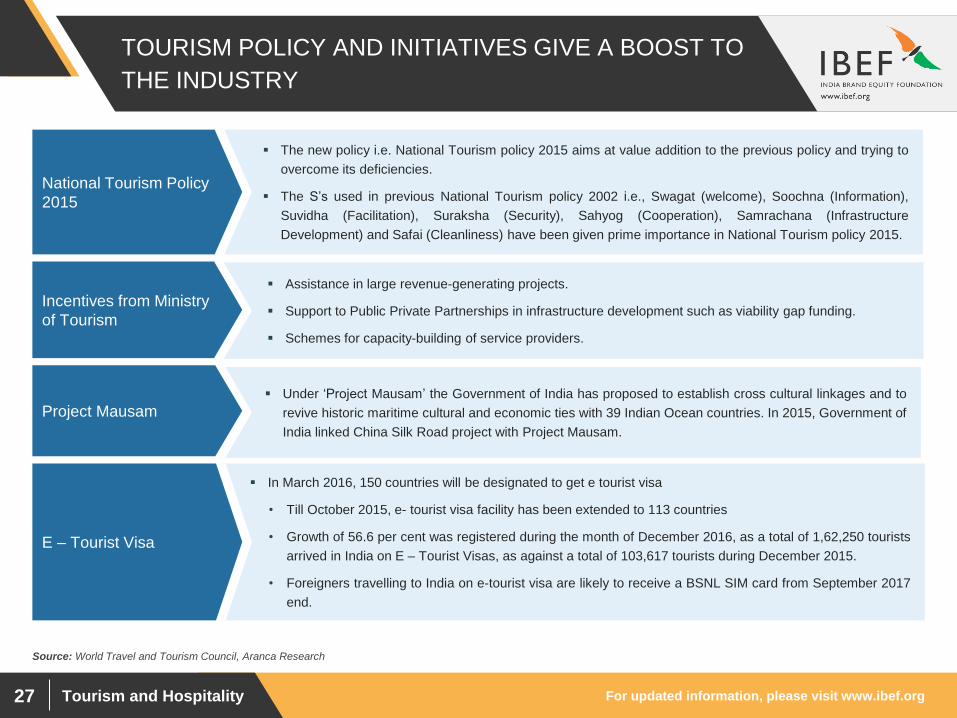
Assistance in large revenue-generating projects.
Support to Public Private Partnerships in infrastructure development such as viability gap funding.
Schemes for capacity-building of service providers.
Under ‘Project Mausam’ the Government of India has proposed to establish cross cultural linkages and to
revive historic maritime cultural and economic ties with 39 Indian Ocean countries. In 2015, Government of
India linked China Silk Road project with Project Mausam.
In March 2016, 150 countries will be designated to get e tourist visa
• Till October 2015, e- tourist visa facility has been extended to 113 countries
• Growth of 56.6 per cent was registered during the month of December 2016, as a total of 1,62,250 tourists
arrived in India on E – Tourist Visas, as against a total of 103,617 tourists during December 2015.
• Foreigners travelling to India on e-tourist visa are likely to receive a BSNL SIM card from September 2017
end.
TOURISM POLICY AND INITIATIVES GIVE A BOOST TO
THE INDUSTRY
The new policy i.e. National Tourism policy 2015 aims at value addition to the previous policy and trying to
overcome its deficiencies.
The S’s used in previous National Tourism policy 2002 i.e., Swagat (welcome), Soochna (Information),
Suvidha (Facilitation), Suraksha (Security), Sahyog (Cooperation), Samrachana (Infrastructure
Development) and Safai (Cleanliness) have been given prime importance in National Tourism policy 2015.
National Tourism Policy
2015
Source: World Travel and Tourism Council, Aranca Research
Incentives from Ministry
of Tourism
Project Mausam
E – Tourist Visa
For updated information, please visit www.ibef.org Tourism and Hospitality 28
CONTINUED GROWTH IN INVESTMENTS IN THE
TOURISM SECTOR
33
.7 2
3.8
28
.9
33
.0
31
.3
32
.2
35
.0
34
.6
36
.3
12
5.9
0
20
40
60
80
100
120
140
2008 2009 2010 2011 2012 2013 2014 2015 2016E 2025F
Source: World Travel and Tourism Council’s Economic Impact 2015, Aranca Research
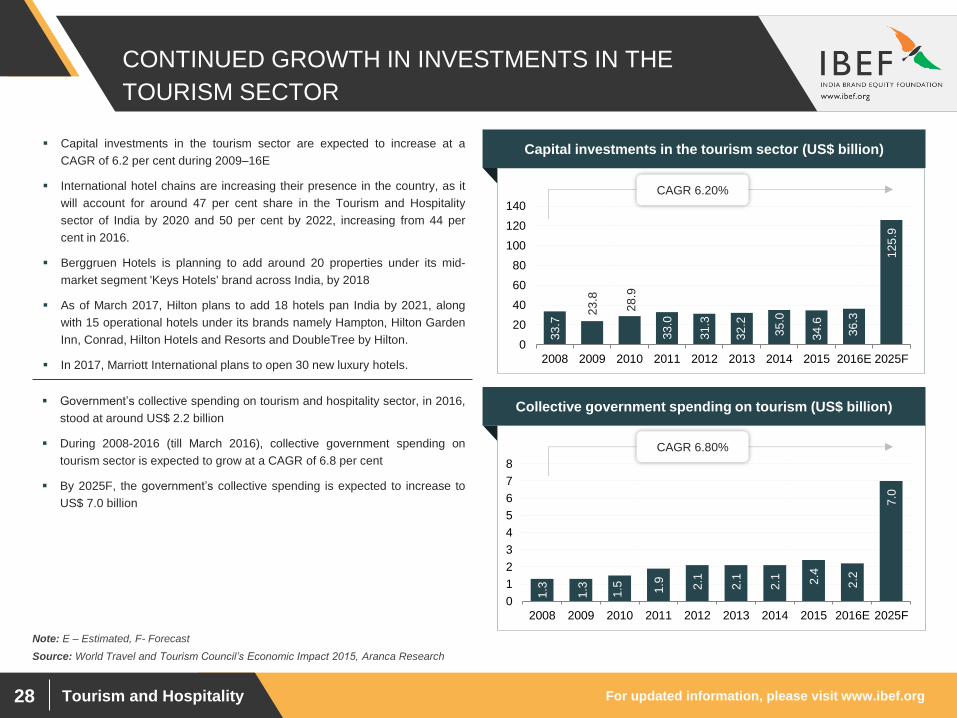
Capital investments in the tourism sector are expected to increase at a
CAGR of 6.2 per cent during 2009–16E
International hotel chains are increasing their presence in the country, as it
will account for around 47 per cent share in the Tourism and Hospitality
sector of India by 2020 and 50 per cent by 2022, increasing from 44 per
cent in 2016.
Berggruen Hotels is planning to add around 20 properties under its mid-
market segment 'Keys Hotels' brand across India, by 2018
As of March 2017, Hilton plans to add 18 hotels pan India by 2021, along
with 15 operational hotels under its brands namely Hampton, Hilton Garden
Inn, Conrad, Hilton Hotels and Resorts and DoubleTree by Hilton.
In 2017, Marriott International plans to open 30 new luxury hotels.
Government’s collective spending on tourism and hospitality sector, in 2016,
stood at around US$ 2.2 billion
During 2008-2016 (till March 2016), collective government spending on
tourism sector is expected to grow at a CAGR of 6.8 per cent
By 2025F, the government’s collective spending is expected to increase to
US$ 7.0 billion
CAGR 6.20%
1.3
1.3
1.5
1.9
2.1
2.1
2.1
2.4
2.2
7.0
0
1
2
3
4
5
6
7
8
2008 2009 2010 2011 2012 2013 2014 2015 2016E 2025F
CAGR 6.80%
Note: E – Estimated, F- Forecast
Capital investments in the tourism sector (US$ billion)
Collective government spending on tourism (US$ billion)
For updated information, please visit www.ibef.org Tourism and Hospitality 29
GROWTH IN VISA ON ARRIVAL
20
10
20
11
20
12
20
13
20
14
20
15
20
16
65
94
12
76
1
16
08
4
20
29
4
39
04
8
44
53
00
10
79
69
6
0
2,00,000
4,00,000
6,00,000
8,00,000
10,00,000
12,00,000
1 2 3 4 5 6 7
Source: Ministry of Tourism, Aranca Research
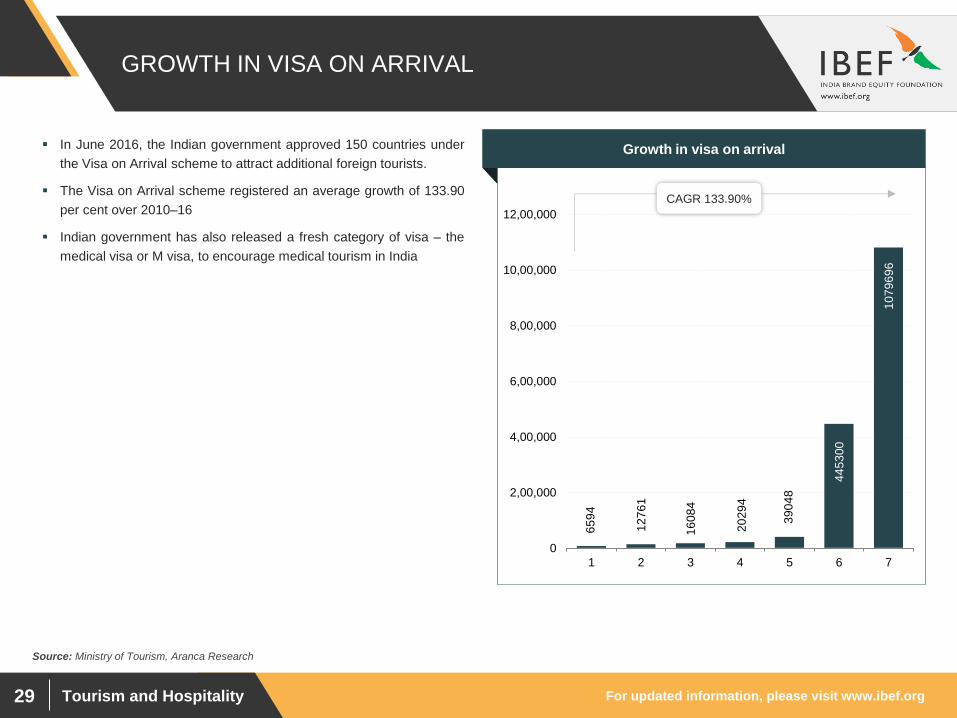
In June 2016, the Indian government approved 150 countries under
the Visa on Arrival scheme to attract additional foreign tourists.
The Visa on Arrival scheme registered an average growth of 133.90
per cent over 2010–16
Indian government has also released a fresh category of visa – the
medical visa or M visa, to encourage medical tourism in India
Visakhapatnam port traffic (million tonnes) Growth in visa on arrival
CAGR 133.90%

Tourism and Hospitality
OPPORTUNITIES
For updated information, please visit www.ibef.org Tourism and Hospitality 31
NICHE SEGMENTS OFFER GOOD OPPORTUNITIES
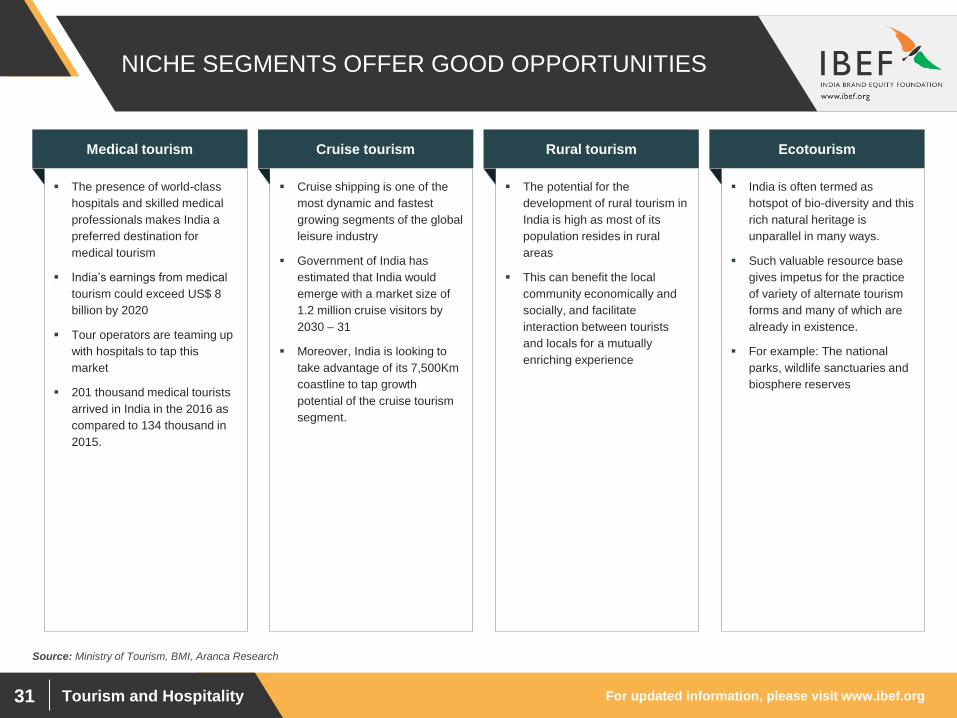
The presence of world-class
hospitals and skilled medical
professionals makes India a
preferred destination for
medical tourism
India’s earnings from medical
tourism could exceed US$ 8
billion by 2020
Tour operators are teaming up
with hospitals to tap this
market
201 thousand medical tourists
arrived in India in the 2016 as
compared to 134 thousand in
2015.
Medical tourism
Cruise shipping is one of the
most dynamic and fastest
growing segments of the global
leisure industry
Government of India has
estimated that India would
emerge with a market size of
1.2 million cruise visitors by
2030 – 31
Moreover, India is looking to
take advantage of its 7,500Km
coastline to tap growth
potential of the cruise tourism
segment.
Cruise tourism
The potential for the
development of rural tourism in
India is high as most of its
population resides in rural
areas
This can benefit the local
community economically and
socially, and facilitate
interaction between tourists
and locals for a mutually
enriching experience
Rural tourism
India is often termed as
hotspot of bio-diversity and this
rich natural heritage is
unparallel in many ways.
Such valuable resource base
gives impetus for the practice
of variety of alternate tourism
forms and many of which are
already in existence.
For example: The national
parks, wildlife sanctuaries and
biosphere reserves
Ecotourism
Source: Ministry of Tourism, BMI, Aranca Research
For updated information, please visit www.ibef.org Tourism and Hospitality 32
LEADING STATES/UTs IN TERMS OF FOREIGN
TOURISTS
Note: As per latest data available
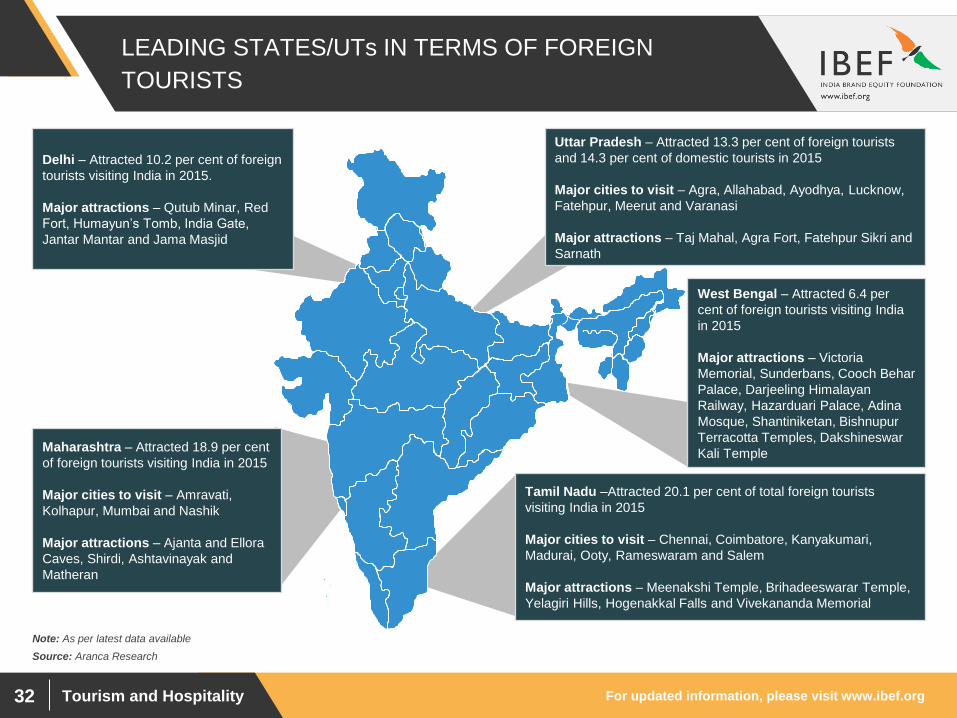
Tamil Nadu –Attracted 20.1 per cent of total foreign tourists
visiting India in 2015
Major cities to visit – Chennai, Coimbatore, Kanyakumari,
Madurai, Ooty, Rameswaram and Salem
Major attractions – Meenakshi Temple, Brihadeeswarar Temple,
Yelagiri Hills, Hogenakkal Falls and Vivekananda Memorial
Uttar Pradesh – Attracted 13.3 per cent of foreign tourists
and 14.3 per cent of domestic tourists in 2015
Major cities to visit – Agra, Allahabad, Ayodhya, Lucknow,
Fatehpur, Meerut and Varanasi
Major attractions – Taj Mahal, Agra Fort, Fatehpur Sikri and
Sarnath
Delhi – Attracted 10.2 per cent of foreign
tourists visiting India in 2015.
Major attractions – Qutub Minar, Red
Fort, Humayun’s Tomb, India Gate,
Jantar Mantar and Jama Masjid
Maharashtra – Attracted 18.9 per cent
of foreign tourists visiting India in 2015
Major cities to visit – Amravati,
Kolhapur, Mumbai and Nashik
Major attractions – Ajanta and Ellora
Caves, Shirdi, Ashtavinayak and
Matheran
West Bengal – Attracted 6.4 per
cent of foreign tourists visiting India
in 2015
Major attractions – Victoria
Memorial, Sunderbans, Cooch Behar
Palace, Darjeeling Himalayan
Railway, Hazarduari Palace, Adina
Mosque, Shantiniketan, Bishnupur
Terracotta Temples, Dakshineswar
Kali Temple
Source: Aranca Research
For updated information, please visit www.ibef.org Tourism and Hospitality 33
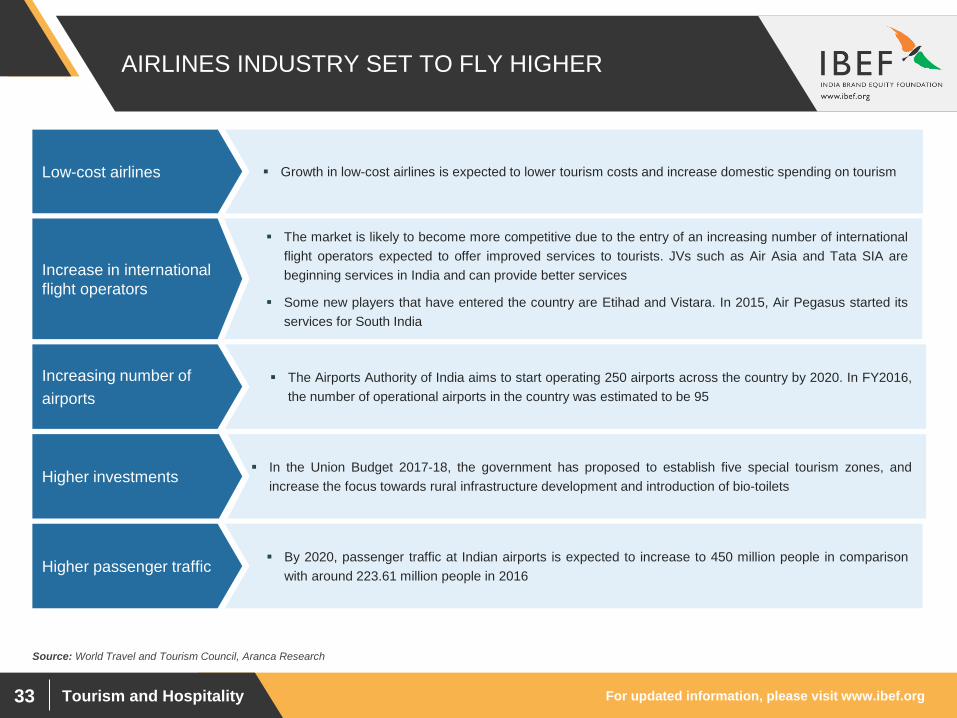
The market is likely to become more competitive due to the entry of an increasing number of international
flight operators expected to offer improved services to tourists. JVs such as Air Asia and Tata SIA are
beginning services in India and can provide better services
Some new players that have entered the country are Etihad and Vistara. In 2015, Air Pegasus started its
services for South India
The Airports Authority of India aims to start operating 250 airports across the country by 2020. In FY2016,
the number of operational airports in the country was estimated to be 95
In the Union Budget 2017-18, the government has proposed to establish five special tourism zones, and
increase the focus towards rural infrastructure development and introduction of bio-toilets
By 2020, passenger traffic at Indian airports is expected to increase to 450 million people in comparison
with around 223.61 million people in 2016
AIRLINES INDUSTRY SET TO FLY HIGHER
Growth in low-cost airlines is expected to lower tourism costs and increase domestic spending on tourism Low-cost airlines
Source: World Travel and Tourism Council, Aranca Research
Increase in international
flight operators
Increasing number of
airports
Higher investments
Higher passenger traffic

Tourism and Hospitality
CASE STUDIES
For updated information, please visit www.ibef.org Tourism and Hospitality 35
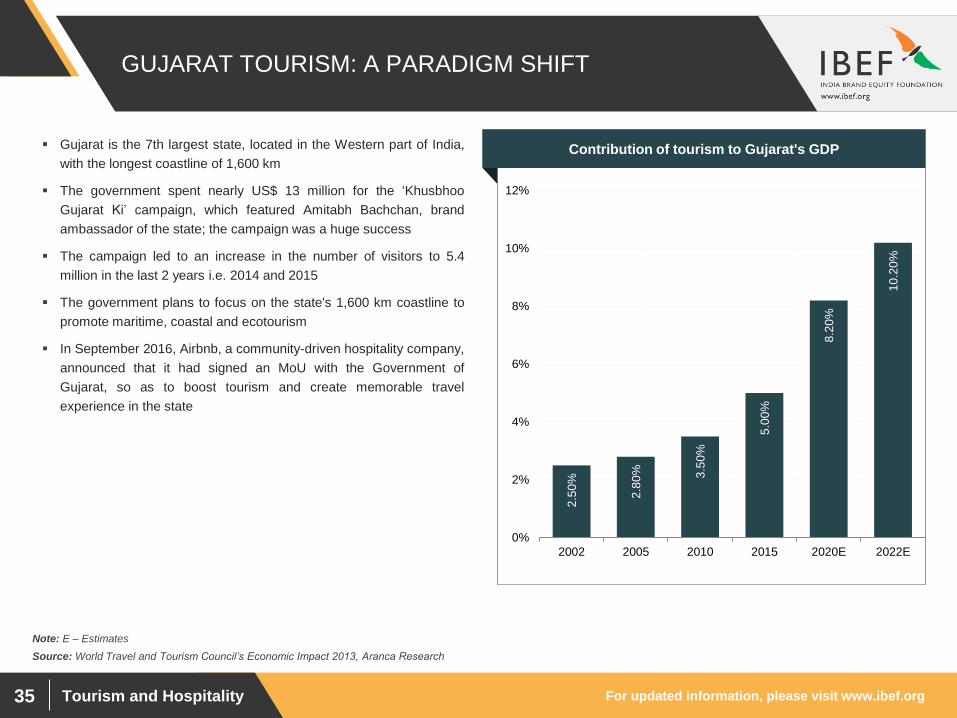
GUJARAT TOURISM: A PARADIGM SHIFT
2.5
0%
2.8
0%
3.5
0%
5.0
0%
8.2
0%
10
.20
%
0%
2%
4%
6%
8%
10%
12%
2002 2005 2010 2015 2020E 2022E
Gujarat is the 7th largest state, located in the Western part of India,
with the longest coastline of 1,600 km
The government spent nearly US$ 13 million for the ‘Khusbhoo
Gujarat Ki’ campaign, which featured Amitabh Bachchan, brand
ambassador of the state; the campaign was a huge success
The campaign led to an increase in the number of visitors to 5.4
million in the last 2 years i.e. 2014 and 2015
The government plans to focus on the state's 1,600 km coastline to
promote maritime, coastal and ecotourism
In September 2016, Airbnb, a community-driven hospitality company,
announced that it had signed an MoU with the Government of
Gujarat, so as to boost tourism and create memorable travel
experience in the state
Visakhapatnam port traffic (million tonnes) Contribution of tourism to Gujarat's GDP
Source: World Travel and Tourism Council’s Economic Impact 2013, Aranca Research
Note: E – Estimates
For updated information, please visit www.ibef.org Tourism and Hospitality 36
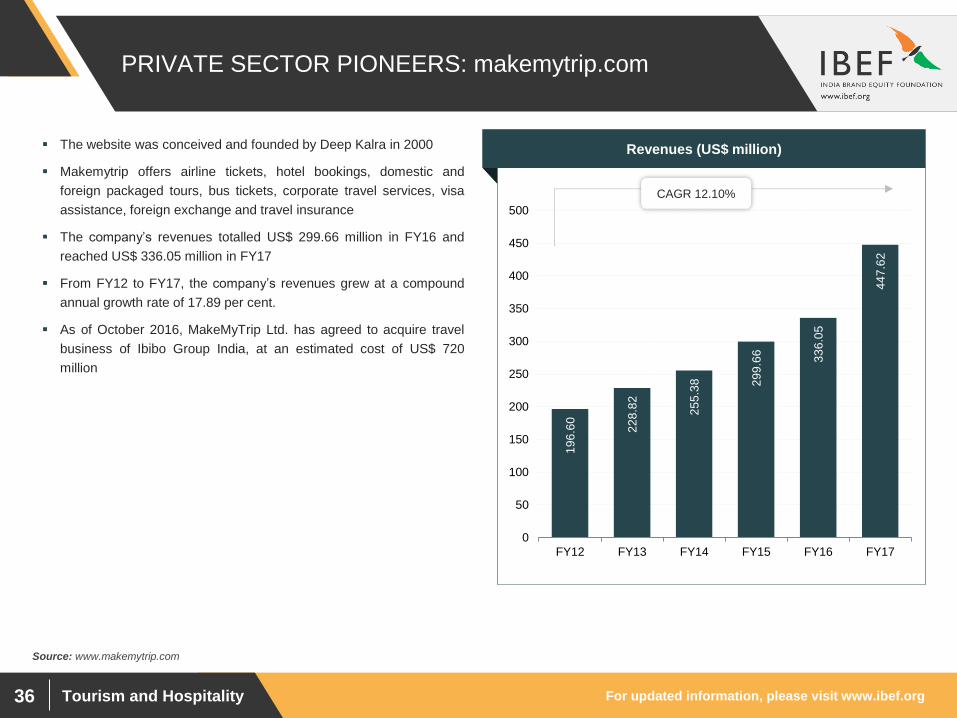
PRIVATE SECTOR PIONEERS: makemytrip.com
19
6.6
0
22
8.8
2
25
5.3
8
29
9.6
6
33
6.0
5
44
7.6
2
0
50
100
150
200
250
300
350
400
450
500
FY12 FY13 FY14 FY15 FY16 FY17
Source: www.makemytrip.com
The website was conceived and founded by Deep Kalra in 2000
Makemytrip offers airline tickets, hotel bookings, domestic and
foreign packaged tours, bus tickets, corporate travel services, visa
assistance, foreign exchange and travel insurance
The company’s revenues totalled US$ 299.66 million in FY16 and
reached US$ 336.05 million in FY17
From FY12 to FY17, the company’s revenues grew at a compound
annual growth rate of 17.89 per cent.
As of October 2016, MakeMyTrip Ltd. has agreed to acquire travel
business of Ibibo Group India, at an estimated cost of US$ 720
million
Visakhapatnam port traffic (million tonnes) Revenues (US$ million)
CAGR 12.10%
For updated information, please visit www.ibef.org Tourism and Hospitality 37
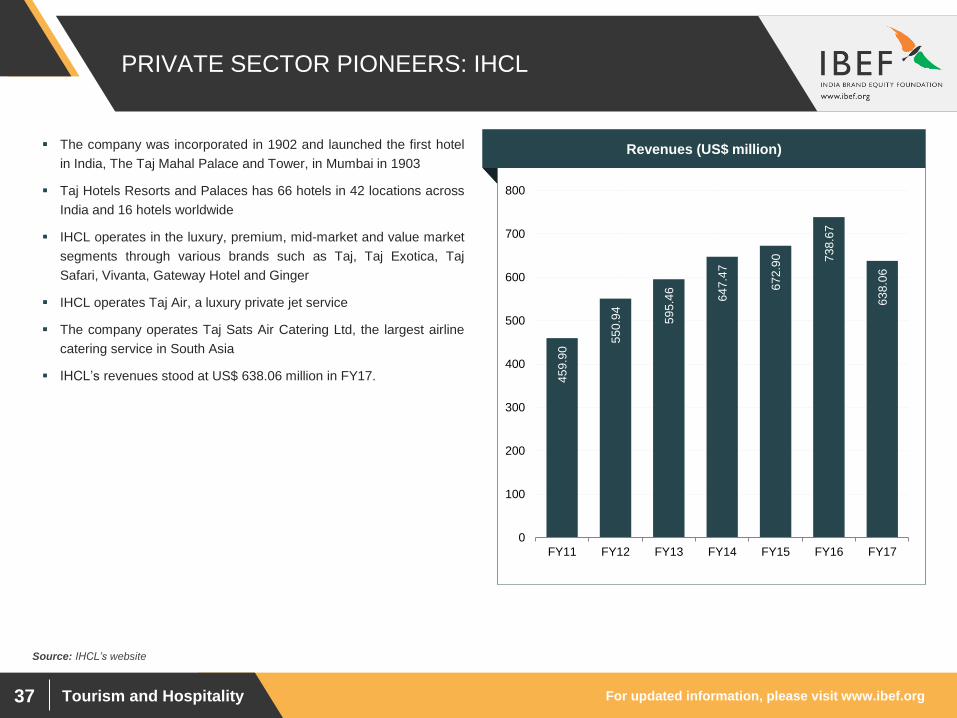
PRIVATE SECTOR PIONEERS: IHCL
45
9.9
0 5
50
.94
59
5.4
6
64
7.4
7
67
2.9
0
73
8.6
7
63
8.0
6
0
100
200
300
400
500
600
700
800
FY11 FY12 FY13 FY14 FY15 FY16 FY17
Source: IHCL’s website
The company was incorporated in 1902 and launched the first hotel
in India, The Taj Mahal Palace and Tower, in Mumbai in 1903
Taj Hotels Resorts and Palaces has 66 hotels in 42 locations across
India and 16 hotels worldwide
IHCL operates in the luxury, premium, mid-market and value market
segments through various brands such as Taj, Taj Exotica, Taj
Safari, Vivanta, Gateway Hotel and Ginger
IHCL operates Taj Air, a luxury private jet service
The company operates Taj Sats Air Catering Ltd, the largest airline
catering service in South Asia
IHCL’s revenues stood at US$ 638.06 million in FY17.
Visakhapatnam port traffic (million tonnes) Revenues (US$ million)

Tourism and Hospitality
KEY INDUSTRY
ASSOCIATIONS
For updated information, please visit www.ibef.org Tourism and Hospitality 39
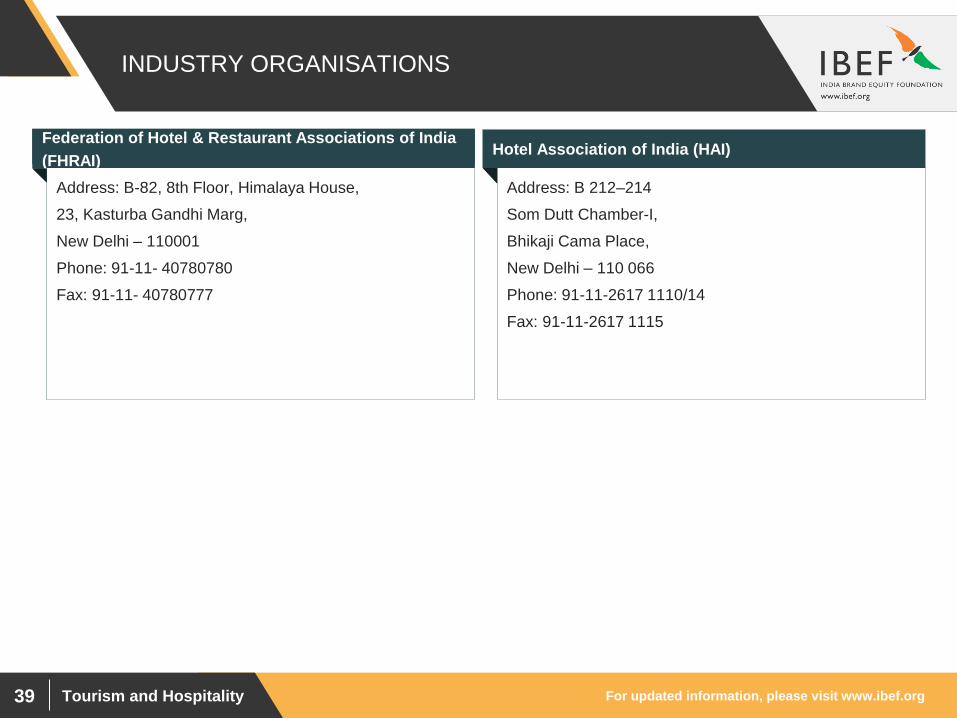
INDUSTRY ORGANISATIONS
Visakhapatnam port traffic (million tonnes) Federation of Hotel & Restaurant Associations of India
(FHRAI) Hotel Association of India (HAI)
Address: B 212–214
Som Dutt Chamber-I,
Bhikaji Cama Place,
New Delhi – 110 066
Phone: 91-11-2617 1110/14
Fax: 91-11-2617 1115
Address: B-82, 8th Floor, Himalaya House,
23, Kasturba Gandhi Marg,
New Delhi – 110001
Phone: 91-11- 40780780
Fax: 91-11- 40780777

Tourism and Hospitality
USEFUL
INFORMATION
For updated information, please visit www.ibef.org Tourism and Hospitality 41
GLOSSARY
Direct contribution: Spending on accommodation, transportation, attractions and entertainment
Indirect contribution: Travel and tourism investment spending, and government collective travel and tourism spending
Induced contribution: Spending of direct and indirect employees
GOI: Government of India
CAGR: Compound Annual Growth Rate
INR: Indian Rupee
US$ : US Dollar
Wherever applicable, numbers have been rounded off to the nearest whole number
For updated information, please visit www.ibef.org Tourism and Hospitality 42
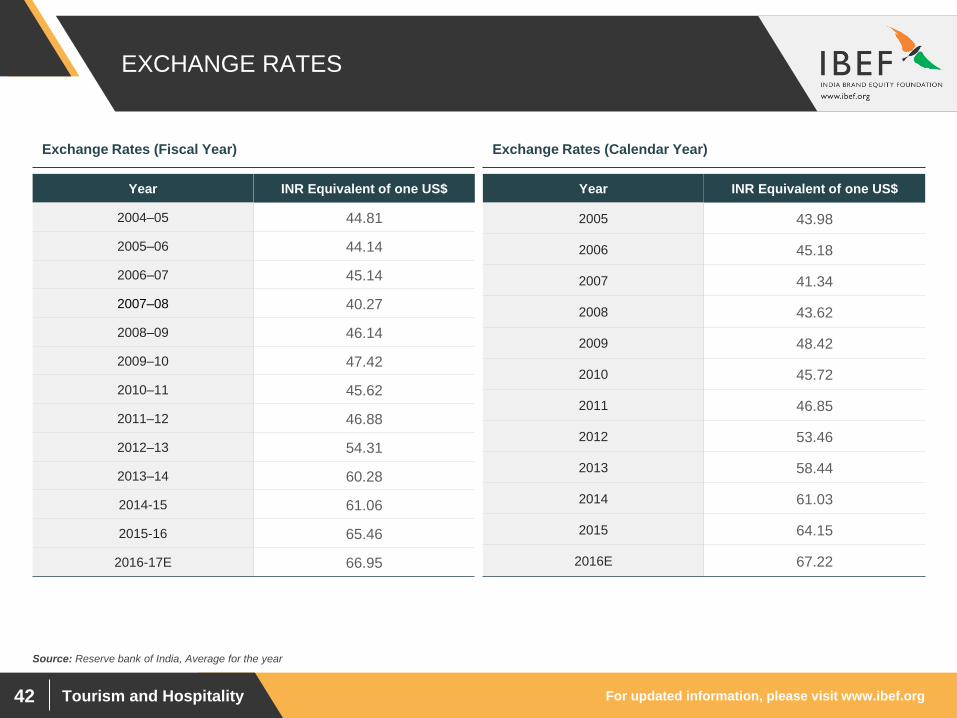
EXCHANGE RATES
Year INR Equivalent of one US$
2004–05 44.81
2005–06 44.14
2006–07 45.14
2007–08 40.27
2008–09 46.14
2009–10 47.42
2010–11 45.62
2011–12 46.88
2012–13 54.31
2013–14 60.28
2014-15 61.06
2015-16 65.46
2016-17E 66.95
Year INR Equivalent of one US$
2005 43.98
2006 45.18
2007 41.34
2008 43.62
2009 48.42
2010 45.72
2011 46.85
2012 53.46
2013 58.44
2014 61.03
2015 64.15
2016E 67.22
Exchange Rates (Fiscal Year) Exchange Rates (Calendar Year)
Source: Reserve bank of India, Average for the year
For updated information, please visit www.ibef.org Tourism and Hospitality 43
DISCLAIMER
India Brand Equity Foundation (IBEF) engaged Aranca to prepare this presentation and the same has been prepared by Aranca in consultation
with IBEF.
All rights reserved. All copyright in this presentation and related works is solely and exclusively owned by IBEF. The same may not be reproduced,
wholly or in part in any material form (including photocopying or storing it in any medium by electronic means and whether or not transiently or
incidentally to some other use of this presentation), modified or in any manner communicated to any third party except with the written approval
of IBEF.
This presentation is for information purposes only. While due care has been taken during the compilation of this presentation to ensure that the
information is accurate to the best of Aranca and IBEF’s knowledge and belief, the content is not to be construed in any manner whatsoever as a
substitute for professional advice.
Aranca and IBEF neither recommend nor endorse any specific products or services that may have been mentioned in this presentation and nor do
they assume any liability or responsibility for the outcome of decisions taken as a result of any reliance placed on this presentation.
Neither Aranca nor IBEF shall be liable for any direct or indirect damages that may arise due to any act or omission on the part of the user due to any
reliance placed or guidance taken from any portion of this presentation.