THESE` DOCTEUR DE L’UNIVERSITE DE GRENOBLE´ Kalpana Mandal · DOCTEUR DE L’UNIVERSITE DE...
148
TH ` ESE Pour obtenir le grade de DOCTEUR DE L’UNIVERSIT ´ E DE GRENOBLE Sp´ ecialit ´ e: Physique pour les sciences du vivant Arr ˆ et´ e minist ´ erial : 7 aout 2006 Pr´ esent ´ ee par Kalpana Mandal Th` ese dirig ´ ee par Prof. Antoine Delon et codirig ´ ee par Dr. Martial Balland pr´ epar ´ ee au sein Laboratoire interdisciplinaire de Physique et de l’Ecole doctorale de Physique Role of ECM Physical Properties on Force Distribution and Cell In- ternal Organization Th` ese soutenue publiquement le (26th September 2012), devant le jury compos´ e de : Prof. Atef Asnacios University Paris-Diderot, Rapporteur Dr. Olivier Theodoly Aix Marseille University, Rapporteur Prof. Bertrand Fourcade Joseph Fourier University, Grenoble, Examinateur Asst. Prof. Martial Balland Joseph Fourier University, Grenoble, Examinateur Prof. Antoine Delon Joseph Fourier University, Grenoble, Directeur de th` ese Asst. Prof. Martial Balland Joseph Fourier University, Grenoble, Co-Directeur de th` ese
Transcript of THESE` DOCTEUR DE L’UNIVERSITE DE GRENOBLE´ Kalpana Mandal · DOCTEUR DE L’UNIVERSITE DE...

THESE
Pour obtenir le grade de
DOCTEUR DE L’UNIVERSITE DE GRENOBLESpecialite : Physique pour les sciences du vivant
Arrete ministerial : 7 aout 2006
Presentee par
Kalpana Mandal
These dirigee par Prof. Antoine Delon
et codirigee par Dr. Martial Balland
preparee au sein Laboratoire interdisciplinaire de Physique
et de l’Ecole doctorale de Physique
Role of ECM Physical Propertieson Force Distribution and Cell In-ternal Organization
These soutenue publiquement le (26th September 2012),
devant le jury compose de :
Prof. Atef AsnaciosUniversity Paris-Diderot, Rapporteur
Dr. Olivier TheodolyAix Marseille University, Rapporteur
Prof. Bertrand FourcadeJoseph Fourier University, Grenoble, Examinateur
Asst. Prof. Martial BallandJoseph Fourier University, Grenoble, Examinateur
Prof. Antoine DelonJoseph Fourier University, Grenoble, Directeur de these
Asst. Prof. Martial BallandJoseph Fourier University, Grenoble, Co-Directeur de these


Acknowledgement:
First of all, I would like to thank my supervisor Dr. Martial Balland for his guid-
ance, support,enthusiasm throughout my Ph.D. program. It was always encouraging
to discuss science with him. He provided all the best possible environment to make
my experiments work. I would like to acknowledge Dr. Irne Wang for her guidance,
patience and valuable involvement during the period of my graduate research. I
had many great discussions with her which helped me a lot in understanding many
things in a better way. I would like to convey my sincere regards and respect to Dr.
Lionel Bureau for sharing his knowledge with me. It was very nice working with
him. I acknowledge financial support from Nanoscience Foundation.
My sincere thanks Dr. Antoine Delon for his support. I convey my deep regards
to Dr. Olivier Destaing for his generous help by providing all biological samples. I
would like to thank Dr. Beniot Ladoux for his involvement. I would like to thank
Dr. Manual Thery for sharing knowledge with us.
I would specially like to thank to Jessie Sitbon for helping me in all administrative
matter. I would like to thank Mr. Phillipe for all the technical support he pro-
vided. I would like to thank all my co-colleagues in the lab Dr. Aurlien Pennec,
Dr. Jean-Claude Vial, Mrs. Mike Kloster Landsburg, Dr. Charles-Edouard Leroux,
Ms Rachel Milloud, Dr. Ananda Kumar soshee, Mr. Michal Garcia, Dr. Madhu
Priya, Dr. Dipanwita Biswas for all the supports in and outside the lab. I would
like to thank my former colleague friends Jie Gao, Qingzong Tseng, Edith, Aparna
and Valentina. It has been a very good stay in Grenoble during my PhD work. I
would like to thank all my friends in Grenoble who made my stay memorable.
I would sincerely thank my very special friends Monamie Sanyal and Shreya
Ghatak. I will always cherish the moments I have spent with them.
I gratefully acknowledge my Late didima for always motivating me to move for-
ward. I am greatful to my parents for their understanding, unconditional support
i

and believe on me. Lovingly, I acknowldge my brothers; borda, mejhda and bhai,
sister in law and tora for their love,care and encouragement. My thesis would have
not been possible without the constant support I get from my family. I would like
to acknowledge Anupam for his love, care, encouragement and support, courage he
gave me.
ii
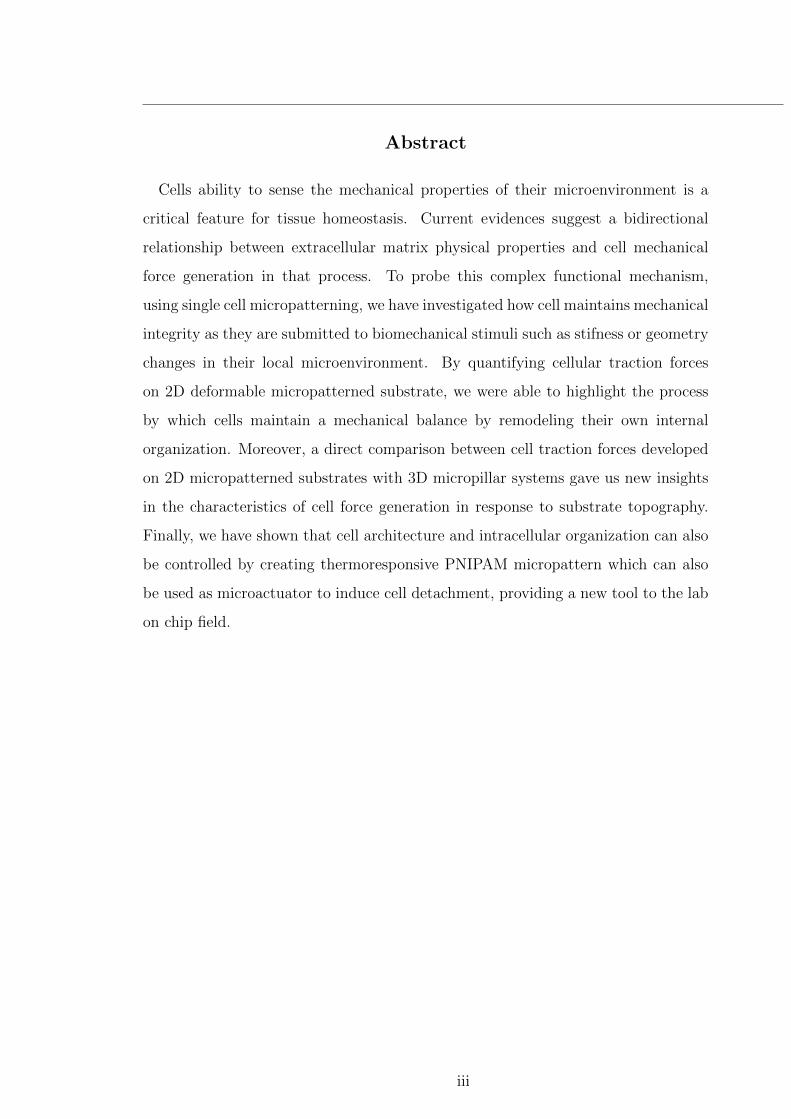
Abstract
Cells ability to sense the mechanical properties of their microenvironment is a
critical feature for tissue homeostasis. Current evidences suggest a bidirectional
relationship between extracellular matrix physical properties and cell mechanical
force generation in that process. To probe this complex functional mechanism,
using single cell micropatterning, we have investigated how cell maintains mechanical
integrity as they are submitted to biomechanical stimuli such as stifness or geometry
changes in their local microenvironment. By quantifying cellular traction forces
on 2D deformable micropatterned substrate, we were able to highlight the process
by which cells maintain a mechanical balance by remodeling their own internal
organization. Moreover, a direct comparison between cell traction forces developed
on 2D micropatterned substrates with 3D micropillar systems gave us new insights
in the characteristics of cell force generation in response to substrate topography.
Finally, we have shown that cell architecture and intracellular organization can also
be controlled by creating thermoresponsive PNIPAM micropattern which can also
be used as microactuator to induce cell detachment, providing a new tool to the lab
on chip field.
iii
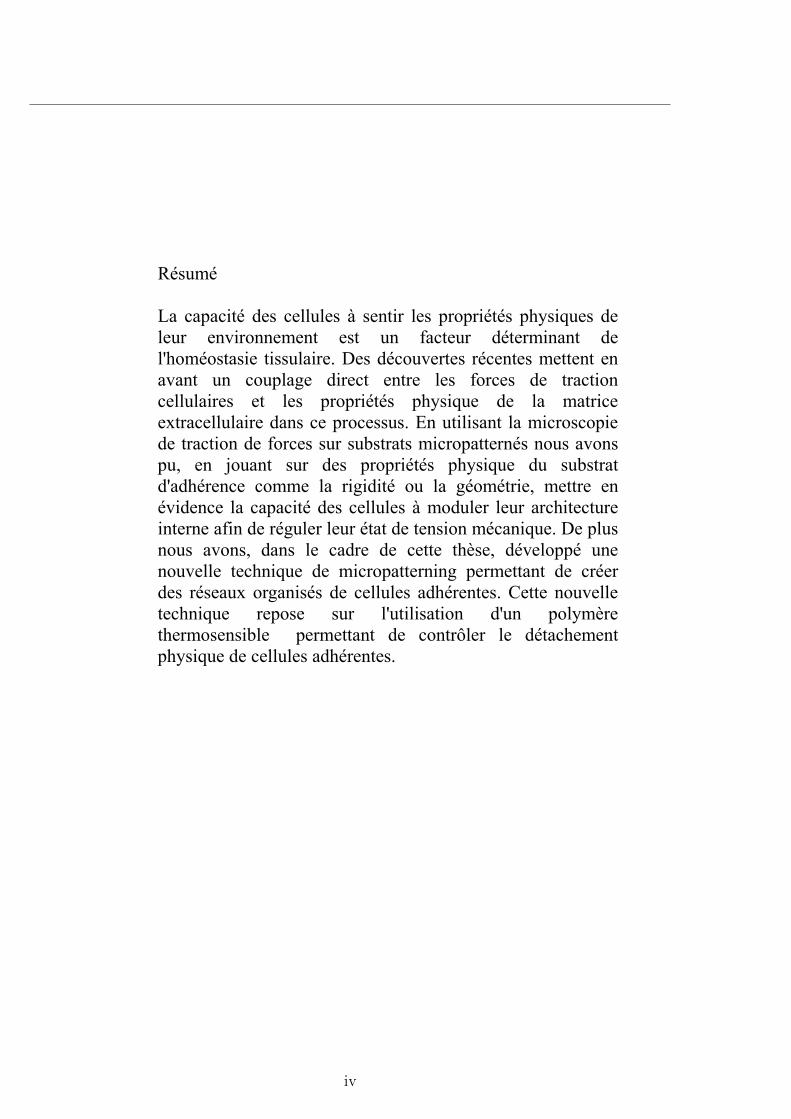
Résumé
La capacité des cellules à sentir les propriétés physiques de leur environnement est un facteur déterminant de l'homéostasie tissulaire. Des découvertes récentes mettent en avant un couplage direct entre les forces de traction cellulaires et les propriétés physique de la matrice extracellulaire dans ce processus. En utilisant la microscopie de traction de forces sur substrats micropatternés nous avons pu, en jouant sur des propriétés physique du substrat d'adhérence comme la rigidité ou la géométrie, mettre en évidence la capacité des cellules à moduler leur architecture interne afin de réguler leur état de tension mécanique. De plus nous avons, dans le cadre de cette thèse, développé une nouvelle technique de micropatterning permettant de créer des réseaux organisés de cellules adhérentes. Cette nouvelle technique repose sur l'utilisation d'un polymère thermosensible permettant de contrôler le détachement physique de cellules adhérentes.
iv
Contents
1. An introduction to cell mechanics: a Physics view 1
1.1. Introduction: . . . . . . . . . . . . . . . . . . . . . . . . . . . . . . . . . . 1
1.2. Cell internal architecture: the cytoskeleton . . . . . . . . . . . . . . . . 3
1.2.1. Microtubules . . . . . . . . . . . . . . . . . . . . . . . . . . . . . . 4
1.2.2. Intermediate filaments . . . . . . . . . . . . . . . . . . . . . . . . 4
1.2.3. Actin filaments . . . . . . . . . . . . . . . . . . . . . . . . . . . . . 5
1.3. Cell interaction with the extracellular matrix . . . . . . . . . . . . . . . 6
1.3.1. The extracellular matrix: . . . . . . . . . . . . . . . . . . . . . . . 7
1.3.2. Cell - ECM linkage : focal adhesion and focal complex . . . . . 8
1.3.3. ECM-adhesion-cytoskeleton interactions . . . . . . . . . . . . . 10
1.4. Cell mechanics: force generation and mechanotransduction . . . . . . . 10
1.5. Objectives and specific goals . . . . . . . . . . . . . . . . . . . . . . . . . 12
2. Tools and techniques for biomechanics 15
2.1. Introduction . . . . . . . . . . . . . . . . . . . . . . . . . . . . . . . . . . . 15
2.2. Experimental design . . . . . . . . . . . . . . . . . . . . . . . . . . . . . . 17
2.2.1. Mask design . . . . . . . . . . . . . . . . . . . . . . . . . . . . . . 17
2.2.2. Micro-fabrication and utilization . . . . . . . . . . . . . . . . . . 18
2.2.2.1. Gel preparation: . . . . . . . . . . . . . . . . . . . . . . 19
2.2.2.2. PAA micropattern characterization : . . . . . . . . . . 21
2.2.2.3. Cell culture : . . . . . . . . . . . . . . . . . . . . . . . . 22
2.2.3. Fluorescence Microscopy . . . . . . . . . . . . . . . . . . . . . . . 23
2.2.4. Imaging tools and development . . . . . . . . . . . . . . . . . . . 27
2.2.5. Image acquisition and processing . . . . . . . . . . . . . . . . . . 28
v
Contents Contents
2.3. Cell traction measurement and development . . . . . . . . . . . . . . . 28
2.3.1. Displacement field extraction . . . . . . . . . . . . . . . . . . . . 32
2.3.2. Traction field determination . . . . . . . . . . . . . . . . . . . . . 33
3. Influence of ECM physical properties on force generation and mechan-
otransduction 37
3.1. Introduction . . . . . . . . . . . . . . . . . . . . . . . . . . . . . . . . . . . 37
I. 39
3.2. Role of the ECM geometry in cell traction force distribution . . . . . . 41
3.2.1. Experimental approach . . . . . . . . . . . . . . . . . . . . . . . 41
3.2.2. Investigating cell internal structure organization in response
to ECM geometry . . . . . . . . . . . . . . . . . . . . . . . . . . 42
3.2.3. Cell traction force quantification in response to ECM geometry 46
3.2.3.1. Average traction force distribution . . . . . . . . . . . 47
3.2.3.2. Local force distribution . . . . . . . . . . . . . . . . . . 49
3.2.4. Conclusion and Discussion . . . . . . . . . . . . . . . . . . . . . . 50
II. 53
3.3. Towards a direct comparison of micropillar array with TFM on mi-
cropatterned substrates . . . . . . . . . . . . . . . . . . . . . . . . . . . . 55
3.3.1. Experimental approach . . . . . . . . . . . . . . . . . . . . . . . . 55
3.3.2. Traction force measurement . . . . . . . . . . . . . . . . . . . . . 57
3.3.2.1. Force distributions on different rigidities . . . . . . . . 58
3.3.3. Focal adhesion size depends on substrate stiffness . . . . . . . 61
3.3.4. A few comparison on micropillar/patterned hydrogel . . . . . . 64
3.3.5. Conclusion and Discussion . . . . . . . . . . . . . . . . . . . . . 66
4. Spatial correlation between actin generated forces and centrosome po-
sitioning 69
4.1. Introduction: . . . . . . . . . . . . . . . . . . . . . . . . . . . . . . . . . . 69
vi

Contents Contents
4.2. Experimental Details . . . . . . . . . . . . . . . . . . . . . . . . . . . . . 70
4.2.1. Micropattern design: . . . . . . . . . . . . . . . . . . . . . . . . . 70
4.2.2. Cell culture on micropattern: . . . . . . . . . . . . . . . . . . . . 70
4.3. Cell internal organization in response to ECM geometry . . . . . . . . 71
4.3.1. Actin architecture . . . . . . . . . . . . . . . . . . . . . . . . . . . 71
4.3.2. Focal Adhesion distribution in response to ECM geometry . . 73
4.3.3. Centrosome distribution: . . . . . . . . . . . . . . . . . . . . . . . 74
4.4. Traction force distribution on different shapes . . . . . . . . . . . . . . 76
4.4.1. Local force distribution and orientation . . . . . . . . . . . . . . 79
4.5. Total contractile energy . . . . . . . . . . . . . . . . . . . . . . . . . . . . 80
4.6. Conclusion and Discussion . . . . . . . . . . . . . . . . . . . . . . . . . . 81
5. Thermoresponsive micropatterned substrates for single cell studies 83
5.1. Introduction . . . . . . . . . . . . . . . . . . . . . . . . . . . . . . . . . . . 83
5.2. Polymer brush synthesis on glass coverslip: . . . . . . . . . . . . . . . . 85
5.3. PNIPAM brush characterization . . . . . . . . . . . . . . . . . . . . . . . 86
5.3.1. Brush thickness . . . . . . . . . . . . . . . . . . . . . . . . . . . . 86
5.3.2. Effect of UV irradiation on polymer brushes . . . . . . . . . . . 88
5.3.3. Patterning on synthesized polymer . . . . . . . . . . . . . . . . . 89
5.3.4. Micro-textured surface functionalization . . . . . . . . . . . . . 90
5.4. Cell adhesion and fixation . . . . . . . . . . . . . . . . . . . . . . . . . . 92
5.4.1. Cell seeding on the pattern . . . . . . . . . . . . . . . . . . . . . 92
5.4.2. Cell adhesion depends on physical properties of polymer brush 93
5.4.3. Cell fixing and staining . . . . . . . . . . . . . . . . . . . . . . . . 95
5.4.4. Cell division on the pattern . . . . . . . . . . . . . . . . . . . . . 95
5.4.5. Temperature dependent properties of PNIPAM and cell de-
tachment . . . . . . . . . . . . . . . . . . . . . . . . . . . . . . . . 97
5.5. Conclusion and Discussion . . . . . . . . . . . . . . . . . . . . . . . . . . 99
5.5.1. Advantages . . . . . . . . . . . . . . . . . . . . . . . . . . . . . . . 99
6. Summary and Outlook: 103
vii

Contents Contents
A. ANNEX 107
A.1. Hydrogel Preparation Protocols: . . . . . . . . . . . . . . . . . . . . . . . 107
A.1.1. Bead Functionalization: . . . . . . . . . . . . . . . . . . . . . . . 107
A.1.2. Coverslip Treatment . . . . . . . . . . . . . . . . . . . . . . . . . 108
A.1.3. Hydrogel Micropatterning : . . . . . . . . . . . . . . . . . . . . . 109
A.2. Micropatterning on PNIPAM polymer brush experimental protocols: . 111
A.2.1. Patterning . . . . . . . . . . . . . . . . . . . . . . . . . . . . . . . 111
A.2.2. Surface Functionalization . . . . . . . . . . . . . . . . . . . . . . 111
A.3. Cell Culture . . . . . . . . . . . . . . . . . . . . . . . . . . . . . . . . . . . 112
A.3.1. Classic culture . . . . . . . . . . . . . . . . . . . . . . . . . . . . . 112
A.3.2. cell culture on pattern . . . . . . . . . . . . . . . . . . . . . . . . 113
A.4. Immuno-labeling: . . . . . . . . . . . . . . . . . . . . . . . . . . . . . . . . 114
References 116
List of Publications 131
List of Figures 138
viii

1. An introduction to cell
mechanics: a Physics view
1.1. Introduction:
It has emerged as an active area of research among biophysicists that adherent
cells are able to sense the physical properties of extracellular matrix, especially
substrate stiffness and geometry which influences the process of biomechanical reg-
ulatory mechanism [1, 2, 3, 4]. In vivo, cells adhere on a substrate called the extra-
cellular matrix (ECM) [5, 6] which provides a substrate for cell anchorage, serves
as a tissue scaffold, guides cell migration during embryonic development and wound
repair, plays a key role in tissue morphogenesis [7, 8, 9]. Moreover, the extracellular
matrix does not only provide a substrate for cell but, is also responsible for trans-
mitting environmental signals to cells, which ultimately affects cell proliferation,
differentiation and apoptosis [10, 11].
Forces, exerted or sensed by the cell, are further translated into biochemical sig-
nals. The ability of cells to integrate information from their environment is well
known as mechanotransduction involving reciprocal integration of mechanical stim-
uli into biochemical signals. This property is mostly based on the activation of a
family of transmembranous proteins that can create a dynamic mechanical contin-
uum between the extracellular matrix and the cell internal architecture ( such as cell
cytoskeleton) [12]. Moreover, the plasticity of the mechanotransduction process is
reinforced by the ability of transmembrane proteins like integrins to generate intra-
cellular signalling in response to their mechanical activation. The physical properties
1
Introduction:
such as stiffness of the microenvironment that cell experiences needs to be taken into
account when trying to understand the complex nature of cell signaling integrity.
A stiffer matrix causes force-dependent aggregation and clustering of integrins re-
sulting in elevated Rho-ROCK dependent cytoskeletal tension, which amplifies the
formation and stabilization of focal adhesion assembly [13]. Thus mechanosensi-
tive feedback modulates cell architecture, which in turn [14] affects cell functions in
diverse processes such as migration, proliferation, differentiation, apoptosis and is
crucial for organ development and homeostasis [15, 16, 17]. Improper regulation of
biomechanical feedback loop, often caused by mutations or misregulation of proteins,
that disturb cellular or extracellular mechanics, may lead to cancer progression and
metastasis [18].
A variety of approaches (such as microcontact printing, micropillar method) have
been made over last few years to make the link between ECM physical properties
and cell internal architecture and their related forces [19, 20, 21, 22]. These stud-
ies provide great insights regarding the development of traction force at the cell
ECM interface but, they impose numerous limitations. A major limitation arises
from the morphological heterogeneity that cells adopt on these substrates. It be-
comes more complex to elucidate the relation between cytoskeletal architecture and
cellular traction forces and that ultimately makes statistical analysis difficult. More-
over, in vivo cells encounter geometrical boundary conditions imposed by both ECM
geometry and other cells which is not respected in classical culture. Thus, the un-
derlying mechanism behind the way cell senses, redistributes and transmits forces
in response to ECM geometry remains not fully understood. This thesis provides a
new insight into the basic mechanisms behind the mechanotransduction process by
linking cytoskeletal architecture, cell internal organization and cytoskeletal gener-
ated force by using traction force microscopy on micropatterned substrate.
Here we start by describing our model system: an eukaryotic cell. The schematic
of our model system is given below in figure 1.1. The figure illustrates a cell adhering
on a substrate via focal adhesion, forming connection to its internal cytoskeleton.
2

Cell internal architecture: the cytoskeleton
Next a short description of cellular internal structure is given. Finally we describe
the existing mechanical relation between intracellular structure and force generation
at the cell-ECM interface.
Figure 1.1.: Schematic of Eukaryotic Cell and its environment.
1.2. Cell internal architecture: the cytoskeleton
Cell cytoskeleton is a highly dynamic and complex fibrillar network. These cell cy-
toskeletons is polymer like structural mesh, which is responsible for maintaining cell
architecture, internal tension balance and plays a crucial role in organelle position-
ing [23]. This dynamic meshwork reorganizes its structure during diverse cellular
processes including cell division, migration, cell adhesion and intracellular transport.
These reorganizations finally lead to specific arrangements of organelles within the
cell which at larger scale participate to tissue organization.
The dynamic assembling and disassembling properties of the cytoskeleton poly-
mers allow cell to feel and respond to changes in their micro-environment [24]. Ex-
ternal signals propagate through these filaments from ECM (or neighbouring cells)
to cell interior. The cytoskeleton is made up of three kinds of protein filaments,
namely microtubules(MT), intermediate filaments (IFs) and actin filaments(AFs).
Many different proteins, called motor proteins, ensuring filament crosslinking and
sliding are associated with each type of filaments. These molecular motors enable
cells to generate tension and thus reorganize or adapt their shape within a living
3

Cell internal architecture: the cytoskeleton
tissue. Figure1 1.2 shows individual filament of all three types. Here is a description
of each type of filament.
Figure 1.2.: Schematic of single cytoskeleton filaments actin(red), MT(green),
IF(yellow).
1.2.1. Microtubules
Microtubules (MTs) are cylindrical polymers found in every eukaryotic cell. Micro-
tubules are made of polymerized tubulin and form tubular shaped polymer mostly
radially distributed from the centrosome (microtubule organizing center) to the
plasma membrane. MT are strongly involved in maintaining cell structure, pro-
viding platforms for intracellular transport and spindle formation during mitosis.
The basic structural properties like the number of protofilaments (microtubule ba-
sic brick), the radius of the tube, filament helical pitch have been well determined
by electron microscopy by Chretien et al. 1995; [25]. Moreover, MTs play an im-
portant role in cell polarity by positioning the centrosome and in many types of cell
interphase[23, 26], thanks to different motor protein interactions such as dynein.
1.2.2. Intermediate filaments
The intermediate filaments (IFs) are considered to be the most stable component of
the cell cytoskeleton [27]. Many studies suggested that the dynamical IF network is
involved in maintaining cell shape and rigidity, and serve to anchor in place several
1http://www.accessexcellence.org/LC/BEOn/data/phasethree/0030-beon/submission.php
4
Cell internal architecture: the cytoskeleton
organelles, including the nucleus and desmosomes. Intermediate filaments are also
involved in formation of the nuclear lamina [28, 29]. IF form an heterogeneous family
of cytoskeletal proteins such as vimentin, desmin, neurofilaments, and nestin which
are expressed in mesenchymal, muscular, and neuronal tissues, respectively. It has
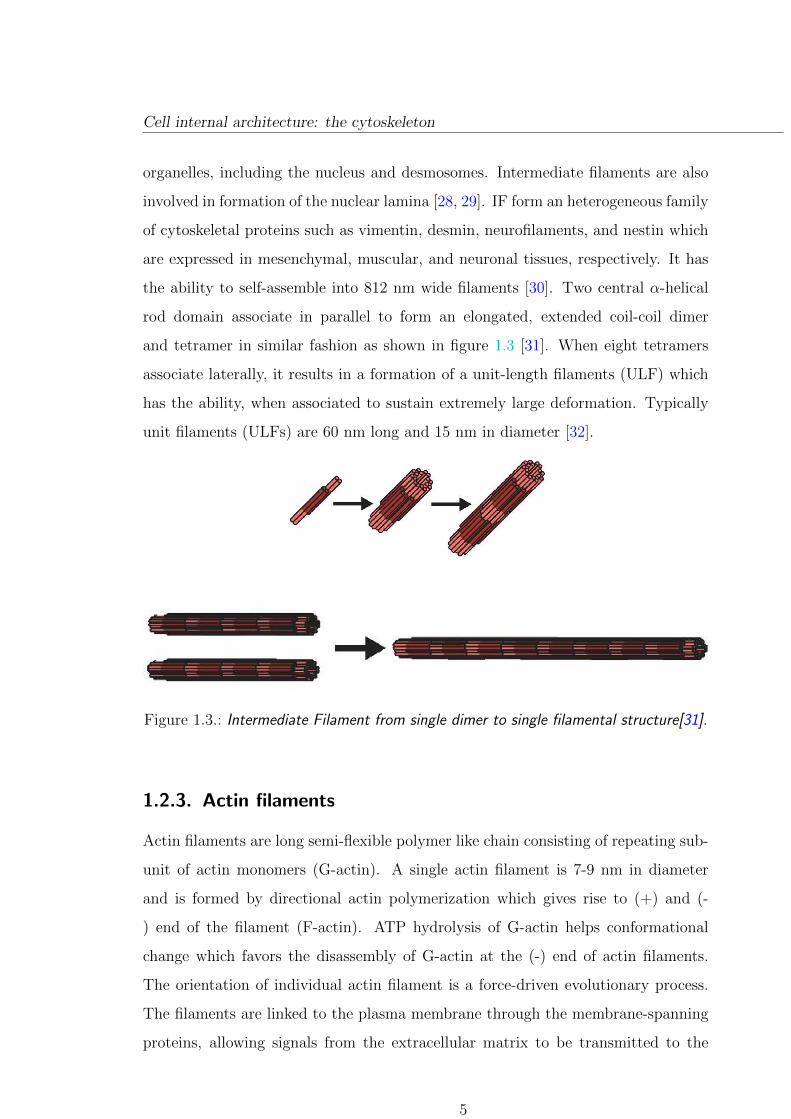
the ability to self-assemble into 812 nm wide filaments [30]. Two central α-helical
rod domain associate in parallel to form an elongated, extended coil-coil dimer
and tetramer in similar fashion as shown in figure 1.3 [31]. When eight tetramers
associate laterally, it results in a formation of a unit-length filaments (ULF) which
has the ability, when associated to sustain extremely large deformation. Typically
unit filaments (ULFs) are 60 nm long and 15 nm in diameter [32].
Figure 1.3.: Intermediate Filament from single dimer to single filamental structure[31].
1.2.3. Actin filaments
Actin filaments are long semi-flexible polymer like chain consisting of repeating sub-
unit of actin monomers (G-actin). A single actin filament is 7-9 nm in diameter
and is formed by directional actin polymerization which gives rise to (+) and (-
) end of the filament (F-actin). ATP hydrolysis of G-actin helps conformational
change which favors the disassembly of G-actin at the (-) end of actin filaments.
The orientation of individual actin filament is a force-driven evolutionary process.
The filaments are linked to the plasma membrane through the membrane-spanning
proteins, allowing signals from the extracellular matrix to be transmitted to the
5

Cell interaction with the extracellular matrix
cytoskeleton, and vice versa. Actin is able to generate forces by two mechanisms.
Firstly, by polymerization and depolymerization, actin filament promotes cell motil-
ity [33]at the leading edge of the cell and also subcellular structural movement [34].
Secondly, by interacting with myosin II, actin generates forces that lead to cell con-
tractility [35]. It has been shown that, in cell migration, acto-myosin interaction
generates contractile forces to move forward and retract at the back of the cell
The dynamics of actin cytoskeleton regulates many important cellular processes,
including cell motility, cell division, cytokinesis, cell contractility and cell shape.
Figure 1.4 shows actin network inside REF52 cell, labeled in green by F-actin im-
munostaining.
Figure 1.4.: In the actin cytoskeleton of REF52 cells, labelled with GFP-conjugated
phalloidin (green).
1.3. Cell interaction with the extracellular matrix
The connection between cells and the underlying ECM are mediated by two types of
integrin-dependant junctions: focal adhesion and hemidesmosomes. Focal adhesions
are linked to the actin cytoskeleton while hemidesmosomes are linked to the inter-
mediate filaments. As actin filaments are responsible for the generation of cellular
traction forces here we focus on cell - ECM interaction through focal adhesions.
6

Cell interaction with the extracellular matrix
Adhesion receptors act as mechanosensors where physical signals (forces sensed
or exerted by the cell) are converted into biochemical ones and are then propa-
gated along the linked network of actin filaments and associated proteins by form-
ing a physical linkage to the ECM with cell. Both this physical linkage and the
mecanochemical transduction regulate many cell mophological behaviour including
actin organization and cell microenvironmental adaptation Etc. Cells constantly
probe the physical properties of their microenvironment through mechanotransduc-
tion processes involving continuous and bidirectional [8, 36] transduction of cy-
toskeleton generated forces in dynamic reorganizations of adhesive structures. Nev-
ertheless, the precise mechanisms by which mechanical forces lead to eventual bio-
chemical and molecular responses remain undefined. Now we try to focus on the
main components which are involve in this bidirectional mechanism.
1.3.1. The extracellular matrix:
Extracellular matrix (ECM) is a complex structure, composed of many structural
and nonstructural proteins assembled into an organized meshwork to give cell a
support. In vivo extra cellular matrix provides a substrate for cell anchorage and
behave as a tissue scaffold and maintains connectivity within tissue [37]. In vivo
ECM is made and oriented by the cells within it. Moreover, different cell types
are associated with different structures of ECM by changing organization, amount
and type of proteins [38]. In tissue cell experiences 3D environment with different
stiffness, geometry and signaling. Cell interaction with the extracellular matrix has
dramatic effect on cell morphology. Numerous studies show the influence of ECM on
cell by imposing geometrical restriction or by playing with biomechanical properties
of the ECM on tissue mimicking model [39, 40, 41]. It has been shown by Engler et
al. that by changing the stiffness of the substrate stem cell fate lineage specification
can be controlled [4]. Indeed, monitoring for tissue stiffness is widespread technique
in diseases screening like tumors [42, 43]
It is well known that ECM remodels the cell behavior and morphology. Conversely,
cell also feeds to organize the ECM proteins which secreted from cell within by
7
Cell interaction with the extracellular matrix
exerting tension on the matrix [44]. Secreted proteins play a diverse role in regulating
cell proliferation, migration and differentiation in vertebrate development [37]. The
extracellular matrix contains a number of proteins (fibronectin, lamin, collagen)
having multiple domains, and each of it has specific binding sites[45].
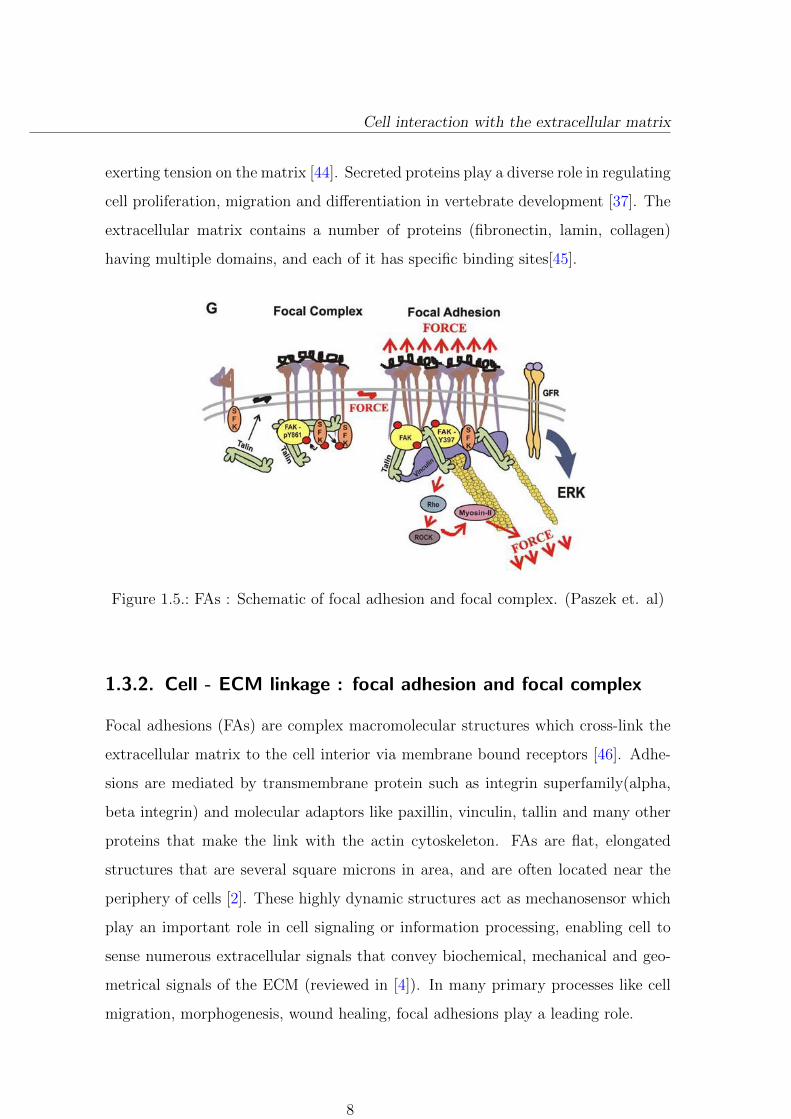
Figure 1.5.: FAs : Schematic of focal adhesion and focal complex. (Paszek et. al)
1.3.2. Cell - ECM linkage : focal adhesion and focal complex
Focal adhesions (FAs) are complex macromolecular structures which cross-link the
extracellular matrix to the cell interior via membrane bound receptors [46]. Adhe-
sions are mediated by transmembrane protein such as integrin superfamily(alpha,
beta integrin) and molecular adaptors like paxillin, vinculin, tallin and many other
proteins that make the link with the actin cytoskeleton. FAs are flat, elongated
structures that are several square microns in area, and are often located near the
periphery of cells [2]. These highly dynamic structures act as mechanosensor which
play an important role in cell signaling or information processing, enabling cell to
sense numerous extracellular signals that convey biochemical, mechanical and geo-
metrical signals of the ECM (reviewed in [4]). In many primary processes like cell
migration, morphogenesis, wound healing, focal adhesions play a leading role.
8
Cell interaction with the extracellular matrix
Initially, when cell starts adhering on the substrate, adhesion sites evolve from dot
like structure of less than 1µm in diameter called nascent adhesions. These nascent
adhesion sites are known to mature in focal complex. Focal complexes are short
- lived structures, containing integrin [47], vinculin and paxillin. Their formation
is induced by the Rho-family GTPase Rac. Focal complexes normally develop into
focal adhesions (see figure 1.5) as a consequence of the activation of Rho [48, 49] or
following the application of external force [13].
It is widely presumed that FA size is modulated by force to mediate changes in
adhesion strength at different levels of cellular tension. Consistent with this idea,
several studies have found a direct correlation between FA size and local traction
force, indicating that the force per unit area, or stress, remains constant during FA
maturation [13, 20]. However, other measurements have illustrated a more complex
dependence. Recent study reported an inverse link between size and traction stress
in the front of migrating cells, but found no such relationship in the cell rear [50].
Moreover, it has been shown that small FAs ( 1µm) exhibit variable levels of stress
[51], and extremely large supermature FAs exert a high stress [52]. Conversely, a
recent study [53] shows that a strong correlation between adhesion size and traction
force exists only during the initial stages of myosin-mediated adhesion maturation
and growth. However, for mature adhesions, no correlation between traction stress
and size has been observed.
Adhesion assembly and maturation are highly dependent on the ECM environ-
ment which is believed to incite intracellular structural rearrangements that in turn
foster the recruitment of additional proteins (growth) and induce signaling cascades
leading to actin polymerization [54]. Transition of the focal complexes into focal
adhesions is accompanied by transition of the associated actin mesh into densely
packed straight bundles of filaments known as stress fibers [3]. Relation between fo-
cal adhesion with actin or force still remains in debate. Such knowledge is crucial for
our understanding of force transmission at FAs and cellular mechanosensing. Next
section contains more about the cell matrix interactions and its effect on cytoskeletal
organization.
9

Cell mechanics: force generation and mechanotransduction
1.3.3. ECM-adhesion-cytoskeleton interactions
In tissue, biomechanical regulatory process are tightly regulated by maintaining cell
shape and internal architecture [17, 23, 36]. ECM influence on cell internal organi-
zation has nicely been shown by Thery et al. [40]. Using glass micropatterning, they
showed that ECM geometry, focal adhesion and actin are functionally linked. This
work particularly revealed an intrinsic ability of cell to self-organize into a very repro-
ducible manner in response to a given ECM geometry. Moreover, this bidirectional
[55] interaction leads to change dynamically structure and molecular properties of
adhesion sites in response to cytoskeletal reorganizing signals. These changes are
mainly driven by the actomyosin contractile machinery of the cells, or by forces
applied externally to the cells [56]. Thus, matrix stiffness (exogenous forces) and
cytoskeletal tension (endogenous forces) functionaly cooperate in a mechano-circuit
that modulates phenotypic transformations in cells.
1.4. Cell mechanics: force generation and
mechanotransduction
Cells sense, process and respond to mechanical and other biophysical cues from the
ECM using an interconnected hierarchy of mechanochemical systems that include
adhesion receptors, cytoskeletal networks and molecular motors as shown in the
schematic 1.6. The integrated mechanics and dynamics of these systems enable cells
to control their shape and generate forces. Understanding how forces are sensed or
generated by cells and translated by proteins is one of the main question in the field
of cell mechanics. Acquiring knowledge about the role played by forces on cell and
tissue behavior, requires finding what factors contribute to force generation in cell.
In adherent cells, forces get generated by the following two mechanisms: con-
tinuous assembling and disassembling of actin fibers and acto-myosin contractile
machinery which is mainly driven by myosin II interaction with actin. These forces
are transmitted through adhesion sites to the underlying substrate, resulting in its
deformation.
10
Cell mechanics: force generation and mechanotransduction
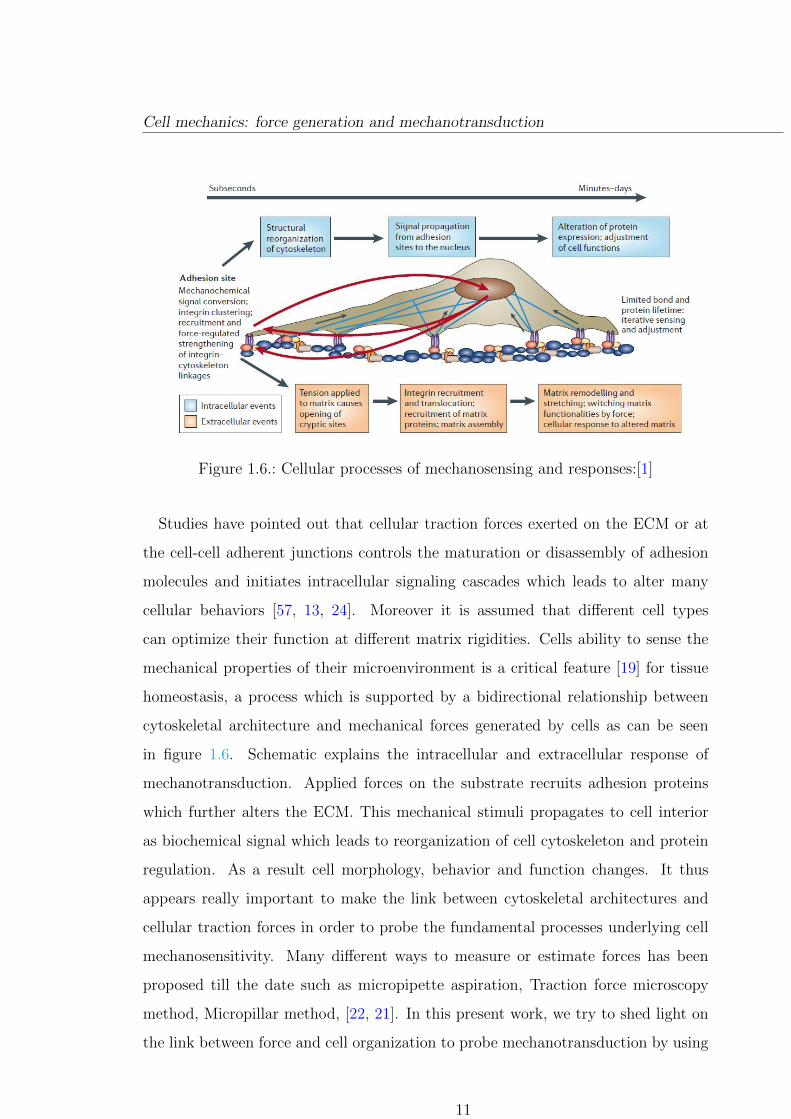
Figure 1.6.: Cellular processes of mechanosensing and responses:[1]
Studies have pointed out that cellular traction forces exerted on the ECM or at
the cell-cell adherent junctions controls the maturation or disassembly of adhesion
molecules and initiates intracellular signaling cascades which leads to alter many
cellular behaviors [57, 13, 24]. Moreover it is assumed that different cell types
can optimize their function at different matrix rigidities. Cells ability to sense the
mechanical properties of their microenvironment is a critical feature [19] for tissue
homeostasis, a process which is supported by a bidirectional relationship between
cytoskeletal architecture and mechanical forces generated by cells as can be seen
in figure 1.6. Schematic explains the intracellular and extracellular response of
mechanotransduction. Applied forces on the substrate recruits adhesion proteins
which further alters the ECM. This mechanical stimuli propagates to cell interior
as biochemical signal which leads to reorganization of cell cytoskeleton and protein
regulation. As a result cell morphology, behavior and function changes. It thus
appears really important to make the link between cytoskeletal architectures and
cellular traction forces in order to probe the fundamental processes underlying cell
mechanosensitivity. Many different ways to measure or estimate forces has been
proposed till the date such as micropipette aspiration, Traction force microscopy
method, Micropillar method, [22, 21]. In this present work, we try to shed light on
the link between force and cell organization to probe mechanotransduction by using
11

Objectives and specific goals
TFM technique.
1.5. Objectives and specific goals
Many interesting development have been made towards the understanding of cell
sensitivity to physical cues such as geometry, topography etc. One of the most ob-
vious missing information concerns the role of the extracellular matrix geometry on
tension distribution inside the cell and its influence on the intracellular organization.
In this thesis, we focus on the role of the extra cellular matrix geometry on cell
adhesion, internal organization and traction forces distribution by combining use of
traction force microscopy and micropatterning techniques. More precisely, we study
how different shapes of the adhesive micropatterned ECM affect cell force distribu-
tion both locally and globally at the single cell level. We try to see the correlation of
actin network organization with paxillin and centrosome distribution. Some of the
measurements have yielded intriguing insights into cellular response to geometrical
stimulation.
Chapter 2 contains a description of the experimental methods and approaches
used in this work. In this chapter we give details about our micropatterning tech-
nique and our traction force microscopy algorithm for data analysis.
Chapter 3 is divided into two parts. In the first part we focused on how geometrical
modulation of the ECM influences traction force distribution, and also localization
of focal adhesion at the single cell level. We have measured cell traction force
using different micropatterned shapes on 2D soft polyacrylamide gel embedded with
nano beads. We showed that ECM geometry affects local stresses while whole cell
contractile energy appears to be conserved.
In a second part, we try to compare cell traction forces developed when cells are
on a continuous 2D micropatterned substrate with discrete 3D micropillar array of
”equivalent” stiffness. We also have investigated how forces and focal adhesions
12
Objectives and specific goals
varies with rigidity modulation of the extracellular matrix in both these two cases.
Chapter 4 tries to explore a potential relation in between traction forces orien-
tation and cell internal organization. We studied a strong correlation in between
cell internal organization such as focal adhesion with centrosome positioning which
suggests a potential role of actin in centrosome centration. This is, to our knowledge
the first evidence of that process.
Chapter 5 describes an alternative approach to the design of micropatterned sur-
faces on PNIPAM polymer brushes having thermoresponsive properties for single
cell studies. In the first part we characterize polymer brush (length and density)
and pattern creation on synthesized polymer. Next we study cell adhesion depen-
dence on brush thickness, length and polymer lower critical temperature. Finally, we
discuss temperature-dependent swelling properties of PNIPAM and their potential
application in cell detachment.
13


2. Tools and techniques for
biomechanics
2.1. Introduction
There are many studies going on in biomechanics from single molecular level to tis-
sue engineering where a large number of cells as a whole is studied. Most of these
studies use the tools of mechanics in order to correlate the structural or functional
response of biological samples to force measurements such as in adhesion, migration
[58], differentiation and apoptosis. Nowadays more and more groups are focusing
their attention on this ability of cells to respond to physical cues of their microen-
vironment, a process called mechanotransduction.
Many different techniques have been developped or adapted to the field of cell me-
chanics in order to probe cell mechanotransduction aspects. The technologies used
in that field relies on one basic bioengineering principles that ensures that precise
forces are imposed or measured onto biological objects in a well defined environ-
ment. Both local and global approaches are used to apply calibrated forces onto
living cells [17]. In case of techniques such as AFM, Optical Trapping, magnetic
tweezers a local (smaller than the cell size) probe is used to exert forces to the cells.
A great advantage of these techniques are to apply tunable solicitations to individual
cells. However, lack of understanding the system as a whole is major inconvenience
of these techniques. On the other hand, in case of global approaches [59, 60], there
can be some lack in describing the details of the individual microstrustural elements
as it is usually assumed to be averaged over large scale areas. Hereby it has to be
15

Introduction
noticed that the spatial organization of cells within tissues is very important for
their function and thus, one of the most difficult part to study cell mechanics is
that in classic culture like glass or plastic petri dish, where cell internal and external
arrangements are highly variable from cell to cell. Statistical analysis of any cell
morphology and their coupling with cell mechanical properties is thus very diffi-
cult. Hence, it appears necessary to have a control on cell architecture to quantify
cell biomechanical properties statistically. It is challenging to many biomedical and
tissue-engineering applications to control cell adhesion and cell internal organization
in order to describe as precisely as possible cell mechanical behavior.
Another way to approach this problem is not to apply calibrated solicitations to
the cells but to directly measure traction forces developped by individual cells in
relation to their structure and shape, which may allow local as well as global insight
of a systematic understanding. The main goal of my work is to be able to relate
local and global cell internal structures to cellular traction forces. For that purpose,
we propose to design a set-up that will combine single cell micropatterning with
traction force microscopy.
Micropatterning is a high-throughput method with a wide range of applications,
such as tissue engineering, cell based drug screening, and fundamental cell biology
studies [23]. This tool has been used to arrange living cells in a regular manner giv-
ing access to statistical tools (image averaging) and to localize spatial distribution
in cell based biosensors and transducers. By using standard patterning techniques,
cell microenvironment geometry can easily be modulated. Hence, cell internal orga-
nization also becomes reproducible. Moreover, the number of structures fabricated
at once on the same substrate can reach several tens of thousand allowing a ”statis-
tical” approach in the observations and measurements under similar experimental
conditions. The use of Traction Force Microscopy technique enable us to calcu-
late forces exerted by the cell on the substrate it is subjected to adhere. Thus by
designing micropatterns on soft substrates it is possible to correlate cell internal
organization with cell force distribution in a statistical approach.
16

Experimental design
2.2. Experimental design
2.2.1. Mask design
To address the question: how ECM geometry influence cellular traction forces dis-
tribution, different micropatterns shapes have been designed in the work.
To create adhesive micropattern of a specific design, a quartz photomask mask need
to be fabricated. There are many software used to design photomasks such as Klay-
out , Autocad, CleWin. For our work, mask designing software CleWin has been
used. To design different ECM geometry, different types of patterns are required
for the mask design. For some of our shapes, we have preserved the same projected
area to ensure that cell pre-stress will be the same. Single shapes are designed in
Figure 2.1.: Mask designed by CleWin: designed V shape shown in the image of trian-
gular area is about 900µ m2 with bar width 7µm
one layer. To create an array of 2D micropattern, particular shapes are grouped
and arranged (as shown in figure 2.1) into a regular array in a different layer. Dif-
ferent layers are useful to specify to the mask manufacturer which parts of the mask
should be opaque for the uv light exposure (that will ultimately lead to adhesive
ECM islands creation). Numbers are etched in a regular interval to create a matrix
reference on the whole coverlsip to avoid any ambiguity among cells when they are
17
Experimental design
arranged on the array (especially useful while working with fixed samples).
Then, the designed mask (a GDSII file) is send to the mask manufacturing company
(Toppan Photomasks inc.,Texas USA) for implementation of design on chromium
quartz photomask.
2.2.2. Micro-fabrication and utilization
Microfabrication is a very useful approach in cell mechanics as well as in fluid me-
chanics. The main interest relies on the microfabrication that it gives researchers to
design model environment with fixed boundary conditions (micropatterns, microw-
ells, micropillars etc.). By designing artificial environment, cell internal organization
and multi-cellular assemblies can thus be designed ”at will” allowing to study cell
morphological behavior statistically. Moreover, in vivo cells are constrained me-
chanically and geometrically. Single cell micropatterning to some extent, can thus
mimick those conditions which are not possible in classic culture where cells are
plated on an homogeneous layer of ECM proteins and hence, adopt any kind of
morphology[10].
There are mainly two ways to create 2D micropatterns. Firstly, micro-contact
printing [61, 62] which is a widely used method that use elastomeric microstructure
stamps made of polydimethylsiloxane (PDMS) to deposit ECM proteins on different
kind of substrates (glass coverslips, hydrogels). A common alternative to PDMS
stamping is the use of UV light activation, through a photomask to a specific region
of the substrates that can further be modified chemically so as to link different types
of proteins as shown by Azioune et al. [63, 64].
Another methodology has been developed in our group by using PNIPAM polymer
brushes with thermoresponsive properties that give an extra feature to single cell
micropatterning (details described in chapter 5). [41]
In this thesis, the technique we have used relies on UV irradiation of the sample,
which is a thin layer of polyacrylamide hydrogel. This technique avoids a large
number of steps and is less time consuming compare to other existing patterning
18

Experimental design
techniques. There are many different interest of working with polyacrylamide gel:
1. Polyacrylamide (PAA) is a soft elastic material allowing experimentalist to
measure cellular tractions forces.
2. PAA is very transparent so that imaging through the gel is possible.
3. PAA is very easy to prepare.
4. PAA is mechanically very stable and mechanical properties can easily be tuned.
5. PAA material is biocompatible.
Here is a brief description of our polyacrylamide micro-patterning procedure:
2.2.2.1. Gel preparation:
Fabricated chromium quartz mask can directly be used for patterning. An acry-
lamide gel pre-mix (PBS/acrylamide/bis-acrylamide) can directly be polymerized
onto the quartz mask by placing a drop of pre-mix in between the mask and a
silanized coverslip [see protocol annexA3 ]. This gel pre-mix is pre-doped with 200nm
fluorescent beads [treated with PLL-PEG(Follow AnnexA1)]. Beads are added only
for TFM measurement. Required stiffness of the gel can be achieved by controlling
over the relative concentration of acrylamide and cross-linker bis-acrylamide.
After polymerization, next step is to activate the polyacrylamide hydrogel by
using a deep UV light exposure below 200nm (ref: UVO- CLEANER, Jelight Con-
many,Inc.). This deep UV irradiation creates a local plasma in illuminated regions
that oxidize the gel surface. As it is not possible to conjugate ECM proteins directly
to the gel, this gel oxidation allows us to indirectly cross-link protein with the ac-
tivated part of the polyacrylamide gel. After irradiation, EDC and NHS chemicals
are mixed at a proper concentration and molarity (see annex A3) to cross link PAA
with ECM proteins. Schematic diagram 2.2 shows the gel preparation steps. As
previously described, only the pattern part is transparent and exposed to deep UV
light (rest of the mask is opaque). Fluorescent ECM protein conjugation with the
19

Experimental design
Figure 2.2.: schematic of the experimental procedure to create pattern on acrylamide
gel.
gel results in a monolayer of coating (as shown in figure 2.3) on the activated part
of the gel which can easily be detectable under fluorescence microscope and which
is ready for cell culturing.(For the details of the protocol see Annex).
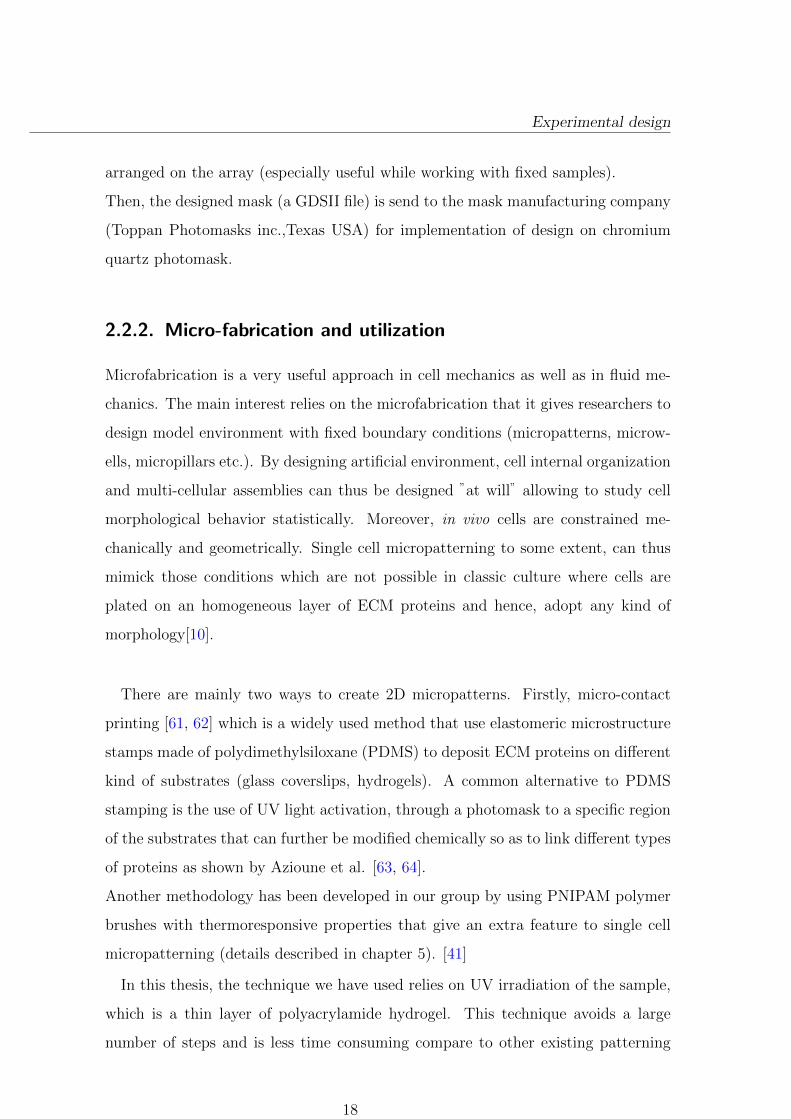
This micropatterning technique is well suited to study biological phenomenon as
it has the ability to produce stable patterns on transparent polymeric substrates in
a biocompatible manner. The success of the technique relies on the fact that it has
one to one transfer of any kind of 2D patterning. Micropattern spatial resolution
can reach up to 2µm (as shown by the elliptical dot in figure 2.3) in this technique.
Moreover, the incorporation of nano beads in the gel enable us to calculate cell
traction force distribution in response to ECM geometry.
20
Experimental design
Figure 2.3.: Fluorescently labeled protein coated micropattern (red) on polyacrylamide
hydrogel; Regular array of oval shape dot (green) structure : major and
minor axis are 2 and 3 µm.
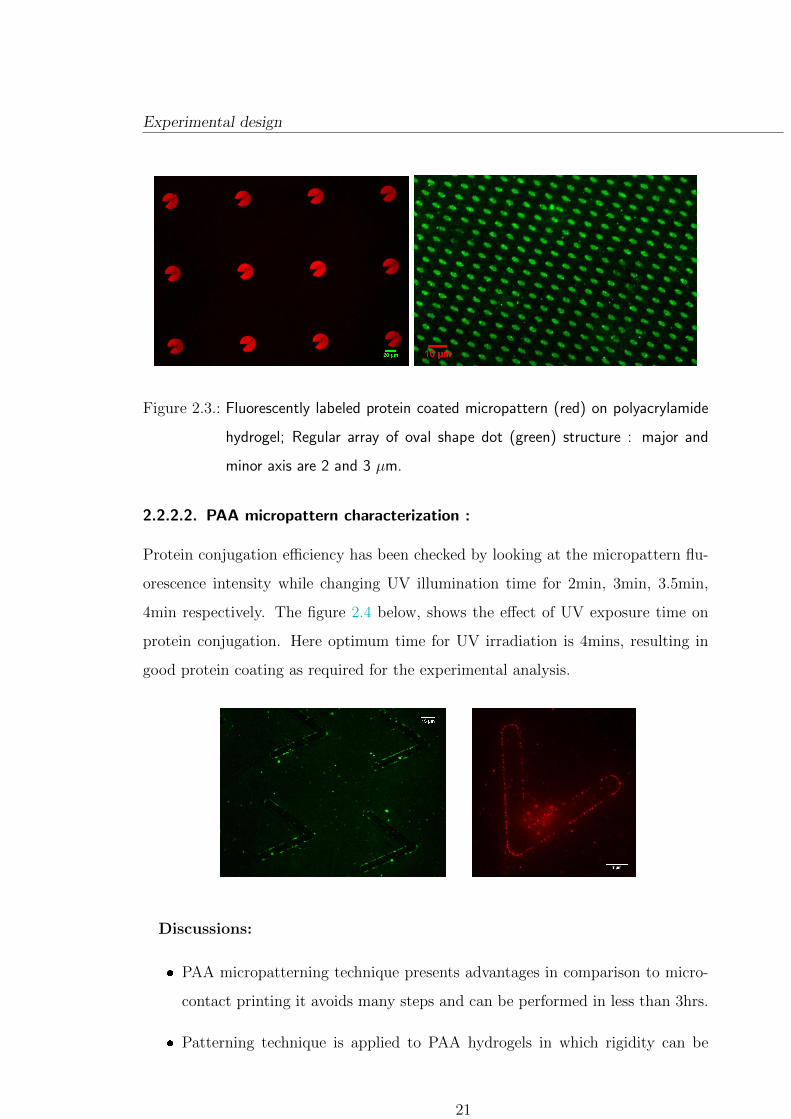
2.2.2.2. PAA micropattern characterization :
Protein conjugation efficiency has been checked by looking at the micropattern flu-
orescence intensity while changing UV illumination time for 2min, 3min, 3.5min,
4min respectively. The figure 2.4 below, shows the effect of UV exposure time on
protein conjugation. Here optimum time for UV irradiation is 4mins, resulting in
good protein coating as required for the experimental analysis.
Discussions:
� PAA micropatterning technique presents advantages in comparison to micro-
contact printing it avoids many steps and can be performed in less than 3hrs.
� Patterning technique is applied to PAA hydrogels in which rigidity can be
21
Experimental design
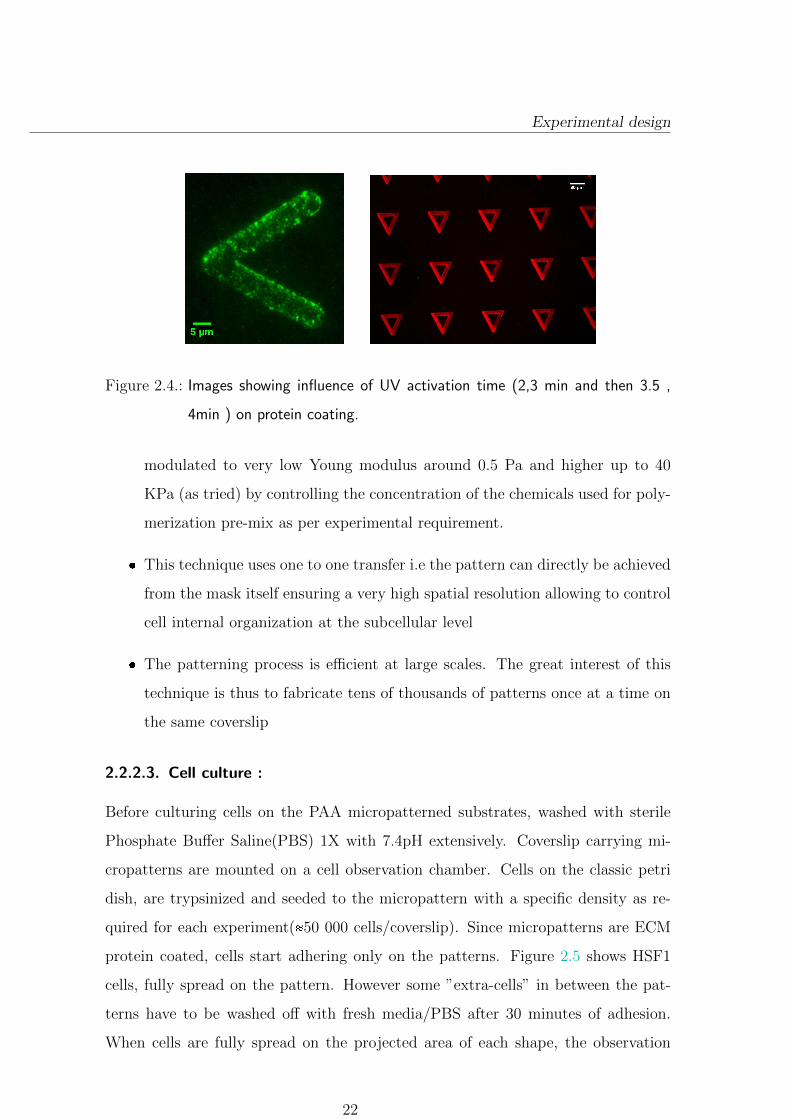
Figure 2.4.: Images showing influence of UV activation time (2,3 min and then 3.5 ,
4min ) on protein coating.
modulated to very low Young modulus around 0.5 Pa and higher up to 40
KPa (as tried) by controlling the concentration of the chemicals used for poly-
merization pre-mix as per experimental requirement.
� This technique uses one to one transfer i.e the pattern can directly be achieved
from the mask itself ensuring a very high spatial resolution allowing to control
cell internal organization at the subcellular level
� The patterning process is efficient at large scales. The great interest of this
technique is thus to fabricate tens of thousands of patterns once at a time on
the same coverslip
2.2.2.3. Cell culture :
Before culturing cells on the PAA micropatterned substrates, washed with sterile
Phosphate Buffer Saline(PBS) 1X with 7.4pH extensively. Coverslip carrying mi-
cropatterns are mounted on a cell observation chamber. Cells on the classic petri
dish, are trypsinized and seeded to the micropattern with a specific density as re-
quired for each experiment(�50 000 cells/coverslip). Since micropatterns are ECM
protein coated, cells start adhering only on the patterns. Figure 2.5 shows HSF1
cells, fully spread on the pattern. However some ”extra-cells” in between the pat-
terns have to be washed off with fresh media/PBS after 30 minutes of adhesion.
When cells are fully spread on the projected area of each shape, the observation
22

Experimental design
chamber is being taken for experimental observation under the ”TFM” microscope.
At that time, cell culturing media is replaced by imaging media without Phenol red
in order to prevent photochemical reaction in the media. Moreover as the pattern
is stained in Cy3, retrieving phenol red from the media gives a better contrast for
pattern images. In some cases, the micropattern sample, bearing cells is taken for
fixation to stain either actin, paxillin or tubulin.
Figure 2.5.: Bright field images of cells, arranged in a regular manner on the protein
coated micropattern: Images taken by phase contrast olympus microscope
with 4X objective.
2.2.3. Fluorescence Microscopy
Fluorescence microscopy is a commonly used imaging technique in biological speci-
men investigation. The main interest of this technique is that instead of looking to
the whole cell, special parts of interest can be visualized by using protein antibodies
linked with fluorophores that in turn attach to targeted features of investigation.
The discovery of green fluorescent protein in the early 1960s ultimately heralded a
new area in cell biology by enabling investigators to apply molecular cloning meth-
ods, fusing the fluorophore to a wide variety of protein and enzyme targets, in order
to monitor cellular processes in living systems using optical microscopy and related
23

Experimental design
methodology.
The basic task of the fluorescence microscope is to let excitation light radiate the
specimen and then sort out the much weaker emitted light to make up the image.
First, the microscope has a filter that only lets through radiation with the desired
wavelength that matches your fluorescing material. The radiation collides with the
atoms in your specimen and electrons are excited to a higher energy level (see figure1
2.6 ).
Figure 2.6.: Diagram shows mechanism of a molecule to Fluoresce. Typical excitation
and fluorescence specification of a given fluorophore has been shown.
When they relax to a lower level, they emit light. To become visible, the emitted
light is separated from the much brighter excitation light in a second filter. Here,
the fact that the emitted has a longer wavelength is used. The fluorescing areas can
be observed in the microscope and shine out against a dark background with high
contrast. Practically, in a fluorescence microscope a multispectral arc-discharge
lamp is generally used so that specific wavelength can be selected by bandpass
excitation filter. Light from the source passes through the excitation filter and then
1[http://www.olympusmicro.com/primer/java/jablonski/jabintro/jablonskijavafigure1.jpg]
24

Experimental design
it reflects from the dichroic mirror surface. The dichroic mirror has the property
to reflect the short wavelengths coming from excitation light onto the specimen. It
is transparent for the longer wavelength emitted from the specimen. The emission
light gathered by the objective lens passes back through the dichroic mirror and
is subsequently filtered by a barrier (or emission) filter, the latter one is used to
block the unwanted excitation wavelengths ( schematic shown in figure 2.7 ). Thus,
by choosing the right set of fluorophores and filters it becomes possible to observe
separately different fluorescent objects and this for different sub-cellular structures
at the same time. That point is very important for our application as we need for a
single run of experiment to take bead images, pattern images in different fluorescence
channels.
Arc Lamp
specimen
objective
Filter cube
Dichroic mirror
Excitation light
Excitation light all wavelength
mirror
CCD Camera
Emitted light
Excitation filter
Emission filter
Figure 2.7.: Schematic ray diagram of the Fluorescence Microscope imaging technique.
When a molecule (a fluorophore) is excited at its specific absorption wavelength
it goes from a ground state to its excited state (see figure 2.6). Afterwards there
is a spontaneous emission of light during transition of the molecule from its lowest
25
Experimental design
vibrational energy level of an excited state S1 back to the ground state under a
mechanism called fluorescence.
Photobleaching:
A common problem in fluorescence microscopy is the phenomenon of photobleach-
ing. It occurs when a fluorophore permanently loses the ability to fluoresce due to
photon-induced chemical damage and covalent modification. Photobleaching may
results from different possible mechanism, but it is assumed to be linked to a tran-
sition from the excited singlet state to the excited triplet state. The excited triplet
state is relatively long-lived and is chemically more reactive. The average number of
excitation and emission cycles that occurs for a particular fluorophore before pho-
tobleaching is dependent upon the molecular structure and the local environment.
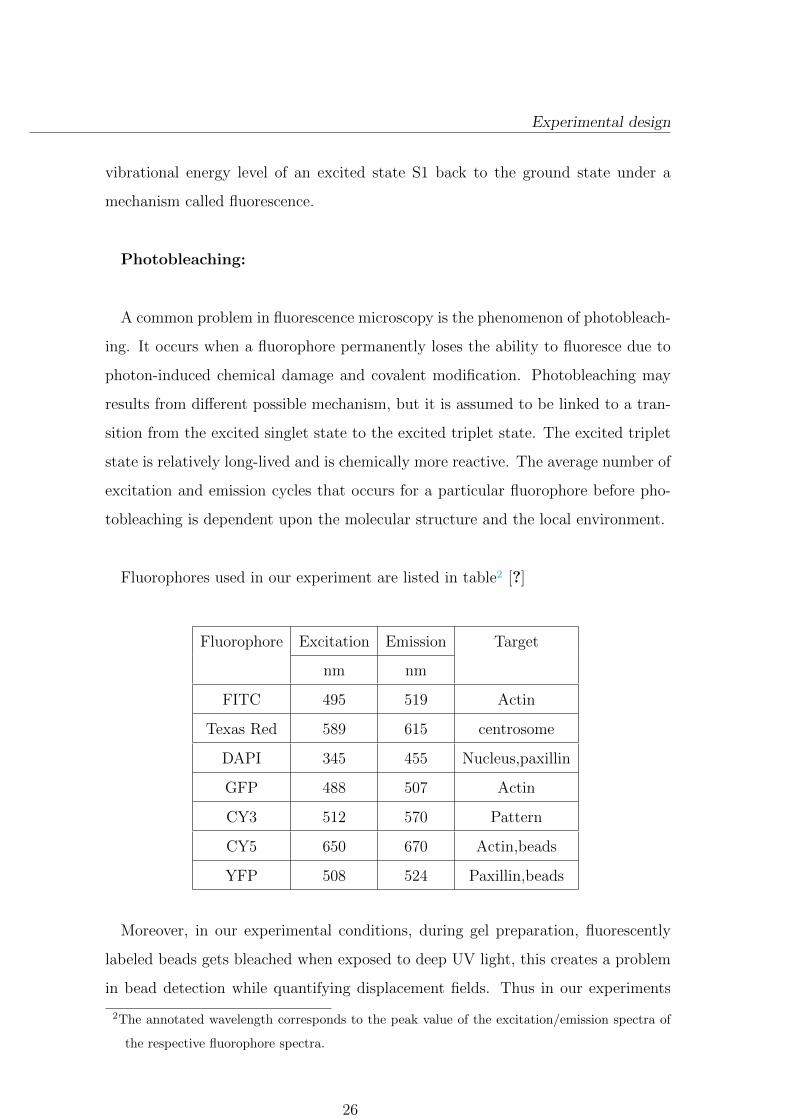
Fluorophores used in our experiment are listed in table2 [?]
Fluorophore Excitation Emission Target
nm nm
FITC 495 519 Actin
Texas Red 589 615 centrosome
DAPI 345 455 Nucleus,paxillin
GFP 488 507 Actin
CY3 512 570 Pattern
CY5 650 670 Actin,beads
YFP 508 524 Paxillin,beads
Moreover, in our experimental conditions, during gel preparation, fluorescently
labeled beads gets bleached when exposed to deep UV light, this creates a problem
in bead detection while quantifying displacement fields. Thus in our experiments
2The annotated wavelength corresponds to the peak value of the excitation/emission spectra of
the respective fluorophore spectra.
26
Experimental design
beads fluorophores are chosen in order to minimize photobleaching.
2.2.4. Imaging tools and development
For image acquisition the Nikon ECLIPSE Ti Series inverted microscope has been
used. Phase contrast imaging has been done on an Olympus CKX41 inverted mi-
croscope.
Typical objectives used for all experiments are : 10X, 20X air, 40X air , 60X oil (for
fixed samples imaging, a 1.5 multiplier has been used).
An automated filter wheel is mounted with the Nikon microscope containing 5 band-
pass filter cubes at a time. Each filter cube contains one excitation filter , one
dichroic mirror and one emission filter. For bright field imaging an upright illumina-
tor is placed on top of the microscope. For fluorescence imaging an Arc lamp Nikon
(C-HGFIE refno 670384) is used. Images are acquired by CCD camera (CoolSnap
ES Roper Scientific).
A proper culture environment is very important for live-cell imaging experiments.
Maintaining a proper temperature(37XC) environment for cell on the microscope
stage is fundamental. For that purpose a thermalization chamber has been developed
in the lab. Live- cell imaging chamber is also very critical part of the experiment. A
large variety of designs are available in the market giving cell friendly environment
for long term cell imaging. A useful good chamber should be
� easily sterilizable and chamber material should not be toxic for the cell.
� an unit isolated from the laboratory environment.
� properly covered during experiment to minimize evaporation or contamination.
� the culture chamber should be simple enough to allow physical manipulation
of the cells like changing media during experiment.
Initial experiments are done with a workshop made chamber which turned out to
be toxic for cells. After mounting the coverslip onto the chamber within 10 mins
27

Cell traction measurement and development
cells are dead. Later on, the chamber has been used for long time imaging is a
POC-R model from Zeiss.
2.2.5. Image acquisition and processing
For all our image acquisitions, the software Micromanager (µ-manager) has been
used in order to automatize the system for multi-positioning acquisition (including
Z-stack acquisition and auto-shutter). For a typical TFM experiment, when cells are
nicely spread on the micropattern, images of cells in brightfield, beads and patterns
are acquired. To measure the displacement field induce by cellular traction forces on
the hydrogel a pair of bead images need to be acquired : one image when cells are on
the pattern and another one when cells are detached from the substrate in order to
obtain the relaxed state of the gel (cells are detached from the substrate by simply
adding water which results in cell lysis ). Sample images for TFM has shown in
figure 2.8. It has to be noticed that for bead images, a Z- stack is acquired because
the beads are in a plane which is under the cell surface. Among all Z stack images
of the beads, only the best focus image is selected for TFM calculation. These ”best
focus” images are important to calculate the displacement field accurately.
For each coverslip 50 to 60 positions (corresponding to 50 to 60 cells) are usually
acquired. Acquired images are then renamed and their contrast is usually enhanced
for all image sets for further processing.
2.3. Cell traction measurement and development
When cells are adhered on the substrate it exerts tensile stress by acto-myosin
contractile machinery and also by constant polymerization and depolymerization of
actin. These forces are transmitted to the substrate via adhesive structures such as
focal adhesion (Balaban et al. 2001)[20, 7]. Traction forces play a pivotal role in
cell shape maintenance, migration, wound healing, mechanical signal generation or
many other cellular functions [65].
Numerous different techniques that enable experimentalist to quantify cellular
traction forces, which have been developed over the last few years[21, 66, 67]. Trac-
28

Cell traction measurement and development
Figure 2.8.: Typical images are acquired for TFM experiment: from left: cell under
bright field, beads (200nm) under the pattern in YFP, fibronectin coupled
with fibrinogen, coated on Pattern in Cy3 channel respectively
tion forces developed by cells are roughly in the nN range (Choquet al. 1997) on
adhesion sites possessing areas of micrometer square or less [16, 52]. In particular,
these have been characterized by different methods based on the deformation of
elastic planar substrates [50, 51, 57, 69, 70].
Among all these techniques, TFM (Dembo al.1996) remains the most widely used
method to precisely quantify and localize mechanical forces generated by single ad-
herent cell [22, 69, 71, 68, 72, 73]. TFM studies provided great insights regarding
the development of traction forces at the cell-ECM interface. In this study we have
chosen to work with a particular version of traction force microscopy called Fourier
Transform Traction Cytometry (FTTC).
The objective of Traction force microscopy technique is to calculate forces (F)
exerted on a continuous substrate from its deformation measurements. To do that
experimentalists need to solve an inverse problem, which is ill-posed owing to the
presence of noise. From this inverse problem solution they are able to calculate
traction forces at each adhesion sites by using linear elasticity theory.
Here we have used linear theory of elasticity to calculate the cellular stress field[74].
For FTTC calculation we have considered the substrate homogeneous and linear
elastic semi-infinite half space as the prepared polyacrylamide gel has to be thick
29

Cell traction measurement and development
Figure 2.9.: Cell traction force exerted on the substrate.
enough for this assumption. Both lateral distance over which displacement is mea-
sured and the lateral dimension of force or deformed area should be small with
respect to the substrate thickness to approximate semi- infinite elastic continuum
to finite one. Thickness or our gel is 70 - 80 µm as considered for all experiment.
The displacement vector induced by cellular forces at any point can be written as
ui on the elastic substrate as convolution form :
ui�x� � S Gij�x � x��fj�x��dx�
(2.1)
where ui and fj includes x and y component for the displacement and force re-
spectively. The force field includes forces from all other point x�
apart from the
applied point of force. Gij is the Green’s tensor in response which is response to
point traction in two dimensional plane of substrate, can be written as
Gij�r� � 1 � ν
πE��1 � ν�δij
r� ν
xixjr3
� (2.2)
or can be written as
Gij�r� � 1 � ν
πEr3
<@@@@@>�1 � ν�r2
� νx2 νxy
νxy �1 � ν�r2� νy2
=AAAAA?(2.3)
30
Cell traction measurement and development
where r �º
r.r �»x2 � y2
E is the young modulus ν is the Poisson’s ratio of the substrate under considera-
tion.
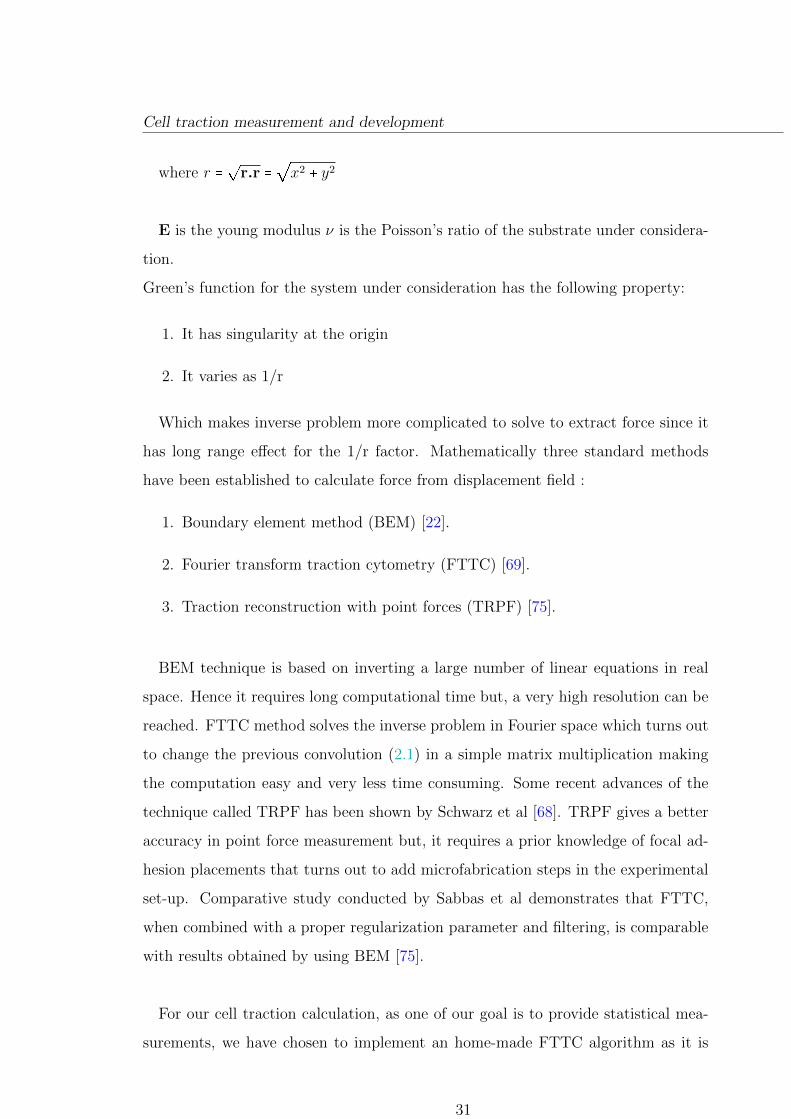
Green’s function for the system under consideration has the following property:
1. It has singularity at the origin
2. It varies as 1/r
Which makes inverse problem more complicated to solve to extract force since it
has long range effect for the 1/r factor. Mathematically three standard methods
have been established to calculate force from displacement field :
1. Boundary element method (BEM) [22].
2. Fourier transform traction cytometry (FTTC) [69].
3. Traction reconstruction with point forces (TRPF) [75].
BEM technique is based on inverting a large number of linear equations in real
space. Hence it requires long computational time but, a very high resolution can be
reached. FTTC method solves the inverse problem in Fourier space which turns out
to change the previous convolution (2.1) in a simple matrix multiplication making
the computation easy and very less time consuming. Some recent advances of the
technique called TRPF has been shown by Schwarz et al [68]. TRPF gives a better
accuracy in point force measurement but, it requires a prior knowledge of focal ad-
hesion placements that turns out to add microfabrication steps in the experimental
set-up. Comparative study conducted by Sabbas et al demonstrates that FTTC,
when combined with a proper regularization parameter and filtering, is comparable
with results obtained by using BEM [75].
For our cell traction calculation, as one of our goal is to provide statistical mea-
surements, we have chosen to implement an home-made FTTC algorithm as it is
31

Cell traction measurement and development
computationally inexpensive (Thanks to Dr. Irene Wang for developing the code).
We have developed a Fast Fourier Traction Cytometry software which includes a
combination of Particle Image Velocimetry (PIV) and Particle tracking for displace-
ment field measurements.
2.3.1. Displacement field extraction
To determine cell-induced displacement field, the very first step of the analysis is
global correction of stage drift using images of beads before (stressed) and after (re-
laxed) killing cell. Drift correction is achieved by cross correlating the two images.
Position of the max /peak of cross-correlation corresponds to the global transla-
tion. After determining this maximum cross-correlation in between stressed and
non-stressed bead images, translation is corrected and bead images are resized at
the same dimension
In the first step of displacement field analysis, we perform to PIV calculation,
stressed and relaxed bead images are overlapped and subdivided into small win-
dows. Here all the small window sizes are kept constant, typical size of 64 or 128
pixels. Between the corresponding pair (stressed and relaxed) of bead images, cross-
correlation is obtained [75, 76]. Mean displacement is calculated from the peak of
the the maximum cross-correlated images [7, 69, 72], then each bead displacement
is mapped using particle tracking in each sub-window. Schematic diagram ?? shows
displacement field calculation.
So the new displacement for each bead is:
�U �
x��i � Ui�x� �Xi (2.4)
Where i gives corresponding PIV window. Xi gives the average displacement in
each case and the value of Xi is constant for the all beads on the same PIV window.
This calculation needs to determine the bead identity as the displacement can be
measured when initial and final position of the beads are known. PIV requires a
large enough window to yield accurate values. Therefore, it is compromise between
resolution and accuracy.
32
Cell traction measurement and development
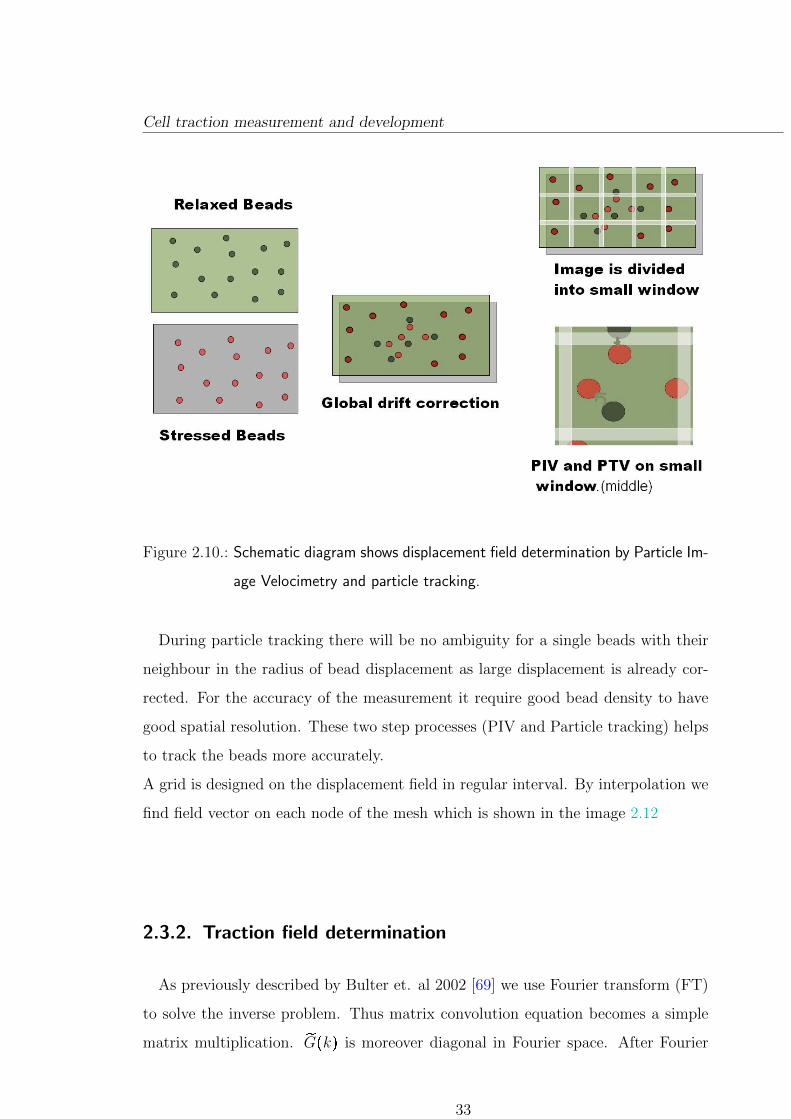
Figure 2.10.: Schematic diagram shows displacement field determination by Particle Im-
age Velocimetry and particle tracking.
During particle tracking there will be no ambiguity for a single beads with their
neighbour in the radius of bead displacement as large displacement is already cor-
rected. For the accuracy of the measurement it require good bead density to have
good spatial resolution. These two step processes (PIV and Particle tracking) helps
to track the beads more accurately.
A grid is designed on the displacement field in regular interval. By interpolation we
find field vector on each node of the mesh which is shown in the image 2.12
2.3.2. Traction field determination
As previously described by Bulter et. al 2002 [69] we use Fourier transform (FT)
to solve the inverse problem. Thus matrix convolution equation becomes a simple
matrix multiplication. ÇG�k� is moreover diagonal in Fourier space. After Fourier
33
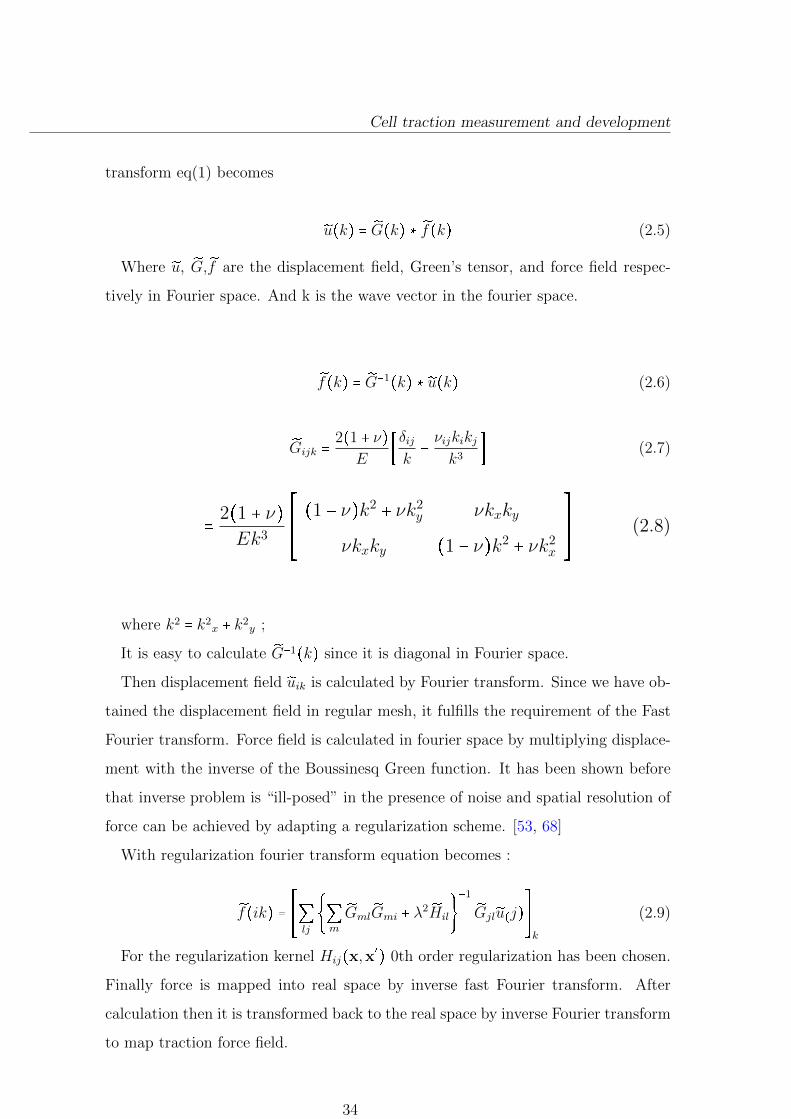
Cell traction measurement and development
transform eq(1) becomes
Çu�k� � ÇG�k� � Çf�k� (2.5)
Where Çu, ÇG,Çf are the displacement field, Green’s tensor, and force field respec-
tively in Fourier space. And k is the wave vector in the fourier space.
Çf�k� � ÇG�1�k� � Çu�k� (2.6)
ÇGijk �2�1 � ν�
E�δijk�
νijkikjk3
� (2.7)
�
2�1 � ν�Ek3
<@@@@@>�1 � ν�k2
� νk2y νkxky
νkxky �1 � ν�k2� νk2
x
=AAAAA?(2.8)
where k2 � k2x � k2y ;
It is easy to calculate ÇG�1�k� since it is diagonal in Fourier space.
Then displacement field Çuik is calculated by Fourier transform. Since we have ob-
tained the displacement field in regular mesh, it fulfills the requirement of the Fast
Fourier transform. Force field is calculated in fourier space by multiplying displace-
ment with the inverse of the Boussinesq Green function. It has been shown before
that inverse problem is “ill-posed” in the presence of noise and spatial resolution of
force can be achieved by adapting a regularization scheme. [53, 68]
With regularization fourier transform equation becomes :
Çf�ik� � <@@@@>Qlj �QmÇGml
ÇGmi � λ2 ÇHil¡
�1 ÇGjlÇu�j�=AAAA?k (2.9)
For the regularization kernel Hij�x,x�� 0th order regularization has been chosen.
Finally force is mapped into real space by inverse fast Fourier transform. After
calculation then it is transformed back to the real space by inverse Fourier transform
to map traction force field.
34
Cell traction measurement and development
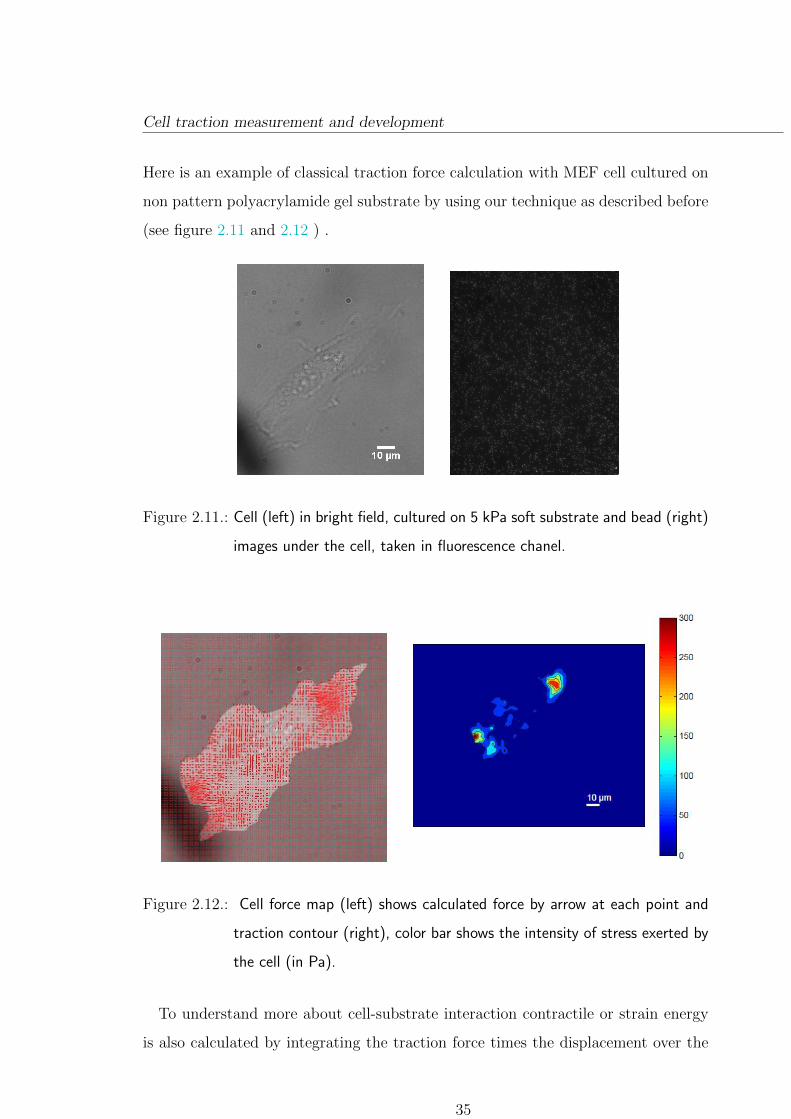
Here is an example of classical traction force calculation with MEF cell cultured on
non pattern polyacrylamide gel substrate by using our technique as described before
(see figure 2.11 and 2.12 ) .
Figure 2.11.: Cell (left) in bright field, cultured on 5 kPa soft substrate and bead (right)
images under the cell, taken in fluorescence chanel.
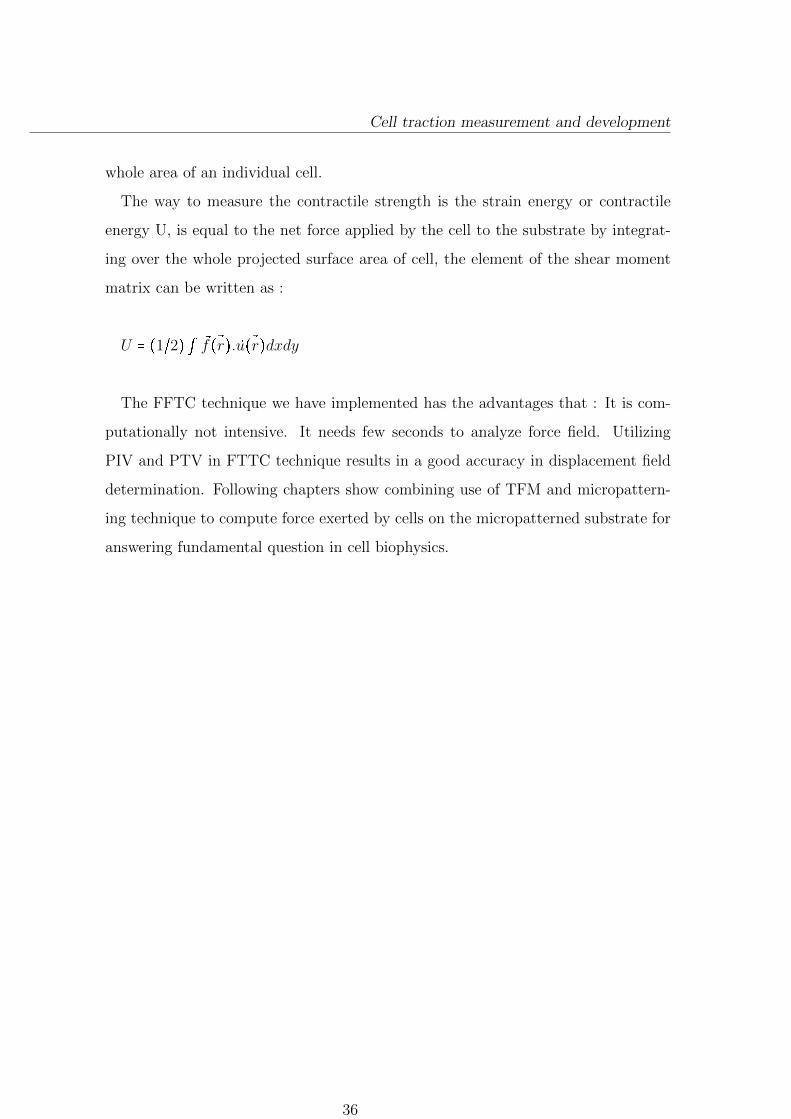
Figure 2.12.: Cell force map (left) shows calculated force by arrow at each point and
traction contour (right), color bar shows the intensity of stress exerted by
the cell (in Pa).
To understand more about cell-substrate interaction contractile or strain energy
is also calculated by integrating the traction force times the displacement over the
35
Cell traction measurement and development
whole area of an individual cell.
The way to measure the contractile strength is the strain energy or contractile
energy U, is equal to the net force applied by the cell to the substrate by integrat-
ing over the whole projected surface area of cell, the element of the shear moment
matrix can be written as :
U � �1~2� R Ñf Ñ�r�.Ñu Ñ�r�dxdy
The FFTC technique we have implemented has the advantages that : It is com-
putationally not intensive. It needs few seconds to analyze force field. Utilizing
PIV and PTV in FTTC technique results in a good accuracy in displacement field
determination. Following chapters show combining use of TFM and micropattern-
ing technique to compute force exerted by cells on the micropatterned substrate for
answering fundamental question in cell biophysics.
36

3. Influence of ECM physical
properties on force generation and
mechanotransduction
3.1. Introduction
In vivo cells maintain predefined and reproducible shapes and architectures, which
play a critical role in cellular and tissue functioning. Extra cellular matrix, on
which cells adhere, provides a variety of biochemical signals that influence cellular
behaviour including cell adhesion, migration and differentiation but it also provides
scaffold for cells that strongly influences cell architecture and their related intra-
cellular tension [1]. Understanding how the physical properties (geometry, rigidity
etc.) of the extra-cellular matrix influences cell shape, internal organization and
signaling remains a major question in cell biology[77]. Recently a large number
of microfabrication techniques such as micropatterning has expound the ability to
artificially reconstruct internal conditions (geometrical constraints, soft substrates)
experienced by cells in vivo[78].
In this chapter we will probe the existing relation between cell shape and cell force
generation in response to ECM physical properties by using a combination of cell
micropatterning and traction force microscopy on soft substrates. This chapter is
divided into two parts. In the first part of this chapter, we have investigate the effect
of micron-scale ECM geometry influence on spatial force distribution at the single
cell level. Observation on cell traction force distribution is based on the utilization
37

Introduction
of micropatterns with different subcellular geometrical shapes while ensuring indi-
vidual cells to have exactly the same envelope. We have shown that single cells are
able to regulate their contractile energy at the global scale by spatially redistributing
actin generated forces and adhesion sites in response to the geometry of the ECM.
In the second part of this chapter we explore how matrix stiffness influences the
process of cell rigidity sensing that is known to have diverse effects on cellular be-
haviour including motility, proliferation, adhesion and differentiation [4, 79, 80, 81].
In this second part, we compare forces developed in continuous 2D substrate with
micropillar 3D substrate, having same arrangement by using a previously described
elastic model [82] that allowed us to evaluate the equivalent Young modulus of a
microtextured surface with the one of a continuous hydrogel. In particular, we study
the forces developed by REF52 cells on a micro-post array in comparison to those
measured on micro-patterned substrate with different substrate rigidities. By corre-
lating forces with focal adhesion assembly, we delineate how mechanotransduction
process gets stimulated in response to stiffness changes.
38

Part I.
39


Role of the ECM geometry in cell traction force distribution
3.2. Role of the ECM geometry in cell traction force
distribution
Substrate rigidity, ECM-ligand specificity, and topography influence cellular traction
forces and ultimately on cell behaviour. In particular, does the cell regulate its
tension locally or globally is still a question that remains unsolved. To address this
question we have used Traction force microscopy on a set of 3 different micropatterns
enabling us to control cell shape while changing their underlying ECM geometry.
3.2.1. Experimental approach
As a model system we have used Mouse Embryonic Fibroblasts (MEF) for these
experiments. Each micropattern has been designed so as to isolate single cells on a
square envelope of projected surface area of 900 µm2 using adhesive bars of 7 µm
width on 5kPa hydrogels. Micropatterns are coated with a mix of ECM proteins
composed of fibronectin conjugated with fluorescent fibrinogen. ECM protein con-
centration are kept constant throughout all the experiments (20 µg/mL). Previous
studies [40] have shown that, on micropattern created on glass substrate, cells tend
to form actin bundles over non adhesive regions. Micropatterning technique on soft
hydrogel enable us to determine traction forces, besides controlling cell shape. It
provides control on cellular organization in response to substrate modulation.
Figure 3.1.: Image of Protein coated micropatterns(red), created on polyacrylamide hy-
drogel U, H and Arrow respectively. Fluorescence images are acquired in
Cy3 channel.(scale bar 10 µm)
41
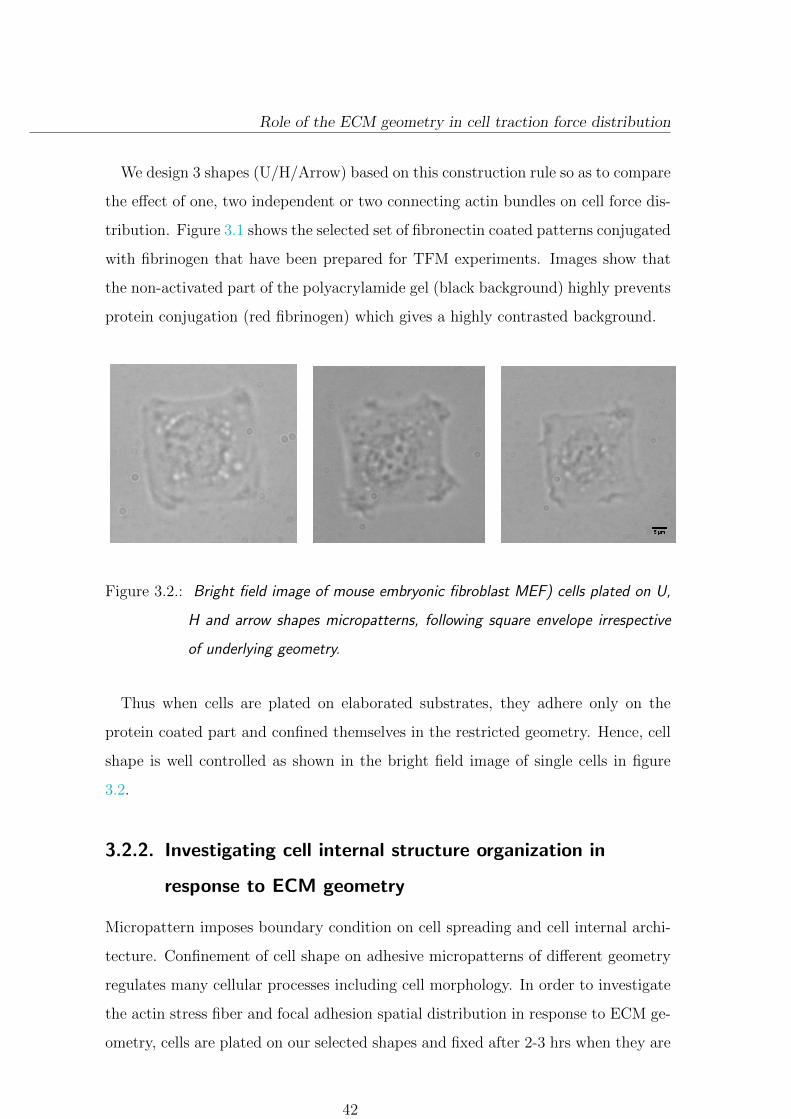
Role of the ECM geometry in cell traction force distribution
We design 3 shapes (U/H/Arrow) based on this construction rule so as to compare
the effect of one, two independent or two connecting actin bundles on cell force dis-
tribution. Figure 3.1 shows the selected set of fibronectin coated patterns conjugated
with fibrinogen that have been prepared for TFM experiments. Images show that
the non-activated part of the polyacrylamide gel (black background) highly prevents
protein conjugation (red fibrinogen) which gives a highly contrasted background.
Figure 3.2.: Bright field image of mouse embryonic fibroblast MEF) cells plated on U,
H and arrow shapes micropatterns, following square envelope irrespective
of underlying geometry.
Thus when cells are plated on elaborated substrates, they adhere only on the
protein coated part and confined themselves in the restricted geometry. Hence, cell
shape is well controlled as shown in the bright field image of single cells in figure
3.2.
3.2.2. Investigating cell internal structure organization in
response to ECM geometry
Micropattern imposes boundary condition on cell spreading and cell internal archi-
tecture. Confinement of cell shape on adhesive micropatterns of different geometry
regulates many cellular processes including cell morphology. In order to investigate
the actin stress fiber and focal adhesion spatial distribution in response to ECM ge-
ometry, cells are plated on our selected shapes and fixed after 2-3 hrs when they are
42
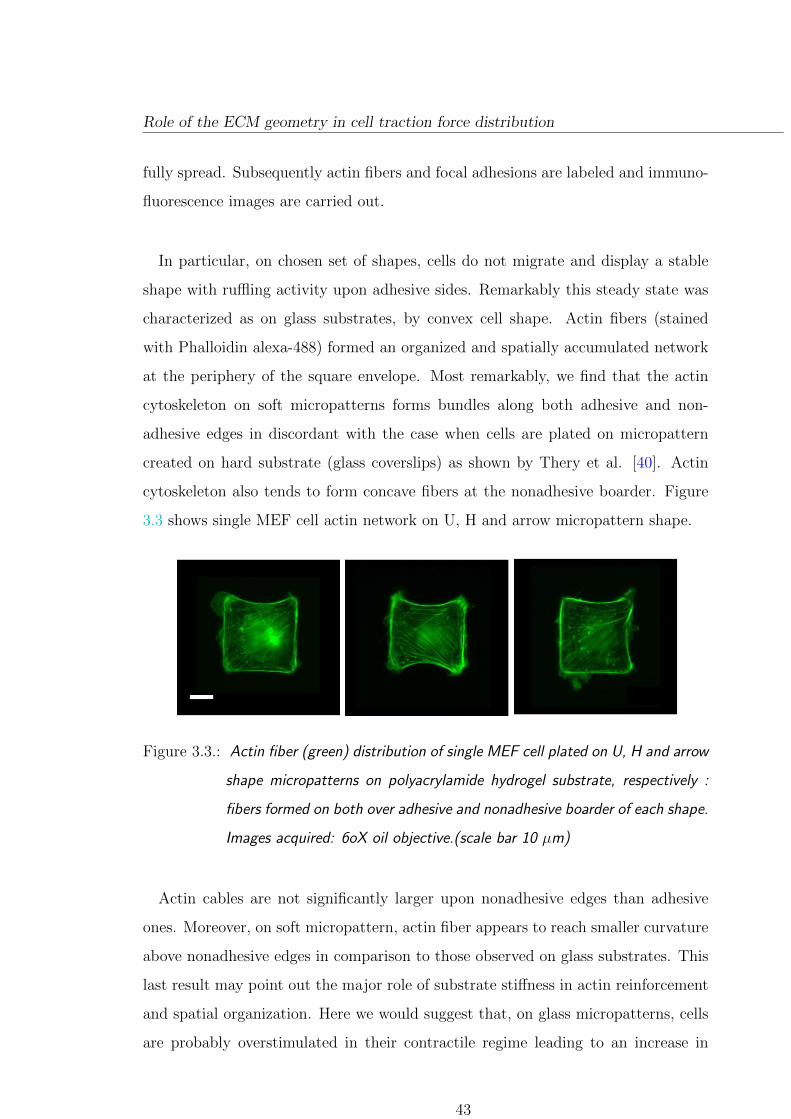
Role of the ECM geometry in cell traction force distribution
fully spread. Subsequently actin fibers and focal adhesions are labeled and immuno-
fluorescence images are carried out.
In particular, on chosen set of shapes, cells do not migrate and display a stable
shape with ruffling activity upon adhesive sides. Remarkably this steady state was
characterized as on glass substrates, by convex cell shape. Actin fibers (stained
with Phalloidin alexa-488) formed an organized and spatially accumulated network
at the periphery of the square envelope. Most remarkably, we find that the actin
cytoskeleton on soft micropatterns forms bundles along both adhesive and non-
adhesive edges in discordant with the case when cells are plated on micropattern
created on hard substrate (glass coverslips) as shown by Thery et al. [40]. Actin
cytoskeleton also tends to form concave fibers at the nonadhesive boarder. Figure
3.3 shows single MEF cell actin network on U, H and arrow micropattern shape.
Figure 3.3.: Actin fiber (green) distribution of single MEF cell plated on U, H and arrow
shape micropatterns on polyacrylamide hydrogel substrate, respectively :
fibers formed on both over adhesive and nonadhesive boarder of each shape.
Images acquired: 6oX oil objective.(scale bar 10 µm)
Actin cables are not significantly larger upon nonadhesive edges than adhesive
ones. Moreover, on soft micropattern, actin fiber appears to reach smaller curvature
above nonadhesive edges in comparison to those observed on glass substrates. This
last result may point out the major role of substrate stiffness in actin reinforcement
and spatial organization. Here we would suggest that, on glass micropatterns, cells
are probably overstimulated in their contractile regime leading to an increase in
43
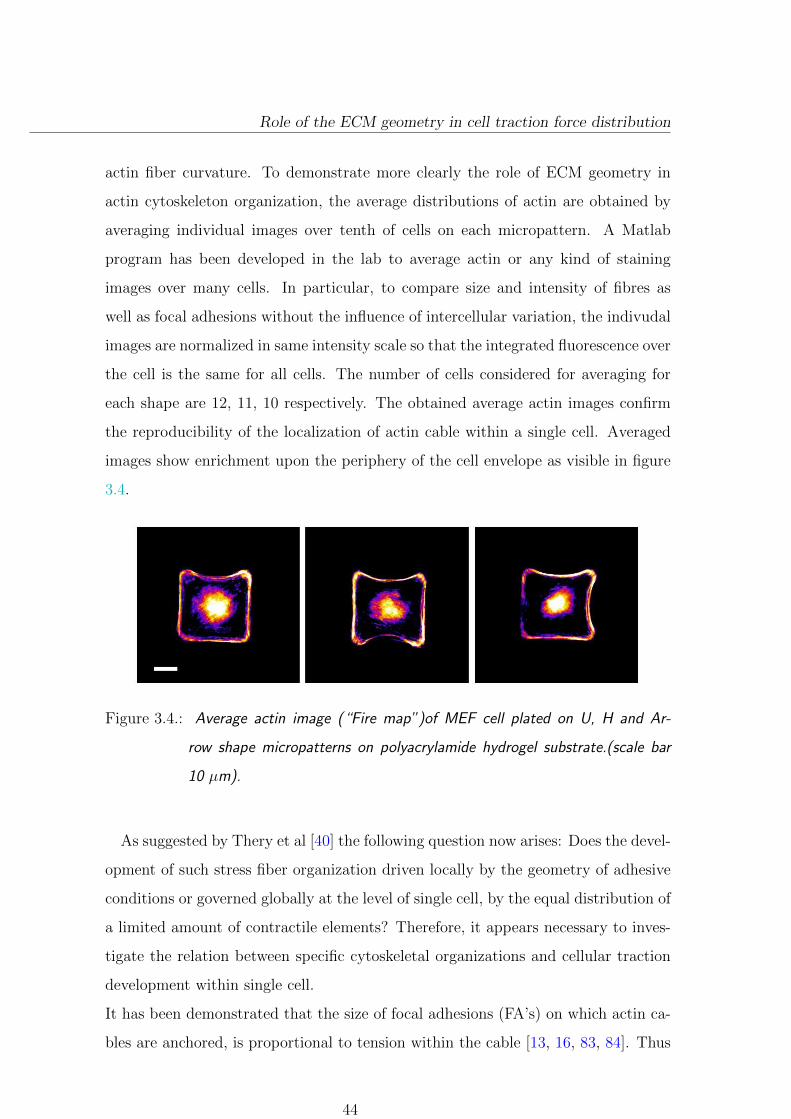
Role of the ECM geometry in cell traction force distribution
actin fiber curvature. To demonstrate more clearly the role of ECM geometry in
actin cytoskeleton organization, the average distributions of actin are obtained by
averaging individual images over tenth of cells on each micropattern. A Matlab
program has been developed in the lab to average actin or any kind of staining
images over many cells. In particular, to compare size and intensity of fibres as
well as focal adhesions without the influence of intercellular variation, the indivudal
images are normalized in same intensity scale so that the integrated fluorescence over
the cell is the same for all cells. The number of cells considered for averaging for
each shape are 12, 11, 10 respectively. The obtained average actin images confirm
the reproducibility of the localization of actin cable within a single cell. Averaged
images show enrichment upon the periphery of the cell envelope as visible in figure
3.4.
Figure 3.4.: Average actin image (“Fire map”)of MEF cell plated on U, H and Ar-
row shape micropatterns on polyacrylamide hydrogel substrate.(scale bar
10 µm).
As suggested by Thery et al [40] the following question now arises: Does the devel-
opment of such stress fiber organization driven locally by the geometry of adhesive
conditions or governed globally at the level of single cell, by the equal distribution of
a limited amount of contractile elements? Therefore, it appears necessary to inves-
tigate the relation between specific cytoskeletal organizations and cellular traction
development within single cell.
It has been demonstrated that the size of focal adhesions (FA’s) on which actin ca-
bles are anchored, is proportional to tension within the cable [13, 16, 83, 84]. Thus
44
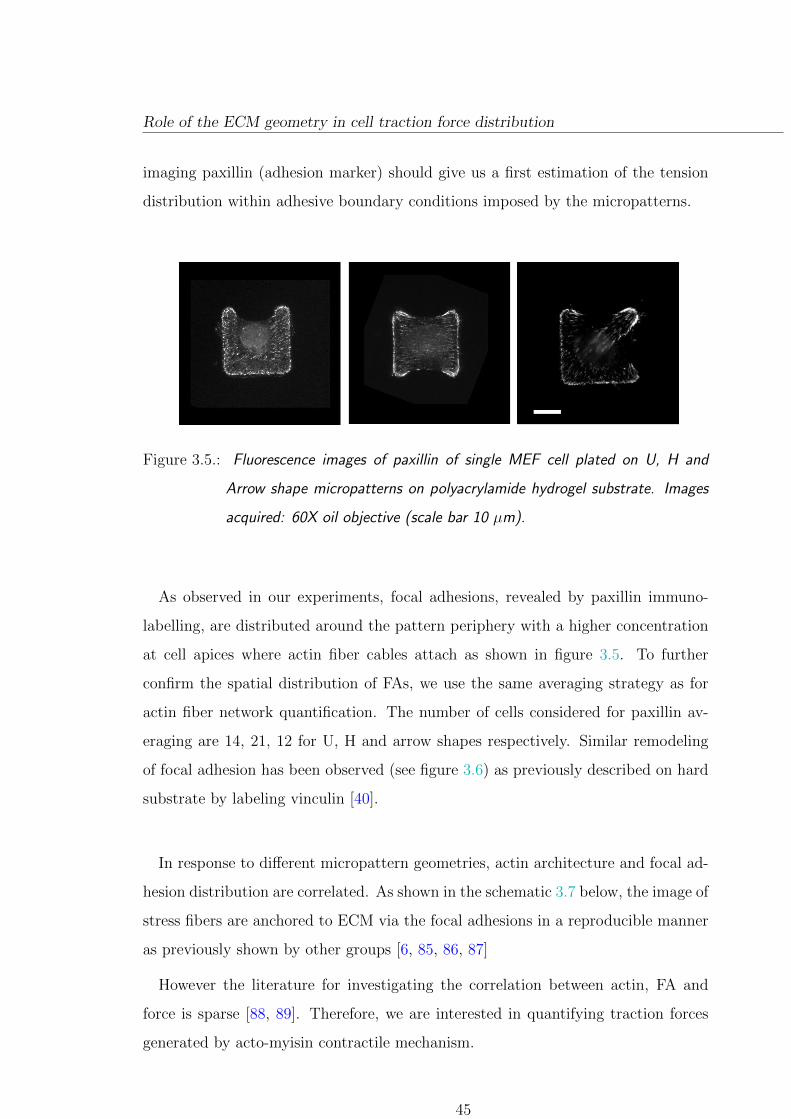
Role of the ECM geometry in cell traction force distribution
imaging paxillin (adhesion marker) should give us a first estimation of the tension
distribution within adhesive boundary conditions imposed by the micropatterns.
Figure 3.5.: Fluorescence images of paxillin of single MEF cell plated on U, H and
Arrow shape micropatterns on polyacrylamide hydrogel substrate. Images
acquired: 60X oil objective (scale bar 10 µm).
As observed in our experiments, focal adhesions, revealed by paxillin immuno-
labelling, are distributed around the pattern periphery with a higher concentration
at cell apices where actin fiber cables attach as shown in figure 3.5. To further
confirm the spatial distribution of FAs, we use the same averaging strategy as for
actin fiber network quantification. The number of cells considered for paxillin av-
eraging are 14, 21, 12 for U, H and arrow shapes respectively. Similar remodeling
of focal adhesion has been observed (see figure 3.6) as previously described on hard
substrate by labeling vinculin [40].
In response to different micropattern geometries, actin architecture and focal ad-
hesion distribution are correlated. As shown in the schematic 3.7 below, the image of
stress fibers are anchored to ECM via the focal adhesions in a reproducible manner
as previously shown by other groups [6, 85, 86, 87]
However the literature for investigating the correlation between actin, FA and
force is sparse [88, 89]. Therefore, we are interested in quantifying traction forces
generated by acto-myisin contractile mechanism.
45

Role of the ECM geometry in cell traction force distribution
Figure 3.6.: Average paxillin images over several MEF cells :Images show adhesions on
U, H and Arrow patterns respectively. (scale bar 10 µm).
Figure 3.7.: Schematic of stress fiber - focal adhesion coupling distributed over the
projected area envelopes. (scale bar 10 µm).
3.2.3. Cell traction force quantification in response to ECM
geometry
In this sub-section, we will focus on how traction forces are spatially distributed in
relation to previously observed actin filaments and paxillin organizations. To answer
this question we quantify the force exerted by the cell both locally and globally on
the ECM.
When cells are fully spread on the micropatterned substrate they are generally
very flat (thickness in z direction is in the range of few micrometers). Therefore,
force exerted on the substrate by the adherent cell, is considered to be tangential
to the substrate as previously described by Schwarz et al. [68]. Force quantification
has been done on polyacrylamide hydrogels embedded with fluorescent nano-beads
as described in chapter2 and ANNEX. In order to maintain same experimental con-
46
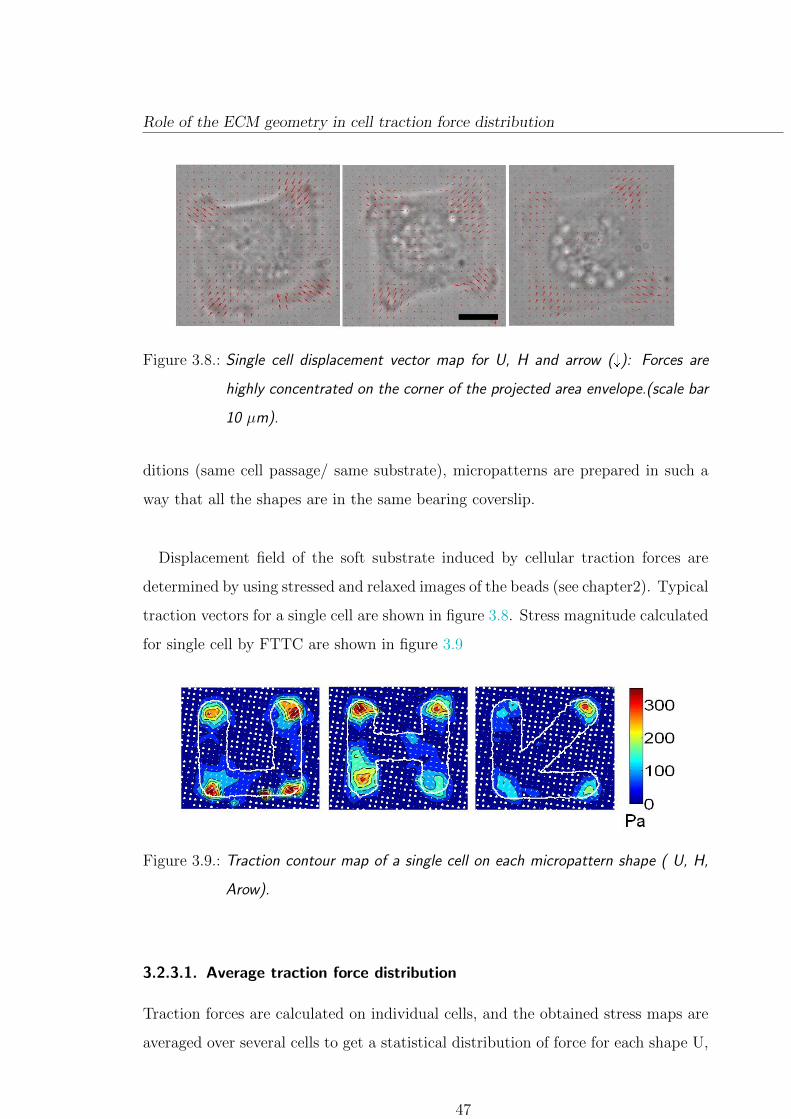
Role of the ECM geometry in cell traction force distribution
Figure 3.8.: Single cell displacement vector map for U, H and arrow (�): Forces are
highly concentrated on the corner of the projected area envelope.(scale bar
10 µm).
ditions (same cell passage/ same substrate), micropatterns are prepared in such a
way that all the shapes are in the same bearing coverslip.
Displacement field of the soft substrate induced by cellular traction forces are
determined by using stressed and relaxed images of the beads (see chapter2). Typical
traction vectors for a single cell are shown in figure 3.8. Stress magnitude calculated
for single cell by FTTC are shown in figure 3.9
Figure 3.9.: Traction contour map of a single cell on each micropattern shape ( U, H,
Arow).
3.2.3.1. Average traction force distribution
Traction forces are calculated on individual cells, and the obtained stress maps are
averaged over several cells to get a statistical distribution of force for each shape U,
47
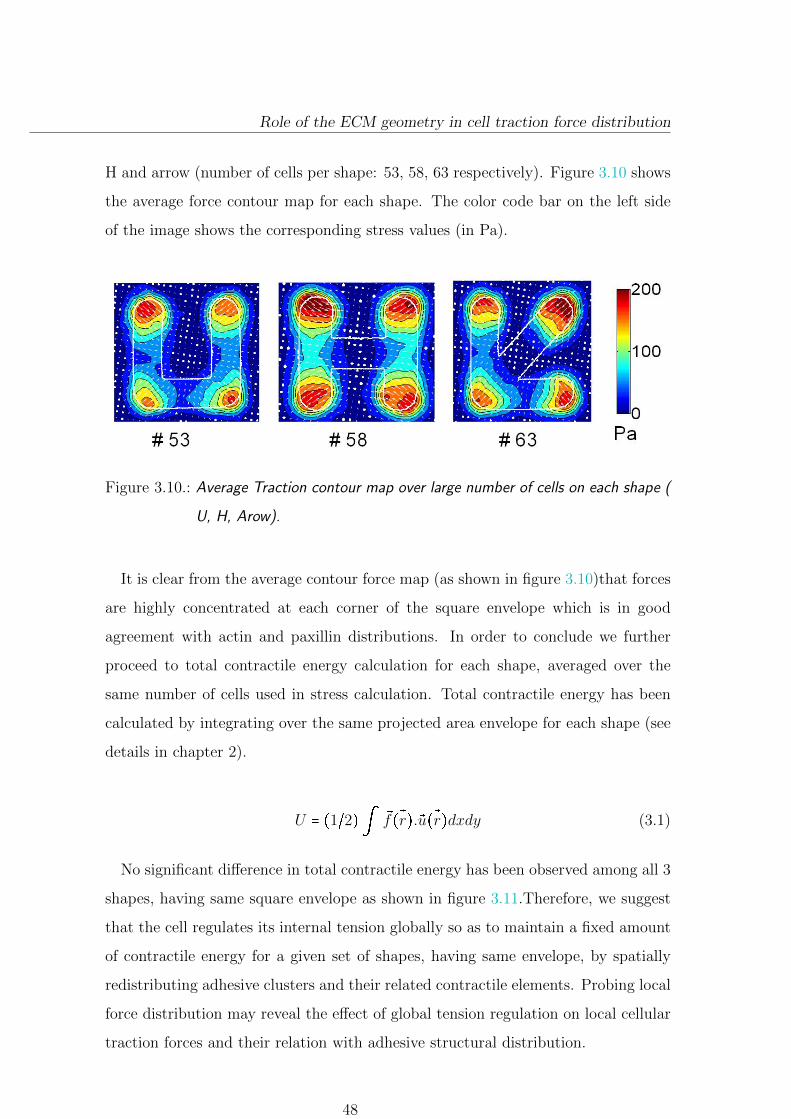
Role of the ECM geometry in cell traction force distribution
H and arrow (number of cells per shape: 53, 58, 63 respectively). Figure 3.10 shows
the average force contour map for each shape. The color code bar on the left side
of the image shows the corresponding stress values (in Pa).
Figure 3.10.: Average Traction contour map over large number of cells on each shape (
U, H, Arow).
It is clear from the average contour force map (as shown in figure 3.10)that forces
are highly concentrated at each corner of the square envelope which is in good
agreement with actin and paxillin distributions. In order to conclude we further
proceed to total contractile energy calculation for each shape, averaged over the
same number of cells used in stress calculation. Total contractile energy has been
calculated by integrating over the same projected area envelope for each shape (see
details in chapter 2).
U � �1~2�S Ñf Ñ�r�.Ñu Ñ�r�dxdy (3.1)
No significant difference in total contractile energy has been observed among all 3
shapes, having same square envelope as shown in figure 3.11.Therefore, we suggest
that the cell regulates its internal tension globally so as to maintain a fixed amount
of contractile energy for a given set of shapes, having same envelope, by spatially
redistributing adhesive clusters and their related contractile elements. Probing local
force distribution may reveal the effect of global tension regulation on local cellular
traction forces and their relation with adhesive structural distribution.
48

Role of the ECM geometry in cell traction force distribution
Figure 3.11.: Average of total contractile energy developed by cells on U, H and arrow
shape micropatterns.
3.2.3.2. Local force distribution
To get a better insight on spatial redistribution of cellular traction forces in response
to ECM geometry, we calculate average force on each corner of the pattern by
averaging force on a circle of diameter 18µm on each pattern corner and normalized
with respect to total force produced by cell. Results are presented in figure 3.12.
In all the cases, we found that the forces tend to be relatively higher at the
point where nonadhesive fibers are connected, suggesting that tension along the non
adhesive fibers are higher in comparison to adhesive ones. This argument is clear
when we compare corner number 1 and 3 histogram bars with 2 and 4 on U shape.
However, in the shape with symmetrical corners i.e H shape, forces are not equally
distributed. These differences is certainly related to intercellular variability and
calculation errors. Interestingly, we found that on arrow, two non adhesive fibers
contacting at corner 3 lead to a local increase in traction forces. For the same shape,
at corner 1 and 4 local forces are little higher as compared to corner 2 but lower than
the corner 3 as expected (non adhesive vs adhesive fibers). These results confirm
49

Role of the ECM geometry in cell traction force distribution
Figure 3.12.: Local force distribution on each corner averaged over many cells(U=53,
H=58, arrow=63) for each shape.
that stress fiber strength along edges depends on local adhesiveness (ability of cells
to form or contact numerous fibers).
3.2.4. Conclusion and Discussion
In this study, we have systematically investigated the influence of micron scale ECM
geometry on cellular traction force distribution. Observations on force distribution
is based on the use of a micropatterning technique combined with traction force
microscopy. Results show that, for a given set of shapes having same projected
area and square envelope while changing the underlying ECM geometry, total con-
tractile energy is preserved. This contractile energy regulation in response to ECM
geometry is achieved through local force redistribution. The observation on spatial
50

Role of the ECM geometry in cell traction force distribution
distribution of traction force measurement are co-localized with focal adhesion. An
asymmetric distribution of focal adhesion throughout the pattern, while enriched
upon the corners of the envelope is observed in correlation with actin fiber orga-
nization. Actin cytoskeleton remodels organization in response to ECM geometry.
Most strikingly fibers are assembled and oriented both along adhesive and non ad-
hesive edges of the cell envelope. Results obtained on soft substrate are dissimilar
with results obtained earlier on hard substrate pattern. Moreover, tension in fiber
along nonadhesive boarder are higher than the adhesive ones. Furthermore, actin
structures are correlated with associated force distributions. Henceforth, local distri-
bution shows higher stress value at the end of the nonadhesive fiber despite, having
same total contractility. We thus can conclude that cells think globally but act
locally.
51


Part II.
53


Towards a direct comparison of micropillar array with TFM on micropatterned substrates
3.3. Towards a direct comparison of micropillar array
with TFM on micropatterned substrates
To provide quantitative force measurements, experimentalists have mainly focused
on designing tunable substrates in a variety of topography, geometry and rigidity
that would enable both high spatial resolution measurements of substrate deforma-
tion and biocompatible functionalization. Traction force microscopy and micropillar
(micropost) array are the two main methods that largely participated in describ-
ing cell rigidity sensing. However, TFM is based on experiments using continuous
flexible hydrogel while micropillar studies are based on the utilization of discrete mi-
crotextured surfaces. Forces can directly be measured in Micropillar method from
the deflection of the pillar. Hence, no approximation to be assumed so as solving
inverse problem. However these technique lacks high resolution imaging. But the
question arises now does it experiences physiological condtions like in tissue?
In this part, we will try to compare two techniques by designing continuous 2D
micropatterned substrates, that will mimick 3D micropost arrays, on which we will
measure forces exerted by Rat Embryonic Fibroblasts and that for different sub-
strates rigidities.
3.3.1. Experimental approach
Traction force microscopy experiments are performed on continuous hydrogel, pat-
terned in a regular array of circular protein coated dots mimicking the geometry
and arrangements of array of micropillars used in related studies [82]. For both
experiments, Rat Embryonic Fibrobasts (REF52)[ kindly provided by Dr. Benoit
Ladoux (University, Paris7)] are used. Cells are maintained at 37XC in a humid-
ified atmosphere of 5% CO2 and 95% air in Dulbeccos modified Eagle medium
(DMEM) containing 10% bovine calf serum. REF52 cells are plated few hours be-
fore microscopy experiments. Gel used for traction force microsopy experiments are
patterned following a previously described procedure [87]. For details of the exper-
55

Towards a direct comparison of micropillar array with TFM on micropatterned substrates
imental procedure and protocols see chapter2 and ANNEX.
A freshly prepared 2D soft substrates coated with protein (fibronectin)is shown
in figure 3.13.
Figure 3.13.: Circular array of 2D protein coated dots on a polyacrylamide hydrogel.
Typical size of a dot is two micrometers. Images are taken in Cy3 Channel
in epifluorescence microscopy with 20X and 40X air objectives respectively.
Figure 3.14.: Intensity line profile of circular dot array indicates a strong contrast.
Line profile of fluorescent intensity of the pattern image shows a high signal to
noise ratio (figure 3.14) which implies a high spatial resolution achieved at micron
scale via photo lithography. Figure 3.13 also shows a homogeneous protein distri-
bution on the dot pattern. Here, size, center to center distance and arrangement of
the dots fully correspond to micropost array structures.
56
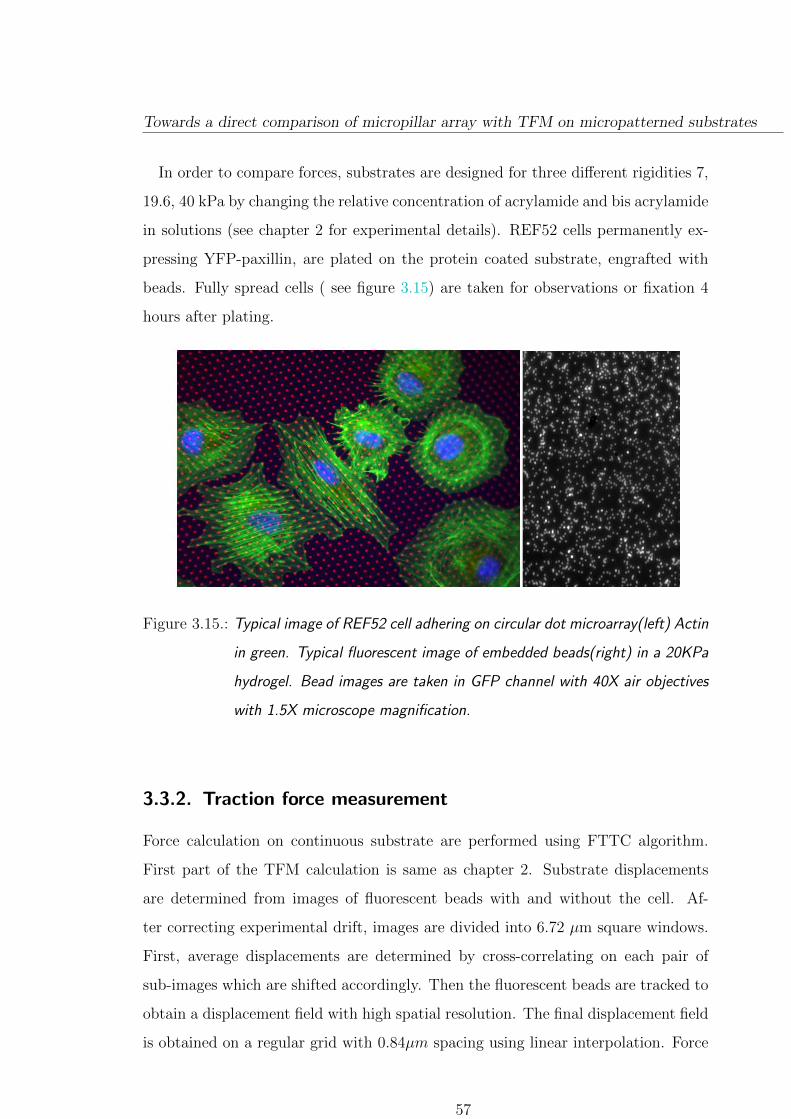
Towards a direct comparison of micropillar array with TFM on micropatterned substrates
In order to compare forces, substrates are designed for three different rigidities 7,
19.6, 40 kPa by changing the relative concentration of acrylamide and bis acrylamide
in solutions (see chapter 2 for experimental details). REF52 cells permanently ex-
pressing YFP-paxillin, are plated on the protein coated substrate, engrafted with
beads. Fully spread cells ( see figure 3.15) are taken for observations or fixation 4
hours after plating.
Figure 3.15.: Typical image of REF52 cell adhering on circular dot microarray(left) Actin
in green. Typical fluorescent image of embedded beads(right) in a 20KPa
hydrogel. Bead images are taken in GFP channel with 40X air objectives
with 1.5X microscope magnification.
3.3.2. Traction force measurement
Force calculation on continuous substrate are performed using FTTC algorithm.
First part of the TFM calculation is same as chapter 2. Substrate displacements
are determined from images of fluorescent beads with and without the cell. Af-
ter correcting experimental drift, images are divided into 6.72 µm square windows.
First, average displacements are determined by cross-correlating on each pair of
sub-images which are shifted accordingly. Then the fluorescent beads are tracked to
obtain a displacement field with high spatial resolution. The final displacement field
is obtained on a regular grid with 0.84µm spacing using linear interpolation. Force
57
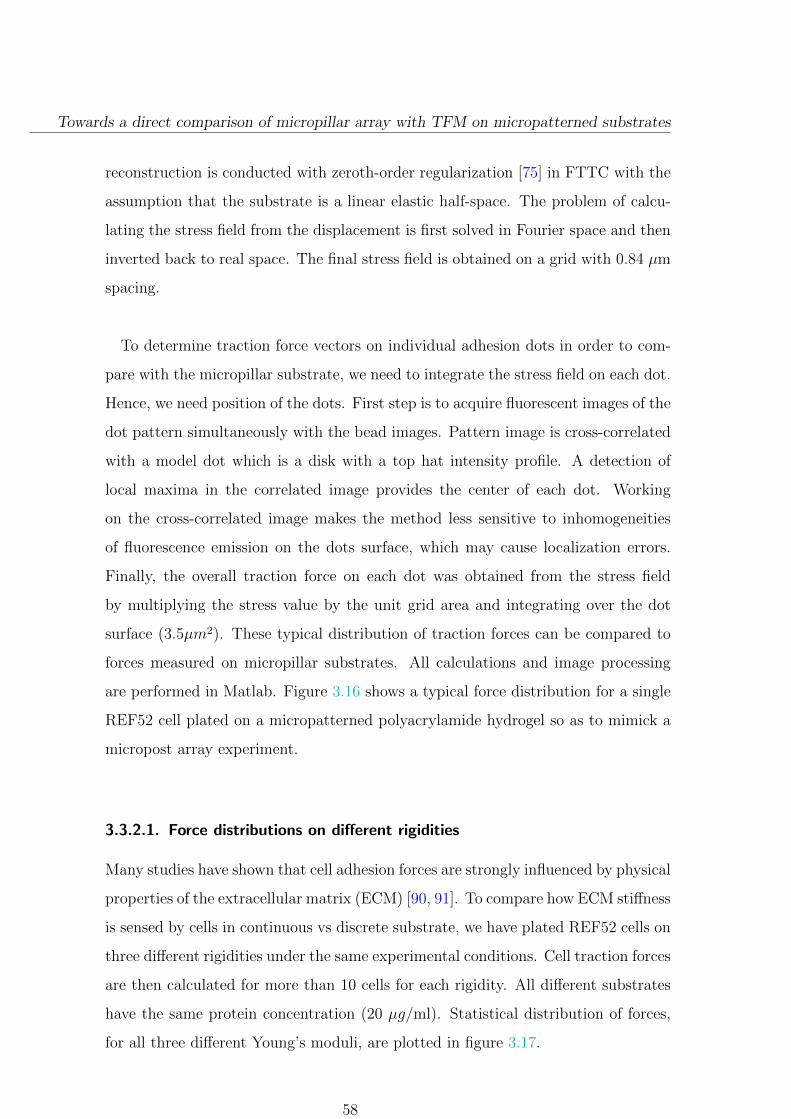
Towards a direct comparison of micropillar array with TFM on micropatterned substrates
reconstruction is conducted with zeroth-order regularization [75] in FTTC with the
assumption that the substrate is a linear elastic half-space. The problem of calcu-
lating the stress field from the displacement is first solved in Fourier space and then
inverted back to real space. The final stress field is obtained on a grid with 0.84 µm
spacing.
To determine traction force vectors on individual adhesion dots in order to com-
pare with the micropillar substrate, we need to integrate the stress field on each dot.
Hence, we need position of the dots. First step is to acquire fluorescent images of the
dot pattern simultaneously with the bead images. Pattern image is cross-correlated
with a model dot which is a disk with a top hat intensity profile. A detection of
local maxima in the correlated image provides the center of each dot. Working
on the cross-correlated image makes the method less sensitive to inhomogeneities
of fluorescence emission on the dots surface, which may cause localization errors.
Finally, the overall traction force on each dot was obtained from the stress field
by multiplying the stress value by the unit grid area and integrating over the dot
surface (3.5µm2). These typical distribution of traction forces can be compared to
forces measured on micropillar substrates. All calculations and image processing
are performed in Matlab. Figure 3.16 shows a typical force distribution for a single
REF52 cell plated on a micropatterned polyacrylamide hydrogel so as to mimick a
micropost array experiment.
3.3.2.1. Force distributions on different rigidities
Many studies have shown that cell adhesion forces are strongly influenced by physical
properties of the extracellular matrix (ECM) [90, 91]. To compare how ECM stiffness
is sensed by cells in continuous vs discrete substrate, we have plated REF52 cells on
three different rigidities under the same experimental conditions. Cell traction forces
are then calculated for more than 10 cells for each rigidity. All different substrates
have the same protein concentration (20 µg/ml). Statistical distribution of forces,
for all three different Young’s moduli, are plotted in figure 3.17.
58

Towards a direct comparison of micropillar array with TFM on micropatterned substrates
Figure 3.16.: Statistical distribution of force per circular dot on a 7 kPa rigid gel for a
single REF52 cell.
Figure 3.17.: Statistical distribution of force developed by REF52 cells on dot micropat-
tern with substrate rigidity 7, 19.6, 40 kPa.
Increasing the substrate rigidity leads to a clear shift of the distribution towards
higher forces as shown in figure 3.18. To get a clear view on that point we plotted
the average force (per dot) exerted by the cells for different Young’s modulus of the
micro-patterned substrates where a strong correlation with the surface stiffness is
exhibited as previously described by other groups [16, 82].
Indeed we observe (in figure 3.19) that increasing substrate stiffness of the un-
59
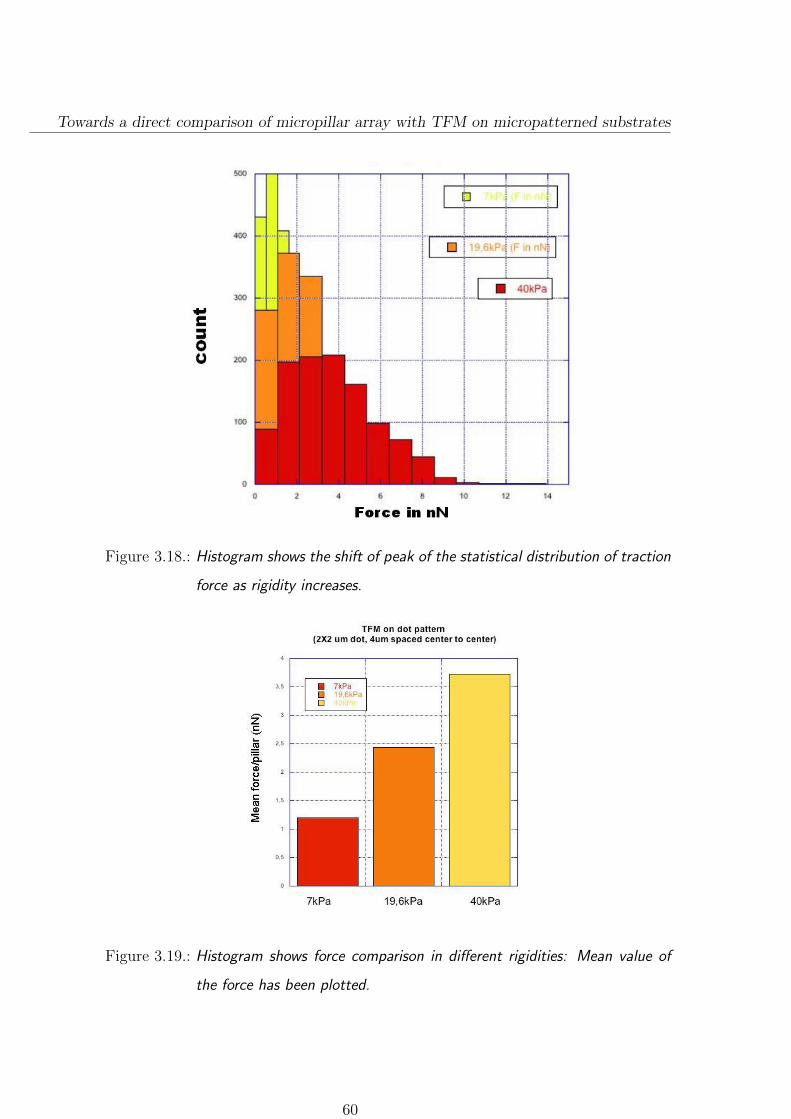
Towards a direct comparison of micropillar array with TFM on micropatterned substrates
Figure 3.18.: Histogram shows the shift of peak of the statistical distribution of traction
force as rigidity increases.
Figure 3.19.: Histogram shows force comparison in different rigidities: Mean value of
the force has been plotted.
60
Towards a direct comparison of micropillar array with TFM on micropatterned substrates
derlying hydrogel from 7 to 40 kPa enhanced the total cellular traction forces by
approximately 50 to 60 % .
More precisely, we observe a linear increase of the average force per dot from 1.2nN
to 3.7nN for moduli varying from 7 to 40kPa. This result highlights the ability of
cells to sense the rigidity of their microenvironment. However, we did not reach the
”classical” saturated regime of the maximal force exerted by cells.
In addition, previous studies have shown that cell rigidity sensing is often associated
with different organization of their actin cytoskeleton and focal adhesion. In order
to investigate the role of morphological cellular changes in the force transmission
process, we next analyze the size distribution of focal adhesions as a function of
substrate rigidity.
3.3.3. Focal adhesion size depends on substrate stiffness
FA’s play an important role in cell mechanotransduction. To investigate the signifi-
cance of focal adhesion behavior in rigidity sensing, we have quantified the adhesion
area of prominent residents at focal contacts, known as paxillin, transfected with
YFP on our model system, REF52 cells. We probe mechanotransduction using pax-
illin expression of REF52 cells in response to changes of polyacrylamide substrate
Young’s modulus. Paxillin expression on the circular array of adhesive dots is shown
in figure 3.20. In paxillin images, we observe well-defined focal contacts localized
with micropattern adhesive structures confining adhesions on micro dots. On in-
dividual dots, paxillin exhibits an elongated architecture directed toward the cell
center as shown in figure 3.21(left).
We quantify the area of each focal adhesion assembly. To perform this analysis all
image intensities have been normalized and thresholded to an arbitrary but identical
value. FA’s areas are measured for at least 10 cells per rigidity using Image J particle
tracking plugin. Focal contact quantification method is schematically represented in
figure 3.21. Mean focal adhesion areas are determined using FA’s size distributions
(typically 100 FA’s per cell) measured on more than 10 cells. Results are presented
in figure 3.22(right).
61

Towards a direct comparison of micropillar array with TFM on micropatterned substrates
Figure 3.20.: Paxillin adhesion distribution on regular array of circular dot. Right Paxillin
(green) overlapped with protein coated pattern (red): Images acquired by
20X (left) and 40X (right) air objectives in YFP channel.
Figure 3.21.: Paxillin adhesion area quantification: paxillin(YFP); Intensity thresholded
image of paxillin (middle); binarized area of each adhesion assembly(right).
As expected from previous studies [13, 20, 82] the size of FAs increases with in-
creasing substrates stiffness. This result also appears to be highly linked with the
previous force measurement ( figure 3.18) and further suggests that focal contact
growth is force induced. To study correlation between focal adhesion size and force,
we plotted average force per dot along x-axis with mean focal adhesion area per
circular dot along y-axis for all tested rigidities as shown in figure 3.23. Each point
in the plot represents different rigidities from 7 to 40 KPa. It should be noted that
62

Towards a direct comparison of micropillar array with TFM on micropatterned substrates
Figure 3.22.: Mean focal adhesion area ( determined by averaging over 500 circular
dot) increases, in response to increasing stiffness from 7 to 40 kPa.
each point in the plot has been obtained from an average over hundreds ( 500) of
FA
Figure 3.23.: Mean focal adhesion area variation with average force per circular dot for
7 , 19.6 and 40 kPa rigid substrates.
The result depicted in figure 3.23 shows a linear relationship between force and
63

Towards a direct comparison of micropillar array with TFM on micropatterned substrates
focal adhesion growth in the lower rigidity regime. Thus, the force applied by the
cell on its substrate is closely linked to the assembly of the adhesion sites. Moreover,
forces exerted at single focal adhesion in fibroblasts are found to be of the order of a
few nN. These two observations are consistent with previous estimations [13, 20, 82].
3.3.4. A few comparison on micropillar/patterned hydrogel
At the date of writing this report, REF52 force statistics on micropillars have not
been performed. However Ghibaudo’s paper in Soft Matter [82] allowed us to ex-
tract informations so as to compare our two experiments. Ghibaudo and colleagues
propose ”an elastic model that estimates the equivalent Young’s modulus, Eeff , of
a micropillar substrate”. This model leads to the following equation:
Eeff �9 � k
4Π � a(3.2)
where k is the spring constant of a micropillar and where a corresponds to either
the size of FA or the radius of the pillars. As in both experiments we used 1 mi-
crometer radius pillars, the relation between Eeff and k is Eeff=0.7�106k. Thus
by using this simple relation , we want to compare our results on 7, 20 and 40kPa
respectively we have to consider forces and FA measurements done on micropillars
of stiffness of 10, 28.5 and 57 nN/micrometer respectively. Figure 2/C of Ghibaudo
et al. enables us to have some estimation of corresponding rigidity associated forces.
Our observations are summarized in the following table.
E Eeff k(106) Fpillar Fdot
kPa kPa nN/µm nN nN
7 7 10 2 1.2
20 20 28 4 2.6
40 40 57 7 3.7
Table 3.1.: Force comparison on discrete (MDCK cell) and continuous(REF52 cells)
substrate.
64
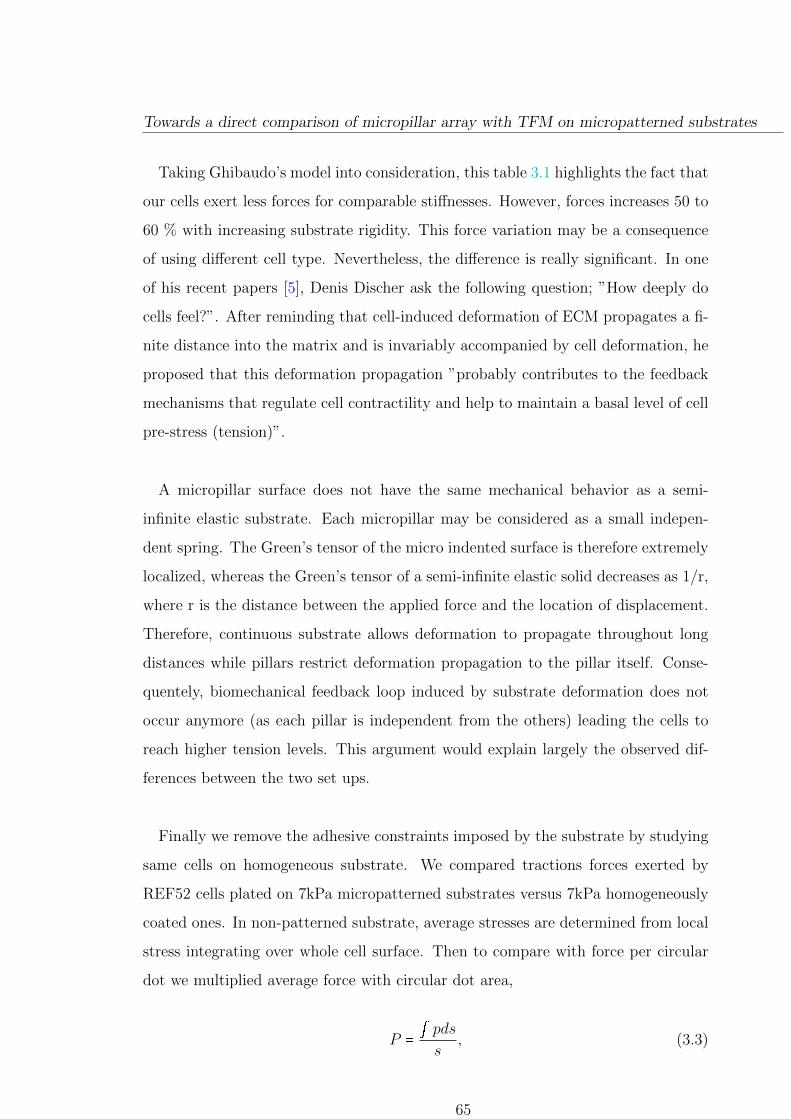
Towards a direct comparison of micropillar array with TFM on micropatterned substrates
Taking Ghibaudo’s model into consideration, this table 3.1 highlights the fact that
our cells exert less forces for comparable stiffnesses. However, forces increases 50 to
60 % with increasing substrate rigidity. This force variation may be a consequence
of using different cell type. Nevertheless, the difference is really significant. In one
of his recent papers [5], Denis Discher ask the following question; ”How deeply do
cells feel?”. After reminding that cell-induced deformation of ECM propagates a fi-
nite distance into the matrix and is invariably accompanied by cell deformation, he
proposed that this deformation propagation ”probably contributes to the feedback
mechanisms that regulate cell contractility and help to maintain a basal level of cell
pre-stress (tension)”.
A micropillar surface does not have the same mechanical behavior as a semi-
infinite elastic substrate. Each micropillar may be considered as a small indepen-
dent spring. The Green’s tensor of the micro indented surface is therefore extremely
localized, whereas the Green’s tensor of a semi-infinite elastic solid decreases as 1/r,
where r is the distance between the applied force and the location of displacement.
Therefore, continuous substrate allows deformation to propagate throughout long
distances while pillars restrict deformation propagation to the pillar itself. Conse-
quentely, biomechanical feedback loop induced by substrate deformation does not
occur anymore (as each pillar is independent from the others) leading the cells to
reach higher tension levels. This argument would explain largely the observed dif-
ferences between the two set ups.
Finally we remove the adhesive constraints imposed by the substrate by studying
same cells on homogeneous substrate. We compared tractions forces exerted by
REF52 cells plated on 7kPa micropatterned substrates versus 7kPa homogeneously
coated ones. In non-patterned substrate, average stresses are determined from local
stress integrating over whole cell surface. Then to compare with force per circular
dot we multiplied average force with circular dot area,
P �R pdss
, (3.3)
65
Towards a direct comparison of micropillar array with TFM on micropatterned substrates
Where P = average stress; p = stress on small area ds ; s = total surface area under
the cell. Force (F) per circular dot can be written as
F � P � S, (3.4)
S = area of the circular dot.
Results obtained are presented in figure 3.24 histogram where @ F A is average
force per circular dot area.
Figure 3.24.: Force comparison on pattern vs non-pattern substrate of rigidity 7 to 40
kPa.
We found that lying on substrates of identical rigidities, cells exert significantly
higher forces on micropatterned hydrogels. This observation is consistent with our
previous findings on single cell micropatterns in which cells tend to form large con-
tractile fibers above non adhesive regions leading to local increase in cellular traction
forces. Result is not surprising since focal adhesions are localized on the dots while
for homogeneous substrate adhesion are not biased. Therefore, in average force
calculation whole cell area is considered as shown in eq. 3.3
3.3.5. Conclusion and Discussion
By coupling hydrogel micropatterning with Traction Force microscopy using Fast
Fourier Traction Cytometry algorithm , we are able to correlate forces that single
66
Towards a direct comparison of micropillar array with TFM on micropatterned substrates
REF52 cell develop with the focal adhesion size by measuring paxillin. Moreover,
culturing the cells on 7, 20, 40 kPa hydrogels, shows a linear correlation of substrate
rigidity with cell traction force in the lower rigidity regime. In this regime we find
linear relationship between force per adhesive area with focal adhesion size. Using
quantitative approach we were able to compare our observations with the results
obtained on discrete substrate such as on micro-pillars. Although, different cell
types are used for force comparison, our observation show a reduced cell contractility
on continuous substrate which may be due to the fact that the micropillars do not
allow cell to sense long range deformations which may lead to increase basal tension
in the absence regulating feedback. Finally our findings may suggest that substrate
texture plays a major role in transmission of cell induced deformation and ultimately
in cell rigidity sensing.
67

4. Spatial correlation between actin
generated forces and centrosome
positioning
4.1. Introduction:
Cell responds to physical cues of their microenvironment, such as stiffness and geom-
etry of the ECM [40, 92]. More precisely, geometrical features such as shape of the
substrate are known to affect cell traction force and adhesive structural organization
as we have shown in the previous chapter. However, little is known about the effect
of distribution and orientation of traction forces on cell internal organization. To
elucidate force distribution influence on organelle distribution, we will discuss the
potential relation between spatial force distribution and centrosome positioning in
this chapter. We try to correlate traction force with centrosome distribution.
Centrosome is the main microtubule organizing center (MTOC) of the animal cell
as well as a regulator of cell-cycle progression. It has been suggested by Michel
Bornens that the centrosome is“suspected from the start to have a role in cell sym-
metry breaking and the maintenance of cell polarity”[26]. Interestingly, when ad-
herent cells are free to spread on a substrate, the centrosome self organizes at the
geometrical center of the cell. The precision of this centrosome centering have been
nicely demonstrated when cells were cultured on a glass substrate where cell shape
was confined [23, 26]. Thus, centrosome positioning at the cell center appears to be
tightly regulated and to be a fundamental event in cell polarity establishment. The
69
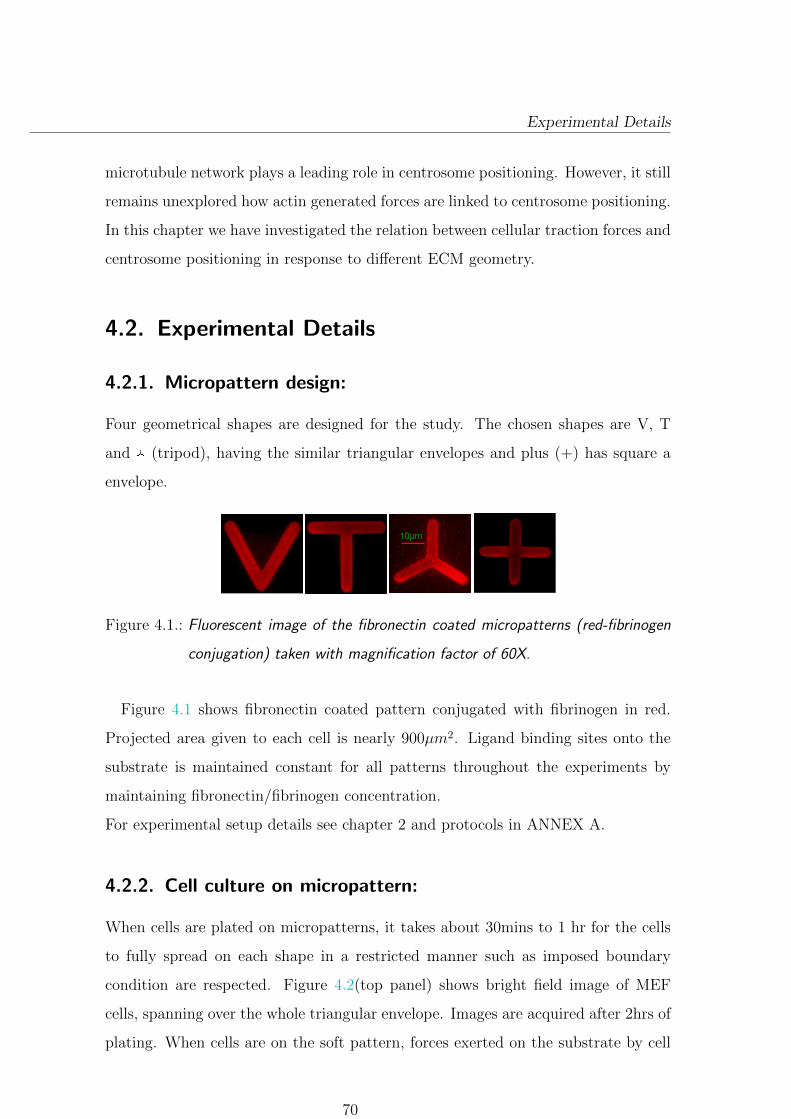
Experimental Details
microtubule network plays a leading role in centrosome positioning. However, it still
remains unexplored how actin generated forces are linked to centrosome positioning.
In this chapter we have investigated the relation between cellular traction forces and
centrosome positioning in response to different ECM geometry.
4.2. Experimental Details
4.2.1. Micropattern design:
Four geometrical shapes are designed for the study. The chosen shapes are V, T
and ) (tripod), having the similar triangular envelopes and plus (+) has square a
envelope.
Figure 4.1.: Fluorescent image of the fibronectin coated micropatterns (red-fibrinogen
conjugation) taken with magnification factor of 60X.
Figure 4.1 shows fibronectin coated pattern conjugated with fibrinogen in red.
Projected area given to each cell is nearly 900µm2. Ligand binding sites onto the
substrate is maintained constant for all patterns throughout the experiments by
maintaining fibronectin/fibrinogen concentration.
For experimental setup details see chapter 2 and protocols in ANNEX A.
4.2.2. Cell culture on micropattern:
When cells are plated on micropatterns, it takes about 30mins to 1 hr for the cells
to fully spread on each shape in a restricted manner such as imposed boundary
condition are respected. Figure 4.2(top panel) shows bright field image of MEF
cells, spanning over the whole triangular envelope. Images are acquired after 2hrs of
plating. When cells are on the soft pattern, forces exerted on the substrate by cell
70
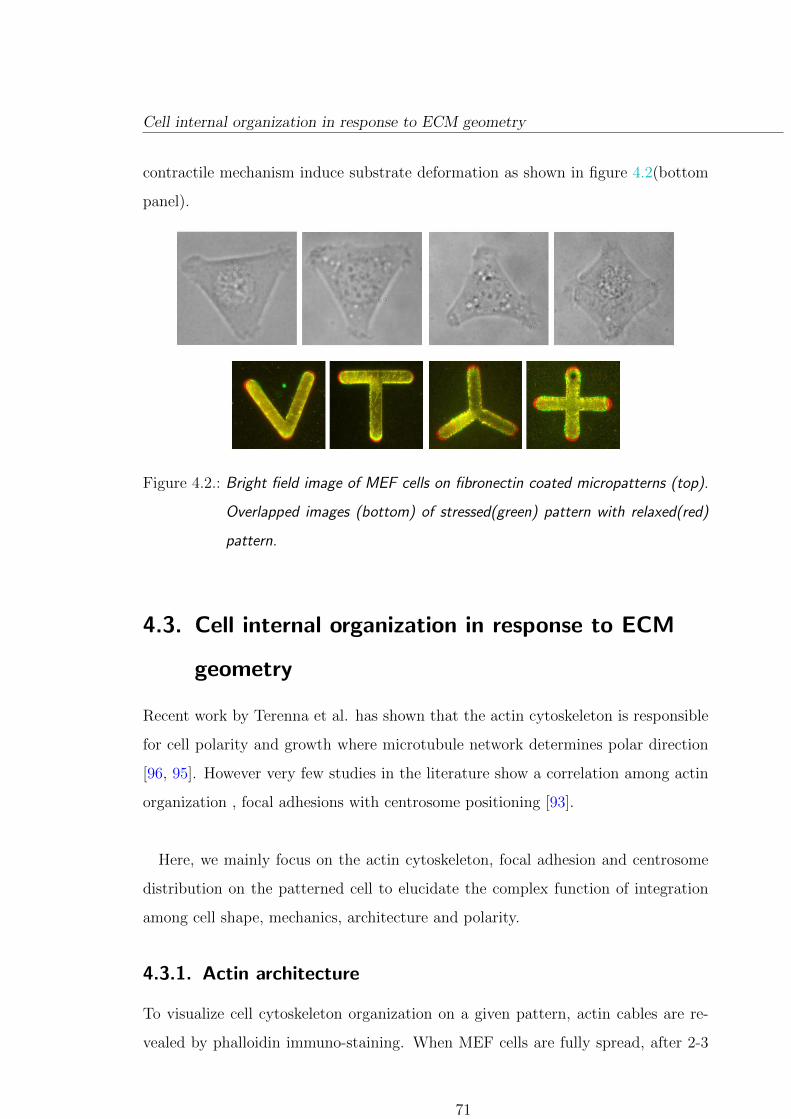
Cell internal organization in response to ECM geometry
contractile mechanism induce substrate deformation as shown in figure 4.2(bottom
panel).
Figure 4.2.: Bright field image of MEF cells on fibronectin coated micropatterns (top).
Overlapped images (bottom) of stressed(green) pattern with relaxed(red)
pattern.
4.3. Cell internal organization in response to ECM
geometry
Recent work by Terenna et al. has shown that the actin cytoskeleton is responsible
for cell polarity and growth where microtubule network determines polar direction
[96, 95]. However very few studies in the literature show a correlation among actin
organization , focal adhesions with centrosome positioning [93].
Here, we mainly focus on the actin cytoskeleton, focal adhesion and centrosome
distribution on the patterned cell to elucidate the complex function of integration
among cell shape, mechanics, architecture and polarity.
4.3.1. Actin architecture
To visualize cell cytoskeleton organization on a given pattern, actin cables are re-
vealed by phalloidin immuno-staining. When MEF cells are fully spread, after 2-3
71

Cell internal organization in response to ECM geometry
hrs of plating, cells are fixed and stained. Reproducible fiber bundles are enriched
upon both adhesive and nonadhesive area which connects the extreme edges of the
pattern. Figure 4.3 (upper panel) shows non intersecting actin fibers formed by a
single cell on V, T, Tripod and plus micropatterns. The space between the adhesive
bars are filled with sparse actin fibers.
Figure 4.3.: Actin fibers(green) organized inside single MEF cells plated on V, T , Tripod,
Plus shapes (top panel). Images acquired: 60X oil objective. “Fire color
map” of actin fiber cables averaged over several cells on the respective
shapes (bottom panel).
Actin stained images have been averaged over several cells on each micropattern(
V � 10; T� 15; Tripod� 20; Plus� 15). All images are normalized to the same
intensity scale.
Averaged actin images are shown in figure 4.3 (bottom Panel). Color code in “fire
map” shows a higher concentration of actin (purple� yellow) densely accumulated
along the periphery of the triangular envelope. Fiber network is concave over non
adhesive region and in contrast, fibers are mostly straight along the adhesive edge
of the pattern, which is in agreement with our previous findings (chapter 3).
These formation of actin bundles can stimulate the formation of focal adhesion
since actin fibers are strongly coupled with adhesion sites as we have seen in chapter
3. To establish strong correlation between actin and FA, it is important to reveal
FA distribution.
72
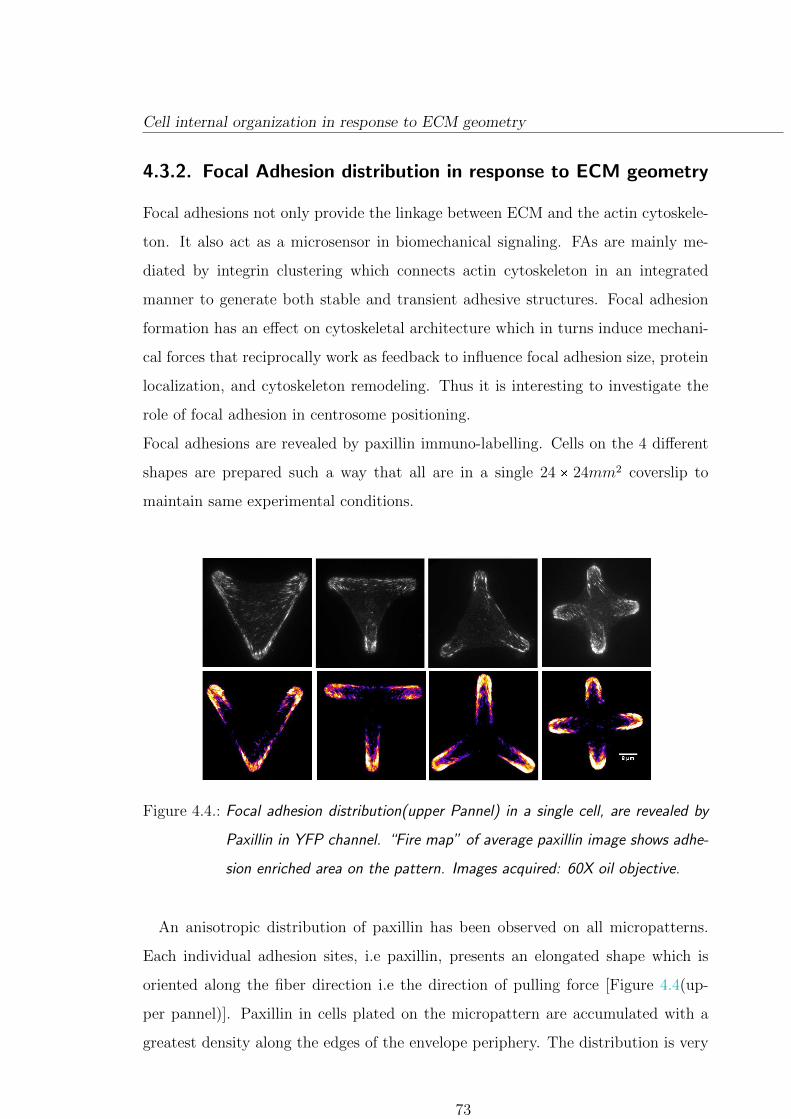
Cell internal organization in response to ECM geometry
4.3.2. Focal Adhesion distribution in response to ECM geometry
Focal adhesions not only provide the linkage between ECM and the actin cytoskele-
ton. It also act as a microsensor in biomechanical signaling. FAs are mainly me-
diated by integrin clustering which connects actin cytoskeleton in an integrated
manner to generate both stable and transient adhesive structures. Focal adhesion
formation has an effect on cytoskeletal architecture which in turns induce mechani-
cal forces that reciprocally work as feedback to influence focal adhesion size, protein
localization, and cytoskeleton remodeling. Thus it is interesting to investigate the
role of focal adhesion in centrosome positioning.
Focal adhesions are revealed by paxillin immuno-labelling. Cells on the 4 different
shapes are prepared such a way that all are in a single 24 � 24mm2 coverslip to
maintain same experimental conditions.
Figure 4.4.: Focal adhesion distribution(upper Pannel) in a single cell, are revealed by
Paxillin in YFP channel. “Fire map” of average paxillin image shows adhe-
sion enriched area on the pattern. Images acquired: 60X oil objective.
An anisotropic distribution of paxillin has been observed on all micropatterns.
Each individual adhesion sites, i.e paxillin, presents an elongated shape which is
oriented along the fiber direction i.e the direction of pulling force [Figure 4.4(up-
per pannel)]. Paxillin in cells plated on the micropattern are accumulated with a
greatest density along the edges of the envelope periphery. The distribution is very
73
Cell internal organization in response to ECM geometry
similar to those observed on glass substrates for identical shapes [40].
To better understand focal adhesion distribution, we averaged paxillin image over
several cells for all shapes ( V � 8; T� 14; Tripod� 13; Plus� 19 ). All images are
normalized in the same intensity scale. Average paxillin image as shown in figure4.4
(bottom panel) are preferentially localized at the extreme edges of adhesive pattern
in agreement with previous studies [40, 97, 98]. No adhesion has been observed
at the center of the micropattern. Paxillin distributions are strongly co-localized
with force as FA contacts developed with force [97]. Accumulation of FAs at the
extremities of the actin fiber cable provides link between FA and actin network. This
proves that cell shape changes the organization of actin cytoskeleton that in turn
governs focal adhesion formation. Next we focus on the centrosomes are distributed
on different shapes to correlate with adhesion and actin organization.
4.3.3. Centrosome distribution:
Centrosome is a subcellular organelle, which plays a key role in cell division, migra-
tion, polarization etc. It has been shown before that centrosome plays an important
role in defining cell polarity. To investigate the role of centrosome in cell centering
and cytoskeletal organization, we first plated cells on the individual micropatterned
substrates. To elucidate the precise position of the centrosome, γ-tubulin(yellow)
has been stained as shown in figure 4.5 (top panel) in yellow. The brightest spot in
γ-tubulin images shows centrosome position of a single MEF cell.
Several centrosomes are plotted on different micropattern in a single image window
as shown in figure 4.5. However, on V and T micropattern centrosome distribution
is off-centered with respect to the geometrical center by localizing the distribution
in the upper region of T shape and lower region of V-shape. Now the question arises
whether centrosome could be regulated by adhesion geometry. In order to find a
correlation we calculate the center of mass(COM) Ñrcom of average paxillin images
74

Cell internal organization in response to ECM geometry
Figure 4.5.: γ�tubulin stained in GFP(top): Bright spot in the middle is the centrosome.
Distribution of the centrosomes(blue) plotted on a pattern(red).60X oil
objective.( V = 23, T = 40; tripod = 12 ).
by,
Ñrcom �RS I�Ñr�ÑrdSRS I�Ñr�dS (4.1)
Where Ñrcom is the position of the center of mass; I(Ñr) is the fluorescence intensity
at the position Ñr ;
75

Traction force distribution on different shapes
Ñr is the position of the considered small area dS, S is the total surface area.
Figure 4.6.: Focal adhesion converges to center of mass of ECM marked in yellow.
We found that paxillin COM converges near the centrosome distribution center
(as shown in figure 4.6 for all 3 shapes.) showing a strong spatial correlation between
substrate adhesions and centrosome centering. This results may suggests an under-
lying mechanism which links centrosome positioning to the adhesion distribution
and actin architecture.
On the other hand, cell adhesion sites work as microsensors to feel the microen-
vironment such as ECM geometry, which affects the force distribution. In addition
physical basis of cell contractile forces are actin network. Therefore force distribu-
tion may complete correlation among actin network with paxillin and centrosome
distribution.
4.4. Traction force distribution on different shapes
We have used Traction Force Microscopy (FTTC) method as described in chapter
2 for cell traction force quantification on 5 kPa substrate. Single cell induced dis-
placement field of the substrate is shown for a single cell on each shape in figure
4.7 (upper Panel) (Typical displacement of an individual bead can reach values up
to 2 µm). Vector length in figure 4.7 (upper Panel) corresponds to the relative
magnitude of the displacement.
Typical force field of single cells on each pattern is shown in figure 4.7 (bottom
panel). To make force distribution more clearly visible, we computed stress contour
map. Figure 4.8 shows the single cell traction contour map. Color code in the cell
76
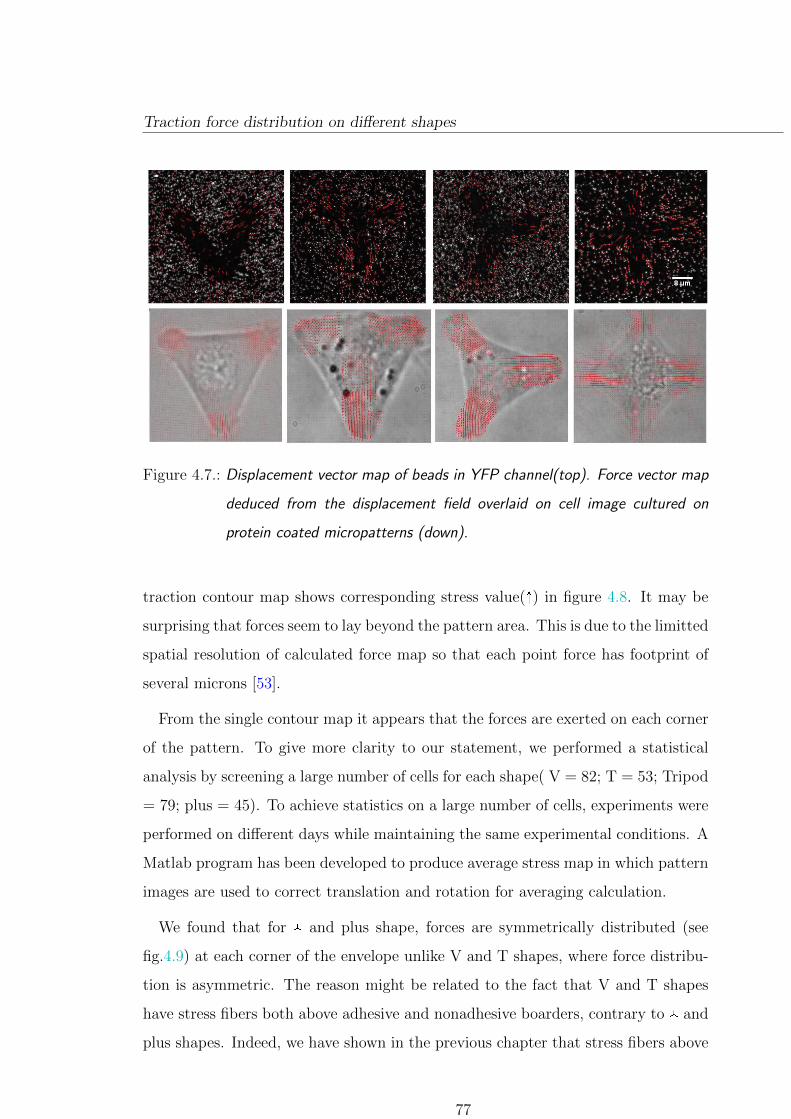
Traction force distribution on different shapes
Figure 4.7.: Displacement vector map of beads in YFP channel(top). Force vector map
deduced from the displacement field overlaid on cell image cultured on
protein coated micropatterns (down).
traction contour map shows corresponding stress value(�) in figure 4.8. It may be
surprising that forces seem to lay beyond the pattern area. This is due to the limitted
spatial resolution of calculated force map so that each point force has footprint of
several microns [53].
From the single contour map it appears that the forces are exerted on each corner
of the pattern. To give more clarity to our statement, we performed a statistical
analysis by screening a large number of cells for each shape( V = 82; T = 53; Tripod
= 79; plus = 45). To achieve statistics on a large number of cells, experiments were
performed on different days while maintaining the same experimental conditions. A
Matlab program has been developed to produce average stress map in which pattern
images are used to correct translation and rotation for averaging calculation.
We found that for ) and plus shape, forces are symmetrically distributed (see
fig.4.9) at each corner of the envelope unlike V and T shapes, where force distribu-
tion is asymmetric. The reason might be related to the fact that V and T shapes
have stress fibers both above adhesive and nonadhesive boarders, contrary to ) and
plus shapes. Indeed, we have shown in the previous chapter that stress fibers above
77

Traction force distribution on different shapes
Figure 4.8.: Stress contour map of single MEF cells cultured on fibronectin coated mi-
cropatterns for all 4 shapes (V, T,Tripod and plus respectively).
Figure 4.9.: Stress contour map obtained by averaging over several cells.
adhesive and nonadhesive boarder have different level of contractility and conse-
quently affect local stress distribution. To understand better the force distribution
asymmetry in response to ECM geometry, we then probed local force distribution
and its orientation.
78

Traction force distribution on different shapes
4.4.1. Local force distribution and orientation
In this sub-section we focus on the local force quantification ( magnitude and ori-
entation at each pattern corner). To simplify the problem we consider that forces
are essentially applied in the corners of V, T, ) and plus which is justified by the
average stress map ( see figure 4.9). We calculate average force over an area of 18µm
diameter circle at each corner of all shapes. We remark that the forces, located at
each pattern corner of of V and T shapes are off- centered with respect to ECM
geometrical center(GC). For V shape forces are directed towards the lower part of
the pattern whereas, in the case of T shape forces are pulled towards the upper
part. In contrary, for ) and plus where vectors are directed at the pattern center.
It is to be noted here that ) and plus are symmetric shapes. Moreover, in case of )
and plus shapes pattern center of mass(COM) and pattern geometrical center(GC)
coincides at center. Results obtained on symmetric and asymmetric shapes are dis-
cordant as clearly visible in case of V and T shapes than ) and plus shape in figure
4.10. Highlights of the results are in different color : red mark in the middle shows
the center of mass of each pattern, purple circle is the area over which forces are
averaged, green arrow shows the average force orientation directed towards a point
very close to the pattern COM.
From these observations, we may suggest that cell traction force convergence de-
pends on the underlying ECM geometry. We observe that force orientation on V and
T deviate from the geometrical center in the same direction as the centrosome posi-
tion or the adhesion distribution. Therefore it may suggest an underlying mechanism
relating to centrosome centering, focal adhesion distribution, actin organization and
force distribution. Although observations need to be confirmed by further studies,
our results indicate correlation between centrosome position and actin structures.
Moreover actin generated force distribution is correlated with centrosome position-
ing.
79
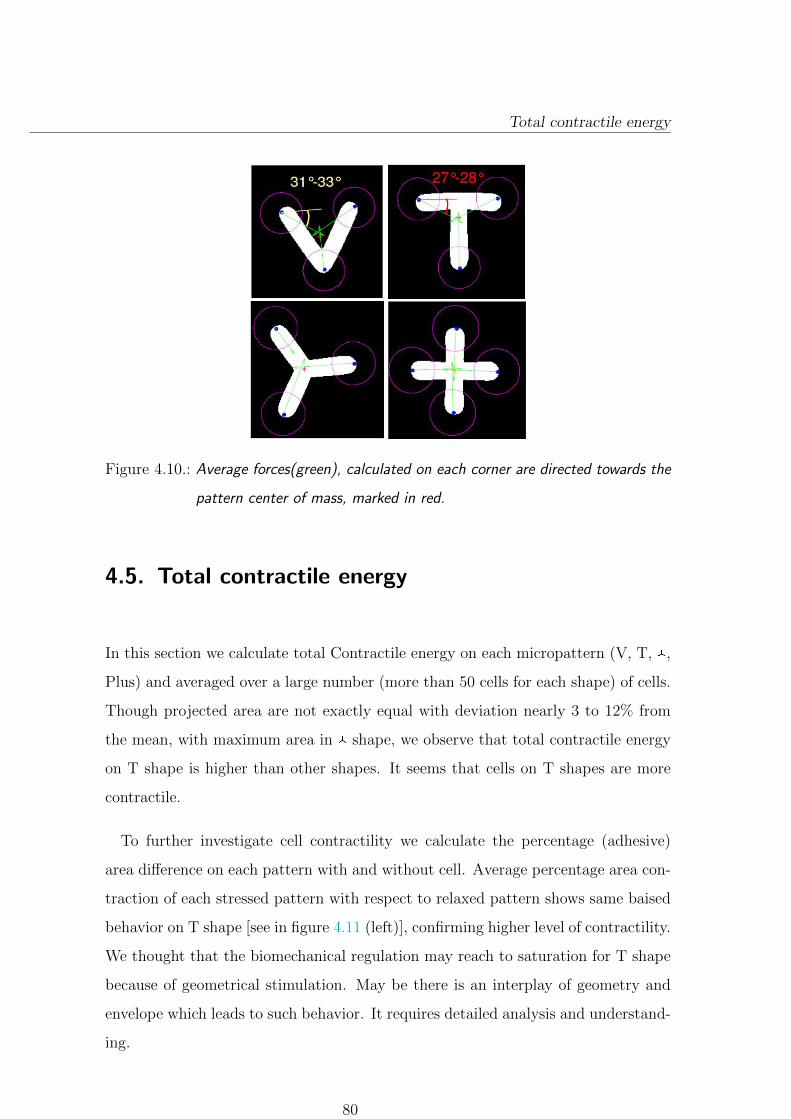
Total contractile energy
Figure 4.10.: Average forces(green), calculated on each corner are directed towards the
pattern center of mass, marked in red.
4.5. Total contractile energy
In this section we calculate total Contractile energy on each micropattern (V, T, ),
Plus) and averaged over a large number (more than 50 cells for each shape) of cells.
Though projected area are not exactly equal with deviation nearly 3 to 12% from
the mean, with maximum area in ) shape, we observe that total contractile energy
on T shape is higher than other shapes. It seems that cells on T shapes are more
contractile.
To further investigate cell contractility we calculate the percentage (adhesive)
area difference on each pattern with and without cell. Average percentage area con-
traction of each stressed pattern with respect to relaxed pattern shows same baised
behavior on T shape [see in figure 4.11 (left)], confirming higher level of contractility.
We thought that the biomechanical regulation may reach to saturation for T shape
because of geometrical stimulation. May be there is an interplay of geometry and
envelope which leads to such behavior. It requires detailed analysis and understand-
ing.
80

Conclusion and Discussion
Figure 4.11.: Average percentage area difference (left) for each pattern with and with-
out cell; and error bar is the standard deviation for each individual case.
Contractile energy averaged (right) over several MEF cells cultured on
protein coated micropatterns for all 3 shapes.
4.6. Conclusion and Discussion
In this chapter we see that centrosomes are distributed off-centered with respect to
geometrical center of the pattern for the V and T shapes in contrary to ) and plus
shapes. Hence, centrosome positioning are influenced by ECM geometry. We also
find that center of mass of the average paxillin distribution on each shape coincides
with the COM of ECM. We observe that the forces are located on the upper part
of the T shape and in the mower part of the tripod shape. We thus may say that
mechanism of centrosome positioning correlated to FA distribution. Moreover actin
generated forces are directed towards the centrosome distrubution center when we
calculate average forces on each corner of the pattern. We propose that this result
is an interplay among centrosome, actin cytoskeleton, actin generated forces and
focal adhesions. We also observe a biased behavior on T shape in total contractile
energy and percentage area measurements which seems to contradict the previous
observation on square envelope. We would suggest that there is an increase of basal
tension which may be due to an interplay of the geometry and ECM and envelope.
However, present results here are under careful analysis and investigation.
81


5. Thermoresponsive micropatterned
substrates for single cell studies
5.1. Introduction
Surface micropatterning is a powerful tool for the design of cell-based assays and
sensors, or for fundamental studies of cellular response to environmental cues
[102, 103, 104]. Such patterns have proven to be highly valuable for e.g. statisti-
cal analysis of the response of cells cultured in a well-controlled microenvironement
[23]. Micropatterning has attracted many polymer physicist over the last few years
to make the micro-structure design more suitable for cell biology research. There
are different polymers which are sensitive to specific wavelength of light or temper-
ature. These polymers can be used to enrich the biomedical device sensitivity and
functionnality.
This chapter contains a description of a new approach to design micropattern
for single cell studies. Here we describe the combination of surface chemistry and
microfabrication techniques which allows to create substrates onto which adhesion
can be tuned so as to obtain regular 2D arrays of immobilized cells. The work in
this chapter has been done in collaboration with Dr. Lionel Bureau. He has done
polymer brush synthesis and characterization. Next part which we have developed ,
is creating micropattern on the polymer brush and surface functionalization. Then
in collaboration we showed adhesion and thermo-detachment of cell on the pattern
.
83

Introduction
The microfabrication technique which we have developed, is based on the use
of poly(Nisopropylacrylamide) (PNIPAM) polymer brushes. The main interest of
working with PNIPAM is that the polymer is sensitive to temperature (PNIPAM
polymer chain in water becomes hydrophobic above the lower critical solution tem-
perature of the polymer, around 32XC). Many applications in bioengineering, espe-
cially in microfluidics have used PNIPAM temperature sensitivity to design switches
or valves to control fluid flows. Grafted PNIPAM polymer turns out to be a promis-
ing surface modifier in order to control cell adhesion.
Patterned brushes of passive water soluble polymers, can be elaborated by two
main routes:
1. uniform coating of the substrate grafted-onto brush by adsorption of a
block-copolymer containing a protein-repellent part (often poly(ethylene-
glycol)) stretching away from the underlying surface. Such a uniform brush
is subsequently patterned by selective UV irradiation to create adhesive
zones[105, 106].
2. polymer brushes grafted from the substrate, i.e. grown from a layer of poly-
merization initiators first grafted on the substrate. Patterning is achieved by
micro-contact printing of the initiator, which ensures a growth of polymer
chains restricted to the initiator-printed regions [107, 108].
These are two very important techniques to create adhesive pattern in the field of
single cell studies.
On the other hand, it has been shown by Okano et al [109] that poly ( Nisopropy-
lacrylamide) (PNIPAM) brushes could be use for the cell detachment. PNIPAM
polymer undergoes conformational change below Lower critical Solution Temper-
ature (LCST) and swells, when temperature goes down from 37X to below 32X.
The cell detachment has been shown when thickness of the brush are low enough
[110, 111]. But if the polymer grafting is very thick , then irrespective of the tem-
perature brushes becomes nonadhesive for the cell [112, 113].
84
Polymer brush synthesis on glass coverslip:
In the present work we have developed a method to fabricate thermoresponsive
micropatterned substrates which combines many of the advantages of the above-
mentioned techniques and allows for single cell studies. Unlike all other work [110,
111, 112, 113] the dimension of the pattern can be achieved down to 4µm. A key
point in designing micropatterned surfaces is to obtain a high contrast between
the regions onto which cells attach and the surrounding non-adhesive background.
The use of background polymer coatings, and in particular polymer brushes, have
become a favorite choice, for they exhibit excellent protein-repellency, hence efficient
cell non-adhesiveness.
Here is a short description of the new approach with advanced properties, that have
been developed by us.
5.2. Polymer brush synthesis on glass coverslip:
PNIPAM brushes are grafted from glass coverslips and oxidized silicon wafers by
surface-initiated Atom Transfer Radical Polymerization (ATRP). All aqueous solu-
tions were prepared in ultra-pure water. To create PNIPAM polymer brush, several
steps are involved. The following diagram 5.1 explains the main required steps :
1. Glass or silicon substrates are cleaned in a sodium hydroxide aqueous solution
and rinsed with water.
2. Samples are immersed in an aqueous solution of 3- aminopropyl- triethoxysi-
lane (APTES) of proper concentration cAPTES.
3. After rinsing with water it is dried in a nitrogen stream.
4. Samples are immersed in solution mix of dichloromethane, containing triethy-
lamine (TEA) and 2-bromo-2 -methylpropionyl bromide (BMPB).
5. Samples are rinsed with dichloromethane, ethanol and water.
6. A solution of N -isopropylacrylamide (NIPAM), 1,1,7,7 -
Pentamethyldiethylenetriamine (PMDETA) and water is prepared.
85

PNIPAM brush characterization
7. Initiator-grafted samples are immersed in this solution for required amount of
time during which polymerization occurred.
8. And finally the samples are rinsed with pure water.
The figure 5.1 below shows the preparation steps of grafting polymer brush on
glass coverslip
Figure 5.1.: Schematic diagram of PNIPAM polymer synthesis on glass coverslip.
[step (2) grafting of an ATRP initiator on a glass surface ; Step (3)is NIPAM
polymerization , step (4) polymer brush has grown are exposed to UV irradiation; Step
(5) Prepared micro-structure ]
5.3. PNIPAM brush characterization
Physical properties of brushes are characterized by ellipsometry
5.3.1. Brush thickness
PNIPAM brushes grown on silicon wafers are characterized by measuring their dry
thickness, hdry by ellipsometry. The dry thickness of a brush is given by
hdry � Na3~d2 (5.1)
86
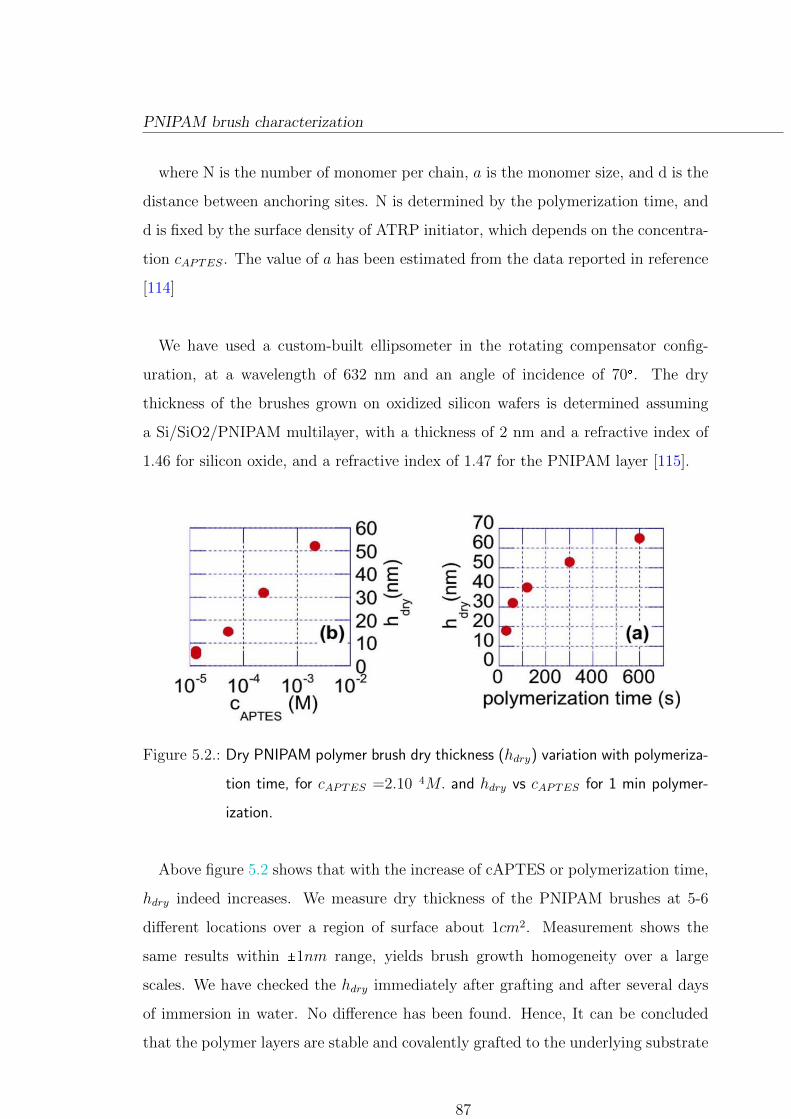
PNIPAM brush characterization
where N is the number of monomer per chain, a is the monomer size, and d is the
distance between anchoring sites. N is determined by the polymerization time, and
d is fixed by the surface density of ATRP initiator, which depends on the concentra-
tion cAPTES. The value of a has been estimated from the data reported in reference
[114]
We have used a custom-built ellipsometer in the rotating compensator config-
uration, at a wavelength of 632 nm and an angle of incidence of 70X. The dry
thickness of the brushes grown on oxidized silicon wafers is determined assuming
a Si/SiO2/PNIPAM multilayer, with a thickness of 2 nm and a refractive index of
1.46 for silicon oxide, and a refractive index of 1.47 for the PNIPAM layer [115].
Figure 5.2.: Dry PNIPAM polymer brush dry thickness (hdry) variation with polymeriza-
tion time, for cAPTES =2.10�4M. and hdry vs cAPTES for 1 min polymer-
ization.
Above figure 5.2 shows that with the increase of cAPTES or polymerization time,
hdry indeed increases. We measure dry thickness of the PNIPAM brushes at 5-6
different locations over a region of surface about 1cm2. Measurement shows the
same results within �1nm range, yields brush growth homogeneity over a large
scales. We have checked the hdry immediately after grafting and after several days
of immersion in water. No difference has been found. Hence, It can be concluded
that the polymer layers are stable and covalently grafted to the underlying substrate
87

PNIPAM brush characterization
[116].
5.3.2. Effect of UV irradiation on polymer brushes
When dry PNIPAM brushes are exposed to deep UV light in air, it results in the
ablation of the polymer from the surface. Ablation has been characterized under
such conditions, by monitoring grafted brush thickness hdry as a function of UV
irradiation time �tUV � on grafted silicon wafers which has the same surface property
as glass. Figure 5.3 plot shows that starting from an initial brush thicknesses of a
few tens of nm, a complete removal of the polymer is achieved for tUV C 300s.
Figure 5.3.: Polymer brush thickness hdry is controlled by UV irradiation time : Data
are shown here for brushes of initial thickness 82 nm (blue),65 nm (green),
and 54 nm (red). Complete removal of brush appears at t=300sec.
It shows that lower wavelength (below 200nm) is required for PNIPAM ablation.
An exposure of a 75W UV lamp (l=365nm) at 2 cm for 15 mins results no dry
thickness decrease of the grafted layers. It shows that 365nm UV exposure can used
to sterilize the PNIPAM surface if required.
88

PNIPAM brush characterization
5.3.3. Patterning on synthesized polymer
To create required micropattern design on the grafted polymer glass surface, a deep
UV irradiation technique has been used.
1. Dry PNIPAM-bearing coverslips were placed in direct contact with a chromium
quartz photomask (Toppan Photomasks inc.,Texas USA)
2. UV irradiation of the surfaces through the photomask was achieved in a
custom-built device housing a set of 4 low-pressure mercury lamps (Heraeus
Noblelight GmbH, NIQ 60/35 XL long life lamp,λ � 185 and 254 nm, quartz
tube, 60 W).
3. Samples were placed at a fixed distance of 9 cm from the UV tubes and
irradiated for a duration between 5 and 10 minutes.
Patterns elaborated on PNIPAM-bearing coverslips using tUV C 300s can be ob-
served by phase contrast microscopy. Fig.5.4 provides an illustration of different
pattern shapes that can be observed.
Figure 5.4.: Phase contrast image of annular, triangular, rectangular and hexagonal pat-
terns obtained by UV photoablation of PNIPAM. The light grey regions have
been irradiated by deep UV, where the polymer have been removed. Image
size is 700x500 µm2.
Contrast on such image arises from both the height and the refractive index dif-
ference between the PNIPAM background layer and the bare glass which has been
89
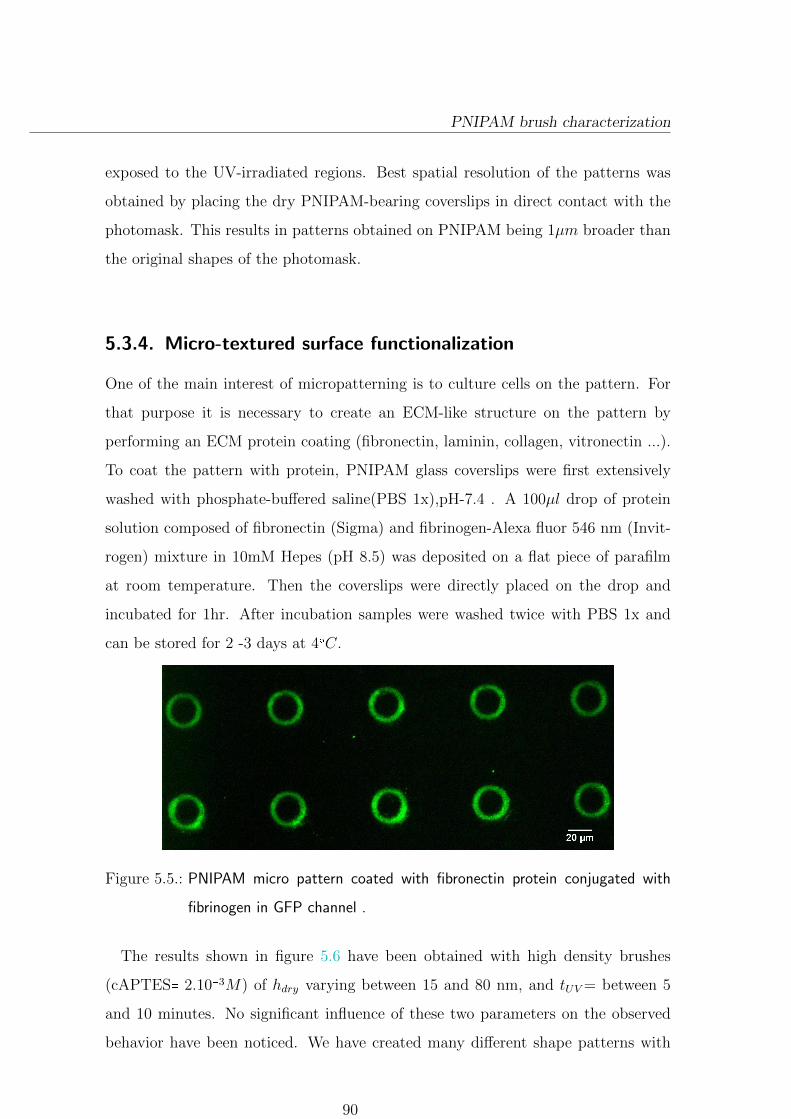
PNIPAM brush characterization
exposed to the UV-irradiated regions. Best spatial resolution of the patterns was
obtained by placing the dry PNIPAM-bearing coverslips in direct contact with the
photomask. This results in patterns obtained on PNIPAM being 1µm broader than
the original shapes of the photomask.
5.3.4. Micro-textured surface functionalization
One of the main interest of micropatterning is to culture cells on the pattern. For
that purpose it is necessary to create an ECM-like structure on the pattern by
performing an ECM protein coating (fibronectin, laminin, collagen, vitronectin ...).
To coat the pattern with protein, PNIPAM glass coverslips were first extensively
washed with phosphate-buffered saline(PBS 1x),pH-7.4 . A 100µl drop of protein
solution composed of fibronectin (Sigma) and fibrinogen-Alexa fluor 546 nm (Invit-
rogen) mixture in 10mM Hepes (pH 8.5) was deposited on a flat piece of parafilm
at room temperature. Then the coverslips were directly placed on the drop and
incubated for 1hr. After incubation samples were washed twice with PBS 1x and
can be stored for 2 -3 days at 4XC.
Figure 5.5.: PNIPAM micro pattern coated with fibronectin protein conjugated with
fibrinogen in GFP channel .
The results shown in figure 5.6 have been obtained with high density brushes
(cAPTES� 2.10�3M) of hdry varying between 15 and 80 nm, and tUV = between 5
and 10 minutes. No significant influence of these two parameters on the observed
behavior have been noticed. We have created many different shape patterns with
90
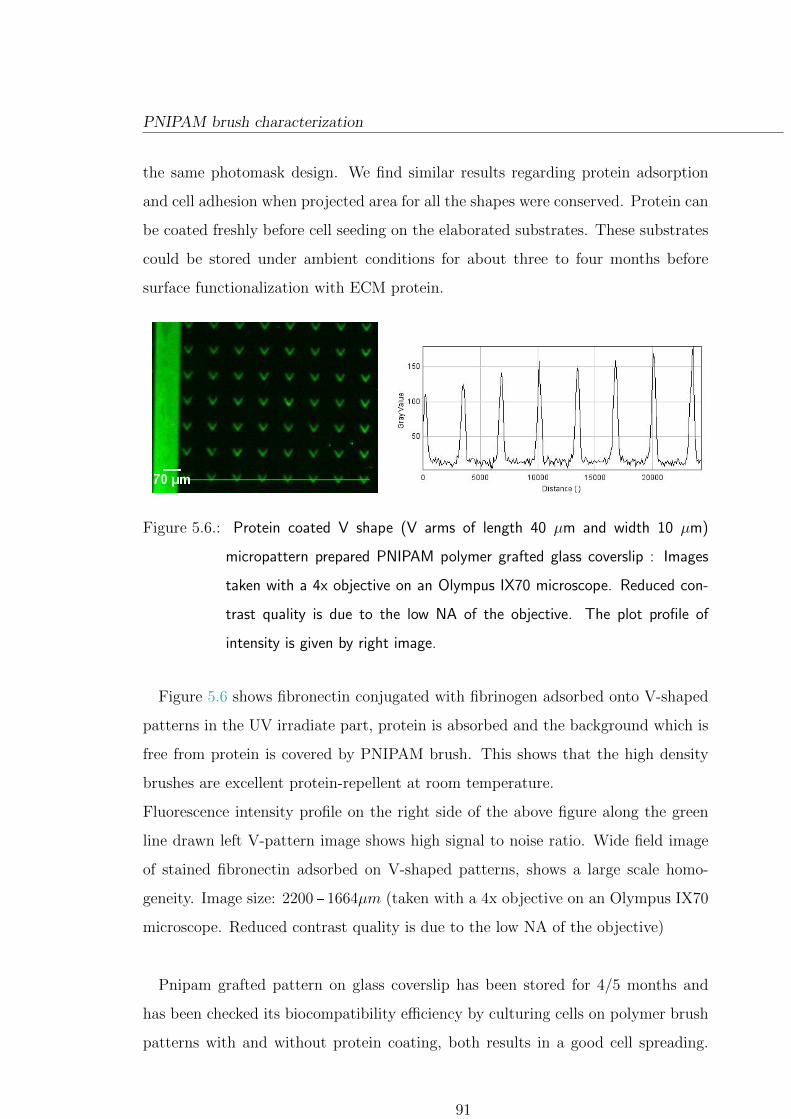
PNIPAM brush characterization
the same photomask design. We find similar results regarding protein adsorption
and cell adhesion when projected area for all the shapes were conserved. Protein can
be coated freshly before cell seeding on the elaborated substrates. These substrates
could be stored under ambient conditions for about three to four months before
surface functionalization with ECM protein.
Figure 5.6.: Protein coated V shape (V arms of length 40 µm and width 10 µm)
micropattern prepared PNIPAM polymer grafted glass coverslip : Images
taken with a 4x objective on an Olympus IX70 microscope. Reduced con-
trast quality is due to the low NA of the objective. The plot profile of
intensity is given by right image.
Figure 5.6 shows fibronectin conjugated with fibrinogen adsorbed onto V-shaped
patterns in the UV irradiate part, protein is absorbed and the background which is
free from protein is covered by PNIPAM brush. This shows that the high density
brushes are excellent protein-repellent at room temperature.
Fluorescence intensity profile on the right side of the above figure along the green
line drawn left V-pattern image shows high signal to noise ratio. Wide field image
of stained fibronectin adsorbed on V-shaped patterns, shows a large scale homo-
geneity. Image size: 2200�1664µm (taken with a 4x objective on an Olympus IX70
microscope. Reduced contrast quality is due to the low NA of the objective)
Pnipam grafted pattern on glass coverslip has been stored for 4/5 months and
has been checked its biocompatibility efficiency by culturing cells on polymer brush
patterns with and without protein coating, both results in a good cell spreading.
91
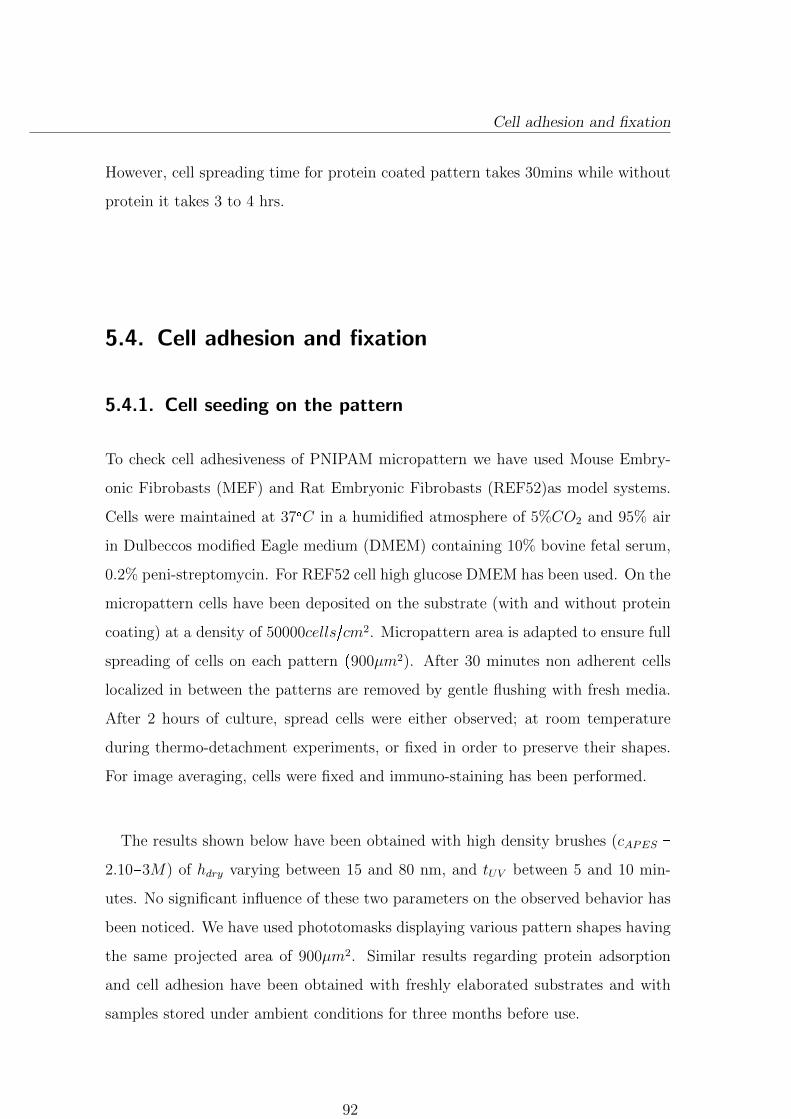
Cell adhesion and fixation
However, cell spreading time for protein coated pattern takes 30mins while without
protein it takes 3 to 4 hrs.
5.4. Cell adhesion and fixation
5.4.1. Cell seeding on the pattern
To check cell adhesiveness of PNIPAM micropattern we have used Mouse Embry-
onic Fibrobasts (MEF) and Rat Embryonic Fibrobasts (REF52)as model systems.
Cells were maintained at 37XC in a humidified atmosphere of 5%CO2 and 95% air
in Dulbeccos modified Eagle medium (DMEM) containing 10% bovine fetal serum,
0.2% peni-streptomycin. For REF52 cell high glucose DMEM has been used. On the
micropattern cells have been deposited on the substrate (with and without protein
coating) at a density of 50000cells~cm2. Micropattern area is adapted to ensure full
spreading of cells on each pattern �900µm2). After 30 minutes non adherent cells
localized in between the patterns are removed by gentle flushing with fresh media.
After 2 hours of culture, spread cells were either observed; at room temperature
during thermo-detachment experiments, or fixed in order to preserve their shapes.
For image averaging, cells were fixed and immuno-staining has been performed.
The results shown below have been obtained with high density brushes (cAPES �
2.10�3M) of hdry varying between 15 and 80 nm, and tUV between 5 and 10 min-
utes. No significant influence of these two parameters on the observed behavior has
been noticed. We have used phototomasks displaying various pattern shapes having
the same projected area of 900µm2. Similar results regarding protein adsorption
and cell adhesion have been obtained with freshly elaborated substrates and with
samples stored under ambient conditions for three months before use.
92
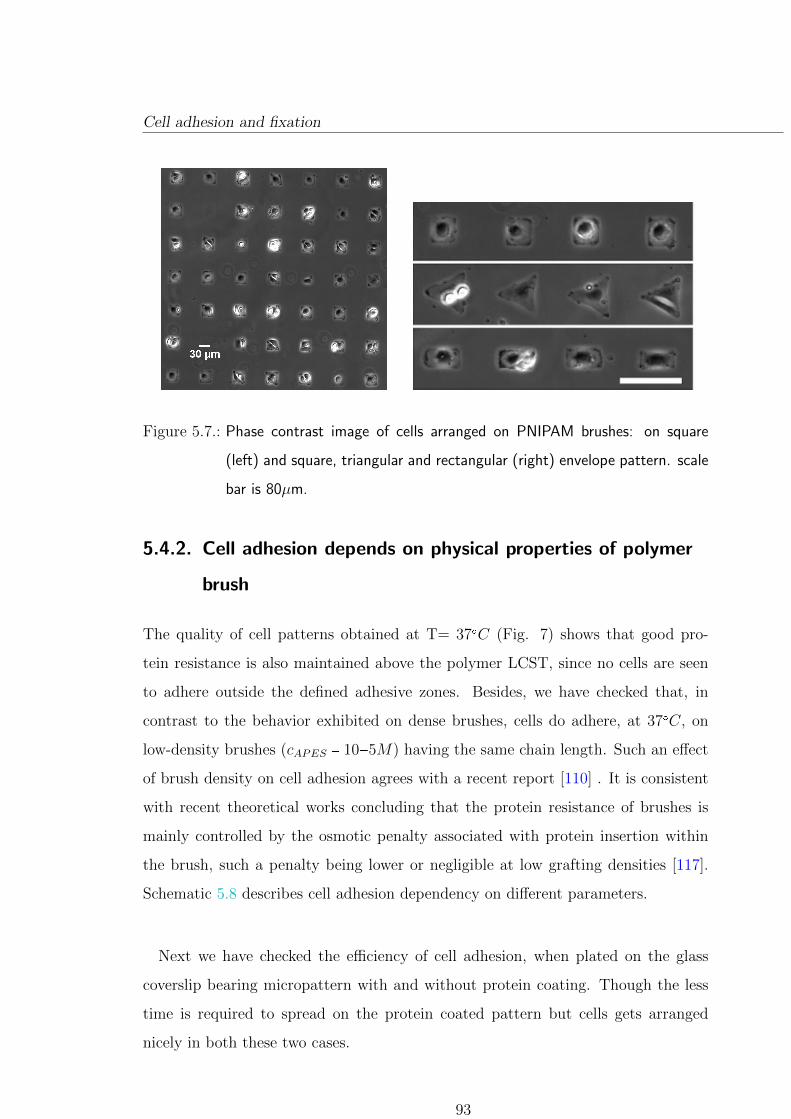
Cell adhesion and fixation
Figure 5.7.: Phase contrast image of cells arranged on PNIPAM brushes: on square
(left) and square, triangular and rectangular (right) envelope pattern. scale
bar is 80µm.
5.4.2. Cell adhesion depends on physical properties of polymer
brush
The quality of cell patterns obtained at T= 37XC (Fig. 7) shows that good pro-
tein resistance is also maintained above the polymer LCST, since no cells are seen
to adhere outside the defined adhesive zones. Besides, we have checked that, in
contrast to the behavior exhibited on dense brushes, cells do adhere, at 37XC, on
low-density brushes (cAPES � 10�5M) having the same chain length. Such an effect
of brush density on cell adhesion agrees with a recent report [110] . It is consistent
with recent theoretical works concluding that the protein resistance of brushes is
mainly controlled by the osmotic penalty associated with protein insertion within
the brush, such a penalty being lower or negligible at low grafting densities [117].
Schematic 5.8 describes cell adhesion dependency on different parameters.
Next we have checked the efficiency of cell adhesion, when plated on the glass
coverslip bearing micropattern with and without protein coating. Though the less
time is required to spread on the protein coated pattern but cells gets arranged
nicely in both these two cases.
93
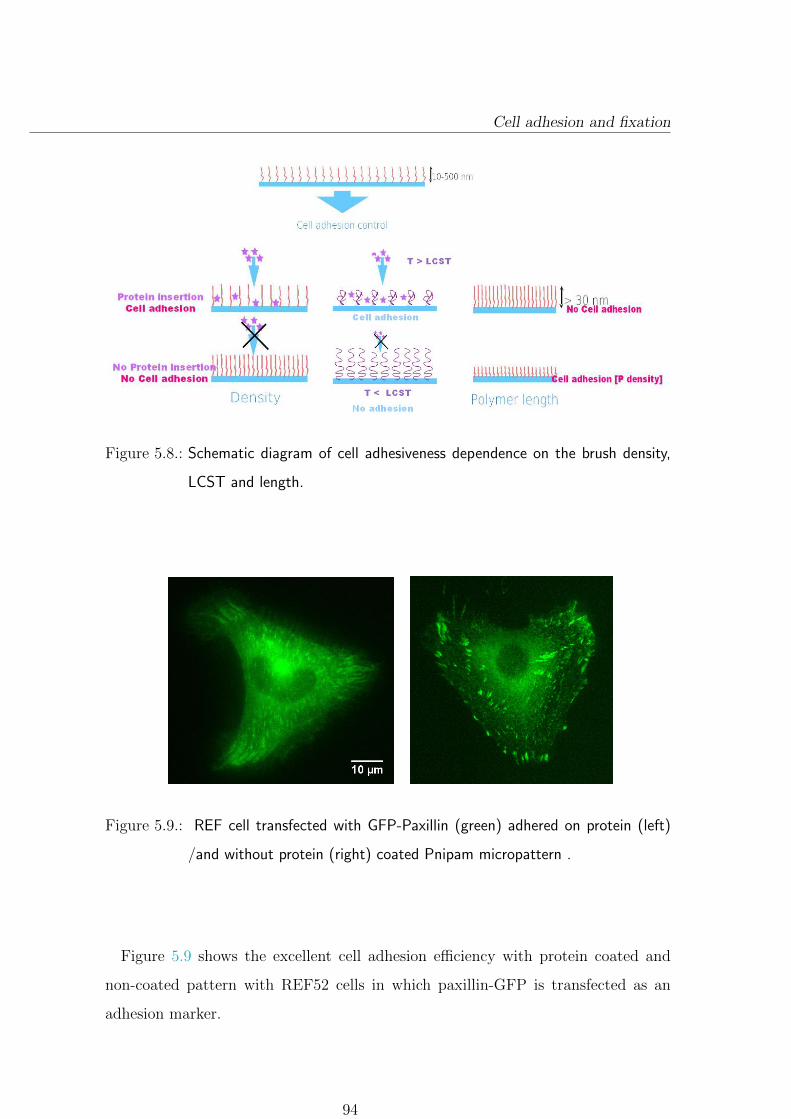
Cell adhesion and fixation
Figure 5.8.: Schematic diagram of cell adhesiveness dependence on the brush density,
LCST and length.
Figure 5.9.: REF cell transfected with GFP-Paxillin (green) adhered on protein (left)
/and without protein (right) coated Pnipam micropattern .
Figure 5.9 shows the excellent cell adhesion efficiency with protein coated and
non-coated pattern with REF52 cells in which paxillin-GFP is transfected as an
adhesion marker.
94
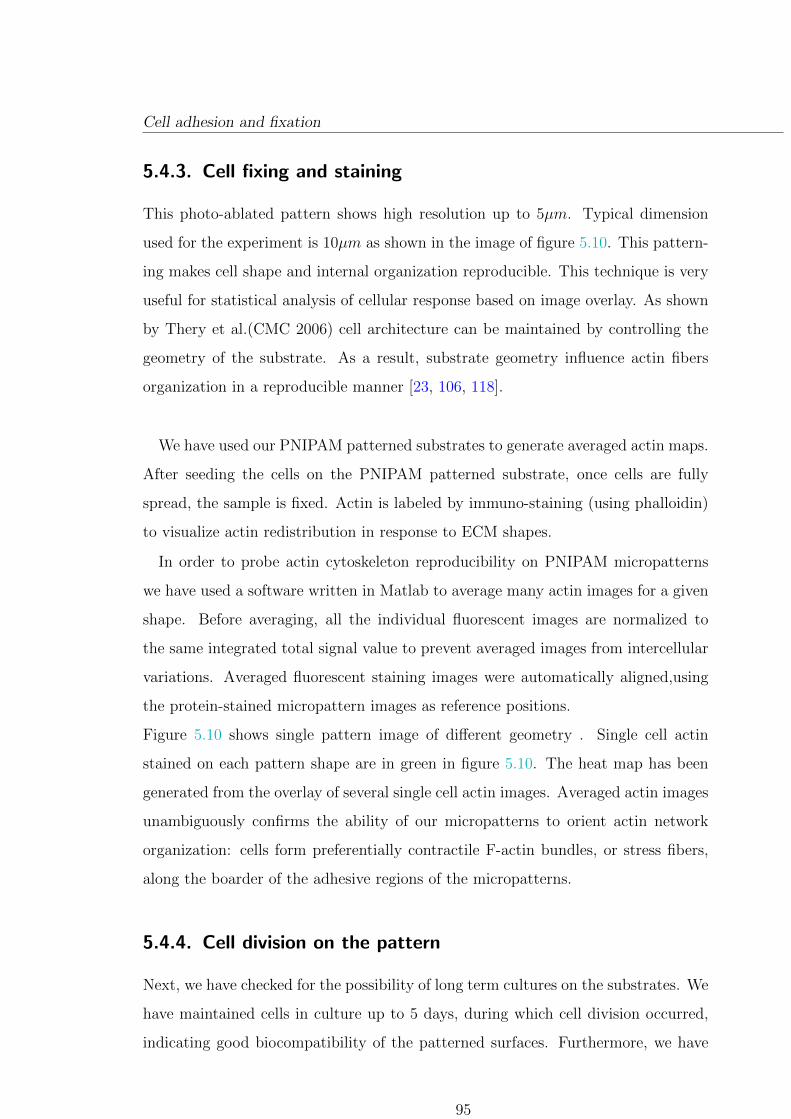
Cell adhesion and fixation
5.4.3. Cell fixing and staining
This photo-ablated pattern shows high resolution up to 5µm. Typical dimension
used for the experiment is 10µm as shown in the image of figure 5.10. This pattern-
ing makes cell shape and internal organization reproducible. This technique is very
useful for statistical analysis of cellular response based on image overlay. As shown
by Thery et al.(CMC 2006) cell architecture can be maintained by controlling the
geometry of the substrate. As a result, substrate geometry influence actin fibers
organization in a reproducible manner [23, 106, 118].
We have used our PNIPAM patterned substrates to generate averaged actin maps.
After seeding the cells on the PNIPAM patterned substrate, once cells are fully
spread, the sample is fixed. Actin is labeled by immuno-staining (using phalloidin)
to visualize actin redistribution in response to ECM shapes.
In order to probe actin cytoskeleton reproducibility on PNIPAM micropatterns
we have used a software written in Matlab to average many actin images for a given
shape. Before averaging, all the individual fluorescent images are normalized to
the same integrated total signal value to prevent averaged images from intercellular
variations. Averaged fluorescent staining images were automatically aligned,using
the protein-stained micropattern images as reference positions.
Figure 5.10 shows single pattern image of different geometry . Single cell actin
stained on each pattern shape are in green in figure 5.10. The heat map has been
generated from the overlay of several single cell actin images. Averaged actin images
unambiguously confirms the ability of our micropatterns to orient actin network
organization: cells form preferentially contractile F-actin bundles, or stress fibers,
along the boarder of the adhesive regions of the micropatterns.
5.4.4. Cell division on the pattern
Next, we have checked for the possibility of long term cultures on the substrates. We
have maintained cells in culture up to 5 days, during which cell division occurred,
indicating good biocompatibility of the patterned surfaces. Furthermore, we have
95
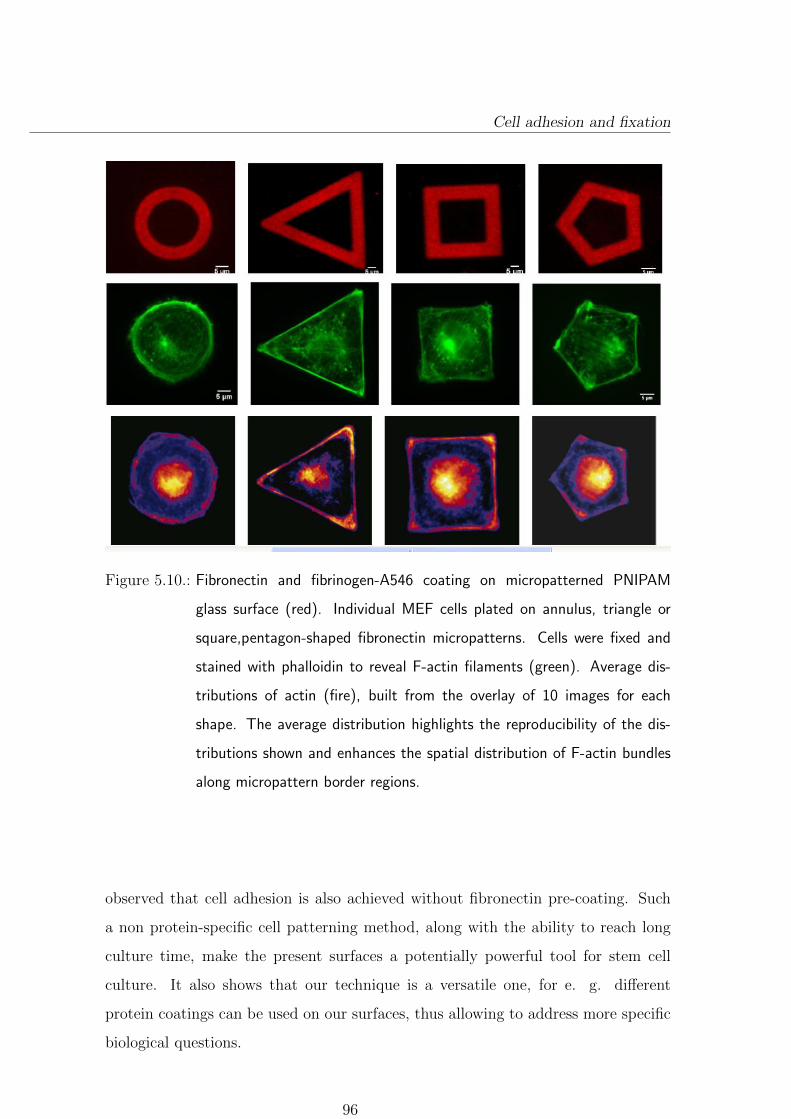
Cell adhesion and fixation
Figure 5.10.: Fibronectin and fibrinogen-A546 coating on micropatterned PNIPAM
glass surface (red). Individual MEF cells plated on annulus, triangle or
square,pentagon-shaped fibronectin micropatterns. Cells were fixed and
stained with phalloidin to reveal F-actin filaments (green). Average dis-
tributions of actin (fire), built from the overlay of 10 images for each
shape. The average distribution highlights the reproducibility of the dis-
tributions shown and enhances the spatial distribution of F-actin bundles
along micropattern border regions.
observed that cell adhesion is also achieved without fibronectin pre-coating. Such
a non protein-specific cell patterning method, along with the ability to reach long
culture time, make the present surfaces a potentially powerful tool for stem cell
culture. It also shows that our technique is a versatile one, for e. g. different
protein coatings can be used on our surfaces, thus allowing to address more specific
biological questions.
96

Cell adhesion and fixation
Figure 5.11.: Cell division on V shape pattern after 5 days: green paxillin; blue nucleus.
5.4.5. Temperature dependent properties of PNIPAM and cell
detachment
PNIPAM polymer has the property to response to temperature stimulation. Al-
though dense PNIPAM brushes are protein repellent irrespective of the tempera-
ture, their thermo sensitive property can still be used for local cell manipulation.
We showed that by exploiting thermoresponsiveness and micropattern geometry cells
can be detached from the substrate very easily without using any chemical reagents.
Figure 5.12.: Schematic diagram of cell detachment from PNIPAM polymer, induced by
temperature.
Most importantly the way cells are detached are different from what has been de-
scribed previously [109, 110, 111, 112, 113]. This cell detachment mechanism does
not involve a temperature-induced change in the cell/PNIPAM affinity, but rather
takes advantage of polymer swelling to generate forces. Cells thus detached from
97
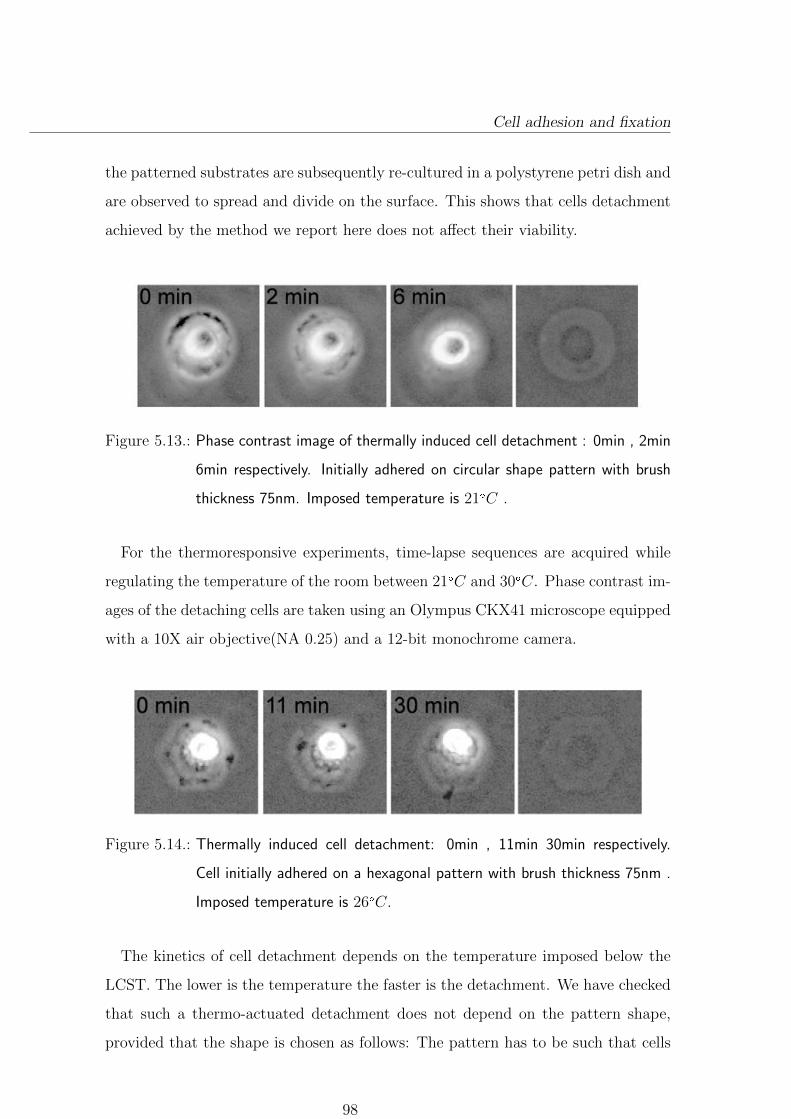
Cell adhesion and fixation
the patterned substrates are subsequently re-cultured in a polystyrene petri dish and
are observed to spread and divide on the surface. This shows that cells detachment
achieved by the method we report here does not affect their viability.
Figure 5.13.: Phase contrast image of thermally induced cell detachment : 0min , 2min
6min respectively. Initially adhered on circular shape pattern with brush
thickness 75nm. Imposed temperature is 21XC .
For the thermoresponsive experiments, time-lapse sequences are acquired while
regulating the temperature of the room between 21XC and 30XC. Phase contrast im-
ages of the detaching cells are taken using an Olympus CKX41 microscope equipped
with a 10X air objective(NA 0.25) and a 12-bit monochrome camera.
Figure 5.14.: Thermally induced cell detachment: 0min , 11min 30min respectively.
Cell initially adhered on a hexagonal pattern with brush thickness 75nm .
Imposed temperature is 26XC.
The kinetics of cell detachment depends on the temperature imposed below the
LCST. The lower is the temperature the faster is the detachment. We have checked
that such a thermo-actuated detachment does not depend on the pattern shape,
provided that the shape is chosen as follows: The pattern has to be such that cells
98
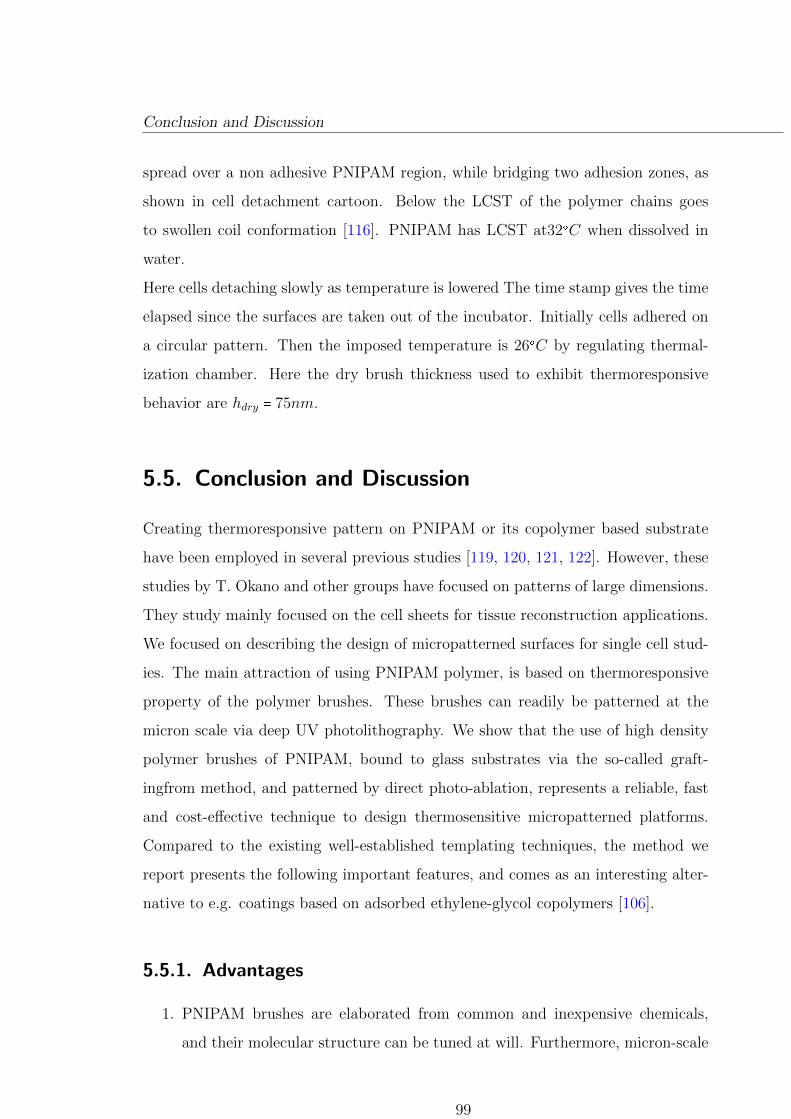
Conclusion and Discussion
spread over a non adhesive PNIPAM region, while bridging two adhesion zones, as
shown in cell detachment cartoon. Below the LCST of the polymer chains goes
to swollen coil conformation [116]. PNIPAM has LCST at32XC when dissolved in
water.
Here cells detaching slowly as temperature is lowered The time stamp gives the time
elapsed since the surfaces are taken out of the incubator. Initially cells adhered on
a circular pattern. Then the imposed temperature is 26XC by regulating thermal-
ization chamber. Here the dry brush thickness used to exhibit thermoresponsive
behavior are hdry � 75nm.
5.5. Conclusion and Discussion
Creating thermoresponsive pattern on PNIPAM or its copolymer based substrate
have been employed in several previous studies [119, 120, 121, 122]. However, these
studies by T. Okano and other groups have focused on patterns of large dimensions.
They study mainly focused on the cell sheets for tissue reconstruction applications.
We focused on describing the design of micropatterned surfaces for single cell stud-
ies. The main attraction of using PNIPAM polymer, is based on thermoresponsive
property of the polymer brushes. These brushes can readily be patterned at the
micron scale via deep UV photolithography. We show that the use of high density
polymer brushes of PNIPAM, bound to glass substrates via the so-called graft-
ingfrom method, and patterned by direct photo-ablation, represents a reliable, fast
and cost-effective technique to design thermosensitive micropatterned platforms.
Compared to the existing well-established templating techniques, the method we
report presents the following important features, and comes as an interesting alter-
native to e.g. coatings based on adsorbed ethylene-glycol copolymers [106].
5.5.1. Advantages
1. PNIPAM brushes are elaborated from common and inexpensive chemicals,
and their molecular structure can be tuned at will. Furthermore, micron-scale
99

Conclusion and Discussion
patterning is achieved in one single step, without requiring access to clean
room facilities.
2. Robust and stable anti-adhesive brushes are covalently grafted at high density
on common glass coverslips by surface-initiated ATRP.
3. Polymer chains being covalently bound to the substrate, such coatings show
excellent usage and storage long-term stability.
4. High grafting density brushes display superior protein and cell repellency, ob-
tained in an extremely reliable and reproducible way.
5. Photolithography yields sharp patterns, in contrast to microcontact-printing
techniques which may be limited in resolution by surface diffusion of the
printed species
6. This method is easy to implement and requires only basic laboratory equip-
ment.
7. Although such high density brushes are cell-repellent at 37XC, PNIPAM chains
still shift from a collapsed to a swollen state as the temperature is decreased be-
low the polymer LCST (Lower Critical Solution Temperature) of 32XC. This
temperature-controlled conformation change of PNIPAM, combined with a
proper choice of the pattern shapes, make the polymer coating act as a ther-
moactuator which allows us to detach the studied cells by lowering the surface
temperature. This adds a very attractive feature to the usual passive mi-
cropatterned platforms.
Patterned substrates can thus be produced within 2-3 hours only, in a highly
reproducible way. Moreover, we have shown that a proper choice of the pattern
shapes allows us to combine the cell non-adhesiveness of dense PNIPAM brushes
with their thermoresponsiveness, which permits gentle cell detachment. These fea-
tures make such PNIPAM based substrates a choice tool for single cell patterning
and thermally-induced on-chip cell manipulation.
100

Conclusion and Discussion
The empirical designing of the thermoresponsive micropattern is very useful for
single cell studies. However further elucidation is required to optimize the design. It
needs to elicit how the ability of swelling or collapsing of the polymer brushes depend
on grafting density, how the detachment kinetics depends on the brush thickness.
101

6. Summary and Outlook:
Major part of this thesis is dedicated to investigate the extracellular matrix influ-
ence on intracellular organization and its associated cytoskeletal tension distribution
using polyacrylamide micropatterning and traction force microscopy. The novelty
of this work lies on correlating cell traction forces with cell internal architecture
in a reproducible manner. Using single cell micropatterning on soft substrates, we
have explored the role of the physical properties of the extracellular matrix such as
geometry and stiffness on cell force distribution while keeping cell projected area
constant. We thus were able to correlate different cell architectures such as actin
cytoskeleton organization, focal adhesions and centrosome localization in response
to various geometrical stimulations. This thesis also includes the development of a
new micropatterning technique based on the utilization of thermoresponsive poly-
mer brushes providing new insights in single cell manipulation.
When cells have been plated on soft micropatterns of different geometry, actin
fibers were accumulated along both adhesive and non-adhesive boarder of the pat-
tern envelope contrary to previous experiments performed on glass. For a set of
three different shapes of a fixed envelope (square), we have statistically quantified
cell contractile energy and their associated cytoskeletal architectures. Interestingly,
we have shown for the first time that total forces and contractile energies are in-
dependent of the ECM geometry when averaged over a large number cells (more
than 50 cells per shape) indicating a strong regulatory mechanism of mechanical
balance within cell. Moreover, we have also been able to explore this regulatory
mechanism by describing local force redistribution and their associated adhesive
structures distribution in response to the underlying ECM geometry.
103

CHAPTER 6. SUMMARY AND OUTLOOK:
In a second part, we tried to compare cell traction forces obtained via two major
techniques used in the field of cell mechanics: TFM and micropost arrays. Cellu-
lar traction forces have been compared on 2D micropatterned substrates with 3D
micro-pillar arrays, having same arrangements of ECM geometry, on three different
stiffnesses 7, 20 and 40 kPa respectively. In both these two methods, it has been
observed that traction forces increase linearly with increasing substrate stiffness.
In addition we also observed a linear correlation between force and focal adhesion
growth. However, higher magnitudes of force developed on micropillars may be due
to the discontinuity in long-range deformation propagation that in turns affect cell
basal tension regulation.
Subsequently, we have studied centrosome positioning and its relation with actin
generated forces using micro-patterned traction cytometry. Very surprisingly, we
observed that for V and T shapes, centrosome were off centered with respect to
the cell geometrical center were usually observed. In addition, we also have shown
that paxillin distribution converges to the center of mass of the ECM geometry in
correlation with centrosome distribution. Thus we may suggest that centrosome po-
sitioning highly depend upon adhesion spatial distribution which is as far as we know
the first evidence of this correlation. Finally, we found that local traction forces (at
each pattern corners) are directed towards the centrosome localization. This cor-
relation in between actin generated forces, adhesion distributions and centrosome
positioning suggests a potential role of actin in centrosome centering. We also have
studied contractile energy in which it seems that T shape has a bias behavior. How-
ever, obtained results require better understanding and further investigations.
Finally, we proposed a new approach to create micropattern using thermorespon-
sive PNIPAM polymer brushes grafted on glass substrates. In previous studies,
PNIPAM thermoresponsive property has been used for cell sheet engineering. In
this thesis we have shown that PNIPAM micropatterns can be created by deep UV
irradiation, by removing polymer from the surface, and thus designed for single cell
studies. Using this technique, pattern resolution can be reached up to 4 µm (see
104
CHAPTER 6. SUMMARY AND OUTLOOK:
chapter5) and the created patterns could be easily functionalized with ECM proteins.
We also have shown that the length(@30nm) and grafting density of the polymer has
to be tightly adjusted to make cells adhere on the substrate. Ultimately, we have
shown that a proper choice of the pattern shapes allows them to combine the cell
non-adhesiveness of dense PNIPAM brushes with their thermoresponsiveness, which
permits gentle cell detachment. Though this technique may provide different useful
advantages in lab on chip developments and single cell manipulation. Following
the dynamic of this detachment over time will give great insights in cell adhesion
comprehension.
105

A. ANNEX
A.1. Hydrogel Preparation Protocols:
A.1.1. Bead Functionalization:
Materials:
� 0.2µm (stock solution is 2 % solid) DAPI beads or 0.2µm YFP beads [ pur-
chased from Bangs Laboratory, Inc (FC02F)]
� PLL-g-PEG in powder [purchased from VWR(20-3.3-2)]
� N-Hydroxysuccinimide (NHS) [ purchased from Fluka Analytical (56480-25G)
]
� 1-ethyl-3-(3-dimethylaminopropyl) carbodiimide(EDC) [ purchased from
sigma (E6383-5G) ]
� HEPES buffer (10 mM pH 8.5, pH 7.4)
� MES buffer (10 mM pH 5.5)
Procedure:
1. 10µL beads (stock solution is 2 % solid) + 40uL MES buffer(10mM pH5.5)
solution, mix well 50µl by vortexing.
2. Prepare NHS/EDC (0.4 mg/0.8 mg) in 200µL MES solution.
3. Prepare PLL-PEG solution by adding 4 mg powder in 250 µL HEPES buffer
(10 mM pH 8.5).
107

Hydrogel Preparation Protocols:
4. Mix bead and EDC/NHS solution (solution 1 + 2).
5. Add peg solution in the bead-EDC/NHS solution (solution 3 + 4).
6. Incubate solution(5) in a rotator for 2hr @ RT (or 4XC rocking overnight).
7. Spin down the beads at 14000 rpm for 30 minutes, and remove solution. (Try
to use a lower speed and short time at first if possible)
8. Re-suspend in HEPES (10 mM pH 7.4).
9. Spin down the beads and remove solution.
10. Re-suspend in 2 to 4� original beads volume in HEPES (10 mM pH 7.4).
A.1.2. Coverslip Treatment
Materials:
� 99.9% ethanol
� 10% Acetic acid
� Bind saline ( stored at RT purchased from Plus one; code no - 17-1330-01)
Procedure:
1. Solution prepared in 99.9% ethanol by adding acetic acid of 3.2 % and bind
saline of 0.38% and mix wel by votexing
2. 100µl of solution used to cover 20�20 coverslip.
3. By kimwipe, solution is smeared on the glass coverslip.
4. Keep for drying about 15 to 20 mins.
5. Functionalized coverslips can be stored for long term using for gel preparation.
108
Hydrogel Preparation Protocols:
A.1.3. Hydrogel Micropatterning :
Materials:
All chemicals purchased from Sigma.
� Acrylamide solution.
� N,N-methylene bisacrylamide solution.
� Tetramethylethylenediamine(TEMED)
� 98 % Ammonium persulfate (APS)
� DPBS, Ca and Mg free [PAA Laboratories (Cat no H15-002)]
� Fibronectin from bovine plasma ( Purchased from Sigma)
� Fibrinogen ( Purchased from Sigma F1141-IMG) ( Purchased from Invitrogen)
Stock Solutions:
� 10 % APS prepared in water
� 0.2 M EDC prepared in water
� 0.15 M NHS prepared in water
Procedure:
1. Put enough amount of isopropanol and smear it on the quartz mask.
2. Sonicate the beads for 2 to 4 mins.
3. Add 3 µl of beads (for TFM measurements only) in 160 µl of gel
premix(PBS/acrylamide/bis-acrylamide).
4. Put enough amount of n-hexan on the mask and keep rubbing on the mask
with kimwipe.
5. Put 1-2 ml of n- hexen with pipette and smear it with kim wipe.
109

Hydrogel Preparation Protocols:
6. Add 1µl of TEMED in gel solution.
7. Add 1µl of APS in gel solution and vortex it.
8. 30 µl of solution drop put on the n-hexan smeared mask for 20�20 mm square
saline treated coverslip.
9. Cover the mask to prevent evaporation. And also put a small piece of wet
tissue to avoid dry environment.
10. Give 45Mins to 1 hr for polymerization at room temperature (RT) .
11. Illuminate with deep UV through the mask for 4mins.
EDC- NHS Coating
12. Put a piece of parafilm on a flat place.
13. Take out the mask and put enough water over the coverslip on the mask .
14. Prepare NHS and EDC mix (1:1) and put a drop of mix of 100 µl for 20�20
mm square coverslip on the parafilm sheet .
15. Detach the gel-coverslip from the mask by adding milliQ-water.
16. Dry the gel by air-flow (blow with nitrogen or clean air).
17. Put the coverslip (gel side down) directly on NHS/EDC solution on parafilm
for 15 minutes at RT.
18. Move the coverslip 2 to 3 times during incubation to remove bubbles.
Protein Coating
19. Prepare protein solution 1 µl Fibrinogen and 3 µl of Fibronectin in 100µl of
Hepes pH 8.5(20 µg/mL protein).
110
Micropatterning on PNIPAM polymer brush experimental protocols:
20. Put a small piece of parafilm on a flat place. Put the 100µl of protein solution
drop on the parafilm.
21. Remove excess NHS/EDC solution by blotting the side of the coverslip against
kimwipe.
22. Put the coverslip with gel side down on the solution.
23. Incubate at RT for at least 1 hr.
24. Wash the coverslip 2 times 1X PBS (not necessarily sterile).
25. Store at 4XC (can be kept for � 2 days).
A.2. Micropatterning on PNIPAM polymer brush
experimental protocols:
A.2.1. Patterning
� Synthesized polymer on glass coverslip kept under UV lamp.
� A quartz-chromium mask, containing experimental design placed on top of the
coverslip with minimum gap.
� UV lamp illuminated for about 5-7 minutes.
� Patterns are created on the sample which can be stored 5-6 months.
A.2.2. Surface Functionalization
Surface can be functionalized with desired proteins.
1. Protein solution prepared in HEPES (10 mM of 8.5 pH) by adding 20 µg /ml
in concentration (fibrinogen and fibronectin)
2. 100 µl of protein solution put on a flat piece of parafilm.
3. Coverslip deposited in the solution and incubated for 1 hr at RT.
111

Cell Culture
A.3. Cell Culture
Materials:
1. Dulbecco’s Modified Eagle Medium (DMEM) (Purchased from PAA Labora-
tories )
2. Fetal calf/ bovine serum (FCS/FBS) (Purchased from PAA Laboratories )
3. Primary and secondary antibody ( Purchased from Invitrogen)
4. TritonX-100 ( Purchased from Sigma T8787)
5. Trypsin EDTA 1� (Purchased from PAA Laboratories )
6. Fluoroshield ( Purchased from Sigma T8787)
A.3.1. Classic culture
Mouse embryonic fibroblast (MEF) cells are generous gift of Dr. Olivier Destaing
from Institute of Albert Bonniot, Grenoble.
Rat embryonic fibroblast ( REF52) cells are kindly provided by Dr. Benoit Ladoux
from Paris 7 University.
Mouse embryonic fibroblasts(MEF) are cultured in Dulbecco’s Modified Eagle
Medium (DMEM) supplemented with 10 % Fetal calf serum (FCS), 0.2 % penicillin
streptomycine and 2 mM L-glutamine (GIBCO) and Sodium Pyruvate. Cells were
maintained at 37XC and 5% CO2.
Rat embryonic fibroblasts ( REF52 ) cells are cultured with high Glucose Dul-
becco’s Modified Eagle Medium ( DMEM) with 10 % Fetal bovine Serum(FBS),
and 0.2 % penicillin streptomycine. Incubator temperature was maintained at 37XC
supplemented with 5 % CO2.
112

Cell Culture
Some cells were frozen to maintain same passage for different set of experiments.
Cells were stored in DMSO at 80X C for few months.
A.3.2. cell culture on pattern
1. Remove media for the classic petri or flask.
2. Cells are washed with 1� PBS.
3. Cells are trypsinized in the classic culture.
4. Culture media added maintaining 50,000/ cm2 cells.
5. trypsinized cells are seeded on the prepared micropatterned coverslip (mounted
on cell observation chamber only for TFM).
6. When cell starts adhering on the adhesive part of the substrate (after 30 -
45mins) extra cells are washed off.
7. When cells are fully spread after 2-3 hrs of intubation at 37XC , media is
replaced with imaging media supplemented with 5 % CO2 without Phenol
red.
8. Cell bearing coverslip is taken for respective experiments (traction force ex-
periment or for staining).
——————————————————————————————————-
* Before plating cells it is required to count the cell density.
* Cell adhesion time depends on the cell type and substrate rigidity.
* 2 hrs before starting experiments, microscope thermalization chamber is set to
37XC.
* In TFM experiments cells are killed by milliQ water.
113

Immuno-labeling:
A.4. Immuno-labeling:
Actin Staining :
1. Remove culture media from cell and rinse (for paxillin) with 1� PBS (pH 7.4).
2. Wash cells 2 times with 1� PBS (pH 7.4).
3. Fix in 4 % formaldehyde for 15 to 20 minutes at RT.
4. Rinse 2 times with 1� PBS (pH 7.4).
5. Permeabilize cells in 0.5 % Triton-X100 for 10 minutes.
6. Incubate in fluorescent-phalloidin (1ug/ml from 1mg/ml frozen stock ) in
HEPES (10mM pH 8.5) for 45 minutes to 1 hr.
7. Wash 2 times with 1� PBS (pH 7.4).
8. Mount in Fluoroshield with DAPI to stain nuclei if required for overnight and
seal it.
Double Staining : Paxillin and Centrosome
1. Remove culture media from cell.
2. Fix in 4% formaldehyde for 15 to 20 minutes at RT (for paxillin) or add cold
methanol(-20XC) by the side of the petridish (only for centrosome).
3. keep it at -20XC for about 5-6mins (for centrosome). Keep it at room temper-
ature for 10 -20 minutes.
4. Remove methanol or formaldehyde.
5. Wash cells 2� with 1� PBS (pH 7.4).
6. Permeabilize cells in 0.5 % Triton-X100 for 10 minutes (only for paxillin)
7. Incubate in 100 µl of protein solution composed of 1.5% BSA primary antibody
(1 µg/ml ) in PBS for 45 minutes to 1 hr (paxillin) at RT.
114
Immuno-labeling:
8. Wash 2 times with 1 � PBS (pH 7.4).
9. Incubate in 100 µl of protein solution composed of 1.5% BSA secondary anti-
body (1 µg/ml ) in PBS for 40 minutes (for centrosome) or 45 minutes to 1
hr (paxillin) at RT.
10. Wash 2 times with 1 � PBS (pH 7.4).
11. Mount in Fluoroshield with DAPI to stain nuclei if required for overnight and
seal it.
115


References
[1] Viola Vogel, Michael Sheetz; Local force and geometry sensing regulate cell
functions Nature Reviews Molecular Cell Biology Volume 7 April 2006 271.
[2] Benjamin Geiger, Alexander Bershadsky, Roumen Pankov and Kenneth M.
Yamada; Transmebrane Extracellular Matrix Cytoskeleton Crosstalk; Nature
Reviews; Molecular Cell Biology Volume 2 November 2001 793
[3] Alexander D. Bershadsky, Nathalie Q. Balaban, and Benjamin Geiger; Adhe-
sion - Dependent Cell Mechanosensitivity ; Annual Review of Cell Develop-
mental Biology 2003 19:67795 .
[4] Adam J. Engler, Shamik Sen, H. Lee Sweeney and Dennis E. Dische Engler;
Matrix Elasticity Directs Stem Cell Lineage SpecificationCell 126, 677689,
August 25, 2006
[5] Amnon Buxboim, Irena L. Ivanovska and Dennis E. Discher, Matrix elasticity,
cytoskeletal forces and physics of the nucleus: how deeply do cells feel outside
and in?; Journal of Cell Science 123, 297-308 2010 doi:10.1242/jcs.041186.
[6] Marie Versaevel1, Thomas Grevesse1 ang Sylvain Gabriele; Spatial coordina-
tion between cell and nuclear shape within micropatterned endothelial cells;
Nature Communication 2012 DOI: 10.1038/ncomms1668.
[7] Wang HB, Dembo M, Hanks SK, Wang Y Focal adhesion kinase is involved
in mechanosensing during fibroblast migration. Proc Natl Acad Sci USA 2001
98(20):1129511300.
117

References References
[8] Goetz JG. Bidirectional control of the inner dynamics of focal adhesions pro-
motes cell migration; Cell Adhesion and Migration 2009, 3:185-190.
[9] Lo CM., Wang HB., Dembo M., Wang YL., Cell movement is guided by the
rigidity of the substrate. Biophys Journal 2000 79:144152,
[10] Thery M; Cell Micropatterning as a Tool to Decipher Cell Morphogenesis and
Functions; Journal of Cell Science 2010 123: 4201-4213.
[11] Sui Huang and Donald E. Ingber; Shape-Dependent Control of Cell
Growth, Differentiation, and Apoptosis: Switching between Attractors in
Cell Regulatory Networks; Experimental Cell Research; 2000 261 91103
doi:10.1006/excr.5044.
[12] Jaalouk D.E. and Lammerding J., Mechanotransduction gone awry; Nature
Reviews Molecular cell Biology 2009 volume 10 63.
[13] Riveline D., E. Zamir, N. Q. Balaban, U. S. Schwarz, B. Geiger, Z. Kam and
A. D. Bershadsky; Focal contact as a mechanosensor: externally applied local
mechanical force induces growth of focal contacts by a mDial-dependent and
ROCK-independent mechanism; Journal of Cell Biology 2001 153:11751185.
[14] Yeung T., Georges, PC., Flanagan LA., Marg B., Ortiz M., Funaki M.,Zahir
N., Ming W., Weaver V., Janmey PA.; Effects of Substrate Stiffness on Cell
Morphology, Cytoskeletal Structure, and Adhesion; Cell Motility and the Cy-
toskeleton 2005 60:2434.
[15] Zamir E, Geiger B, Kam Z Quantitative Multicolor Compositional Imaging
Resolves Molecular Domains in Cell-Matrix Adhesions. PLoS ONE 2008 3(4):
e1901. doi:10.1371/journal.pone.0001901.
[16] Choquet D., D. F. Felsenfeld, and M. P. Sheetz; Extracellular matrix rigidity
causes strengthening of integrin-cytoskeleton linkages; Cell 1997. 88:3948.
[17] Christopher S. Chen, John Tan, Joe Tien; Mechanotransduction at cell matrix
118

References References
and cell-cell contacts; Annual Review of Biomedical Engineering 2004 vol 6:
275- 302.
[18] Matthew J. Paszek, Nastaran Zahir,Kandice R. Johnson,Johnathon N.
Lakins,Gabriela Rozenberg,Amit Gefen, Cynthia A.Reinhart-King, Susan S.
Margulies, Micah Dembo,David Boettiger, Daniel A. Hammer, and Valerie
M. Weaver; Tensional homeostasis and the malignant phenotype; Cancer Cell
2005 DOI 10.1016/j.ccr.2005.08.010.
[19] J. Dai and M. P. Sheetz ; Mechanical properties of neuronal growth cone
membranes studied by tether formation with laser optical tweezers; Biophysi-
cal Journal 1995 March 68(3): 988996 doi: 10.1016/S0006-3495(95)80274-2.
[20] Balaban N.Q., Schwarz U.S., Riveline D., Goichberg P., Tzur G., Sabanay I.,
Mahalu D., Safran S., Bershadsky A.D., Addadi L., Geiger B.; Force and focal
adhesion assembly: a close relationship studied using elastic micropatterned
substrates; Nature Cell Biology 2001 3, 466472.
[21] Harris, A. K., P. Wild, and D. Stopak. Silicone rubber substrata: a new wrinkle
in the study of cell locomotion; Science 208(4440):177179, 1980.
[22] M Dembo, T Oliver, A Ishihara, and K Jacobson ;Imaging the traction stresses
exerted by locomoting cells with the elastic substratum method; Biophysical
Journal 1996 April; 70(4): 20082022.
[23] Thery M, Racine V, Piel M, Pepin A, Dimitrov A, Chen Y, Sibarita JB,
Bornens M; Anisotropy of cell adhesive microenvironment governs cell internal
organization and orientation of polarity; Proc Natl Acad Sci USA 2006 103:
1977119776.
[24] Chen C.S., Mechanotransduction a field pulling together? Journal of Cell
Science 2008 121, 3285- 3292.
[25] Chretien, D. and Fuller, S.D. Microtubules switch occasionally into unfavor-
able configurations during elongation; Journal of Molecular Biology 2000 May
12;298(4):663-76.
119

References References
[26] Michel Bornens; The Centrosome in Cells and Organisms; Science 2012 425
DOI: 10.1126/science.1209037.
[27] Jones J. C. R., Goldman A. E., Steinert P. M., Yuspa S., Goldman R. D;
Dynamic aspects of the supramolecular organization of intermediate filament
networks in cultured epidermal cells; Cell Motil. 1982 2:197213.
[28] Goldman R. D., Grin B., Mendez M. G., Kuczmarski E. R; Intermediate
filaments: versatile building blocks of cell structure; Curr. Opin. Cell Biol.
2008 20:2834
[29] Oriolo A. S., Wald F. A., Ramsauer V. P., Salas P. J. Intermediate filaments:
a role in epithelial polarity; Exp. Cell Res. 2007;313:22552264
[30] Robert Kirmse., Zhao Qin., Carl M. Weinert., Andrea Hoenger, Markus J.
Buehler, Laurent Kreplak. Plasticity of Intermediate Filament Subunits; PLoS
ONE 2010 Volume 5 .
[31] Kirmse R, Portet S, Mcke N, Aebi U, Herrmann H, Langowski J. A quanti-
tative kinetic model for the in vitro assembly of intermediate filaments from
tetrameric vimentin; J Biol Chem 2007 282(25):18563-18572.
[32] Herrmann H, Haner M, Brettel M, Ku NO, Aebi U Characterization of distinct
early b assembly units of different intermediate filament proteins; J Mol Biol
1999 286: 14031420.
[33] Mogilner A. Oster G. Cell motility driven by actin polymerization; Biophys.
J. 1996 71(6):3030-45.
[34] Tom Shemesh, Alexander D. Bershadsky, and Michael M. Kozlov; Physical
Model for Self-Organization of Actin Cytoskeleton and Adhesion Complexes
at the Cell Front; Biophysical Journal Volume 102 April 2012 17461756doi:
10.1016/j.bpj.2012.03.006.
[35] Balland M., Richert A., Gallet F., The dissipative contribution of myosin II
in the cytoskeleton dynamics of myoblasts; Eur Biophys J 34: 255261, 2005.
120
References References
[36] Hynes RO., Integrins: bidirectional, allosteric signaling machines, Cell 2002
20;110(6):673-87.
[37] Yonggang Pang, Xiaoli Wang, Dongkeun Lee, Howard P. Greisler; Dynamic
quantitative visualization of single cell alignment and migration and matrix
remodeling in 3-D collagen hydrogels under mechanical force; Biomaterials
2011 32 3776e3783.
[38] Alberts B, Johnson A, Lewis J, et al. Molecular Biology of the Cell, 4th edition
; Garland Science 2002.
[39] Je rome Solon, Ilya Levental, Kheya Sengupta, Penelope C. Georges, and
Paul A. Janmey; Fibroblast Adaptation and Stiffness Matching to Soft Elas-
tic Substrates; Biophysical Journal Volume 93 December 2007 44534461;doi:
10.1529/biophysj.106.101386.
[40] Manuel Thery, Anne Pepin, Emilie Dressaire,Yong Chen,2and Michel Bor-
nens1; Cell distribution of stress fibres in response to the geometry of the
adhesive environment; Cell Motility and the Cytoskeleton 2006.
[41] Kalpana Mandal, Martial Balland, Lionel Bureau; Thermoresponsive Mi-
cropatterned Substrates for Single Cell Studies; PLoS ONE, May 2012 Volume
7 Issue 5 e37548.
[42] Khaled W., Ermert H., Reichling S., Bruhns O.T., The inverse problem of
elasticity: a reconstruction procedure to determine the shear modulus of tissue,
in Proc. of 2005 IEEE Ultrasonics Symp, 735738, 2005.
[43] Sun C., Standish B., Yanga V.X., Optical coherence elastography: current sta-
tus and future applications, Journal of Biomedical Optics 2011 16(4), 043001.
[44] D. Stopak and A.K. Harris, Connective tissue morphogenesis by fibroblast
traction I. Tissue culture observations ; Dev. Biol. 1982 90:383398.
[45] Daniel J. Leahy, Implications of atomic-resolution structures for cell adhesion;
Annu. Rev. Cell Dev. Biol.1997 13:363393.
121
References References
[46] Abercrombie M, Dunn GA; Adhesions of fibroblasts to substratum during
contact inhibition observed by interference reflection microscopy; Exp Cell
Res. 1975; 92(1):5762.
[47] Ballestrem C, Hinz B, Imhof BA, Wehrle-Haller B.Marching at the front and
dragging behind: differential alphaVbeta3-integrin turnover regulates focal
adhesion behavior; J Cell Biol. 2001 Dec 24;155(7):1319-32.
[48] Clark E. A., King W. G., Brugge J. S., Symons M. and Hynes R. O.; Integrin-
mediated signals regulated by members of the rho family of GTPases; J. Cell
Biol 1998. 142, 573-586.
[49] Rottner K, Hall A, Small JV; Interplay between Rac and Rho in the control
of substrate contact dynamics; Curr Biol. 1999 Jun 17;9(12):640-8.
[50] Beningo KA, Lo CM, Wang YL. Flexible polyacrylamide substrata for the
analysis of mechanical interactions at cell-substratum adhesions; Methods Cell
Biol.2002 69:32539 .
[51] Tan J.L., Tien J., Pirone D.M., Gray D.S., Bhadriraju K., Chen C.S. Cells
lying on a bed of microneedles:an approach to isolate mechanical force; Proc.
Natl Acad. Sci.2003 USA 100, 14841489.
[52] Goffin JM, Pittet P, Csucs G, Lussi JW, Meister JJ, Hinz B , Focal ad-
hesion size controls tension-dependent recruitment J Cell Biol. 2006 Jan
16;172(2):259-68. Epub 2006 Jan 9.
[53] J. Stricker, B. Sabass, U. Schwarz, and M. Gardel.Optimization of traction
force microscopy for micron-sized focal adhesions; J. Phys. Condensed Matter
2010 22:194104 doi:10.1088/0953-8984/22/19/194104.
[54] Zaidel-Bar R., Cohen M., Addadi L. Geiger B. Hierarchical assembly of cell-
matrix adhesion complexes. Biochem. Soc. Trans. 2004 32(Pt3):416-20.
[55] Katsumi A., Wayne Orr A., Tzima E., Schwartz M.A., Integrins in Mechan-
otransduction, JBC 2004 volume 279 13 pp. 1200112004.
122
References References
[56] Eli Zamir and Benjamin Geiger Components of cell-matrix adhesions ; J Cell
Sci 2001 October 15 114, 3583-3590.
[57] Galbraith C.G., Sheetz M.P.: A micromachined device provides a new bend
on fibroblast traction forces. Proc. Natl Acad. Sci.1997 USA 94, 91149118 .
[58] Juliet Lee, Michelle Leonard, Tun Oliver,Akira Ishihara, and Ken Jacobson,
Traction Forces Generated by Locomoting KeratocytesThe Journal of Cell
Biology 1994 December Volume 127, Number 6, Part 2, 1957-1964.
[59] Demosthene Mitrossilis, Jonathan Fouchard, Axel Guiroy, Nicolas Desprat,
Nicolas Rodriguez, Ben Fabry,and Atef Asnacios; Single-cell response to stiff-
ness exhibits muscle-like behavior; PNAS 2009 October 27 . 1824318248, doi
10.1073
[60] Jochen Guck, Revathi Ananthakrishnan, Hamid Mahmood, Tess J. Moon, C.
Casey Cunningham and Josef K; The Optical Stretcher: A Novel Laser Tool
to Micromanipulate Cells; Biophysical Journal 2001 Volume 81 Issue 2 767-784
doi:10.1016/S0006-3495(01)75740-2.
[61] James L Wilbur, Amit Kumar, Hans A Biebuyck, Enoch Kim and George M
Whitesidesy Microcontact printing of self-assembled monolayers:applications
in microfabrication; Nanotechnology 7 1996 452457.
[62] Milan Mrksich, Laura E. Dike, Joe Tien, Donald E. Ingber, and George M.
Whitesides, Using Microcontact Printing to Pattern the Attachment of Mam-
malian Cells to Self-Assembled Monolayers of Alkanethiolates on Transparent
Films of Gold and Silver Experimental cell research 1997 235, 305313 .
[63] Ammar Azioune, Nicolas Carpi,Qingzong Tseng,Manuel Thry, Matthieu Piel;
Chapter 8Protein Micropatterns: A Direct Printing Protocol Using Deep Uvs
, Methods in cell Biology , volume 97, 2010, Pages 133146 .
[64] Azioune A, Storch M, Bornens M, Thry M, Piel M; Simple and rapid process
for single cell micro-patterning; Lab on Chip 2009 Jun 7;9(11):1640-2.
123
References References
[65] Harris AK, Stopak D, Wild P. Fibroblast traction as a mechanism for collagen
morphogenesis. Nature 1981 290:249-251
[66] Marganski WA, Dembo M, Wang YL (2003) Measurements of cell-generated
deformations on flexible substrata using correlation- based optical flow. Meth
Enzymol 361:197211
[67] Yang Z, Lin JS, Chen J,Wang JH. Determining substrate displacement and
cell traction fields–a new approach. J Theor Biol 2006 242:607-616.
[68] U.S. Schwarz, N.Q. Balaban, D.Riveline, A. Bershadsky, B. Geiger and S.A.
Safran; Calculation of Forces at Focal Adhesions from Elastic Substrate
Data: The Effect of Localized Force and the Need for Regularization; Bio-
physical Journal 2002 1 September Volume 83 1380-1394, doi:10.1016/S0006-
3495(02)73909-X
[69] Butler, J.P., Toli-Nrrelykke, I.M., Fabry,B., Fredberg, J.J.; Traction fields,
moments, and strain energy that cells exert on their surroundings; Am. J.
Physiol. Cell Physiol 2002 282, C595C605.
[70] du Roure O, Saez A, Buguin A, Austin RH; Force mapping in epithelial cell
migration; Proc Natl Acad Sci U S A, 2005 102:2390-2395.
[71] Pelham RJ Jr, Wang Y. 1997. Cell locomotion and focal adhesions are regu-
lated by substrate flexibility. Proc. Natl. Acad. Sci. USA 94:1366165.
[72] James H-C. Wang 1, and Bin Li; The principles and biological applications
of cell traction force microscopy Microscopy: Science Technology Applications
and Education 2007.
[73] Valentina Peschetola, Valrie M. Laurent, Alain Duperray, Luigi Preziosi, Da-
vide Ambrosi, Claude Verdier; Traction forces of cancer cells; Computer Meth-
ods in Biomechanics and Biomedical Engineering 2011 14, S1 159-160; DOI
10.1080/10255842.2011.593954.
124

References References
[74] Burton, K. Taylor, D. L.; Traction forces of cytokinesis measured with opti-
cally modified elastic substrat.; Nature 1997 385 450454 .
[75] Sabass B., Gardel, M.L., Waterman, C.M., Schwarz, U.S.: High resolution
traction force microscopy based on experimental and computational advances.
Biophysical Journal 2008 94 207220 ; doi:10.1529/biophysj.107.113670.
[76] Dembo M,Wang YL. Stresses at the cell-to-substrate interface during locomo-
tion of fibroblasts. Biophysical Journal 1999 76:2307- 2316.
[77] Marie Versaevel, Thomas Grevesse1 and Sylvain Gabriele; Spatial coordination
between cell and nuclear shape within micropatterned endothelial cells; Nature
communications 2012 DOI: 10.1038.
[78] Justin R. Tse and Adam J. Engler; Preparation of Hydrogel Substrates with
Tunable Mechanical Properties; Current Protocols in Cell Biology 2010 DOI:
10.1002/0471143030.cb1016s47.
[79] Eric A. Klein,Liqun Yin,Devashish Kothapalli,Paola Castagnino,Fitzroy J.
Byfield, Tina Xu,Ilya Leventa, Elizabeth Hawthorne, Paul A. Janmey,and
Richard K. Assoian; Cell-Cycle Control by Physiological Matrix Elasticity
and In Vivo Tissue Stiffening; Current Biology 2009 19, 15111518; DOI
10.1016/j.cub.2009.07.069.
[80] Eric A. Klein, Liqun Yin, Devashish Kothapalli,Paola Castagnino,Fitzroy
J. Byfield, Tina Xu, Ilya Levental, Elizabeth Hawthorne, Paul A. Jan-
mey and Richard K. Assoian1; Cell-Cycle Control by Physiological Ma-
trix Elasticity and In Vivo Tissue Stiffening; Current Biology 2009 19 DOI
10.1016/j.cub.2009.07.069.
[81] Masha Prager-Khoutorsky, Alexandra Lichtenstein1, Ramaswamy Krishnan,
Kavitha Rajendran,Avi Mayo1, Zvi Kam, Benjamin Geiger and Alexander D.
Bershadsky1; Fibroblast polarization is a matrix-rigidity-dependent process
controlled by focal adhesion mechanosensing ; Nature Cell Biology 2011 DOI:
10.1038/ncb2370.
125

References References
[82] M. Ghibaudo, A. Saez, L. Trichet, A. Xayaphoummine, J. Browaeys, P. Sil-
berzan, A. Buguin, and B. Ladoux; Traction forces and rigidity sensing regu-
late cell functions; Soft Matter 2008 4:18361843, 2008.
[83] Alexander D. Bershadsky, Nathalie Q. Balaban and Benjamin Geiger;
adhesion-dependent cell mechanosensitivity ; Annu. Rev. Cell Dev. Biol 2003.
19:67795
[84] Daniel A. Fletcher and R. Dyche Mullins; Cell mechanics and the cytoskeleton;
Nature 2010 doi:10.1038;nature08908.
[85] Burridge K., and M. Chrzanowska-Wodnicka; Focal adhesions,contractility,
and signaling; Annu. Rev. Cell Dev. Biol 1996 12:463518.
[86] Galbraith, C. G., and M. Sheetz. Forces on adhesive contacts affect cell func-
tion; Curr. Opin. Cell Biol 1998 10:566571.
[87] Qingzong Tseng, a Irene Wang, Eve Duchemin-Pelletier,Ammar Azioune,
Nicolas Carpi,Jie Gao, Odile Filhol,Matthieu Piel,Manuel Thery and Martial
Balland; A new micropatterning method of soft substrates reveals that dif-
ferent tumorigenic signals can promote or reduce cell contraction levels; Lab
Chip 2011 11 DOI: 10.1039/c0lc00641f.
[88] Geiger B., A. Bershadsky, R. Pankov, and K. M. Yamada. Transmembrane
crosstalk between the extracellular matrix and the cytoskeleton. Nat. Rev.
Mol. Cell Biol. 2001 2:793805.
[89] Andrew D. Rape, Wei-hui Guo, Yu-li Wang;The regulation of traction force
in relation to cell shape and focal adhesions; Biomaterials 2011 32 2043e2051;
doi:10.1016/j.biomaterials.2010.11.044.
[90] Saez A, Buguin A, Silberzan P, Ladoux B ,Is the mechanical activity of ep-
ithelial cells controlled by deformations or forces?; Biophysical Journal 2005
89:L524.
126

References References
[91] Wesley R. Leganta, Amit Pathak, Michael T. Yang, Vikram S. Deshpande,
Robert M. McMeeking, and Christopher S. Chen; Microfabricated tissue
gauges to measure and manipulate forces from 3D microtissues, PNAS 2009
June 23 volume 106 no 25 1009710102 doi 10.1073 .
[92] Britta Trappmann, Julien E. Gautrot, John T. Connelly,Daniel G. T. Strange,
Yuan Li,Michelle L.Oyen, Martien A. Cohen Stuart, Heike Boehm6, Bojun
Li, Viola Vogel,Joachim P. Spatz, Fiona M.Watt,and Wilhelm T. S. Huck;
Extracellular-matrix tethering regulates stem-cell fate; Nature Materials Ad-
vance Online Publication DOI: 10.1038/NMAT3339.
[93] Kimura K, Kimura A; A novel mechanism of microtubule length-dependent
force to pull centrosomes toward the cell center; Bioarchitecture 2011 March
1(2):74-79.
[94] Shinji Deguchi, Tsubasa S Matsui, Kazushi Iio; The position and size of indi-
vidual focal adhesions are determined by intracellular stress-dependent posi-
tive regulation.; Cytoskeleton 2011 68(11):639-51. DOI: 10.1002/cm.20541.
[95] Martin, S.G., and Chang, F. New end take off: Regulating cell polarity during
the fission yeast cell cycle; Cell Cycle 2005 (Georgetown,Tex) 4, 10461049.
[96] Courtney R. Terenna, Tatyana Makushok,Guilhem Velve-Casquillas,Damien
Baigl,Yong Chen,Michel Bornens,Anne Paoletti,Matthieu Piel and Phong
T. Tran1;Physical Mechanisms Redirecting Cell Polarity and Cell Shape
in Fission Yeast; Current Biology 2008 November 25 18 17481753, DOI
10.1016/j.cub.2008.09.047.
[97] Olivier M Rossier1,Nils Gauthier Nicolas Biais1,Wynn Vonnegut, Marc-
Antoine Fardin, Philip Avigan,Evan R Heller,Anurag Mathur, Saba Ghassemi,
Michael S Koeckert,James C Hone and Michael P Sheetz; Force generated by
actomyosin contraction builds bridges between adhesive contacts ; European
Molecular Biology Organization 2010.
127
References References
[98] Chen CS, Alonso JL, Ostuni E, Whitesides GM, Ingber DE ; Cell shape pro-
vides global control of focal adhesion assembly; Biochem Biophys Res Commun
2003 307: 355361.
[99] Christophore A. Lemmon, Lewis H. Romer; A Predictive Model of Cell Trac-
tion Force Based on Cell Geometry; Biophysical Journal 2010 Volume 99
doi:10.1016/j.bpj.2010.09.024.
[100] Shang-You Tee, Jianping Fu, Christopher S. Chen, and Paul A. Janmey; Cell
Shape and Substrate Rigidity Both Regulate Cell Stiffness; Biophysical Jour-
nal 2011 Volume 100 doi: 10.1016/j.bpj.2010.12.3744.
[101] Britta Trappmann, Julien E. Gautrot, John T. Connelly, Daniel G. T. Strange,
Yuan Li, Michelle L. Oyen, Martien A. Cohen Stuart, Heike Boehm, Bojun
Li, Viola Vogel,Joachim P. Spatz, Fiona M.Watt, andWilhelm T. S. Huck1;
Extracellular-matrix tethering regulates stem-cell fate; Nature materials 2012
DOI: 10.1038/NMAT3339
[102] Singhvi R, Kumar A, Lopez GP, Stephanopoulos GN, Wang DI, et al. Engi-
neering cell shape and function. Science 1994 264: 696698.
[103] Falconnet D, Csucs G, Grandin HM, Textor M Surface engineering approaches
to micropattern surfaces for cell-based assays; Biomaterials 2006 27: 30443063.
[104] Thery M ; Micropatterning as a tool to decipher cell morphogenesis and func-
tions; J Cell Sci 2010 123: 42014213.
[105] Pan Z, Yan C, Peng R, Zhao Y, He Y, et al.Control of cell nucleus shapes via
micropillar patterns; Biomaterials 2012 33: 17301735.
[106] Ma H, Hyun J, Stiller P, Chilkoti A non-fouling oligo(ethylene glycol)- func-
tionalized polymer brushes synthesized by surface-initiated atom transfer rad-
ical polymerization; Adv Mater 2004 16: 338341.
[107] Azioune A, Storch M, Bornens M, Thery M, Piel M ; Simple and rapid process
for single cell micro-patterning; Lab Chip 2009 9: 16401642.
128

References References
[108] Gautrot JE, Trappmann B, Oceguera-Yanez F, Connely J, He X, et al. Ex-
ploiting the superior protein resistance of polymer brushes to control single cell
adhesion and polarization at the micron scale. Biomaterials 2010 31: 50305041.
[109] Okano T, Yamada N, Okuhara M, Sakai H, Sakurai Y Mechanism of cell
detachment from temperature-modulated, hydrophilic-hydrophobic polymer
surfaces. Biomaterials 1995 16: 297303.
[110] Nagase K, Kobayashi J, Okano T ; Temperature-responsive intelligent inter-
faces for biomolecular separation and cell sheet engineering. J R Soc Interface
2009 6: S293S309.
[111] Schmaljohann D, Oswald J, Jorgensen B, Nitschke M, Beyerlein D, et
al. Thermo-responsive pnipaam-g-peg films for controlled cell detachment;
Biomacromolecules 2003 4: 17331739.
[112] Mizutani A, Kikuchi A, Yamatao M, Kanazawa H, Okano T Preparation of
thermoresponsive polymer brush surfaces and their interaction with cells; Bio-
materials 2008 29: 20732081.
[113] Nagase K, Watanabe M, Kikuchi A, Yamato M, Okano T ;Thermoresponsive
polymer brushes as intelligent biointerfaces: Preparation via atrp and charac-
terization; Macromol Biosci 2011 11: 400409.
[114] Ishida N, Biggs S ; Direct observation of the phase transition for a
poly(nisopropylacryamide) layer grafted onto a solid surface by afm and qcm-
d; Langmuir 2011 23: 1108311088.
[115] Plunkett KN, Zhu X, Moore JS, Leckband DE Pnipam chain collapse depends
on the molecular weight and grafting density; Langmuir 2006 22: 42594266.
[116] Malham IB, Bureau L; Density effects on collapse compression and adhesion
of thermoresponsive polymer brushes; Langmuir 2010 26: 47624768.
[117] Halperin A, Kroger M Collapse of thermoresponsive brushes and the tuning
of protein adsorption; Macromolecules 2011 44: 69867005.
129

References References
[118] Peng R, Yao X, Ding J Effect of cell anisotropy on differentiation of stem
cells on micropatterned surfaces through the controlled single cell adhesion;
Biomaterials 2011 32: 80488057.
[119] Liu H, Ito Y Cell attachment and detachment on icropatternimmobilized
poly(nisopropylacrylamide) with gelatin; Lab Chip 2002 2: 175178.
[120] Takahashi H, Nakayama M, Itoga K, Yamato M, Okano T ; Micropatterned
thermoresponsive polymer brush surfaces for fabricating cell sheets with well-
controlled orientational structures; Biomacromolecules 2011 12: 14141418.
[121] Yamato M, Konno C, Utsumi M, Okano T ;Thermally responsive polymer-
grafted surfaces facilitate patterned cell seeding and co-culture. Biomaterials
2002 23: 561567.
[122] Williams C, Tsuda Y, Isenberg BC, Yamato M, Shimizu T, et al. Aligned
cell sheets grown on thermo-responsive substrates with microcontact printed
protein patterns; Adv Mater 2009 21: 21612164.
124
130

References References
Publications :
1. Thermoresponsive micropatterned substrates for single cell studies.
Kalpana Mandal, Martial Balland, Lionel Bureau.- PLoS one, May 31, 2012 .
2. Geometrical cue influences cell internal tension distribution locally
and globally. Kalpana Mandal, Irne Wang, Martial Balland. - In preparation.
3. Spatial correlation between actin generated forces and centrosome
positioning. Kalpana Mandal, Irne Wang, Martial Balland. - In preparation.
4. Direct comparison of cell traction force on 2D micropattern with 3D
micropillar. Kalpana Mandal, Irene Wang, Martial Balland, Benoit Ladoux.
- In preparation.
131

List of Figures
1.1. Schematic of Eukaryotic Cell and its environment. . . . . . . . . . . . . . 3
1.2. Schematic of single cytoskeleton filaments actin(red), MT(green),
IF(yellow). . . . . . . . . . . . . . . . . . . . . . . . . . . . . . . . . . . . . 4
1.3. Intermediate Filament from single dimer to single filamental structure[31]. 5
1.4. In the actin cytoskeleton of REF52 cells, labelled with GFP-
conjugated phalloidin (green). . . . . . . . . . . . . . . . . . . . . . . . 6
1.5. FAs : Schematic of focal adhesion and focal complex. (Paszek et. al) 8
1.6. Cellular processes of mechanosensing and responses:[1] . . . . . . . . . 11
2.1. Mask designed by CleWin: designed V shape shown in the image of
triangular area is about 900µ m2 with bar width 7µm . . . . . . . . . . . 17
2.2. schematic of the experimental procedure to create pattern on acrylamide
gel. . . . . . . . . . . . . . . . . . . . . . . . . . . . . . . . . . . . . . . . . 20
2.3. Fluorescently labeled protein coated micropattern (red) on polyacry-
lamide hydrogel; Regular array of oval shape dot (green) structure : major
and minor axis are 2 and 3 µm. . . . . . . . . . . . . . . . . . . . . . . . 21
2.4. Images showing influence of UV activation time (2,3 min and then 3.5 ,
4min ) on protein coating. . . . . . . . . . . . . . . . . . . . . . . . . . . 22
2.5. Bright field images of cells, arranged in a regular manner on the protein
coated micropattern: Images taken by phase contrast olympus micro-
scope with 4X objective. . . . . . . . . . . . . . . . . . . . . . . . . . . . . 23
2.6. Diagram shows mechanism of a molecule to Fluoresce. Typical excitation
and fluorescence specification of a given fluorophore has been shown. . . 24
2.7. Schematic ray diagram of the Fluorescence Microscope imaging technique. 25
133

List of Figures List of Figures
2.8. Typical images are acquired for TFM experiment: from left: cell under
bright field, beads (200nm) under the pattern in YFP, fibronectin coupled
with fibrinogen, coated on Pattern in Cy3 channel respectively . . . . . . 29
2.9. Cell traction force exerted on the substrate. . . . . . . . . . . . . . . . . 30
2.10. Schematic diagram shows displacement field determination by Particle
Image Velocimetry and particle tracking. . . . . . . . . . . . . . . . . . . . 33
2.11. Cell (left) in bright field, cultured on 5 kPa soft substrate and bead (right)
images under the cell, taken in fluorescence chanel. . . . . . . . . . . . . . 35
2.12. Cell force map (left) shows calculated force by arrow at each point and
traction contour (right), color bar shows the intensity of stress exerted
by the cell (in Pa). . . . . . . . . . . . . . . . . . . . . . . . . . . . . . . . 35
3.1. Image of Protein coated micropatterns(red), created on polyacrylamide
hydrogel U, H and Arrow respectively. Fluorescence images are acquired
in Cy3 channel.(scale bar 10 µm) . . . . . . . . . . . . . . . . . . . . . . . 42
3.2. Bright field image of mouse embryonic fibroblast MEF) cells plated on U,
H and arrow shapes micropatterns, following square envelope irrespective
of underlying geometry. . . . . . . . . . . . . . . . . . . . . . . . . . . . . . 42
3.3. Actin fiber (green) distribution of single MEF cell plated on U, H and
arrow shape micropatterns on polyacrylamide hydrogel substrate, respec-
tively : fibers formed on both over adhesive and nonadhesive boarder of
each shape. Images acquired: 6oX oil objective.(scale bar 10 µm) . . . . 43
3.4. Average actin image (“Fire map”)of MEF cell plated on U, H and Arrow
shape micropatterns on polyacrylamide hydrogel substrate.(scale bar 10
µm). . . . . . . . . . . . . . . . . . . . . . . . . . . . . . . . . . . . . . . . 44
3.5. Fluorescence images of paxillin of single MEF cell plated on U, H and
Arrow shape micropatterns on polyacrylamide hydrogel substrate. Images
acquired: 60X oil objective (scale bar 10 µm). . . . . . . . . . . . . . . . . 45
3.6. Average paxillin images over several MEF cells :Images show adhesions
on U, H and Arrow patterns respectively. (scale bar 10 µm). . . . . . . . 46
134
List of Figures List of Figures
3.7. Schematic of stress fiber - focal adhesion coupling distributed over the
projected area envelopes. (scale bar 10 µm). . . . . . . . . . . . . . . . . 46
3.8. Single cell displacement vector map for U, H and arrow (�): Forces are
highly concentrated on the corner of the projected area envelope.(scale
bar 10 µm). . . . . . . . . . . . . . . . . . . . . . . . . . . . . . . . . . . . 47
3.9. Traction contour map of a single cell on each micropattern shape ( U,
H, Arow). . . . . . . . . . . . . . . . . . . . . . . . . . . . . . . . . . . . . 47
3.10. Average Traction contour map over large number of cells on each shape
( U, H, Arow). . . . . . . . . . . . . . . . . . . . . . . . . . . . . . . . . . . 48
3.11. Average of total contractile energy developed by cells on U, H and arrow
shape micropatterns. . . . . . . . . . . . . . . . . . . . . . . . . . . . . . . 49
3.12. Local force distribution on each corner averaged over many cells(U=53,
H=58, arrow=63) for each shape. . . . . . . . . . . . . . . . . . . . . . . . 50
3.13. Circular array of 2D protein coated dots on a polyacrylamide hydrogel.
Typical size of a dot is two micrometers. Images are taken in Cy3 Channel
in epifluorescence microscopy with 20X and 40X air objectives respectively. 56
3.14. Intensity line profile of circular dot array indicates a strong contrast. . . . 56
3.15. Typical image of REF52 cell adhering on circular dot microarray(left)
Actin in green. Typical fluorescent image of embedded beads(right) in
a 20KPa hydrogel. Bead images are taken in GFP channel with 40X air
objectives with 1.5X microscope magnification. . . . . . . . . . . . . . . . 57
3.16. Statistical distribution of force per circular dot on a 7 kPa rigid gel for a
single REF52 cell. . . . . . . . . . . . . . . . . . . . . . . . . . . . . . . . . 59
3.17. Statistical distribution of force developed by REF52 cells on dot micropat-
tern with substrate rigidity 7, 19.6, 40 kPa. . . . . . . . . . . . . . . . . . 59
3.18. Histogram shows the shift of peak of the statistical distribution of traction
force as rigidity increases. . . . . . . . . . . . . . . . . . . . . . . . . . . . 60
3.19. Histogram shows force comparison in different rigidities: Mean value of
the force has been plotted. . . . . . . . . . . . . . . . . . . . . . . . . . . . 60
135
List of Figures List of Figures
3.20. Paxillin adhesion distribution on regular array of circular dot. Right Pax-
illin (green) overlapped with protein coated pattern (red): Images ac-
quired by 20X (left) and 40X (right) air objectives in YFP channel. . . . 62
3.21. Paxillin adhesion area quantification: paxillin(YFP); Intensity thresholded
image of paxillin (middle); binarized area of each adhesion assembly(right). 62
3.22. Mean focal adhesion area ( determined by averaging over 500 circular
dot) increases, in response to increasing stiffness from 7 to 40 kPa. . . . 63
3.23. Mean focal adhesion area variation with average force per circular dot for
7 , 19.6 and 40 kPa rigid substrates. . . . . . . . . . . . . . . . . . . . . . 63
3.24. Force comparison on pattern vs non-pattern substrate of rigidity 7 to 40
kPa. . . . . . . . . . . . . . . . . . . . . . . . . . . . . . . . . . . . . . . . 66
4.1. Fluorescent image of the fibronectin coated micropatterns (red-fibrinogen
conjugation) taken with magnification factor of 60X. . . . . . . . . . . . . 70
4.2. Bright field image of MEF cells on fibronectin coated micropatterns (top).
Overlapped images (bottom) of stressed(green) pattern with relaxed(red)
pattern. . . . . . . . . . . . . . . . . . . . . . . . . . . . . . . . . . . . . . . 71
4.3. Actin fibers(green) organized inside single MEF cells plated on V, T ,
Tripod, Plus shapes (top panel). Images acquired: 60X oil objective.
“Fire color map” of actin fiber cables averaged over several cells on the
respective shapes (bottom panel). . . . . . . . . . . . . . . . . . . . . . . . 72
4.4. Focal adhesion distribution(upper Pannel) in a single cell, are revealed
by Paxillin in YFP channel. “Fire map” of average paxillin image shows
adhesion enriched area on the pattern. Images acquired: 60X oil objective. 73
4.5. γ�tubulin stained in GFP(top): Bright spot in the middle is the cen-
trosome. Distribution of the centrosomes(blue) plotted on a pat-
tern(red).60X oil objective.( V = 23, T = 40; tripod = 12 ). . . . . . . . 75
4.6. Focal adhesion converges to center of mass of ECM marked in yellow. . 76
4.7. Displacement vector map of beads in YFP channel(top). Force vector
map deduced from the displacement field overlaid on cell image cultured
on protein coated micropatterns (down). . . . . . . . . . . . . . . . . . . 77
136

List of Figures List of Figures
4.8. Stress contour map of single MEF cells cultured on fibronectin coated
micropatterns for all 4 shapes (V, T,Tripod and plus respectively). . . . . 78
4.9. Stress contour map obtained by averaging over several cells. . . . . . . . 78
4.10. Average forces(green), calculated on each corner are directed towards the
pattern center of mass, marked in red. . . . . . . . . . . . . . . . . . . . . 80
4.11. Average percentage area difference (left) for each pattern with and with-
out cell; and error bar is the standard deviation for each individual case.
Contractile energy averaged (right) over several MEF cells cultured on
protein coated micropatterns for all 3 shapes. . . . . . . . . . . . . . . . 81
5.1. Schematic diagram of PNIPAM polymer synthesis on glass coverslip. . . 86
5.2. Dry PNIPAM polymer brush dry thickness (hdry) variation with poly-
merization time, for cAPTES =2.10�4M. and hdry vs cAPTES for 1 min
polymerization. . . . . . . . . . . . . . . . . . . . . . . . . . . . . . . . . . 87
5.3. Polymer brush thickness hdry is controlled by UV irradiation time : Data
are shown here for brushes of initial thickness 82 nm (blue),65 nm (green),
and 54 nm (red). Complete removal of brush appears at t=300sec. . . . 88
5.4. Phase contrast image of annular, triangular, rectangular and hexagonal
patterns obtained by UV photoablation of PNIPAM. The light grey re-
gions have been irradiated by deep UV, where the polymer have been
removed. Image size is 700x500 µm2. . . . . . . . . . . . . . . . . . . . . 89
5.5. PNIPAM micro pattern coated with fibronectin protein conjugated with
fibrinogen in GFP channel . . . . . . . . . . . . . . . . . . . . . . . . . . . 90
5.6. Protein coated V shape (V arms of length 40 µm and width 10 µm)
micropattern prepared PNIPAM polymer grafted glass coverslip : Images
taken with a 4x objective on an Olympus IX70 microscope. Reduced
contrast quality is due to the low NA of the objective. The plot profile
of intensity is given by right image. . . . . . . . . . . . . . . . . . . . . . 91
5.7. Phase contrast image of cells arranged on PNIPAM brushes: on square
(left) and square, triangular and rectangular (right) envelope pattern.
scale bar is 80µm. . . . . . . . . . . . . . . . . . . . . . . . . . . . . . . . 93
137

List of Figures List of Figures
5.8. Schematic diagram of cell adhesiveness dependence on the brush density,
LCST and length. . . . . . . . . . . . . . . . . . . . . . . . . . . . . . . . . 94
5.9. REF cell transfected with GFP-Paxillin (green) adhered on protein (left)
/and without protein (right) coated Pnipam micropattern . . . . . . . . . 94
5.10. Fibronectin and fibrinogen-A546 coating on micropatterned PNIPAM
glass surface (red). Individual MEF cells plated on annulus, triangle
or square,pentagon-shaped fibronectin micropatterns. Cells were fixed
and stained with phalloidin to reveal F-actin filaments (green). Average
distributions of actin (fire), built from the overlay of 10 images for each
shape. The average distribution highlights the reproducibility of the dis-
tributions shown and enhances the spatial distribution of F-actin bundles
along micropattern border regions. . . . . . . . . . . . . . . . . . . . . . . 96
5.11. Cell division on V shape pattern after 5 days: green paxillin; blue nucleus. 97
5.12. Schematic diagram of cell detachment from PNIPAM polymer, induced
by temperature. . . . . . . . . . . . . . . . . . . . . . . . . . . . . . . . . . 97
5.13. Phase contrast image of thermally induced cell detachment : 0min , 2min
6min respectively. Initially adhered on circular shape pattern with brush
thickness 75nm. Imposed temperature is 21XC . . . . . . . . . . . . . . . 98
5.14. Thermally induced cell detachment: 0min , 11min 30min respectively.
Cell initially adhered on a hexagonal pattern with brush thickness 75nm
. Imposed temperature is 26XC. . . . . . . . . . . . . . . . . . . . . . . . . 98
138