
The Role of the Chemical Tanker in Everyday Life 2011 CMA Chem Tank Presentation.pdf• Introduction...
41
The Role of the Chemical Tanker in Everyday Life CMA Luncheon Stamford, CT January 27, 2011 Jack Noonan Jack Noonan CEO CEO BLT Chembulk Group BLT Chembulk Group
Transcript of The Role of the Chemical Tanker in Everyday Life 2011 CMA Chem Tank Presentation.pdf• Introduction...
The Role of the Chemical Tanker in Everyday Life
CMA LuncheonStamford, CT
January 27, 2011
Jack NoonanJack NoonanCEOCEOBLT Chembulk GroupBLT Chembulk Group

• Introduction to BLT Chembulk Group
• Chemical Tanker Industry: An Overview
• 50 Years – A Brief History of Chemical Parcel Tanker Trade
• The Role of the Chemical Tanker in Everyday Life
• Chemical Tanker Trade
– Where it is today
– Where it is going
Today’s Agenda
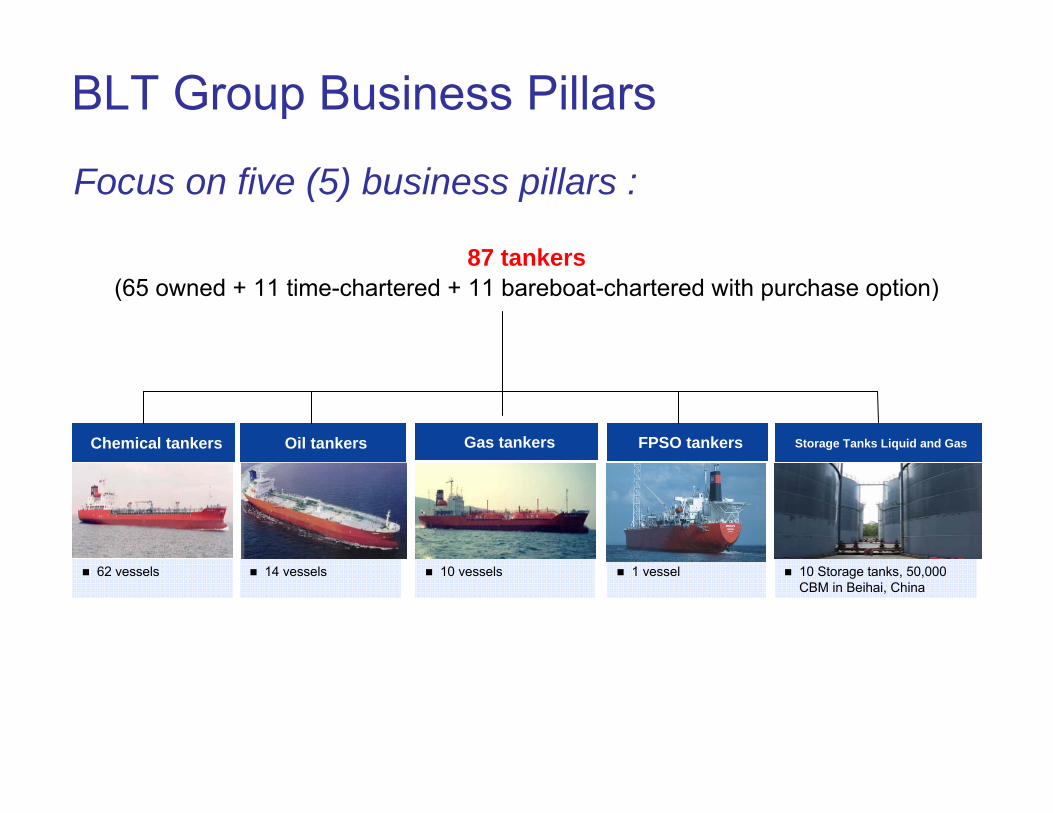
Focus on five (5) business pillars :
87 tankers(65 owned + 11 time-chartered + 11 bareboat-chartered with purchase option)
62 vessels 14 vessels 1 vessel
Chemical tankers Oil tankers FPSO tankersGas tankers
10 vessels
Storage Tanks Liquid and Gas
10 Storage tanks, 50,000 CBM in Beihai, China
BLT Group Business Pillars
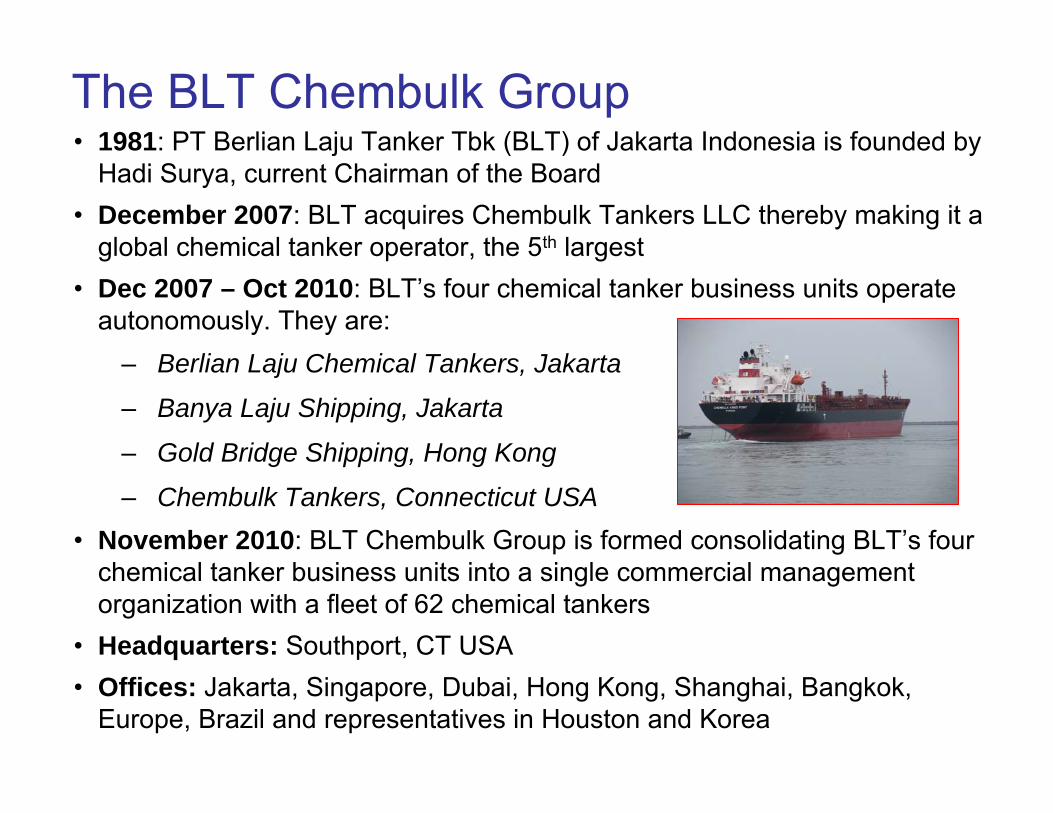
The BLT Chembulk Group • 1981: PT Berlian Laju Tanker Tbk (BLT) of Jakarta Indonesia is founded by
Hadi Surya, current Chairman of the Board • December 2007: BLT acquires Chembulk Tankers LLC thereby making it a
global chemical tanker operator, the 5th largest • Dec 2007 – Oct 2010: BLT’s four chemical tanker business units operate
autonomously. They are: – Berlian Laju Chemical Tankers, Jakarta
– Banya Laju Shipping, Jakarta
– Gold Bridge Shipping, Hong Kong
– Chembulk Tankers, Connecticut USA• November 2010: BLT Chembulk Group is formed consolidating BLT’s four
chemical tanker business units into a single commercial management organization with a fleet of 62 chemical tankers
• Headquarters: Southport, CT USA• Offices: Jakarta, Singapore, Dubai, Hong Kong, Shanghai, Bangkok,
Europe, Brazil and representatives in Houston and Korea
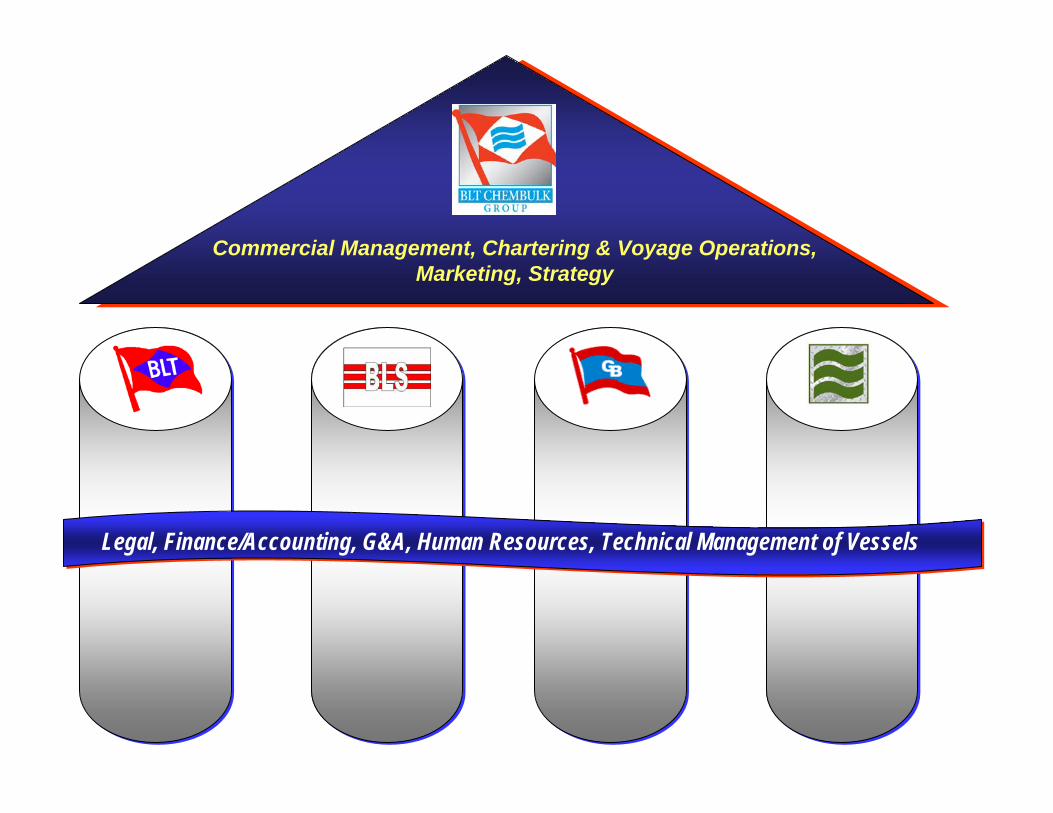
Commercial Management, Chartering & Voyage Operations, Marketing, Strategy
Legal, Finance/Accounting, G&A, Human Resources, Technical Management of Vessels
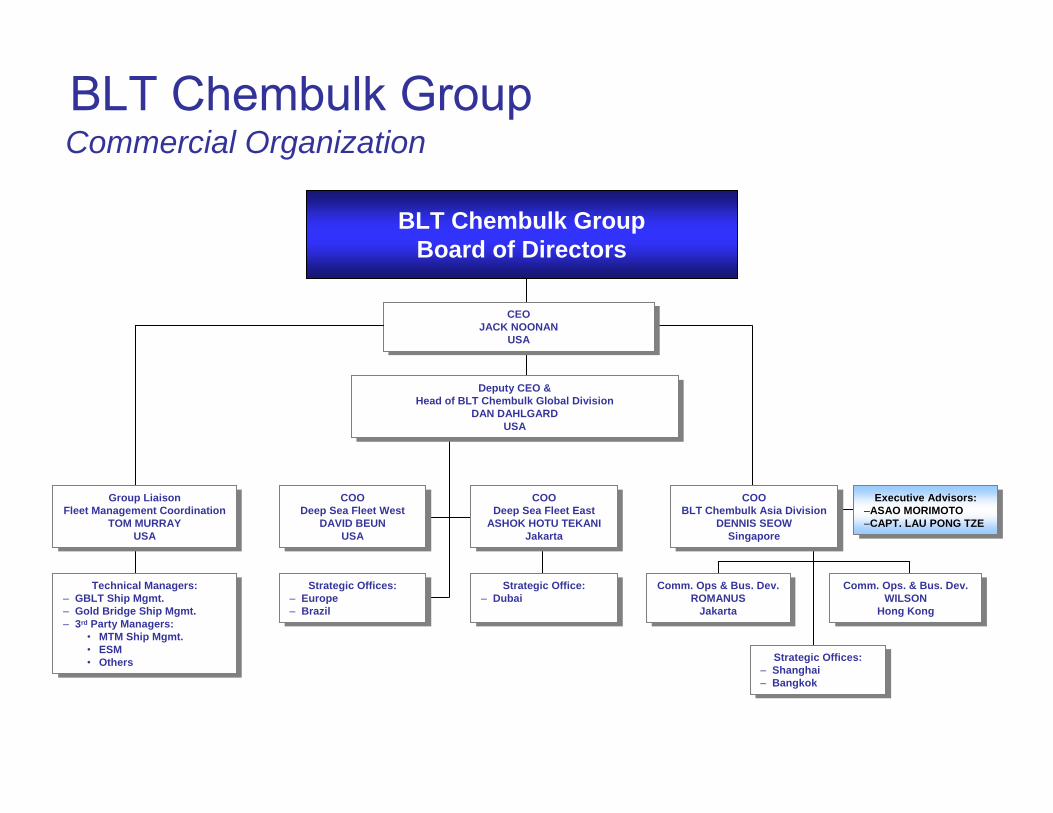
BLT Chembulk GroupCommercial Organization
BLT Chembulk GroupBoard of Directors
CEOJACK NOONAN
USA
CEOJACK NOONAN
USA
Deputy CEO &Head of BLT Chembulk Global Division
DAN DAHLGARDUSA
Deputy CEO &Head of BLT Chembulk Global Division
DAN DAHLGARDUSA
Group LiaisonFleet Management Coordination
TOM MURRAYUSA
Group LiaisonFleet Management Coordination
TOM MURRAYUSA
COODeep Sea Fleet West
DAVID BEUNUSA
COODeep Sea Fleet West
DAVID BEUNUSA
COODeep Sea Fleet East
ASHOK HOTU TEKANIJakarta
COODeep Sea Fleet East
ASHOK HOTU TEKANIJakarta
COOBLT Chembulk Asia Division
DENNIS SEOWSingapore
COOBLT Chembulk Asia Division
DENNIS SEOWSingapore
Executive Advisors:–ASAO MORIMOTO–CAPT. LAU PONG TZE
Executive Advisors:–ASAO MORIMOTO–CAPT. LAU PONG TZE
Technical Managers:– GBLT Ship Mgmt.– Gold Bridge Ship Mgmt.– 3rd Party Managers:
• MTM Ship Mgmt.• ESM• Others
Technical Managers:– GBLT Ship Mgmt.– Gold Bridge Ship Mgmt.– 3rd Party Managers:
• MTM Ship Mgmt.• ESM• Others
Strategic Offices:– Europe– Brazil
Strategic Offices:– Europe– Brazil
Strategic Office:– Dubai
Strategic Office:– Dubai
Comm. Ops & Bus. Dev.ROMANUS
Jakarta
Comm. Ops & Bus. Dev.ROMANUS
Jakarta
Comm. Ops. & Bus. Dev.WILSON
Hong Kong
Comm. Ops. & Bus. Dev.WILSON
Hong Kong
Strategic Offices:– Shanghai– Bangkok
Strategic Offices:– Shanghai– Bangkok
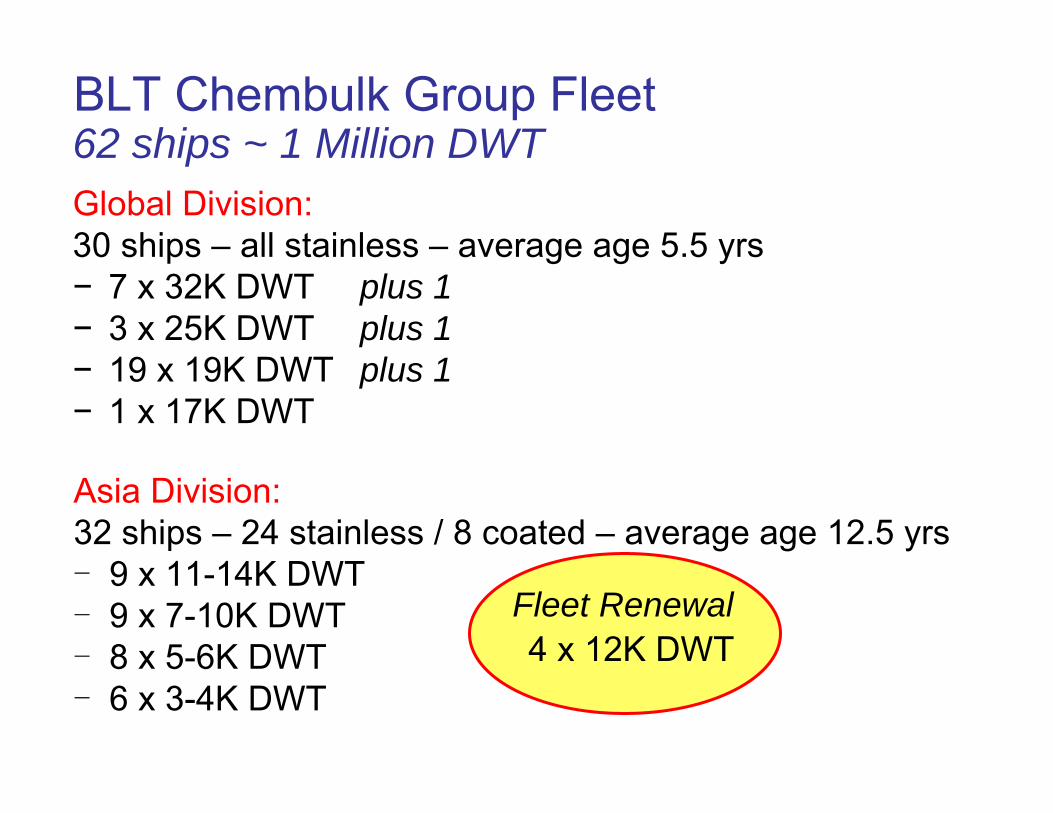
Asia Division:32 ships – 24 stainless / 8 coated – average age 12.5 yrs‒ 9 x 11-14K DWT‒ 9 x 7-10K DWT‒ 8 x 5-6K DWT‒ 6 x 3-4K DWT
BLT Chembulk Group Fleet
Global Division:30 ships – all stainless – average age 5.5 yrs− 7 x 32K DWT plus 1− 3 x 25K DWT plus 1− 19 x 19K DWT plus 1− 1 x 17K DWT
62 ships ~ 1 Million DWT
4 x 12K DWTFleet Renewal
88
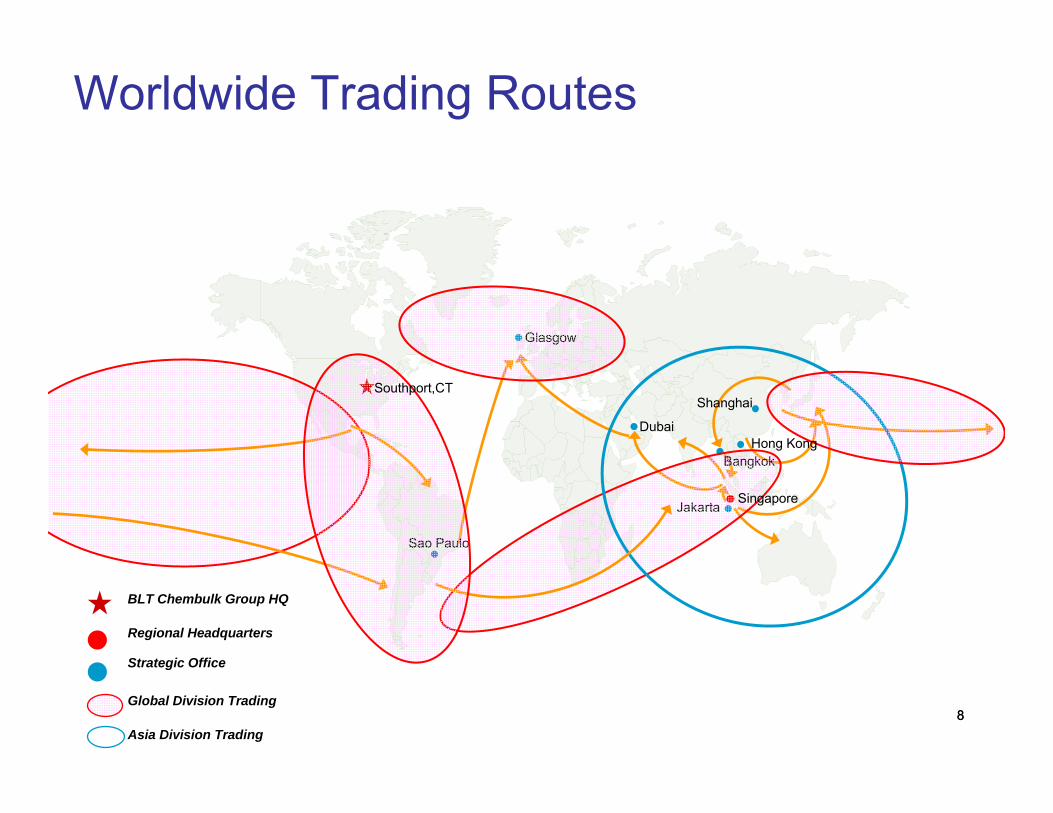
Jakarta
Bangkok
Shanghai
Glasgow
Dubai
Global Division Trading
Asia Division Trading
Worldwide Trading Routes
Strategic Office
Regional Headquarters
BLT Chembulk Group HQ
Sao Paulo
Hong Kong
Southport,CT
Singapore
Chemical Tanker Trade: An Overview
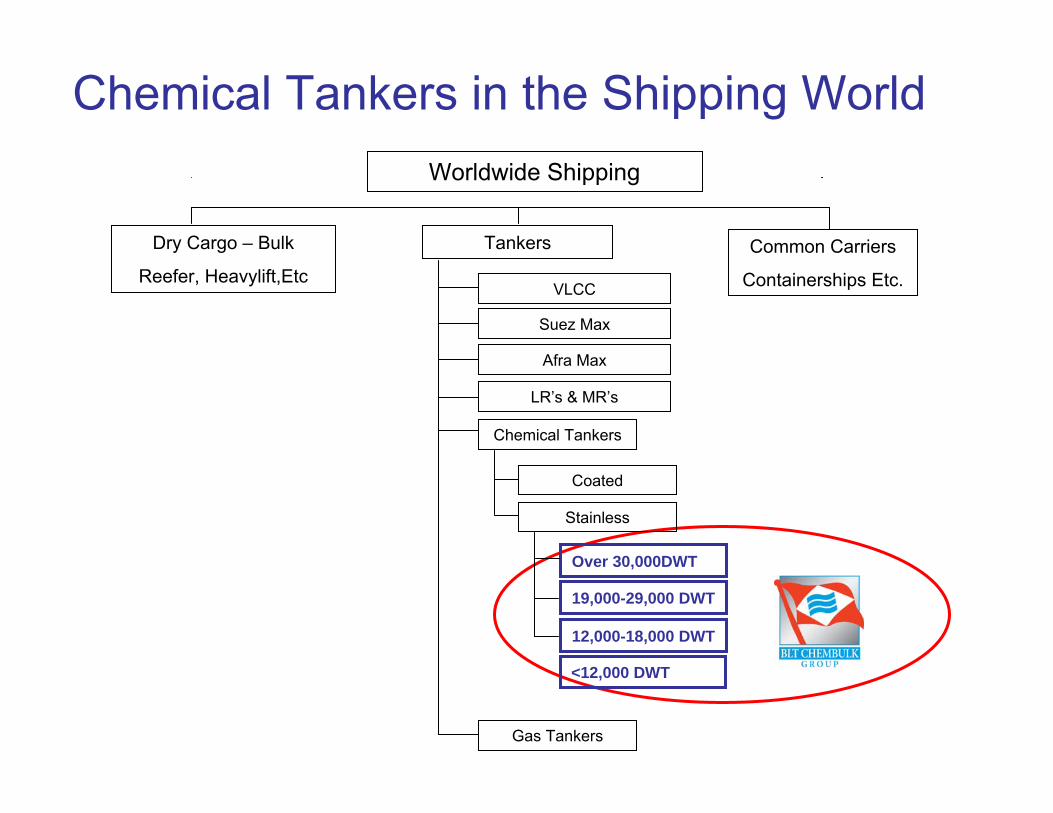
Chemical Tankers in the Shipping WorldWorldwide Shipping
Dry Cargo – Bulk
Reefer, Heavylift,EtcCommon Carriers
Containerships Etc.
Tankers
19,000-29,000 DWT
Suez Max
Afra Max
LR’s & MR’s
Chemical Tankers
Stainless
Coated
VLCC
12,000-18,000 DWT
Over 30,000DWT
Gas Tankers
<12,000 DWT
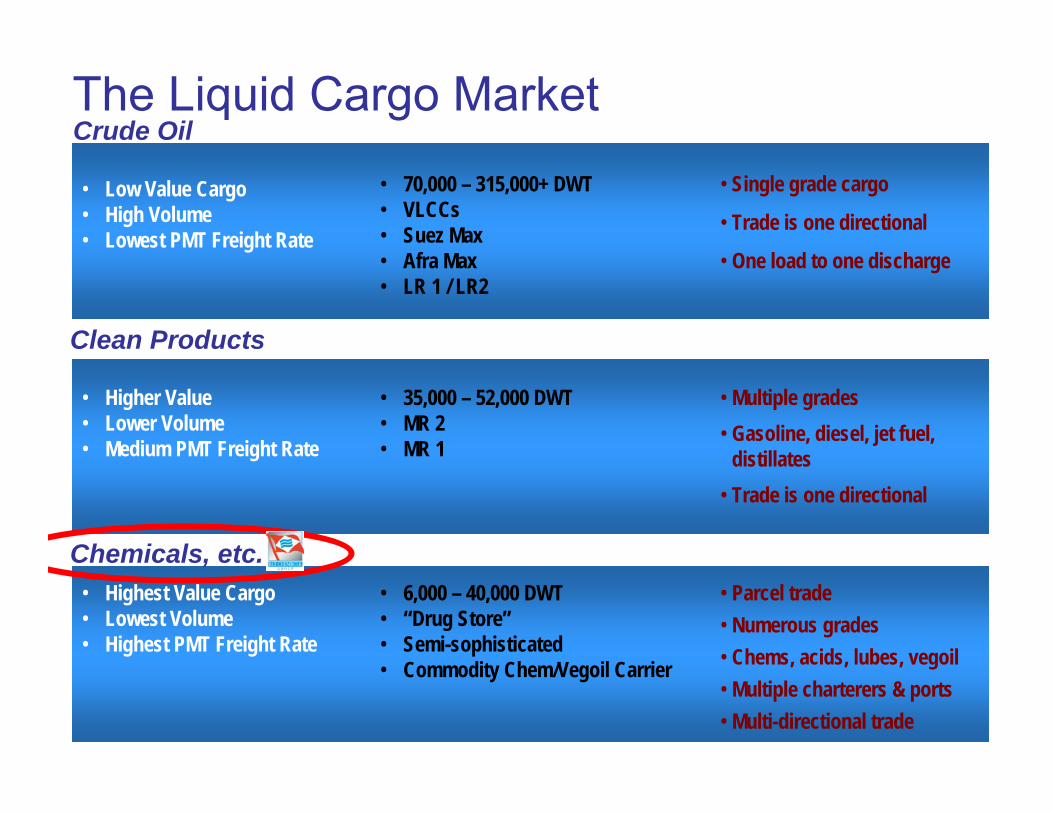
The Liquid Cargo Market
• 70,000 – 315,000+ DWT• VLCCs• Suez Max• Afra Max• LR 1 / LR2
• 35,000 – 52,000 DWT• MR 2• MR 1
• 6,000 – 40,000 DWT• “Drug Store”• Semi-sophisticated• Commodity Chem/Vegoil Carrier
• Single grade cargo
• Trade is one directional
• One load to one discharge
• Multiple grades• Gasoline, diesel, jet fuel,
distillates• Trade is one directional
• Parcel trade• Numerous grades• Chems, acids, lubes, vegoil• Multiple charterers & ports• Multi-directional trade
• Higher Value• Lower Volume• Medium PMT Freight Rate
• Low Value Cargo• High Volume• Lowest PMT Freight Rate
• Highest Value Cargo• Lowest Volume• Highest PMT Freight Rate
Crude Oil
Clean Products
Chemicals, etc.
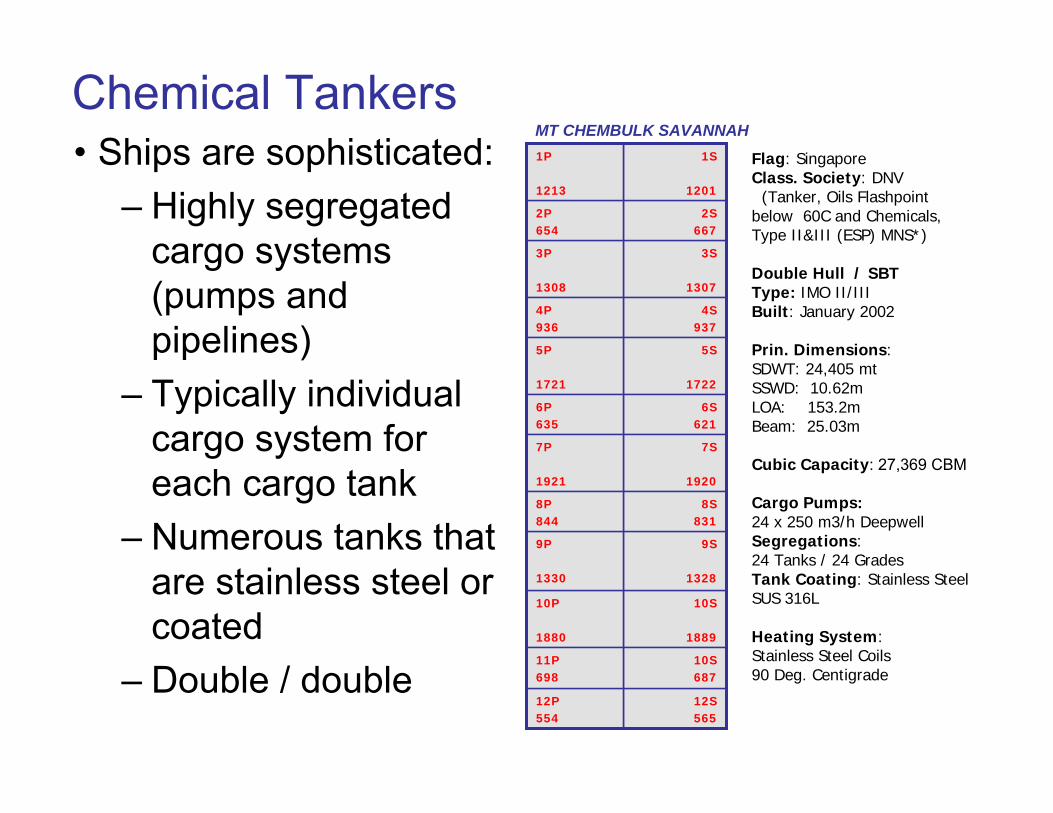
Chemical Tankers• Ships are sophisticated:
– Highly segregated cargo systems (pumps and pipelines)
– Typically individual cargo system for each cargo tank
– Numerous tanks that are stainless steel or coated
– Double / double
10S
1889
10P
1880
3S
1307
3P
1308
4S937
4P936
5S
1722
5P
1721
6S621
6P635
7S
1920
7P
1921
12S565
12P554
10S687
11P698
9S
1328
9P
1330
8S831
8P844
2S667
2P654
1S
1201
1P
1213
MT CHEMBULK SAVANNAH
Flag: SingaporeClass. Society: DNV
(Tanker, Oils Flashpoint below 60C and Chemicals, Type II&III (ESP) MNS*)
Double Hull / SBTType: IMO II/IIIBuilt: January 2002
Prin. Dimensions:SDWT: 24,405 mt SSWD: 10.62m LOA: 153.2mBeam: 25.03m
Cubic Capacity: 27,369 CBM
Cargo Pumps: 24 x 250 m3/h DeepwellSegregations: 24 Tanks / 24 GradesTank Coating: Stainless Steel SUS 316L
Heating System: Stainless Steel Coils90 Deg. Centigrade
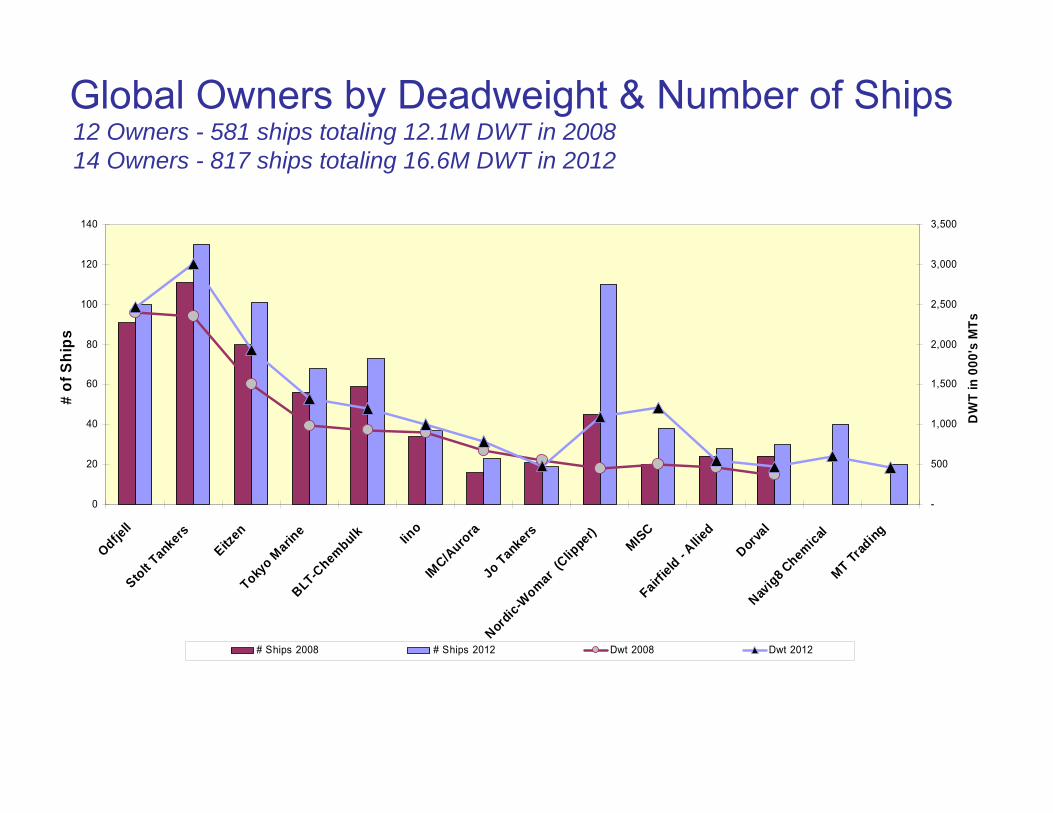
The global owning sector is an oligopoly.
Chemical Tanker Ownership
As depicted on the following graph:
• In 2008 the three largest owners operate ~52% of the total deadweight (~45% in 2012)
• ~85% of the total global deadweight is operated by just twelve companies (14 companies in 2012)
• The balance is mostly comprised of numerous smaller owners operating regionally; many in Asia
0
20
40
60
80
100
120
140
Odfjell
Stolt Tankers
Eitzen
Tokyo M
arine
BLT-Chembulk Iin
oIM
C/Auro
raJo Tankers
Nordic-W
omar (Clip
per)
MISCFairf
ield - Allie
d
Dorval
Navig8 C
hemicalMT Trad
ing
# of
Shi
ps
-
500
1,000
1,500
2,000
2,500
3,000
3,500
DW
T in
000
's M
Ts
# Ships 2008 # Ships 2012 Dwt 2008 Dwt 2012
Global Owners by Deadweight & Number of Ships12 Owners - 581 ships totaling 12.1M DWT in 200814 Owners - 817 ships totaling 16.6M DWT in 2012
Chemical Tanker IndustryA Brief History: 1959-2010
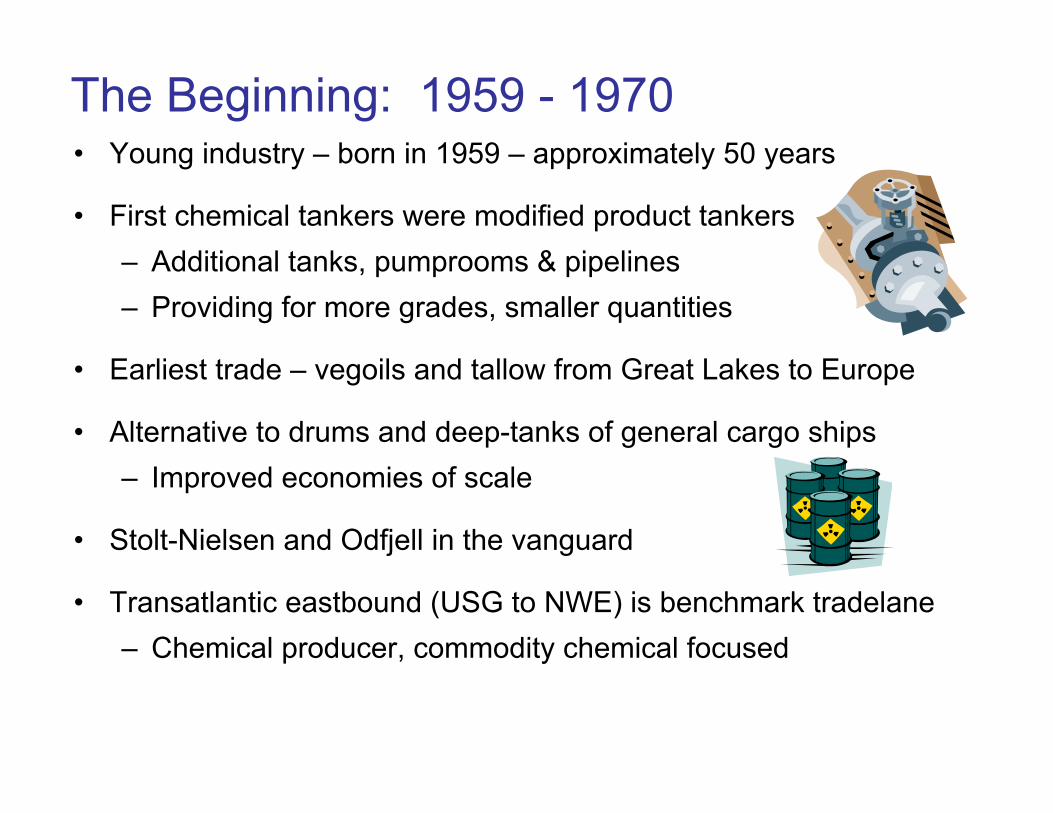
• Young industry – born in 1959 – approximately 50 years
• First chemical tankers were modified product tankers– Additional tanks, pumprooms & pipelines– Providing for more grades, smaller quantities
• Earliest trade – vegoils and tallow from Great Lakes to Europe
• Alternative to drums and deep-tanks of general cargo ships– Improved economies of scale
• Stolt-Nielsen and Odfjell in the vanguard
• Transatlantic eastbound (USG to NWE) is benchmark tradelane– Chemical producer, commodity chemical focused
The Beginning: 1959 - 1970
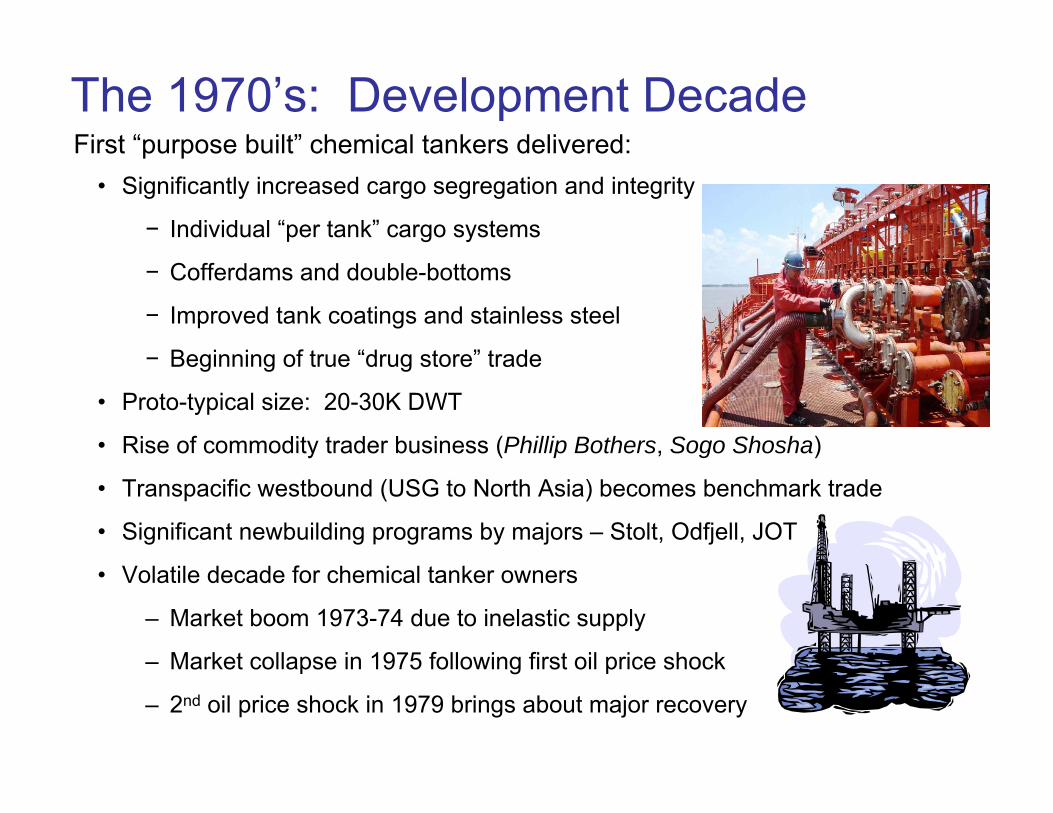
First “purpose built” chemical tankers delivered:The 1970’s: Development Decade
• Significantly increased cargo segregation and integrity
− Individual “per tank” cargo systems
− Cofferdams and double-bottoms
− Improved tank coatings and stainless steel
− Beginning of true “drug store” trade
• Proto-typical size: 20-30K DWT
• Rise of commodity trader business (Phillip Bothers, Sogo Shosha)
• Transpacific westbound (USG to North Asia) becomes benchmark trade
• Significant newbuilding programs by majors – Stolt, Odfjell, JOT
• Volatile decade for chemical tanker owners
– Market boom 1973-74 due to inelastic supply
– Market collapse in 1975 following first oil price shock
– 2nd oil price shock in 1979 brings about major recovery
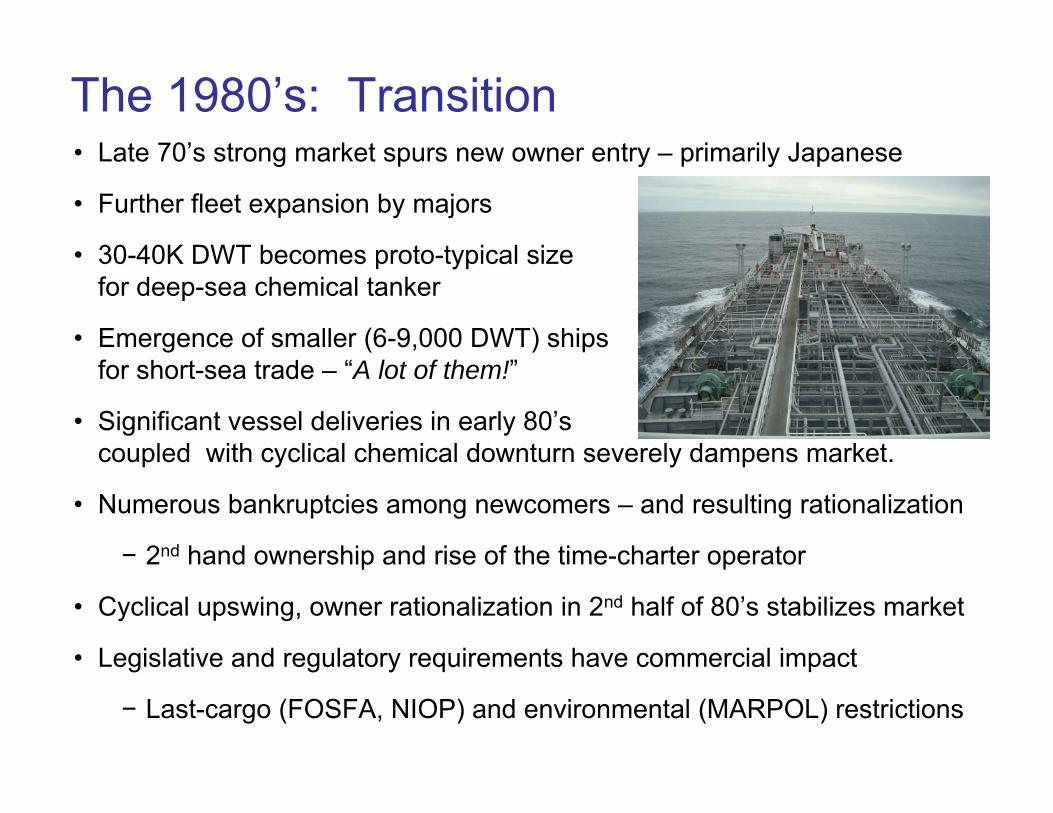
The 1980’s: Transition • Late 70’s strong market spurs new owner entry – primarily Japanese
• Further fleet expansion by majors
• 30-40K DWT becomes proto-typical size for deep-sea chemical tanker
• Emergence of smaller (6-9,000 DWT) ships for short-sea trade – “A lot of them!”
• Significant vessel deliveries in early 80’s coupled with cyclical chemical downturn severely dampens market.
• Numerous bankruptcies among newcomers – and resulting rationalization
− 2nd hand ownership and rise of the time-charter operator
• Cyclical upswing, owner rationalization in 2nd half of 80’s stabilizes market
• Legislative and regulatory requirements have commercial impact
− Last-cargo (FOSFA, NIOP) and environmental (MARPOL) restrictions
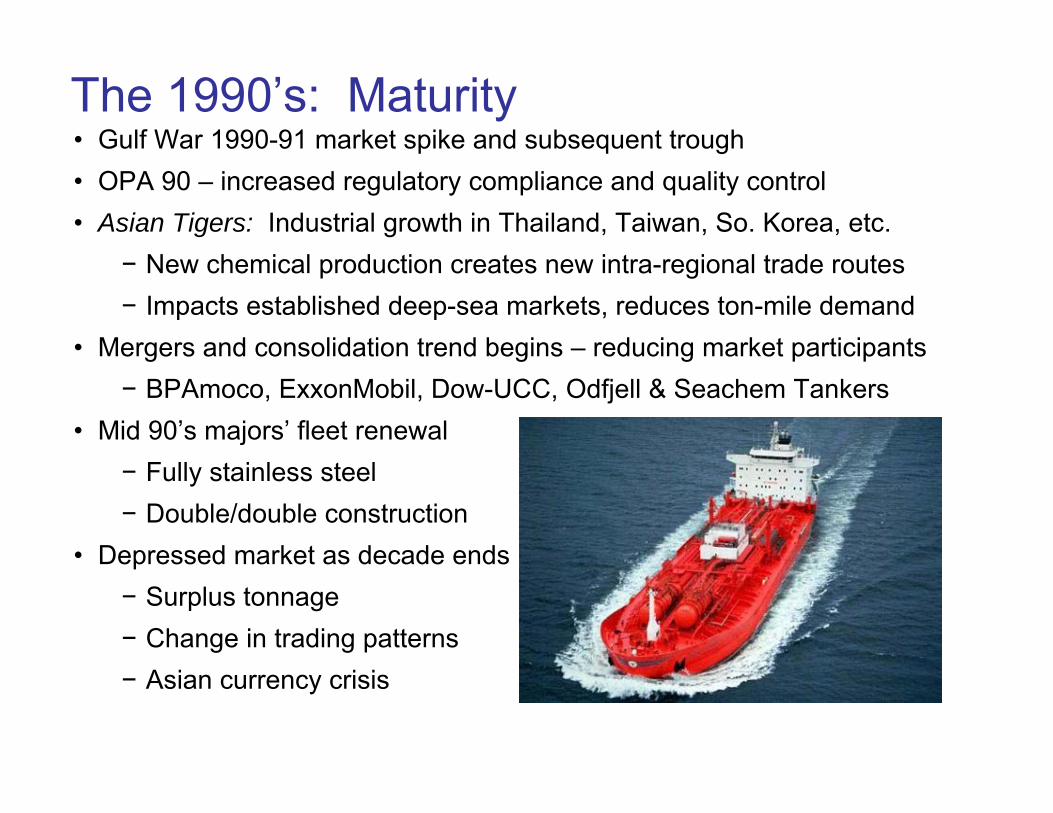
The 1990’s: Maturity• Gulf War 1990-91 market spike and subsequent trough• OPA 90 – increased regulatory compliance and quality control• Asian Tigers: Industrial growth in Thailand, Taiwan, So. Korea, etc.
− New chemical production creates new intra-regional trade routes− Impacts established deep-sea markets, reduces ton-mile demand
• Mergers and consolidation trend begins – reducing market participants− BPAmoco, ExxonMobil, Dow-UCC, Odfjell & Seachem Tankers
• Mid 90’s majors’ fleet renewal− Fully stainless steel − Double/double construction
• Depressed market as decade ends− Surplus tonnage− Change in trading patterns− Asian currency crisis
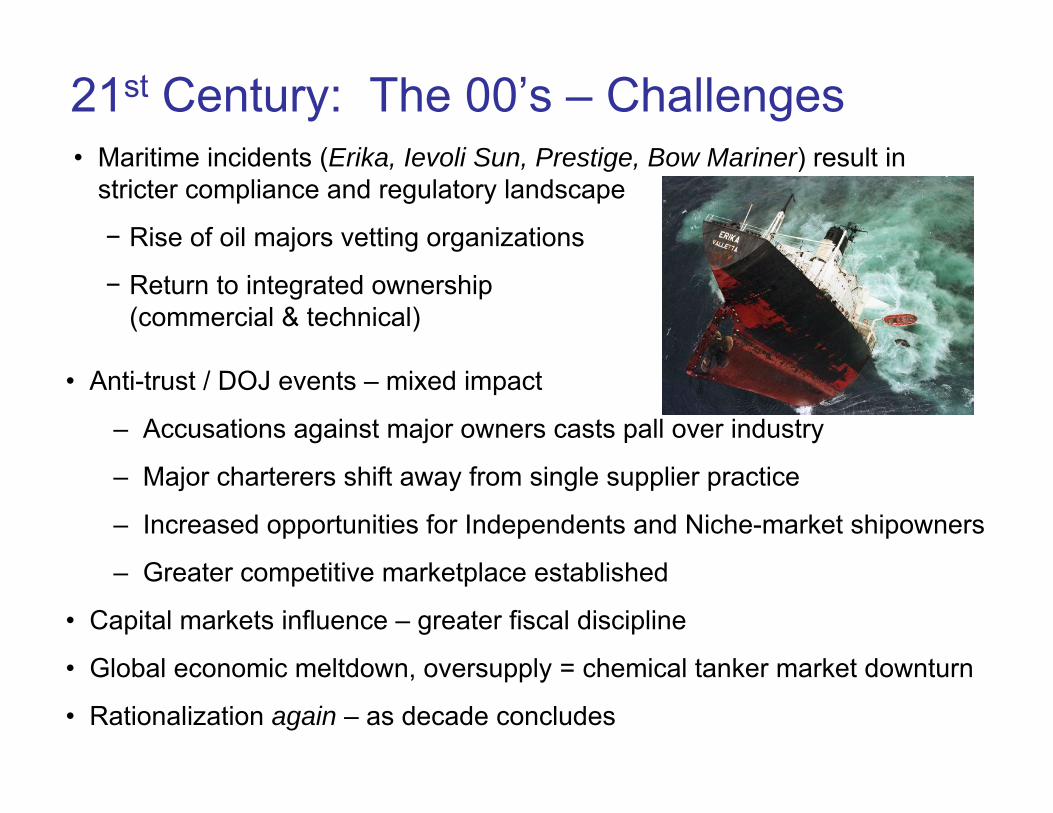
21st Century: The 00’s – Challenges • Maritime incidents (Erika, Ievoli Sun, Prestige, Bow Mariner) result in
stricter compliance and regulatory landscape
• Anti-trust / DOJ events – mixed impact
– Accusations against major owners casts pall over industry
– Major charterers shift away from single supplier practice
– Increased opportunities for Independents and Niche-market shipowners
– Greater competitive marketplace established
• Capital markets influence – greater fiscal discipline
• Global economic meltdown, oversupply = chemical tanker market downturn
• Rationalization again – as decade concludes
− Rise of oil majors vetting organizations
− Return to integrated ownership (commercial & technical)
The Role of the Chemical Tanker in Everyday Life
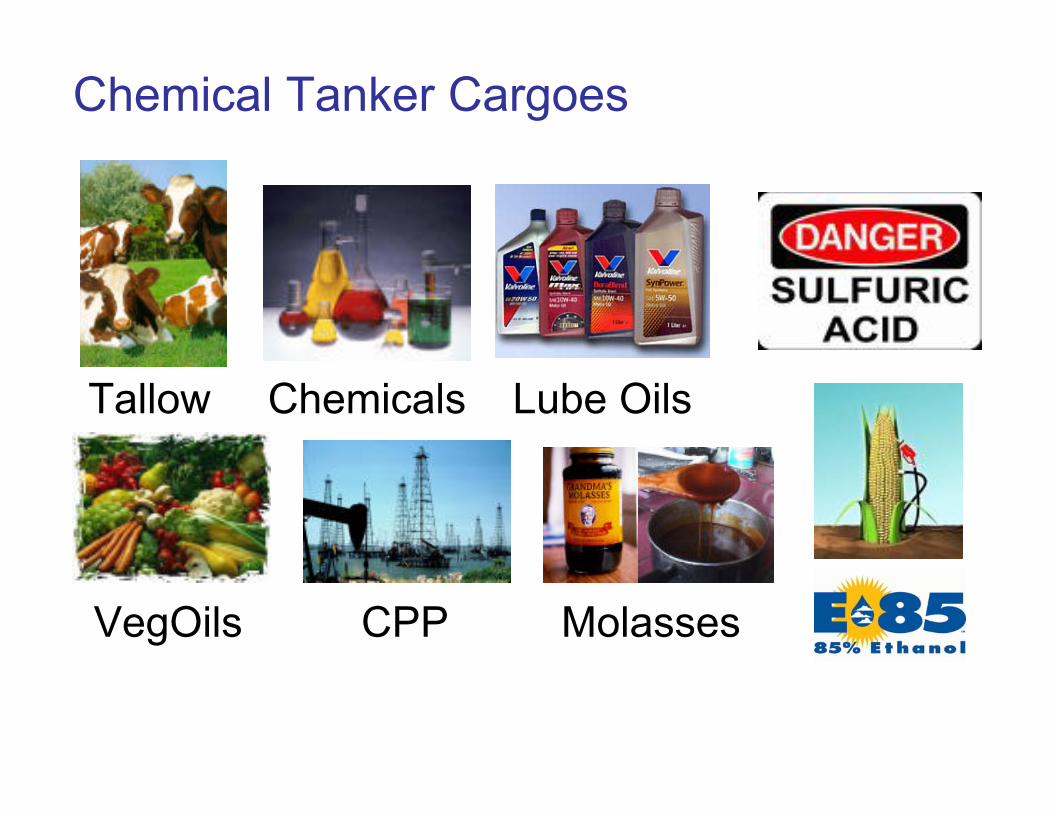
Tallow Chemicals
MolassesCPPVegOils
Lube Oils
Chemical Tanker Cargoes
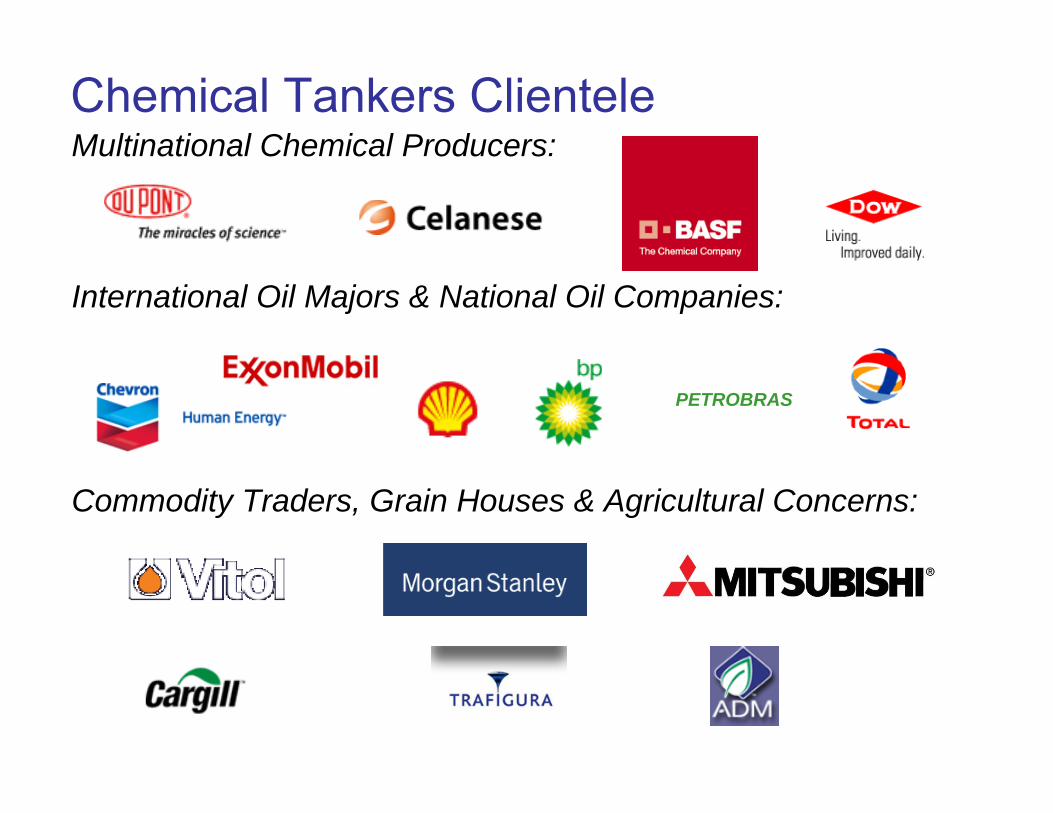
Chemical Tankers Clientele
Commodity Traders, Grain Houses & Agricultural Concerns:
PETROBRAS
Multinational Chemical Producers:
International Oil Majors & National Oil Companies:
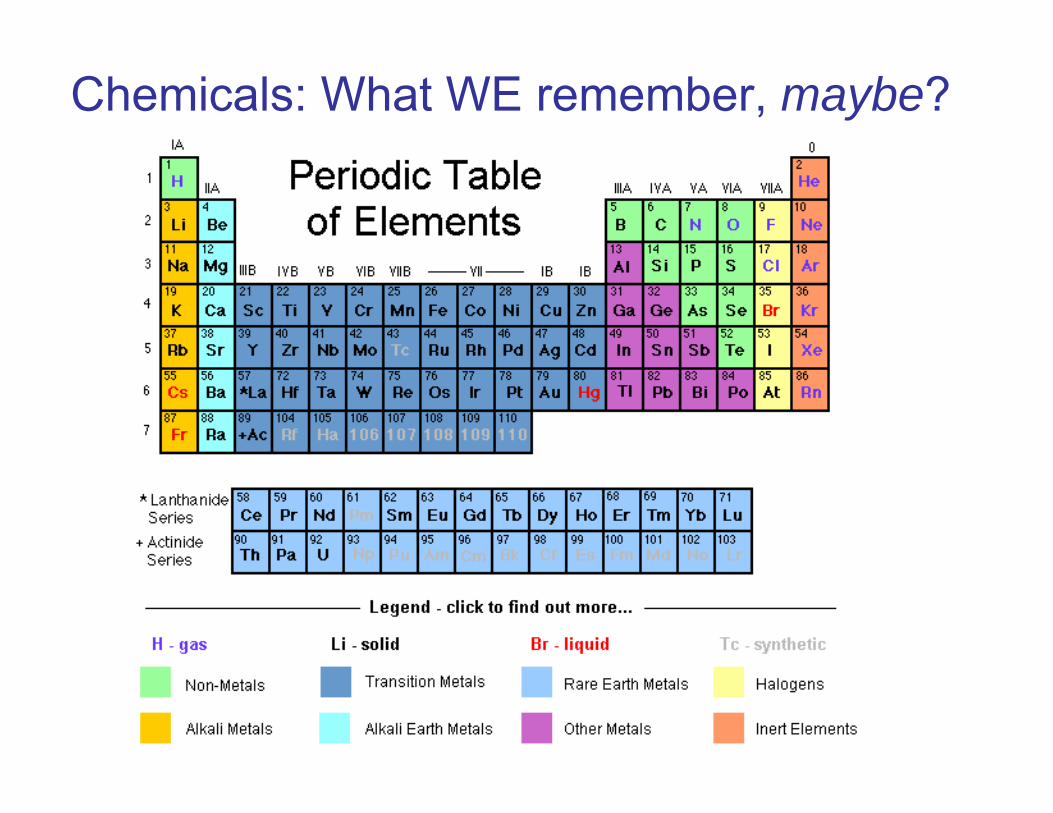
Chemicals: What WE remember, maybe?
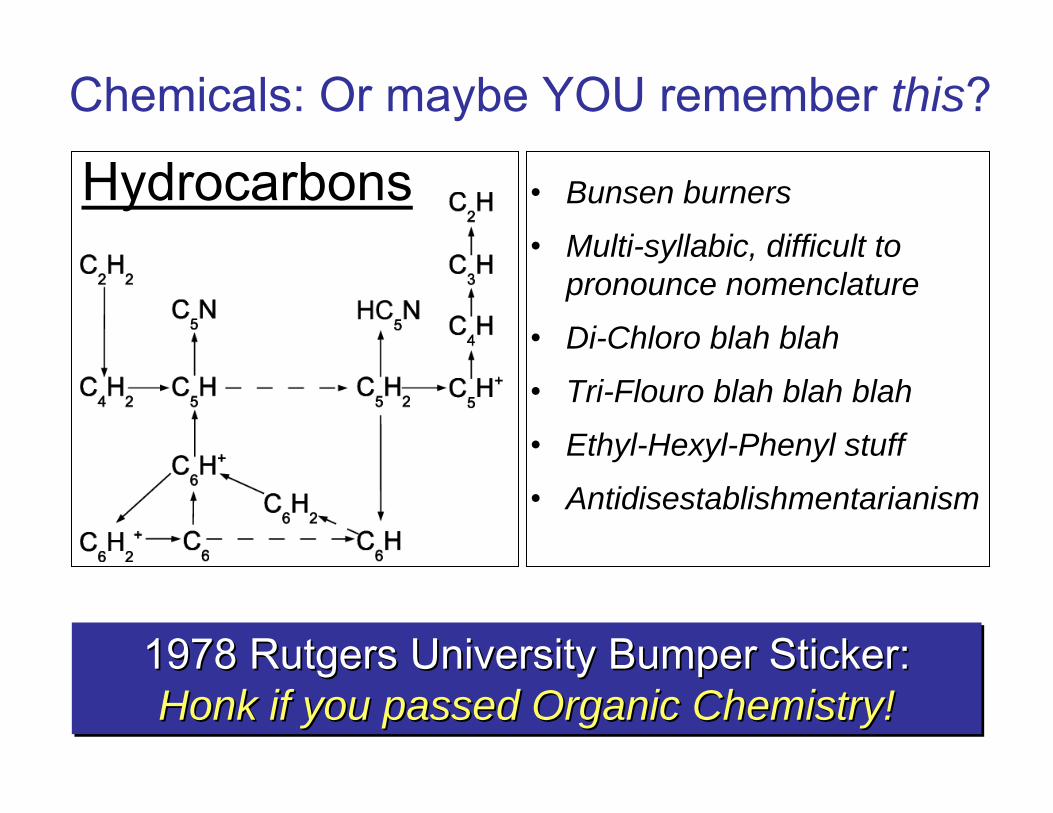
Chemicals: Or maybe YOU remember this?
• Bunsen burners
• Multi-syllabic, difficult to pronounce nomenclature
• Di-Chloro blah blah
• Tri-Flouro blah blah blah
• Ethyl-Hexyl-Phenyl stuff
• Antidisestablishmentarianism
1978 Rutgers University Bumper Sticker: Honk if you passed Organic Chemistry!
1978 Rutgers University Bumper Sticker: 1978 Rutgers University Bumper Sticker: Honk if you passed Organic Chemistry!Honk if you passed Organic Chemistry!
Hydrocarbons

Chemicals – What THEY Think Now
So, we chemical tanker operators are perceived to be some of the Bad Guys!So, we chemical tanker operators are So, we chemical tanker operators are
perceived to be some of the perceived to be some of the Bad Guys!Bad Guys!
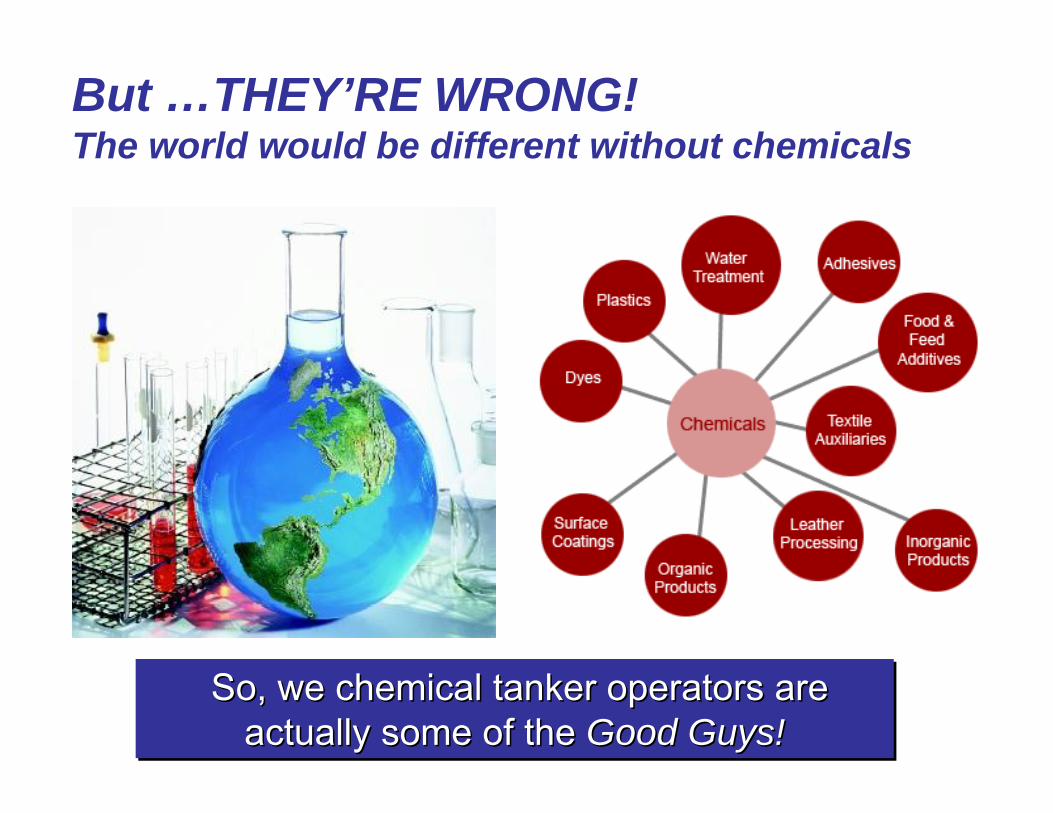
But …THEY’RE WRONG!The world would be different without chemicals
So, we chemical tanker operators are actually some of the Good Guys!
So, we chemical tanker operators are So, we chemical tanker operators are actually some of the actually some of the Good Guys!Good Guys!
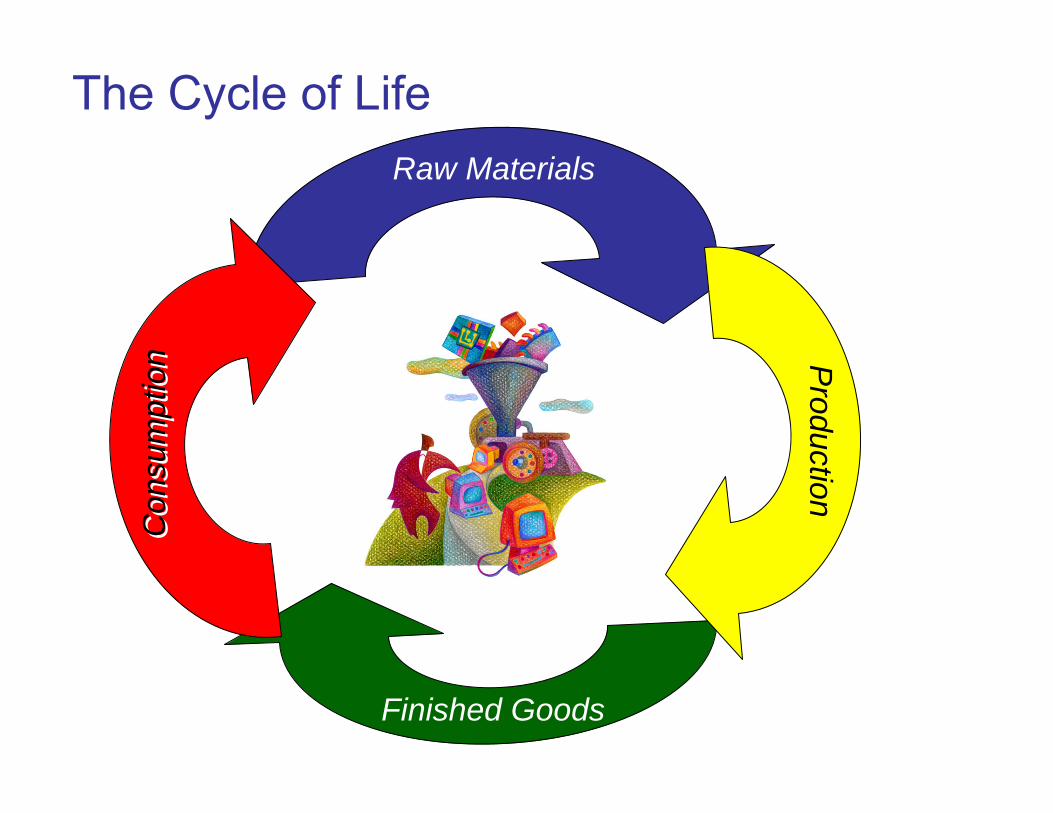
The Cycle of Life
Finished Goods
Raw Materials
Production
Con
sum
ptio
nC
onsu
mpt
ion
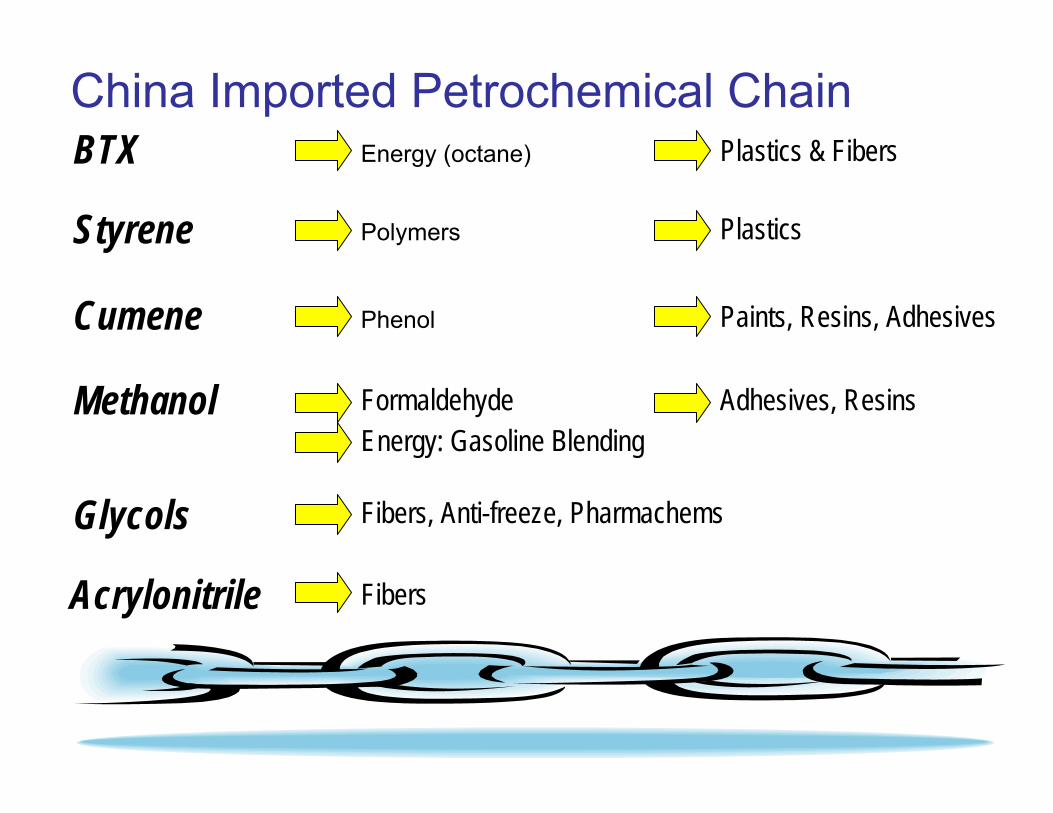
China Imported Petrochemical Chain
Glycols Fibers, Anti-freeze, Pharmachems
Acrylonitrile Fibers
Methanol Formaldehyde Adhesives, ResinsEnergy: Gasoline Blending
BTX Plastics & FibersEnergy (octane)
Styrene PlasticsPolymers
Cumene Paints, Resins, AdhesivesPhenol

China Chemical Production & Export Chain Plastics & Fibers Automotive production
Everyday consumer goodsFurnitureClothing
Resins & Adhesives Housing materialsManufacture of PlywoodPaints
Pharmachems PharmaceuticalsHealth & Beauty Aids
Caustic Soda AluminumPaper

South American Import Chain
Lubricating Oils Industrial & Automotive
Inorganic Acid Fertilizer
Acetyls
Acrylates
Styrene Plastics
GlycolsFibers
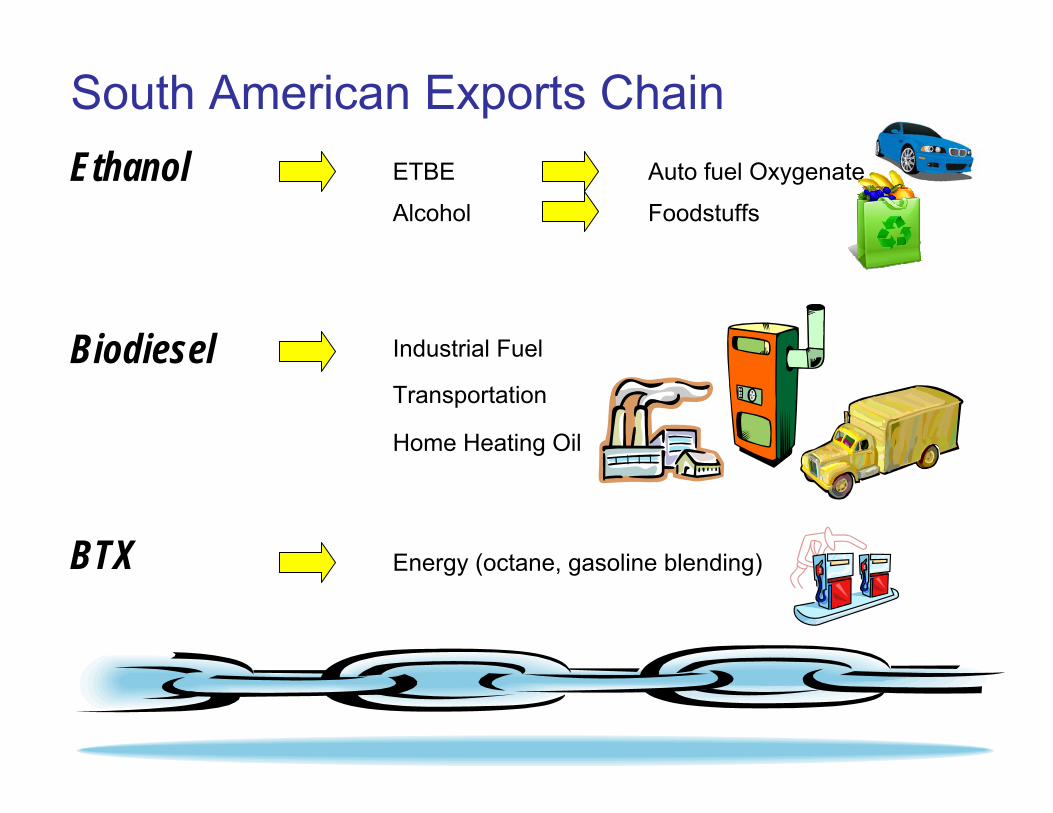
South American Exports Chain Ethanol ETBE
Alcohol
Auto fuel Oxygenate
Foodstuffs
Biodiesel Industrial Fuel
Transportation
Home Heating Oil
BTX Energy (octane, gasoline blending)
The Chemical Tanker TradeWhere are we today ?Where are we going ?
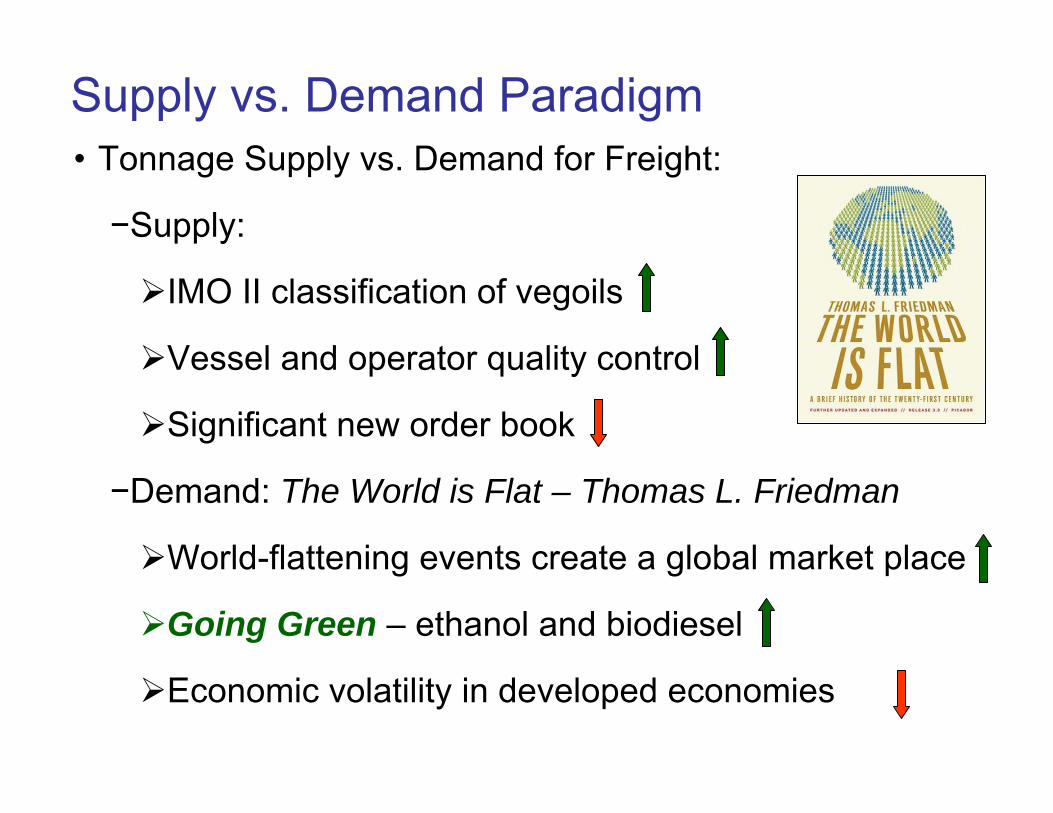
Supply vs. Demand Paradigm • Tonnage Supply vs. Demand for Freight:
−Supply:
IMO II classification of vegoils
Vessel and operator quality control
Significant new order book
−Demand: The World is Flat – Thomas L. Friedman
World-flattening events create a global market place
Going Green – ethanol and biodiesel
Economic volatility in developed economies
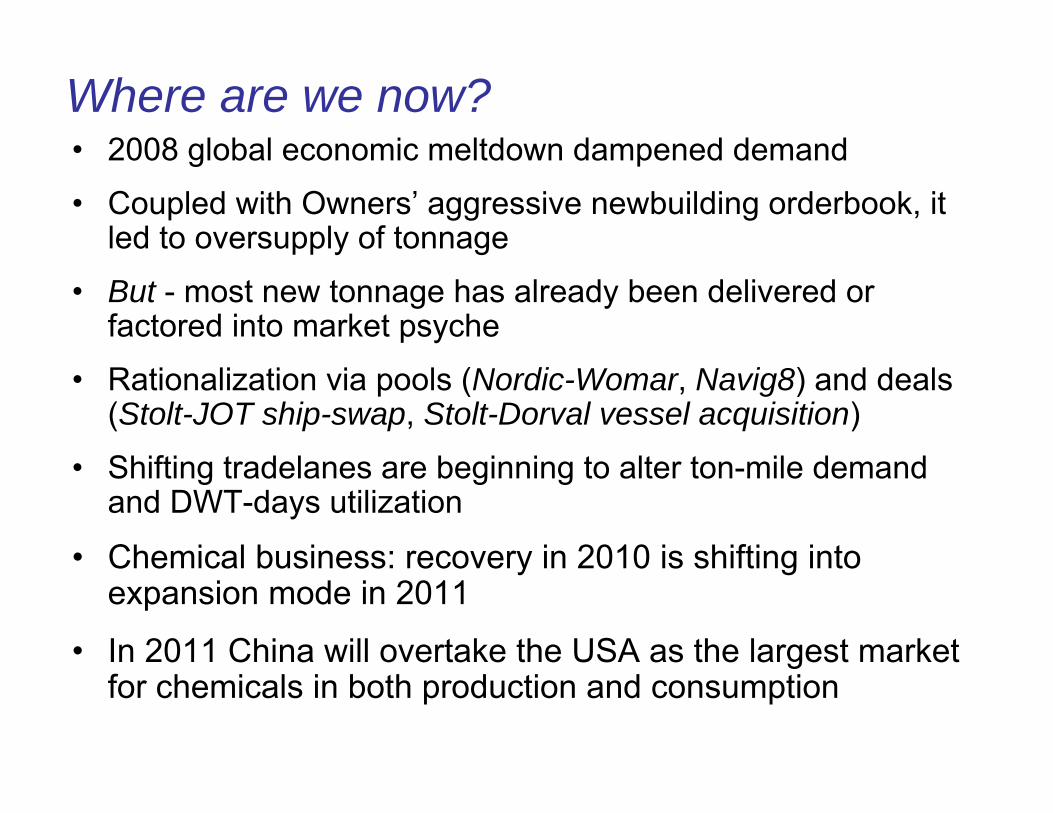
Where are we now? • 2008 global economic meltdown dampened demand
• Coupled with Owners’ aggressive newbuilding orderbook, it led to oversupply of tonnage
• But - most new tonnage has already been delivered or factored into market psyche
• Rationalization via pools (Nordic-Womar, Navig8) and deals (Stolt-JOT ship-swap, Stolt-Dorval vessel acquisition)
• Shifting tradelanes are beginning to alter ton-mile demand and DWT-days utilization
• Chemical business: recovery in 2010 is shifting into expansion mode in 2011
• In 2011 China will overtake the USA as the largest market for chemicals in both production and consumption

Chemical Tanker Demand by Tradelane(In millions of metric tons)
0.0
2.0
4.0
6.0
8.0
10.0
12.0
14.0
16.0
18.0
20.0
N Am
erica
to N
Asia
N Asia
to th
e Am
erica
sSE
Asia
to U
SA
Asia to
Eur
ope (
Chem
s)
Asia to
Eur
ope (
Veg)
Amer
icas
to E
urop
e
Euro
pe to
the A
mer
icas
Intra
-Amer
icas
USA to
Afri
ca &
Indi
an O
ean
Euro
pe to
Nor
th A
siaME G
ulf t
o USA
ME Gul
f to
Europ
e
ME Gul
f to
North
Asia
ME Gul
f to
Indi
an S
ubco
ntME G
ulf t
o SE
Asia
Major Trade Route
Mill
ions
MTs 2008
2012
Source: Richardson Lawrie Associates
Total worldwide demand 2008 – 87.7MTotal worldwide demand 2008 – 87.7M
Total worldwide demand 2012 – 105.2MTotal worldwide demand 2012 – 105.2M
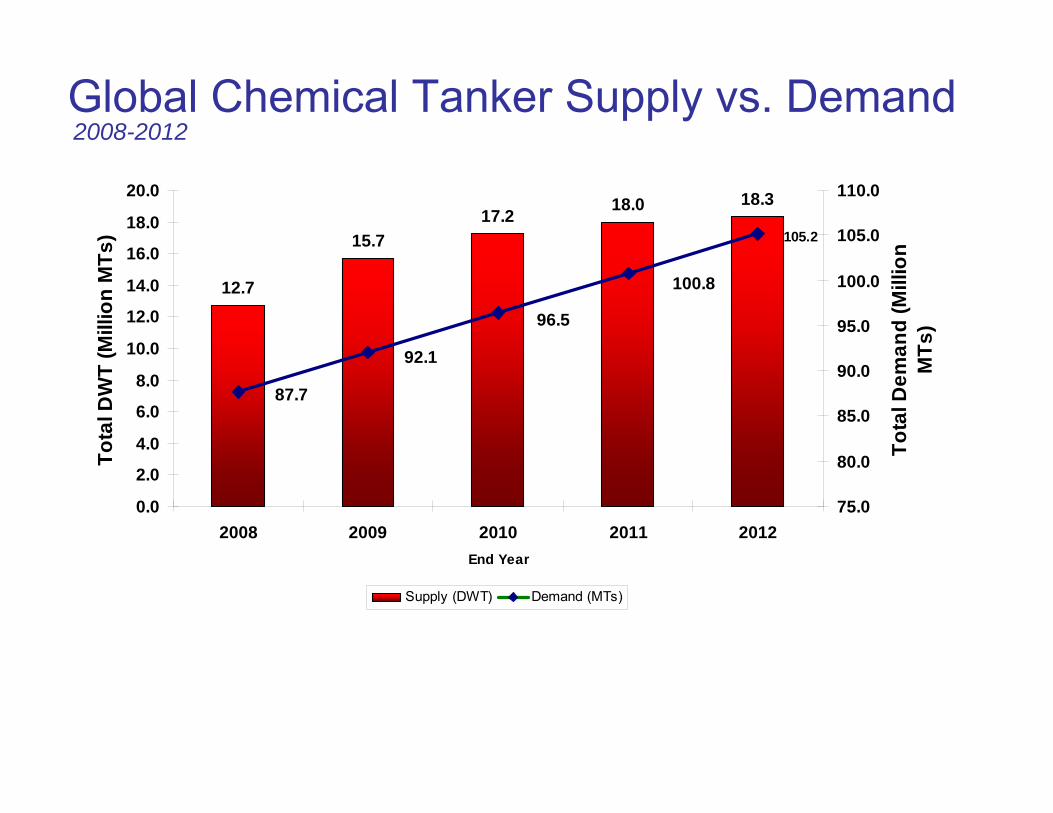
12.7
15.717.2 18.0 18.3
87.7
92.1
96.5
100.8
105.2
0.0
2.0
4.0
6.0
8.0
10.0
12.0
14.0
16.0
18.0
20.0
2008 2009 2010 2011 2012End Year
Tota
l DW
T (M
illio
n M
Ts)
75.0
80.0
85.0
90.0
95.0
100.0
105.0
110.0
Tota
l Dem
and
(Mill
ion
MTs
)
Supply (DWT) Demand (MTs)
Global Chemical Tanker Supply vs. Demand2008-2012

Year on Year Percentage Change
-3.3%
+5.1%
+5.4%
+8.8%
+7.7%
+8.4%
+12.2%
-5.0%
0.0%
5.0%
10.0%
15.0%
20.0%
25.0%
30.0%
2008 2009 2010 2011 2012
Cum
ulat
ive
Perc
enta
ge C
hang
e vs
200
8 (G
loba
l) or
200
9 (E
mer
ging
Mar
kets
)
Global Chemical Production Emerging Markets Chemical Production
Where are we going ?Chemical Production Growth 2008-2012
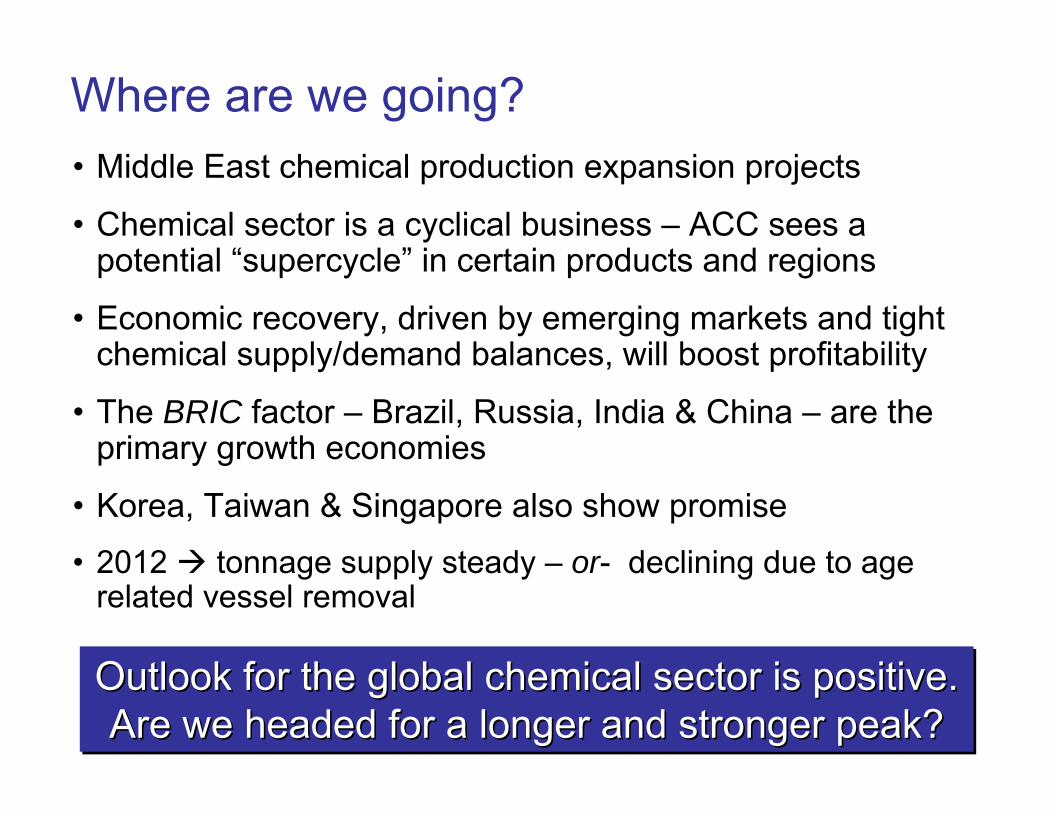
• Middle East chemical production expansion projects
• Chemical sector is a cyclical business – ACC sees a potential “supercycle” in certain products and regions
• Economic recovery, driven by emerging markets and tight chemical supply/demand balances, will boost profitability
• The BRIC factor – Brazil, Russia, India & China – are the primary growth economies
• Korea, Taiwan & Singapore also show promise
• 2012 tonnage supply steady – or- declining due to age related vessel removal
Where are we going?
Outlook for the global chemical sector is positive.Are we headed for a longer and stronger peak?
Outlook for the global chemical sector is positive.Outlook for the global chemical sector is positive.Are we headed for a longer and stronger peak?Are we headed for a longer and stronger peak?
Sources for the data presented herein include:
• American Chemistry Council
• Clarksons
• Eastport Maritime
• Quincannon Associates
• Richardson Lawrie Associates
• Simpson, Spence & Young
• Sound Tanker Chartering
Acknowledgements
Thank you for your time today!Thank you for your time today!Thank you for your time today!


![[BLT] 특허권의내용과명세서의이해_김성현_20160824_v2](https://static.fdocument.pub/doc/165x107/58735df41a28abe7648b4f7b/blt-20160824v2-58bd808549376.jpg)

![[Blt] 2014년 정부지원사업12월](https://static.fdocument.pub/doc/165x107/559cebdc1a28ab2b708b4788/blt-2014-12.jpg)


![[BLT] 창업과 지식재산](https://static.fdocument.pub/doc/165x107/5592e7321a28ab1f698b4701/blt-5592e7321a28ab1f698b4701.jpg)


![[BLT] 브랜드 네이밍 사례 - BLT 브랜드 네이밍 연구소 (엄정한 변리사)](https://static.fdocument.pub/doc/165x107/58a3fc3b1a28ab64528b57fd/blt-blt-.jpg)
![[BLT] 지식재산권 기초강의](https://static.fdocument.pub/doc/165x107/557ef825d8b42ad17d8b5064/blt-557ef825d8b42ad17d8b5064.jpg)