The New York Knowledge Initiative … libraries opening doors to knowledge for all New Yorkers...
18
The New York Knowledge Initiative … libraries opening doors to knowledge for all New Yorkers Libraries are uniquely positioned to close the gap at all levels – they deliver knowledge resources directly to New Yorkers and have skilled staff to help access and use them, but... New York lags behind other states in funding for its online library. In fact, NOVEL - New York’s first statewide virtual library - is supported entirely by temporary federal LSTA funds. There is no state support to grow or sustain this cost-effective program despite the fact that for every $1 spent on NOVEL, local libraries would pay $30 if they were to purchase these resources themselves. 40% of schools remain without access to NOVEL. New York State’s public libraries have a combined $1.7 billion need for construction and renovation. Many are inaccessible to those with disabilities, or are located in a crumbling and unsafe facility, or are unable to accommodate current computer and Internet technology. The New York Knowledge Initiative would provide: $10 million to grow and sustain NOVEL, including providing advanced R&D resources; more math, science, and technology resources for K-16; and better access for schools. $14 million for Public Library Construction Grants to help renovate and upgrade public library facilities. 1
-
date post
19-Dec-2015 -
Category
Documents
-
view
217 -
download
0
Transcript of The New York Knowledge Initiative … libraries opening doors to knowledge for all New Yorkers...
The New York Knowledge Initiative
… libraries opening doors to knowledge for all New Yorkers
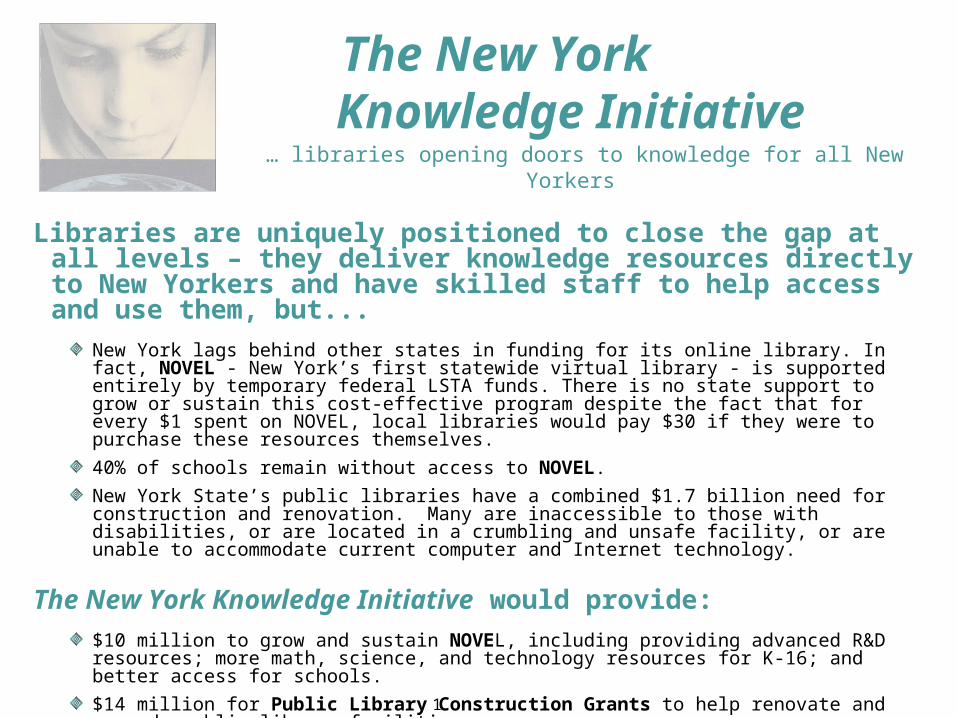
Libraries are uniquely positioned to close the gap at all levels – they deliver knowledge resources directly to New Yorkers and have skilled staff to help access and use them, but...
New York lags behind other states in funding for its online library. In fact, NOVEL - New York’s first statewide virtual library - is supported entirely by temporary federal LSTA funds. There is no state support to grow or sustain this cost-effective program despite the fact that for every $1 spent on NOVEL, local libraries would pay $30 if they were to purchase these resources themselves.
40% of schools remain without access to NOVEL.
New York State’s public libraries have a combined $1.7 billion need for construction and renovation. Many are inaccessible to those with disabilities, or are located in a crumbling and unsafe facility, or are unable to accommodate current computer and Internet technology.
The New York Knowledge Initiative would provide:
$10 million to grow and sustain NOVEL, including providing advanced R&D resources; more math, science, and technology resources for K-16; and better access for schools.
$14 million for Public Library Construction Grants to help renovate and upgrade public library facilities.
$3 million for library systems to support cost-effective access to knowledge resources and resource sharing for New York’s public, school, academic, and special libraries.
1
Access to Education in Museums … Museums opening doors to
knowledge for all New Yorkers
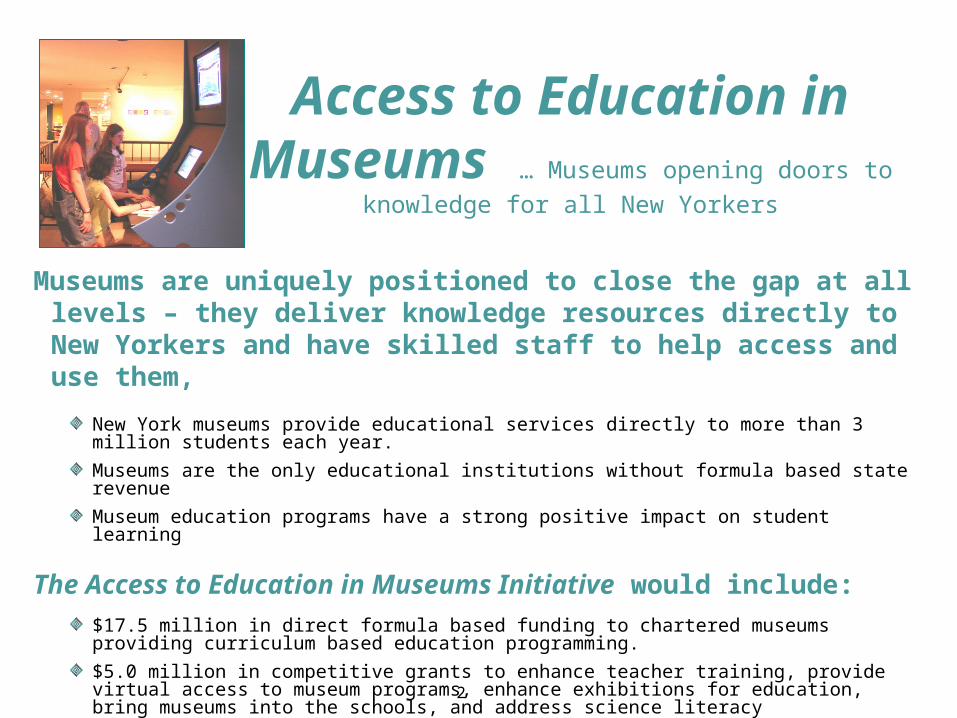
Museums are uniquely positioned to close the gap at all levels – they deliver knowledge resources directly to New Yorkers and have skilled staff to help access and use them,
New York museums provide educational services directly to more than 3 million students each year.
Museums are the only educational institutions without formula based state revenue
Museum education programs have a strong positive impact on student learning
The Access to Education in Museums Initiative would include:
$17.5 million in direct formula based funding to chartered museums providing curriculum based education programming.
$5.0 million in competitive grants to enhance teacher training, provide virtual access to museum programs, enhance exhibitions for education, bring museums into the schools, and address science literacy
$5.0 million for competitive grants for performing arts institutions providing educational programming to students.
2
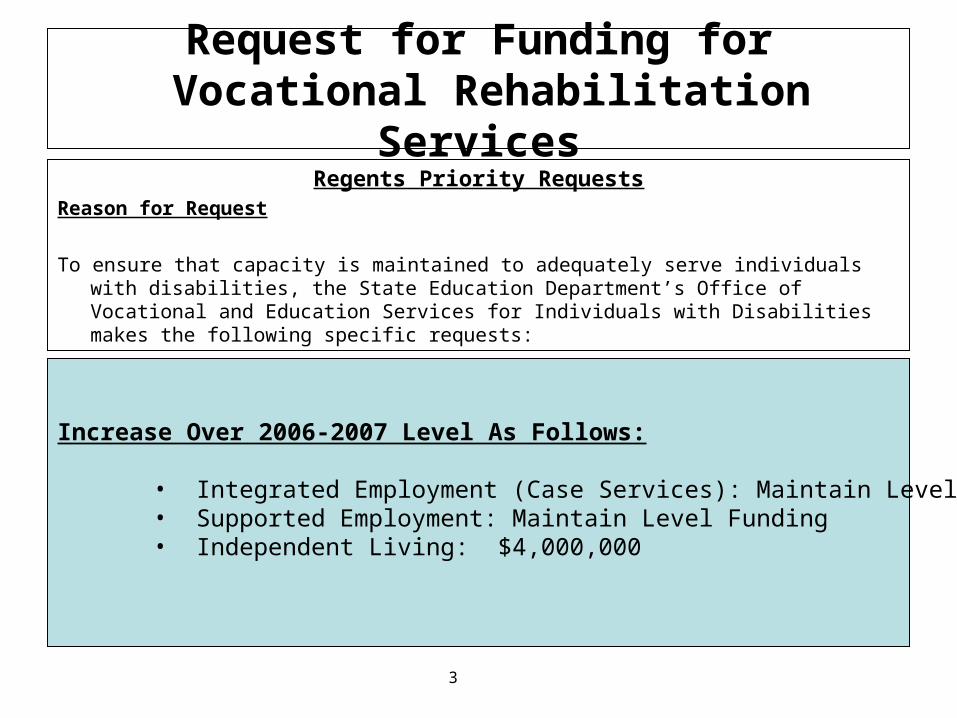
Request for Funding for Vocational Rehabilitation Services
Regents Priority RequestsReason for Request
To ensure that capacity is maintained to adequately serve individuals with disabilities, the State Education Department’s Office of Vocational and Education Services for Individuals with Disabilities makes the following specific requests:
Increase Over 2006-2007 Level As Follows:
• Integrated Employment (Case Services): Maintain Level Funding• Supported Employment: Maintain Level Funding• Independent Living: $4,000,000
3
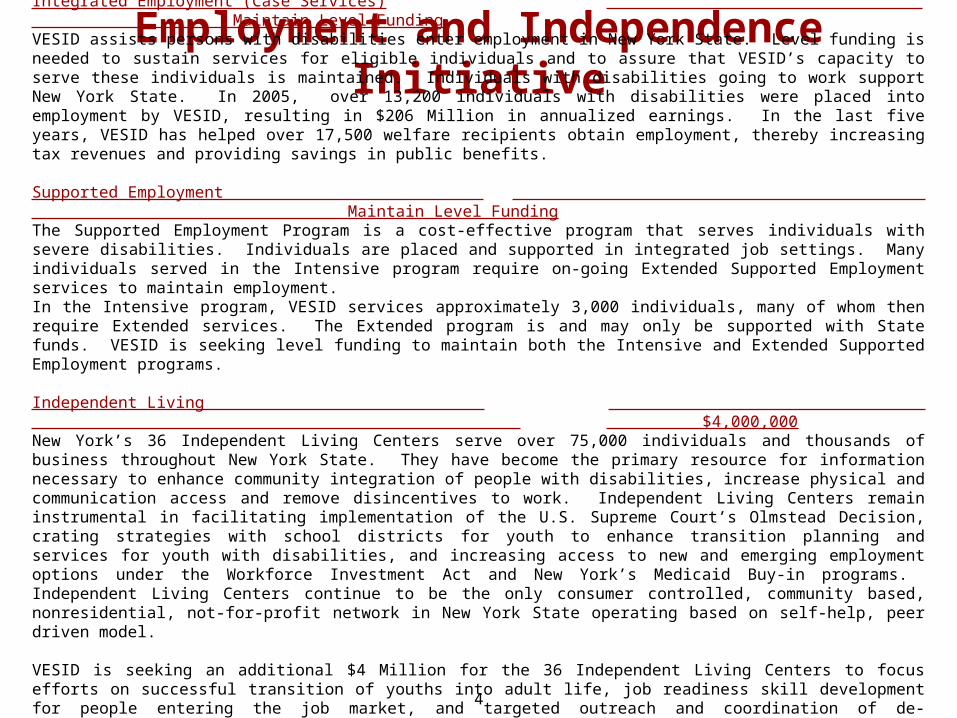
Employment and Independence InitiativeIntegrated Employment (Case Services) Maintain Level FundingVESID assists persons with disabilities enter employment in New York State. Level funding is needed to sustain services for eligible individuals and to assure that VESID’s capacity to serve these individuals is maintained. Individuals with disabilities going to work support New York State. In 2005, over 13,200 individuals with disabilities were placed into employment by VESID, resulting in $206 Million in annualized earnings. In the last five years, VESID has helped over 17,500 welfare recipients obtain employment, thereby increasing tax revenues and providing savings in public benefits.
Supported Employment Maintain Level FundingThe Supported Employment Program is a cost-effective program that serves individuals with severe disabilities. Individuals are placed and supported in integrated job settings. Many individuals served in the Intensive program require on-going Extended Supported Employment services to maintain employment. In the Intensive program, VESID services approximately 3,000 individuals, many of whom then require Extended services. The Extended program is and may only be supported with State funds. VESID is seeking level funding to maintain both the Intensive and Extended Supported Employment programs.
Independent Living $4,000,000New York’s 36 Independent Living Centers serve over 75,000 individuals and thousands of business throughout New York State. They have become the primary resource for information necessary to enhance community integration of people with disabilities, increase physical and communication access and remove disincentives to work. Independent Living Centers remain instrumental in facilitating implementation of the U.S. Supreme Court’s Olmstead Decision, crating strategies with school districts for youth to enhance transition planning and services for youth with disabilities, and increasing access to new and emerging employment options under the Workforce Investment Act and New York’s Medicaid Buy-in programs. Independent Living Centers continue to be the only consumer controlled, community based, nonresidential, not-for-profit network in New York State operating based on self-help, peer driven model. VESID is seeking an additional $4 Million for the 36 Independent Living Centers to focus efforts on successful transition of youths into adult life, job readiness skill development for people entering the job market, and targeted outreach and coordination of de-institutionalization for New Yorkers with disabilities.
4
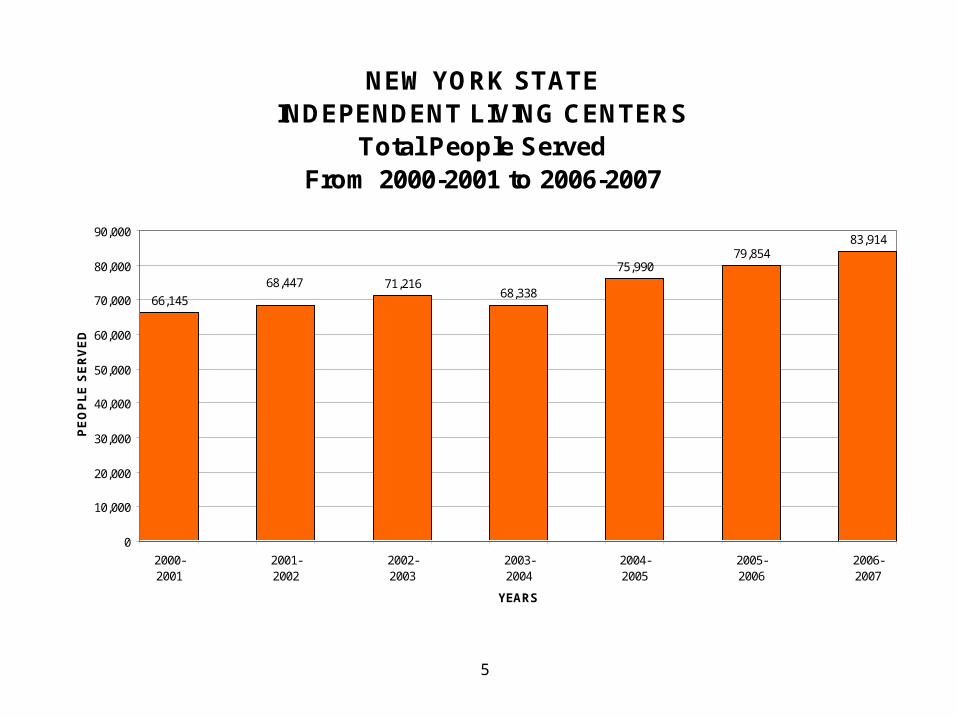
NEW YORK STATEINDEPENDENT LIVING CENTERS
Total People ServedFrom 2000-2001 to 2006-2007
66,14571,216
68,338
75,99079,854
83,914
68,447
0
10,000
20,000
30,000
40,000
50,000
60,000
70,000
80,000
90,000
2000-2001
2001-2002
2002-2003
2003-2004
2004-2005
2005-2006
2006-2007
YEARS
PE
OP
LE
SE
RV
ED
5
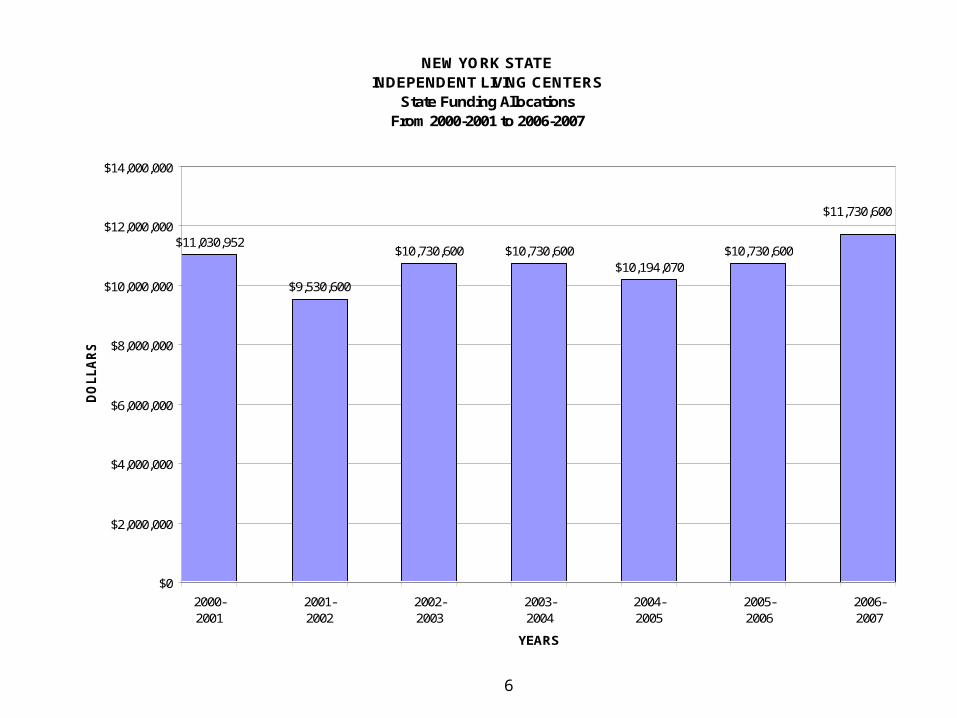
NEW YORK STATEINDEPENDENT LIVING CENTERS
State Funding AllocationsFrom 2000-2001 to 2006-2007
$11,030,952
$9,530,600
$10,730,600 $10,730,600$10,194,070
$10,730,600
$11,730,600
$0
$2,000,000
$4,000,000
$6,000,000
$8,000,000
$10,000,000
$12,000,000
$14,000,000
2000-2001
2001-2002
2002-2003
2003-2004
2004-2005
2005-2006
2006-2007
YEARS
DO
LL
AR
S
6
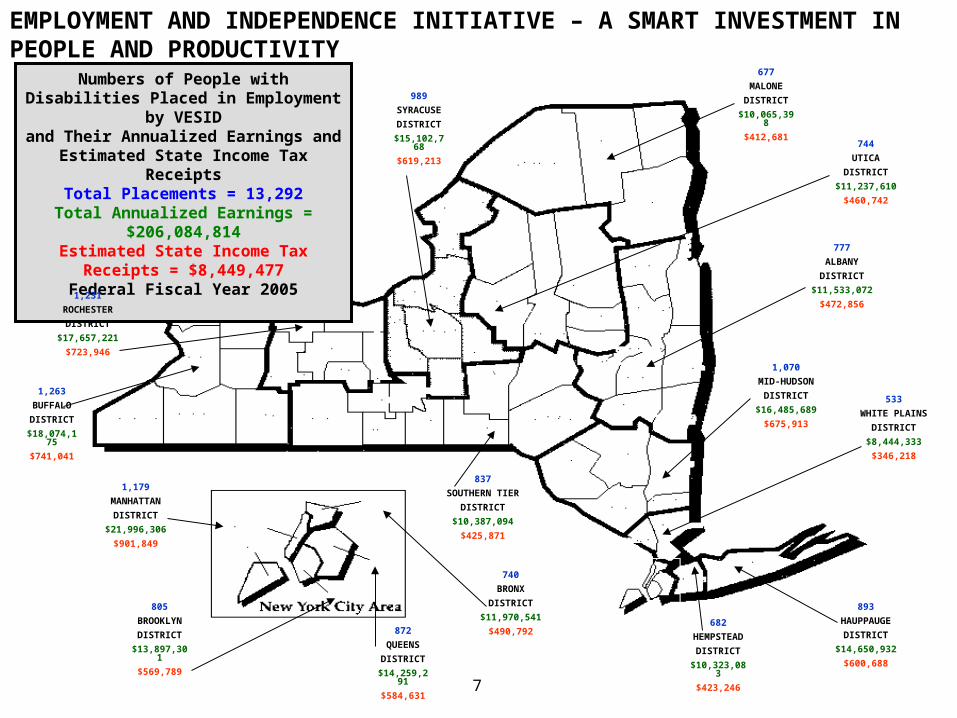
Numbers of People withDisabilities Placed in Employment by VESID
and Their Annualized Earnings and Estimated State Income Tax Receipts
Total Placements = 13,292Total Annualized Earnings = $206,084,814
Estimated State Income Tax Receipts = $8,449,477
Federal Fiscal Year 2005
EMPLOYMENT AND INDEPENDENCE INITIATIVE – A SMART INVESTMENT IN PEOPLE AND PRODUCTIVITY
677
MALONE
DISTRICT
$10,065,398
$412,681
744
UTICA
DISTRICT
$11,237,610
$460,742
777
ALBANY
DISTRICT
$11,533,072
$472,856
1,070
MID-HUDSON
DISTRICT
$16,485,689
$675,913
533
WHITE PLAINS
DISTRICT
$8,444,333
$346,218
893
HAUPPAUGE
DISTRICT
$14,650,932
$600,688
682
HEMPSTEAD
DISTRICT
$10,323,083
$423,246
837
SOUTHERN TIER
DISTRICT
$10,387,094
$425,871
989
SYRACUSE
DISTRICT
$15,102,768
$619,213
1,231
ROCHESTER
DISTRICT
$17,657,221
$723,946
1,263
BUFFALO
DISTRICT
$18,074,175
$741,041
1,179
MANHATTAN
DISTRICT
$21,996,306
$901,849
805
BROOKLYN
DISTRICT
$13,897,301
$569,789
872
QUEENS
DISTRICT
$14,259,291
$584,631
740
BRONX
DISTRICT
$11,970,541
$490,792
7
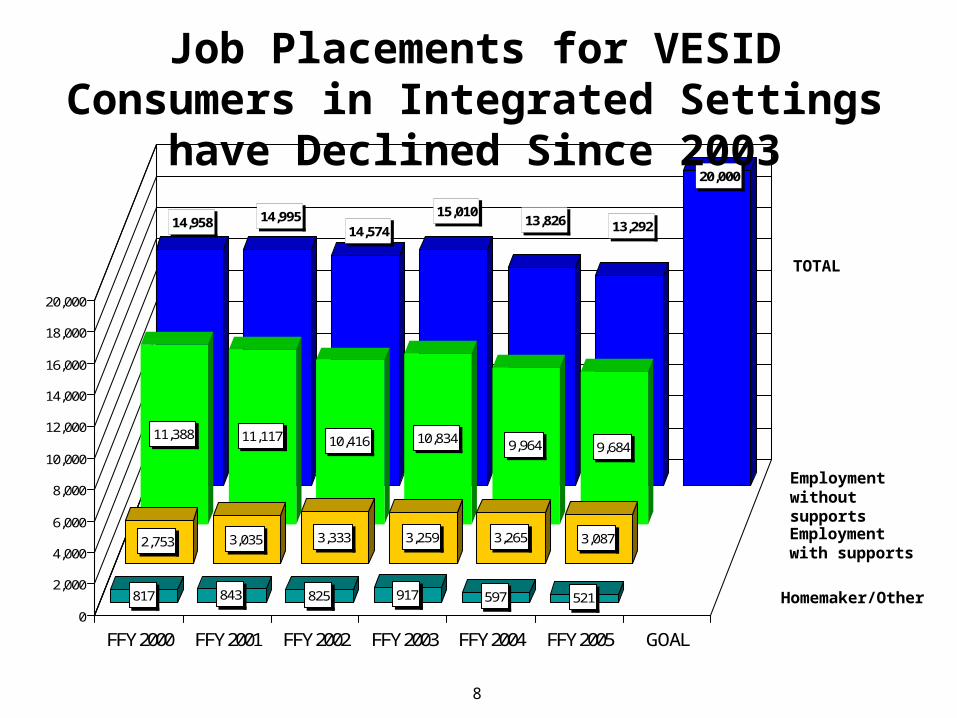
14,958 14,99514,574
15,01013,826 13,292
20,000
11,388 11,117 10,416 10,834 9,964 9,684
2,753 3,035 3,333 3,259 3,265 3,087
817 843 825 917 597 521
0
2,000
4,000
6,000
8,000
10,000
12,000
14,000
16,000
18,000
20,000
FFY 2000 FFY 2001 FFY 2002 FFY 2003 FFY 2004 FFY 2005 GOAL
Job Placements for VESID Consumers in Integrated Settings have Declined Since 2003
TOTAL
Employment without supports
Employment with supports
Homemaker/Other
8
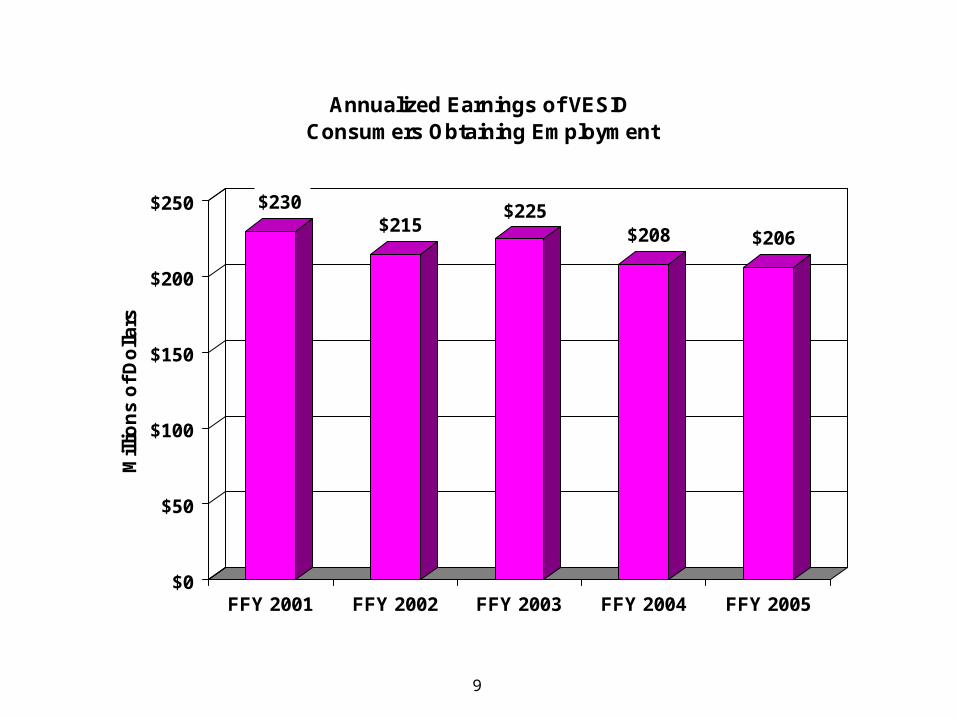
$230$215
$225$208 $206
$0
$50
$100
$150
$200
$250
Mill
ion
s o
f D
olla
rs
FFY 2001 FFY 2002 FFY 2003 FFY 2004 FFY 2005
Annualized Earnings of VESID Consumers Obtaining Employment
9
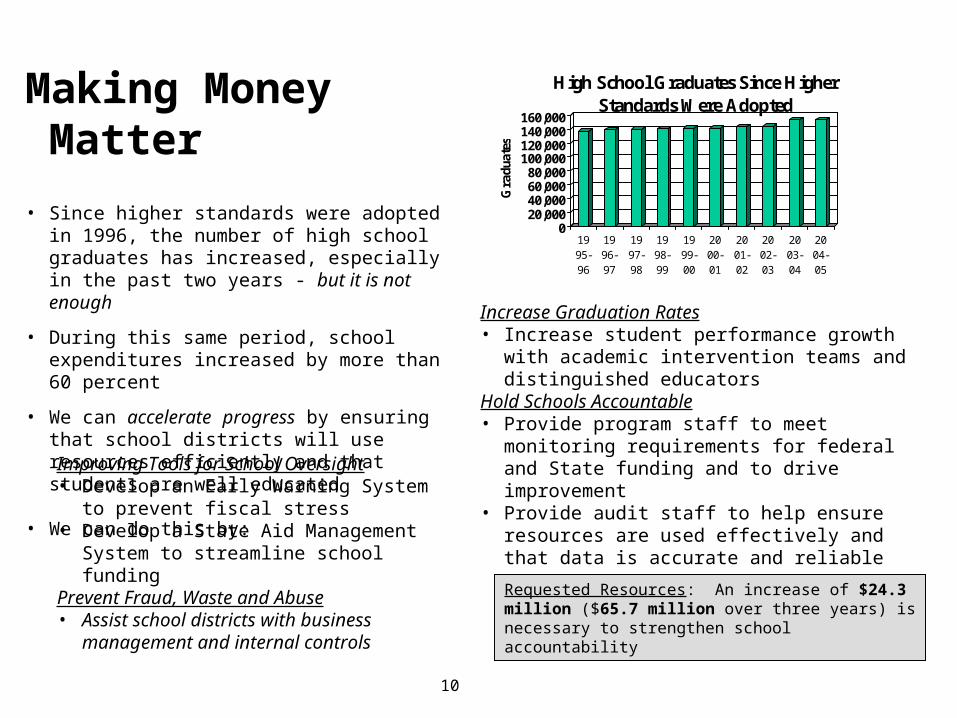
Making Money Matter
• Since higher standards were adopted in 1996, the number of high school graduates has increased, especially in the past two years - but it is not enough
• During this same period, school expenditures increased by more than 60 percent
• We can accelerate progress by ensuring that school districts will use resources efficiently and that students are well educated
• We can do this by:
Improving Tools for School Oversight • Develop an Early Warning System to
prevent fiscal stress• Develop a State Aid Management System
to streamline school fundingPrevent Fraud, Waste and Abuse• Assist school districts with business
management and internal controls
020,00040,00060,00080,000
100,000120,000140,000160,000
Gra
duat
es
1995-96
1996-97
1997-98
1998-99
1999-00
2000-01
2001-02
2002-03
2003-04
2004-05
High School Graduates Since Higher Standards Were Adopted
Increase Graduation Rates• Increase student performance growth with
academic intervention teams and distinguished educators
Hold Schools Accountable• Provide program staff to meet monitoring
requirements for federal and State funding and to drive improvement
• Provide audit staff to help ensure resources are used effectively and that data is accurate and reliable
Requested Resources: An increase of $24.3 million ($65.7 million over three years) is necessary to strengthen school accountability
10
Technology to Improve Performance
Create a New Office of Educational and Academic Technology to Effectively Use Technology to Improve Performance
• Education must do what the business community has done: use technology to vastly improve productivity. Technology is being applied to educational curriculum, testing processes, distance learning, professional development, and broadband communication in our educational institutions. The University of the State of New York (USNY) spends considerable money to make this vision of a technology-rich educational environment a reality. The goal is to identify more ways to harness those USNY resources, leverage existing technology, fill in whatever gaps exist and improve educational performance.
• A central office within SED is needed to coordinate the ‘mapping’ of the digital capacity of USNY institutions, develop and implement a USNY Technology Policy and Plan, and coordinate Federal and State funding for technology use in the field. The Department is requesting funding for 3 positions for research and additional internal technology ($500,000).
11
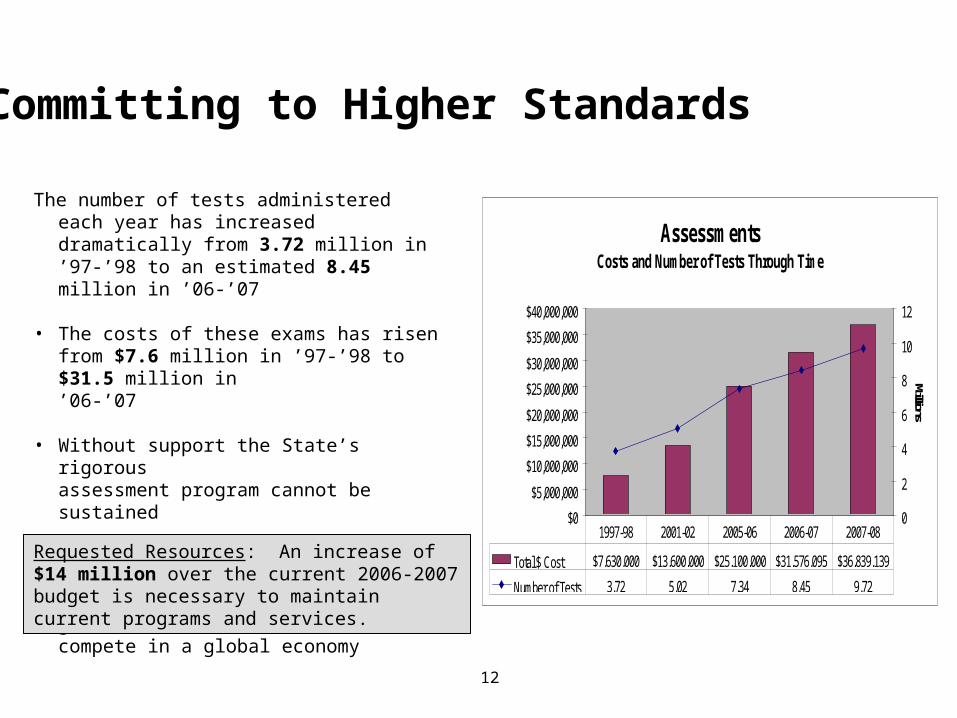
The number of tests administered each year has increased dramatically from 3.72 million in ’97-’98 to an estimated 8.45 million in ’06-’07
• The costs of these exams has risen from $7.6 million in ’97-’98 to $31.5 million in ’06-’07
• Without support the State’s rigorousassessment program cannot be sustained
• Investing in the quality of the State’s assessment and reporting program will help ensure that our graduates have the skills to compete in a global economy
Requested Resources: An increase of $14 million over the current 2006-2007 budget is necessary to maintain current programs and services.
AssessmentsCosts and Number of Tests Through Time
$0
$5,000,000
$10,000,000
$15,000,000
$20,000,000
$25,000,000
$30,000,000
$35,000,000
$40,000,000
0
2
4
6
8
10
12
Millions
Total $ Cost $7,630,000 $13,600,000 $25,100,000 $31,576,095 $36,839,139
Number of Tests 3.72 5.02 7.34 8.45 9.72
1997-98 2001-02 2005-06 2006-07 2007-08
12
Committing to Higher Standards
Regents Priorities for Higher Education
Strong Graduate Programs to Meet the State’s Needs
The number of doctoral degrees conferred in New York State in 2004-05 was essentially the same as the number conferred in 1995-96
An Adequate Supply of Qualified Professionals
The U.S. Health Resources and Services Administration (HRSA) projects a shortage of 17,000 RNs in New York State by 2010
13
Closing Performance Gaps in Higher Education
Only 43% of Baccalaureate degree-seeking Black and Hispanic students complete their degrees in six years as compared to 65% of White students
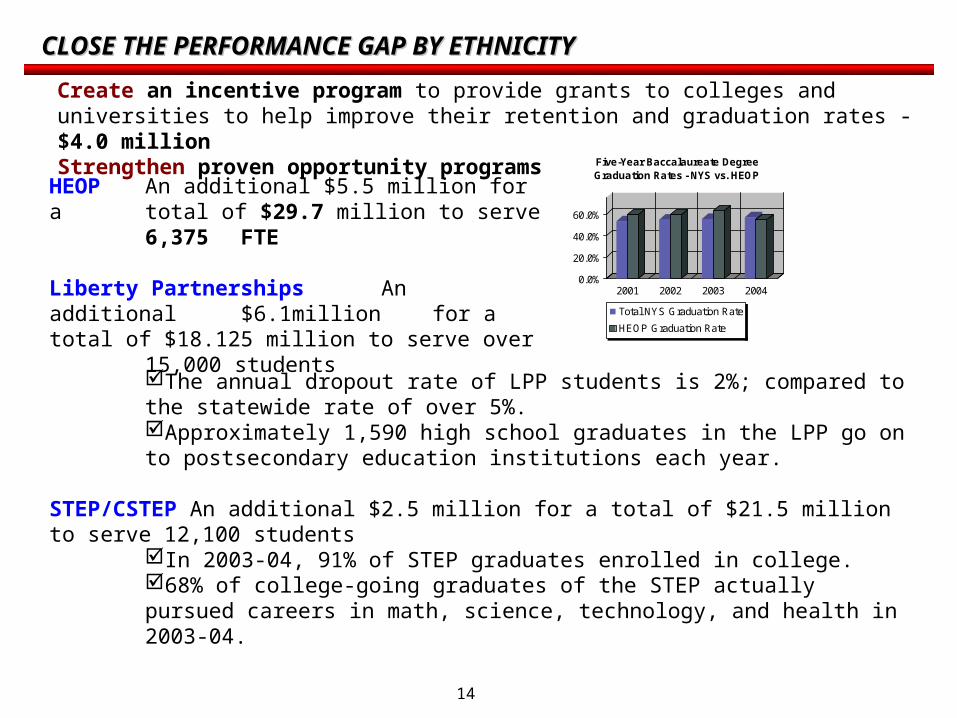
CLOSE THE PERFORMANCE GAP BY ETHNICITYCLOSE THE PERFORMANCE GAP BY ETHNICITY
0.0%
20.0%
40.0%
60.0%
2001 2002 2003 2004
Five-Year Baccalaureate Degree Graduation Rates - NYS vs. HEOP
Total NYS Graduation Rate
HEOP Graduation Rate
The annual dropout rate of LPP students is 2%; compared to the statewide rate of over 5%. Approximately 1,590 high school graduates in the LPP go on to postsecondary education institutions each year.
STEP/CSTEP An additional $2.5 million for a total of $21.5 million to serve 12,100 students
In 2003-04, 91% of STEP graduates enrolled in college.68% of college-going graduates of the STEP actually pursued careers in math, science, technology, and health in 2003-04.
HEOP An additional $5.5 million for a total of $29.7 million to serve 6,375 FTE
Liberty Partnerships An additional $6.1million for a total of $18.125 million to serve over 15,000 students
Create an incentive program to provide grants to colleges and universities to help improve their retention and graduation rates - $4.0 millionStrengthen proven opportunity programs
14
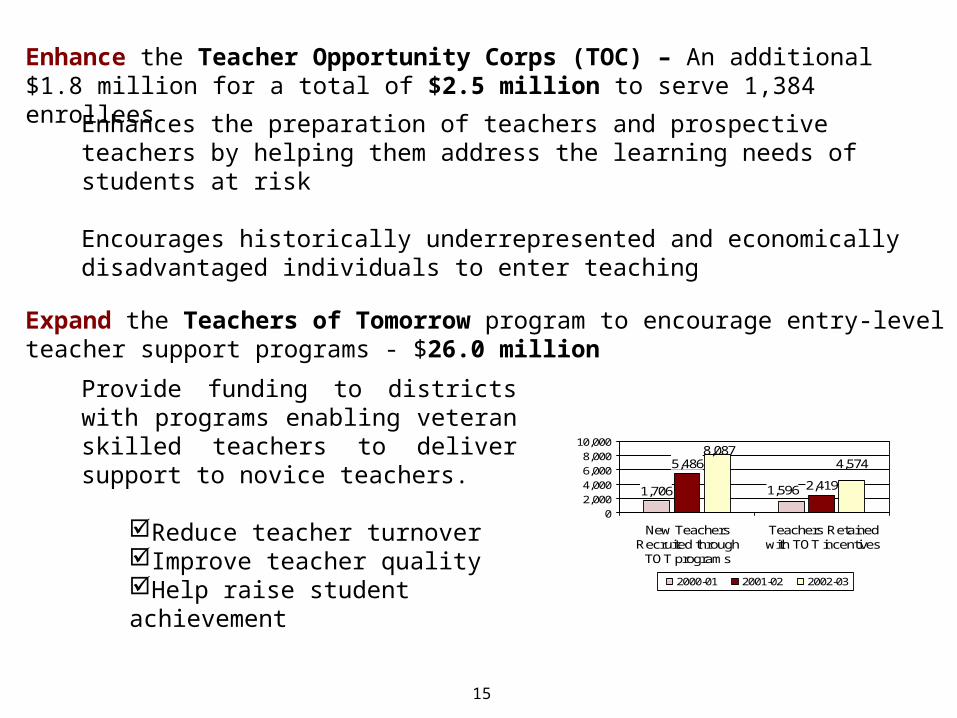
Enhances the preparation of teachers and prospective teachers by helping them address the learning needs of students at risk
Encourages historically underrepresented and economically disadvantaged individuals to enter teaching
1,706
5,486
1,596 2,419
4,5748,087
02,0004,0006,0008,000
10,000
New TeachersRecruited through
TOT programs
Teachers Retainedwith TOT incentives
2000-01 2001-02 2002-03
Provide funding to districts with programs enabling veteran skilled teachers to deliver support to novice teachers.
Reduce teacher turnoverImprove teacher qualityHelp raise student achievement
Enhance the Teacher Opportunity Corps (TOC) – An additional $1.8 million for a total of $2.5 million to serve 1,384 enrollees
Expand the Teachers of Tomorrow program to encourage entry-level teacher support programs - $26.0 million
15
STRENGTHEN GRADUATE EDUCATION
Create Create a competitive doctoral and post-doctoral fellowship program in academic fields where more scholars are needed for research, faculty assignments and/or professional practice. - $4.0 million
CreateCreate a grant-based program for colleges and universities to establish professional education opportunity programs to prepare high school and community college students to enter professional education programs - $2.0 million
16
ENSURE AN ADEQUATE SUPPLY OF QUALIFIED PROFESSIONALS
Postsecondary Education and Individuals with Disabilities• A high school diploma is no longer sufficient to ensure individuals with
disabilities competitive employment
• About 50 percent of students with disabilities and 20 percent of individuals with disabilities over the age of 21 are expected to access postsecondary education
• The lack of college and university support services for students with disabilities, coupled with physical barrier to full access to campuses, have worked together to deny many potential students the opportunity to pursue a postsecondary education.
• This proposal was developed in consultation with representatives of SUNY, CUNY, the independent colleges and universities, and the degree-granting proprietary colleges.
• $15.0 million is needed to: Provide base funding for capacity building. Support the development of programmatic activities. Support recruitment programs that establish targets for recruitment of
students with disabilities.
17
Critical Capacity Needs
The Office of Higher Education is requesting funding for a total of 7 positions to ensure that resources are used and maintained in the public interest - $360,000
College and University Evaluation (3)
Research and Information Services (2)
Collegiate Programs Development (1)
Pre-Collegiate Preparation Programs (1)
18