
Survey on Employment in European Shipbuilding Countries...
13
AgS-Monitoring Shipbuilding Survey on Employment in European Shipbuilding Countries - Selected Results - Sector Committee Shipbuilding Thorsten Ludwig
Transcript of Survey on Employment in European Shipbuilding Countries...
AgS-Monitoring Shipbuilding
Survey on Employment in European Shipbuilding Countries
- Selected Results -
Sector Committee Shipbuilding
Thorsten Ludwig
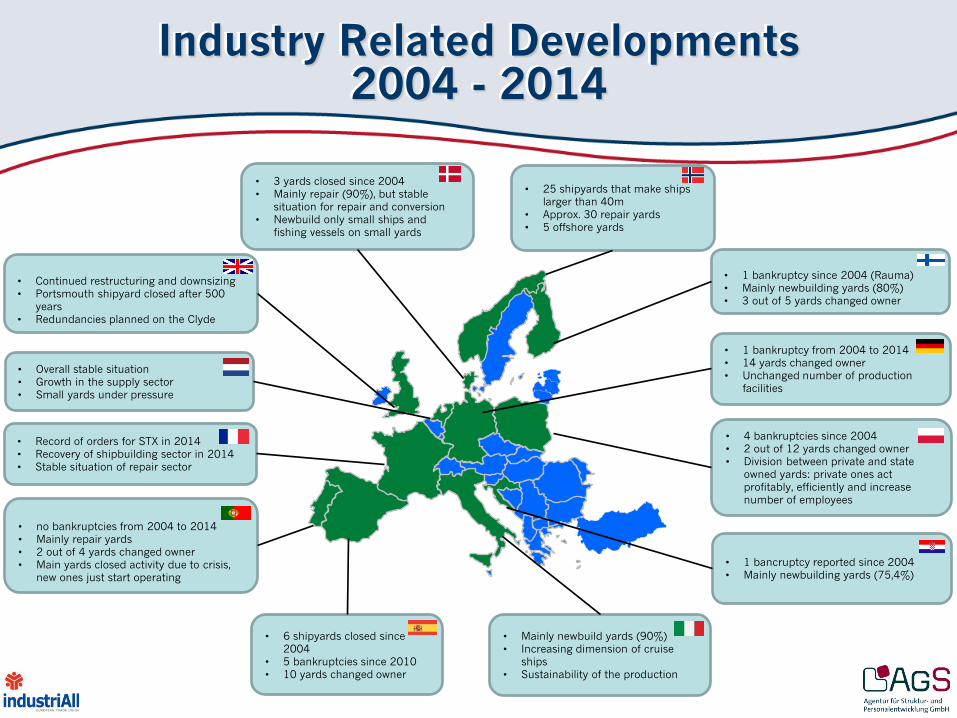
Industry Related Developments 2004 - 2014
• Overall stable situation • Growth in the supply sector • Small yards under pressure
• Record of orders for STX in 2014 • Recovery of shipbuilding sector in 2014 • Stable situation of repair sector
• no bankruptcies from 2004 to 2014 • Mainly repair yards • 2 out of 4 yards changed owner • Main yards closed activity due to crisis,
new ones just start operating
• 6 shipyards closed since 2004
• 5 bankruptcies since 2010 • 10 yards changed owner
• Mainly newbuild yards (90%) • Increasing dimension of cruise
ships • Sustainability of the production
• 1 bancruptcy reported since 2004 • Mainly newbuilding yards (75,4%)
• 4 bankruptcies since 2004 • 2 out of 12 yards changed owner • Division between private and state
owned yards: private ones act profitably, efficiently and increase number of employees
• 1 bankruptcy from 2004 to 2014 • 14 yards changed owner • Unchanged number of production
facilities
• 1 bankruptcy since 2004 (Rauma) • Mainly newbuilding yards (80%) • 3 out of 5 yards changed owner
• 25 shipyards that make ships
larger than 40m • Approx. 30 repair yards • 5 offshore yards
• 3 yards closed since 2004 • Mainly repair (90%), but stable
situation for repair and conversion • Newbuild only small ships and
fishing vessels on small yards
• Continued restructuring and downsizing • Portsmouth shipyard closed after 500
years • Redundancies planned on the Clyde
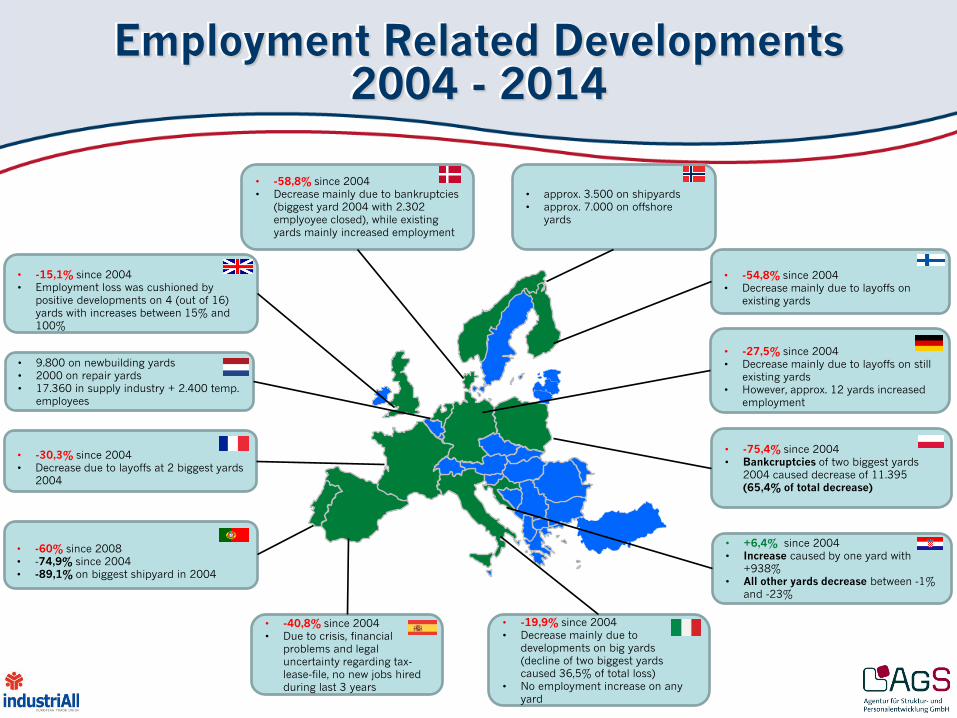
Employment Related Developments 2004 - 2014
• 9.800 on newbuilding yards • 2000 on repair yards • 17.360 in supply industry + 2.400 temp.
employees
• -30,3% since 2004 • Decrease due to layoffs at 2 biggest yards
2004
• -60% since 2008 • -74,9% since 2004 • -89,1% on biggest shipyard in 2004
• -40,8% since 2004 • Due to crisis, financial
problems and legal uncertainty regarding tax-lease-file, no new jobs hired during last 3 years
• -19,9% since 2004 • Decrease mainly due to
developments on big yards (decline of two biggest yards caused 36,5% of total loss)
• No employment increase on any yard
• +6,4% since 2004 • Increase caused by one yard with
+938% • All other yards decrease between -1%
and -23%
• -75,4% since 2004 • Bankcruptcies of two biggest yards
2004 caused decrease of 11.395 (65,4% of total decrease)
• -27,5% since 2004 • Decrease mainly due to layoffs on still
existing yards • However, approx. 12 yards increased
employment
• -54,8% since 2004 • Decrease mainly due to layoffs on
existing yards
• approx. 3.500 on shipyards • approx. 7.000 on offshore
yards
• -58,8% since 2004 • Decrease mainly due to bankruptcies
(biggest yard 2004 with 2.302 emplyoyee closed), while existing yards mainly increased employment
• -15,1% since 2004 • Employment loss was cushioned by
positive developments on 4 (out of 16) yards with increases between 15% and 100%
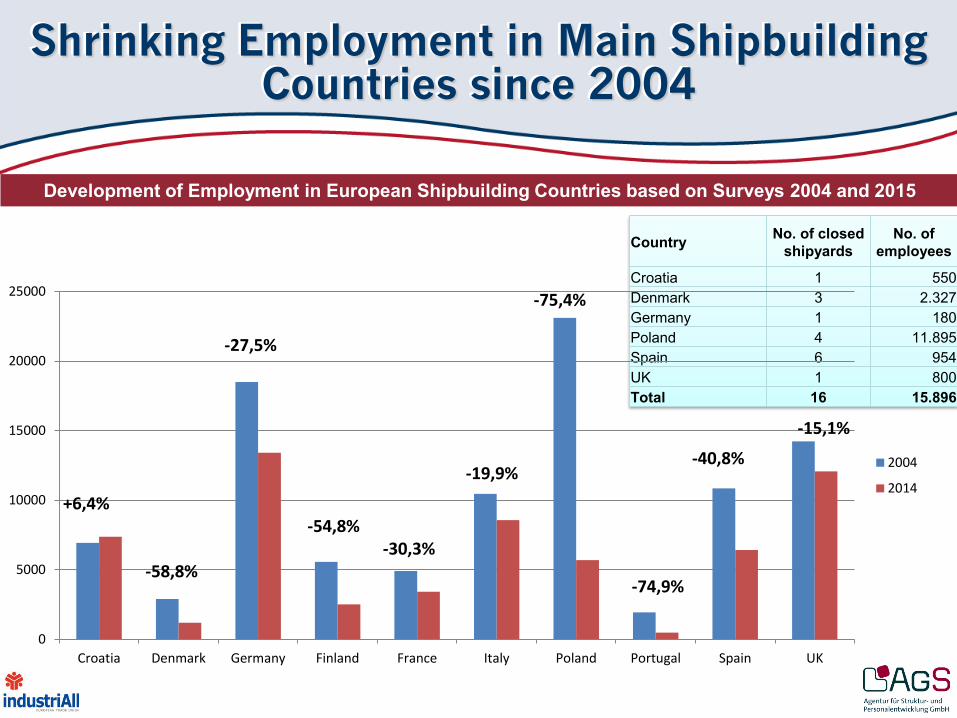
Shrinking Employment in Main Shipbuilding Countries since 2004
Development of Employment in European Shipbuilding Countries based on Surveys 2004 and 2015
Country No. of closed shipyards
No. of employees
Croatia 1 550 Denmark 3 2.327 Germany 1 180 Poland 4 11.895 Spain 6 954 UK 1 800 Total 16 15.896
0
5000
10000
15000
20000
25000
Croatia Denmark Germany Finland France Italy Poland Portugal Spain UK
2004
2014+6,4%
-58,8%
-27,5%
-54,8% -30,3%
-19,9%
-75,4%
-74,9%
-40,8%
-15,1%
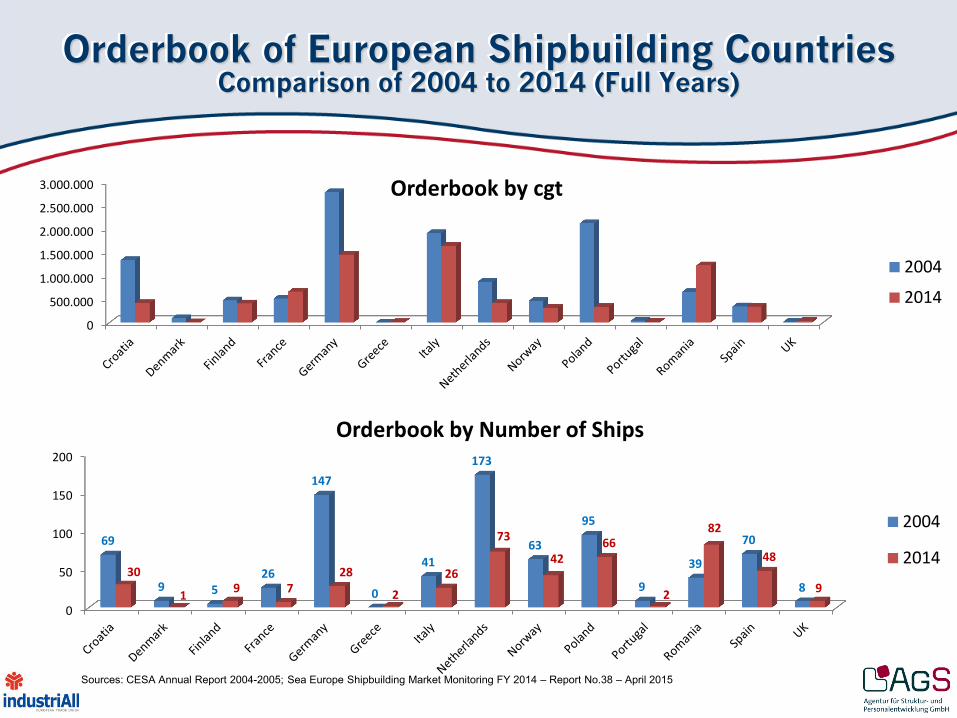
Orderbook of European Shipbuilding Countries Comparison of 2004 to 2014 (Full Years)
0
500.000
1.000.000
1.500.000
2.000.000
2.500.000
3.000.000 Orderbook by cgt
2004
2014
0
50
100
150
200
69
9 5 26
147
0
41
173
63
95
9
39
70
8 30
1 9 7 28
2
26
73
42 66
2
82
48
9
Orderbook by Number of Ships
2004
2014
Sources: CESA Annual Report 2004-2005; Sea Europe Shipbuilding Market Monitoring FY 2014 – Report No.38 – April 2015
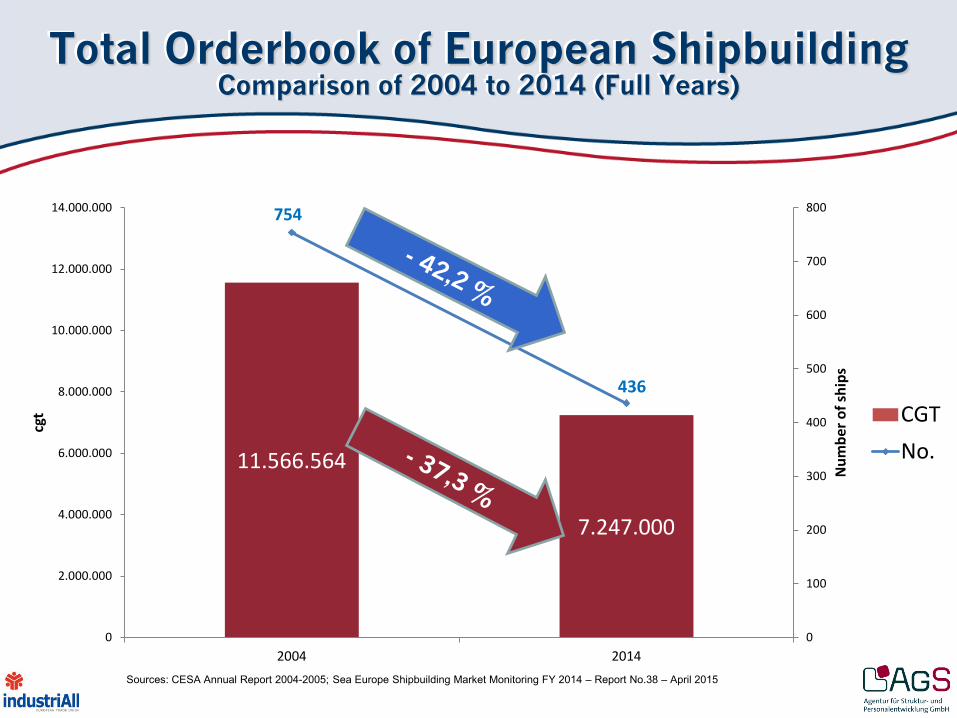
Total Orderbook of European Shipbuilding Comparison of 2004 to 2014 (Full Years)
11.566.564
7.247.000
754
436
0
100
200
300
400
500
600
700
800
0
2.000.000
4.000.000
6.000.000
8.000.000
10.000.000
12.000.000
14.000.000
2004 2014
Num
ber o
f shi
ps
cgt CGT
No.
Sources: CESA Annual Report 2004-2005; Sea Europe Shipbuilding Market Monitoring FY 2014 – Report No.38 – April 2015
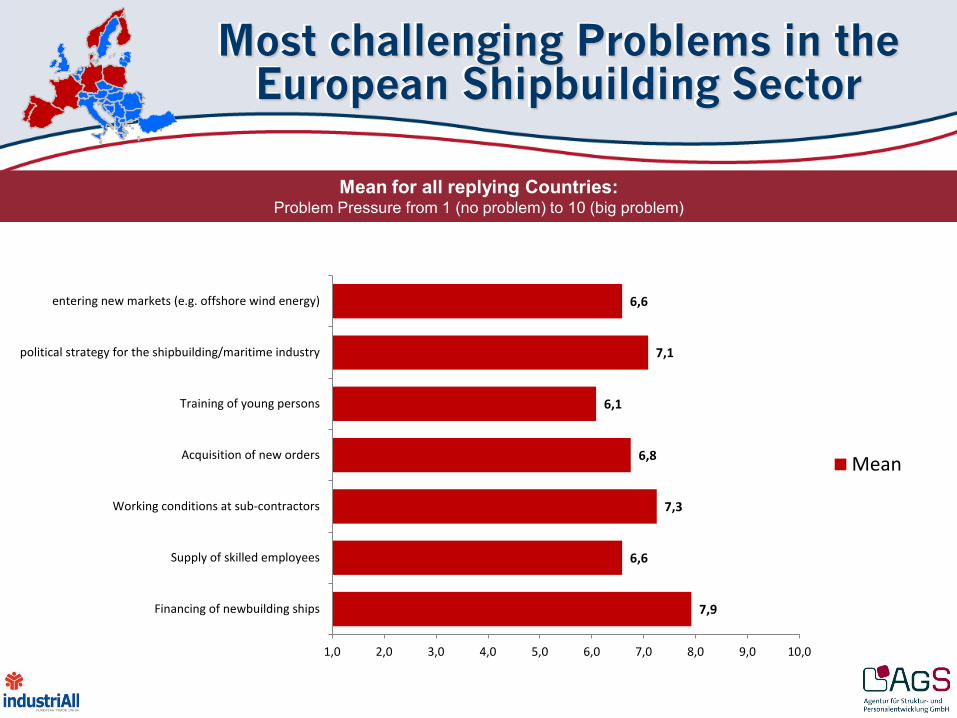
Most challenging Problems in the European Shipbuilding Sector
Mean for all replying Countries: Problem Pressure from 1 (no problem) to 10 (big problem)
7,9
6,6
7,3
6,8
6,1
7,1
6,6
1,0 2,0 3,0 4,0 5,0 6,0 7,0 8,0 9,0 10,0
Financing of newbuilding ships
Supply of skilled employees
Working conditions at sub-contractors
Acquisition of new orders
Training of young persons
political strategy for the shipbuilding/maritime industry
entering new markets (e.g. offshore wind energy)
Mean
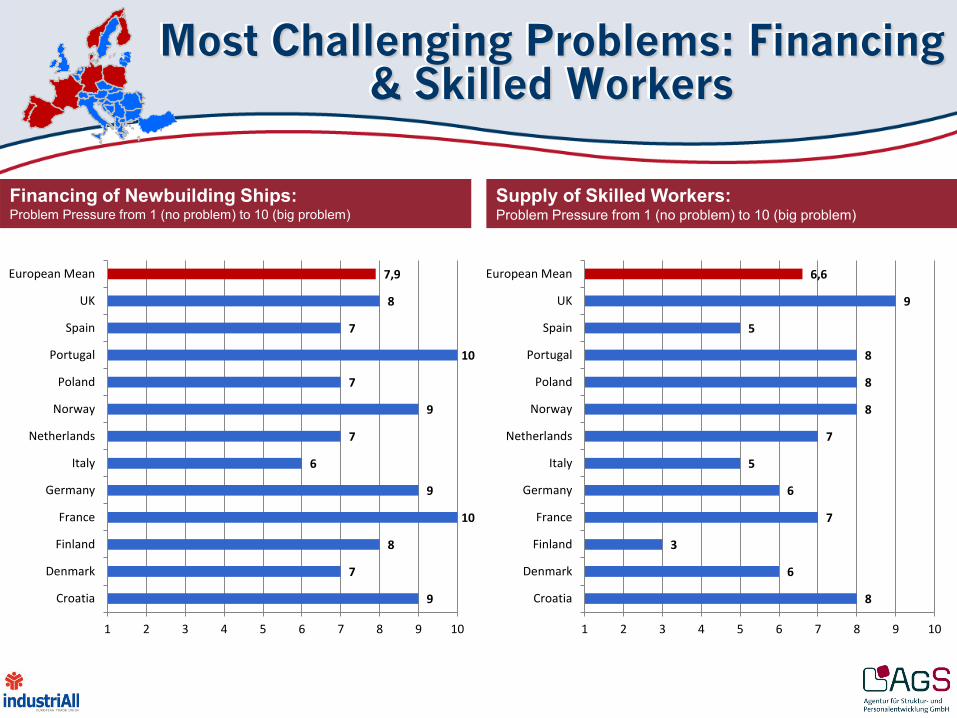
Most Challenging Problems: Financing & Skilled Workers
Financing of Newbuilding Ships: Problem Pressure from 1 (no problem) to 10 (big problem)
Supply of Skilled Workers: Problem Pressure from 1 (no problem) to 10 (big problem)
9
7
8
10
9
6
7
9
7
10
7
8
7,9
1 2 3 4 5 6 7 8 9 10
Croatia
Denmark
Finland
France
Germany
Italy
Netherlands
Norway
Poland
Portugal
Spain
UK
European Mean
8
6
3
7
6
5
7
8
8
8
5
9
6,6
1 2 3 4 5 6 7 8 9 10
Croatia
Denmark
Finland
France
Germany
Italy
Netherlands
Norway
Poland
Portugal
Spain
UK
European Mean
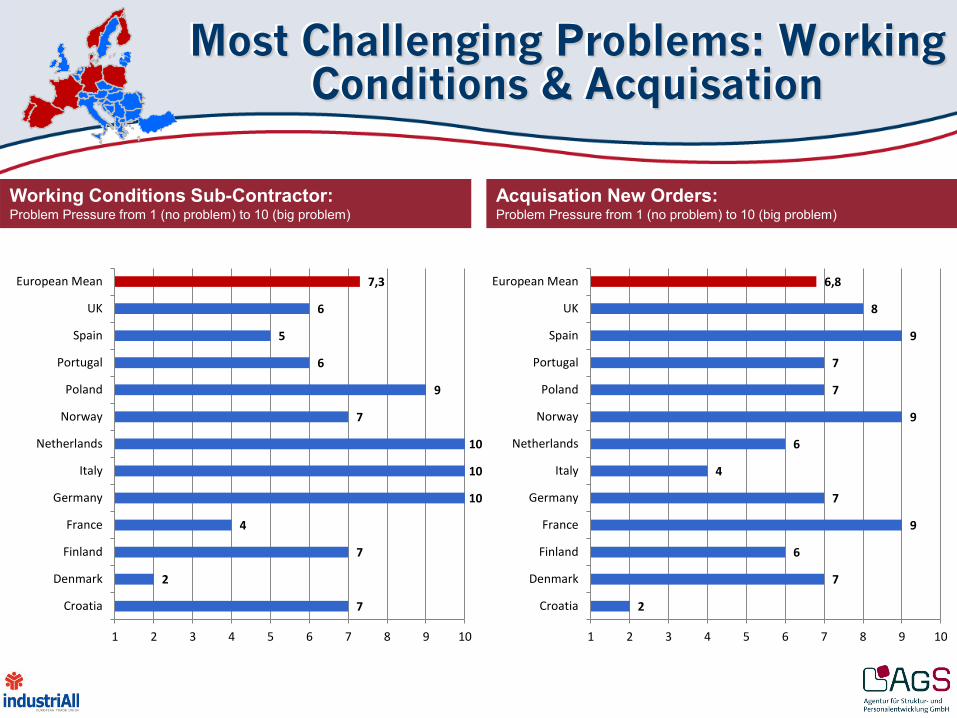
Most Challenging Problems: Working Conditions & Acquisation
Working Conditions Sub-Contractor: Problem Pressure from 1 (no problem) to 10 (big problem)
Acquisation New Orders: Problem Pressure from 1 (no problem) to 10 (big problem)
7
2
7
4
10
10
10
7
9
6
5
6
7,3
1 2 3 4 5 6 7 8 9 10
Croatia
Denmark
Finland
France
Germany
Italy
Netherlands
Norway
Poland
Portugal
Spain
UK
European Mean
2
7
6
9
7
4
6
9
7
7
9
8
6,8
1 2 3 4 5 6 7 8 9 10
Croatia
Denmark
Finland
France
Germany
Italy
Netherlands
Norway
Poland
Portugal
Spain
UK
European Mean
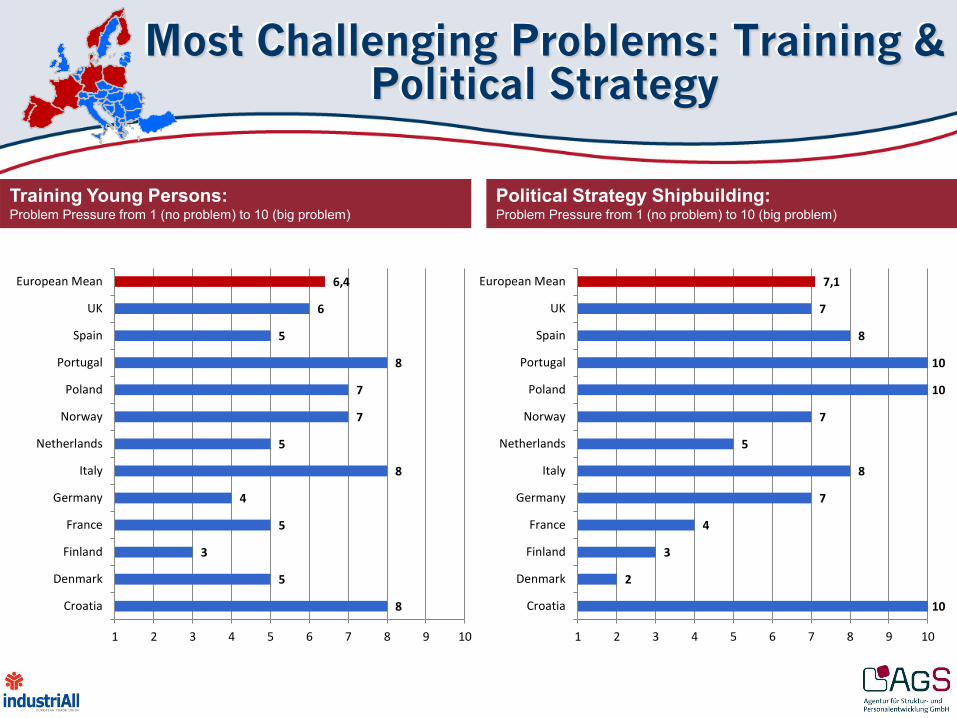
Most Challenging Problems: Training & Political Strategy
Training Young Persons: Problem Pressure from 1 (no problem) to 10 (big problem)
Political Strategy Shipbuilding: Problem Pressure from 1 (no problem) to 10 (big problem)
8
5
3
5
4
8
5
7
7
8
5
6
6,4
1 2 3 4 5 6 7 8 9 10
Croatia
Denmark
Finland
France
Germany
Italy
Netherlands
Norway
Poland
Portugal
Spain
UK
European Mean
10
2
3
4
7
8
5
7
10
10
8
7
7,1
1 2 3 4 5 6 7 8 9 10
Croatia
Denmark
Finland
France
Germany
Italy
Netherlands
Norway
Poland
Portugal
Spain
UK
European Mean
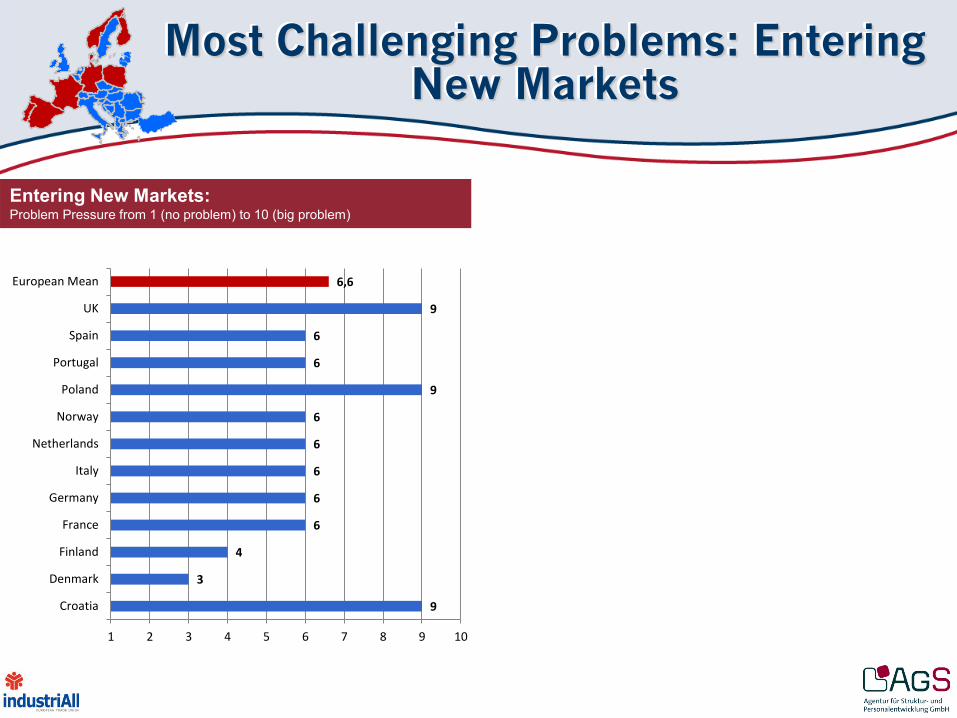
Most Challenging Problems: Entering New Markets
Entering New Markets: Problem Pressure from 1 (no problem) to 10 (big problem)
9
3
4
6
6
6
6
6
9
6
6
9
6,6
1 2 3 4 5 6 7 8 9 10
Croatia
Denmark
Finland
France
Germany
Italy
Netherlands
Norway
Poland
Portugal
Spain
UK
European Mean
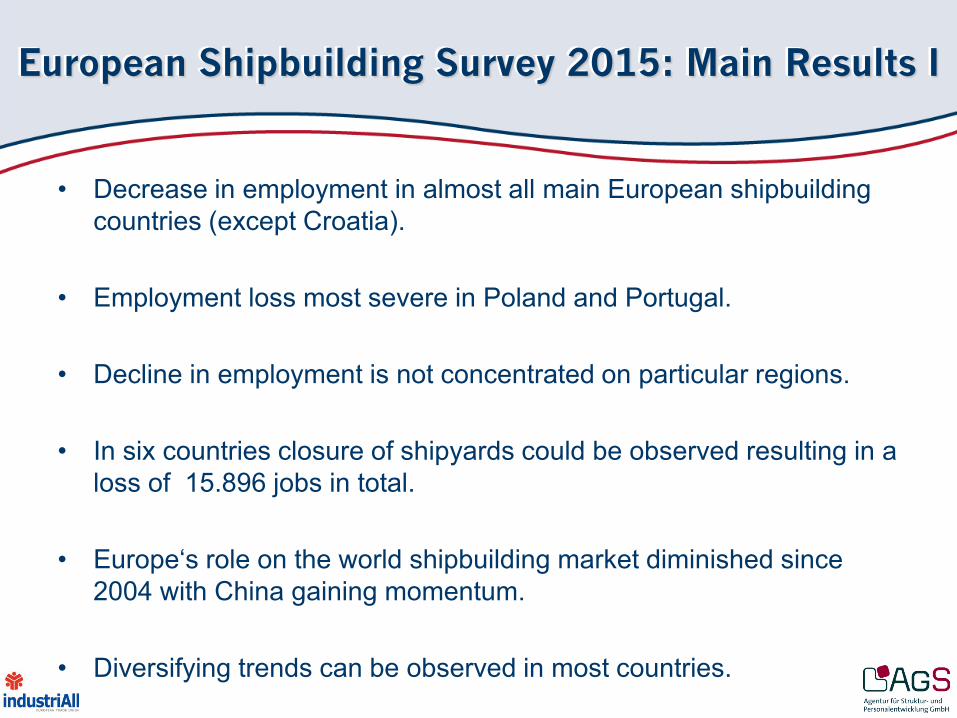
European Shipbuilding Survey 2015: Main Results I
• Decrease in employment in almost all main European shipbuilding countries (except Croatia).
• Employment loss most severe in Poland and Portugal.
• Decline in employment is not concentrated on particular regions.
• In six countries closure of shipyards could be observed resulting in a loss of 15.896 jobs in total.
• Europe‘s role on the world shipbuilding market diminished since 2004 with China gaining momentum.
• Diversifying trends can be observed in most countries.
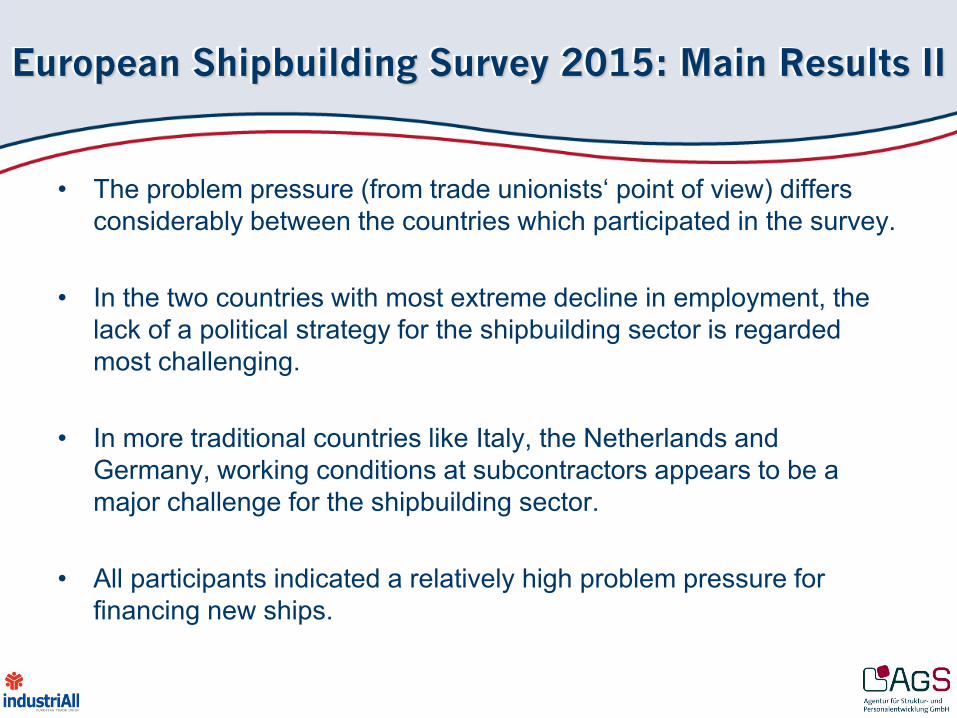
European Shipbuilding Survey 2015: Main Results II
• The problem pressure (from trade unionists‘ point of view) differs considerably between the countries which participated in the survey.
• In the two countries with most extreme decline in employment, the lack of a political strategy for the shipbuilding sector is regarded most challenging.
• In more traditional countries like Italy, the Netherlands and Germany, working conditions at subcontractors appears to be a major challenge for the shipbuilding sector.
• All participants indicated a relatively high problem pressure for financing new ships.