Study of the Physicochemical Properties of Tulobuterol...
7
442 Vol. 60, No. 4 © 2012 The Pharmaceutical Society of Japan Chem. Pharm. Bull. 60(4) 442–448 (2012) Study of the Physicochemical Properties of Tulobuterol Dry Syrups Using Taste and Smell Sensors Yutaka Inoue,* Hironori Shimazaki, Isamu Murata, Masayuki Kimura, and Ikuo Kanamoto Laboratory of Drug Safety Management, Faculty of Pharmaceutical Sciences, Josai University; 1–1 Keyakidai, Sakado, Saitama 350–0295, Japan. Received September 27, 2011; accepted January 12, 2012 The purpose of the present study was to evaluate the taste and smell of Tulobuterol Dry Syrup (TB- DS) in its original form (formulation A) and generic form (formulations B and C) by means of gustatory sensation tests and taste and smell sensors. In addition, the physicochemical properties of the syrups in a solid state were compared. Evaluation of sweetness with a powdered sample revealed significant differences between formulation A and formulation B and between formulation B and formulation C. In contrast, the re- sults of principal component analysis (PCA) with a taste sensor revealed differences in principal component 1 (PC 1) among formulations A, B, and C. Smell sensor measurement of powdered samples revealed differ- ences in products in terms of only PC 1, but these results were not related to the results of gustatory sensa- tion testing with a smell sensor. Measurement of particle size distribution and scanning electron microscopy revealed differences in the particle diameter and particle surface shape for each product. Formulation B had the strongest absorption in the near-infrared spectrum, followed by formulation A and then formulation C. Accordingly, differences in preparations were presumably caused by variations in manufacturing specifica- tions, such as types of additives and their content and coating methods used. In other words, the characteris- tics of each product were revealed by evaluation of their physical properties, sensing of taste and smell, and human gustatory sensation tests. Key words Tulobuterol; dry syrup; gustatory sensation test; taste sensor; smell sensor Compliance is crucial to drug therapy as part of pediatric care. Convenient pediatric preparations with a taste and smell that small children like are being developed, and these prepa- rations include granules, dry syrups (DSs), and liquid syrups. A DS is a preparation that helps to improve compliance by masking the bitterness of active pharmaceutical ingredients through coating techniques and additives. 1,2) However, particle diameter increases as a result of the coating process involved in masking, increasing the burden on small children because of the large individual dose given. Particle diameter is report- ed to affect the roughness of a medicine, which in turn affects the characteristics of its consumption. 3) Therefore, the coating process may not always benefit patients. Pharmaceuticals with various characteristics are now available due to the spread of generic medicines. Generics are released after the patent for the original pharmaceutical expires, and their effects are similar to an original pharmaceutical with the same active ingredients. When a drug manufacturer applies for approval of a product, relevant standards and test methods must be used and stability testing and bioequivalence testing must be performed. 4) Japan’s Ministry of Health, Labour and Welfare carefully examines applications based on these data and is- sues or denies approval. Information on the taste and odor of a drug is not required when applying for approval of a drug despite the fact that taste and odor may affect patient compli- ance. 5) However, such information is rarely offered in clinical practice. 6) Evaluation of aspects like a drug’s taste is generally performed via human gustatory sensation tests. However, indi- vidual differences such as gender, age, dietary habits and pal- ate may influence taste evaluation, 7–9) so uniform and objective evaluation of taste is difficult. Thus, attempting to establish a simple approach to measuring the taste and smell of drugs and to design an objective scale for that purpose in place of human gustatory sensation tests are interesting challenges. In recent years, the development of sensory analytical equipment including taste and smell sensors has allowed ma- chine-based evaluation of taste. In the field of food, the taste provided by thickening has been compared using a taste sen- sor and human taste tests, and both methods are reported to be related. 10) A close correlation has also been found between the evaluation of bitterness in human gustatory sensation tests and the measurement of bitterness with a taste sensor in research using a patented product and a generic product. 11) Furthermore, bitterness can reportedly be predicted using a taste sensor by comparing the bitterness of drugs using nine types of antibacterial agents. 12) Thus, evaluating the taste of drugs with a taste sensor is an interesting topic of study. 13,14) An agonist of beta-2 adrenergic receptors in the sympa- thetic nervous system, Tulobuterol hydrochloride (TB) is a bronchodilator and is administered as a DS or adhesive skin patch to treat infantile bronchial asthma. TB has increasingly been prescribed as a result of the spread of generic DSs and adhesive skin patches. Generic adhesive skin patches with TB are reported to have different skin permeability that seen with patented adhesive skin patches. 15) In addition, Tsuchiya et al. reported on changes in formulations, physicochemical properties, and results of human gustatory sensation testing with regard to a patented TB-DS drug. 16) The characteristics of patented and generic preparations have been reported, but there have been no reports on sensor-based evaluation of taste or smell or on the assessment of physicochemical properties of patented and generic TB-DS products. Accordingly, taste and smell according to human gustatory sensation tests and taste and smell sensors were compared, and the physicochemical properties of TB-DS formulations were evaluated via particle size analysis, scanning microscopy, near-infrared spectros- copy, dissolution testing, and sugar content analysis. Experimental Materials Three different 0.1% (1 mg/g) dry syrups Regular Article * To whom correspondence should be addressed. e-mail: [email protected]
Transcript of Study of the Physicochemical Properties of Tulobuterol...

442 Vol. 60, No. 4
© 2012 The Pharmaceutical Society of Japan
Chem. Pharm. Bull. 60(4) 442–448 (2012)
Study of the Physicochemical Properties of Tulobuterol Dry Syrups Using Taste and Smell SensorsYutaka Inoue,* Hironori Shimazaki, Isamu Murata, Masayuki Kimura, and Ikuo KanamotoLaboratory of Drug Safety Management, Faculty of Pharmaceutical Sciences, Josai University; 1–1 Keyakidai, Sakado, Saitama 350–0295, Japan. Received September 27, 2011; accepted January 12, 2012
The purpose of the present study was to evaluate the taste and smell of Tulobuterol Dry Syrup (TB-DS) in its original form (formulation A) and generic form (formulations B and C) by means of gustatory sensation tests and taste and smell sensors. In addition, the physicochemical properties of the syrups in a solid state were compared. Evaluation of sweetness with a powdered sample revealed significant differences between formulation A and formulation B and between formulation B and formulation C. In contrast, the re-sults of principal component analysis (PCA) with a taste sensor revealed differences in principal component 1 (PC 1) among formulations A, B, and C. Smell sensor measurement of powdered samples revealed differ-ences in products in terms of only PC 1, but these results were not related to the results of gustatory sensa-tion testing with a smell sensor. Measurement of particle size distribution and scanning electron microscopy revealed differences in the particle diameter and particle surface shape for each product. Formulation B had the strongest absorption in the near-infrared spectrum, followed by formulation A and then formulation C. Accordingly, differences in preparations were presumably caused by variations in manufacturing specifica-tions, such as types of additives and their content and coating methods used. In other words, the characteris-tics of each product were revealed by evaluation of their physical properties, sensing of taste and smell, and human gustatory sensation tests.
Key words Tulobuterol; dry syrup; gustatory sensation test; taste sensor; smell sensor
Compliance is crucial to drug therapy as part of pediatric care. Convenient pediatric preparations with a taste and smell that small children like are being developed, and these prepa-rations include granules, dry syrups (DSs), and liquid syrups. A DS is a preparation that helps to improve compliance by masking the bitterness of active pharmaceutical ingredients through coating techniques and additives.1,2) However, particle diameter increases as a result of the coating process involved in masking, increasing the burden on small children because of the large individual dose given. Particle diameter is report-ed to affect the roughness of a medicine, which in turn affects the characteristics of its consumption.3) Therefore, the coating process may not always benefit patients. Pharmaceuticals with various characteristics are now available due to the spread of generic medicines. Generics are released after the patent for the original pharmaceutical expires, and their effects are similar to an original pharmaceutical with the same active ingredients. When a drug manufacturer applies for approval of a product, relevant standards and test methods must be used and stability testing and bioequivalence testing must be performed.4) Japan’s Ministry of Health, Labour and Welfare carefully examines applications based on these data and is-sues or denies approval. Information on the taste and odor of a drug is not required when applying for approval of a drug despite the fact that taste and odor may affect patient compli-ance.5) However, such information is rarely offered in clinical practice.6) Evaluation of aspects like a drug’s taste is generally performed via human gustatory sensation tests. However, indi-vidual differences such as gender, age, dietary habits and pal-ate may influence taste evaluation,7–9) so uniform and objective evaluation of taste is difficult. Thus, attempting to establish a simple approach to measuring the taste and smell of drugs and to design an objective scale for that purpose in place of human gustatory sensation tests are interesting challenges.
In recent years, the development of sensory analytical
equipment including taste and smell sensors has allowed ma-chine-based evaluation of taste. In the field of food, the taste provided by thickening has been compared using a taste sen-sor and human taste tests, and both methods are reported to be related.10) A close correlation has also been found between the evaluation of bitterness in human gustatory sensation tests and the measurement of bitterness with a taste sensor in research using a patented product and a generic product.11) Furthermore, bitterness can reportedly be predicted using a taste sensor by comparing the bitterness of drugs using nine types of antibacterial agents.12) Thus, evaluating the taste of drugs with a taste sensor is an interesting topic of study.13,14)
An agonist of beta-2 adrenergic receptors in the sympa-thetic nervous system, Tulobuterol hydrochloride (TB) is a bronchodilator and is administered as a DS or adhesive skin patch to treat infantile bronchial asthma. TB has increasingly been prescribed as a result of the spread of generic DSs and adhesive skin patches. Generic adhesive skin patches with TB are reported to have different skin permeability that seen with patented adhesive skin patches.15) In addition, Tsuchiya et al. reported on changes in formulations, physicochemical properties, and results of human gustatory sensation testing with regard to a patented TB-DS drug.16) The characteristics of patented and generic preparations have been reported, but there have been no reports on sensor-based evaluation of taste or smell or on the assessment of physicochemical properties of patented and generic TB-DS products. Accordingly, taste and smell according to human gustatory sensation tests and taste and smell sensors were compared, and the physicochemical properties of TB-DS formulations were evaluated via particle size analysis, scanning microscopy, near-infrared spectros-copy, dissolution testing, and sugar content analysis.
ExperimentalMaterials Three different 0.1% (1 mg/g) dry syrups
Regular Article
* To whom correspondence should be addressed. e-mail: [email protected]

April 2012 443
were used in the present study: TB-DS in its original form, BERACHIN® dry syrup for children 0.1% (Mitsubishi Tanabe Pharmacy, Co., Ltd., Osaka, Japan), and in two generic forms, TULOBUNIST® DS 0.1% (Takata Seiyaku Co., Ltd., Tokyo, Japan) and SEKINARIN®-DS FOR PEDIATRIC 0.1% (Towa Pharma Co., Ltd., Osaka, Japan) (Table 1). TB was purchased from Wako Pure Chemical Industries Ltd. (Osaka, Japan). All other reagents were of special reagent grade.
Measurement of Particle Size Distribution The volume particle size distribution of powdered products was mea-sured using a dynamic light-scattering instrument (Malvern Mastersizer Scirocco 2000, Malvern Instruments Ltd., Worcs, U.K.) with an in-house Standard Operating Procedure (SOP) (refractive index: 1.52; measurement time: 1 s; dispersive air pressure: 2 bar). The particle size distribution was charac-terized by the mass median diameter d (0.5), i.e. the size in microns at which 50% of the sample is smaller and 50% is larger.
Particle Morphology according to Scanning Electron Microscopy (SEM) The shape and surface morphology of particles were examined using a scanning electron microscope (Hitachi, model S3000N, Japan). An acceleration voltage of 15 kV was used for all samples. Prior to microscopy, the sam-ples were mounted onto aluminum stubs 12 mm in diameter and coated with gold using in an atmosphere of argon using a Hitachi Ltd. SEM Coating Unit E1010 ion sputter coater (Hitachi Ltd., Japan) at 50 mA for 70 s.
Near-Infrared (NIR) Spectra and Data Analysis Each sample was analyzed using a NIRFlex N-500 analyzer (Büchi Labortechnik AG, Switzerland). The transmittance spectra were recorded using Vision software (Foss NIR Systems, Inc., Laurel, MD, U.S.A.) by integrating 32 scans taken from 1000 to 2500 nm at 2 nm intervals. A reference (ambient air) spectrum was obtained by integrating 32 scans in advance in order to compute each DS powder’s transmittance spectrum. The spectral data were processed and analyzed using associ-ated NIRWare software modules and NIRCal chemometric software.
Sugar Content according to a Refractometer Sugar content in each powder was determined with an Atago Master-N1 sugar refractometer (Atago Co., Ltd., Japan) using TB at concentrations of 0.01, 0.05, and 0.10 mg/mL.
Evaluation of the Dissolution Profile of TB in DS Formulations The dissolution behavior of the original and generic forms of TB-DSs was compared. A dissolution test was performed in accordance with the Guideline for Bioequivalence Studies of Generic Products. The samples corresponded to 10 mg of TB. The drug dissolution study was carried out in accordance with a JP XVI-compliant paddle ap-paratus (Toyama, NTR-593, Japan). The dissolution medium was distilled water (900 mL, 37±0.5°C). A vacuum was used to deaerate the medium. The rate of agitation of the paddle
was 50 rpm. The samples (10 mL) were withdrawn at various time intervals using a syringe and filtered through a 0.450-μm (Toyo Roshi Kaisha, Ltd., Japan) cellulose ester disc filter. The filtered solutions were appropriately diluted with the HPLC mobile phase solution and analyzed with HPLC. The drug concentrations in the solution were determined by HPLC (LC-10A, Shimadzu Co., Japan). The mobile phase was delivered at a flow rate of 0.67 mL/min through an Inertsil® ODS-3 col-umn (4.6 mm i.d. 150 mm: Japan) with an injection volume of 100 μL at 35°C. To determine the concentration of TB, an ace-tonitrile/0.025 mol/L phosphoric buffer pH 2.5 (40/60, v/v) was used as a mobile phase. The detection wavelength was 220 nm after suitable dilution with the mobile phase.
Taste Sensor Measurement and Data Analysis A taste sensor system, α-ASTREE Liquid and Taste Analyzer 12 (Alpha MOS, Toulouse, France), was used to measure the electric potential of the TB-DS solution. This taste sensor consists of an array of 7 liquid cross-sensitive electrodes or sensors (ZZ, BA, BB, CA, GA, HA, and JB), a 16-position automatic sampler, and associated interface electronic module. Each sensor consists of a silicon transistor with an organic coating that determines the sensitivity and selectivity of the sensor. Measurement was done with 2.5 g of sample dispersed in 150 mL of distilled water, and measurements were done at room temperature at each measurement interval (0, 10, 20, 30, 40, 50, 60, 90, 120, 150, 180, 210, 240 s). Measurements consist of the difference in electric potential for each sensor and the Ag/AgCl reference electrode at room temperature in an equilibrium state. An integral signal for each sample constitutes a vector consisting of seven taste sensor determi-nations. Each sample was measured and the standard devia-tion was calculated on average. In addition, the data obtained were subjected to principal component analysis (PCA) using Alpha Soft V12 software. The distance between each drug (the Euclidean distance) was calculated using values output by the taste sensor. The Euclidean distance (dPQ) of sample P=(P1, P2, ···, Pk) and sample Q=(Q1, Q2, ···, Qk) can be repre-sented by Eq. 1, where:
7
2
1
( )PQ k kk
d P Q−=
= (1)
dPQ: Euclidean distance of sample P and sample Q. P: Sensor output value at 0 s for sample P. Q: Sensor output value at each time for sample P. k: Sensors (ZZ, BA, BB, CA, GA, HA, and JB).
Smell Sensor Measurement and Data Analysis The smell sensor system, α-FOX: Liquid and Taste Analyzer 12 of Alpha MOS, Toulouse, France, was used to measure elec-tronic potential of TB-DS solution. This smell sensor consists of an array of 18 metal oxide semiconductor (MOS) sensors. Measurement was done with 0.5 g of sample dispersed in
Table 1. Each Formulation and Its Additives
Formulation Product name Additives Drug company
Formulation A TULOBUNIST® DS 0.1% White soft sugarHydroxypropyl cellulose (HPC)
Takata Seiyaku
Formulation B BERACHIN® dry syrup for children 0.1% White soft sugar Mitsubishi Tanabe PharmacyFormulation C SEKINARIN®-DS FOR PEDIATRIC 0.1% White soft sugar Towa Pharma
444 Vol. 60, No. 4
20 mL of distilled water at each time interval at 40°C. In ad-dition, the data obtained were subjected to PCA using Alpha Soft V12 software.
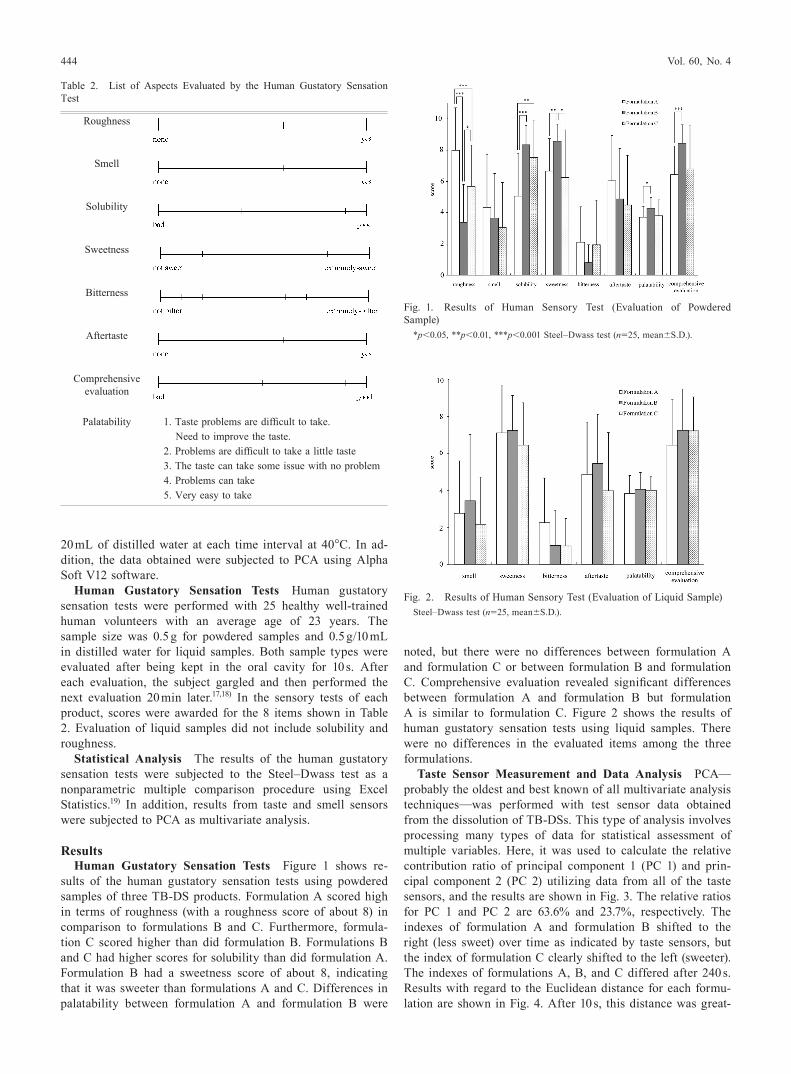
Human Gustatory Sensation Tests Human gustatory sensation tests were performed with 25 healthy well-trained human volunteers with an average age of 23 years. The sample size was 0.5 g for powdered samples and 0.5 g/10 mL in distilled water for liquid samples. Both sample types were evaluated after being kept in the oral cavity for 10 s. After each evaluation, the subject gargled and then performed the next evaluation 20 min later.17,18) In the sensory tests of each product, scores were awarded for the 8 items shown in Table 2. Evaluation of liquid samples did not include solubility and roughness.
Statistical Analysis The results of the human gustatory sensation tests were subjected to the Steel–Dwass test as a nonparametric multiple comparison procedure using Excel Statistics.19) In addition, results from taste and smell sensors were subjected to PCA as multivariate analysis.
ResultsHuman Gustatory Sensation Tests Figure 1 shows re-
sults of the human gustatory sensation tests using powdered samples of three TB-DS products. Formulation A scored high in terms of roughness (with a roughness score of about 8) in comparison to formulations B and C. Furthermore, formula-tion C scored higher than did formulation B. Formulations B and C had higher scores for solubility than did formulation A. Formulation B had a sweetness score of about 8, indicating that it was sweeter than formulations A and C. Differences in palatability between formulation A and formulation B were
noted, but there were no differences between formulation A and formulation C or between formulation B and formulation C. Comprehensive evaluation revealed significant differences between formulation A and formulation B but formulation A is similar to formulation C. Figure 2 shows the results of human gustatory sensation tests using liquid samples. There were no differences in the evaluated items among the three formulations.
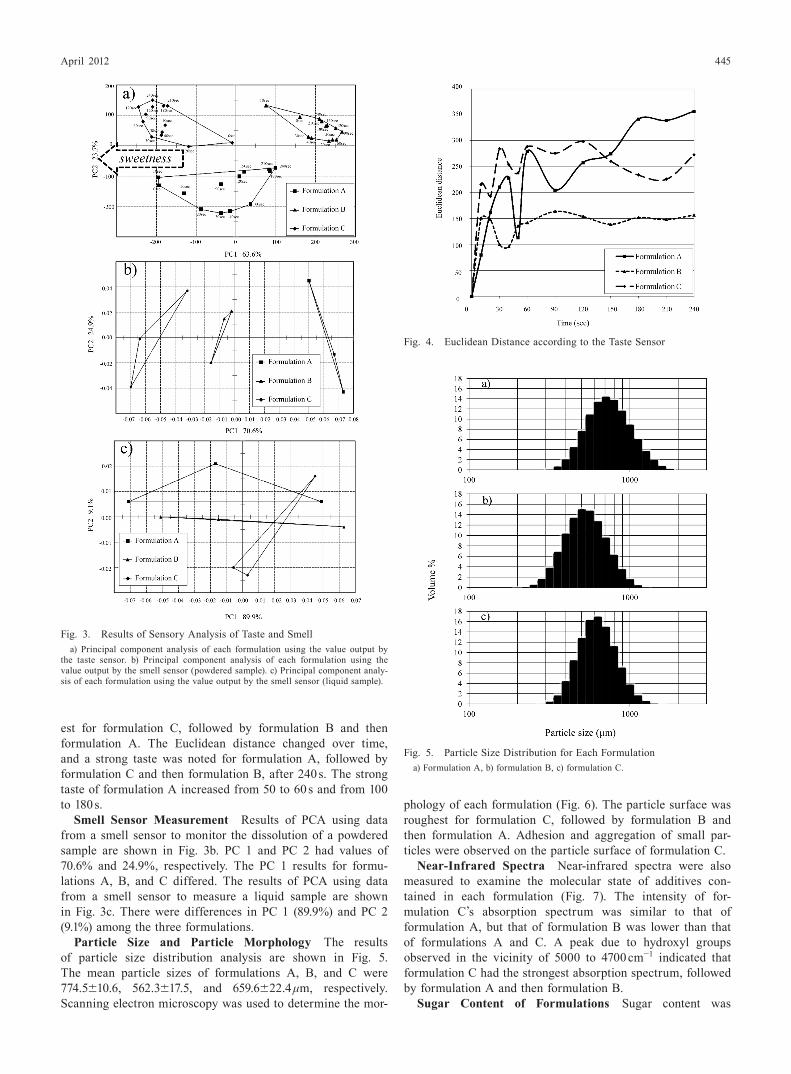
Taste Sensor Measurement and Data Analysis PCA—probably the oldest and best known of all multivariate analysis techniques—was performed with test sensor data obtained from the dissolution of TB-DSs. This type of analysis involves processing many types of data for statistical assessment of multiple variables. Here, it was used to calculate the relative contribution ratio of principal component 1 (PC 1) and prin-cipal component 2 (PC 2) utilizing data from all of the taste sensors, and the results are shown in Fig. 3. The relative ratios for PC 1 and PC 2 are 63.6% and 23.7%, respectively. The indexes of formulation A and formulation B shifted to the right (less sweet) over time as indicated by taste sensors, but the index of formulation C clearly shifted to the left (sweeter). The indexes of formulations A, B, and C differed after 240 s. Results with regard to the Euclidean distance for each formu-lation are shown in Fig. 4. After 10 s, this distance was great-
Fig. 1. Results of Human Sensory Test (Evaluation of Powdered Sample)
*p<0.05, **p<0.01, ***p<0.001 Steel–Dwass test (n=25, mean±S.D.).
Fig. 2. Results of Human Sensory Test (Evaluation of Liquid Sample)Steel–Dwass test (n=25, mean±S.D.).
Table 2. List of Aspects Evaluated by the Human Gustatory Sensation Test
Roughness
Smell
Solubility
Sweetness
Bitterness
Aftertaste
Comprehensive evaluation
Palatability 1. Taste problems are difficult to take.Need to improve the taste.
2. Problems are difficult to take a little taste3. The taste can take some issue with no problem4. Problems can take5. Very easy to take
April 2012 445
est for formulation C, followed by formulation B and then formulation A. The Euclidean distance changed over time, and a strong taste was noted for formulation A, followed by formulation C and then formulation B, after 240 s. The strong taste of formulation A increased from 50 to 60 s and from 100 to 180 s.
Smell Sensor Measurement Results of PCA using data from a smell sensor to monitor the dissolution of a powdered sample are shown in Fig. 3b. PC 1 and PC 2 had values of 70.6% and 24.9%, respectively. The PC 1 results for formu-lations A, B, and C differed. The results of PCA using data from a smell sensor to measure a liquid sample are shown in Fig. 3c. There were differences in PC 1 (89.9%) and PC 2 (9.1%) among the three formulations.
Particle Size and Particle Morphology The results of particle size distribution analysis are shown in Fig. 5. The mean particle sizes of formulations A, B, and C were 774.5±10.6, 562.3±17.5, and 659.6±22.4 μm, respectively. Scanning electron microscopy was used to determine the mor-
phology of each formulation (Fig. 6). The particle surface was roughest for formulation C, followed by formulation B and then formulation A. Adhesion and aggregation of small par-ticles were observed on the particle surface of formulation C.
Near-Infrared Spectra Near-infrared spectra were also measured to examine the molecular state of additives con-tained in each formulation (Fig. 7). The intensity of for-mulation C’s absorption spectrum was similar to that of formulation A, but that of formulation B was lower than that of formulations A and C. A peak due to hydroxyl groups observed in the vicinity of 5000 to 4700 cm−1 indicated that formulation C had the strongest absorption spectrum, followed by formulation A and then formulation B.
Sugar Content of Formulations Sugar content was
Fig. 3. Results of Sensory Analysis of Taste and Smella) Principal component analysis of each formulation using the value output by
the taste sensor. b) Principal component analysis of each formulation using the value output by the smell sensor (powdered sample). c) Principal component analy-sis of each formulation using the value output by the smell sensor (liquid sample).
Fig. 4. Euclidean Distance according to the Taste Sensor
Fig. 5. Particle Size Distribution for Each Formulationa) Formulation A, b) formulation B, c) formulation C.

446 Vol. 60, No. 4
measured in solutions of 0.01, 0.05, and 0.10 mg/mL (as a converted concentration of TB) (Table 3). The sugar content in a solution with a TB concentration of 0.01 mg/mL was about 0.3% for formulations A, B, and C; the sugar content in a so-lution with a TB concentration of 0.05 mg/mL was about 4.3% for formulations A, B, and C. In contrast, the sugar content of formulation A and formulation B in a solution with a TB con-centration of 0.1 mg/mL was about 8.5% but the sugar content of formulation C was about 8.8%.
Evaluation of the Dissolution Profile A dissolution test was performed to examine the dissolution behavior of each formulation (Fig. 8). In addition, testing was performed ac-cording to guidelines for bioequivalence testing of generic products. Results confirmed that the dissolution rate after 15 min reached 85% for formulations A, B, and C. The dis-solution rate for formulations B and C was approximately
90% after 180 s, but formulation A had a slower dissolution in comparison.
DiscussionThis study used taste and smell sensors to evaluate the
physical properties of formulations in a solid state and this study conducted sensory testing to assess and compare the taste and smell of Tulobuterol DS in original and generic form.
Comparison of the Sweetness of TB-DSs Evaluation of sweetness using powdered samples revealed significant differ-ences between formulations A and B and between formula-tions B and C (Fig. 1). In contrast, the results of PCA with a taste sensor (Fig. 3a) revealed differences among formulations A, B, and C in terms of PC 1. The index of the taste sensor changed over time: the index for formulations A and B shifted to the right (less sweet) over time but the index of formulation C shifted to the left (sweeter). The shift in PC 1 for formula-tion B was presumably related to the strength of the sweetness component. Thus, PC 1 was considered relevant in PCA and evaluation of sweetness in human gustatory sensation tests.
Evaluation of physicochemical properties revealed that formulation A contains refined sugar for sweetness and a hydroxypropyl cellulose (HPC) additive as a binder, and for-mulation C also contains refined sugar.20) Analysis of NIR spectra revealed a peak due to hydroxyl groups in the vicinity
Fig. 6. Scanning Electron Microscopy Photograph of Each Formulationa) Formulation A (×80), b) formulation B (×100), c) formulation C (×90).
Fig. 7. Near-Infrared Spectra of Each Formulation (4000–10000 cm−1) Fig. 8. Dissolution Test of Each Formulation
Table 3. Brix Measurement of Each Formulation
Concentration of Tulobuterol
0.01 mg/mL 0.05 mg/mL 0.1 mg/mL
Formulation A 0.30±0.02% 4.30±0.01% 8.50±0.05%Formulation B 0.30±0.01% 4.25±0.05% 8.53±0.04%Formulation C 0.30±0.03% 4.38±0.04% 8.83±0.04%
n=4 mean±S.D.

April 2012 447
of 5000 cm−1 and 4700 cm−1.21,22) Differences in the absorp-tion peak intensity of the OH group of soft white sugar and the HPC content of each formulation were caused by dif-ferences in the additive content in each formulation (Fig. 7). Formulation C in a solution with a TB concentration of 0.10 mg/mL had a higher sugar content than did formulations A and B. Differences in additive content for each formulation may have been the cause, and differences in physical proper-ties in a solid state may have contributed to differences in sweetness (Table 3). However, formulation B scored higher for sweetness in human sensory testing than did formulations A and C. For this reason, dissolution of TB-DSs in the oral cavity was thought to reflect sweetness due to differences in elution of additives in each formulation. In other words, the results of human gustatory sensation testing did not agree with the formulation’s properties in a solid state because of differences related to the dissolution process. In addition, hu-man sensory testing revealed differences in sweetness despite the fact that formulations B and C contained the same addi-tives. This thus suggested that sweetness may have been due to the formulation’s manufacturing process.
Comparison of the Bitterness and Palatability of TB-DSs Human sensory testing using in bitterness and after-taste of powdered samples revealed no significant differences between formulation A and the other formulations (Fig. 1). Formulation B had a low score for bitterness in comparison to formulations A and C. This is presumably due to its lighter taste and fewer changes in its taste over time as a result of changes in the Euclidean distance (Fig. 4). Formulation A scored higher in terms of aftertaste than did formulations B and C. The Euclidean distance of Formulation A continued increasing until 240 s while varying to some extent. On the other hand, the Euclidean distance of preparation B and C al-most became the constant value after having increased rapidly. This was found to coincide with the dissolution behavior seen in the dissolution test (Fig. 8). Thus, variations in taste over time influenced aftertaste (Fig. 4).
Comparison of the Smell of TB-DSs There were no sig-nificant differences among the formulations with regard to the smell of the powdered samples (Fig. 1). The smell sensor was found to be able to pick up on odors that were not detected in sensory tests because the positions of the sensor differ for each formulation at PC 1 (Fig. 3b).
Evaluation of Roughness and Dissolution Profile Human gustatory sensation tests revealed significant differ-ences in roughness for powdered samples of all of the for-mulations (Fig. 1). Evaluation showed that formulation A was the roughest. Formulation roughness is reported to be related to particle diameter.7) The particle diameter of formulation A (774 μm) was larger than that of formulations B (562 μm) and C (659 μm) (Fig. 5). This suggests that particle diameter measurement was a useful technique for evaluating texture. Solubility was evaluated using powdered samples, and formu-lation A was less soluble than the other formulations (Fig. 1). Similarly, dissolution testing indicated that formulation A had a low rate of dissolution prior to 180 s in comparison to formu-lations B and C, matching the results with regard to solubility (Fig. 8). Formulation A was assumed to be less soluble than the other formulations because it contains an HPC binder as an additive. Differences in additives and the manufacturing process are reported to affect the dissolution of a formula-
tion.23) In comparison to formulations B and C, formulation A had a large particle diameter and smooth particle surface (Fig. 6). Therefore, particle diameter and surface were presumed to contribute to solubility.
Prediction of the Taste of TB-DSs Using a Taste Sensor Figure 2 shows the results of human gustatory sensation test-ing with a liquid sample and it shows no significant differenc-es in evaluated aspects for all of the formulations. The smell sensor was not able to clearly distinguish with liquid samples of each preparation (Fig. 3c). Human gustatory sensation tests using liquid samples revealed no differences among the for-mulations, so texture and taste in these tests were evaluated based on dissolution of the formulation from a solid state. Measurement of the Euclidean distance revealed that dissolu-tion from a powder in the oral cavity may significantly influ-ence the results of human gustatory sensation tests. Changes in taste presumably related to changes in the Euclidian dis-tance influenced taste in human gustatory sensation tests, as did the refined sugar and HPC contained in formulations A, B, and C. Test results were also influenced by differences in the coating on the formulation and methods of its manufacture, as corroborated by SEM.
As the current results have shown, evaluation of taste and smell using human sensory tests and a taste sensor revealed differences between TB-DS in its original and generic forms. In addition, evaluation of the physicochemical properties of each formulation revealed the characteristics of each formula-tion. In the past, evaluation of smell and taste was done by performing sensory testing with human subjects, but differ-ences in the age, sex, preferences, and sensitivity of subjects can lead to different results.7,8) A report has indicated that sen-sory analysis using taste and smell sensors allows evaluation equivalent to that provided by human sensory testing.24,25) If the “quality” and “strength” of smells and tastes can be quan-tified and diagrammed by a machine as they are in human sensory evaluation, then such an approach will provide an ef-fective means of objective evaluation without the intrusion of human subjectivity.
ConclusionTaste, smell, and physicochemical properties of TB-DS
formulations were evaluated using taste and smell sensors. The taste and smell of each formulation was characterized, and the properties of the formulations were identified. Results suggested that drug information be provided in accordance with patient needs and that information be actively compiled. Evaluation of taste has depended greatly on human gustatory sensation testing, but extensive use of taste and smell sensors is expected because such sensors allow more effective assess-ment of drug quality and development of new formulations by reproducing the results of sensory testing in an objective format.
References 1) Djordjevic J., Zatorre R. J., Jones-Gotman M., Chem. Senses, 29,
199–208 (2004). 2) Toraishi K., Nakamura N., Yuizono Y., Mori M., Yamada M.,
Takahashi T., Kurokawa M., Jan. J. Hosp. Pharm., 24, 479–483 (1998).
3) Imai E., Hatae K., Shimada A., J. Home Ecom. Jpn., 46, 1151–1158 (1995).

448 Vol. 60, No. 4
4) Yoshida Ya., Yoshida Yo., Sakamoto J., Iryo, 63, 702–707 (2009). 5) Shimokawa K., Itabashi T., Yamazaki N., Hino F., Ishii F., Jpn. J.
Pharm. Health Care Sci., 35, 662–668 (2009). 6) Tomizawa T., Kono M., Ishii A., Akiba M., Sata H., Nakajima S.,
Jpn. J. Drug Inform, 12, 158–162 (2011). 7) Mojet J., Christ-Hazelhof E., Heidema J., Chem. Senses, 26, 845–
860 (2001). 8) Mojet J., Heidema J., Christ-Hazelhof E., Chem. Senses, 28, 397–
413 (2003). 9) Kampov-Polevoy A. B., Garbutt J. C., Janowsky D. S., Alcohol
Alcohol., 34, 386–395 (1999).10) Nakamura M., Sato F., Yoshida S., Kumagai M., Suzuki Y., Nippon
Shokuhin Kōgyō Gakkai Shi, 57, 380–388 (2010).11) Okada S., Takemoto E., Ishizaka T., Uchida T., Jpn. J. Pharm.
Health Care Sci., 33, 905–912 (2007).12) Kumagai C., Tokuyama E., Ishizaka T., Mukai J., Asaka K., Uchida
T., Jpn. J. Pharm. Health Care Sci., 33, 659–665 (2007).13) Tsuji E., Takada M., Uchida T., Jpn. J. Pharm. Health Care Sci., 31,
186–193 (2005).14) Ishizaka T., Tsuji E., Mukai J., Asaka K., Uchida T., Jpn. J. Pharm.
Health Care Sci., 32, 259–265 (2006).15) Tojo K., Hikima T., Biol. Pharm. Bull., 30, 1576–1579 (2007).
16) Tsuchiya M., Watanabe S., Kurokawa Y., Harasawa H., Nakano T., Nishitani A., Imai K., Iwasaki Y., Byōin Yakugaku, 13, 34–42 (1987).
17) Okada S., Takemoto E., Ishizaka T., Taniuchi K., Tanoue A., Tsuji E., Uchida T., Jpn. J. Pharm. Health Care Sci., 34, 32–39 (2008).
18) Hazekawa M., Morisaki T., Fujii K., Tange M., Haraguchi T., Yoshida M., Uchida T., Jpn. J. Pharm. Health Care Sci., 36, 262–269 (2010).
19) Kan T., “Statistical Analysis with “EXCEL Statistics” (Newly-revised edition),” ed. by ESUMI Co., Ltd., Tokyo, 2006, pp. 370–384.
20) Hasegawa A., Nakagawa H., Sugimoto I., Yakugaku Zasshi, 104, 544–547 (1984).
21) Takeno S., Bamba T., Nakazawa Y., Fukusaki E., Okazawa A., Kobayashi A., J. Biosci. Bioeng., 106, 537–540 (2008).
22) Diaz-Arnold A. M., Arnold M. A., Williams V. D., J. Dent. Res., 71, 438–442 (1992).
23) Li C., Sakamoto M., Yakuzaigaku, 67, 133–141 (2007).24) Tokuyama E., Matsunaga C. Yoshida k., Mifsud J-C., Irei T.,
Yoshida M., Uchida T., Chem. Pharm. Bull., 57, 382–387 (2009). 25) Kashima A., Yabuki H., Morohashi A., Fukumoto K., Ueno K., Jpn.
J. Pharm. Health Care Sci., 32, 1088–1093 (2006).