STUDY OF BRAND AWARENESS AND BRAND IMAGE OF …
124
Marjukka Eerikäinen STUDY OF BRAND AWARENESS AND BRAND IMAGE OF LAATUKESKUS, EXCELLENCE FINLAND Master’s Thesis Degree Program in International Business Management 2017
Transcript of STUDY OF BRAND AWARENESS AND BRAND IMAGE OF …
Marjukka Eerikäinen
STUDY OF BRAND AWARENESS AND BRAND IMAGE OF
LAATUKESKUS, EXCELLENCE FINLAND
Master’s Thesis Degree Program in International Business Management
2017
Tekijä/Tekijät
Tutkinto
Aika
Marjukka Eerikäinen Master of Business Administration
Joulukuu 2017
Opinnäytetyön nimi Brändin tunnettuuden ja imagon kartoitus ja tutkimus, Laatu-keskus Excellence Finland
124 sivua 6 liitesivua
Toimeksiantaja Laatukeskus, Excellence Finland Oy
Ohjaaja Satu Peltola, Yliopettaja
Tiivistelmä Kiinnostus laatukulttuuriin ja yhteistyön kehittämiseen on nähty parantavan kestävää kan-sallista kilpailukykyä. Suomessa on jatkuvasti kasvava määrä järjestöjä, jotka kehittävät pit-källä aikavälillä johtamistaan ja toimintaansa, mikä tekee heistä reagoivampia ympäristö-vaatimusten muutoksiin. Tässä tutkimuksessa tarkastellaan Laatukeskus, Excellence Fin-landiin nykyistä brändin tunnettuutta ja brändi-mielikuvaa sekä miten nykyistä brändi-ima-goa tulisi kehittää. Tutkimuksen tavoitteena oli brändin tunnettuuden määrittely sekä brändi-imagon kehittä-minen yrityksen sidosryhmien näkökulmasta. Tämän tutkimuksen tavoitteena oli myös li-sätä brändi tietoisuutta sekä ylläpitää ja vahvistaa yrityksen brändi-uskollisuutta ja mainetta nykyisten ja potentiaalisten asiakkaiden sekä kansainvälisten kumppanien keskuudessa. Tutkimuskysymys oli, miten koettua brändi-mielikuvaa olisi parannettava. Teoreettinen viitekehys esittää brändin tunnettuuden ja brändi-imagon ja siihen liittyvien termien keskinäisiä yhteyksiä ja miten ne yhdessä vaikuttavat sidosryhmien kokemaan yri-tyksen mielikuvaan. Tutkimus toteutettiin kvantitatiivisena Survey-tutkimuksena. Avoimet kysymykset lisäsivät tutkimukseen kvalitatiivista puolta. Tutkimuksen ensisijaiset tiedot ke-rättiin verkko-kyselylomakkeella ja toteutettiin suomeksi sekä englanniksi. Tiedonkeruussa käytettiin jäsenneltyjä ja puolistrukturoituja kysymyksiä. Kysely lähetettiin yhteensä 938 or-ganisaatiolle, joista saatiin yhteensä 158 vastausta. Vastausprosentiksi tuli näin ollen koko-naisuudessaan noin 16,8%. Tärkeimmät johtopäätökset osoittivat, että nykyinen brändin mielikuva on melko hyvä ja myönteinen, mutta ei ole vielä täysin selkeä kaikille kohderyhmille. Myös brändin tunnet-tuutta pidettiin varsin hyvänä, mutta erinomaisena vain pienelle vähemmistölle. Esimerkiksi, jatkossa tarvitaan enemmän näkyvyyttä. Hyödyntämällä kyselyn tulokset ja ottamalla huo-mioon annetut kehitysideat, Laatukeskus pystyy laatimaan brändi-strategian ja kehittämään nykyistä brändiään ja imagoaan.
Asiasanat Brändin tunnettuus, brändipääoma, brändi tunnistettavuus, brändi-imago, brändin positiointi, brändiuskollisuus
Author
Degree
Time
Marjukka Eerikäinen Master of Business Administration
December 2017
Thesis Title Study of Brand Awareness and Brand Image of Laatukeskus, Excellence Finland
124 pages 6 pages of appendices
Commissioned by Laatukeskus, Excellence Finland Oy
Supervisor Satu Peltola, Principal Lecturer, Dr. Sc (econ.)
Abstract Interest in improving quality culture and co-operation has been seen to improve sustainable national competitiveness. In Finland, there are constantly increasing number of organiza-tions developing in the long-term their management and activities and this makes them more responsive regarding changes in the environment requirements. This study explores the current brand image of Excellence Finland and, how it should be improved. The aim of the study was to conceptualize brand awareness and develop the brand image from the view point of the company stakeholders. The objective of this study was to in-crease brand awareness likewise maintain and strengthen the brand loyalty and reputation among existing and potential customers as well as international partners. The research question was, how should the experienced brand image be improved. The relevant theory deals with brand awareness and brand image and moreover related terms. Also, clear definitions to each term are given. The interrelated connections of these terms are discussed, and how they together influence the brand image of a company seen by its stakeholders. This research was conducted as a quantitative survey study and open questions raised the qualitative aspect of the research. The primary data of the survey was collected by hosting an online questionnaire and conducted both in Finnish and English. In the data collection, structured and semi-structured questionnaires were used. The online questionnaire was sent in total to 938 organisations of which 158 responses were received. This gives the ap-proximate response rate of 16,8%, based on the number of selected organizations. The main conclusions indicated the current brand image is quite good and positive, but not yet very clear to all the target groups. Also, the brand awareness was considered quite good, but excellent only for the small minority. For example, more visibility was needed. By utilising the survey results from the study and taking into consideration the recommen-dations given, Excellence Finland will be able to devise a strategy to build and develop their current brand image and increase brand awareness.
Keywords Brand awareness, brand equity, brand recognition, brand image, brand positioning, brand loyalty
CONTENTS
1 INTRODUCTION .......................................................................................................... 6
1.1 Background of the study ......................................................................................... 6
1.2 Research and Development objectives .................................................................. 7
1.2.1 Research and Development question ............................................................... 9
1.2.2 Limitations ....................................................................................................... 10
1.3 The methodology and scope ................................................................................ 11
1.4 Structure of the study ............................................................................................ 12
1.5 Conceptual framework of the study ...................................................................... 13
1.6 The analytical model ............................................................................................. 14
2 DEFINITION OF A BRAND (PHENOMEN) AND BRAND AWARENESS ................... 15
2.1 Building brand equity ............................................................................................ 17
2.2 Brand recognition and recall ................................................................................. 18
2.3 Brand Asset Valuator (BAV) -model of brand equity ............................................. 20
3 BRAND IMAGE........................................................................................................... 21
3.1 Brand positioning .................................................................................................. 22
3.2 Brand mantras ...................................................................................................... 23
3.3 Brand loyalty ......................................................................................................... 23
3.3.1 Brand experience ............................................................................................ 24
3.3.2 Brand Halo ...................................................................................................... 25
3.3.3 Your Brand Storybook™ ................................................................................. 26
4 LAATUKESKUS, EXCELLENCE FINLAND ................................................................ 27
5 RESEARCH METHODOLOGY .................................................................................. 28
5.1 Quantitative and qualitative research .................................................................... 29
5.2 Reliability and validity ........................................................................................... 31
5.3 Data collection methods ....................................................................................... 33
5.4 Data analysis ........................................................................................................ 35
6 SURVEY RESULTS ................................................................................................... 36
6.1 Current customers ................................................................................................ 39
6.2 Potential customers .............................................................................................. 66
6.3 International Partners ........................................................................................... 79
7 CONCLUSIONS ......................................................................................................... 88
7.1 Managerial implications ........................................................................................ 90
7.2 The theoretical part of the study ........................................................................... 93
7.3 Conclusions, current customers ............................................................................ 94
7.4 Conclusions, potential customers ......................................................................... 98
7.5 Conclusions, international partners ..................................................................... 100
7.6 Further study suggestions .................................................................................. 101
REFERENCES ................................................................................................................ 102
LIST OF FIGURES
APPENDICES
Appendix 1. COVER LETTER, CUSTOMERS
Appendix 2. COVER LETTER, POTENTIAL CUSTOMERS
Appendix 3. COVER LETTER, INTERNATIONAL PARTNERS
Appendix 4. Survey Pal Questions: Current customers
Appendix 5. Survey Pal Questions: Potential customers
Appendix 6. Survey Pal Questions: International Partners
6
1 INTRODUCTION
1.1 Background of the study
The need for this study arose from the company in question, Laatukeskus, Ex-
cellence Finland, which is a 100% owned company of the Laatuyhdistys ry
(Registered Association). It is supporting the Association's activities by provid-
ing training and expert services. This research looks at the company’s current
brand image from the point of view of the existing and potential stakeholders.
In this study, the brand name Excellence Finland is used to cover the entire
activity and services of the company. The company structure will be explained
more in detail in chapter 4.
At first, the idea started to develop after discussions and personal meetings
with the Quality Manager, and later with the CEO and the Training Manager.
In the first discussions occurred, that it had already been planned to imple-
ment an online questionnaire regarding the brand image, but had never being
realized. The thesis subject was then agreed to be related to the need of this
kind of evaluation of the brand image from the view point of the company
stakeholders.
The idea further developed, since it occurred to be the company’s 50th working
anniversary in 2016, and to celebrate this, a brand renewal project was
started. This project is now ongoing and includes a recruitment of new cus-
tomers, which is aimed to increase their membership significantly as well as
better support the customer’s wishes and needs of the development. The tar-
get groups were thereafter confirmed to be three; key corporate- and support-
ing members as well as individual members. Namely, the target groups were
agreed to be current customers, potential customers and current international
partners.
The results of this thesis study will be used for the benefit of the Excellence
Finland’s brand renewal and recruitment project to develop their operations
holistically, in particular to serve and meet the expectations of current and fu-
ture customers of their services and products. Additionally, the results of this
thesis will be expected to reveal holistic development of Excellence Finland’s
7
brand image. This is supported by the relevant theory of brand awareness and
brand image, where the latter is a product of brand associations.
The schedule of this project was to set until May 2016 regarding the results of
the survey, and until December 2016 for the final report. However, the final re-
port was later agreed to be ready until October 2017. The agreed schedule
was managed like planned and the few changes in schedule of the final report
were also approved and justified.
1.2 Research and Development objectives
At the beginning of the review of the brand phenomenon in general, it was dis-
covered, that the concept has been attracting interest in business and man-
agement fields and plenty of previous studies were found. For example, the
relatively recent study of Hammond (2008, 10) impresses, how brand is a ma-
jor factor in a process of decision making. He also claims, how brand resides
in the mind and – without a strong brand a company cannot differentiate itself
or “you are dead in the water”. However, very little research was found on de-
veloping brand image, although it is very important part of any company’s
marketing program. Further during this research, it was learned how brand im-
age development is a process and strong brand image attracts your custom-
ers towards your products. A strong brand image is also a unique competitive
tool to fight against your competitors.
In this study, the theoretical background involves the dimensions of the inter-
linkages and inequalities between brand awareness and brand image and in-
troduces the related terms, but at first explains shortly the phenomenon of
brand, supported by the relevant literature.
However, for example, Keller (2013, 76–77) determines, how brand aware-
ness must be first created before the brand image. In addition, to create a
positive brand image, strong favourable and unique associations towards a
brand in people’s memory must be first created and be linked as well as im-
plemented with marketing programs.
8
Onward, it is claimed that the world is moving into a people-driven economy,
meaning the consumer is ‘in the seat of power’ - - and the brands engage con-
sumers on the level of senses and emotions (Gobe 2009, 17–18). Hammond
(2008, 18) also underlines the importance of holistic experience for the cus-
tomer, and branding is therefore “looking out from the window of a customer”.
Although this is important, influencing customer experiences, is argued for ex-
ample by Hammond, to be basically all you need to build a brand. Albeit this
can be agreed, the chapter of Brand experiences and Brand Halo determine
this even further with the importance of Emotions, Perception, Innovation and
Communication (mnemonic of EPIC), when the organizations want to build
stakeholder loyalty (Hammond 2008, 20–21).
Regarding the empirical research, although the Excellence Finland’s services
annually evaluate companies, covering external expert evaluations, self-evalu-
ations and development validation, the company's own brand image and
awareness of development has received less attention. Additionally, the Ex-
cellence Finland believes, that they are the standard-bearer for excellence in
Finland, an active builder of networks and Finland’s messenger in quality af-
fairs rooted in honesty and wellbeing. However, these assumptions have
never been verified on behalf of their stakeholders.
Thus, this study is based on the need and interest of the case company to ver-
ify these assumptions by investigating this in detail likewise to discover the
current stage of brand awareness, and how to develop brand image among
the selected target groups with the quantitative approach, with qualitative ef-
fect.
The aim of the study is to conceptualize and measure the brand awareness
and brand image of the case company. The research objective is to
strengthen and develop current brand image and to increase brand aware-
ness among the selected target groups. Secondly, objective was also to main-
tain and strengthen the case company’s brand loyalty and reputation among
existing and potential customers as well as international partners.
9
1.2.1 Research and Development question
The research question based on the objectives and the problem definition
above is;
How should the experienced brand image be improved?
Brand image is a very wide subject and could be defined for example as a cur-
rent and immediate reflection, which the stakeholders have of the organization
itself (Abratt& Kleyn 2012, 1055). The research question was chosen to be
simple and relevant against to the thesis title. Furthermore, it was very soon
noticed, that the related term of brand positioning (to name a few) was one
major component to control the marketing strategy and to maximize potential
benefit to the company.
Moreover, another main subject of this study is brand awareness, which is
very much related to the brand image. It was again well-noticed, how it should
be first recognized before the brand image and that brand awareness is also
related to brand recognition and brand recall (Cf. Chapter 2.2) Additionally,
brand awareness is a basic dimension of brand equity, which means the con-
sumer must be aware of the brand to have brand equity. (Shimp 2010, 36–
38.) Therefore, to understand this more deeply, for example the Keller’s Cus-
tomer-based Brand Equity Framework Model (in Figure 4) presents two levels
of brand awareness, superficial level of brand recognition and a deeper form
of brand awareness, brand recall.
In the questionnaire the respondents were asked, how to improve the current
brand image of Excellence Finland. This was an open-ended question and as
a result, many great developmental perspectives and ideas were given directly
through the actual questionnaires. However, the author’s own analysis and the
selected theory support these replies and give deeper viewpoints to the re-
search.
10
1.2.2 Limitations
Limitations in this study exist in three categories; focus, the information and
research methods. The focus of this study on brand awareness and brand im-
age are very wide subjects and therefore the topics are limited only to se-
lected related terms, such as brand recognition and brand loyalty. Also, the
other related terms of brand experiences and brand Halo®, present the per-
spective of the emotions of the people likewise communications, in this study.
Secondly, it is presented how these are claimed to be vital for creating power-
ful brands.
The information of this research is mainly narrowed to the last 10 years,
meaning the information is brief and being focused only on the selected terms
and subjects relevant to this study in the last ten years. The material is col-
lected from the books, international journals and chapters in edited online
books, and websites. New and updated information from the Internet is im-
portant, because there the development seems to be faster than in traditional
books. However, all the information cannot be trusted 100% and the author
should be critical and question these materials, because the information
changes so rapidly. Although, the main trends and the latest research is mir-
rored to this study.
The research methods were chosen and limited to be online questionnaire(s),
in-depth interview(s) and internal documents. The answers of the interview
consisted mainly about basic background information about the company.
Therefore, the author had to search the company web pages and its printed
material a lot, to understand the operations and practices. Also, the answers
of the in-depth interviews were mostly the same that had already been pub-
lished. However, this qualitative method of in-depth interviews to use open-
ended questions proved to be vital to the company and they were very eager
to cooperate with this project.
Limitations of the results was also concerning the public version of the final re-
port. The customer names and the organization names the online question-
naires were sent to, was agreed to keep secret to protect the privacy of Excel-
lence Finland. However, the main results were published but limited to ex-
clude the amount of the respondents, only the number of organisations was
11
revealed, and not the amounts of respondents, which affects the response
rate calculations upward. In other words, the results of the research will be
used for the internal purposes and only the key findings will be published.
The benefit of this research for the case company could have been to under-
stand and further develop Excellence Finland’s brand strategy, with the clues
and development hints shown in this study of brand image and brand aware-
ness research and see the people as a powerful element of any branding
strategy. However, this research will not concentrate on building brand strate-
gies, only presenting some models to understand the dimensions of brand im-
age and brand awareness and to analyse the questionnaire results to add a
stakeholder’s and potential customer’s viewpoint to this subject.
1.3 The methodology and scope
The empirical research is based on a quantitative survey in cooperation with
the case company, Excellence Finland. However, qualitative element is also
added, because there are open-ended questions in the questionnaires.
This study is a survey research, but also some case study elements can be
found. A case study usually prefers contemporary events and answers “how”
and “why” questions. The research question applies in that way to a case
study as well. In addition, a case study is used to contribute knowledge gained
from individuals, organizations, groups or objects etc. The case study is then
an in-depth study to collect both quantitative and qualitative data even at the
same time.
On the other hand, in surveys is usually collected quantitative evidence.
These both research methods comprise several data collection methods, like
reports, interviews, observation and archives likewise questionnaires etc.
(Ghauri & Grønhaug 2010,109; Quinlan 2011, 183; Yin 2003, 7.)
This survey was implemented with online questionnaires, which are three in
number and tailored to each group including open questions. This makes the
form of the questionnaires both semi-structured and structured in form. Sec-
ondly, the in-depth interviews and internal documents of the company are a
secondary data collection method. (Read more in Chapter 5.)
12
To process the research question, the chosen technique to analyze the quan-
titative data is statistical methods with pie charts and column diagrams. Sec-
ondly, qualitative data of open-ended questions are presented in tables modi-
fied from Survey Pal Excel sheets to exploit the inner thoughts of the respond-
ents. Also, the qualitative part of the study was collected with in-depth inter-
views. In the end, the findings of this study are discussed and mirrored to the
theoretical part of the study to evaluate the empirical research linked to the
framework.
1.4 Structure of the study
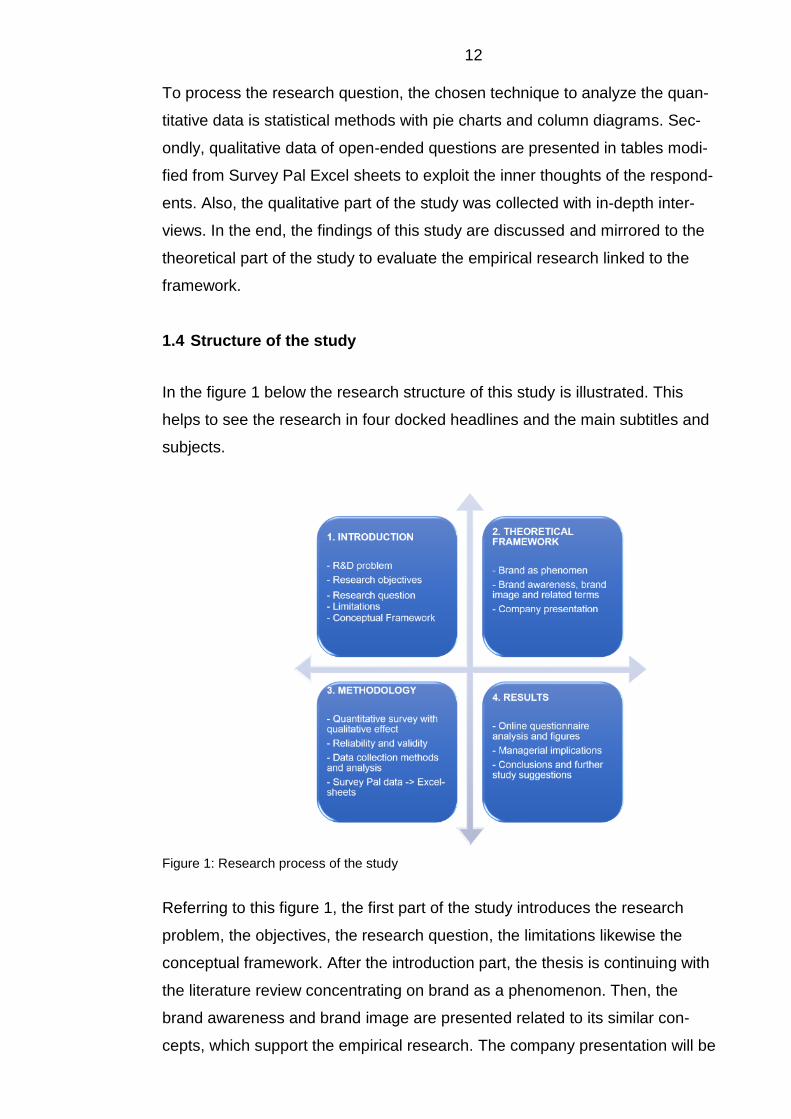
In the figure 1 below the research structure of this study is illustrated. This
helps to see the research in four docked headlines and the main subtitles and
subjects.
Figure 1: Research process of the study
Referring to this figure 1, the first part of the study introduces the research
problem, the objectives, the research question, the limitations likewise the
conceptual framework. After the introduction part, the thesis is continuing with
the literature review concentrating on brand as a phenomenon. Then, the
brand awareness and brand image are presented related to its similar con-
cepts, which support the empirical research. The company presentation will be
13
introduced next to give a picture of the case company to a reader. After this
the research methodology is presented. The last part of the study reveals the
survey results and includes the analyses of the results as well as the future
study development as well as managerial suggestions. The appendices are
the last documents, which illustrate the research and the sent documents in
practice.
The theoretical framework is followed by methodological issues presenting the
principles of quantitative methods for data collection and analysis. However,
the qualitative method is a secondary method, because there are open ques-
tions in the questionnaire as well. In the next chapter the conceptual frame-
work of this study is first described.
1.5 Conceptual framework of the study
In this chapter are presented dimensions of brand image and brand aware-
ness and their related terms. The theoretical framework of the thesis intro-
duces previous research of the phenomenon of brand, brand awareness and
its related terms based on categories such as brand image, brand recognition
and brand loyalty.
The relevant literature and peer-reviewed journals regarding these mentioned
topics in previous studies and knowledge provided from the company is cho-
sen to support the thesis context. The theoretical framework was selected re-
garding the relevance against the thesis title. First, the brand is narrated
shortly as a phenomenon. Secondly, the linkages between the terms related
to brand awareness and brand image will be next discussed and different
views of previous research studies will be compared and analysed.
The theoretical framework and the chosen quantitative data analysis method
are mainly based on the research of Quinlan’s (2011) Business Research
Methods, and Research Methods in Business Studies of Ghauri and
Grønhaug (2005 and 2010), and on relevant literature as well as peer re-
viewed articles and the information of internal documents of the company are
given basis to the theoretical framework.
14
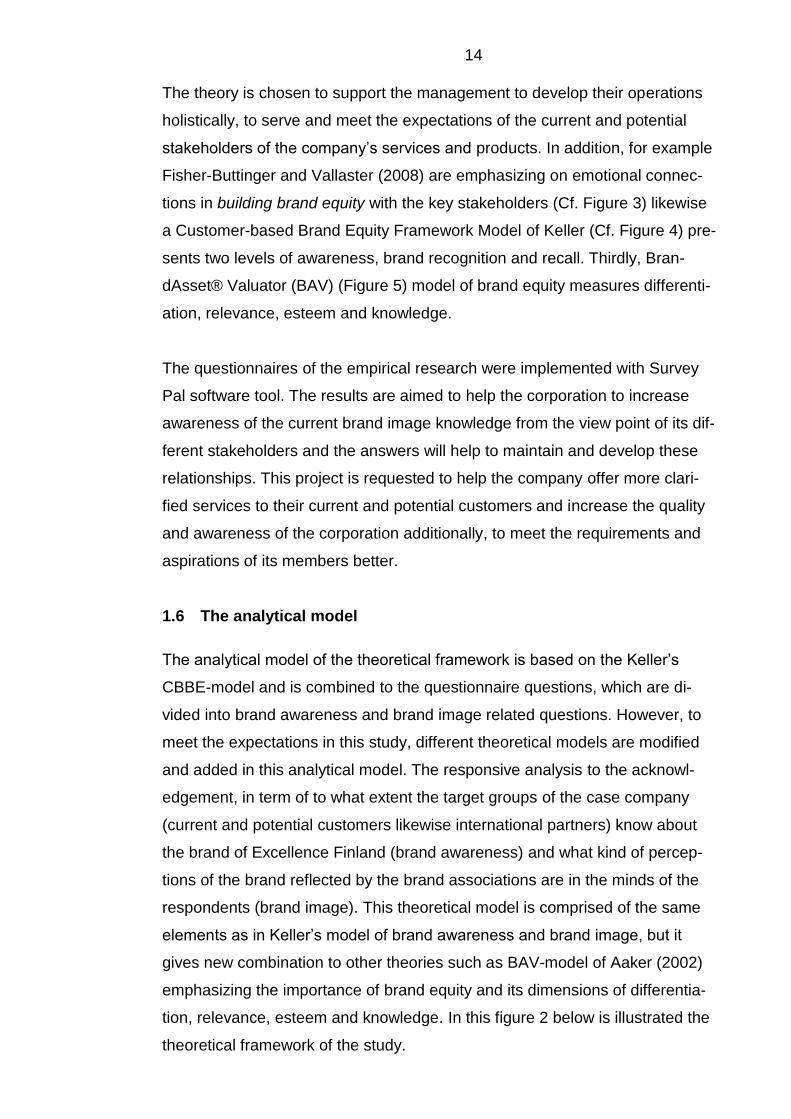
The theory is chosen to support the management to develop their operations
holistically, to serve and meet the expectations of the current and potential
stakeholders of the company’s services and products. In addition, for example
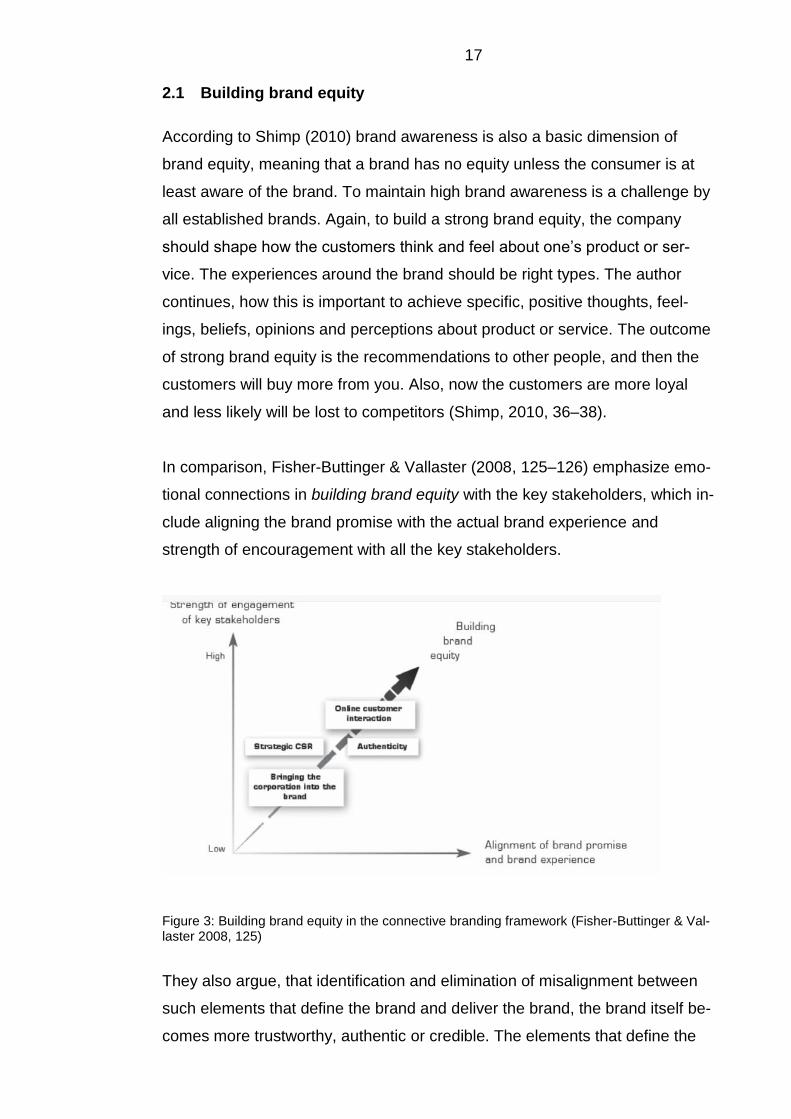
Fisher-Buttinger and Vallaster (2008) are emphasizing on emotional connec-
tions in building brand equity with the key stakeholders (Cf. Figure 3) likewise
a Customer-based Brand Equity Framework Model of Keller (Cf. Figure 4) pre-
sents two levels of awareness, brand recognition and recall. Thirdly, Bran-
dAsset® Valuator (BAV) (Figure 5) model of brand equity measures differenti-
ation, relevance, esteem and knowledge.
The questionnaires of the empirical research were implemented with Survey
Pal software tool. The results are aimed to help the corporation to increase
awareness of the current brand image knowledge from the view point of its dif-
ferent stakeholders and the answers will help to maintain and develop these
relationships. This project is requested to help the company offer more clari-
fied services to their current and potential customers and increase the quality
and awareness of the corporation additionally, to meet the requirements and
aspirations of its members better.
1.6 The analytical model
The analytical model of the theoretical framework is based on the Keller’s
CBBE-model and is combined to the questionnaire questions, which are di-
vided into brand awareness and brand image related questions. However, to
meet the expectations in this study, different theoretical models are modified
and added in this analytical model. The responsive analysis to the acknowl-
edgement, in term of to what extent the target groups of the case company
(current and potential customers likewise international partners) know about
the brand of Excellence Finland (brand awareness) and what kind of percep-
tions of the brand reflected by the brand associations are in the minds of the
respondents (brand image). This theoretical model is comprised of the same
elements as in Keller’s model of brand awareness and brand image, but it
gives new combination to other theories such as BAV-model of Aaker (2002)
emphasizing the importance of brand equity and its dimensions of differentia-
tion, relevance, esteem and knowledge. In this figure 2 below is illustrated the
theoretical framework of the study.
15
Figure 2: Analytical model of the theoretical framework
2 DEFINITION OF A BRAND (PHENOMEN) AND BRAND AWARENESS
Brands are part of the urban wallpaper and they have invaded all the sectors
of our lives. However, we may think we are so developed, more knowledgea-
ble and critical nowadays that we have antibodies to resist even the most so-
phisticated brand policies. But, the brands are also more consecrated and col-
located in this new brand era. Products, which are derivatives of brands, are
integral parts of society. Coca Cola or McDonald’s are some examples of
powerful brands, that have social acceptance, despite the negative view-
points. Branding has been usually claimed to enter a phase of inexorable de-
cline. Again, the roles of brands are more complex, pervasive as well as multi-
faceted, which take into consideration social criticism and public opinion.
However, to face competitors, being ethical is the new axiom. Individual val-
ues are important to achieve economic aims and unique brands should pursue
new aims linked to these values. Companies could also rethink the very na-
ture of their brand, the emotional, mental and spiritual vision, which are more
important than the material image and its being (Fioroni and Titterton 2009, 3–
4).
Hammond (2008, 14) likewise argues with defining a brand as a “total sensory
experience a customer has with your company and its product or service.” The
experience here refers to any person who has ever been in contact whether
with your company staff, product or service. Before creating any logos or col-
16
our schemes, customers should be put first, and consider in a customer per-
spective the right kind of relations and develop them. So-called ‘cart-before-
horse-ism’ is the trouble some small businesses face, when they work anti-
clockwise working first for the logos and symbols or corporate identities before
the customer needs. The understanding of their company place in the whole
brand scheme is then not understood properly. Instead, one should look
through the window of a customer and not look out as a business owner. After
that, it is possible to influence on your customers’ experiences.
In the literature of branding, brand awareness consistently refers to a brand’s
quality likewise to brand’s state or familiarity. Brand awareness could also be
defined as the strength of the corporate brand node, or in other words, trace in
memory. (Ormeno, 2007, 74.) To enlighten more, it is reflected by the ability of
constituency to recognize or recall the corporate brand under any conditions.
This is also supported by Ojasalo & Ojasalo (2010), when they determine
brand awareness as a customer’s ability to identify and remember the brand in
all kinds of circumstances. In addition, Ormeno (2007), continues that when
the constituencies recognize the company name or brand elements, they
should recall the company in a certain industry or business. (Cf. more in
Chapter 2.2) To conclude, brand recognition and the brand recall effect to the
brand awareness level, as well is believed to be strongly dependent on both
mentioned types of awareness performance. (Keller 1993, 1998, 50; Rossiter
and Percy, 1997, 113 cited in Ormeno, 2007, 75.)
Again, Ojasalo & Ojasalo add, how the most significant element of brand
awareness is the brand name, which generally creates symbolic significance
likewise is important part of marketing communications. (Ojasalo & Ojasalo
2010, 240.) However, it can be noted that just a good brand name is not
enough. Therefore, previous studies explain this further, for example Pulk-
kinen (2003) states, how a good brand name is well-known enough and
clearly distinguished from the competitors. Also, the brand name should be
able to redeem the given promises again and again to achieve as well as to
maintain a unique place for customer’s minds. Additionally, brand promise
should be relevant to customers, both at the level of knowledge and further at
the operational level. (Pulkkinen, 2003 52.)
17
2.1 Building brand equity
According to Shimp (2010) brand awareness is also a basic dimension of
brand equity, meaning that a brand has no equity unless the consumer is at
least aware of the brand. To maintain high brand awareness is a challenge by
all established brands. Again, to build a strong brand equity, the company
should shape how the customers think and feel about one’s product or ser-
vice. The experiences around the brand should be right types. The author
continues, how this is important to achieve specific, positive thoughts, feel-
ings, beliefs, opinions and perceptions about product or service. The outcome
of strong brand equity is the recommendations to other people, and then the
customers will buy more from you. Also, now the customers are more loyal
and less likely will be lost to competitors (Shimp, 2010, 36–38).
In comparison, Fisher-Buttinger & Vallaster (2008, 125–126) emphasize emo-
tional connections in building brand equity with the key stakeholders, which in-
clude aligning the brand promise with the actual brand experience and
strength of encouragement with all the key stakeholders.
Figure 3: Building brand equity in the connective branding framework (Fisher-Buttinger & Val-laster 2008, 125)
They also argue, that identification and elimination of misalignment between
such elements that define the brand and deliver the brand, the brand itself be-
comes more trustworthy, authentic or credible. The elements that define the
18
brand e.g. brand principles, brand vision or brand architecture is therefore
eliminated likewise delivering elements like brand metrics, enabling processes
or actual employee behavior is also identified, but eliminated.
The authors here may refer, to find the very pure brand without any disturbing
elements and to start from a clear table, is to cut former habits and meters.
Referring to the authors, meaningful ways to engage employees, customers
and other stakeholders is to find continuously appealing dialogue. This could
lead to building emotional connections with all the key stakeholders and again
satisfy their heightened need for information likewise creates transparency.
In this connective branding framework, the brand is organized around four
brand levers. These are brand strategy, brand building and management,
stakeholder engagement and enabling processes and structures.
2.2 Brand recognition and recall
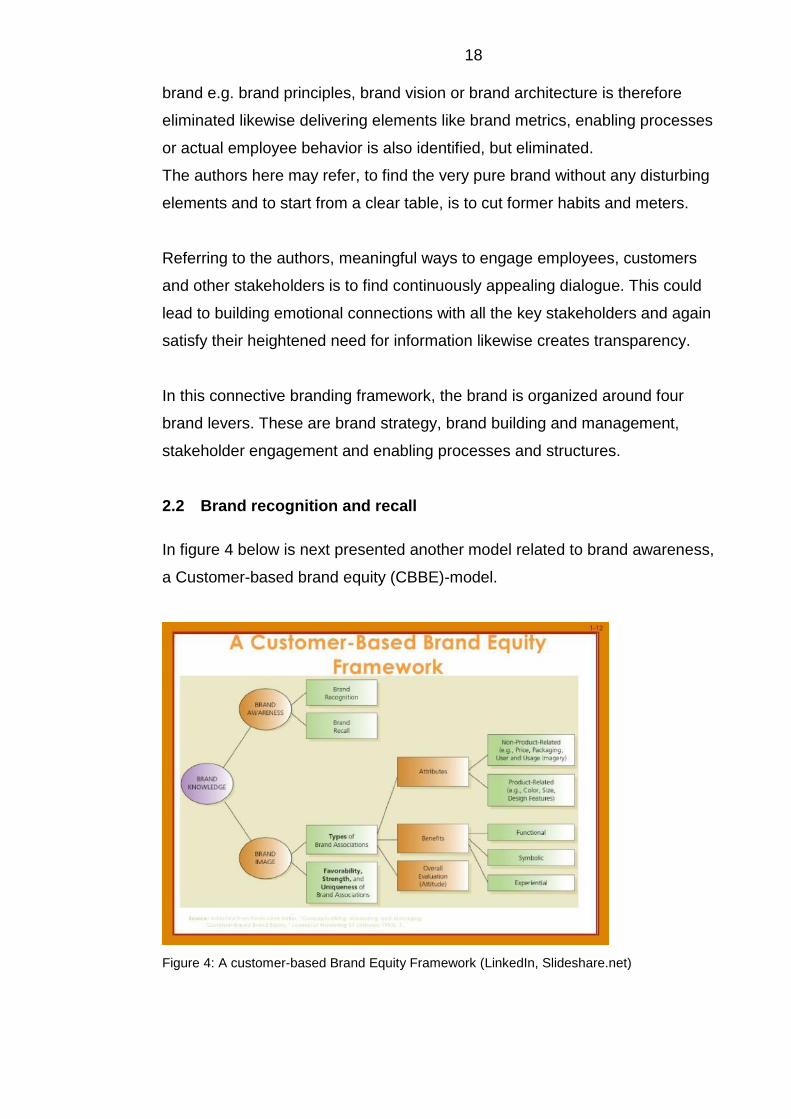
In figure 4 below is next presented another model related to brand awareness,
a Customer-based brand equity (CBBE)-model.
Figure 4: A customer-based Brand Equity Framework (LinkedIn, Slideshare.net)
19
In this model brand knowledge is consisting of a brand node in people’s
memory in which variety of associations are linked to. According to this Kel-
ler’s Customer-based brand equity (CBBE)-model can be noticed, how the rel-
evant dimensions affecting customer’s response are the awareness of the
brand, related terms of brand recall and recognition likewise favorability,
strength and uniqueness of brand associations created in people’s memory.
The brand recall is a deeper form and the brand recognition more superficial
level of awareness. With hints or cues provided, customers can identify a
brand - this is recalling, which marketers aspire.
For example, if a person is requested to name a luxury automobile, most
would say Mercedes-Benz, or in the sports industry, athletic footwear could
bring into mind of many people, for example, Nike or Reebok. A marcom im-
perative is to move brands to top-of-mind awareness (TOMA) from a state of
unawareness. This status exists if the company brand is the very first brand
that the one(s) recall, when they think about brands in certain product catego-
ries.
Two properties to determine brand awareness level are depth and breadth.
These are relevant, because it helps to understand constituency behavior to-
wards a corporate brand (Keller 1998 cited in Ormeno 2007, 88). The depth of
brand awareness refers to a likelihood, how easily and likely the brand ele-
ments will come to mind. Also, this depth depends on brand visibility which is
on the other hand affected by the branding strategy of the company. In turn,
breadth of brand awareness refers to the situations, when the corporate brand
is coming to mind. Secondly, the earlier mentioned ‘equity’ of a corporate
brand depend on these both properties of depth and breadth. But, how to
measure brand awareness?
Churchill and Iacobucci, (2002 cited in Ormeno 2007, 75) continue, how the
primary data of brand awareness could be measured, based on communica-
tion, particularly on questionnaires. There are several measures of awareness
to assess the depth of corporate brand recognition, and it can be direct or indi-
rect. In direct measures, the constituencies can be shown single items or per-
ceptually degraded versions of them and simply ask whether they had seen or
20
heard of them previously or not. In turn, in indirect approach eye tracking tech-
niques can be utilized or the effectiveness can be tested on pupillometric or
other equipment. For example, alternative package designs could be tested
this way. (see more Churchill and Iacobucci 2002, 306.)
2.3 Brand Asset Valuator (BAV) -model of brand equity
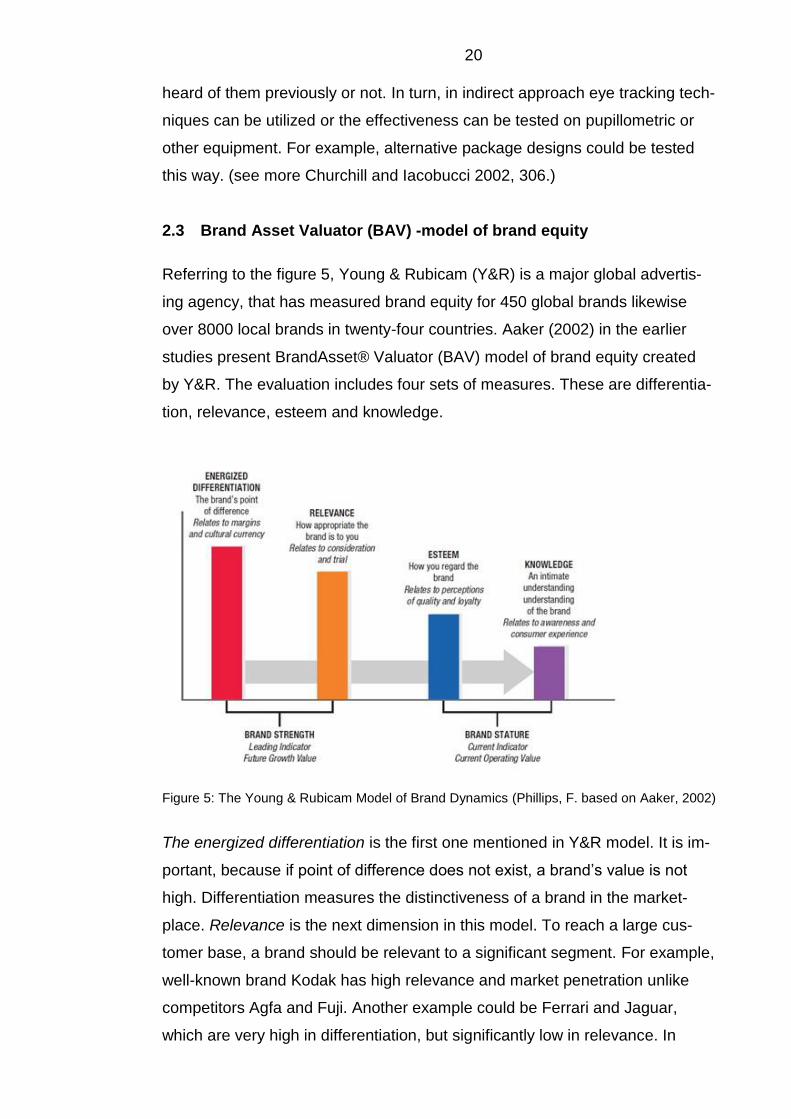
Referring to the figure 5, Young & Rubicam (Y&R) is a major global advertis-
ing agency, that has measured brand equity for 450 global brands likewise
over 8000 local brands in twenty-four countries. Aaker (2002) in the earlier
studies present BrandAsset® Valuator (BAV) model of brand equity created
by Y&R. The evaluation includes four sets of measures. These are differentia-
tion, relevance, esteem and knowledge.
Figure 5: The Young & Rubicam Model of Brand Dynamics (Phillips, F. based on Aaker, 2002)
The energized differentiation is the first one mentioned in Y&R model. It is im-
portant, because if point of difference does not exist, a brand’s value is not
high. Differentiation measures the distinctiveness of a brand in the market-
place. Relevance is the next dimension in this model. To reach a large cus-
tomer base, a brand should be relevant to a significant segment. For example,
well-known brand Kodak has high relevance and market penetration unlike
competitors Agfa and Fuji. Another example could be Ferrari and Jaguar,
which are very high in differentiation, but significantly low in relevance. In

21
other words, very few people would consider buying these luxury labels be
caused by the impracticality for daily use. Brand strength is created by both di-
mensions and the brand of Disney is one of the few, that seems to be high on
brand strength.
Third dimension of this model Esteem is very much based on perceived qual-
ity. Comparatively, there are exceptions like Japan in which perceived quality
is less greater variability in esteem, than perceived popularity. In turn, the last
dimension of knowledge, is not only awareness of a brand, but understanding
what the brand stands for. It is generated by a real customer intimacy towards
the brand unlike awareness, which is only built by exposures. Together, es-
teem and knowledge create brand stature construct (Aaker 2002, 306–307).
3 BRAND IMAGE
The brand image of an organization represents the current and immediate re-
flection, which the stakeholders have of the organization itself. The concept of
image is appropriate to the conceptions of stakeholders in the organization as
it embodies topical opinions (Bick et al. 2003; Balmer 1998; Gray and Balmer
1998 cited in Abratt& Kleyn 2012, 1055). The brand image is also associated
with the different physical and behavioral attributes of the organization. Such
features include, for example, the name of the company, the range of products
and services, the ideology, and the quality tips provided by the organization's
products, services and people (Nguyen and Leblanc 2001 cited in Abratt&
Kleyn 2012, 1055.)
However, a sufficient level of brand awareness must be first created, before
marketers can put more emphasis on crafting a brand image. To create a pos-
itive brand image, a company should use marketing programs to link strong,
favourable and unique associations towards a brand in people’s memory.
These brand associations can be brand attributes, which may be descriptive
features to characterize a product or service. In addition, they can be brand
benefits that contain personal value and meaning, which can be attached to
the product or service attributes. However, the beliefs about the brand attrib-
utes and befits are formed differently. For example, brand associations can be
formed from direct experience, on online surfing, on consumers reports, from
22
word of mouth or simply by assumptions about the brand itself like name,
logo, country, place or event etc. Consequently, communication strategies
should consider the influence of these sources of information. This could hap-
pen by well managing them likewise adequately accounting for them in design
work of the communication strategies.
In conclusion, to create a customer-based brand equity based on a differential
response, marketers should focus on strongly held brand associations that are
both favourable and unique and not shared with competing brands. Unique-
ness is helping one’s consumers or customers to choose the brand. However,
marketers should also analyse very carefully the customers-base as well as
competition to determine the best positioning to one’s brand (Keller 2013, 76–
77).
Uniqueness could be related to personality. Rossolatos (2012, 27) mentions
brand congruence hypothesis, which is created, when the brand personality
correspondence with the consumer’s or brand users’ personality. (Cf. also
earlier studies of Birdwell 1968; Parker 2009; Solomon et al. 2006; Sirgy
1982) If the metaphor of the brand is used as personality, sometimes, mani-
fest through a celebrity in brand advertisements may customers’ find it easier
to appreciate the emotional values of the brand. (De Chernatony 2006, cited in
Rossolatos 2012).
3.1 Brand positioning
Brand positioning means to find a proper location in the minds of people. This
could refer to the minds of a group, of consumers or market segment. If the
brand positioning is successful, it helps to guide marketing strategy and to
maximize potential benefit to the company. It helps to clarify what brand is
about, how it is unique, or similar with other competitive brands as well as
identifies why the consumers should purchase and use it. Positioning also
means to identify the target market and the nature of competition likewise opti-
mal points-of-parity and -difference of brand associations. In other words, mar-
ket people must know who the target consumer is, how the brand is similar
and different compared the competitors (Keller 2013, 79).
23
Srivastava et Metz (2016, 4–6) clarify this, and state how points-of-parity
(POPs) is not just points-of-equality, but an adequate number of consumers
believing that the brand is good enough on attributes and benefits. In other
words, brand associations are not that unique to the brand, but may contain
same elements as competitors and shared by other similar brands. Thus,
points-of-difference (PODs) are attributes or befits than can be related to and
cannot be found among competitors. However, these both are important and
should be used in brand positioning that there is both rational and emotional
components.
3.2 Brand mantras
In the previous research brand mantra has been brought up for example by
Keller (1999). Again, Srivastava & Metz’s (2016) research emphasizes its im-
portance and compares brand mantra into “brand essence” or “core brand
promise”. These mantras are short but captive and very powerful devices.
What a brand mantra should do, is to summarize the crucial and salient con-
siderations of a brand. Nike, is one example of a brand, that economically
communicates what their brand is. The brand mantra of authentic athletic per-
formance also presents the brand values conveyed by its brand mantra. How-
ever, the difference to brand slogan is, that brand mantras are intended with
internal purposes only and slogans, such as “Just do It” slogan of Nike, only
for external use. The three key components for a successful brand mantra
are;
- Communication - A good brand mantra defines the business catego-
ries, uniqueness and boundaries
- Keeping things simple – Be memorable, vivid, short and crisp
- Inspire people – A brand mantra is effective, when it stands out and is
meaningful and relevant to all the employees of a company
3.3 Brand loyalty
The concept of brand loyalty is strategically important to companies to obtain
a sustainable competitive advantage. There are plenty of reasons why it is so,
and next is listed five of them. The first is, that those brand-loyal consumers
24
are less expensive, because they reduce the marketing costs in business.
Secondly, a brand that exhibits high quality is less risky for brand extension.
Thirdly, it has been shown, how brand loyalty affects and associates with
higher rates of return on investment through increases in market share. Fourth
point of view is, that brand-loyal consumers less likely search for alternatives
thus reducing probability to switch to another brand. Furthermore, brand loy-
alty has also been a major determinant of brand equity. (Gounaris&
Stathakopoulos, 2004 283.)
Brand loyalty is a very complex construct; however, it can be defined as a re-
peat purchase, preference and commitment or retention and allegiance. In ad-
dition, there exists several aspects in behavioural or attitudinal brand loyalty.
Brand trust is also related to the customer behaviours, also before as well as
after one’s purchase and it can cause long term loyalty likewise could
strengthen the relation between these two (Liu et al 2011).
Brand loyalty has been on discussion for at least the last three decades in the
marketing literature. It has argued to relate to brand equity process and lead-
ing to certain marketing advantages like marketing costs, making more new
customers and trade leverage.
3.3.1 Brand experience
When the organizations want to build stakeholder loyalty they need to con-
sider the experiences there exist among them, while interacting with the
brand. There are many brand-related stimuli for which the customers are sus-
ceptible to the brand. These include brand recognition features, shapes, fonts,
background design elements, slogans, packaging, marketing communications
and the environment where the brand is sold. (Brakus et al. 2009 cited in
Abratt& Kleyn 2012) These all are also linked with four dimensions of the
brand image, which are next presented.
Sensory experiences occur when visual or other senses are used to perceive
brand-related stimuli. Second is behavioral experiences which involve physi-
cal actions as well as behaviors that occur when consumers (or customers)
associate with consumption of the brand. Third is intellectual experiences that
25
are result of the consumer (or customer) being curious. This also encourages
cognitive reflection while experiencing the brand (Abratt& Kleyn 2012).
These brand experiences deepen the association with a brand, because such
experiences strengthen memory traces. Lack of brand experiences may lead
to a weak brand and the customers are not able to build a strong brand in their
minds.
3.3.2 Brand Halo
To have a major influence on the perception of your customers, a Brand
Halo™ can help you. It includes logos, mission, slogans etc., but the purpose
may remain empty if these are used in isolation. Again, if your Brand Halo™
fits right around your company and displays the best possible light of what
your company can offer, you will have a strong brand. (Hammond 2008, 19).
A brand halo is built on four components, which are Emotions, Perception, In-
novation and Communication. This is easy to remember if one uses the mne-
monic of EPIC. Hammond (2008 20–21) presents each of them.
First, the author is emphasizing emotion, which is the key part of creating a
powerful brand and all the rest next listed is built on this. If the emotion is
missing you simply have a commodity and not a brand. Further, emotions are
influenced by sensory stimulation. This happens through five senses at the
brain, which are sight, sound, smell, taste and touch. A strong perception of
the brand in the minds of a customer is reached through all the senses rather
than just one, like the ‘sight’ sense. However, even these five senses are im-
portant to recognize, it is not enough. In the Innovation-part Brand Halo®
could be compared to a guiding light, where the employees will be guided with
the Brand Halo manual of important processes, systems and procedures to
monitor and improve each customer Brand Reflection. The brand is then alive
with the innovation and longevity is achieved. Also, innovation provides fresh-
ness to keep one’s brand ‘top of mind’ in terms of purchasing decision.
The last of the four parts of Brand Halo core components is communication.
To describe one’s purpose, Brand Storybook helps in creating an emotional
brand. Using narratives to describe your business, aims and achievements, a
26
company can communicate emotional messages to the customers likewise to
the employees. The whole customer experience is then underpinned this way
with the help of Brand Storybook.
People, society and cultural biases change, and brands are not static. This
means one’s brand has continually to be polished. With the help of Brand
Halo® a company can build a brand of EPIC proportions.
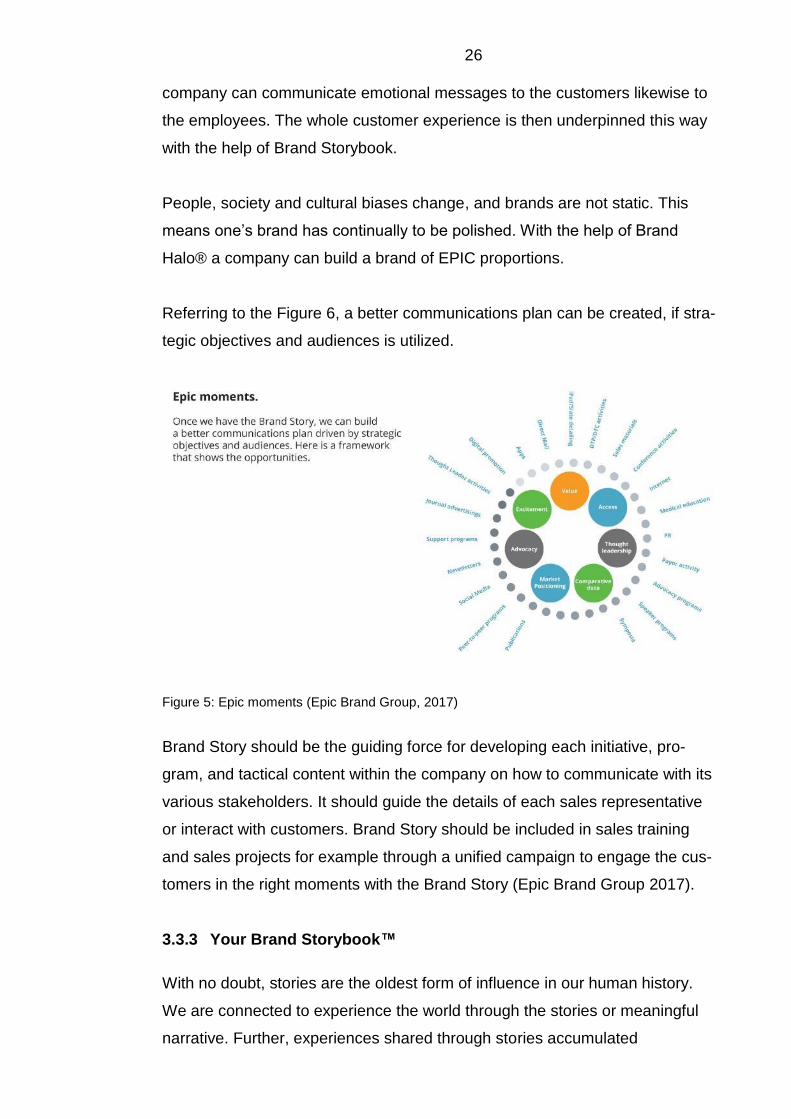
Referring to the Figure 6, a better communications plan can be created, if stra-
tegic objectives and audiences is utilized.
Figure 5: Epic moments (Epic Brand Group, 2017)
Brand Story should be the guiding force for developing each initiative, pro-
gram, and tactical content within the company on how to communicate with its
various stakeholders. It should guide the details of each sales representative
or interact with customers. Brand Story should be included in sales training
and sales projects for example through a unified campaign to engage the cus-
tomers in the right moments with the Brand Story (Epic Brand Group 2017).
3.3.3 Your Brand Storybook™
With no doubt, stories are the oldest form of influence in our human history.
We are connected to experience the world through the stories or meaningful
narrative. Further, experiences shared through stories accumulated
27
knowledge is shared, emotionally, likewise wisdom, beliefs and values. Even
though technological advances provide limitless achievements, still stories are
valued and is a basic need of everyone and keeps one motivated, exited and
inspired (Hammond, 2008 217–218).
Hammond (2008, 19) continues, how customers nowadays seek for meaning-
ful dialogue with suppliers or conversation with businesses rich in symbols,
metaphors, meanings and experiences. Powerful brand can hence be created
if such communication is offered to one’s customers. Respectively, Bill Dau-
phinais, who is a global leader of brand marketing and communications, con-
tinues, how brands are built around stories and identify who one is, or is com-
ing from. Thus, the most effective stories are born and bring brands alive.
Brand values should also meet with customers through captivating stories to
develop meaningful business relationships, in line with one’s credos, stance
and worldview. These customers who are similar to one’s values, beliefs,
ideas etc. are usually already naturally bonded to the brand, but also efforts
should be concentrated on these customers (Hammond, 2008, 220.) If a com-
pany decides to create their own Brand Storybook®, more details can be
found for example in Hammond (2008 from the page 223)
4 LAATUKESKUS, EXCELLENCE FINLAND
The commissioner of the thesis is Finnish Quality Association and its 100%
owned daughter company Laatukeskus Excellence Finland. In this study, we
will use the brand name Excellence Finland as “an umbrella” to comprise both
Finnish Quality Association and Laatukeskus Excellence Finland Oy.
The FQA operates in Espoo and Laatukeskus Excellence Finland supports the
operations by specializing in training and consultancy services. The FQA is an
ideological non-profit making association promoting quality management,
quality control, improving the business sector, public administration policy,
quality of products and the competitiveness. Currently it has over 500 Finnish
members namely private- and public-sector organizations and thousands of
business developers and opinion leaders are actively participating in the activ-
ities of the corporation.
28
There are three different kind of membership options; key corporate members,
supporting corporate members (companies and public-sector organizations)
and individual members. The policy guidelines are constituted by the Advisory
Board comprising senior managers from the key corporate members. The pur-
pose of the Advisory Board is to establish for each strategy period the national
agenda for quality.
Laatukeskus Excellence Finland also has national cooperation with partners,
which are considerable number of organizations actively promoting resistant
competitiveness in Finland. One significant partner is Finland’s Ministry of Em-
ployment and the Economy. International cooperation and networking with
several Quality Organizations around the world promotes Finland in quality
manners and develops and maintains the worldwide quality trends
(Laatukeskus 2015).
As mentioned, Laatukeskus Excellence Finland Ltd is owned by its subsidiary
called Finnish Quality Association, registered association (Suomen
Laatuyhdistys ry). The organization consists of three sections, which are Advi-
sory Board, Board of Directors and Personnel. The operations of the Finnish
Quality Association are directed by the Advisory Board, which is a group of top
executives of decision-making community members. The eighth-member
Board of Directors manage the operations of the association and the company
owned by it. In addition, three people work in the management team and there
are altogether 15 full-time employees. The auditor company is KPMG and the
financial management of the company is controlled by Rantalainen Ltd
(Laatukeskus 2017).
5 RESEARCH METHODOLOGY
The purpose of the empirical study was to explore the current brand image of
Excellence Finland from the point of view of their stakeholders and potential
customers. There were three different customer levels; current and potential
customers, and international partners. The purpose was to know, how the cur-
rent brand image should be improved. The meaning was also to find out char-
acteristics and differences between these target groups’ replies and which is
29
the current brand awareness level of the company, especially among potential
customers.
The conclusive research is based on sampling issues, and not the whole cus-
tomer-base of the case company is utilized in this study. To meet the require-
ments of this conclusive research and to achieve the overall picture of the cur-
rent state of brand image and brand awareness among the customers, a
quantitative approach was chosen. However, qualitative elements are also in-
cluded. The data collection was with an online questionnaire conducted in co-
operation with Excellence Finland and some guidance with their advertising
agency. The questionnaire was in three different forms, tailored to each target
group.
In the next chapter it is presented, how research methods are usually divided
into quantitative or qualitative methods. However, in some cases, these both
can be used to get a larger picture of the results. Also, alternative methods
can be utilized. But, the choice of a right method is selected based on the re-
search basis. For example, research question(s) determine the research
method (Newby 2010, 65).
5.1 Quantitative and qualitative research
In the earlier studies of the literature, research methods refer to a systematic,
focused collection of data gathered orderly. The purpose of the most suitable
method for one research project, is to solve or answer to a research problem,
and should be concerning the question, how to do things. Most commonly in
business studies, normal techniques are structured, semi-structured or un-
structured interviews, surveys or observations (Bennet 1986; Jankowicz 1991
cited in Ghauri & Grønhaug 2005).
The difference between qualitative and quantitative research is the procedure
rather than quality. Basically, in quantitative research findings are statistical
and the quantitative research utilizes measurement. In comparison, qualitative
research does not really measure things. However, the difference is not only
in quantification, but in addition in reflection of different perspectives on
knowledge as well as in research objectives. To analyse these methods more
deeply, the following figure 7 illustrates the main differences.
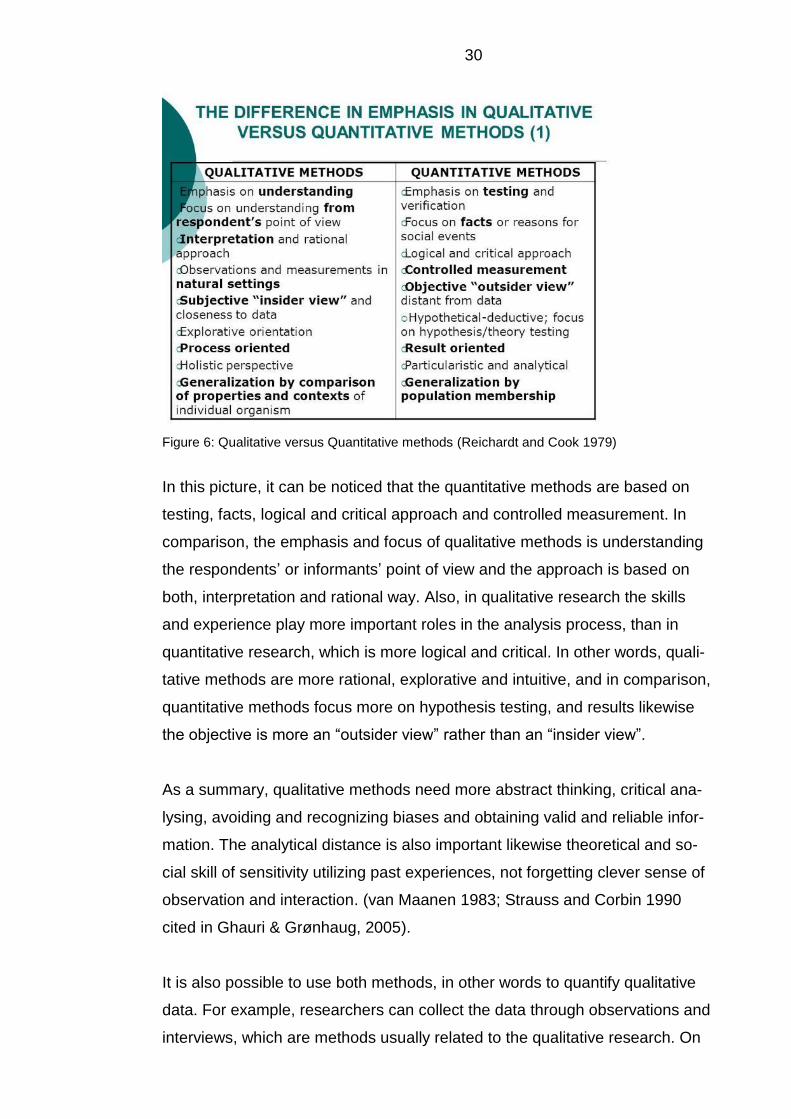
30
Figure 6: Qualitative versus Quantitative methods (Reichardt and Cook 1979)
In this picture, it can be noticed that the quantitative methods are based on
testing, facts, logical and critical approach and controlled measurement. In
comparison, the emphasis and focus of qualitative methods is understanding
the respondents’ or informants’ point of view and the approach is based on
both, interpretation and rational way. Also, in qualitative research the skills
and experience play more important roles in the analysis process, than in
quantitative research, which is more logical and critical. In other words, quali-
tative methods are more rational, explorative and intuitive, and in comparison,
quantitative methods focus more on hypothesis testing, and results likewise
the objective is more an “outsider view” rather than an “insider view”.
As a summary, qualitative methods need more abstract thinking, critical ana-
lysing, avoiding and recognizing biases and obtaining valid and reliable infor-
mation. The analytical distance is also important likewise theoretical and so-
cial skill of sensitivity utilizing past experiences, not forgetting clever sense of
observation and interaction. (van Maanen 1983; Strauss and Corbin 1990
cited in Ghauri & Grønhaug, 2005).
It is also possible to use both methods, in other words to quantify qualitative
data. For example, researchers can collect the data through observations and
interviews, which are methods usually related to the qualitative research. On
31
the other hand, the data collection can allow additionally statistical analysis.
To choose the right method, one should consider, which method you want to
emphasize and what are the objectives of the research. Additionally, the over-
all form determines the right methods to use in this research.
5.2 Reliability and validity
There are earlier studies of the validity and reliability in the literature which
clearly show, how the validity of the results is concerned with whether they are
in relation as they appear to be. In turn, reliability can be examined as internal
and external reliability, and shows how precise the results really are. (Saun-
ders et al. 2003 101.)
In addition, Heikkilä (2001) determines how internal reliability is ensured by
measuring the statistical unit several times, so the result should be the same
each time for reliable measurement. External reliability, in turn, means repeat-
ability, meaning measurements can be repeated in different studies and situa-
tions. Also, reliable study requires same results like in the earlier original
study. Assimilating these two validity and reliability, low reliability reduces va-
lidity, however reliability depends on the validity of the study.
The more recent studies reveal, how research measurements do not present
the actual and very true value of the characteristic of interest, and instead are
just observations of it. Again, a variety of factor can cause even measurement
errors which can be systematic errors or random errors. Systematic error re-
fers to solid factors. These solid factors affect the observed score for each
measurement in the same way. The random error, on the other hand, is due to
factors that can change every time the measurements are made. (Malhotra&
Birks 2006.)
If we consider questionnaires, the validity assesses to what extent the scale or
set of measures precisely represents the concept of interest. (Hair et al., 2006,
137.) In this study, to guarantee external validity, a representative sample was
collected. Although, this sampling frame of the study was limited to the cus-
tomers of Excellence Finland, who were willing to participate. The sampling
share of the customers was taken, because to represent all the Excellence
32
Finland customers would not have been purposeful. This was the case, be-
cause the time constraints and resources were limited.
The total sample size of 158 from 2618 recipients (or 938 different organiza-
tions) was considered good representative of the Excellence Finland’s cus-
tomer base, including the potential customers. However, the results should not
be generalized, because not all the customers are presented in this study.
Content validity refers to whether the test adequately domain or dimension
that has been measured and is particularly relevant to performance or
achievement tests (Domino 2006). To grow content validity in this study, a
comprehensive theoretical framework was added to get an overall compre-
hension of the thesis subject and domain of brand image, brand awareness
and related terms. Validity was also ensured by pre-testing the questionnaire,
in order to detect irregularities and inconsistencies, or change the layout or the
order of the questions. All questions were based on a carefully considered
context with the theme, as well as careful gloss and formulation of questions
to ensure that the respondents were able to understand them. The final ques-
tionnaire was tailored to each target group in context to reveal inner thoughts
related to the company image and awareness. Brand recognition and -image
questions were put first and more sales-oriented questions to the end. This
ensured the focus on issues was in the brand.
The possible cause of concern for reliability is due to the way the study is con-
ducted. In an Internet survey, it is impossible to check that all population
groups have uniform answers or that each respondent answered the question-
naire only once.
Another risk in the Internet survey is that the respondent fills in the question-
naire in a hurry, which may affect the accuracy or whether the answers are not
sent back to the sender. Also, the Internet survey does not allow the clarifica-
tion of questions, like for example in telephone interviews.
Again, the sampling error was minimized in choosing and targeting a substan-
tial sample size of over 2600 of the whole customer base, however potential
customers are not yet customers, so 286 replies can be left over of the
amounts of recipients. However, the sampling frame was limited, for example
33
same questionnaire was sent to the same organization to several employees
and the potential customers’ email address list was gathered quite randomly
and might distort the results. In turn, it was encouraging how replies were re-
ceived in each target group, even though international partners were not that
relevant to the research. Response errors occur, if respondents are giving in-
accurate replies or the question is misleading or indistinct. However, the over-
all validity and reliability of the study were considered adequate after the as-
sessment of individual methods for data collection and analysis.
5.3 Data collection methods
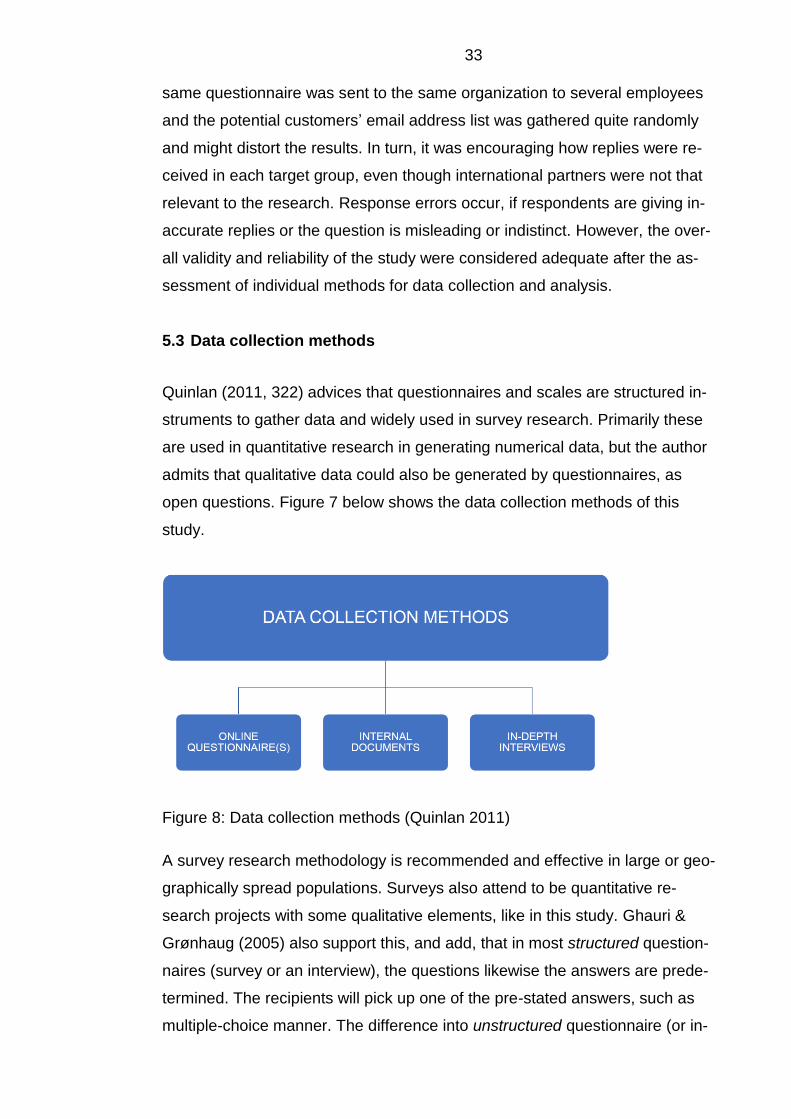
Quinlan (2011, 322) advices that questionnaires and scales are structured in-
struments to gather data and widely used in survey research. Primarily these
are used in quantitative research in generating numerical data, but the author
admits that qualitative data could also be generated by questionnaires, as
open questions. Figure 7 below shows the data collection methods of this
study.
Figure 8: Data collection methods (Quinlan 2011)
A survey research methodology is recommended and effective in large or geo-
graphically spread populations. Surveys also attend to be quantitative re-
search projects with some qualitative elements, like in this study. Ghauri &
Grønhaug (2005) also support this, and add, that in most structured question-
naires (survey or an interview), the questions likewise the answers are prede-
termined. The recipients will pick up one of the pre-stated answers, such as
multiple-choice manner. The difference into unstructured questionnaire (or in-
34
terviews) is, that there are no predetermined answers, or they are roughly pre-
determined. This means, there is possibility to answer in his or her own words.
A questionnaire, which allows the recipient to use their own words and the an-
swers are predetermined is called a semi-structured questionnaire, used in
surveys or interviews (Churchill 1999 cited in Ghauri & Grønhaug 2005).
In this study, the data collection method to collect primary data was chosen to
be both structured, and semi-structed online questionnaire as there we also
open questions. According to Philips (1966 cited in Ghauri & Grønhaug, 2005
124) this kind of combination is recommended. If the survey is using only
structured method, there is no room for the respondents to give their own
views or ideas, which could be very useful in the results analysing phase and
to develop things in the future. In comparison, if the unstructured method is
used alone, the accurate testing of the hypotheses might be difficult or impos-
sible.
The questionnaire in this study was conducted both in Finnish and English
language, since the stakeholders of the company are both national, and inter-
national. The research method was selected quantitative with some qualitative
elements, like earlier mentioned. The questionnaire was chosen to be an
online questionnaire, which can be easily emailed even for a geographically
scattered population and the use of Internet in survey research is very com-
mon (Quinlan 2011, 182, 322, 325).
The secondary data was collected with in-depth interviews and internal docu-
ments. Quinlan (2011, 244) agrees, how documents and printed materials and
archives are the primary sources to collect secondary data. However, in-depth
interviews are also a useful data collection technique. This mainly qualitative
technique can be used to various purposes such as needs assessment, pro-
gram refinement, issue identification or strategic planning. These in-depth in-
terviews are appropriate if one wants to ask open-ended questions to arouse
deeper information from relatively few people. (Guion, Diehl, and McDonald
2006 & 2011) This method was selected to collect information and to deter-
mine the background information, why this survey is implemented in the first
place and which are the purposes and goals of this survey etc.
35
5.4 Data analysis
Like already mentioned, there are three data collection methods in this study.
These are online questionnaires, internal documents and in-depth interviews.
Quantitative data and qualitative data comprise the empirical evidence in this
thesis. The three online questionnaires are each tailored to all target groups
and are also to analyze data and not only to gather it. The questionnaires are
both quantitative and qualitative, because there were open questions in-
cluded. In-depth interviews generate qualitative data, and online question-
naires generate quantitative data with qualitative elements in this study.
However, quantitative data is also called numerical data. Quantitative data in
the analysis is using statistical methods. This is exploited in this study mainly
in pie charts, column diagram and tables. These figures are automatically cre-
ated from Survey Pal Excel sheets, but modified afterwards into appropriate
form, and open-ended questions are presented in tables (Quinlan 2011, 380).
Open-ended questions are analyzed in table-forms and they help to see the
insight thoughts and creative ideas of the respondents. Quinlan (2011, 352&
420) presents four stages in qualitative data analysis. First is to describe data
and next is to interpret this data. Thirdly, the data should be summarized and
make conclusions. Finally, the fourth stage is to find out correlation between
literature review and the data to discover, whether they replenish each other
or not.
The secondary data was collected with in-depth interviews, meaning that the
conversation has been implemented in Finnish and freely and not so struc-
tured like in the semi-structured interview. The main interview questions, in the
first meetings were the following;
1. What is the field of business of Excellence Finland
2. Are there going to be different questions to the different target groups?
3. Will the questionnaire be conducted both in Finnish and English?
4. How will the results of the questionnaires be gathered or directed to re-
spondents?
5. What is the expected time schedule of this study?
6. What are the main reasons to do this study?
36
7. Which are the roles of each one involved in this project?
8. Is there going to be any reward or gift to the respondents of this ques-
tionnaire?
It was obvious since the first meeting, that this kind of brand image survey
was planned for several years within the company, but was never imple-
mented. The importance of this kind of study to discover the opinions and de-
velopment points of view from the customers, members and potential cus-
tomer was experienced very vital to the company and they were very eager to
cooperate with this project.
As mentioned above, qualitative data collected from open-ended questions
and in-depth interviews are used in analysis. Like according to these four
stages, specific data analysis is presented in chapter 6. Qualitative data analy-
sis from in-depth interviews is focused on the in-depth questions presented
more deeply in the next chapter.
6 SURVEY RESULTS
Like earlier mentioned, the secondary data of this study was gathered with in-
depth interviews and internal documents. The interviewees in this research
were the Quality Manager, the Training Manager and the CEO of the case
company and the interviews were implemented personally or in pairs. These
meetings and in-depth interviews provided the opportunity to involve people to
this project better. Roles of each one involving this project were agreed be-
forehand, and this worked until the very end. In practice, one main contact
person, the Training Manager within the company was named. This was in
case, if any problems arise during the study or help was needed.
The selection of the respondents and the test sending likewise the ready-
made questionnaires through the Survey Pal-program was decided to realize
by one person as well, the Quality Manager. In other words, the author did not
select the organizations or respondents, to whom the questionnaires were to
be sent nor did send them.
37
Also, the Communications office, which the company currently cooperates
with, was involved in this project to comment and advise the author of this the-
sis in layout and order of the questionnaire questions. Also, all the personnel
had an opportunity to read the online questionnaire questions before sending
and comment freely. At the very end of the project, all the persons involved in
this project and personnel as well, were offered to comment for the final re-
port, which was printed in the company office.
The first question of the in-depth interview concerned the activities or business
area of the company, which appeared to be to develop oneself likewise de-
velop others towards excellence in quality matters. This happens with semi-
nars, courses, trainings, evaluation- and expert services and through competi-
tions such as Finnish Quality Award and Quality Innovation of the year compe-
tition.
Then, about the questionnaire, the questions were agreed to be different be-
tween the three target groups, but some of the questions were to be similar.
Each question was tailored, by the author, to discover the most important mat-
ters related to the cooperation. These results of the questionnaire are pre-
sented in the next chapter. The most interesting group from the view point of
the Excellence Finland was potential customers, and the company seems to
be eager to get new members.
Next, as earlier mentioned, the language of the questionnaire was agreed to
be Finnish, but for the international partners English. Later it was discovered,
how this complicated the analysis of the results a lot, because all the data had
to be translated into English. However, this was known beforehand, although
the open-ended questions revealed to be the most challenging ones in this
whole study.
Next it was decided, how to deliver the data to the selected target groups. The
online questionnaire was decided together to be distributed through an email,
which is a cost-effective way to reach all the selected respondents. The other
option could have been to post traditionally the questionnaire with the cover
letter, but it must have been very expensive because of the postal fees. The
38
anonymity regarding the respondents was also possible to fulfil, when the
online questionnaire was chosen to be the data gathering method.
The online questionnaire about the brand image of Excellence Finland, was
now sent to three target groups through Survey Pal software tool. However,
before the sending, the questionnaires were slightly modified, with the per-
spective from the company’s partner of communications office. The changes
applied the order of the questions, and the brand recognition questions were
brought up first. The next brand image related questions and the last sales-ori-
ented questions remained the same. This modified structure made the primary
stress now more on brand rather than in sales. In addition, a few questions
were added, in agreement, to be easier to compare the results in the future,
for example, if the questionnaire will be sent again one or two years later.
The rewarding was mentioned in the cover letter, which was one ticket to the
international Quality congress 2016 for the 2nd day, where the main orators
were to be Edward Snowden and Robert Tercek. In addition, 5 pieces of
books were raffled between the respondents. However, this rewarding was not
mentioned in the cover letter of the international partners, which probably af-
fected the low answering percentage of them.
Like earlier mentioned, in total, 938 organizations received the survey link
through an email in April 2016. This gives acceptable answer percentage of
16,84%, in total. This percentage could have been a bit higher, but it was to
be expected on behalf of the commissioner. This result was also expected,
because it was the very first time, when this kind of online questionnaire was
sent to the stakeholders of the company. However, if we put all the three tar-
get groups to be analyzed separately, the results show, that the potential cus-
tomers reply was 31 replies out of 198 organizations. This means, the poten-
tial customers’ answering rate was quite good, with 15,66%. This is quite an
average percentage on online questionnaires and is rather good in that per-
spective.
The other questionnaire in Finnish, was sent to 674 organizations of current
customers and members, and 121 replies were received. This makes 17,95%
39
in percentages. This is the highest percentage share of all the target groups,
and it is as well expected.
Finally, the 66 international partner organizations received the questionnaire
and 6 replies were received, after a reminder email. This gives the answer
percentage of 9,09%. This is a very low result, but was also, however, ex-
pected. The main reasons for the low percentage on international partners’ re-
plies may be, that the cover letter with the survey link went to spam mail or
Outlook subscribed the email unnecessary.
At first, the schedule for the planning part was set until the end of the year
2015, and this schedule realized. The online questionnaire was sent as
planned at the end of April 2016 and the answering time was 2 weeks. Also,
reminder emails and cover letters were sent. Before the sending, the ques-
tions were brainstormed and revised a few times, before the final versions
were ready to be sent to the target groups. The questions can be found on Ap-
pendices 4–6. More in detail, the Finnish online questionnaires (two) to the
current and potential customers and members, were sent on 27th of April
2016, and the answering time was until 9th of May 2016. The English version
to the international partners was sent a day after, and the answering time was
until 10th of May 2016.
Finally, the replies arrived in time and the survey pal online hosting service au-
tomatically calculated the percentages of the answers with Excel. The auto-
matic Excel-figures appeared to be the best to use in this study, because they
are accurate. However, all the Excel-figures had to be translated into English
and most of the chart types were changed to show different kind of charts.
6.1 Current customers
The respondents of the online questionnaire were asked, for example, to eval-
uate, how well they know Excellence Finland, their opinion of the media visibil-
ity, and how they were introduced to the company or which services they had
used so far. The questions were tailored to each group, but some questions
were similar. Open questions were also included, like how to develop the com-
pany image. Particularly, the potential customers were asked, if they develop
40
their processes or about their current operational development tools. Also, ex-
periences were asked to reveal their emotions or feelings. Additionally, the
questions regarding the future buying decisions of the company services were
asked.
The overall results are presented in figures, to make a general picture of the
answer percentages and differences of the company awareness, first among
current customers. The closer analysis is provided in open ended questions
by content filtering and answering variables to find tendency in the results and
survey findings. In the next chapters the questions of each target group will be
presented and analysed separately.
The questionnaire was sent to 674 key current member organizations and 121
replies were received. Only the main results are published in this study, and
the number of organizations, 674. This method of calculation gives approxi-
mately answering percentage rate 17,95% to this group only. This means, that
72% of the replies, meaning 674 organizations of the total of 938 organiza-
tions, was from this target group. Most of the respondents were men, but the
difference to women was not quite much. There were 14 more replies came
from men than from women, meaning 58,8% men and 44,2% female. Since
the main target group was Senior or Middle Management, the most respond-
ents were around in their fifties, 45-54 years of age. However, the age was
distributed quite extensively, which is a good sign.
The second highest was 55-64-year-old group of the respondents, meaning
34 persons and 28,1%. Thirdly, respondents of 35 to 44 years old were 23,1%
of the total, meaning 28 people in this target group. The rest age group of 65+
was 6,6% and under 34 years, 5% and 2,5% something else.
The following figure 9 begins the questionnaire and first asks to estimate the
knowing of the case company among the current customers.
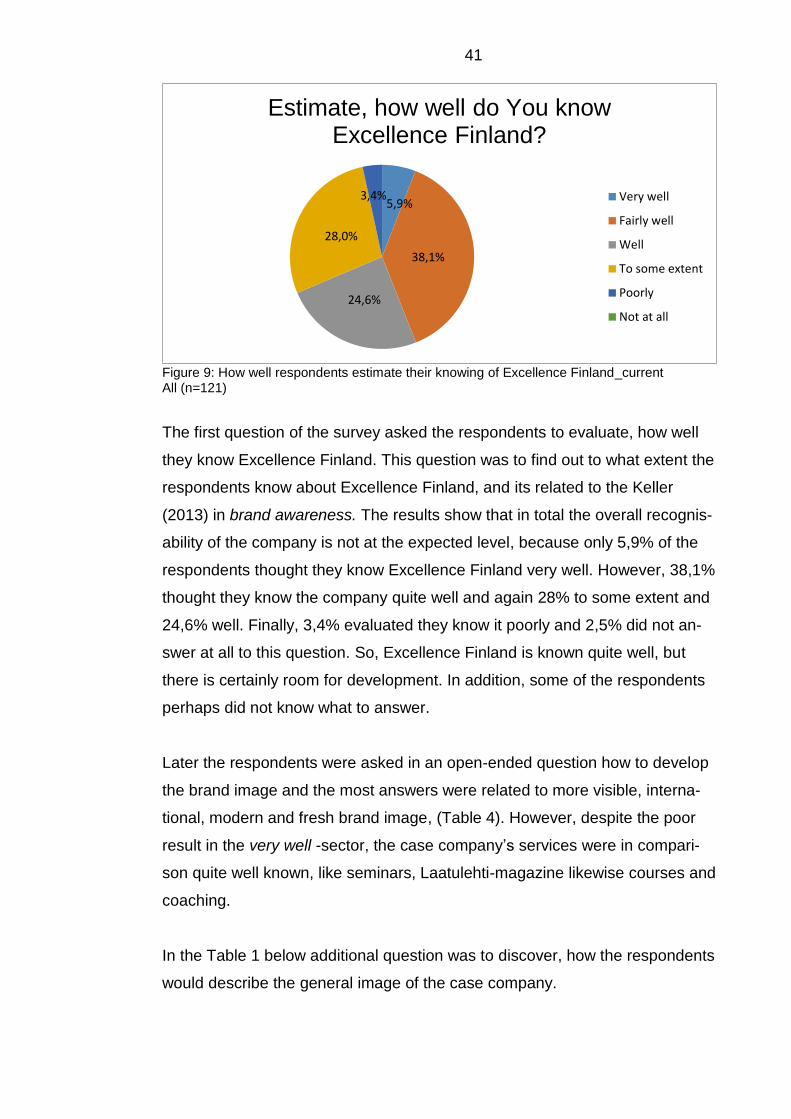
41
Figure 9: How well respondents estimate their knowing of Excellence Finland_current All (n=121)
The first question of the survey asked the respondents to evaluate, how well
they know Excellence Finland. This question was to find out to what extent the
respondents know about Excellence Finland, and its related to the Keller
(2013) in brand awareness. The results show that in total the overall recognis-
ability of the company is not at the expected level, because only 5,9% of the
respondents thought they know Excellence Finland very well. However, 38,1%
thought they know the company quite well and again 28% to some extent and
24,6% well. Finally, 3,4% evaluated they know it poorly and 2,5% did not an-
swer at all to this question. So, Excellence Finland is known quite well, but
there is certainly room for development. In addition, some of the respondents
perhaps did not know what to answer.
Later the respondents were asked in an open-ended question how to develop
the brand image and the most answers were related to more visible, interna-
tional, modern and fresh brand image, (Table 4). However, despite the poor
result in the very well -sector, the case company’s services were in compari-
son quite well known, like seminars, Laatulehti-magazine likewise courses and
coaching.
In the Table 1 below additional question was to discover, how the respondents
would describe the general image of the case company.
5,9%
38,1%
24,6%
28,0%
3,4%
Estimate, how well do You know Excellence Finland?
Very well
Fairly well
Well
To some extent
Poorly
Not at all
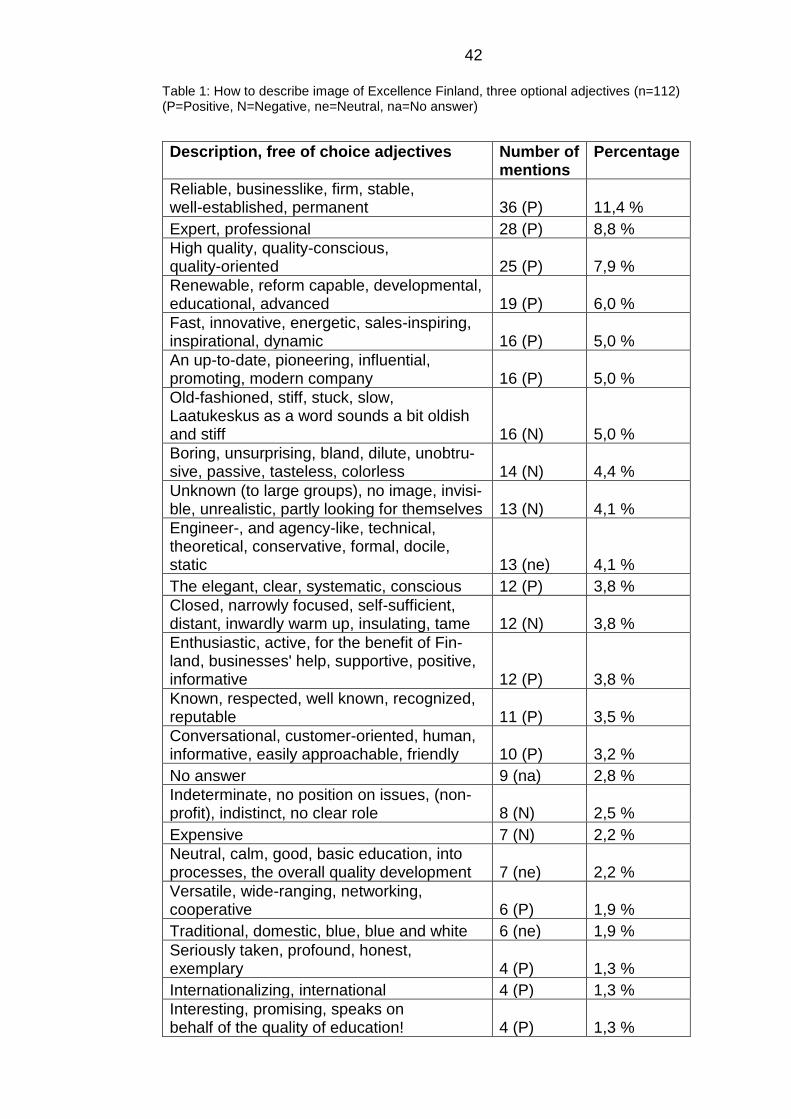
42
Table 1: How to describe image of Excellence Finland, three optional adjectives (n=112) (P=Positive, N=Negative, ne=Neutral, na=No answer)
Description, free of choice adjectives Number of mentions
Percentage
Reliable, businesslike, firm, stable, well-established, permanent 36 (P) 11,4 %
Expert, professional 28 (P) 8,8 %
High quality, quality-conscious, quality-oriented 25 (P) 7,9 %
Renewable, reform capable, developmental, educational, advanced 19 (P) 6,0 %
Fast, innovative, energetic, sales-inspiring, inspirational, dynamic 16 (P) 5,0 %
An up-to-date, pioneering, influential, promoting, modern company 16 (P) 5,0 %
Old-fashioned, stiff, stuck, slow, Laatukeskus as a word sounds a bit oldish and stiff 16 (N) 5,0 %
Boring, unsurprising, bland, dilute, unobtru-sive, passive, tasteless, colorless 14 (N) 4,4 %
Unknown (to large groups), no image, invisi-ble, unrealistic, partly looking for themselves 13 (N) 4,1 %
Engineer-, and agency-like, technical, theoretical, conservative, formal, docile, static 13 (ne) 4,1 %
The elegant, clear, systematic, conscious 12 (P) 3,8 %
Closed, narrowly focused, self-sufficient, distant, inwardly warm up, insulating, tame 12 (N) 3,8 %
Enthusiastic, active, for the benefit of Fin-land, businesses' help, supportive, positive, informative 12 (P) 3,8 %
Known, respected, well known, recognized, reputable 11 (P) 3,5 %
Conversational, customer-oriented, human, informative, easily approachable, friendly 10 (P) 3,2 %
No answer 9 (na) 2,8 %
Indeterminate, no position on issues, (non-profit), indistinct, no clear role 8 (N) 2,5 %
Expensive 7 (N) 2,2 %
Neutral, calm, good, basic education, into processes, the overall quality development 7 (ne) 2,2 %
Versatile, wide-ranging, networking, cooperative 6 (P) 1,9 %
Traditional, domestic, blue, blue and white 6 (ne) 1,9 %
Seriously taken, profound, honest, exemplary 4 (P) 1,3 %
Internationalizing, international 4 (P) 1,3 %
Interesting, promising, speaks on behalf of the quality of education! 4 (P) 1,3 %
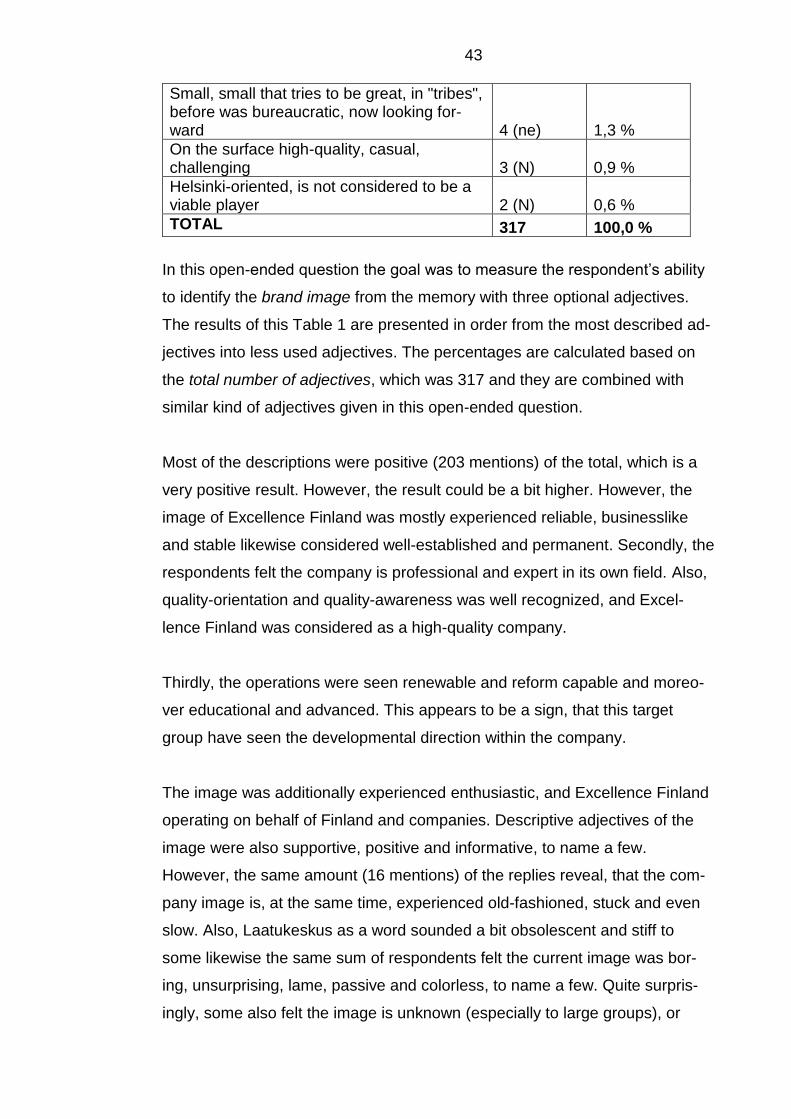
43
Small, small that tries to be great, in "tribes", before was bureaucratic, now looking for-ward 4 (ne) 1,3 %
On the surface high-quality, casual, challenging 3 (N) 0,9 %
Helsinki-oriented, is not considered to be a viable player 2 (N) 0,6 %
TOTAL 317 100,0 %
In this open-ended question the goal was to measure the respondent’s ability
to identify the brand image from the memory with three optional adjectives.
The results of this Table 1 are presented in order from the most described ad-
jectives into less used adjectives. The percentages are calculated based on
the total number of adjectives, which was 317 and they are combined with
similar kind of adjectives given in this open-ended question.
Most of the descriptions were positive (203 mentions) of the total, which is a
very positive result. However, the result could be a bit higher. However, the
image of Excellence Finland was mostly experienced reliable, businesslike
and stable likewise considered well-established and permanent. Secondly, the
respondents felt the company is professional and expert in its own field. Also,
quality-orientation and quality-awareness was well recognized, and Excel-
lence Finland was considered as a high-quality company.
Thirdly, the operations were seen renewable and reform capable and moreo-
ver educational and advanced. This appears to be a sign, that this target
group have seen the developmental direction within the company.
The image was additionally experienced enthusiastic, and Excellence Finland
operating on behalf of Finland and companies. Descriptive adjectives of the
image were also supportive, positive and informative, to name a few.
However, the same amount (16 mentions) of the replies reveal, that the com-
pany image is, at the same time, experienced old-fashioned, stuck and even
slow. Also, Laatukeskus as a word sounded a bit obsolescent and stiff to
some likewise the same sum of respondents felt the current image was bor-
ing, unsurprising, lame, passive and colorless, to name a few. Quite surpris-
ingly, some also felt the image is unknown (especially to large groups), or
44
there is no image at all! Some also thought that the image is invisible, unreal-
istic and Excellence Finland is partly looking still for themselves.
This was not a very good result, but it reveals opportunity to develop and im-
prove the current brand image. Some replies also revealed that the image is
engineer-, and agency-like, technical, theoretical and conservative to name a
few. These are actually neutral replies, but should however, be well noted.
It was likewise quite surprising, how average result came with well known, rec-
ognized or known image. At the same time, the image was experienced even
more, closed, narrowly focused, self-sufficient, distant and inwardly warmed
up, to name a few. However, it was encouraging, that the current image and
the company was, in the meanwhile, experienced conversational, customer-
oriented, human, informative, easily approachable and friendly with 10 men-
tions.
The image and the company itself was considered with 2,2-2,5% indetermi-
nate, no position on issues, (non-profit), indistinct, with no clear role and ex-
pensive. To continue, about 2% of the respondents also felt the image is cur-
rently neutral, calm or the education level is just basic, focusing too much into
processes or quality development. Simultaneously the image was experienced
traditional, domestic likewise blue and white. Blue and white as well as do-
mestic may refer to Finland, meaning Excellence Finland is more sighted
Finnish than an international player.
Next, it was very surprising, that only under 2% of the positive mentions were,
for example, versatile, wide-ranging, networking and cooperative ones. To an-
alyze, this could mean, that the range of services is not versatile enough or,
the respondents feel they were not offered that many options of training, con-
sulting- or other services. Also, networking and cooperation were not at the
expected level, if we consider this sampling survey of the current customers.
Perhaps, this target group feels the cooperation is too unilateral or the net-
working could be better. However, the respondents also experienced the im-
age is already seriously taken, profound, honest and the company gives a
good example, in turn the percentage was not at the expected level, only 4
mentions of the total.
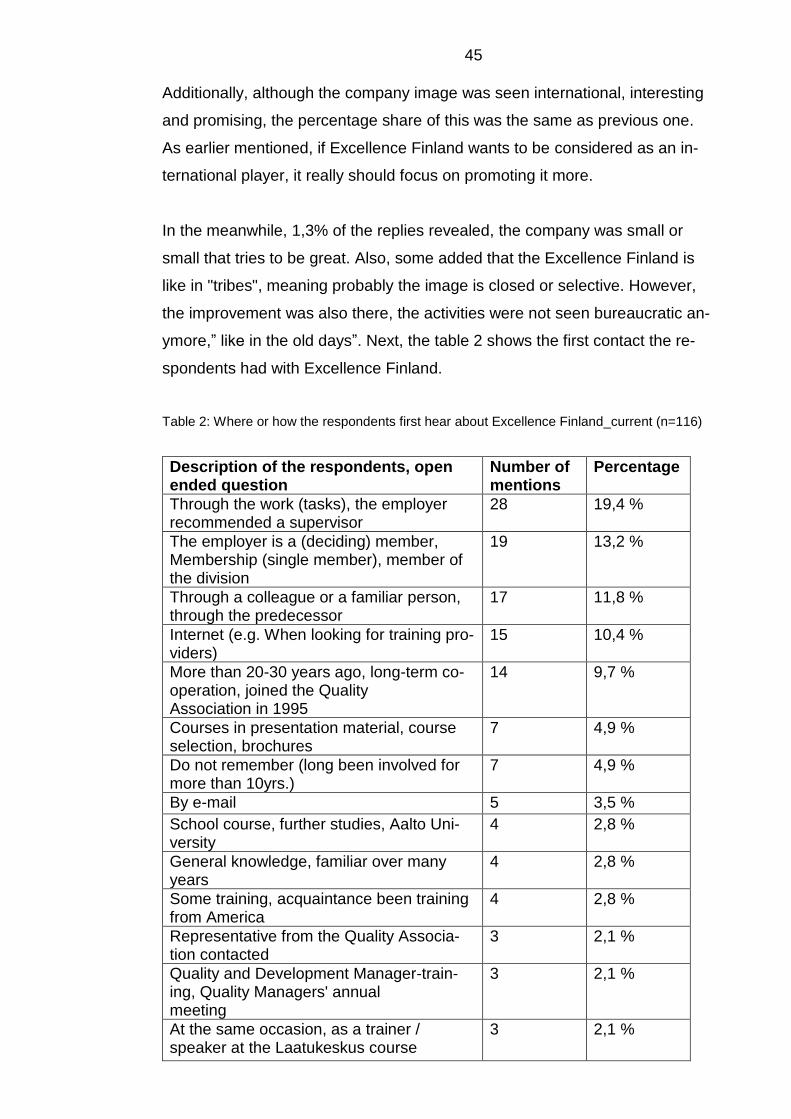
45
Additionally, although the company image was seen international, interesting
and promising, the percentage share of this was the same as previous one.
As earlier mentioned, if Excellence Finland wants to be considered as an in-
ternational player, it really should focus on promoting it more.
In the meanwhile, 1,3% of the replies revealed, the company was small or
small that tries to be great. Also, some added that the Excellence Finland is
like in "tribes", meaning probably the image is closed or selective. However,
the improvement was also there, the activities were not seen bureaucratic an-
ymore,” like in the old days”. Next, the table 2 shows the first contact the re-
spondents had with Excellence Finland.
Table 2: Where or how the respondents first hear about Excellence Finland_current (n=116)
Description of the respondents, open ended question
Number of mentions
Percentage
Through the work (tasks), the employer recommended a supervisor
28 19,4 %
The employer is a (deciding) member, Membership (single member), member of the division
19 13,2 %
Through a colleague or a familiar person, through the predecessor
17 11,8 %
Internet (e.g. When looking for training pro-viders)
15 10,4 %
More than 20-30 years ago, long-term co-operation, joined the Quality Association in 1995
14 9,7 %
Courses in presentation material, course selection, brochures
7 4,9 %
Do not remember (long been involved for more than 10yrs.)
7 4,9 %
By e-mail 5 3,5 %
School course, further studies, Aalto Uni-versity
4 2,8 %
General knowledge, familiar over many years
4 2,8 %
Some training, acquaintance been training from America
4 2,8 %
Representative from the Quality Associa-tion contacted
3 2,1 %
Quality and Development Manager-train-ing, Quality Managers' annual meeting
3 2,1 %
At the same occasion, as a trainer / speaker at the Laatukeskus course
3 2,1 %
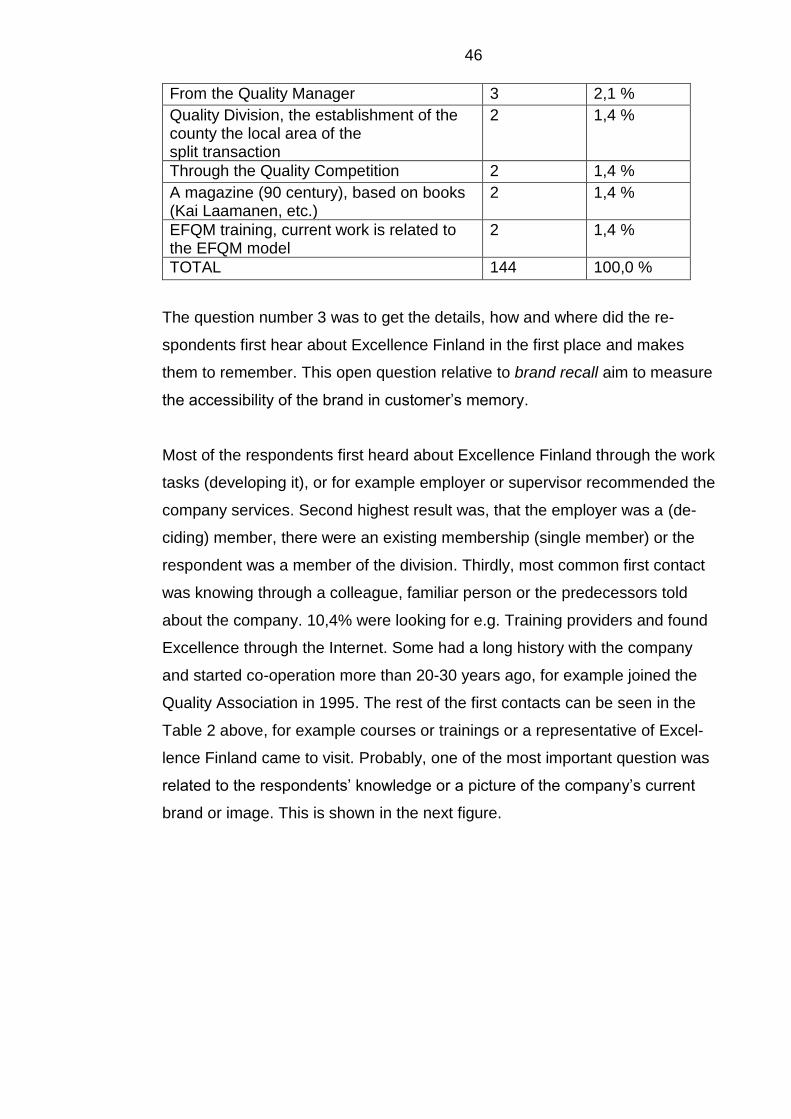
46
From the Quality Manager 3 2,1 %
Quality Division, the establishment of the county the local area of the split transaction
2 1,4 %
Through the Quality Competition 2 1,4 %
A magazine (90 century), based on books (Kai Laamanen, etc.)
2 1,4 %
EFQM training, current work is related to the EFQM model
2 1,4 %
TOTAL 144 100,0 %
The question number 3 was to get the details, how and where did the re-
spondents first hear about Excellence Finland in the first place and makes
them to remember. This open question relative to brand recall aim to measure
the accessibility of the brand in customer’s memory.
Most of the respondents first heard about Excellence Finland through the work
tasks (developing it), or for example employer or supervisor recommended the
company services. Second highest result was, that the employer was a (de-
ciding) member, there were an existing membership (single member) or the
respondent was a member of the division. Thirdly, most common first contact
was knowing through a colleague, familiar person or the predecessors told
about the company. 10,4% were looking for e.g. Training providers and found
Excellence through the Internet. Some had a long history with the company
and started co-operation more than 20-30 years ago, for example joined the
Quality Association in 1995. The rest of the first contacts can be seen in the
Table 2 above, for example courses or trainings or a representative of Excel-
lence Finland came to visit. Probably, one of the most important question was
related to the respondents’ knowledge or a picture of the company’s current
brand or image. This is shown in the next figure.
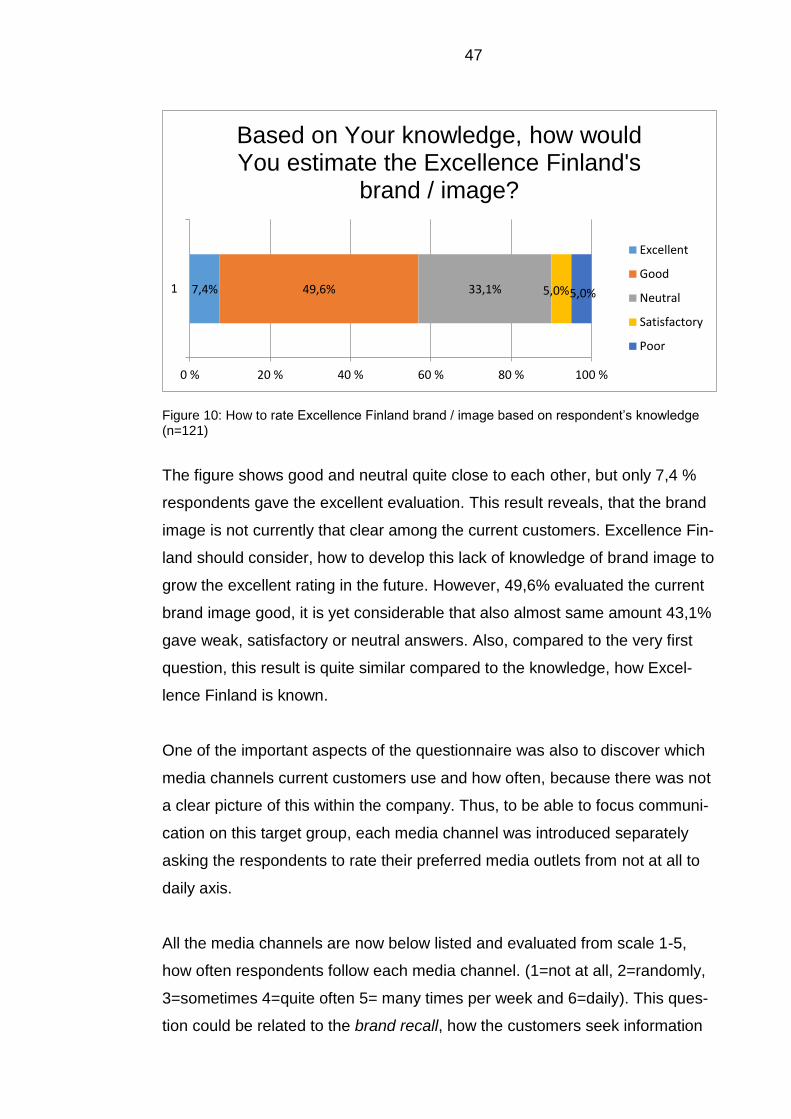
47
Figure 10: How to rate Excellence Finland brand / image based on respondent’s knowledge (n=121)
The figure shows good and neutral quite close to each other, but only 7,4 %
respondents gave the excellent evaluation. This result reveals, that the brand
image is not currently that clear among the current customers. Excellence Fin-
land should consider, how to develop this lack of knowledge of brand image to
grow the excellent rating in the future. However, 49,6% evaluated the current
brand image good, it is yet considerable that also almost same amount 43,1%
gave weak, satisfactory or neutral answers. Also, compared to the very first
question, this result is quite similar compared to the knowledge, how Excel-
lence Finland is known.
One of the important aspects of the questionnaire was also to discover which
media channels current customers use and how often, because there was not
a clear picture of this within the company. Thus, to be able to focus communi-
cation on this target group, each media channel was introduced separately
asking the respondents to rate their preferred media outlets from not at all to
daily axis.
All the media channels are now below listed and evaluated from scale 1-5,
how often respondents follow each media channel. (1=not at all, 2=randomly,
3=sometimes 4=quite often 5= many times per week and 6=daily). This ques-
tion could be related to the brand recall, how the customers seek information
7,4% 49,6% 33,1% 5,0%5,0%1
0 % 20 % 40 % 60 % 80 % 100 %
Based on Your knowledge, how wouldYou estimate the Excellence Finland's
brand / image?
Excellent
Good
Neutral
Satisfactory
Poor
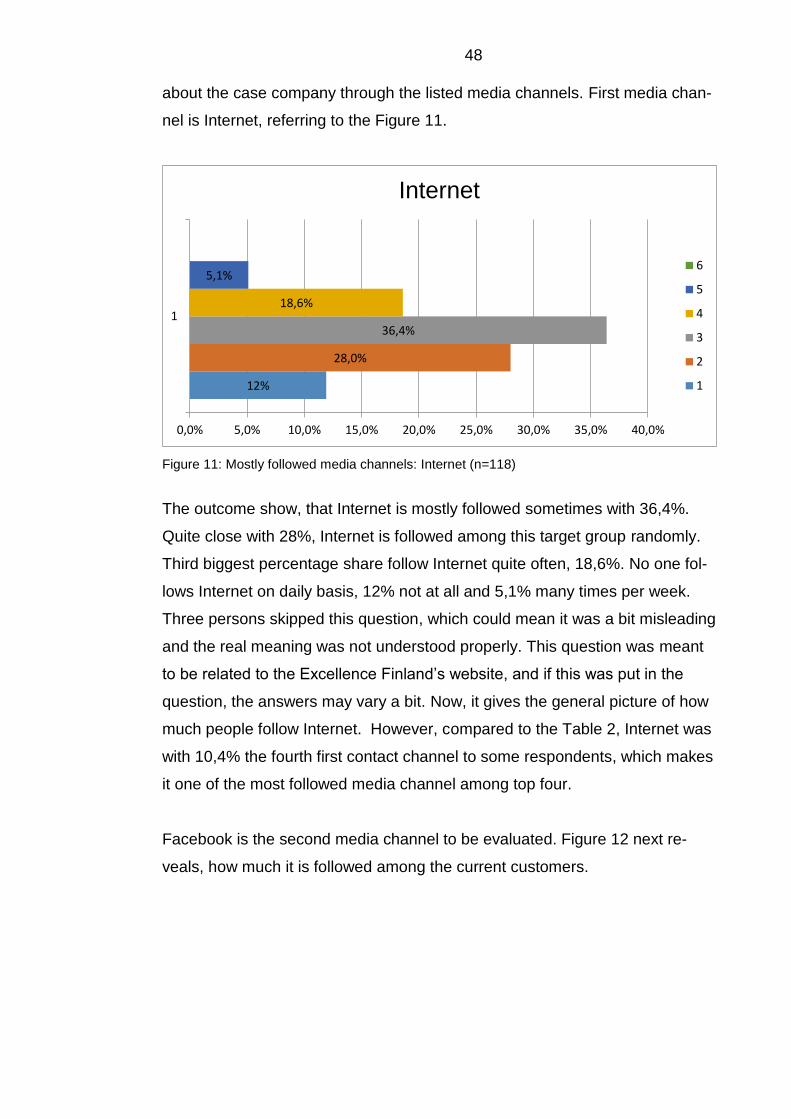
48
about the case company through the listed media channels. First media chan-
nel is Internet, referring to the Figure 11.
Figure 11: Mostly followed media channels: Internet (n=118)
The outcome show, that Internet is mostly followed sometimes with 36,4%.
Quite close with 28%, Internet is followed among this target group randomly.
Third biggest percentage share follow Internet quite often, 18,6%. No one fol-
lows Internet on daily basis, 12% not at all and 5,1% many times per week.
Three persons skipped this question, which could mean it was a bit misleading
and the real meaning was not understood properly. This question was meant
to be related to the Excellence Finland’s website, and if this was put in the
question, the answers may vary a bit. Now, it gives the general picture of how
much people follow Internet. However, compared to the Table 2, Internet was
with 10,4% the fourth first contact channel to some respondents, which makes
it one of the most followed media channel among top four.
Facebook is the second media channel to be evaluated. Figure 12 next re-
veals, how much it is followed among the current customers.
12%
28,0%
36,4%
18,6%
5,1%
0,0% 5,0% 10,0% 15,0% 20,0% 25,0% 30,0% 35,0% 40,0%
1
Internet
6
5
4
3
2
1
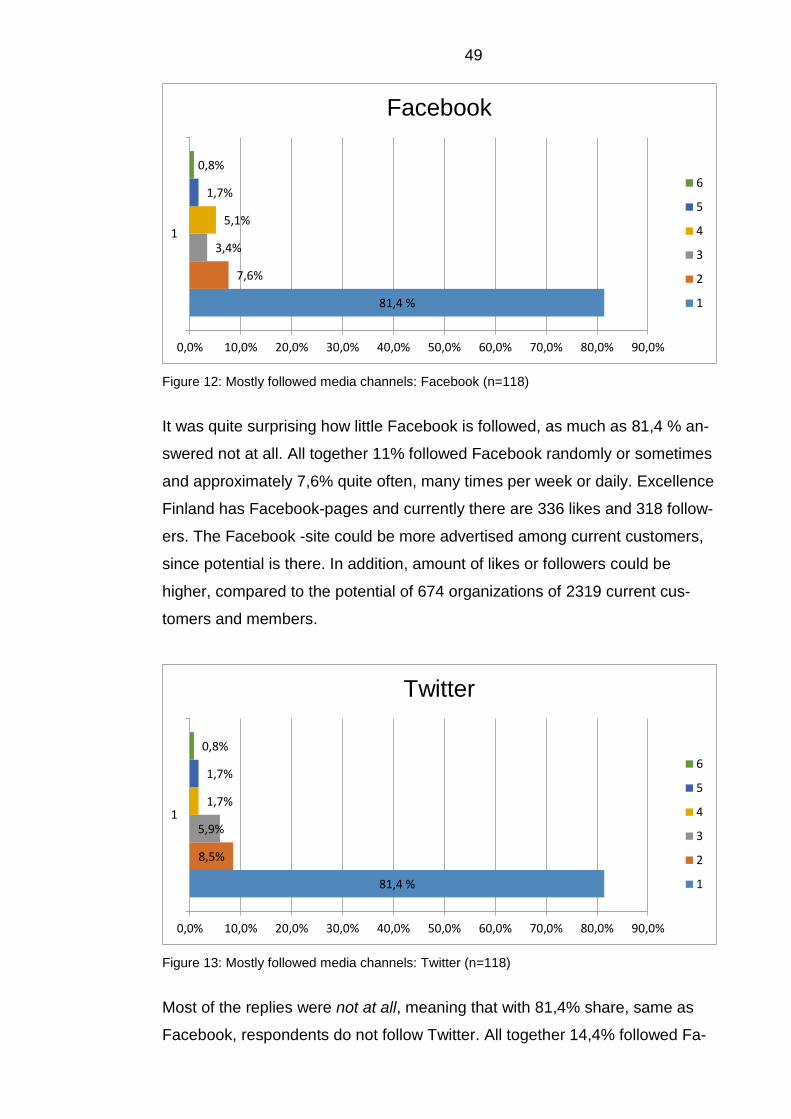
49
Figure 12: Mostly followed media channels: Facebook (n=118)
It was quite surprising how little Facebook is followed, as much as 81,4 % an-
swered not at all. All together 11% followed Facebook randomly or sometimes
and approximately 7,6% quite often, many times per week or daily. Excellence
Finland has Facebook-pages and currently there are 336 likes and 318 follow-
ers. The Facebook -site could be more advertised among current customers,
since potential is there. In addition, amount of likes or followers could be
higher, compared to the potential of 674 organizations of 2319 current cus-
tomers and members.
Figure 13: Mostly followed media channels: Twitter (n=118)
Most of the replies were not at all, meaning that with 81,4% share, same as
Facebook, respondents do not follow Twitter. All together 14,4% followed Fa-
81,4 %
7,6%
3,4%
5,1%
1,7%
0,8%
1
0,0% 10,0% 20,0% 30,0% 40,0% 50,0% 60,0% 70,0% 80,0% 90,0%
6
5
4
3
2
1
81,4 %
8,5%
5,9%
1,7%
1,7%
0,8%
1
0,0% 10,0% 20,0% 30,0% 40,0% 50,0% 60,0% 70,0% 80,0% 90,0%
6
5
4
3
2
1
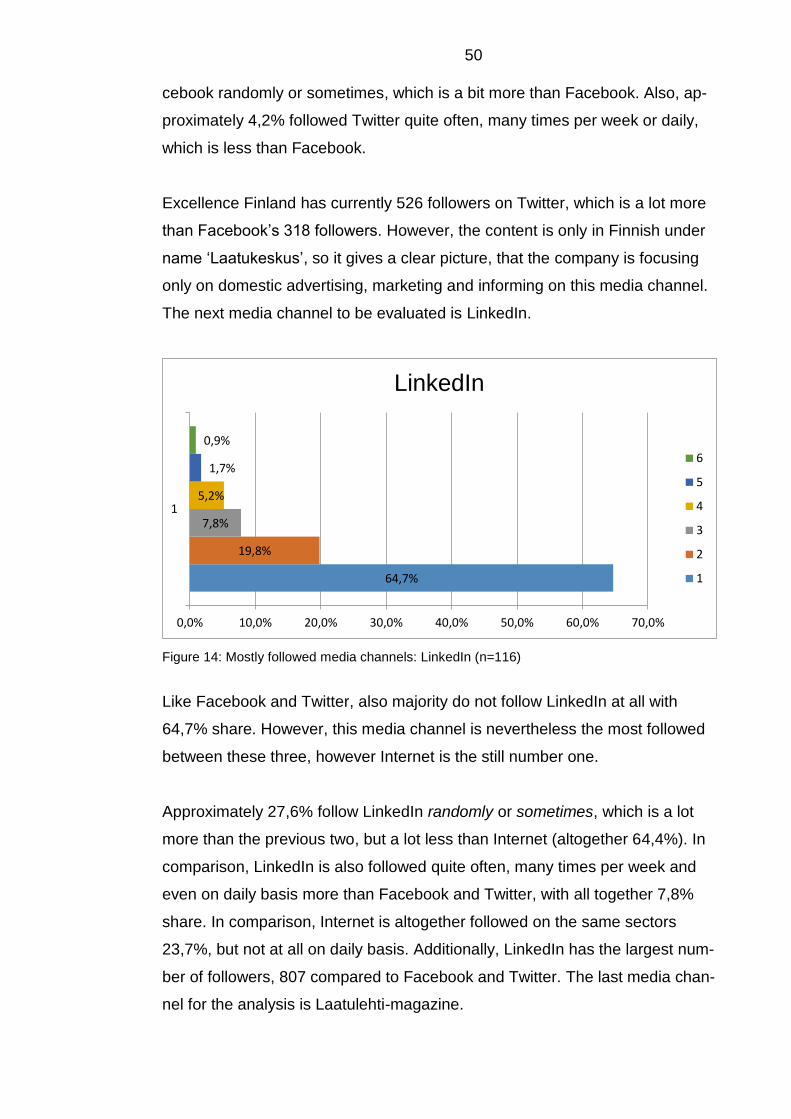
50
cebook randomly or sometimes, which is a bit more than Facebook. Also, ap-
proximately 4,2% followed Twitter quite often, many times per week or daily,
which is less than Facebook.
Excellence Finland has currently 526 followers on Twitter, which is a lot more
than Facebook’s 318 followers. However, the content is only in Finnish under
name ‘Laatukeskus’, so it gives a clear picture, that the company is focusing
only on domestic advertising, marketing and informing on this media channel.
The next media channel to be evaluated is LinkedIn.
Figure 14: Mostly followed media channels: LinkedIn (n=116)
Like Facebook and Twitter, also majority do not follow LinkedIn at all with
64,7% share. However, this media channel is nevertheless the most followed
between these three, however Internet is the still number one.
Approximately 27,6% follow LinkedIn randomly or sometimes, which is a lot
more than the previous two, but a lot less than Internet (altogether 64,4%). In
comparison, LinkedIn is also followed quite often, many times per week and
even on daily basis more than Facebook and Twitter, with all together 7,8%
share. In comparison, Internet is altogether followed on the same sectors
23,7%, but not at all on daily basis. Additionally, LinkedIn has the largest num-
ber of followers, 807 compared to Facebook and Twitter. The last media chan-
nel for the analysis is Laatulehti-magazine.
64,7%
19,8%
7,8%
5,2%
1,7%
0,9%
1
0,0% 10,0% 20,0% 30,0% 40,0% 50,0% 60,0% 70,0%
6
5
4
3
2
1
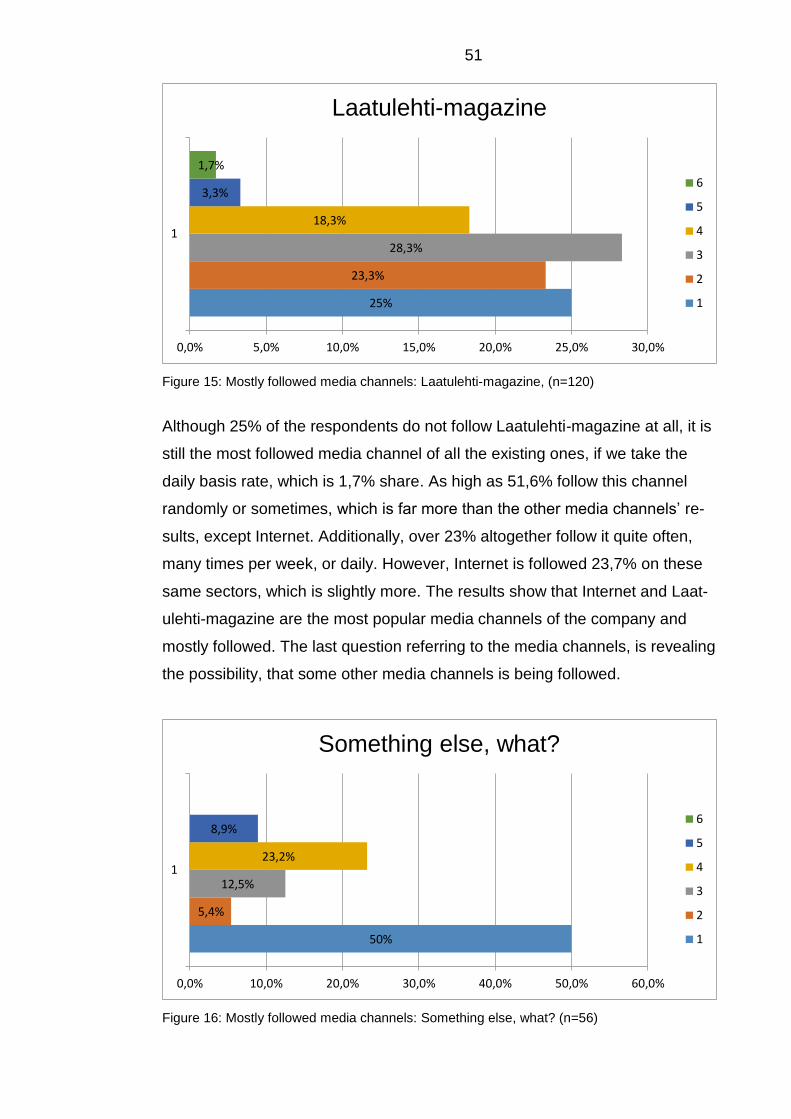
51
Figure 15: Mostly followed media channels: Laatulehti-magazine, (n=120)
Although 25% of the respondents do not follow Laatulehti-magazine at all, it is
still the most followed media channel of all the existing ones, if we take the
daily basis rate, which is 1,7% share. As high as 51,6% follow this channel
randomly or sometimes, which is far more than the other media channels’ re-
sults, except Internet. Additionally, over 23% altogether follow it quite often,
many times per week, or daily. However, Internet is followed 23,7% on these
same sectors, which is slightly more. The results show that Internet and Laat-
ulehti-magazine are the most popular media channels of the company and
mostly followed. The last question referring to the media channels, is revealing
the possibility, that some other media channels is being followed.
Figure 16: Mostly followed media channels: Something else, what? (n=56)
25%
23,3%
28,3%
18,3%
3,3%
1,7%
1
0,0% 5,0% 10,0% 15,0% 20,0% 25,0% 30,0%
Laatulehti-magazine
6
5
4
3
2
1
50%
5,4%
12,5%
23,2%
8,9%
1
0,0% 10,0% 20,0% 30,0% 40,0% 50,0% 60,0%
Something else, what?
6
5
4
3
2
1
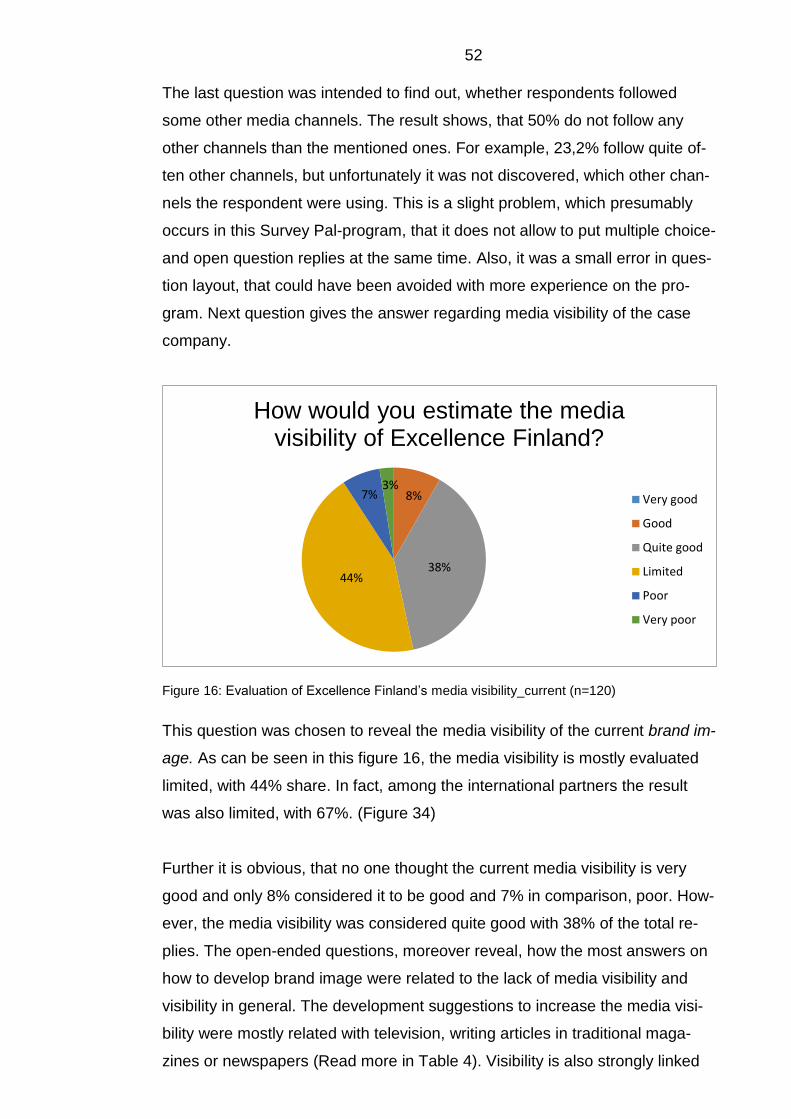
52
The last question was intended to find out, whether respondents followed
some other media channels. The result shows, that 50% do not follow any
other channels than the mentioned ones. For example, 23,2% follow quite of-
ten other channels, but unfortunately it was not discovered, which other chan-
nels the respondent were using. This is a slight problem, which presumably
occurs in this Survey Pal-program, that it does not allow to put multiple choice-
and open question replies at the same time. Also, it was a small error in ques-
tion layout, that could have been avoided with more experience on the pro-
gram. Next question gives the answer regarding media visibility of the case
company.
Figure 16: Evaluation of Excellence Finland’s media visibility_current (n=120)
This question was chosen to reveal the media visibility of the current brand im-
age. As can be seen in this figure 16, the media visibility is mostly evaluated
limited, with 44% share. In fact, among the international partners the result
was also limited, with 67%. (Figure 34)
Further it is obvious, that no one thought the current media visibility is very
good and only 8% considered it to be good and 7% in comparison, poor. How-
ever, the media visibility was considered quite good with 38% of the total re-
plies. The open-ended questions, moreover reveal, how the most answers on
how to develop brand image were related to the lack of media visibility and
visibility in general. The development suggestions to increase the media visi-
bility were mostly related with television, writing articles in traditional maga-
zines or newspapers (Read more in Table 4). Visibility is also strongly linked
8%
38%44%
7%3%
How would you estimate the media visibility of Excellence Finland?
Very good
Good
Quite good
Limited
Poor
Very poor
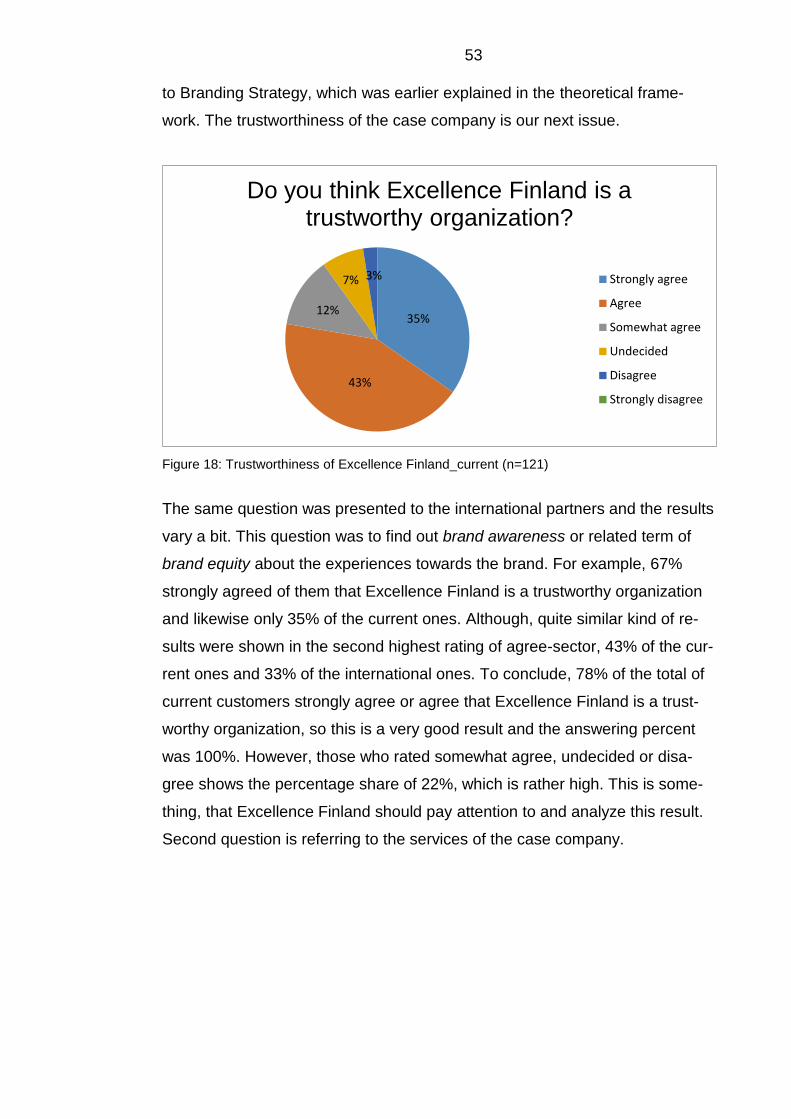
53
to Branding Strategy, which was earlier explained in the theoretical frame-
work. The trustworthiness of the case company is our next issue.
Figure 18: Trustworthiness of Excellence Finland_current (n=121)
The same question was presented to the international partners and the results
vary a bit. This question was to find out brand awareness or related term of
brand equity about the experiences towards the brand. For example, 67%
strongly agreed of them that Excellence Finland is a trustworthy organization
and likewise only 35% of the current ones. Although, quite similar kind of re-
sults were shown in the second highest rating of agree-sector, 43% of the cur-
rent ones and 33% of the international ones. To conclude, 78% of the total of
current customers strongly agree or agree that Excellence Finland is a trust-
worthy organization, so this is a very good result and the answering percent
was 100%. However, those who rated somewhat agree, undecided or disa-
gree shows the percentage share of 22%, which is rather high. This is some-
thing, that Excellence Finland should pay attention to and analyze this result.
Second question is referring to the services of the case company.
35%
43%
12%
7% 3%
Do you think Excellence Finland is a trustworthy organization?
Strongly agree
Agree
Somewhat agree
Undecided
Disagree
Strongly disagree
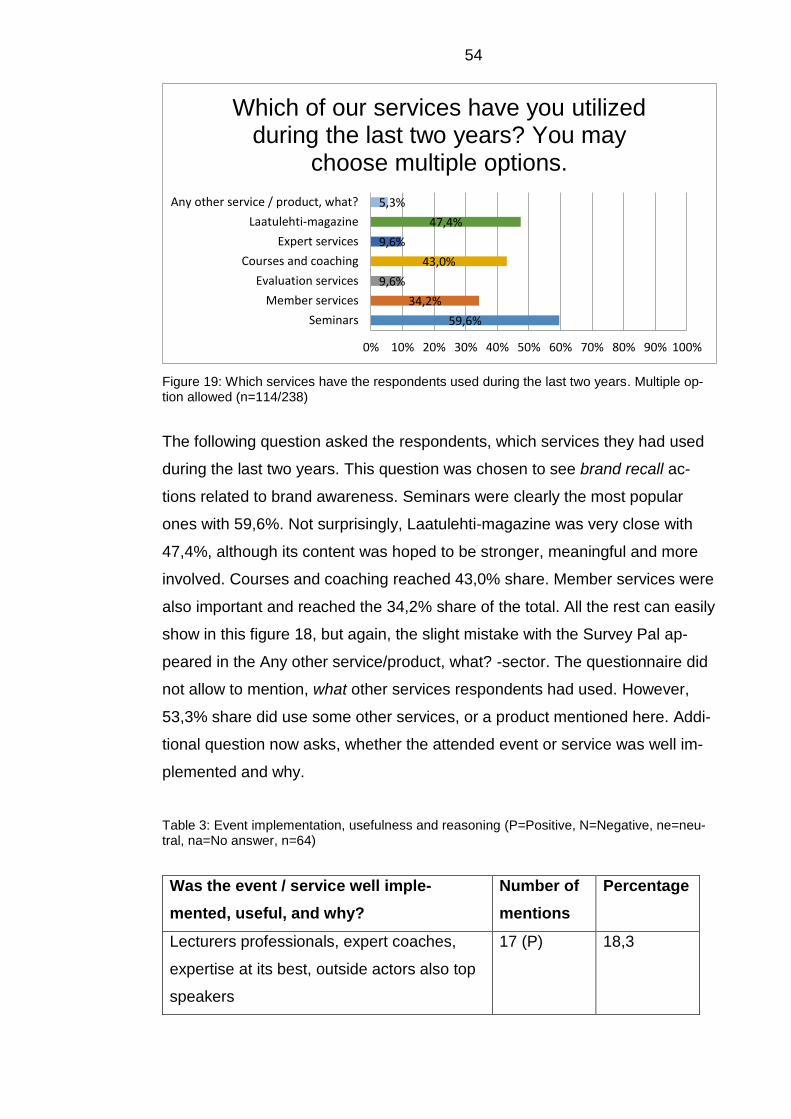
54
Figure 19: Which services have the respondents used during the last two years. Multiple op-tion allowed (n=114/238)
The following question asked the respondents, which services they had used
during the last two years. This question was chosen to see brand recall ac-
tions related to brand awareness. Seminars were clearly the most popular
ones with 59,6%. Not surprisingly, Laatulehti-magazine was very close with
47,4%, although its content was hoped to be stronger, meaningful and more
involved. Courses and coaching reached 43,0% share. Member services were
also important and reached the 34,2% share of the total. All the rest can easily
show in this figure 18, but again, the slight mistake with the Survey Pal ap-
peared in the Any other service/product, what? -sector. The questionnaire did
not allow to mention, what other services respondents had used. However,
53,3% share did use some other services, or a product mentioned here. Addi-
tional question now asks, whether the attended event or service was well im-
plemented and why.
Table 3: Event implementation, usefulness and reasoning (P=Positive, N=Negative, ne=neu-tral, na=No answer, n=64)
Was the event / service well imple-
mented, useful, and why?
Number of
mentions
Percentage
Lecturers professionals, expert coaches,
expertise at its best, outside actors also top
speakers
17 (P) 18,3
59,6%
34,2%
9,6%
43,0%
9,6%
47,4%
5,3%
Seminars
Member services
Evaluation services
Courses and coaching
Expert services
Laatulehti-magazine
Any other service / product, what?
0% 10% 20% 30% 40% 50% 60% 70% 80% 90% 100%
Which of our services have you utilized during the last two years? You may
choose multiple options.
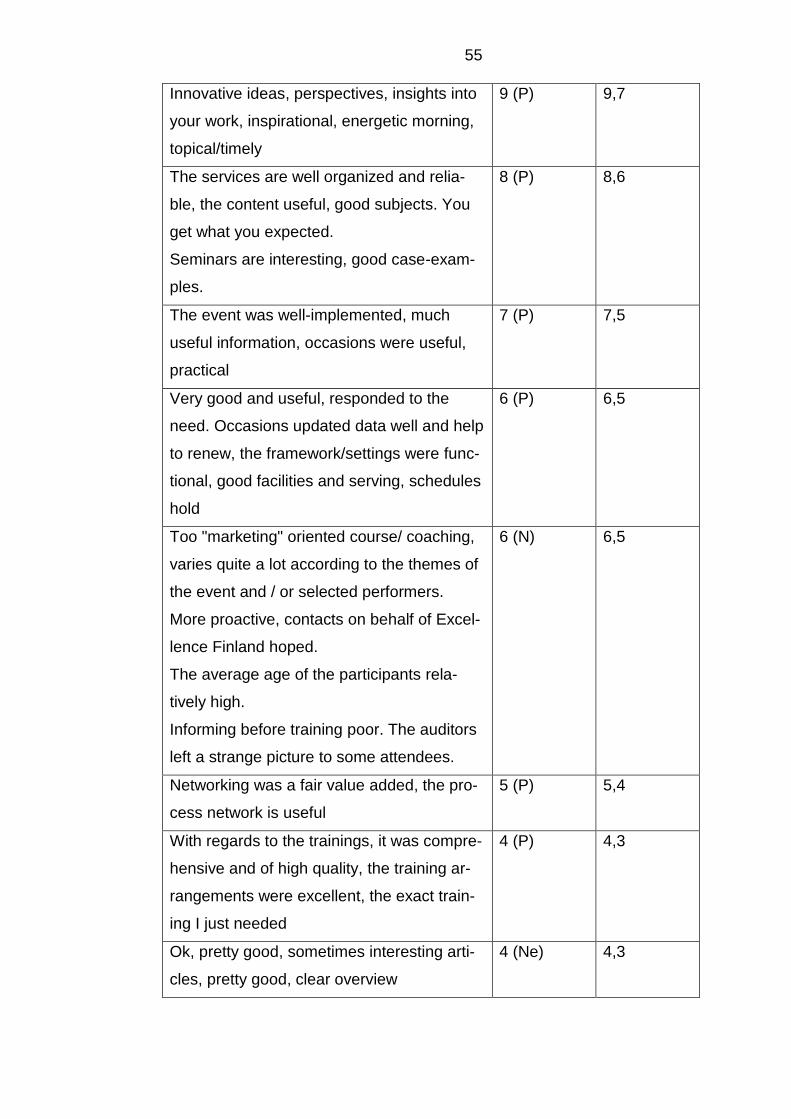
55
Innovative ideas, perspectives, insights into
your work, inspirational, energetic morning,
topical/timely
9 (P) 9,7
The services are well organized and relia-
ble, the content useful, good subjects. You
get what you expected.
Seminars are interesting, good case-exam-
ples.
8 (P) 8,6
The event was well-implemented, much
useful information, occasions were useful,
practical
7 (P) 7,5
Very good and useful, responded to the
need. Occasions updated data well and help
to renew, the framework/settings were func-
tional, good facilities and serving, schedules
hold
6 (P) 6,5
Too "marketing" oriented course/ coaching,
varies quite a lot according to the themes of
the event and / or selected performers.
More proactive, contacts on behalf of Excel-
lence Finland hoped.
The average age of the participants rela-
tively high.
Informing before training poor. The auditors
left a strange picture to some attendees.
6 (N) 6,5
Networking was a fair value added, the pro-
cess network is useful
5 (P) 5,4
With regards to the trainings, it was compre-
hensive and of high quality, the training ar-
rangements were excellent, the exact train-
ing I just needed
4 (P) 4,3
Ok, pretty good, sometimes interesting arti-
cles, pretty good, clear overview
4 (Ne) 4,3
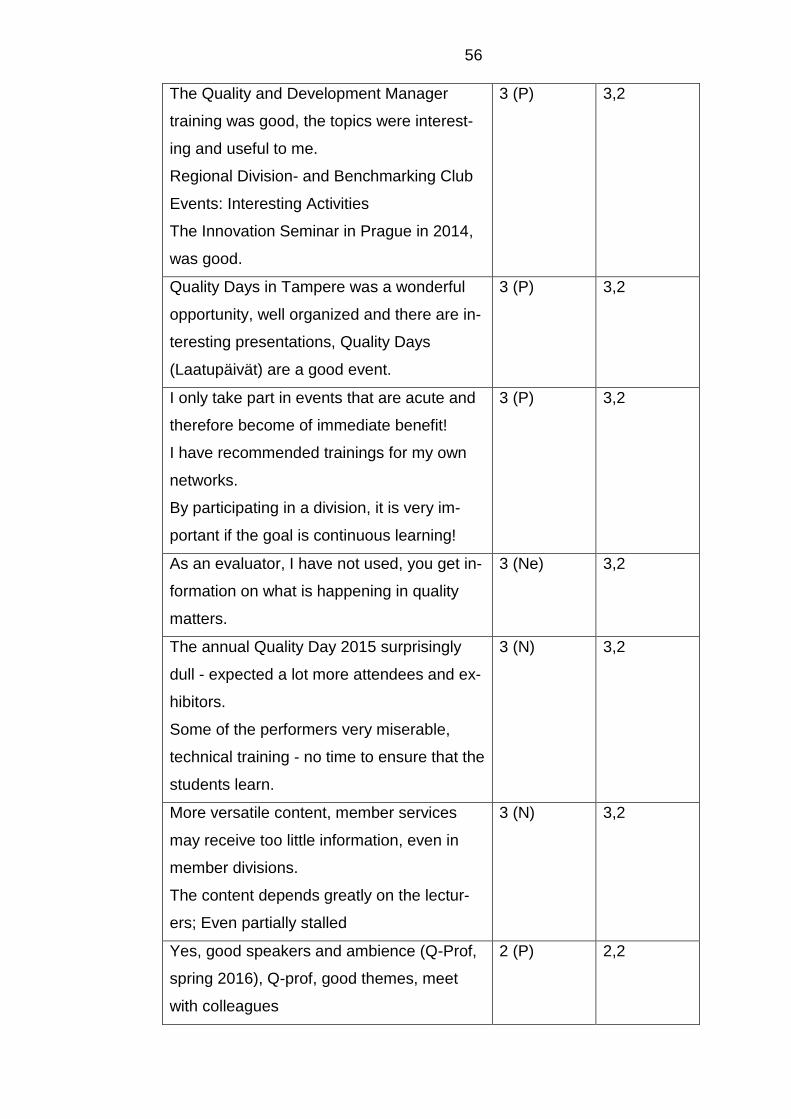
56
The Quality and Development Manager
training was good, the topics were interest-
ing and useful to me.
Regional Division- and Benchmarking Club
Events: Interesting Activities
The Innovation Seminar in Prague in 2014,
was good.
3 (P) 3,2
Quality Days in Tampere was a wonderful
opportunity, well organized and there are in-
teresting presentations, Quality Days
(Laatupäivät) are a good event.
3 (P) 3,2
I only take part in events that are acute and
therefore become of immediate benefit!
I have recommended trainings for my own
networks.
By participating in a division, it is very im-
portant if the goal is continuous learning!
3 (P) 3,2
As an evaluator, I have not used, you get in-
formation on what is happening in quality
matters.
3 (Ne) 3,2
The annual Quality Day 2015 surprisingly
dull - expected a lot more attendees and ex-
hibitors.
Some of the performers very miserable,
technical training - no time to ensure that the
students learn.
3 (N) 3,2
More versatile content, member services
may receive too little information, even in
member divisions.
The content depends greatly on the lectur-
ers; Even partially stalled
3 (N) 3,2
Yes, good speakers and ambience (Q-Prof,
spring 2016), Q-prof, good themes, meet
with colleagues
2 (P) 2,2
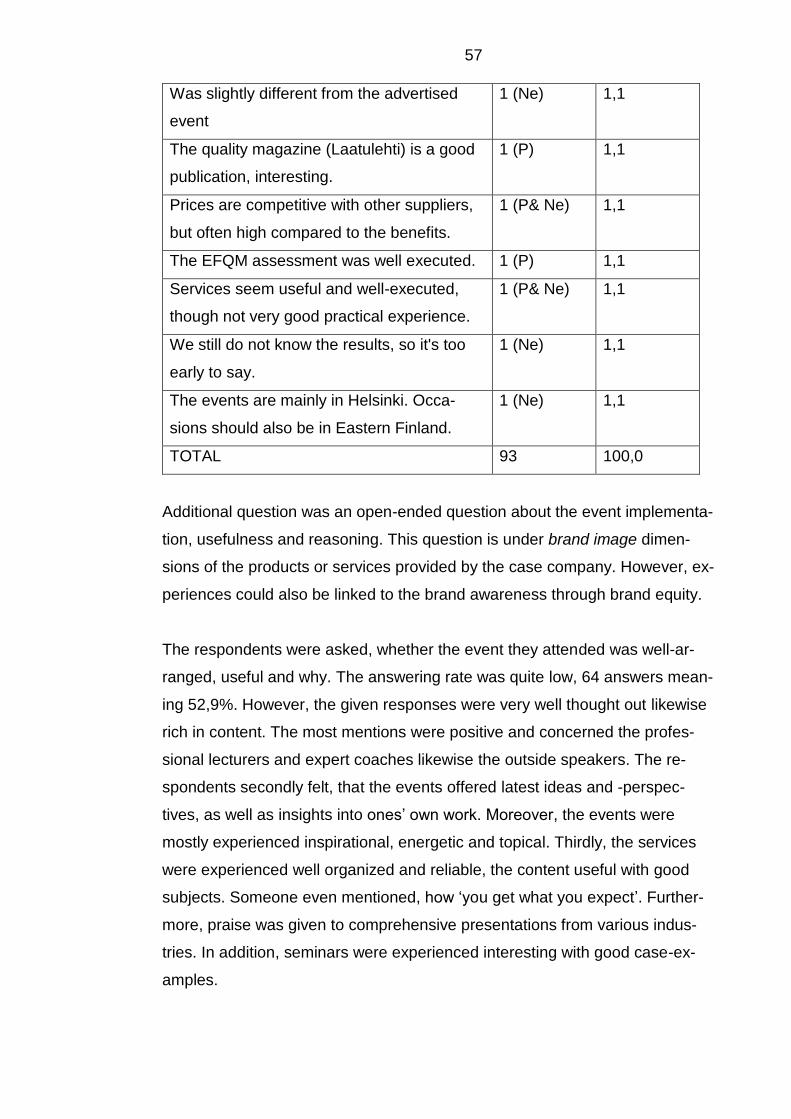
57
Was slightly different from the advertised
event
1 (Ne) 1,1
The quality magazine (Laatulehti) is a good
publication, interesting.
1 (P) 1,1
Prices are competitive with other suppliers,
but often high compared to the benefits.
1 (P& Ne) 1,1
The EFQM assessment was well executed. 1 (P) 1,1
Services seem useful and well-executed,
though not very good practical experience.
1 (P& Ne) 1,1
We still do not know the results, so it's too
early to say.
1 (Ne) 1,1
The events are mainly in Helsinki. Occa-
sions should also be in Eastern Finland.
1 (Ne) 1,1
TOTAL 93 100,0
Additional question was an open-ended question about the event implementa-
tion, usefulness and reasoning. This question is under brand image dimen-
sions of the products or services provided by the case company. However, ex-
periences could also be linked to the brand awareness through brand equity.
The respondents were asked, whether the event they attended was well-ar-
ranged, useful and why. The answering rate was quite low, 64 answers mean-
ing 52,9%. However, the given responses were very well thought out likewise
rich in content. The most mentions were positive and concerned the profes-
sional lecturers and expert coaches likewise the outside speakers. The re-
spondents secondly felt, that the events offered latest ideas and -perspec-
tives, as well as insights into ones’ own work. Moreover, the events were
mostly experienced inspirational, energetic and topical. Thirdly, the services
were experienced well organized and reliable, the content useful with good
subjects. Someone even mentioned, how ‘you get what you expect’. Further-
more, praise was given to comprehensive presentations from various indus-
tries. In addition, seminars were experienced interesting with good case-ex-
amples.
58
To name one example, in 2014 organized Innovation seminar in Prague was
particularly mentioned and experienced as a well-organized group trip. The at-
tendees were exchanging ideas there with each other all the time, ‘from morn-
ing until night time’. One said, there were also very good speakers in the semi-
nars and one seminar, was soon enough to be used in practice.
However, quite many also experienced the course or coaching they attended,
was too "marketing" -oriented and varied quite a lot according to the themes of
the event and / or selected performers. Also, occasions were hoped to be
more proactive and some felt the contacts on behalf of Excellence Finland
were missing.
This could mean, that Excellence Finland should concentrate more on each
theme and be less marketing other services in their occasions, and contact
more their current customers and members. This could simply happen by ask-
ing, from time to time, how they are doing and refer to the latest meeting or a
subject discussed. Also, the attendees may need more concrete point on the
topic, no marketing on which course can develop more that expertise.
The average age of the participants was also experienced relatively high and
informing before training poor. The auditors also left a strange picture to some
attendees. The age distribution is probably hard to effect on behalf of the com-
pany, but it is an interesting point of view. However, the informing before each
training is something easy to improve in the future.
In comparison to successful Prague seminar, the annual Quality Day 2015
was experienced surprisingly dull to some and it was expected a lot more at-
tendees and exhibitors there. Some of the performers were felt even very mis-
erable, and the training too technical, with no time to ensure that the students
learn. Concrete example was an exercise, where one had to enter a chapter
into a ‘particular cell’. This was experienced challenging or too technical to
some. Additionally, some members felt, that the content of the occasions
should have been more versatile likewise member services may receive too
little information, even in the member divisions. In addition, some experienced
the content of the occasions or event greatly depend on the lectures and are
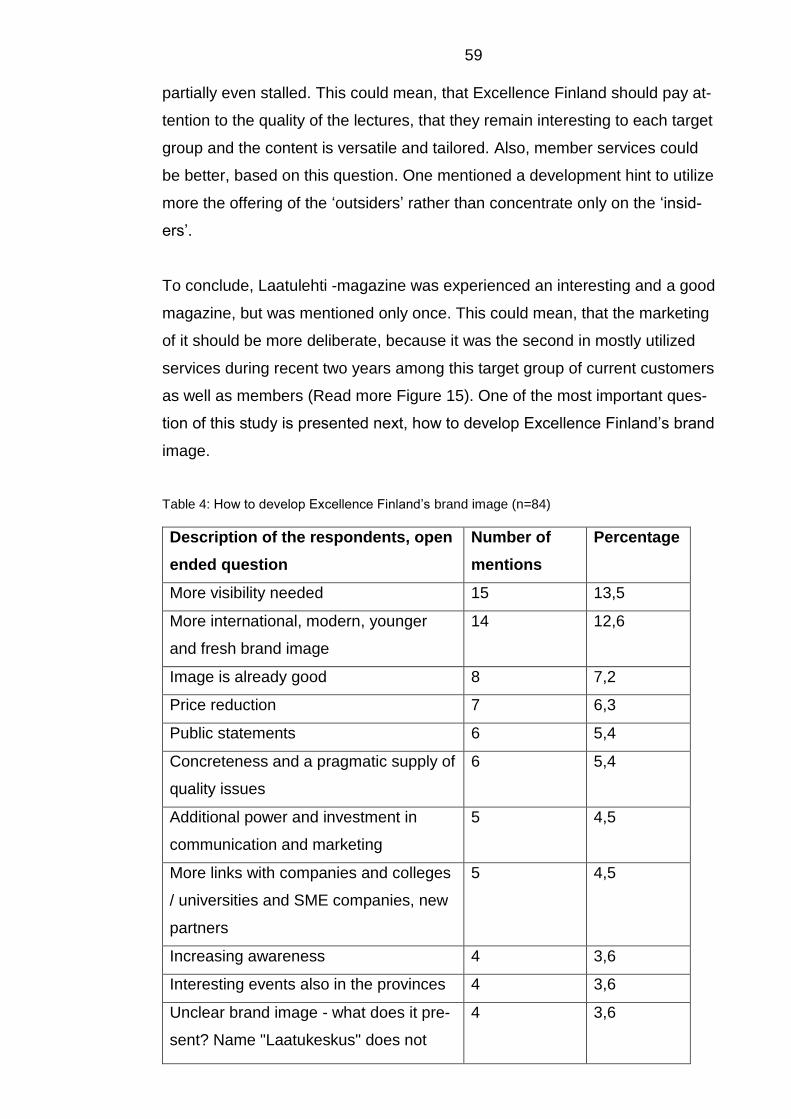
59
partially even stalled. This could mean, that Excellence Finland should pay at-
tention to the quality of the lectures, that they remain interesting to each target
group and the content is versatile and tailored. Also, member services could
be better, based on this question. One mentioned a development hint to utilize
more the offering of the ‘outsiders’ rather than concentrate only on the ‘insid-
ers’.
To conclude, Laatulehti -magazine was experienced an interesting and a good
magazine, but was mentioned only once. This could mean, that the marketing
of it should be more deliberate, because it was the second in mostly utilized
services during recent two years among this target group of current customers
as well as members (Read more Figure 15). One of the most important ques-
tion of this study is presented next, how to develop Excellence Finland’s brand
image.
Table 4: How to develop Excellence Finland’s brand image (n=84)
Description of the respondents, open
ended question
Number of
mentions
Percentage
More visibility needed 15 13,5
More international, modern, younger
and fresh brand image
14 12,6
Image is already good 8 7,2
Price reduction 7 6,3
Public statements 6 5,4
Concreteness and a pragmatic supply of
quality issues
6 5,4
Additional power and investment in
communication and marketing
5 4,5
More links with companies and colleges
/ universities and SME companies, new
partners
5 4,5
Increasing awareness 4 3,6
Interesting events also in the provinces 4 3,6
Unclear brand image - what does it pre-
sent? Name "Laatukeskus" does not
4 3,6
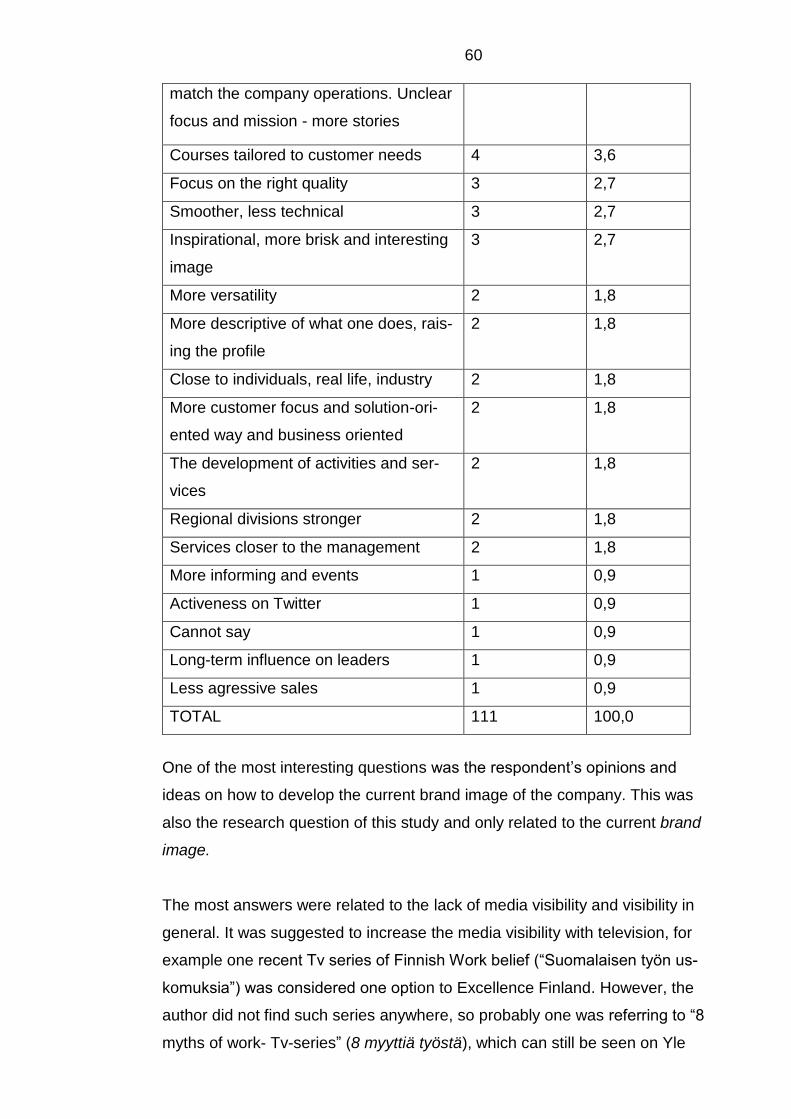
60
match the company operations. Unclear
focus and mission - more stories
Courses tailored to customer needs 4 3,6
Focus on the right quality 3 2,7
Smoother, less technical 3 2,7
Inspirational, more brisk and interesting
image
3 2,7
More versatility 2 1,8
More descriptive of what one does, rais-
ing the profile
2 1,8
Close to individuals, real life, industry 2 1,8
More customer focus and solution-ori-
ented way and business oriented
2 1,8
The development of activities and ser-
vices
2 1,8
Regional divisions stronger 2 1,8
Services closer to the management 2 1,8
More informing and events 1 0,9
Activeness on Twitter 1 0,9
Cannot say 1 0,9
Long-term influence on leaders 1 0,9
Less agressive sales 1 0,9
TOTAL 111 100,0
One of the most interesting questions was the respondent’s opinions and
ideas on how to develop the current brand image of the company. This was
also the research question of this study and only related to the current brand
image.
The most answers were related to the lack of media visibility and visibility in
general. It was suggested to increase the media visibility with television, for
example one recent Tv series of Finnish Work belief (“Suomalaisen työn us-
komuksia”) was considered one option to Excellence Finland. However, the
author did not find such series anywhere, so probably one was referring to “8
myths of work- Tv-series” (8 myyttiä työstä), which can still be seen on Yle
61
Areena (yleareena.fi), online. Additionally, it was also felt, that Excellence Fin-
land is not visible enough on national or traditional medias, for example Laatu-
lehti-magazine was not experienced to be enough and its content was also
hoped to be stronger, meaningful and more involved. It was in addition
claimed, that big audiences do not even know the company exists. The devel-
opment ideas considering visibility included examples of writing articles in tra-
ditional magazines and newspapers and one idea was a First of May event
(“Vappu-tempaus” in Finnish) on a day of Finnish Quality (Laatupäivät).
The second development theme was related to younger, fresher and more in-
ternational brand image. The people and speakers were seen “grey” to some,
which could mean boring or colorless personalities or styles of speeches.
Quite many also wished that younger people would be involved to the activi-
ties of the company. Too less information about the trainings, and the concern
on the field, that it is not known that such trainings exist on behalf of Excel-
lence Finland, was one astonishment. However, third biggest, 7,2% of the re-
spondents felt the current brand image is good already as it is.
Price reduction was the fourth biggest issue, with 6,3% share. The course and
training prices were suggested to come in modern times and some felt the
prices are now “in the clouds”. Next, some replies, 5,4%, concerned about
more publicity, visibility and public statements. Some thought the current is-
sues related to quality development could take even more public stance, for
example, speaking in social media is enough if, for any reason, it is not possi-
ble to take a position, for example, in a newspaper. Furthermore, more robust
presentations in most major publications were needed, in some thoughts.
The same share 5,4% was shown on concreteness and a pragmatic supply of
quality issues. Current customers were hoping more concreteness and prag-
matic supply of quality issues in addition to the top issues, as well as on the
basics, where Finland has, obviously, a lot of work to do. Some felt, that too
much fuss is in small circles and separate, when Excellence Finland could or
should combine and use the country's best resources for the benefit of those
in need.
The result of 4,5% share was also on additional power and investment in com-
munication and marketing likewise getting into headlines. For example, one
62
noted, after the ‘Quality competition’, the number of publicity has been driven
by the ‘Best Workplace Competition’ in Finland. The marketing was also
wished to be more active, but less only marketing-oriented as well as provid-
ing services. Customer meetings were suggested to be increased, to hear
more about the services. Moreover, the same share 4,5% was likewise on
more links with companies and colleges, universities and SME companies.
Advertising in industry publications, service development, co-operation with
companies, by supporting SMEs, the Finnish economy and exports was expe-
rienced to grow. One also winked to open connections to KARVI, The National
Education Evaluation Center, which is an independent agency responsible for
national evaluation of teaching and training (Cf. more Karvi.fi). Also, new part-
ners were hoped, some noted, how often the same organizations tell about
good practices, such as Eloranta et al.
The increasing brand awareness was additionally experienced important, with
3,6% share. For example, presentation round at the decision-making mem-
bers or a visible role through the ‘Quality days’ (Laatupäivät) also means the
national media to some. One suggested purchased STT news coverage for
Quality award (Laatupalkinto) -recipients. As much development ideas were
presented on organizing events also in provinces, not just in Helsinki.
When it comes to international brand image, also 3,6% of the respondents
thought it was unclear or missing and the obsolescent image was hoped to di-
vert into younger, modern, exiting, dynamic, innovative and extensive direc-
tion. Moreover, the graphic design was one additional thing to develop as well,
possibly more colors – update to this day. The brand image was recom-
mended to regenerate into agile and less formal external direction likewise the
name “Laatukeskus” needed rethinking into modern version, referring to some
opinions. Some well-noted, that "Quality" is a challenging term, because it is
associated with virtually everything within a company or organization. ‘So what
brand does the company want to represent, and should the name
‘Laatukeskus’ to be changed’, could be the questions directed to Excellence
Finland? It is true, that at first, one should develop activities and content.
Some thought the name ‘Quality Center /Laatukeskus’ is not responsible for
the content of the current activity. One suggestion for a new name was pre-
sented as Productivity Center. Another option for a small seminar name was
63
‘Q-Prof’. In addition, many thought that the focus and mission is still unclear,
and more stories were hoped, because the concept of quality was experi-
enced awkward to some. Perhaps the Brand Storybook could help with this
(cf. for example Ch. 2.1)
The courses tailored to customer needs was as well wished with 3,6% share.
For example, by emphasizing the benefits of customer companies, people
who do not work with quality people could be more interested in even more of
the business. One suggested, how he/she would change the courses to be in-
teresting by increasing the speed, customer focus, and resolution. Also, one
would emphasize tailor-made (multidimensional) courses and top expertise in
the field of customer needs. In addition, Excellence Finland could promise the
quality guarantee and the price would depend on the results and customer
satisfaction. Also, it was noted how the development should focus on the
opening of quality-jargon and the ‘quality-believers’ should come to the real
world. The development of the brand image should in addition be linked to do-
ing something that genuinely helps companies and organizations.
Some other opinions about the current brand image, were that it is held the
quality self-worth piling underlining the meaning of the quality work to meet the
standards or in other words, imago in which the quality of self-worth is main-
tained, underlining the importance of standards and quality work that is specif-
ically employed. Further, Excellence Finland was felt it lacks the courage to
question its own work. Some mentioned, that they are not looking for the latest
information from the company. Suggestions were to renew the brand image in
such a way that the Excellence Finland would be considered as a primary
source when looking for modern management methods and, especially, for fu-
ture-oriented management methods and leading to the improvement of
productivity through high-quality, cost-effective tools.
To conclude, stylishness was experienced good and to be maintained, as well
as reliability and expertise, but, perhaps a bit more descriptive of what one
does should be clearer. The Excellence was advised to focus more on the
right quality, meaning a broad concept of quality, not seeking market excel-
lence, but beneficial promotion of the right quality. The angle should be more
of a quality expert organization whose expertise sells itself. The Excellence
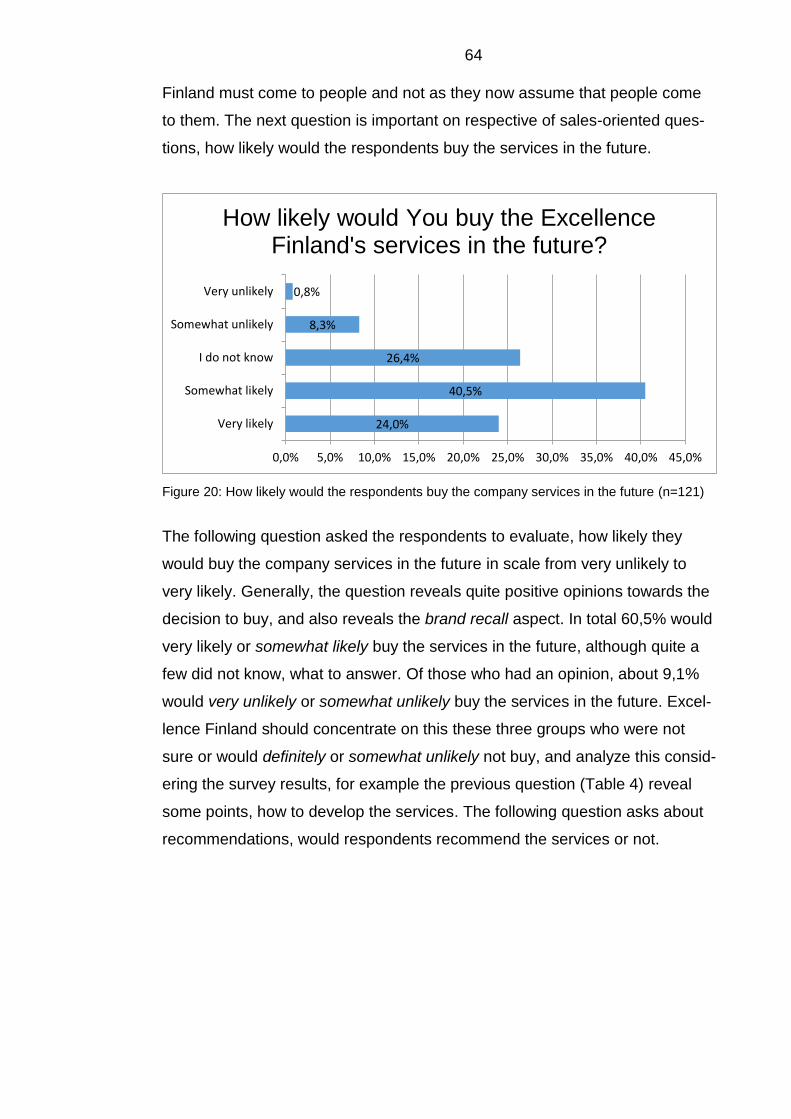
64
Finland must come to people and not as they now assume that people come
to them. The next question is important on respective of sales-oriented ques-
tions, how likely would the respondents buy the services in the future.
Figure 20: How likely would the respondents buy the company services in the future (n=121)
The following question asked the respondents to evaluate, how likely they
would buy the company services in the future in scale from very unlikely to
very likely. Generally, the question reveals quite positive opinions towards the
decision to buy, and also reveals the brand recall aspect. In total 60,5% would
very likely or somewhat likely buy the services in the future, although quite a
few did not know, what to answer. Of those who had an opinion, about 9,1%
would very unlikely or somewhat unlikely buy the services in the future. Excel-
lence Finland should concentrate on this these three groups who were not
sure or would definitely or somewhat unlikely not buy, and analyze this consid-
ering the survey results, for example the previous question (Table 4) reveal
some points, how to develop the services. The following question asks about
recommendations, would respondents recommend the services or not.
24,0%
40,5%
26,4%
8,3%
0,8%
Very likely
Somewhat likely
I do not know
Somewhat unlikely
Very unlikely
0,0% 5,0% 10,0% 15,0% 20,0% 25,0% 30,0% 35,0% 40,0% 45,0%
How likely would You buy the Excellence Finland's services in the future?
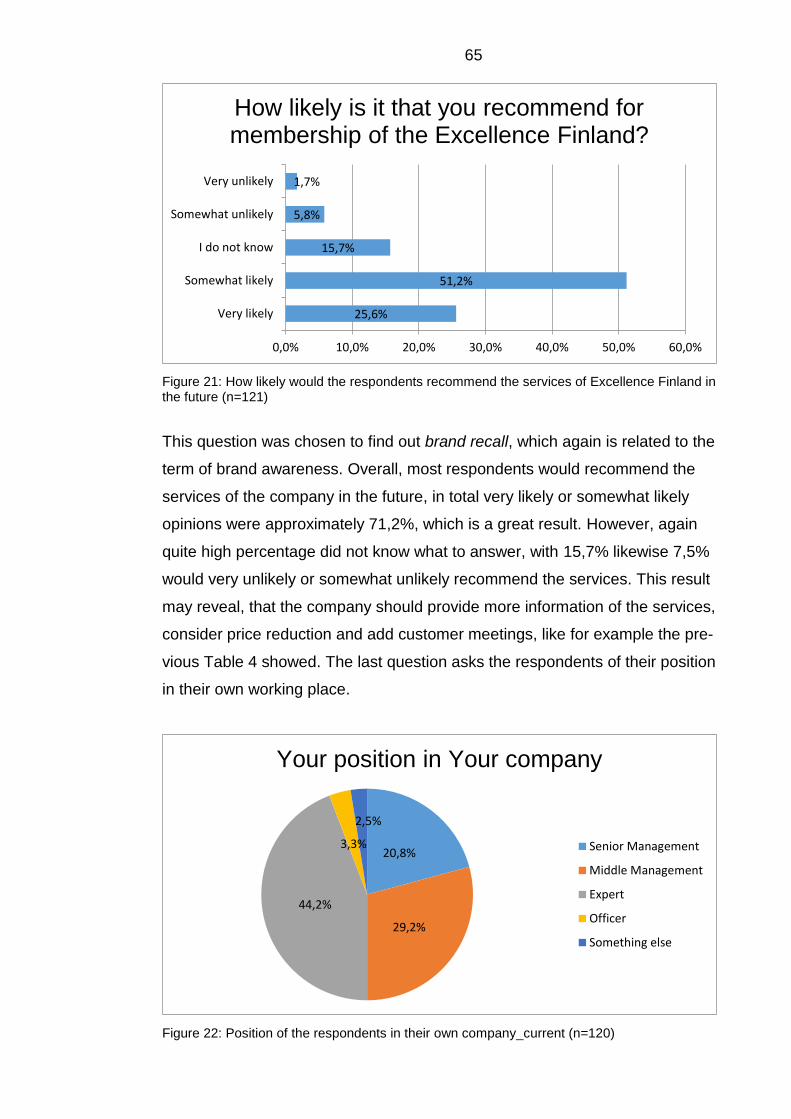
65
Figure 21: How likely would the respondents recommend the services of Excellence Finland in the future (n=121)
This question was chosen to find out brand recall, which again is related to the
term of brand awareness. Overall, most respondents would recommend the
services of the company in the future, in total very likely or somewhat likely
opinions were approximately 71,2%, which is a great result. However, again
quite high percentage did not know what to answer, with 15,7% likewise 7,5%
would very unlikely or somewhat unlikely recommend the services. This result
may reveal, that the company should provide more information of the services,
consider price reduction and add customer meetings, like for example the pre-
vious Table 4 showed. The last question asks the respondents of their position
in their own working place.
Figure 22: Position of the respondents in their own company_current (n=120)
25,6%
51,2%
15,7%
5,8%
1,7%
Very likely
Somewhat likely
I do not know
Somewhat unlikely
Very unlikely
0,0% 10,0% 20,0% 30,0% 40,0% 50,0% 60,0%
How likely is it that you recommend for membership of the Excellence Finland?
20,8%
29,2%
44,2%
3,3%
2,5%
Your position in Your company
Senior Management
Middle Management
Expert
Officer
Something else
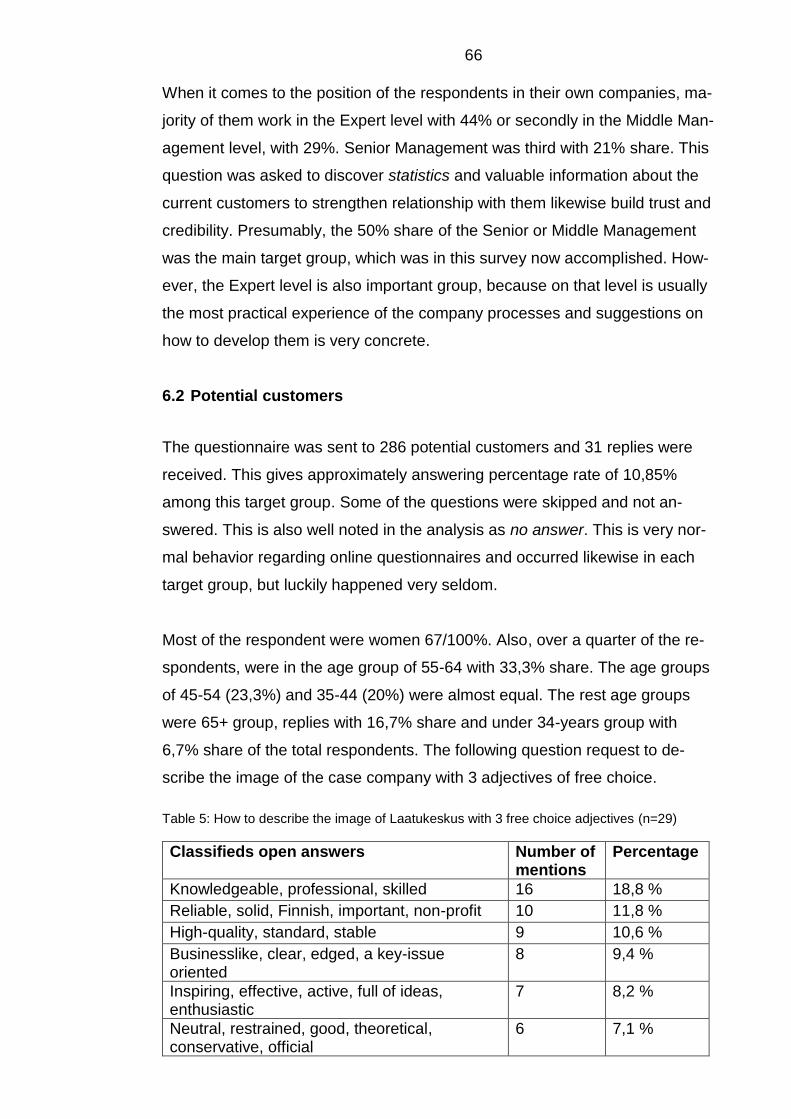
66
When it comes to the position of the respondents in their own companies, ma-
jority of them work in the Expert level with 44% or secondly in the Middle Man-
agement level, with 29%. Senior Management was third with 21% share. This
question was asked to discover statistics and valuable information about the
current customers to strengthen relationship with them likewise build trust and
credibility. Presumably, the 50% share of the Senior or Middle Management
was the main target group, which was in this survey now accomplished. How-
ever, the Expert level is also important group, because on that level is usually
the most practical experience of the company processes and suggestions on
how to develop them is very concrete.
6.2 Potential customers
The questionnaire was sent to 286 potential customers and 31 replies were
received. This gives approximately answering percentage rate of 10,85%
among this target group. Some of the questions were skipped and not an-
swered. This is also well noted in the analysis as no answer. This is very nor-
mal behavior regarding online questionnaires and occurred likewise in each
target group, but luckily happened very seldom.
Most of the respondent were women 67/100%. Also, over a quarter of the re-
spondents, were in the age group of 55-64 with 33,3% share. The age groups
of 45-54 (23,3%) and 35-44 (20%) were almost equal. The rest age groups
were 65+ group, replies with 16,7% share and under 34-years group with
6,7% share of the total respondents. The following question request to de-
scribe the image of the case company with 3 adjectives of free choice.
Table 5: How to describe the image of Laatukeskus with 3 free choice adjectives (n=29)
Classifieds open answers Number of mentions
Percentage
Knowledgeable, professional, skilled 16 18,8 %
Reliable, solid, Finnish, important, non-profit 10 11,8 %
High-quality, standard, stable 9 10,6 %
Businesslike, clear, edged, a key-issue oriented
8 9,4 %
Inspiring, effective, active, full of ideas, enthusiastic
7 8,2 %
Neutral, restrained, good, theoretical, conservative, official
6 7,1 %
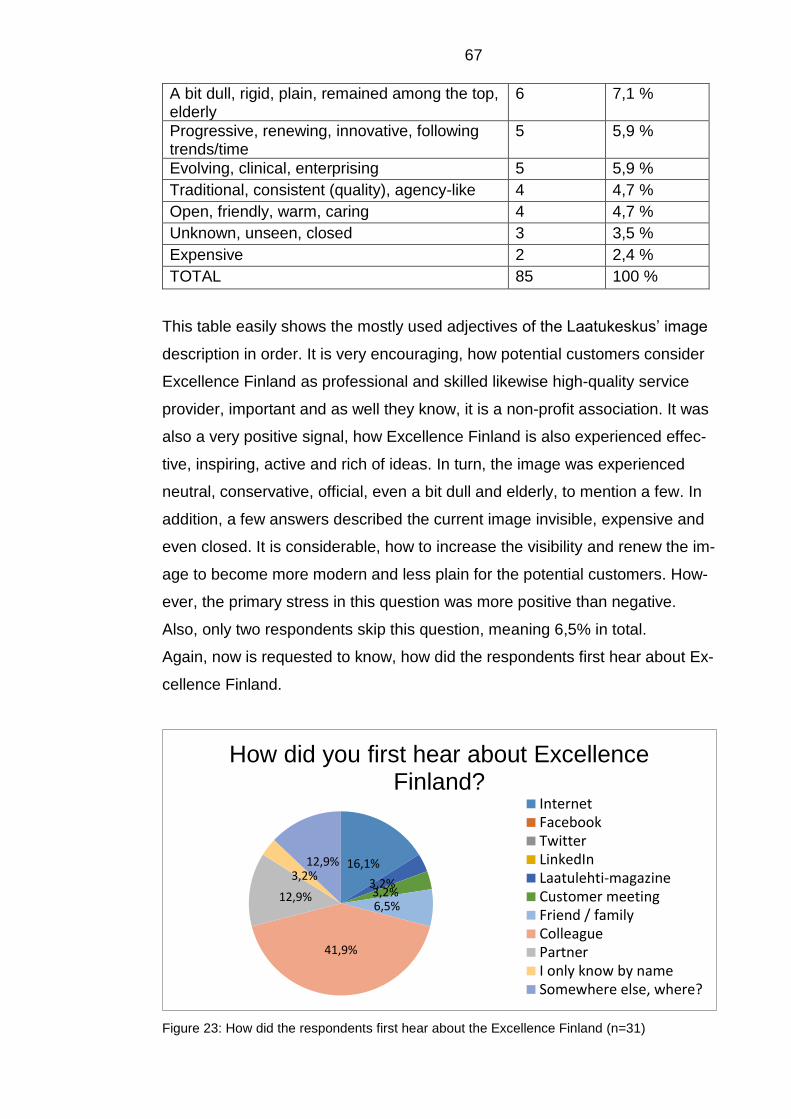
67
A bit dull, rigid, plain, remained among the top, elderly
6 7,1 %
Progressive, renewing, innovative, following trends/time
5 5,9 %
Evolving, clinical, enterprising 5 5,9 %
Traditional, consistent (quality), agency-like 4 4,7 %
Open, friendly, warm, caring 4 4,7 %
Unknown, unseen, closed 3 3,5 %
Expensive 2 2,4 %
TOTAL 85 100 %
This table easily shows the mostly used adjectives of the Laatukeskus’ image
description in order. It is very encouraging, how potential customers consider
Excellence Finland as professional and skilled likewise high-quality service
provider, important and as well they know, it is a non-profit association. It was
also a very positive signal, how Excellence Finland is also experienced effec-
tive, inspiring, active and rich of ideas. In turn, the image was experienced
neutral, conservative, official, even a bit dull and elderly, to mention a few. In
addition, a few answers described the current image invisible, expensive and
even closed. It is considerable, how to increase the visibility and renew the im-
age to become more modern and less plain for the potential customers. How-
ever, the primary stress in this question was more positive than negative.
Also, only two respondents skip this question, meaning 6,5% in total.
Again, now is requested to know, how did the respondents first hear about Ex-
cellence Finland.
Figure 23: How did the respondents first hear about the Excellence Finland (n=31)
16,1%
3,2%3,2%6,5%
41,9%
12,9%
3,2%12,9%
How did you first hear about ExcellenceFinland?
InternetFacebookTwitterLinkedInLaatulehti-magazineCustomer meetingFriend / familyColleaguePartnerI only know by nameSomewhere else, where?
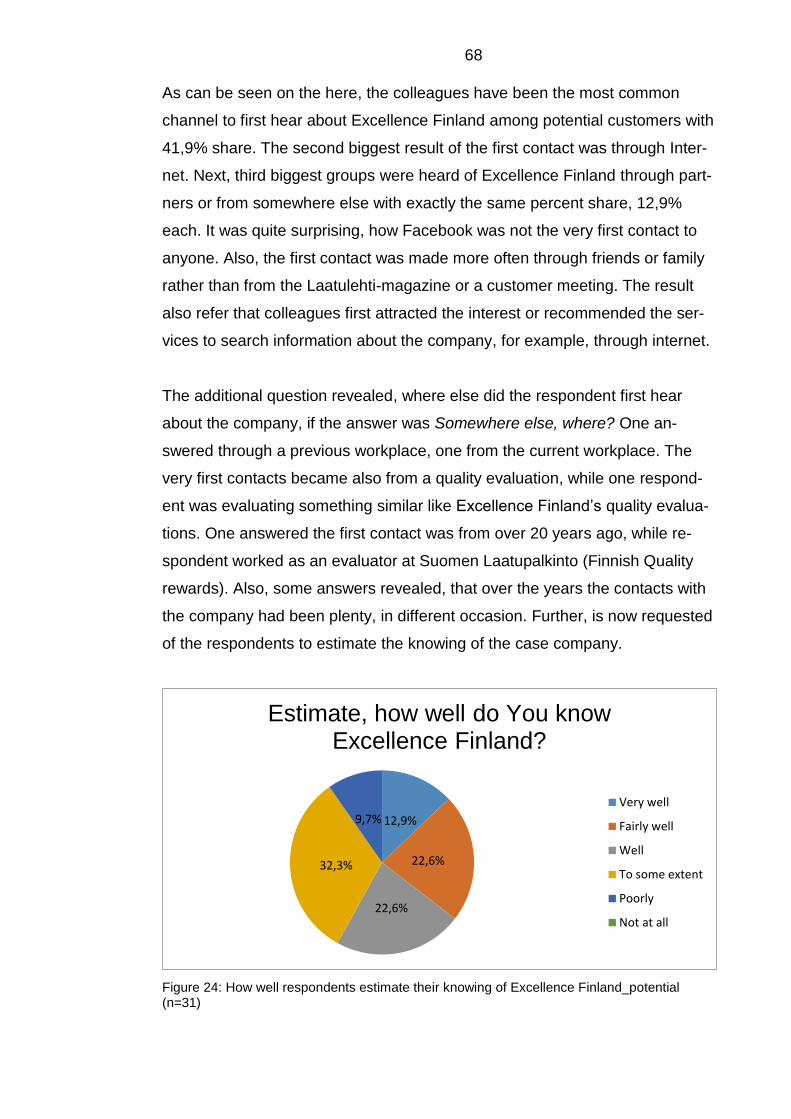
68
As can be seen on the here, the colleagues have been the most common
channel to first hear about Excellence Finland among potential customers with
41,9% share. The second biggest result of the first contact was through Inter-
net. Next, third biggest groups were heard of Excellence Finland through part-
ners or from somewhere else with exactly the same percent share, 12,9%
each. It was quite surprising, how Facebook was not the very first contact to
anyone. Also, the first contact was made more often through friends or family
rather than from the Laatulehti-magazine or a customer meeting. The result
also refer that colleagues first attracted the interest or recommended the ser-
vices to search information about the company, for example, through internet.
The additional question revealed, where else did the respondent first hear
about the company, if the answer was Somewhere else, where? One an-
swered through a previous workplace, one from the current workplace. The
very first contacts became also from a quality evaluation, while one respond-
ent was evaluating something similar like Excellence Finland’s quality evalua-
tions. One answered the first contact was from over 20 years ago, while re-
spondent worked as an evaluator at Suomen Laatupalkinto (Finnish Quality
rewards). Also, some answers revealed, that over the years the contacts with
the company had been plenty, in different occasion. Further, is now requested
of the respondents to estimate the knowing of the case company.
Figure 24: How well respondents estimate their knowing of Excellence Finland_potential (n=31)
12,9%
22,6%
22,6%
32,3%
9,7%
Estimate, how well do You know Excellence Finland?
Very well
Fairly well
Well
To some extent
Poorly
Not at all
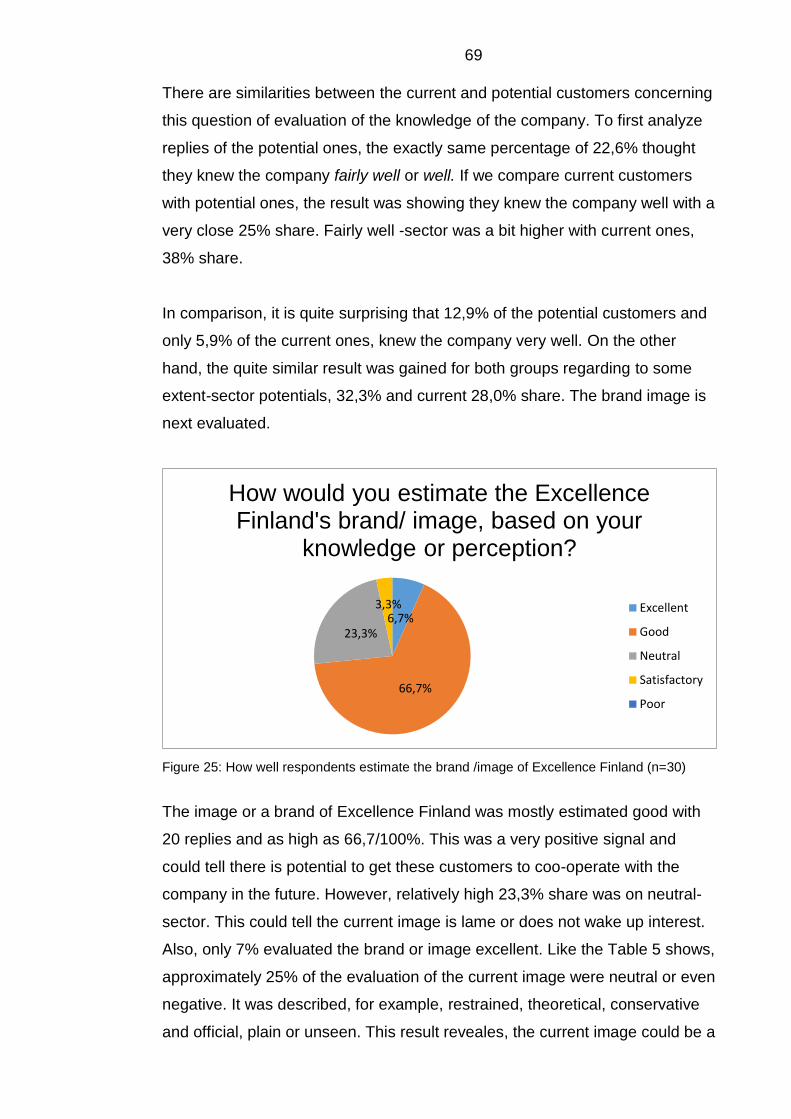
69
There are similarities between the current and potential customers concerning
this question of evaluation of the knowledge of the company. To first analyze
replies of the potential ones, the exactly same percentage of 22,6% thought
they knew the company fairly well or well. If we compare current customers
with potential ones, the result was showing they knew the company well with a
very close 25% share. Fairly well -sector was a bit higher with current ones,
38% share.
In comparison, it is quite surprising that 12,9% of the potential customers and
only 5,9% of the current ones, knew the company very well. On the other
hand, the quite similar result was gained for both groups regarding to some
extent-sector potentials, 32,3% and current 28,0% share. The brand image is
next evaluated.
Figure 25: How well respondents estimate the brand /image of Excellence Finland (n=30)
The image or a brand of Excellence Finland was mostly estimated good with
20 replies and as high as 66,7/100%. This was a very positive signal and
could tell there is potential to get these customers to coo-operate with the
company in the future. However, relatively high 23,3% share was on neutral-
sector. This could tell the current image is lame or does not wake up interest.
Also, only 7% evaluated the brand or image excellent. Like the Table 5 shows,
approximately 25% of the evaluation of the current image were neutral or even
negative. It was described, for example, restrained, theoretical, conservative
and official, plain or unseen. This result reveales, the current image could be a
6,7%
66,7%
23,3%
3,3%
How would you estimate the Excellence Finland's brand/ image, based on your
knowledge or perception?
Excellent
Good
Neutral
Satisfactory
Poor
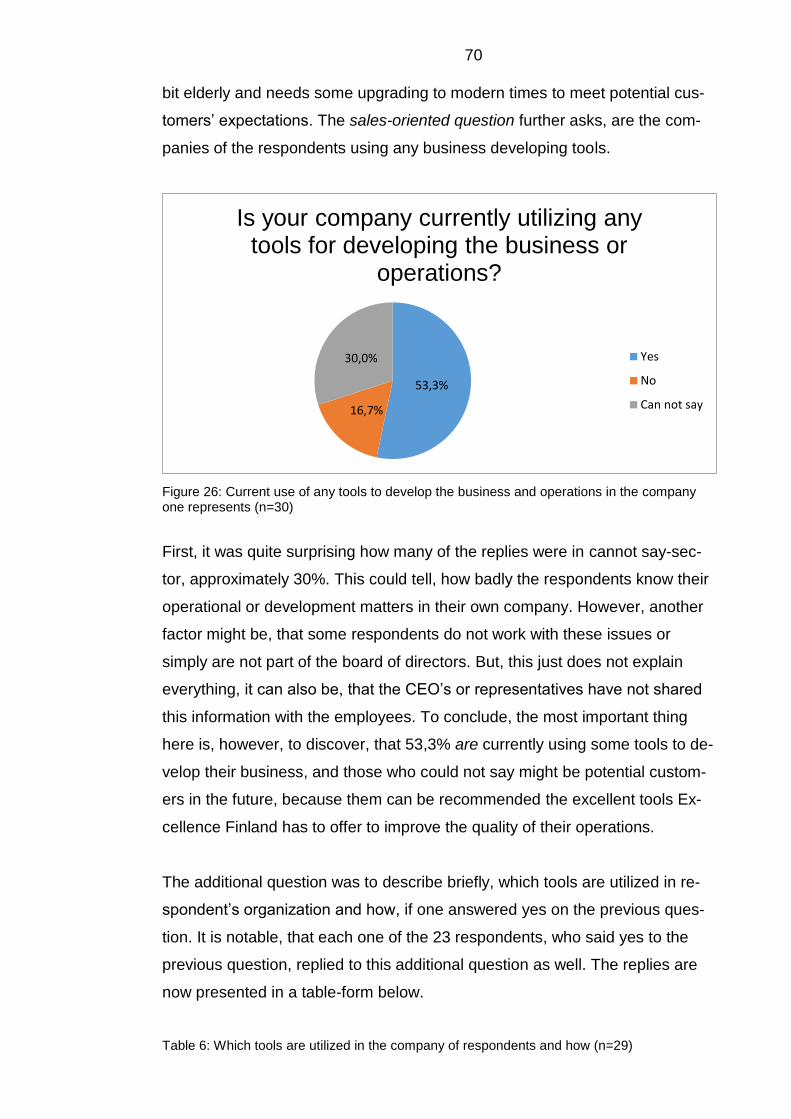
70
bit elderly and needs some upgrading to modern times to meet potential cus-
tomers’ expectations. The sales-oriented question further asks, are the com-
panies of the respondents using any business developing tools.
Figure 26: Current use of any tools to develop the business and operations in the company one represents (n=30)
First, it was quite surprising how many of the replies were in cannot say-sec-
tor, approximately 30%. This could tell, how badly the respondents know their
operational or development matters in their own company. However, another
factor might be, that some respondents do not work with these issues or
simply are not part of the board of directors. But, this just does not explain
everything, it can also be, that the CEO’s or representatives have not shared
this information with the employees. To conclude, the most important thing
here is, however, to discover, that 53,3% are currently using some tools to de-
velop their business, and those who could not say might be potential custom-
ers in the future, because them can be recommended the excellent tools Ex-
cellence Finland has to offer to improve the quality of their operations.
The additional question was to describe briefly, which tools are utilized in re-
spondent’s organization and how, if one answered yes on the previous ques-
tion. It is notable, that each one of the 23 respondents, who said yes to the
previous question, replied to this additional question as well. The replies are
now presented in a table-form below.
Table 6: Which tools are utilized in the company of respondents and how (n=29)
53,3%
16,7%
30,0%
Is your company currently utilizing any tools for developing the business or
operations?
Yes
No
Can not say
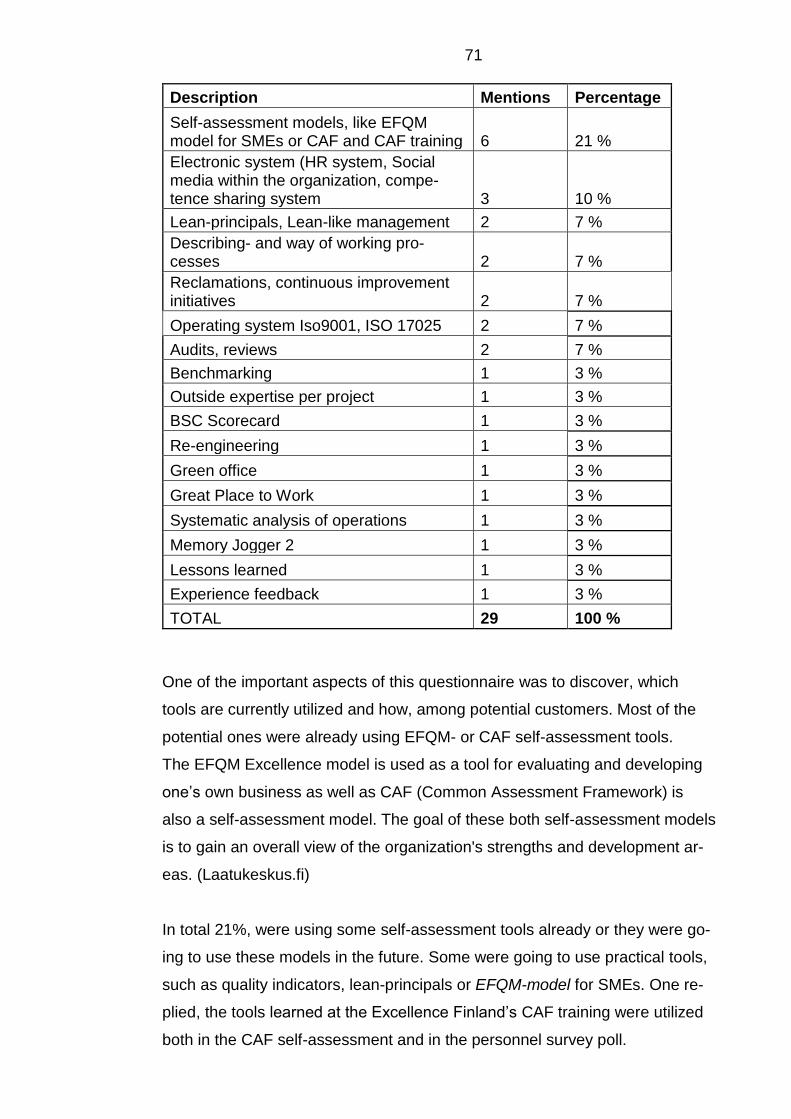
71
Description Mentions Percentage
Self-assessment models, like EFQM model for SMEs or CAF and CAF training 6 21 %
Electronic system (HR system, Social media within the organization, compe-tence sharing system 3 10 %
Lean-principals, Lean-like management 2 7 %
Describing- and way of working pro-cesses 2 7 %
Reclamations, continuous improvement initiatives 2 7 %
Operating system Iso9001, ISO 17025 2 7 %
Audits, reviews 2 7 %
Benchmarking 1 3 %
Outside expertise per project 1 3 %
BSC Scorecard 1 3 %
Re-engineering 1 3 %
Green office 1 3 %
Great Place to Work 1 3 %
Systematic analysis of operations 1 3 %
Memory Jogger 2 1 3 %
Lessons learned 1 3 %
Experience feedback 1 3 %
TOTAL 29 100 %
One of the important aspects of this questionnaire was to discover, which
tools are currently utilized and how, among potential customers. Most of the
potential ones were already using EFQM- or CAF self-assessment tools.
The EFQM Excellence model is used as a tool for evaluating and developing
one’s own business as well as CAF (Common Assessment Framework) is
also a self-assessment model. The goal of these both self-assessment models
is to gain an overall view of the organization's strengths and development ar-
eas. (Laatukeskus.fi)
In total 21%, were using some self-assessment tools already or they were go-
ing to use these models in the future. Some were going to use practical tools,
such as quality indicators, lean-principals or EFQM-model for SMEs. One re-
plied, the tools learned at the Excellence Finland’s CAF training were utilized
both in the CAF self-assessment and in the personnel survey poll.
72
Secondly, most of the respondents with 10% share were using several types
of electronic systems, such as HR system, internal social media organization,
knowledge sharing system and in addition, external knowledge of the matter
for each project. Benchmarking is a comparative analysis and the learning oc-
curs through comparing organizations with each other. This means comparing
activities and processes with another organization. A comparator is generally
sought in some respect for a better organization. Learning subjects can be se-
lected from companies in the same field or from any industry (University of
Eastern Finland). Altogether 10% of the total mentioned benchmarking, audits
or reviews. Continuous improvement and auditing were seen the most im-
portant instruments of renewal and development. The feedback gathered from
both internal and external customers and processes was used to develop pro-
cesses. It was described, how benchmarking brings ideas from outside the
company, how things can be done better and more wisely.
In turn, Lessons Learned is a project management tool, which can help to gain
insights during one project. Therefore, this information can help any future
projects and these insights can be usefully applied into new projects. In turn,
BSC Scorecard is a resource management performance meter developed for
the principles of goal management. Memory Jogger 2's content was also uti-
lized in evaluations and development among the respondents’ organizations
as well. In total, 9% of the total utilized already these tools in their own com-
pany, to name a few. The result shows exciting potential to offer Excellence
Finland’s services to these potential customers and clearly shows, the survey
was sent to correct organizations, who already work or are planning to work
with continuous improvement. Again, the question now requests the respond-
ents to tell, if they develop their organization’s processes.
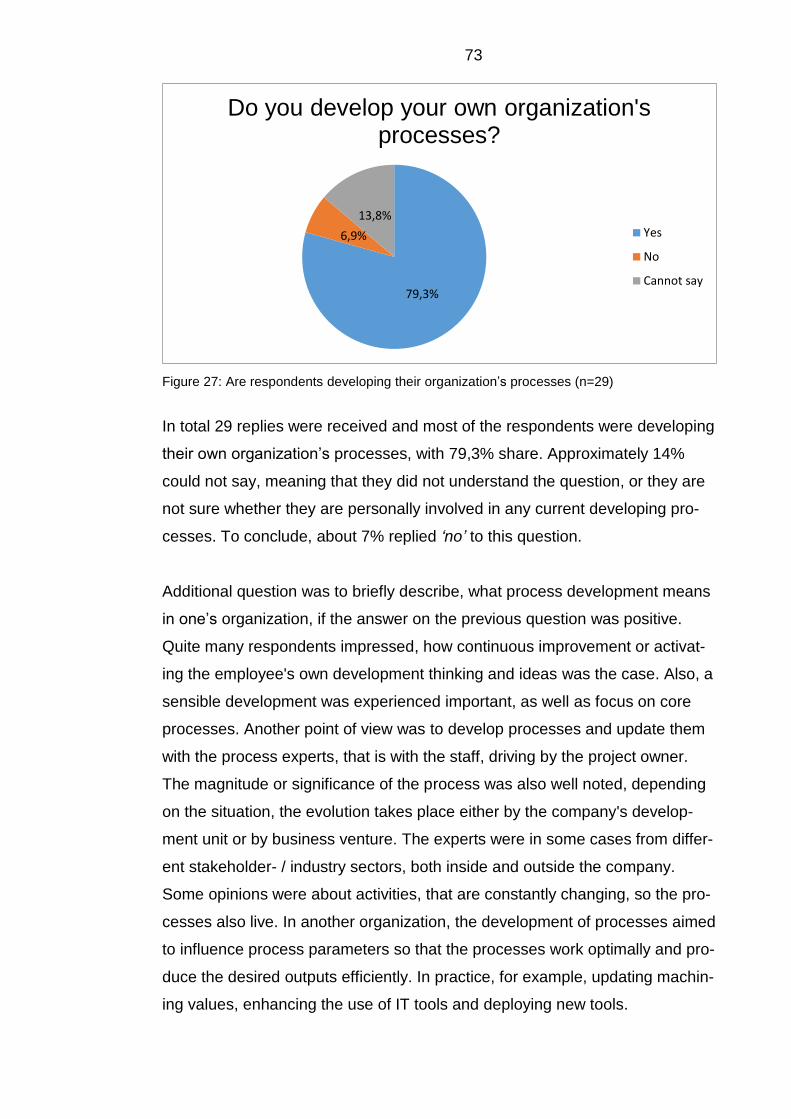
73
Figure 27: Are respondents developing their organization’s processes (n=29)
In total 29 replies were received and most of the respondents were developing
their own organization’s processes, with 79,3% share. Approximately 14%
could not say, meaning that they did not understand the question, or they are
not sure whether they are personally involved in any current developing pro-
cesses. To conclude, about 7% replied ‘no’ to this question.
Additional question was to briefly describe, what process development means
in one’s organization, if the answer on the previous question was positive.
Quite many respondents impressed, how continuous improvement or activat-
ing the employee's own development thinking and ideas was the case. Also, a
sensible development was experienced important, as well as focus on core
processes. Another point of view was to develop processes and update them
with the process experts, that is with the staff, driving by the project owner.
The magnitude or significance of the process was also well noted, depending
on the situation, the evolution takes place either by the company's develop-
ment unit or by business venture. The experts were in some cases from differ-
ent stakeholder- / industry sectors, both inside and outside the company.
Some opinions were about activities, that are constantly changing, so the pro-
cesses also live. In another organization, the development of processes aimed
to influence process parameters so that the processes work optimally and pro-
duce the desired outputs efficiently. In practice, for example, updating machin-
ing values, enhancing the use of IT tools and deploying new tools.
79,3%
6,9%
13,8%
Do you develop your own organization's processes?
Yes
No
Cannot say
74
Many replies were also concerning description of operations. One description
was, how the phases of the operation are first described and defined in an effi-
cient order, then the responsible persons are enrolled for the phases, and the
details of the function next defined. Defining and describing processes was
experienced in a way, that the doing was then more efficient, improving the
quality and increasing the meaningfulness of the work. With the same re-
sources, some felt more was now achieved and the quality improved.
Another way to operate was, that after the organization described the pro-
cesses, the responsibility was transferred for the management. Processes
were in such a way experienced developed and improved based on systemati-
cally collected information and documentation. In addition, description and
definition of processes was the process development in one’s organization,
then development of services and stakeholder work and finally development of
process indicators.
Planning, operative traversal and implementation was in some cases the way
of process development. Also, the action was to make it visible. Also, in some
cases the mapping of the current situation served as a basis for the design of
development targets and the elaboration of a thorough plan.
Reviewing operations, and interfaces / dependencies of operations was also
experienced important. In addition, identifying and systematically eliminating
money jams and bottlenecks was mentioned.
Some respondents experienced there are lack of some process development
matters within their organization, like linking control documents to processes
or risk mapping was requested to be process-based. Additionally, in some
cases, the current range of roles and responsibilities or determination of pro-
cess owners needed clarification. SOTE-preparation of social and health care
reform was also seen as challenging to the new social and health care compa-
nies, when they will change from the office-form into corporate-form and to the
change of competitive situation. To conclude, in some cases, only updating
guidelines yearly or seldom was the only way organization developed their
processes. However, some organizations were already using Lean-manage-
ment or adjusting Lean-principles, but some felt they needed improvement in
development of process indicators.
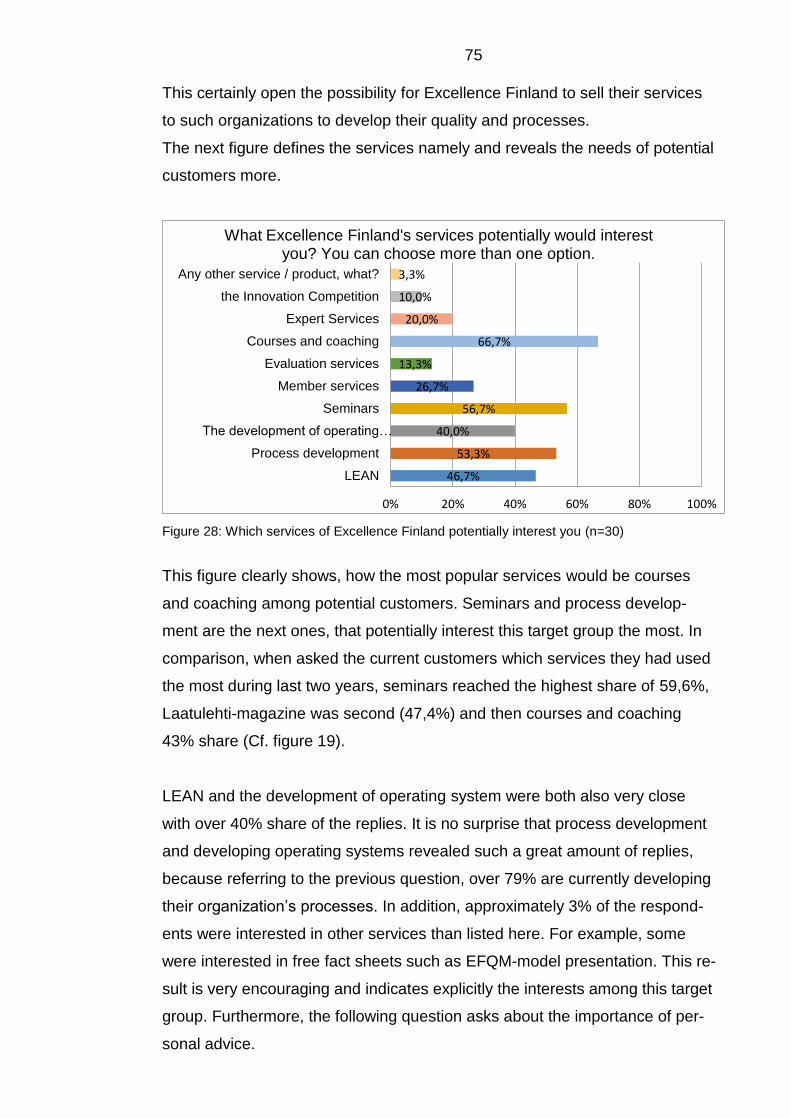
75
This certainly open the possibility for Excellence Finland to sell their services
to such organizations to develop their quality and processes.
The next figure defines the services namely and reveals the needs of potential
customers more.
Figure 28: Which services of Excellence Finland potentially interest you (n=30)
This figure clearly shows, how the most popular services would be courses
and coaching among potential customers. Seminars and process develop-
ment are the next ones, that potentially interest this target group the most. In
comparison, when asked the current customers which services they had used
the most during last two years, seminars reached the highest share of 59,6%,
Laatulehti-magazine was second (47,4%) and then courses and coaching
43% share (Cf. figure 19).
LEAN and the development of operating system were both also very close
with over 40% share of the replies. It is no surprise that process development
and developing operating systems revealed such a great amount of replies,
because referring to the previous question, over 79% are currently developing
their organization’s processes. In addition, approximately 3% of the respond-
ents were interested in other services than listed here. For example, some
were interested in free fact sheets such as EFQM-model presentation. This re-
sult is very encouraging and indicates explicitly the interests among this target
group. Furthermore, the following question asks about the importance of per-
sonal advice.
46,7%
53,3%
40,0%
56,7%
26,7%
13,3%
66,7%
20,0%
10,0%
3,3%
LEAN
Process development
The development of operating…
Seminars
Member services
Evaluation services
Courses and coaching
Expert Services
the Innovation Competition
Any other service / product, what?
0% 20% 40% 60% 80% 100%
What Excellence Finland's services potentially would interest you? You can choose more than one option.
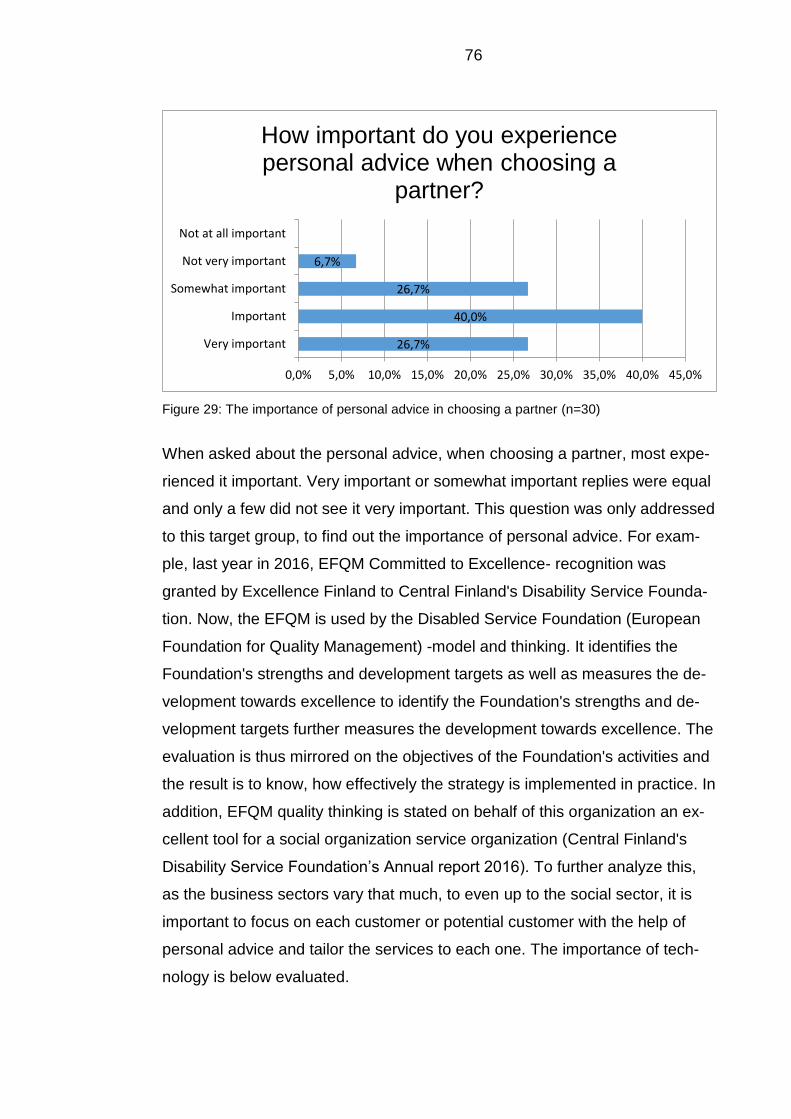
76
Figure 29: The importance of personal advice in choosing a partner (n=30)
When asked about the personal advice, when choosing a partner, most expe-
rienced it important. Very important or somewhat important replies were equal
and only a few did not see it very important. This question was only addressed
to this target group, to find out the importance of personal advice. For exam-
ple, last year in 2016, EFQM Committed to Excellence- recognition was
granted by Excellence Finland to Central Finland's Disability Service Founda-
tion. Now, the EFQM is used by the Disabled Service Foundation (European
Foundation for Quality Management) -model and thinking. It identifies the
Foundation's strengths and development targets as well as measures the de-
velopment towards excellence to identify the Foundation's strengths and de-
velopment targets further measures the development towards excellence. The
evaluation is thus mirrored on the objectives of the Foundation's activities and
the result is to know, how effectively the strategy is implemented in practice. In
addition, EFQM quality thinking is stated on behalf of this organization an ex-
cellent tool for a social organization service organization (Central Finland's
Disability Service Foundation’s Annual report 2016). To further analyze this,
as the business sectors vary that much, to even up to the social sector, it is
important to focus on each customer or potential customer with the help of
personal advice and tailor the services to each one. The importance of tech-
nology is below evaluated.
26,7%
40,0%
26,7%
6,7%
Very important
Important
Somewhat important
Not very important
Not at all important
0,0% 5,0% 10,0% 15,0% 20,0% 25,0% 30,0% 35,0% 40,0% 45,0%
How important do you experience personal advice when choosing a
partner?
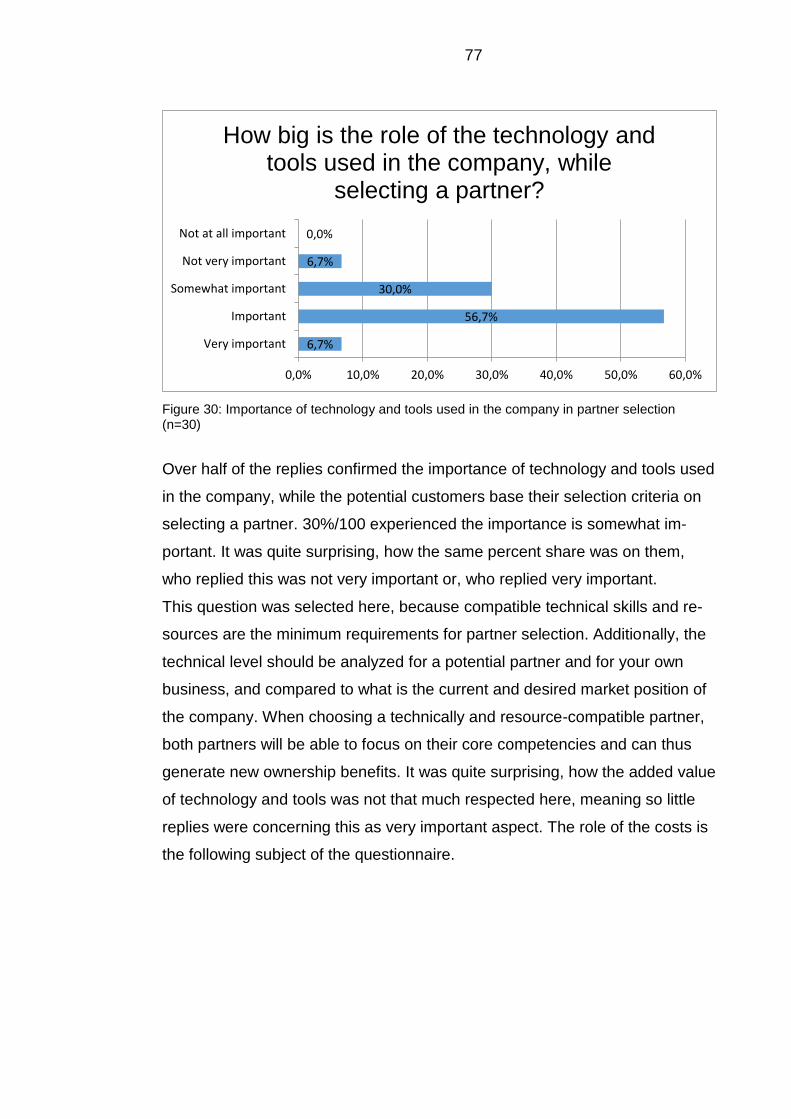
77
Figure 30: Importance of technology and tools used in the company in partner selection (n=30)
Over half of the replies confirmed the importance of technology and tools used
in the company, while the potential customers base their selection criteria on
selecting a partner. 30%/100 experienced the importance is somewhat im-
portant. It was quite surprising, how the same percent share was on them,
who replied this was not very important or, who replied very important.
This question was selected here, because compatible technical skills and re-
sources are the minimum requirements for partner selection. Additionally, the
technical level should be analyzed for a potential partner and for your own
business, and compared to what is the current and desired market position of
the company. When choosing a technically and resource-compatible partner,
both partners will be able to focus on their core competencies and can thus
generate new ownership benefits. It was quite surprising, how the added value
of technology and tools was not that much respected here, meaning so little
replies were concerning this as very important aspect. The role of the costs is
the following subject of the questionnaire.
6,7%
56,7%
30,0%
6,7%
0,0%
Very important
Important
Somewhat important
Not very important
Not at all important
0,0% 10,0% 20,0% 30,0% 40,0% 50,0% 60,0%
How big is the role of the technology and tools used in the company, while
selecting a partner?
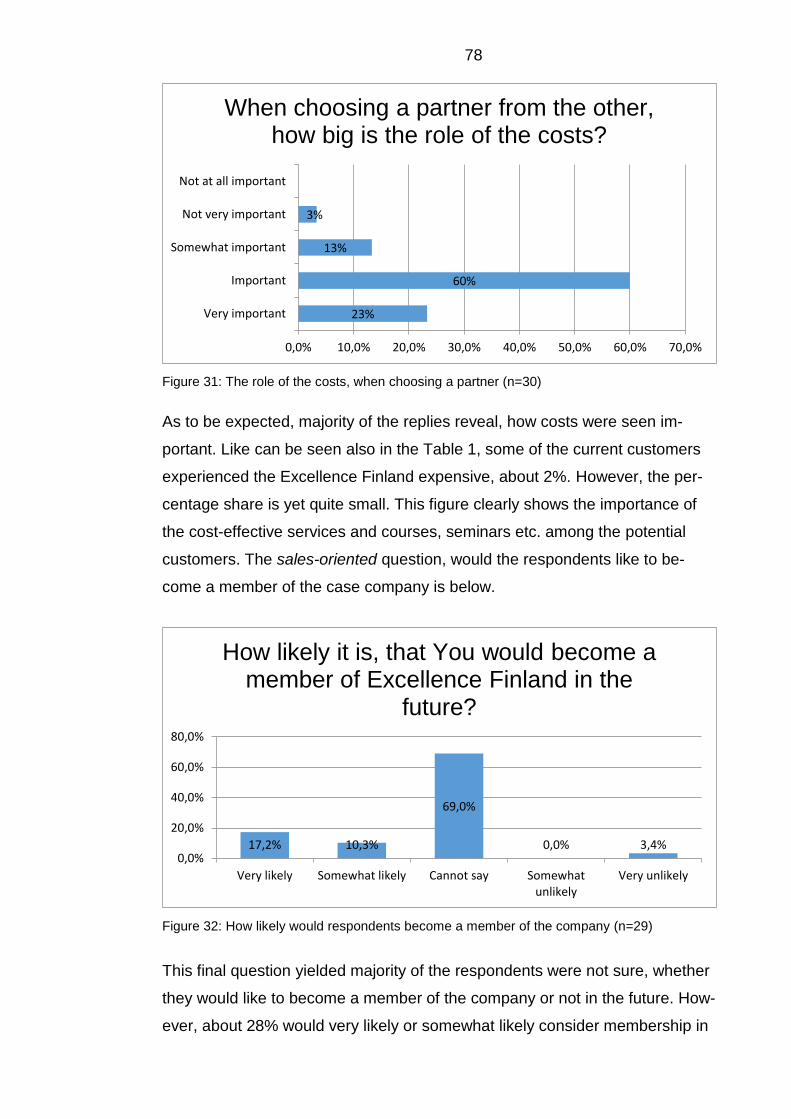
78
Figure 31: The role of the costs, when choosing a partner (n=30)
As to be expected, majority of the replies reveal, how costs were seen im-
portant. Like can be seen also in the Table 1, some of the current customers
experienced the Excellence Finland expensive, about 2%. However, the per-
centage share is yet quite small. This figure clearly shows the importance of
the cost-effective services and courses, seminars etc. among the potential
customers. The sales-oriented question, would the respondents like to be-
come a member of the case company is below.
Figure 32: How likely would respondents become a member of the company (n=29)
This final question yielded majority of the respondents were not sure, whether
they would like to become a member of the company or not in the future. How-
ever, about 28% would very likely or somewhat likely consider membership in
23%
60%
13%
3%
Very important
Important
Somewhat important
Not very important
Not at all important
0,0% 10,0% 20,0% 30,0% 40,0% 50,0% 60,0% 70,0%
When choosing a partner from the other, how big is the role of the costs?
17,2% 10,3%
69,0%
0,0% 3,4%0,0%
20,0%
40,0%
60,0%
80,0%
Very likely Somewhat likely Cannot say Somewhatunlikely
Very unlikely
How likely it is, that You would become a member of Excellence Finland in the
future?
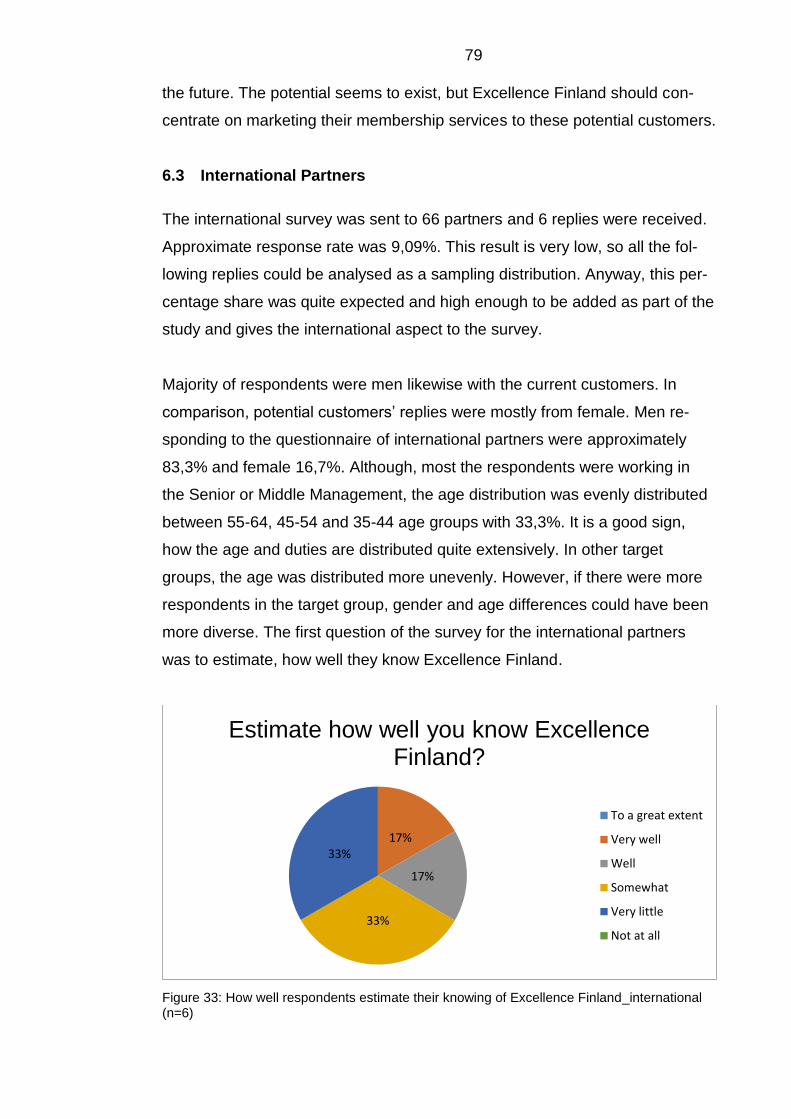
79
the future. The potential seems to exist, but Excellence Finland should con-
centrate on marketing their membership services to these potential customers.
6.3 International Partners
The international survey was sent to 66 partners and 6 replies were received.
Approximate response rate was 9,09%. This result is very low, so all the fol-
lowing replies could be analysed as a sampling distribution. Anyway, this per-
centage share was quite expected and high enough to be added as part of the
study and gives the international aspect to the survey.
Majority of respondents were men likewise with the current customers. In
comparison, potential customers’ replies were mostly from female. Men re-
sponding to the questionnaire of international partners were approximately
83,3% and female 16,7%. Although, most the respondents were working in
the Senior or Middle Management, the age distribution was evenly distributed
between 55-64, 45-54 and 35-44 age groups with 33,3%. It is a good sign,
how the age and duties are distributed quite extensively. In other target
groups, the age was distributed more unevenly. However, if there were more
respondents in the target group, gender and age differences could have been
more diverse. The first question of the survey for the international partners
was to estimate, how well they know Excellence Finland.
Figure 33: How well respondents estimate their knowing of Excellence Finland_international (n=6)
17%
17%
33%
33%
Estimate how well you know Excellence Finland?
To a great extent
Very well
Well
Somewhat
Very little
Not at all
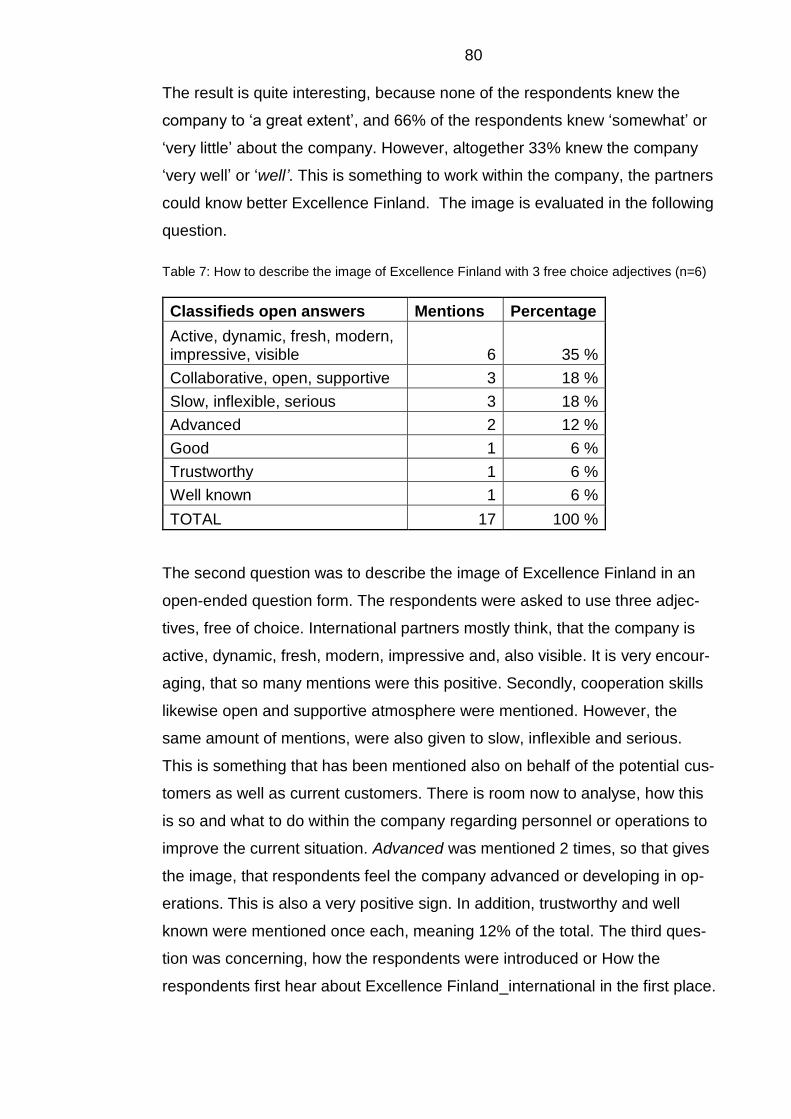
80
The result is quite interesting, because none of the respondents knew the
company to ‘a great extent’, and 66% of the respondents knew ‘somewhat’ or
‘very little’ about the company. However, altogether 33% knew the company
‘very well’ or ‘well’. This is something to work within the company, the partners
could know better Excellence Finland. The image is evaluated in the following
question.
Table 7: How to describe the image of Excellence Finland with 3 free choice adjectives (n=6)
Classifieds open answers Mentions Percentage
Active, dynamic, fresh, modern, impressive, visible 6 35 %
Collaborative, open, supportive 3 18 %
Slow, inflexible, serious 3 18 %
Advanced 2 12 %
Good 1 6 %
Trustworthy 1 6 %
Well known 1 6 %
TOTAL 17 100 %
The second question was to describe the image of Excellence Finland in an
open-ended question form. The respondents were asked to use three adjec-
tives, free of choice. International partners mostly think, that the company is
active, dynamic, fresh, modern, impressive and, also visible. It is very encour-
aging, that so many mentions were this positive. Secondly, cooperation skills
likewise open and supportive atmosphere were mentioned. However, the
same amount of mentions, were also given to slow, inflexible and serious.
This is something that has been mentioned also on behalf of the potential cus-
tomers as well as current customers. There is room now to analyse, how this
is so and what to do within the company regarding personnel or operations to
improve the current situation. Advanced was mentioned 2 times, so that gives
the image, that respondents feel the company advanced or developing in op-
erations. This is also a very positive sign. In addition, trustworthy and well
known were mentioned once each, meaning 12% of the total. The third ques-
tion was concerning, how the respondents were introduced or How the
respondents first hear about Excellence Finland_international in the first place.
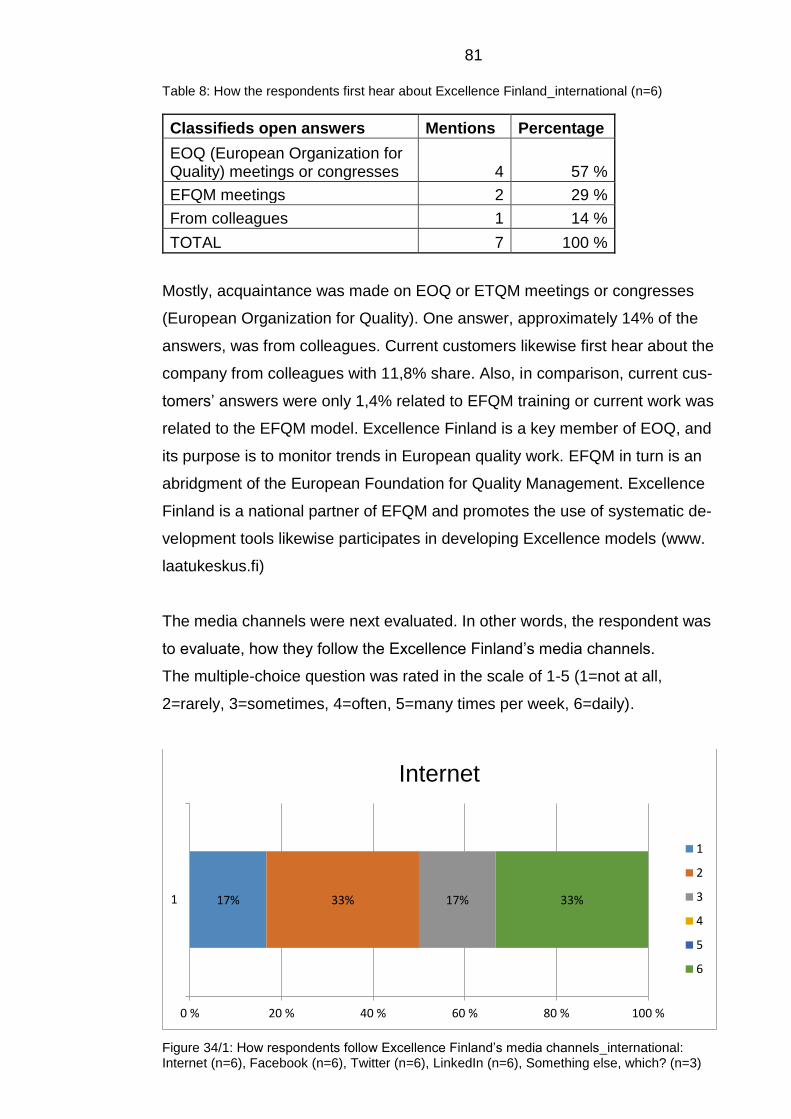
81
Table 8: How the respondents first hear about Excellence Finland_international (n=6)
Classifieds open answers Mentions Percentage
EOQ (European Organization for Quality) meetings or congresses 4 57 %
EFQM meetings 2 29 %
From colleagues 1 14 %
TOTAL 7 100 %
Mostly, acquaintance was made on EOQ or ETQM meetings or congresses
(European Organization for Quality). One answer, approximately 14% of the
answers, was from colleagues. Current customers likewise first hear about the
company from colleagues with 11,8% share. Also, in comparison, current cus-
tomers’ answers were only 1,4% related to EFQM training or current work was
related to the EFQM model. Excellence Finland is a key member of EOQ, and
its purpose is to monitor trends in European quality work. EFQM in turn is an
abridgment of the European Foundation for Quality Management. Excellence
Finland is a national partner of EFQM and promotes the use of systematic de-
velopment tools likewise participates in developing Excellence models (www.
laatukeskus.fi)
The media channels were next evaluated. In other words, the respondent was
to evaluate, how they follow the Excellence Finland’s media channels.
The multiple-choice question was rated in the scale of 1-5 (1=not at all,
2=rarely, 3=sometimes, 4=often, 5=many times per week, 6=daily).
Figure 34/1: How respondents follow Excellence Finland’s media channels_international: Internet (n=6), Facebook (n=6), Twitter (n=6), LinkedIn (n=6), Something else, which? (n=3)
17% 33% 17% 33%1
0 % 20 % 40 % 60 % 80 % 100 %
Internet
1
2
3
4
5
6
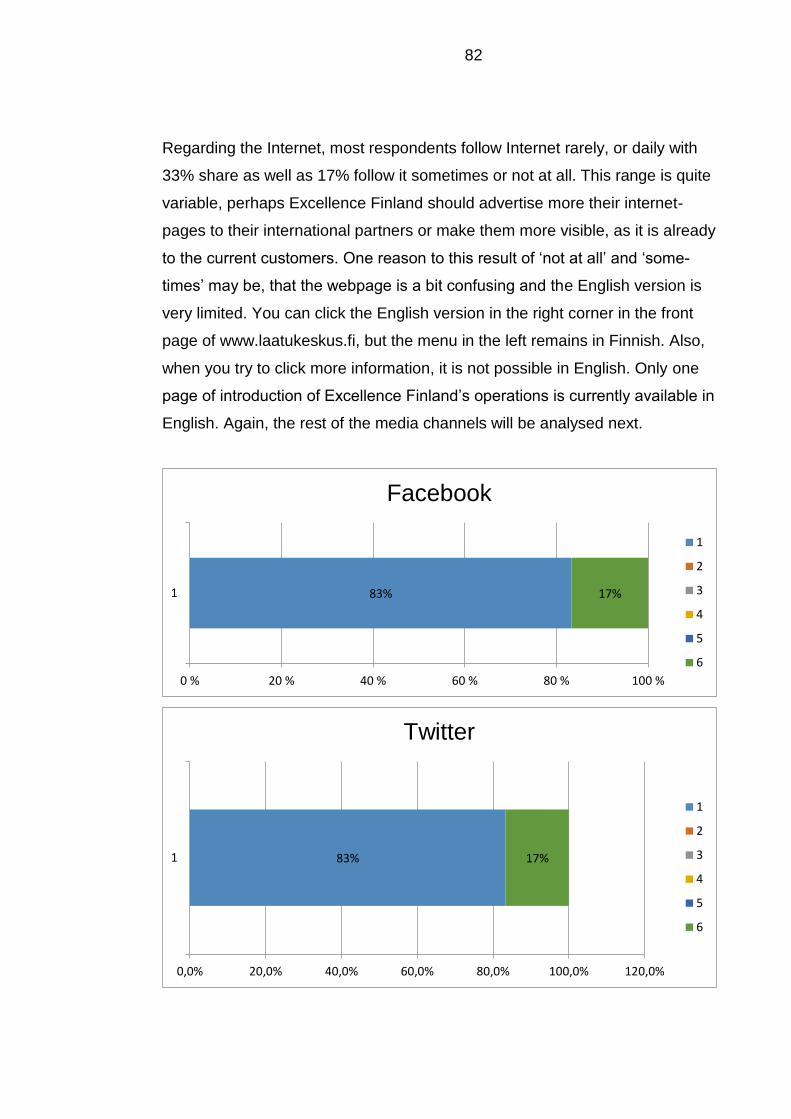
82
Regarding the Internet, most respondents follow Internet rarely, or daily with
33% share as well as 17% follow it sometimes or not at all. This range is quite
variable, perhaps Excellence Finland should advertise more their internet-
pages to their international partners or make them more visible, as it is already
to the current customers. One reason to this result of ‘not at all’ and ‘some-
times’ may be, that the webpage is a bit confusing and the English version is
very limited. You can click the English version in the right corner in the front
page of www.laatukeskus.fi, but the menu in the left remains in Finnish. Also,
when you try to click more information, it is not possible in English. Only one
page of introduction of Excellence Finland’s operations is currently available in
English. Again, the rest of the media channels will be analysed next.
83% 17%1
0 % 20 % 40 % 60 % 80 % 100 %
1
2
3
4
5
6
83% 17%1
0,0% 20,0% 40,0% 60,0% 80,0% 100,0% 120,0%
1
2
3
4
5
6
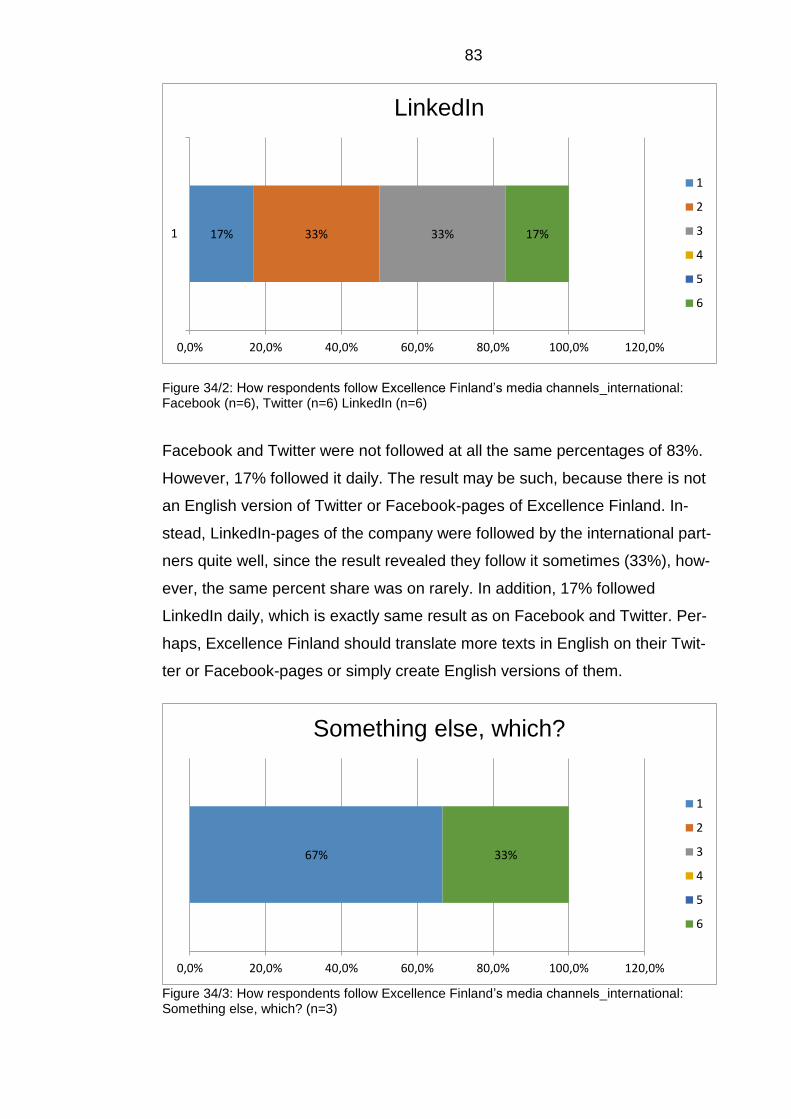
83
Figure 34/2: How respondents follow Excellence Finland’s media channels_international: Facebook (n=6), Twitter (n=6) LinkedIn (n=6)
Facebook and Twitter were not followed at all the same percentages of 83%.
However, 17% followed it daily. The result may be such, because there is not
an English version of Twitter or Facebook-pages of Excellence Finland. In-
stead, LinkedIn-pages of the company were followed by the international part-
ners quite well, since the result revealed they follow it sometimes (33%), how-
ever, the same percent share was on rarely. In addition, 17% followed
LinkedIn daily, which is exactly same result as on Facebook and Twitter. Per-
haps, Excellence Finland should translate more texts in English on their Twit-
ter or Facebook-pages or simply create English versions of them.
Figure 34/3: How respondents follow Excellence Finland’s media channels_international: Something else, which? (n=3)
17% 33% 33% 17%1
0,0% 20,0% 40,0% 60,0% 80,0% 100,0% 120,0%
1
2
3
4
5
6
67% 33%
0,0% 20,0% 40,0% 60,0% 80,0% 100,0% 120,0%
Something else, which?
1
2
3
4
5
6
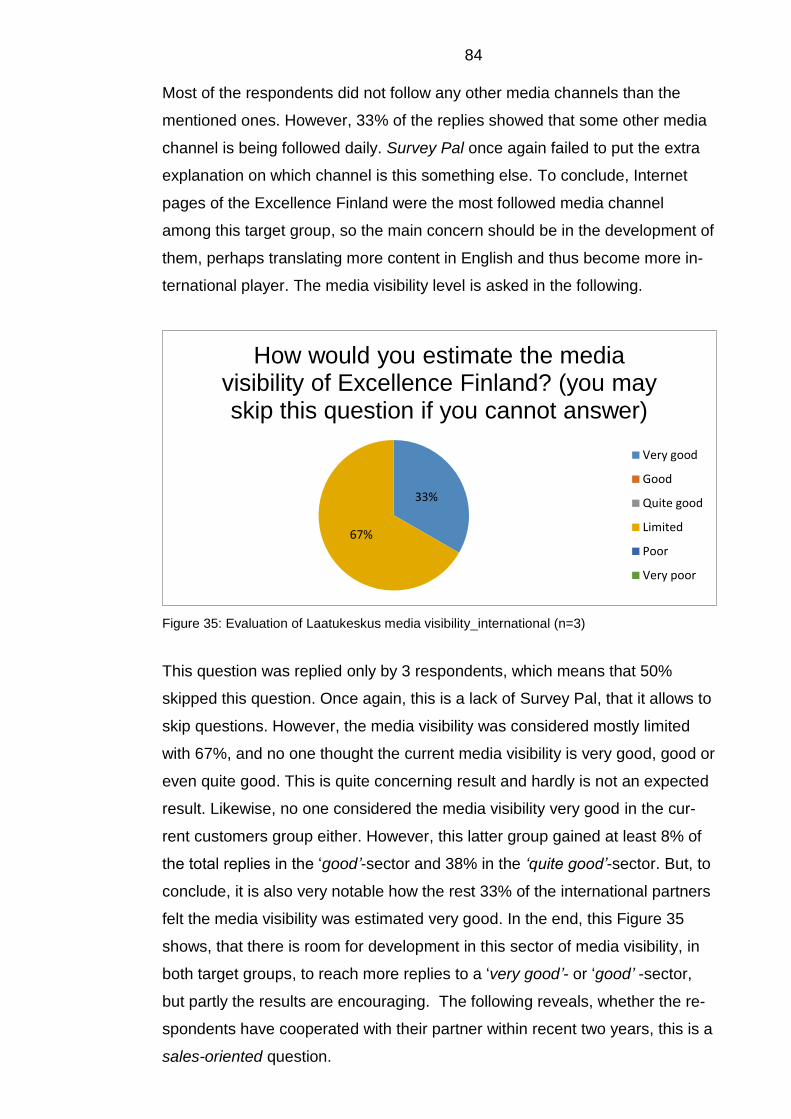
84
Most of the respondents did not follow any other media channels than the
mentioned ones. However, 33% of the replies showed that some other media
channel is being followed daily. Survey Pal once again failed to put the extra
explanation on which channel is this something else. To conclude, Internet
pages of the Excellence Finland were the most followed media channel
among this target group, so the main concern should be in the development of
them, perhaps translating more content in English and thus become more in-
ternational player. The media visibility level is asked in the following.
Figure 35: Evaluation of Laatukeskus media visibility_international (n=3)
This question was replied only by 3 respondents, which means that 50%
skipped this question. Once again, this is a lack of Survey Pal, that it allows to
skip questions. However, the media visibility was considered mostly limited
with 67%, and no one thought the current media visibility is very good, good or
even quite good. This is quite concerning result and hardly is not an expected
result. Likewise, no one considered the media visibility very good in the cur-
rent customers group either. However, this latter group gained at least 8% of
the total replies in the ‘good’-sector and 38% in the ‘quite good’-sector. But, to
conclude, it is also very notable how the rest 33% of the international partners
felt the media visibility was estimated very good. In the end, this Figure 35
shows, that there is room for development in this sector of media visibility, in
both target groups, to reach more replies to a ‘very good’- or ‘good’ -sector,
but partly the results are encouraging. The following reveals, whether the re-
spondents have cooperated with their partner within recent two years, this is a
sales-oriented question.
33%
67%
How would you estimate the media visibility of Excellence Finland? (you may skip this question if you cannot answer)
Very good
Good
Quite good
Limited
Poor
Very poor
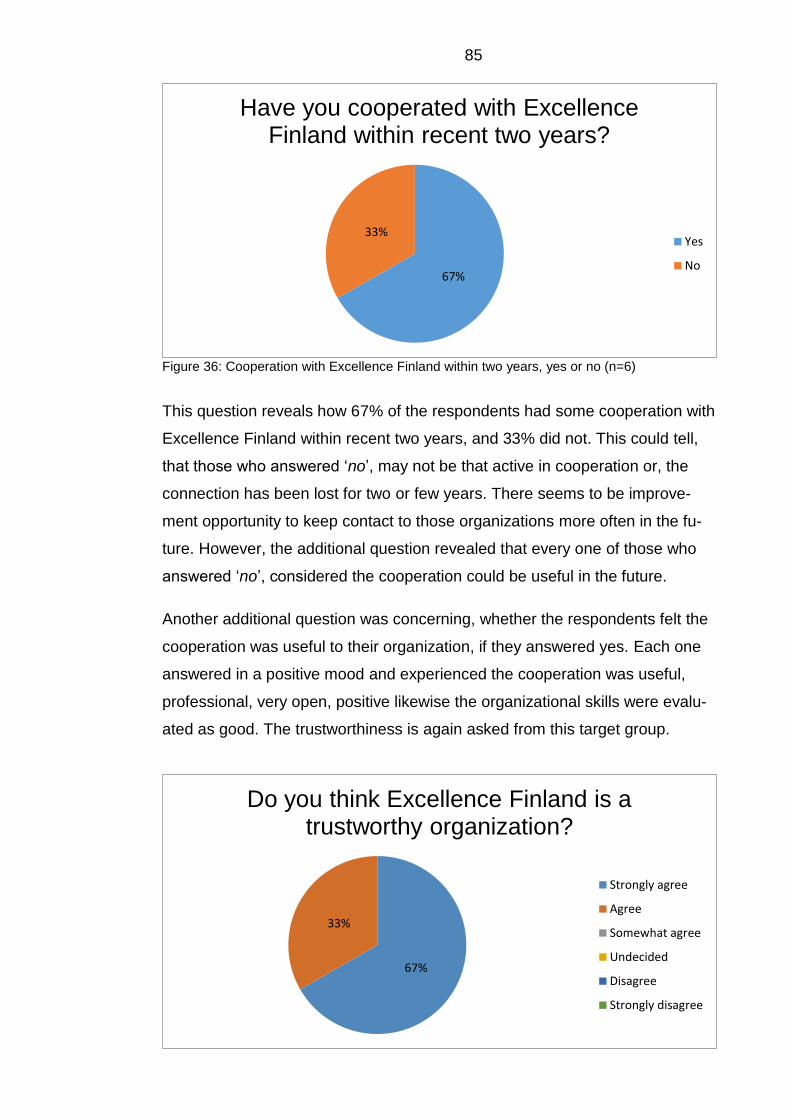
85
Figure 36: Cooperation with Excellence Finland within two years, yes or no (n=6)
This question reveals how 67% of the respondents had some cooperation with
Excellence Finland within recent two years, and 33% did not. This could tell,
that those who answered ‘no’, may not be that active in cooperation or, the
connection has been lost for two or few years. There seems to be improve-
ment opportunity to keep contact to those organizations more often in the fu-
ture. However, the additional question revealed that every one of those who
answered ‘no’, considered the cooperation could be useful in the future.
Another additional question was concerning, whether the respondents felt the
cooperation was useful to their organization, if they answered yes. Each one
answered in a positive mood and experienced the cooperation was useful,
professional, very open, positive likewise the organizational skills were evalu-
ated as good. The trustworthiness is again asked from this target group.
67%
33%
Have you cooperated with Excellence Finland within recent two years?
Yes
No
67%
33%
Do you think Excellence Finland is a trustworthy organization?
Strongly agree
Agree
Somewhat agree
Undecided
Disagree
Strongly disagree
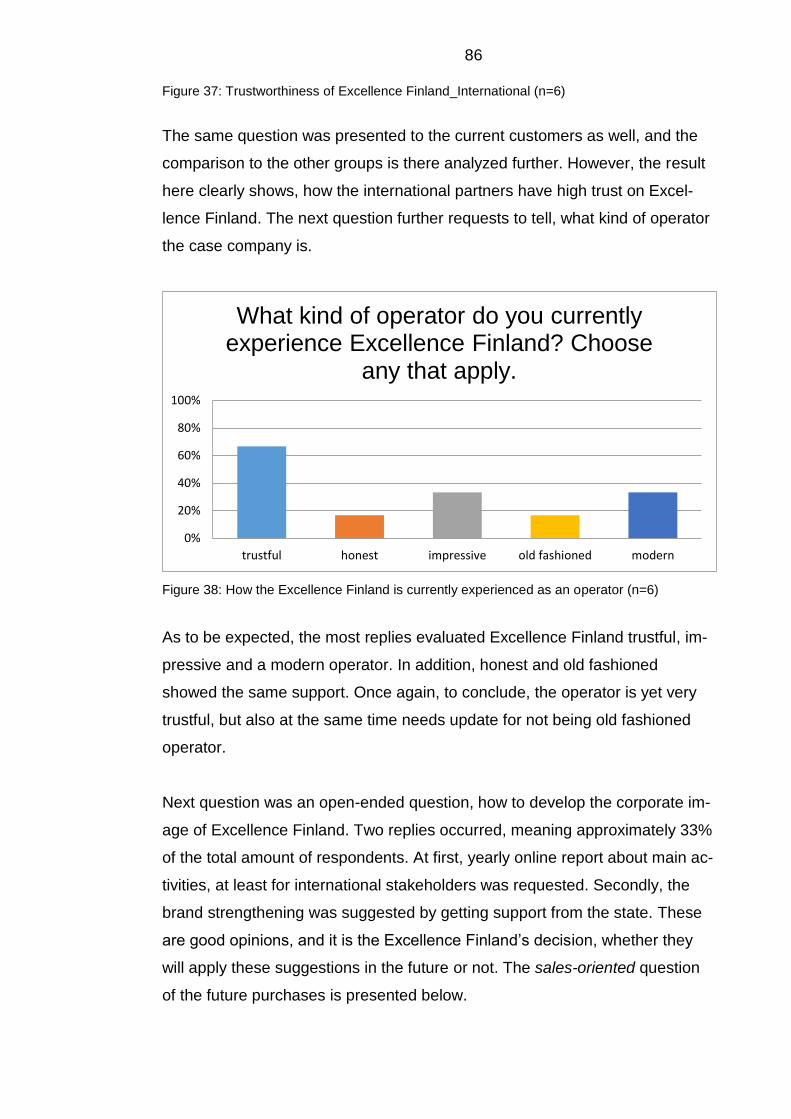
86
Figure 37: Trustworthiness of Excellence Finland_International (n=6)
The same question was presented to the current customers as well, and the
comparison to the other groups is there analyzed further. However, the result
here clearly shows, how the international partners have high trust on Excel-
lence Finland. The next question further requests to tell, what kind of operator
the case company is.
Figure 38: How the Excellence Finland is currently experienced as an operator (n=6)
As to be expected, the most replies evaluated Excellence Finland trustful, im-
pressive and a modern operator. In addition, honest and old fashioned
showed the same support. Once again, to conclude, the operator is yet very
trustful, but also at the same time needs update for not being old fashioned
operator.
Next question was an open-ended question, how to develop the corporate im-
age of Excellence Finland. Two replies occurred, meaning approximately 33%
of the total amount of respondents. At first, yearly online report about main ac-
tivities, at least for international stakeholders was requested. Secondly, the
brand strengthening was suggested by getting support from the state. These
are good opinions, and it is the Excellence Finland’s decision, whether they
will apply these suggestions in the future or not. The sales-oriented question
of the future purchases is presented below.
trustful honest impressive old fashioned modern
0%
20%
40%
60%
80%
100%
What kind of operator do you currently experience Excellence Finland? Choose
any that apply.
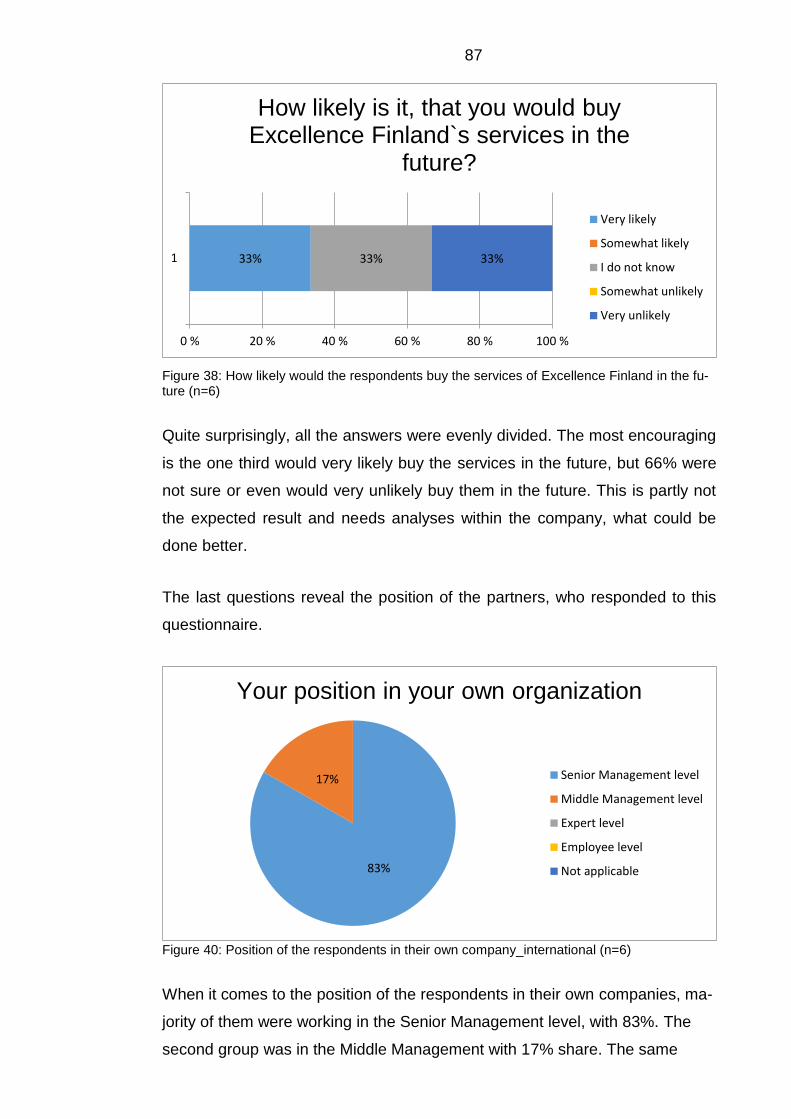
87
Figure 38: How likely would the respondents buy the services of Excellence Finland in the fu-ture (n=6)
Quite surprisingly, all the answers were evenly divided. The most encouraging
is the one third would very likely buy the services in the future, but 66% were
not sure or even would very unlikely buy them in the future. This is partly not
the expected result and needs analyses within the company, what could be
done better.
The last questions reveal the position of the partners, who responded to this
questionnaire.
Figure 40: Position of the respondents in their own company_international (n=6)
When it comes to the position of the respondents in their own companies, ma-
jority of them were working in the Senior Management level, with 83%. The
second group was in the Middle Management with 17% share. The same
33% 33% 33%1
0 % 20 % 40 % 60 % 80 % 100 %
How likely is it, that you would buy Excellence Finland`s services in the
future?
Very likely
Somewhat likely
I do not know
Somewhat unlikely
Very unlikely
83%
17%
Your position in your own organization
Senior Management level
Middle Management level
Expert level
Employee level
Not applicable
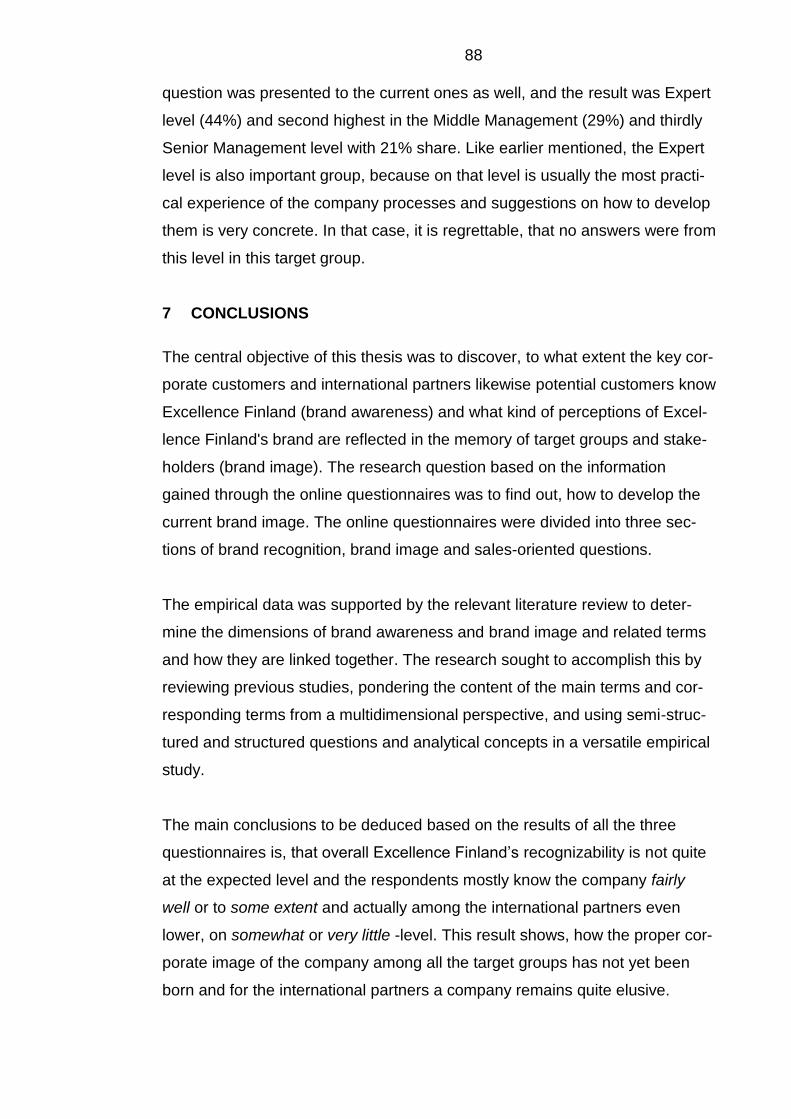
88
question was presented to the current ones as well, and the result was Expert
level (44%) and second highest in the Middle Management (29%) and thirdly
Senior Management level with 21% share. Like earlier mentioned, the Expert
level is also important group, because on that level is usually the most practi-
cal experience of the company processes and suggestions on how to develop
them is very concrete. In that case, it is regrettable, that no answers were from
this level in this target group.
7 CONCLUSIONS
The central objective of this thesis was to discover, to what extent the key cor-
porate customers and international partners likewise potential customers know
Excellence Finland (brand awareness) and what kind of perceptions of Excel-
lence Finland's brand are reflected in the memory of target groups and stake-
holders (brand image). The research question based on the information
gained through the online questionnaires was to find out, how to develop the
current brand image. The online questionnaires were divided into three sec-
tions of brand recognition, brand image and sales-oriented questions.
The empirical data was supported by the relevant literature review to deter-
mine the dimensions of brand awareness and brand image and related terms
and how they are linked together. The research sought to accomplish this by
reviewing previous studies, pondering the content of the main terms and cor-
responding terms from a multidimensional perspective, and using semi-struc-
tured and structured questions and analytical concepts in a versatile empirical
study.
The main conclusions to be deduced based on the results of all the three
questionnaires is, that overall Excellence Finland’s recognizability is not quite
at the expected level and the respondents mostly know the company fairly
well or to some extent and actually among the international partners even
lower, on somewhat or very little -level. This result shows, how the proper cor-
porate image of the company among all the target groups has not yet been
born and for the international partners a company remains quite elusive.
89
In turn, the closer look and examination of the results nevertheless revealed
the current brand image was very positive or good likewise very few individu-
als made negative evaluations or comments. However, some negative com-
ments existed and revealed developmental challenges to develop the brand
image into more visible, modern, faster, colorful, interesting as well as less
theoretical and conservative direction. Also, the company was more seen as
domestic player rather than international.
This demonstrates the communication efforts of Excellence Finland are good
in quality and those who saw the brand image in a negative light still believe
the brand image is developable. However, if the company wants to be seen
more as an international player, the suggestion of the author is to start pro-
moting this more and develop the international web-pages or other communi-
cation or networking channels to be more international. One thing is to con-
sider the name “Laatukeskus” changed to something else, which may be more
describing the company values of excellence, cooperation, integrity and wel-
fare. Especially cooperation in network building is noteworthy to develop and
to keep more contact with current customers likewise international partners.
These suggestions are supported by the earlier literature, for example
Meenahgan (1995) states, how advertising is at the center of brand image de-
velopment, because it can inform the functional capabilities of the brand itself.
Also at the same time, it motivates the brand with symbolic values or mean-
ings, which should be relevant to the customers. These two functions of ad-
vertising closely parallel the informational and transformational schools of ad-
vertising effects and theories on the central and peripheral routes to consumer
persuasion.
In those target groups that know the company fairly well, the brand image is
quite positive, and the developmental recommendations are mainly based on
visibility, how to increase it and not that much on communication, how to rede-
sign that. Although, few of the respondents did suggest additional power or in-
vestment in communication and marketing.
The recognizability of the company did not reveal any major problems and Ex-
cellence Finland is mostly experienced trustworthy and professional in its own
90
field. However, the developmental suggestions could potentially benefit the
case company remarkably in the objective of developing recognizability of the
corporate brand and brand image. Also, there exist great potentials in the new
customer or member field to build cooperation, especially courses and training
approved to be the most important channels. Also, most of these potential
customers were already developing their own organization’s processes, which
opens wonderful opportunity to offer Excellence Finland’s services to them in
the future.
7.1 Managerial implications
Further to more detailed suggestions, based on the findings of the question-
naires, the following is targeted to the case company and its management.
1. Better media visibility and use of Internet and other social media chan-
nels
Since it was established that media visibility was mainly limited and how Inter-
net was the most followed media channel, major efforts should be utilizing it to
improve recognizability and brand awareness. For example, the English ver-
sion of the current webpage is currently very limited and could be developed
to offer more information of the company in English. The Internet-pages could
also include mantras or stories, how the story of Laatukeskus, Excellence Fin-
land started, more history and person-related storytelling.
In addition, the front page of the homepage is very confusing, and there is too
much information. Perhaps, to simplify it is to make pictures bigger and less
articles and links etc. Also, colors could be just a few, not that many as now,
but brighter colors. Again, to develop it further, there could be more informa-
tive videos. For example, the “Rent a Quality Manager” here:
http://www.laatukeskus.fi/suomen-laatuyhdistys/vuokraa-laatupaallikko is quite
boring. More effective could be a video or videos presenting the persons or
videos about the personnel or the premises could be modern and informative,
than just text and pictures. Personal videos, for example interview of a cus-
tomer or an employee could be functional and beneficial to develop brand
91
identity, and the author would recommend videos also including texts. Alt-
hough it was very positive, how many Youtube.com-videos were found made
by Excellence Finland, there are not that much visitors, likes or followers on
the Laatukeskus Facebook-pages. One development hint is to add commer-
cials on the Facebook-pages of the current customers or partners, that would
lead to Laatukeskus site by clicking. Other suggestion is to add messenger
box, which appears each time, someone visits the site, like “Laatukeskus is
now active, please start a conversation”.
The potential through social media platforms is considerable and should be
taken seriously, since it potentially reaches very many people. However, com-
pany’s Twitter-account is nowadays more active as well as Linkedin.com -
posts have been increasing during the last year.
2. Build a brand identity with stories, for example, an expert blog
People love stories, it would be interesting to know, how the Excellence Fin-
land was started and some history about the company. Illustrative pictures
and important milestones could help to see the development of the company
to its current mode. The story could include the values, why Excellence Fin-
land is better than its competitors and which makes it special, and competitive
in the market-sector. For example, company blog is an informative way to give
‘personal touch’ to the stakeholders or potential customers. In turn, it is a posi-
tive sign, how Laatukeskus, Excellence Finland has already stated a monthly
blog for the senior position experts here: http://laatuseniorit.blogspot.com/ This
“Quality senior” (“Laatuseniorit”) -division promotes cooperation, professional-
ism and exchange of experience between members. (Laatukeskus.fi.) How-
ever, this development could be taken further to write other blogs as well. If
we consider potential customers, they need basic information about the ser-
vices company can offer and which benefits they could get compared to the
competitors.
People could also enjoy reading the inside stories, like what kind of work per-
sonnel do there and what is the role of each one for example in this brand re-
92
newal-project. The goal could be two articles per week. These blogs could re-
place the advertisement now on the main webpage, which is in its current
mode a bit confusing and provides too much information with too little fonts.
3. Cooperation and increasing collaboration with university students or or-ganizations
The collaboration for example with the KARVI (national education assessment
center) is one option, like earlier suggested. However, another option would
be to offer Excellence Finland recruitment services, such as Laatukeskus, Ex-
cellence Finland as an employer. Such opportunity does not currently exist,
and this could be a link in the front Internet page. For example, Trainee pro-
grams offer university students opportunity to gain excellent work experience
in quality matters or presentation skills or marketing future management tools
to companies. However, it is great to discover, how in 2016 Laurea University
cooperation with Excellence Finland was started with Lean Management train-
ing. But, to develop further recruitment services, the case company could offer
practical training period or thesis projects to university students who need or
included in their studies.
4. More meaningful dialogue with the customers and more versatile and tailored events
Based on the results of the survey, the quality of the events, courses and
speakers varied occasionally. The meaningful and in advance thought dia-
logue with the customers could help to build more effective events, which
should be tailored more carefully in the future. The customer needs and guid-
ance should also be more concrete and precise, and the topics of the events
should be fulfilled better. The events must be less marketing-oriented and the
contacts on behalf of the case company should be more proactive towards
their stakeholders and done more frequently. This applies also towards the in-
ternational partners. The conversations could be linked to the earlier meetings
or events the customers participated in, and further ask, how they have man-
aged to develop their operations with the tools given by Excellence Finland. In
93
addition, they might need help with some other things like employee satisfac-
tion. The contact could be made by phone or email. Perhaps this could also
mean additional power on marketing and communications and better adver-
tisement on events.
7.2 The theoretical part of the study
The theoretical part began with discussion on brand as a phenomenon based
on previous studies. Based on the literature, brand was claimed to enter a
phase of inexorable decline, and the roles of brands are more complex, perva-
sive as well as multifaceted, which take into consideration social criticism and
public opinion. However, to face competitors, being ethical was the new ax-
iom were individual values are important to achieve economic aims and
unique brands should pursue new aims linked to these values. Therefore, Ex-
cellence Finland could rethink the very nature of their brand, the emotional,
mental and spiritual vision, which are more important than the material image
and its being.
Next, the different approach to multidimensional brand awareness were dis-
cussed and the selected dimensions were presented which were used in this
study. These were brand recognition and BAV (Brand Asset Valuator).
Brand awareness is also a basic dimension of brand equity, meaning that a
brand has no equity unless the consumer is at least aware of the brand.
Therefore, the model of Keller’s Brand Equity Model was presented as well as
a Customer-based Brand Equity Framework Model and Y&R Brand Asset Val-
uator -model related to the other term of brand recognition.
In the second part of the literature view the concept of brand image was intro-
duced, which was the main chapter of this research. However, brand aware-
ness is linked to the brand image and a sufficient level of brand awareness
must be first created, before marketers can put more emphasis on crafting a
brand image.
One interesting point the case company could utilize is, that if the metaphor of
the brand is used as personality. For example, a manifest through a celebrity
in brand advertisements may help customers to find the company easier.
94
Then, it would be to appreciate the emotional values of the brand. Again, the
brand experience is highly involved in the brand image and four different ex-
periences dimensions were presented.
In the third part of the study the case company was presented, and it was dis-
covered that currently it has over 500 Finnish members namely private- and
public-sector organization and thousands of business developers and opinion
leaders are actively participating in the activities of the corporation. Also, the
company structure was presented in this chapter.
7.3 Conclusions, current customers
The conclusion of the brand awareness is, that the current customers know
the company fairly well or to some extent (over 60% in total). Additionally, very
few know the company very well or almost the same amount, poorly. This is
presumably not the expected result. However, the company services are in
comparison quite well known, such as seminars, Laatulehti-magazine etc.
The brand image of Excellence Finland is mostly experienced reliable, busi-
nesslike, well-established, permanent, professional and expert in its own field.
Also, quality-orientation and quality-awareness are well recognized, and the
case company is considered a high-quality company. However, the brand im-
age is also hoped to be more visible, international, modern and fresh. Some
(about 5%) also experience the brand image is boring, unsurprising, lame,
passive and colorless etc. likewise the company name (in Finnish)
Laatukeskus is old-fashioned.
The brand image is mostly considered good (with 49%), but only 7,4 % re-
spondents gave the excellent evaluation. This result reveals, that the brand
image is not currently that clear among the current customers. In turn, almost
the same amount, of over 40% think the current brand image is weak, satis-
factory or neutral. This is considerable and should be developed further, how
to increase the brand awareness and the knowledge towards a clear and un-
derstandable brand image. However, the company itself is mostly experi-
95
enced, with 78% percentage share, a trustworthy organization. But it is nota-
ble that those who rated somewhat agree, undecided or disagree, shows the
percentage share of 22%, which is rather high.
The most followed media channel among the current customers is Laatulehti-
magazine, which is followed even on the daily basis. However, the media visi-
bility is experienced limited, since about 44% of the respondents think that
way. In comparison, among international partners the percentage share of
like-minded is even greater, 67%. This means, the future brand strategy
should include development of media visibility and company visibility in gen-
eral. Very good advices were given, for example increasing media visibility
with television and writing articles in traditional magazines or newspapers. All
services of the company are in use ‘fairly evenly’, but mostly Laatulehti-maga-
zine, seminars and courses and coaching.
Event implementation and its usefulness is currently at excellent level, which
is great. The most mentions concerned the professional lecturers, expert
coaches and the events offered innovative ideas and -perspectives, as well as
insights into ones’ own work. Moreover, the events were in addition mostly ex-
perienced inspirational, energetic, topical, well organized and reliable. Further-
more, praise was given to comprehensive presentations from various indus-
tries. However, feedback was also given about too marketing-oriented events.
Excellence Finland should ask from time to time, how their members are doing
and refer to the latest meeting or a subject discussed. Also, the attendees
may need more concrete point on the topic, not just marketing of which course
can develop more that expertise.
In addition, 3% or under feel that some events need more attendees or exhibi-
tors were dull (for example “The annual Quality Day 2015”), occasionally per-
formers have been too technical and some think, there was not enough time
to ensure that all the participating students learn. Some also experience that
the content should be more versatile on events or member services may re-
ceive too little information, even in member divisions. Additionally, some think
that the content depends greatly on the lecturers and some events have been
slightly different from the advertised.
96
Again, prices are experienced competitive with other suppliers, but often high
compared to the benefits. The price reduction should thus be considered con-
cerning the seminars, coaching and events. Perhaps some events should be
arranged elsewhere than just in Helsinki area, for example, in the Eastern Fin-
land.
The research question of “How to develop brand image” must have been the
most interesting and important question of all. Like already mentioned, this
study revealed, that among this target group Excellence Finland is not visible
enough on national or traditional medias, for example the content of Laatu-
lehti-magazine was hoped to be stronger, meaningful and more involved. It
was in addition claimed, that big audiences do not even know the company
exists. The development ideas considering visibility included examples of writ-
ing articles in traditional magazines and newspapers.
The people and speakers were seen “grey” to some, which could mean boring
or colorless personalities or styles of speeches. Quite many also wished that
younger people would be involved in the activities of the company. Some felt,
that too little information about the trainings were given. The course and train-
ing prices were suggested to “come in modern times” and some felt the prices
are now “in the clouds”. Some felt, that there is “too much fuss” in small circles
and separate, when Excellence Finland could combine and use the country's
best resources for the benefit of those in need.
The increasing brand awareness was additionally experienced important, with
3,6% share. For example, presentation round at the decision-making mem-
bers or a visible role through the ‘Quality days’ (Laatupäivät) also means the
national media to some. One suggested purchased STT news coverage for
Quality award (Laatupalkinto) -recipients. Also, development ideas were pre-
sented on organizing events also in provinces, not just in Helsinki.
When it comes to international brand image, also 3,6% of the respondents
thought it was unclear or missing and the obsolescent image was hoped to di-
vert into younger, modern, exiting, dynamic, innovative and extensive direc-
tion. Moreover, the graphic design was one additional thing to develop as well,
97
possibly more colors – updating to this day. The brand image was recom-
mended to regenerate into agile and less formal external direction. Some well-
noted, that "Quality" is a challenging term, because it is associated with virtu-
ally everything within a company or organization. Some thought the name
‘Quality Center /Laatukeskus’ is not responsible for the content of the current
activity. One suggestion for a new name was presented as Productivity Cen-
ter. Another option for a small seminar name was ‘Q-Prof’. In addition, many
thought that the focus and mission is still unclear, and more stories were
hoped, because the concept of quality was experienced awkward to some.
Perhaps the Brand Storybook could help with this.
The courses tailored to customer needs was as well wished. One suggested,
how he/she would change the courses to be interesting by increasing the
speed, customer focus, and resolution. Also, one would emphasize tailor-
made (multidimensional) courses and top expertise in the field of customer
needs. In addition, Excellence Finland could promise the quality guarantee
and the price would depend on the results and customer satisfaction. Also, it
was noted how the development should focus on the opening of quality-jargon
and the ‘quality-believers’ should come to the real world. The development of
the brand image should in addition be linked to doing something that genu-
inely helps companies and organizations.
Further, Excellence Finland was felt it lacks the courage to question its own
work. Some mentioned, that they are not looking for the latest information
from the company. Suggestions were to renew the brand image in such a way
that the Excellence Finland would be considered as a primary source when
looking for modern management methods and for future-oriented manage-
ment methods and leading to the improvement of productivity through high-
quality, cost-effective tools.
To conclude, stylishness was experienced good and to be maintained, as well
as reliability and expertise. However, the Excellence was advised to focus
more on the right quality, meaning a broad concept of quality, not seeking
market excellence, but beneficial promotion of the right quality. The angle
should be more of a quality expert organization whose expertise sells itself.
98
The Excellence Finland must come to people and not as they now assume
that people come to them.
In total 60,5% would very likely or somewhat likely buy the services in the fu-
ture, although quite a few did not know, what to answer. Also, most respond-
ents would recommend the services of the company in the future, in total very
likely or somewhat likely opinions were approximately 71,2%, which is a great
result. However, again quite high percentage did not know what to answer.
This result may reveal, that the company should provide more information of
the services, consider price reduction and add customer meetings.
7.4 Conclusions, potential customers
Potential customers considered Excellence Finland as professional and skilled
likewise high-quality service provider and they were aware, it is a non-profit
association. The company was also experienced effective, inspiring, active
and rich of ideas. These are very positive signals, and shows the brand
awareness is quite good in general. However, Excellence Finland should con-
sider, how to increase the visibility and renew the image to become more
modern and less plain for the potential customers. The most common channel
to first hear about the company was through the colleagues. The result also
revealed that colleagues first attracted the interest or recommended the ser-
vices to search information about the company, for example, through Internet.
The Excellence Finland was mostly known among this target group fairly well
or well. In comparison, current customers knew the company well with a very
close percentage share of 25%.
The brand image was mostly evaluated good, and only approximately 7%
evaluated it excellent. However, this was a very positive signal and could tell
there is potential to get these customers to co-operate with the company in the
future. Again, some (over 20%) thought the current image is lame or does not
wake up interest. The results reveal, the current image could be a bit elderly
and needs some upgrading to modern times to meet potential customers’ ex-
pectations.
99
One of the important aspects of this questionnaire related to the potential cus-
tomers was to discover, which tools are currently utilized and how, among po-
tential customers. Most of the potential ones were already using EFQM- or
CAF self-assessment tools and most of the respondents were developing their
own organization’s processes. Quite many respondents expressed, how con-
tinuous improvement or activating the employee's own development thinking
and ideas was the most important thing. Also, a sensible development was ex-
perienced important, as well as focus on core processes. Another point of
view was to develop processes and update them with the process experts,
that is with the staff, driven by the project owner. To conclude, in some cases,
only updating guidelines yearly or seldom was the only way organization de-
veloped their processes. However, some organizations were already using
Lean-management or adjusting Lean-principles, but some felt they needed im-
provement in development of process indicators. This certainly open the pos-
sibility for Excellence Finland to sell their services to such organizations to de-
velop their quality and processes. (See more on Survey results).
The most popular services of the case company revealed to be courses and
coaching. Seminars and process development were the next ones, that poten-
tially interest this target group the most. LEAN and the development of operat-
ing system were both also very close with over 40% share of the replies.
When asked about the personal advice, when choosing a partner, most expe-
rienced it important. Very important or somewhat important replies were equal
and only a few did not see it very important. This question was only addressed
to this target group, to find out the importance of personal advice. The results
show, that it is important to focus on each customer or potential customer with
the help of personal advice and tailor the services to each one and cost-effec-
tive services and courses.
This final question yielded majority of the respondents were not sure, whether
they would like to become a member of the company or not in the future. How-
ever, about 28% would very likely or somewhat likely consider membership in
the future. The potential seems to exist, but Excellence Finland should con-
centrate on marketing their membership services to these potential customers.
100
7.5 Conclusions, international partners
The brand awareness was rather low, considering that partners should know
who they co-operate with. Mostly the Excellence Finland was known some-
what or very little (66%). In addition, the results show, how none of the re-
spondents knew the company extremely well. This is quite surprising. How-
ever, altogether 33% knew the company very well or well. To conclude, this is
something to work within the company, the partners could know better Excel-
lence Finland.
International partners mostly think, that the company is active, dynamic, fresh,
modern, impressive and, also visible. It is very encouraging, that so many
mentions were this positive. Secondly, cooperation skills likewise open and
supportive atmosphere were mentioned. However, the same amount of men-
tions, were also given to slow, inflexible and serious. This is something that
has been mentioned also on behalf of the potential customers as well as cur-
rent customers. There is room now to analyse, how this is so and what to do
within the company regarding personnel or operations to improve the current
situation.
The acquaintance of the current partners was commonly made on EOQ or
ETQM meetings or congresses (European Organization for Quality). One an-
swer, approximately 14% of the answers, was from colleagues. Also, quite
close result was through colleagues. Internet pages of the Excellence Finland
were the most followed media channel among this target group, so the main
concern should be in the development of these sites, perhaps translating more
content in English and thus becoming more international player.
The media visibility was considered mostly limited with 67%, and no one
thought the current media visibility is very good, good or even quite good. This
is quite a concerning result and hardly is not an expected result. Although,
33% thought the media visibility was estimated very good. There seems to be
improvement opportunity to keep contact to the international partners more of-
ten in the future, because the results reveal how some had lost connection
within last two years. However, the last contact was experienced positive and
101
experienced the cooperation was useful, professional, very open, positive like-
wise the organizational skills were evaluated as good. Furthermore, the result
clearly shows, how the international partners have high trust on Excellence
Finland.
As to be expected, the most replies evaluated Excellence Finland a trustful,
impressive and modern operator. However, honest and old fashioned showed
the same amount of mentions. It means, the brand image needs updating for
not being an old-fashioned operator. The improvement hints for the future
where, to make a yearly online report about main activities. Secondly, the
brand strengthening was suggested by getting support from the state. The
most encouraging is the one third would very likely buy the services in the fu-
ture, but 66% were not sure or even would very unlikely buy them in the fu-
ture. This is partly not the expected result and needs analyses within the com-
pany, what could be done better.
7.6 Further study suggestions
The findings of this research provide information for the case company to un-
derstand the dimensions of brand awareness and brand image and the ques-
tionnaire reveals the concrete results of the three target groups, how to de-
velop the current brand image. However, the theoretical part is limited, since
the subjects are very wide and for example, Brand Strategy models would be
another study to investigate further. Also, the Cluster analysis would reveal
more exact information to identify customer groups on their loyalty towards the
brand. The international comparisons towards the research subject was very
limited, since quite few respondents reacted to the online questionnaire. Per-
haps, in the future interview would be another option to gain more responses
from the international partners. Also, as earlier mentioned, the current English
version of the case company homepage is very narrow and limited, and some
information is not available in English. Perhaps totally new English homepage
version on Excellence Finland could be considered, since currently, only one
page of introduction of Excellence Finland’s operations is available in English.
Other related terms like brand recognition and brand loyalty are also very wide
subjects and comprise many dimensions, theories and models, which could
be useful further studies to develop brand awareness and brand image.
102
REFERENCES
Aaker, David A. 2002. Building Strong Brands. Simon & Schuster UK Ltd. A
Viacom Company.
Abratt, R. & Kleyn, N. 2012. Corporate identity, corporate branding and corpo-
rate reputations”, European Journal of Marketing, vol. 46, no. 7, 1048−1063.
Chaudhuri, A; Holbrook, Morris B. 2001. The chain of effects from brand trust
and brand affect to brand performance: The role of brand loyalty. Journal of
Marketing, 65.2: 81–93. Available through: ProQuest Central [Accessed 13
September 2016].
Domino, G. & Domino Marla L. 2006. Psychological Testing: And Introduction.
2n Edition. eBook. Cambridge University Press, 24.4.2006. Available through
ProQuest Central [Accessed 15 August 2017].
Epic Brand Group. 2017. Stick to the script. Www document. Available at:
http://epicbg.com/stick-to-the-script/ [Accessed 17 July 2017].
Fioroni, M., Titterton G. 2009. Brand Storming. Managing Brands in the Era of
Complexity. Palgrave Macmillan.
Fisher-Buttinger, C., & Vallaster, C. 2010. Connective Branding: Building
Brand Equity in a Demanding World, John Wiley & Sons, Incorporated. Availa-
ble through: ProQuest eBook Central. [Accessed 6 October 2017].
Ghauri, P., & Grønhaug, K. (ed.) 2010. Research Methods in Business Stud-
ies: A Practical Guide. 4th edition. FT-Pearson.
Ghauri, P., & Grønhaug, K. (ed.) 2005. Research Methods in Business Stud-
ies: A Practical Guide. 3rd edition. Pearson Education Limited.
Gounaris, S. & Stathakopoulos, V. 2004. Antecedents and consequences of
brand loyalty: An empirical study. Journal of Brand Management, 11.4: 283–
306. Available through: ProQuest Central [Accessed 7 September 2017].
103
Hair, Joseph F. Jr., Black, William C., Babin, Barry J., Anderson, Rolph E. &
Tatham, Ronald L. et.al. 2006. Multivariate Data Analysis. 6th Edition. Pren-
tice-Hall London.
Heikkilä, T. 2001. Tilastollinen tutkimus. Pages 30,187. 3rd edition. Helsinki:
Edita
Hammond, J. 2008. Branding Your Business. Kogan Page Limited.
Järvinen, T. CEO. Email discussion 6 February 2015–16 October 2016, 19
September 2017.
Järvinen, T., Rosenqvist, M., Meurmann, M. 2015. Interview 17 February and
7 October 2015. Laatukeskus, Excellence Finland.
Keller, Kevin L. 2013. Strategic Brand Management. Building, Measuring and
Managing Brand Equity. 4th Edition. Pearson Education Limited.
Laatukeskus Excellence Finland. 2017. Laatuyhdistys, Organisaatio. Www
document. Available at: http://www.laatukeskus.fi/suomen-laatuyhdistys-or-
ganisaatio/hallitus [Accessed 7 September 2017].
Laatukeskus in English. 2015. Finnish Quality Association. Available at:
http://www.laatukeskus.fi/suomen-laatuyhdistys/laatukeskus-english [Ac-
cessed 13 February 2016]
Laatukeskus Excellence Finland. 2014. Laatulehti 2-2014. Publications [pdf].
Available at: http://www.laatukeskus.fi/sites/default/files/laatulehti/2014/Laatu-
lehti_2_2014/desktop/index.html?article=1&page=1 [Accessed 15 February
2016]
Laatukeskus Excellence Finland. 2017. Cooperation and International Links
Available at: http://www.laatukeskus.fi/suomen-laatuyhdistys-laatukeskus-eng-
lish/cooperation-and-international-links [Accessed 13 February 2017].
LinkedIn Corporation. 2015. Seminar 3: ememory tags, content analysis, mak-
ing sense of our data. Original Kevin Lane Keller “Conceptualizing, measuring,
104
and Managing Customer-Based Brand Equity” Journal of Marketing 57 (Jan
1993), 7. Available at: http://www.slideshare.net/Rebaenrose/seminar-3-
ememory-tags-content-analysis-making-sense-of-our-data [Accessed on 29
March 2016]
Malhotra, Naresh K. & Birks, David F. 2006. Marketing research: An Applied
Approach, pages 312,313. Updated 2nd European ed. Pearson Education Lim-
ited. Essex, England.
Meenaghan, T. 1995. Journal of Product & Brand Management. 01 October
1995, Vol.4(4), 23-34. Available through: Kaakkuri, Finna [Accessed 11 Octo-
ber 2017].
Meurmann, M. 2015. Quality Manager. Email discussion 16 November 2015–
10 June 2016, 19 September 2017.
Newby, P. 2010. Research Methods for Education. Harlow, Essex. Pearson
Education Ltd.
Ojasalo, J. & Ojasalo K., 2010. B-to-B-palveluiden markkinointi. 1st edition.
Helsinki: WSOYpro Oy.
Ormeno, M. 2007. Managing Corporate Brands: A new approach to corporate
communication. Springer Science & Business Media, 74–75.
Pulkkinen, S. 2003. Mielipaikka markkinoilla. Porvoo: WS Bookwell OY.
Rosenqvist, M. 2016. Communications Manager. Email discussion 6 February
2015–17 September 2017.
Rossolatos G. 2012. Applying structuralist semiotics to brand image research.
(May 4, 2012). PUBLIC JOURNAL OF SEMIOTICS 2012, VOL. 4 (1). Availa-
ble at SSRN: https://ssrn.com/abstract=2050993 [Accessed on 3 September
2017]
Saunders, M., Lewis, P. Thornhill, A. 2003. Research Methods for Business
Student. Pearson Education Limited. 3rd Edition.
105
Shimp, Terence A. 2010. Advertising, Promotion, and other aspects of Inte-
grated Marketing Communications. Preview of a book, pages 36–38. South-
Western Cencage Learning [Accessed on 3 September 2017].
Srivastava, Rajendra K. & G. Metz, 2016. The Future of Branding. Preview of
a book. Pages 4–6 & Section Brand Mantras. Sage Publications India Pvt Ltd.
[Accessed on 4 September 2017].
University of Eastern Finland. Benchmarking. Www document. Available at:
https://www.uef.fi/benchmarking [Accessed on 17 May 2017].
Quinlan, C. 2011. Business Research Methods. South-Western Cengage
Learning Donnelley, China.
106
LIST OF FIGURES AND TABLES
Figure 1. Research process of the study. Eerikäinen, M. 2017. Figure 2. Analytical model of the theoretical framework. Ee-rikäinen, M. 2017. Figure 3. Building brand equity in the connective branding frame-work (Fisher-Buttinger & Vallaster, 2008, 125) Figure 4. A customer-based Brand Equity Framework (LinkedIn, Slideshare.net (original Kevin Lane Keller “Conceptualizing, measuring, and Managing Customer-Based Brand Equity” Journal of Marketing 57 (Jan 1993), 7.) [Accessed 1 September 2015]. Figure 5: The Young & Rubicam Model of Brand Dynamics (Phil-lips, F. based on Aaker, 2002) [Accessed 2.9.2017] Adapted from: http://slideplayer.com/slide/7970145/ Figure 6: Epic moments (Epic Brand Group, 2017) [Accessed 2.9.2017] Adapted from: http://epicbg.com/stick-to-the-script/ Figure 7: Qualitative versus Quantitative methods (Reichardt and Cook 1979 cited in SlidePlayer.com) Figure 8: Data collection methods (Quinlan 2011). Figure 9: How well respondents estimate their knowing of Excel-lence Finland_current All (n=121)
Figure 10: How to rate Excellence Finland brand / image based on respondent’s knowledge (n=121)
Figure 11: Mostly followed media channels: Internet (n=118)
Figure 12: Mostly followed media channels: Facebook (n=118) Figure 13: Mostly followed media channels: Twitter (n=118) Figure 14: Mostly followed media channels: LinkedIn (n=116) Figure 15: Mostly followed media channels: Laatulehti-magazine, (n=120) Figure 16: Mostly followed media channels: Something else, what? (n=56) Figure 18: Trustworthiness of Excellence Finland_current (n=121) Figure 19: Which services have the respondents used during the last two years. Multiple option allowed (n=114/238) Figure 20: How likely would the respondents buy the company services in the future (n=121)
107
Figure 21: How likely would the respondents recommend the ser-vices of Excellence Finland in the future (n=121) Figure 22: Position of the respondents in their own company_cur-rent (n=120) Figure 23: How did the respondents first hear about the Excel-lence Finland (n=31) Figure 24: How well respondents estimate their knowing of Excel-lence Finland_potential (n=31) Figure 25: How well respondents estimate the brand /image of Ex-cellence Finland (n=30) Figure 26: Current use of any tools to develop the business and operations in the company one represents (n=30) Figure 27: Are respondents developing their organization’s pro-cesses (n=29) Figure 28: Which services of Excellence Finland potentially inter-est you (n=30) Figure 29: The importance of personal advice in choosing a part-ner (n=30) Figure 30: Importance of technology and tools used in the com-pany in partner selection (n=30) Figure 31: The role of the costs, when choosing a partner (n=30) Figure 32: How likely would respondents become a member of the company (n=29)
Figure 33: How well respondents estimate their knowing of Excel-lence Finland_international (n=6) Figure 34/1: How respondents follow Excellence Finland’s media channels_international: Internet (n=6), Facebook (n=6), Twitter (n=6), LinkedIn (n=6), Something else, which? (n=3) Figure 34/2: How respondents follow Excellence Finland’s media channels_international: Facebook (n=6), Twitter (n=6) LinkedIn (n=6)
Figure 34/3: How respondents follow Excellence Finland’s media channels_international: Something else, which? (n=3) Figure 35: Evaluation of Laatukeskus media visibility_international (n=3)
108
Figure 36: Cooperation with Excellence Finland within two years, yes or no (n=6) Figure 37: Trustworthiness of Excellence Finland_International (n=6) Figure 38: How the Excellence Finland is currently experienced as an operator (n=6)
Figure 40: Position of the respondents in their own company_in-ternational (n=6) Table 1: How to describe image of Excellence Finland, three op-tional adjectives (n=112) (P=Positive, N=Negative, ne=Neutral, na=No answer)
Table 2: Where or how the respondents first hear about Excellence Finland_current (n=116)
Table 3: Event implementation, usefulness and reasoning (P=Positive, N=Negative, ne=neutral, na=No answer, n=64)
Table 4: How to develop Excellence Finland’s brand image (n=84)
Table 5: How to describe the image of Laatukeskus with 3 free choice adjectives (n=29)
Table 6: Which tools are utilized in the company of respondents and how (n=29)
Table 7: How to describe the image of Excellence Finland with 3 free choice adjectives (n=6) Table 8: How the respondents first hear about Excellence Finland_international (n=6)
Appendix 1 APPENDICES
COVER LETTER, CUSTOMERS
ASIAKKAAT
Otsikko: Laatukeskuksen brändiuudistuskysely Lähettäjä: Laatukeskus / [email protected]
Hyvä vastaanottaja,
Me täällä Laatukeskuksessa olemme käynnistäneet 50-vuotisjuhlavuotemme kunniaksi brän-diuudistuksen, sillä haluamme kehittää näkyvyyttämme ja imagoamme positiiviseen suuntaan palvellaksemme asiakkaitamme parhaalla mahdollisella tavalla myös seuraavat 50 vuotta.
Sinulla on nyt ainutlaatuinen mahdollisuus vaikuttaa uudistusprojektiimme omalla näkemyk-selläsi. Kutsumme sinut mukaan brändiuudistuskyselyymme, joka toteutetaan yhteistyössä Kymenlaakson Ammattikorkeakoulun kanssa.
Kyselyyn pääset vastaamaan tästä: https://my.surveypal.com/Br%C3%A4ndikysely---Nykyi-set-asiakkaat)
(Mikäli kysely ei avaudu oheisesta linkistä, voit kopioida osoitteen suoraan internet-selaimen osoitekenttään hiiren oikealla näppäimellä.)
Käsittelemme vastaukset ehdottoman luottamuksellisina ja tuloksia hyödynnetään Laatukes-kuksen imagon, tunnettuuden ja maineen kokonaisvaltaisessa kehittämisessä. Vastaathan vii-meistään sunnuntaina 8.5.2016.
Arvomme kaikkien vastanneiden kesken pääsylipun kansainvälisen kongressimme 2. päi-vään, jonka ohjelmassa mm. tämän kyselyn tulokset sekä pääpuhujina Edward Snowden sekä Robert Tercek. Lisäksi arvomme 5 kpl kirjapalkintoja. Ilmoitamme voittajille henkilökoh-taisesti. Kyselyn tulokset julkaistaan kansainvälisessä laatukongressissa Finlandia-talolla 1.-2.6.2016. Lisätietoa asiasta: http://www.quality2016.eu.
Kiitos osallistumisestasi imagomme kehittämiseen ja onnea arvontaan.
Miia Rosenqvist – johtaja, seminaarit ja viestintä [email protected] tel. +358 50 534 4843 LAATUKESKUS EXCELLENCE FINLAND Marjukka Eerikäinen - opinnäytetyön tekijä Kymenlaakson Ammattikorkeakoulu (KYAMK) Tradenomi, YAMK Degree in International Business Management
Appendix 2
COVER LETTER, POTENTIAL CUSTOMERS
POTENTIAALISET Otsikko: Laatukeskuksen brändiuudistuskysely Lähettäjä: Laatukeskus / [email protected] Hyvä vastaanottaja, Me täällä Laatukeskuksessa olemme aloittaneet 50-vuotisjuhlavuotemme kunniaksi brändiuu-distuksen, sillä haluamme kehittää näkyvyyttämme ja imagoamme positiiviseen suuntaan pal-vellaksemme niin nykyisiä kuin tulevia asiakkaitamme parhaalla mahdollisella tavalla myös seuraavat 50 vuotta. Sinulla on nyt ainutlaatuinen mahdollisuus vaikuttaa uudistusprojektiimme omalla näkemyk-selläsi. Kutsumme sinut mukaan brändiuudistuskyselyymme, joka toteutetaan yhteistyössä Kymenlaakson Ammattikorkeakoulun kanssa. Kyselyyn pääset vastaamaan tästä: https://my.surveypal.com/Br%C3%A4ndikysely---Potenti-aaliset-asiakkaat) (Mikäli kysely ei avaudu oheisesta linkistä, voit kopioida osoitteen suoraan internet-selaimen osoitekenttään hiiren oikealla näppäimellä.) Käsittelemme vastaukset ehdottoman luottamuksellisina ja tuloksia hyödynnetään Laatukes-kuksen imagon, tunnettuuden ja maineen kokonaisvaltaisessa kehittämisessä. Vastausaikaa sinulla maanantaihin 9. toukokuuta saakka, kysely sulkeutuu 10.5.2016. Arvomme kaikkien vastanneiden kesken pääsylipun kansainvälisen kongressimme 2. päi-vään, jonka ohjelmassa mm. tämän kyselyn tulokset sekä tilaisuuden pääpuhujina Edward Snowden sekä Robert Tercek. Lisäksi arvomme 5 kpl kirjapalkintoja. Ilmoitamme voittajille henkilökohtaisesti. Kyselyn tulokset julkaistaan kansainvälisessä laatukongressissa Finlandia-talolla 1.-2.6.2016. Lisätietoa asiasta: http://www.quality2016.eu Kiitos osallistumisestasi imagomme kehittämiseen ja onnea arvontaan. Miia Rosenqvist – johtaja, seminaarit ja viestintä [email protected] tel. +358 50 534 4843 LAATUKESKUS EXCELLENCE FINLAND Marjukka Eerikäinen - opinnäytetyön tekijä Kymenlaakson Ammattikorkeakoulu (KYAMK) Tradenomi, YAMK Degree in International Business Management
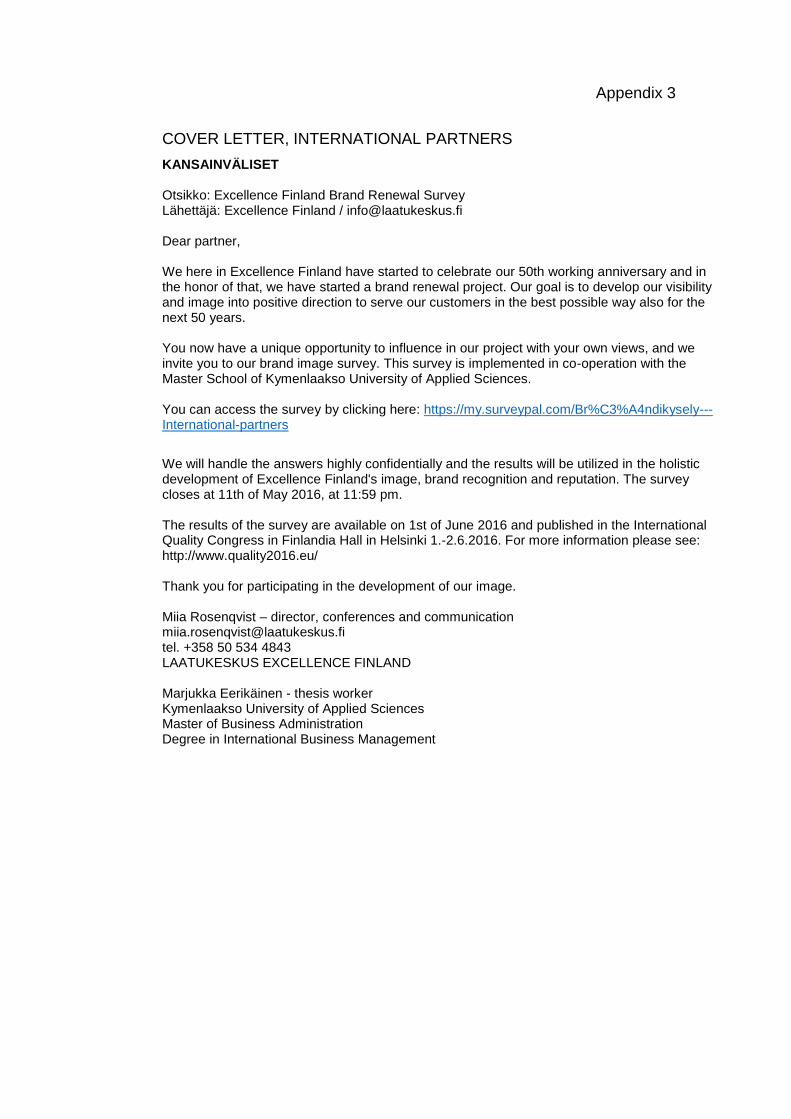
Appendix 3
COVER LETTER, INTERNATIONAL PARTNERS
KANSAINVÄLISET Otsikko: Excellence Finland Brand Renewal Survey Lähettäjä: Excellence Finland / [email protected] Dear partner, We here in Excellence Finland have started to celebrate our 50th working anniversary and in the honor of that, we have started a brand renewal project. Our goal is to develop our visibility and image into positive direction to serve our customers in the best possible way also for the next 50 years. You now have a unique opportunity to influence in our project with your own views, and we invite you to our brand image survey. This survey is implemented in co-operation with the Master School of Kymenlaakso University of Applied Sciences. You can access the survey by clicking here: https://my.surveypal.com/Br%C3%A4ndikysely---International-partners
We will handle the answers highly confidentially and the results will be utilized in the holistic development of Excellence Finland's image, brand recognition and reputation. The survey closes at 11th of May 2016, at 11:59 pm. The results of the survey are available on 1st of June 2016 and published in the International Quality Congress in Finlandia Hall in Helsinki 1.-2.6.2016. For more information please see: http://www.quality2016.eu/ Thank you for participating in the development of our image. Miia Rosenqvist – director, conferences and communication [email protected] tel. +358 50 534 4843 LAATUKESKUS EXCELLENCE FINLAND Marjukka Eerikäinen - thesis worker Kymenlaakso University of Applied Sciences Master of Business Administration Degree in International Business Management
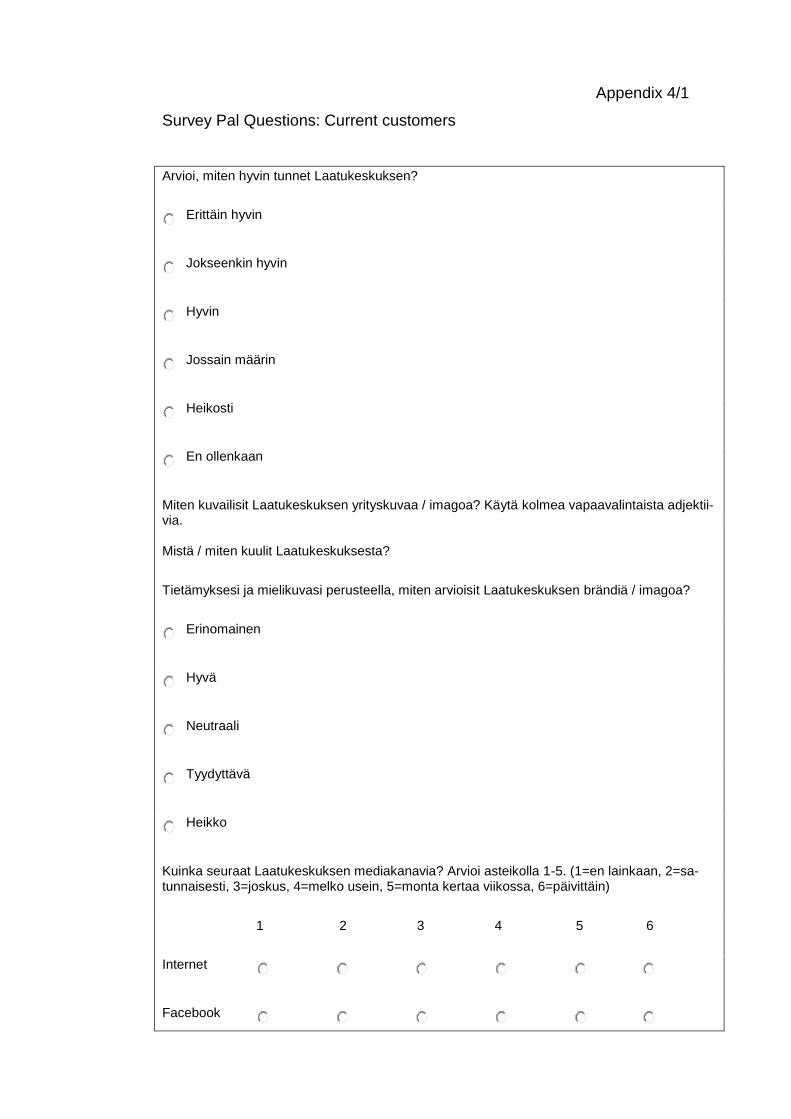
Appendix 4/1
Survey Pal Questions: Current customers
Arvioi, miten hyvin tunnet Laatukeskuksen?
Erittäin hyvin
Jokseenkin hyvin
Hyvin
Jossain määrin
Heikosti
En ollenkaan
Miten kuvailisit Laatukeskuksen yrityskuvaa / imagoa? Käytä kolmea vapaavalintaista adjektii-via. Mistä / miten kuulit Laatukeskuksesta?
Tietämyksesi ja mielikuvasi perusteella, miten arvioisit Laatukeskuksen brändiä / imagoa?
Erinomainen
Hyvä
Neutraali
Tyydyttävä
Heikko
Kuinka seuraat Laatukeskuksen mediakanavia? Arvioi asteikolla 1-5. (1=en lainkaan, 2=sa-tunnaisesti, 3=joskus, 4=melko usein, 5=monta kertaa viikossa, 6=päivittäin)
1 2 3 4 5 6
Internet
Appendix 4/2
Laatulehti
Jokin muu, mikä?
Kuinka arvioisit Laatukeskuksen medianäkyvyyden?
Erittäin hyvä
Hyvä
Melko hyvä
Melko huono
Heikko
Erittäin heikko
Onko Laatukeskus mielestänne luotettava organisaatio?
Täysin samaa mieltä
Samaa mieltä
Jokseenkin samaa mieltä
En osaa sanoa
Eri mieltä
Täysin eri mieltä
Mitä palveluistamme olette käyttäneet viimeisen kahden vuoden aikana? Voit valita myös usean vaihtoehdon.
Appendix 4/3
Seminaarit
Jäsenpalvelut
Arviointipalvelut
Kurssit ja valmennukset
Asiantuntijapalvelut
Laatulehti
Muu, mikä?
Oliko tilaisuus / palvelu hyvin toteutettu, hyödyllinen ja miksi?
Kuinka kehittäisit Laatukeskuksen imagoa?
Kuinka todennäköistä on, että ostaisit Laatukeskuksen palveluja tulevaisuudessa?
Erittäin todennäköistä
Jokseenkin todennäköistä
En osaa sanoa
Jokseenkin epätodennäköistä
Erittäin epätodennäköistä
Kuinka todennäköistä on, että suosittelisit Laatuyhdistyksen jäsenyyttä tai Laatukeskuksen palveluja?
Erittäin todennäköistä
Jokseenkin todennäköistä
En osaa sanoa
Jokseenkin epätodennäköistä
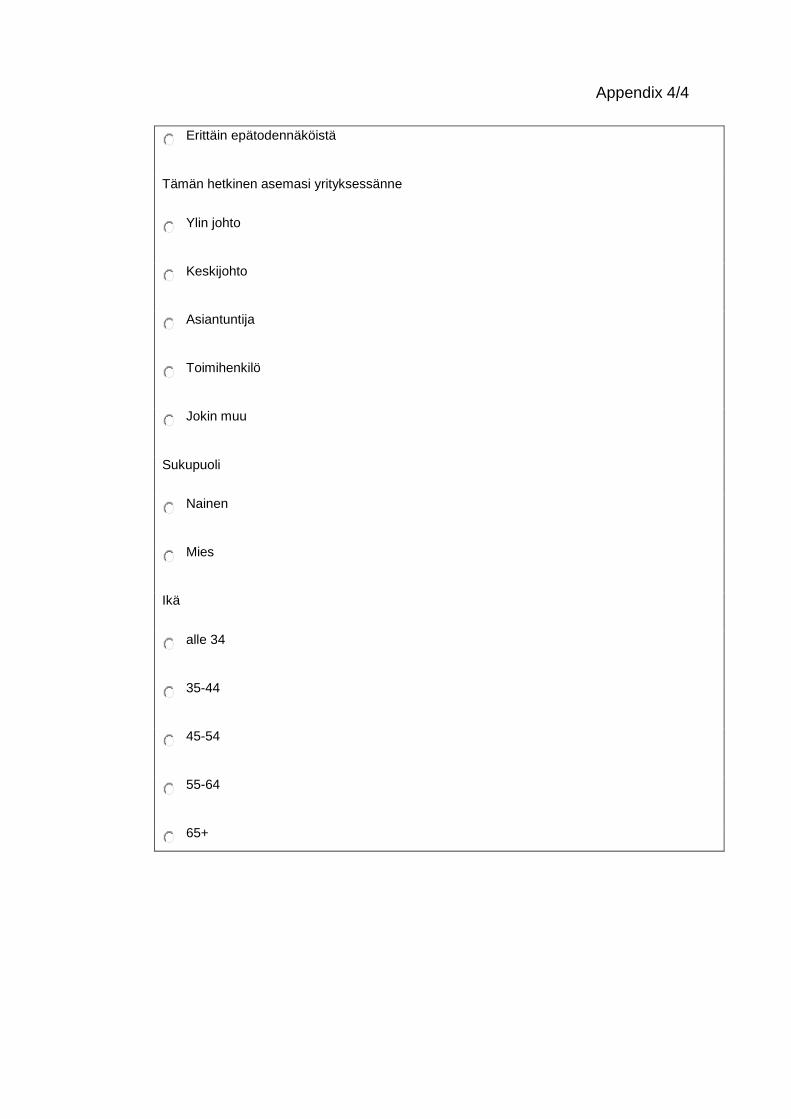
Appendix 4/4
Erittäin epätodennäköistä
Tämän hetkinen asemasi yrityksessänne
Ylin johto
Keskijohto
Asiantuntija
Toimihenkilö
Jokin muu
Sukupuoli
Nainen
Mies
Ikä
alle 34
35-44
45-54
55-64
65+
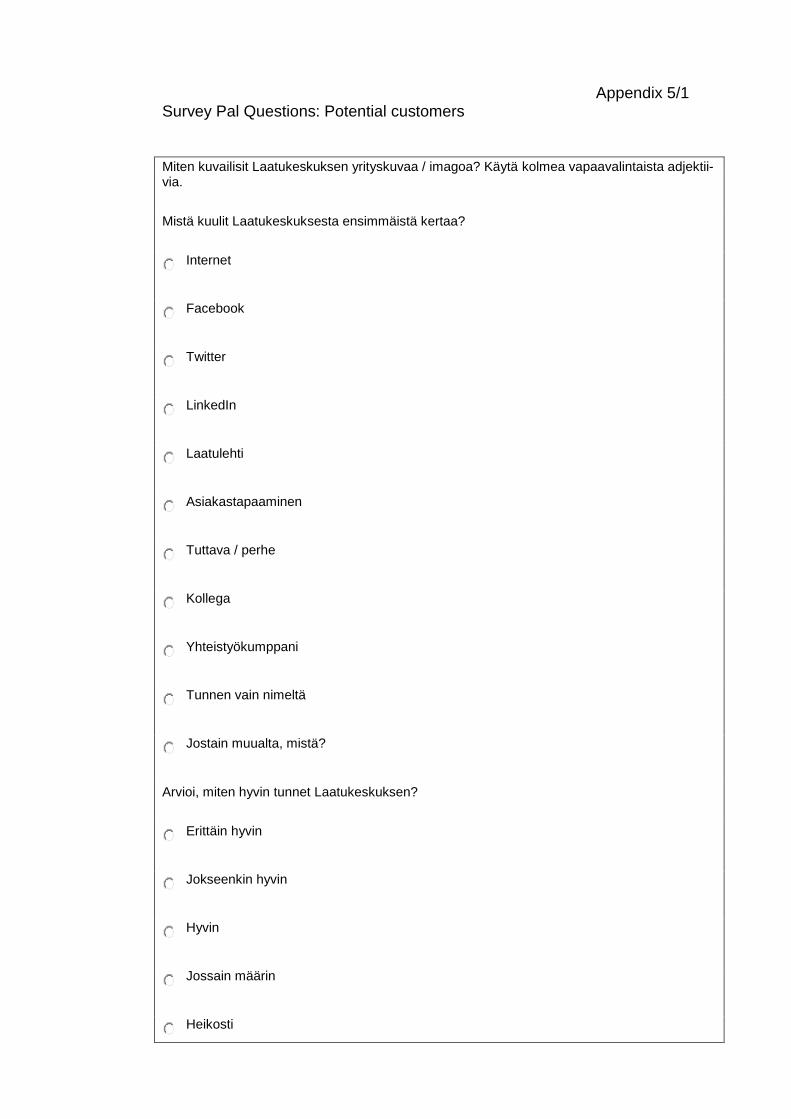
Appendix 5/1 Survey Pal Questions: Potential customers
Miten kuvailisit Laatukeskuksen yrityskuvaa / imagoa? Käytä kolmea vapaavalintaista adjektii-via.
Mistä kuulit Laatukeskuksesta ensimmäistä kertaa?
Internet
Laatulehti
Asiakastapaaminen
Tuttava / perhe
Kollega
Yhteistyökumppani
Tunnen vain nimeltä
Jostain muualta, mistä?
Arvioi, miten hyvin tunnet Laatukeskuksen?
Erittäin hyvin
Jokseenkin hyvin
Hyvin
Jossain määrin
Heikosti
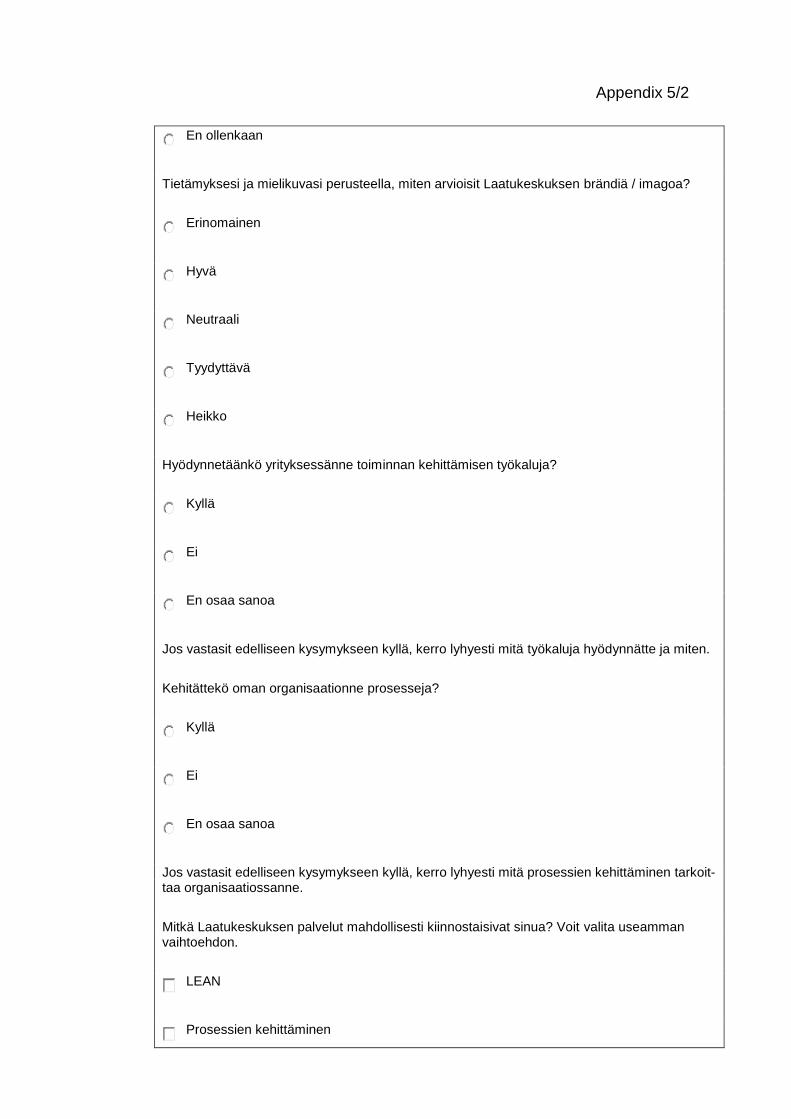
Appendix 5/2
En ollenkaan
Tietämyksesi ja mielikuvasi perusteella, miten arvioisit Laatukeskuksen brändiä / imagoa?
Erinomainen
Hyvä
Neutraali
Tyydyttävä
Heikko
Hyödynnetäänkö yrityksessänne toiminnan kehittämisen työkaluja?
Kyllä
Ei
En osaa sanoa
Jos vastasit edelliseen kysymykseen kyllä, kerro lyhyesti mitä työkaluja hyödynnätte ja miten.
Kehitättekö oman organisaationne prosesseja?
Kyllä
Ei
En osaa sanoa
Jos vastasit edelliseen kysymykseen kyllä, kerro lyhyesti mitä prosessien kehittäminen tarkoit-taa organisaatiossanne.
Mitkä Laatukeskuksen palvelut mahdollisesti kiinnostaisivat sinua? Voit valita useamman vaihtoehdon.
LEAN
Prosessien kehittäminen
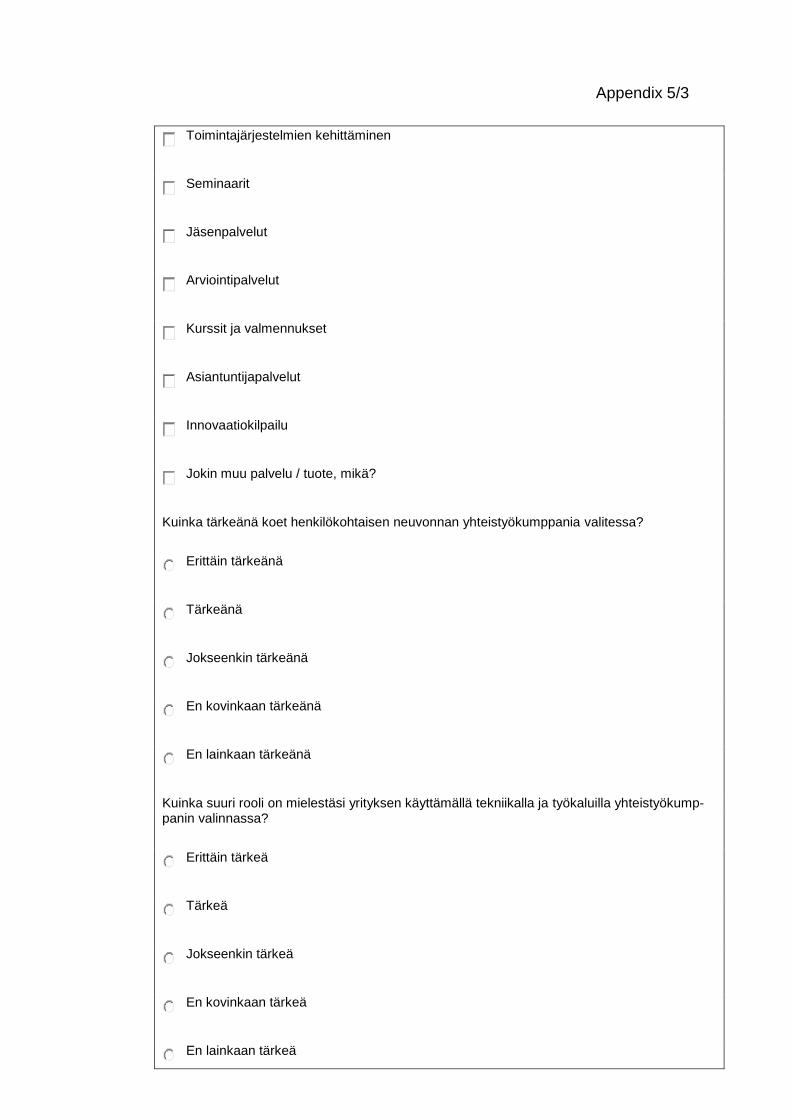
Appendix 5/3
Toimintajärjestelmien kehittäminen
Seminaarit
Jäsenpalvelut
Arviointipalvelut
Kurssit ja valmennukset
Asiantuntijapalvelut
Innovaatiokilpailu
Jokin muu palvelu / tuote, mikä?
Kuinka tärkeänä koet henkilökohtaisen neuvonnan yhteistyökumppania valitessa?
Erittäin tärkeänä
Tärkeänä
Jokseenkin tärkeänä
En kovinkaan tärkeänä
En lainkaan tärkeänä
Kuinka suuri rooli on mielestäsi yrityksen käyttämällä tekniikalla ja työkaluilla yhteistyökump-panin valinnassa?
Erittäin tärkeä
Tärkeä
Jokseenkin tärkeä
En kovinkaan tärkeä
En lainkaan tärkeä
Appendix 5/4
Valitessanne yhteistyökumppania muiden joukosta, kuinka suuri rooli on kustannuksilla?
Erittäin tärkeä
Tärkeä
Jokseenkin tärkeä
En kovinkaan tärkeä
En lainkaan tärkeä
Kuinka todennäköistä on, että liittyisitte Laatuyhdistyksen jäseneksi tulevaisuudessa?
Erittäin todennäköistä
Jokseenkin todennäköistä
En osaa sanoa
Jokseenkin epätodennäköistä
Erittäin epätodennäköistä
Tämän hetkinen asemasi yrityksessänne
Ylin johto
Keskijohto
Asiantuntija
Toimihenkilö
Jokin muu
Appendix 5/5
Sukupuoli
Nainen
Mies
Ikä
alle 34
35-44
45-54
55-64
65+
Appendix 6/1
Survey Pal Questions: International Partners
Estimate, how well do you know Excellence Finland?
To a great extent
Very well
Well
Somewhat
Very little
Not at all
How would you describe the corporate image of Excellence Finland? Please use three adjec-tives of your choice.
How did you get introduced or hear from Excellence Finland?
How do you follow the media channels utilized by Excellence Finland? Evaluate in scale of 1-5. (1=not at all, 2=rarely, 3=sometimes, 4=often, 5=many times per week, 6=daily)
1 2 3 4 5 6
Internet
Something else, which?
Appendix 6/2 How would you estimate the media visibility of Excellence Finland?
Very good
Good
Quite good
Limited
Poor
Very poor
Have you cooperated with Excellence Finland within recent two years?
Yes
No
If you answered yes, do you feel the cooperation was useful to your organization?
If you answered no, would you think cooperation with us to be useful?
Do you think Excellence Finland is a trustworthy organization?
Strongly agree
Agree
Somewhat agree
Undecided
Disagree
Strongly disagree
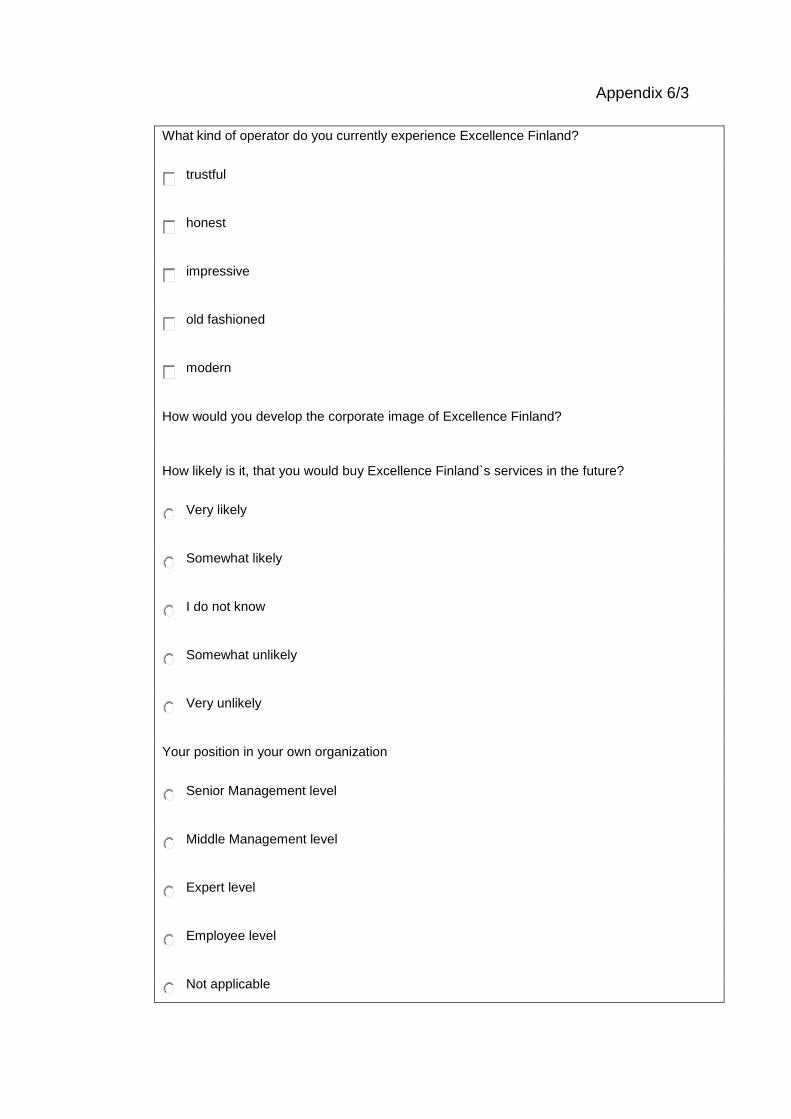
Appendix 6/3
What kind of operator do you currently experience Excellence Finland?
trustful
honest
impressive
old fashioned
modern
How would you develop the corporate image of Excellence Finland?
How likely is it, that you would buy Excellence Finland`s services in the future?
Very likely
Somewhat likely
I do not know
Somewhat unlikely
Very unlikely
Your position in your own organization
Senior Management level
Middle Management level
Expert level
Employee level
Not applicable
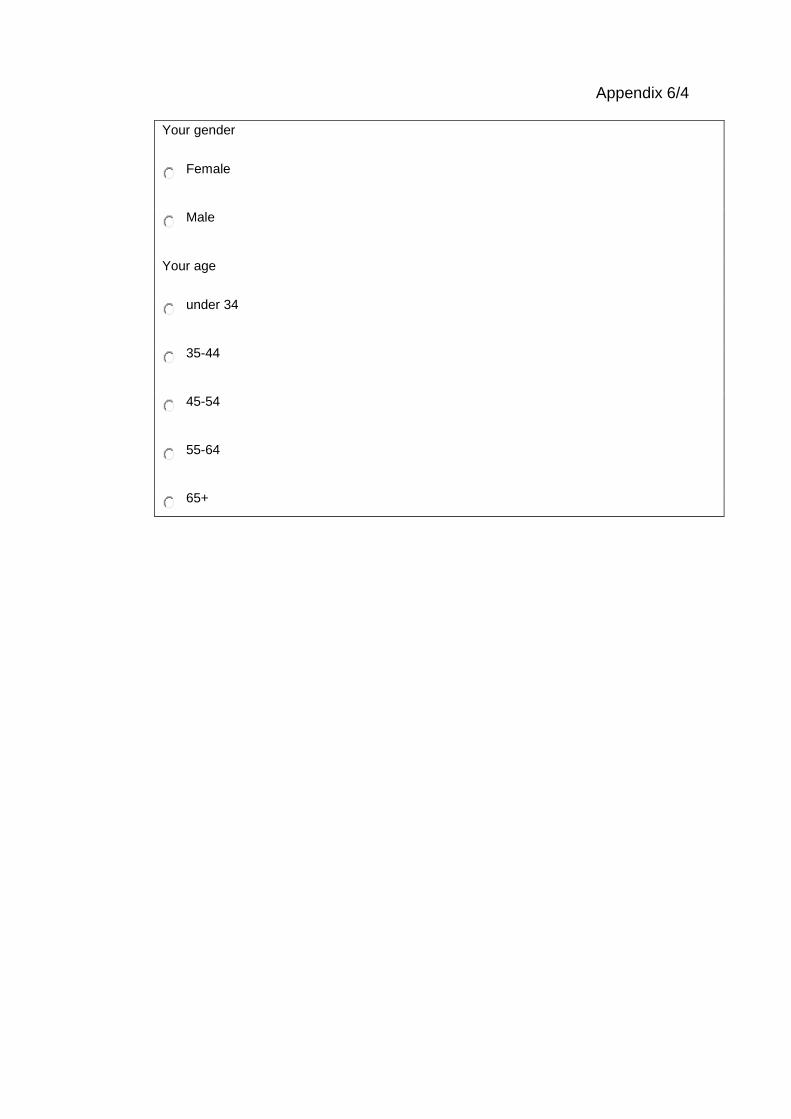
Appendix 6/4
Your gender
Female
Male
Your age
under 34
35-44
45-54
55-64
65+