Stock code: 1102 TT · 3 Table of Contents Company snapshot What’s New PRC market overview Taiwan...
33
亞洲水泥股份有限公司 Asia Cement Corporation IR presentation Stock code: 1102 TT Jun 2018
Transcript of Stock code: 1102 TT · 3 Table of Contents Company snapshot What’s New PRC market overview Taiwan...
亞洲水泥股份有限公司
Asia Cement Corporation
IR presentation
Stock code:
1102 TT
Jun 2018
2
Disclaimer
This presentation contains forward-looking statements. These forward-looking statements are subject
to risks, uncertainties and assumptions, some of which are beyond our control. Actual results may
differ materially from those expressed or implied by these forward-looking statements. Because of
these risks, uncertainties and assumptions, the forward-looking events and circumstances discussed
in this presentation might not occur in the way we expect, or at all. You should not place undue
reliance on any forward-looking information.
In preparing the information herein, ACC have relied upon and assumed, without independent
verification, the accuracy and completeness of all information available from public sources or which
was provided to ACC or which was otherwise reviewed by ACC. Neither ACC nor its advisors have
made any representation or warranty as to the accuracy or completeness of such information and nor
do they assume any undertaking to supplement such information as further information becomes
available or in light of changing circumstances. None of ACC, nor any of their respective affiliates,
advisers or representatives shall have any liability whatsoever (in negligence or otherwise) for any loss
howsoever arising from any use of this presentation or its contents or otherwise arising in connection
with this presentation. Neither this presentation nor any of its contents may be reproduced to a third
party without the prior written consent of ACC.
3
Table of Contents
Company snapshot
What’s New
PRC market overview
Taiwan market overview
Dividend Policy
Financials
CSR achievement
4
Company Snapshot
5
Company Snapshot
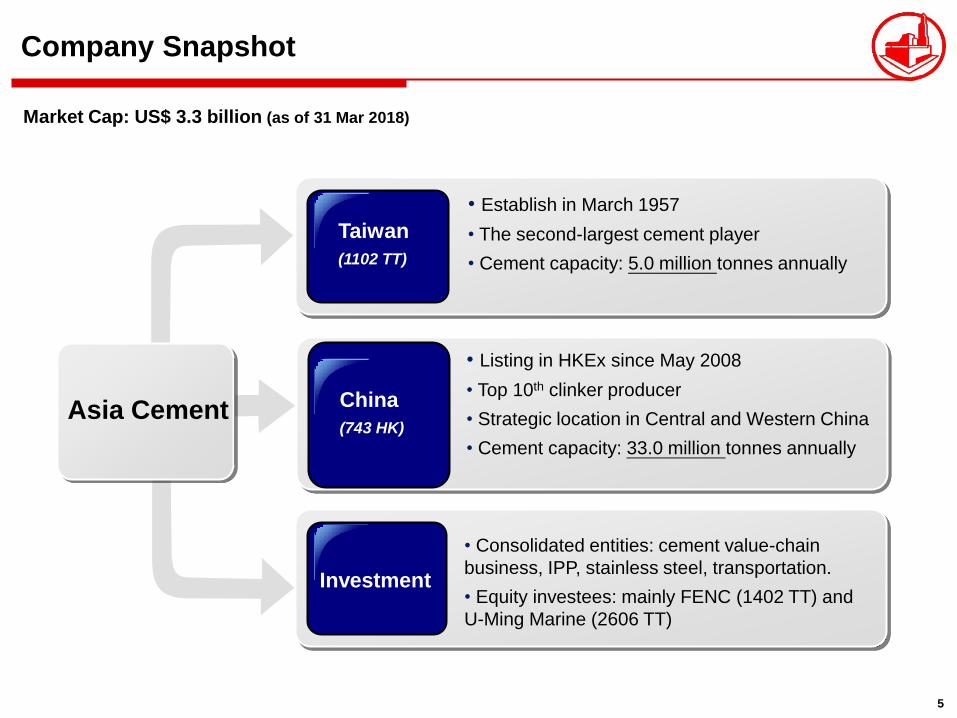
Market Cap: US$ 3.3 billion (as of 31 Mar 2018)
• Consolidated entities: cement value-chain
business, IPP, stainless steel, transportation.
• Equity investees: mainly FENC (1402 TT) and
U-Ming Marine (2606 TT)
Investment
• Listing in HKEx since May 2008
• Top 10th clinker producer
• Strategic location in Central and Western China
• Cement capacity: 33.0 million tonnes annually
• Establish in March 1957
• The second-largest cement player
• Cement capacity: 5.0 million tonnes annually
Taiwan
(1102 TT)
Asia Cement
China
(743 HK)
6
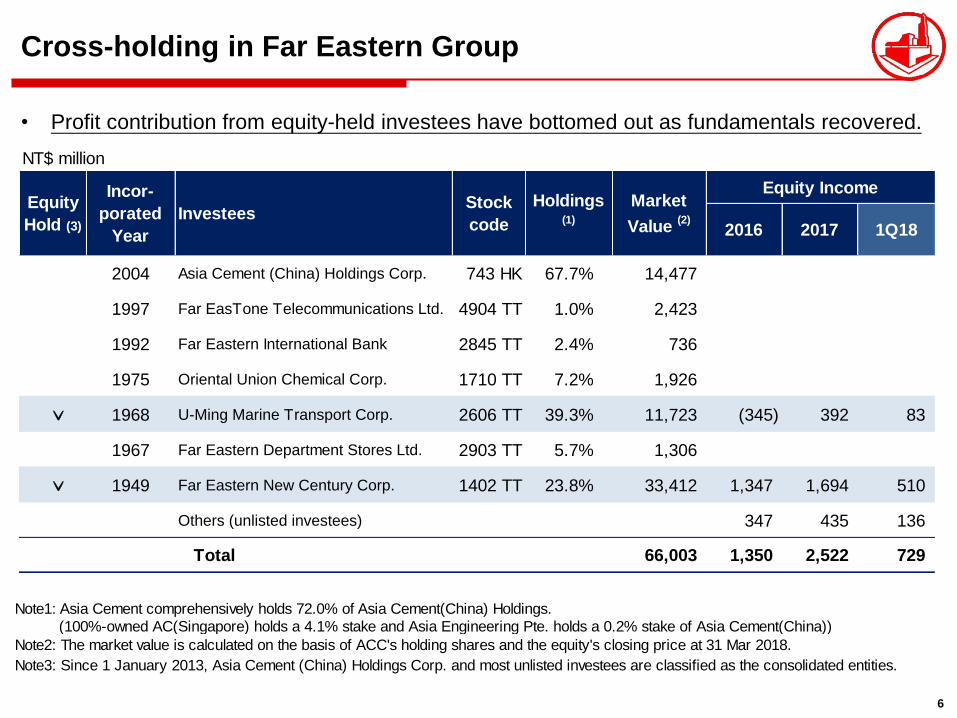
Cross-holding in Far Eastern Group
• Profit contribution from equity-held investees have bottomed out as fundamentals recovered.
Note1: Asia Cement comprehensively holds 72.0% of Asia Cement(China) Holdings.
(100%-owned AC(Singapore) holds a 4.1% stake and Asia Engineering Pte. holds a 0.2% stake of Asia Cement(China))
Note2: The market value is calculated on the basis of ACC's holding shares and the equity's closing price at 31 Mar 2018.
Note3: Since 1 January 2013, Asia Cement (China) Holdings Corp. and most unlisted investees are classified as the consolidated entities.
NT$ million
2016 2017 1Q18
2004 Asia Cement (China) Holdings Corp. 743 HK 67.7% 14,477
1997 Far EasTone Telecommunications Ltd. 4904 TT 1.0% 2,423
1992 Far Eastern International Bank 2845 TT 2.4% 736
1975 Oriental Union Chemical Corp. 1710 TT 7.2% 1,926
ˇ 1968 U-Ming Marine Transport Corp. 2606 TT 39.3% 11,723 (345) 392 83
1967 Far Eastern Department Stores Ltd. 2903 TT 5.7% 1,306
ˇ 1949 Far Eastern New Century Corp. 1402 TT 23.8% 33,412 1,347 1,694 510
Others (unlisted investees) 347 435 136
Total 66,003 1,350 2,522 729
Market
Value (2)
Equity IncomeEquity
Hold (3)
Incor-
porated
Year
InvesteesStock
code
Holdings(1)

7
What’s New
8
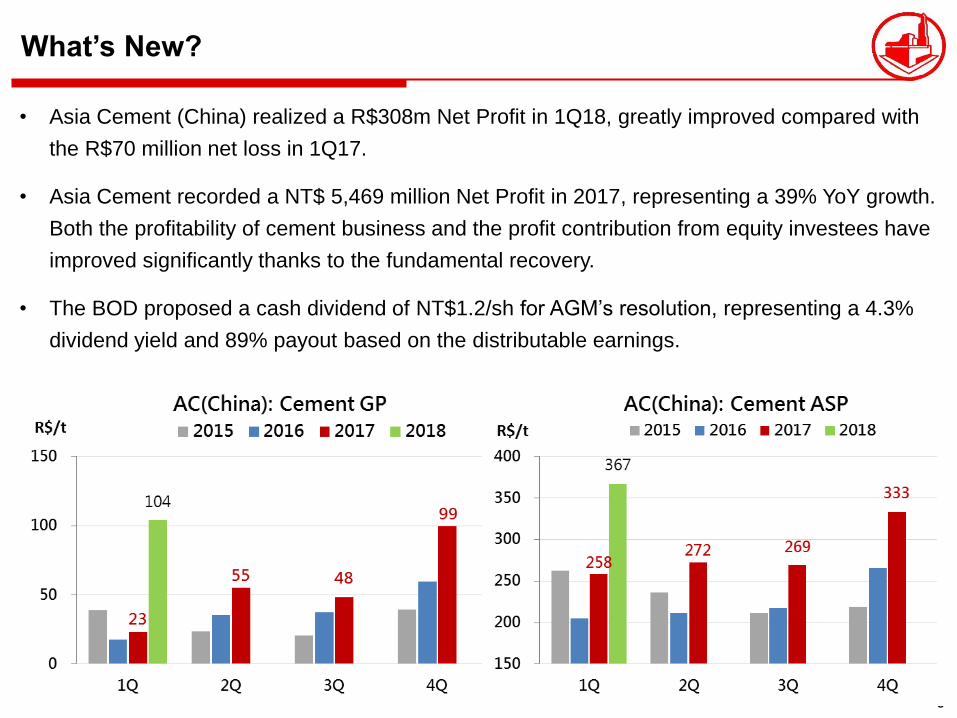
What’s New?
• Asia Cement (China) realized a R$308m Net Profit in 1Q18, greatly improved compared with
the R$70 million net loss in 1Q17.
• Asia Cement recorded a NT$ 5,469 million Net Profit in 2017, representing a 39% YoY growth.
Both the profitability of cement business and the profit contribution from equity investees have
improved significantly thanks to the fundamental recovery.
• The BOD proposed a cash dividend of NT$1.2/sh for AGM’s resolution, representing a 4.3%
dividend yield and 89% payout based on the distributable earnings.
9
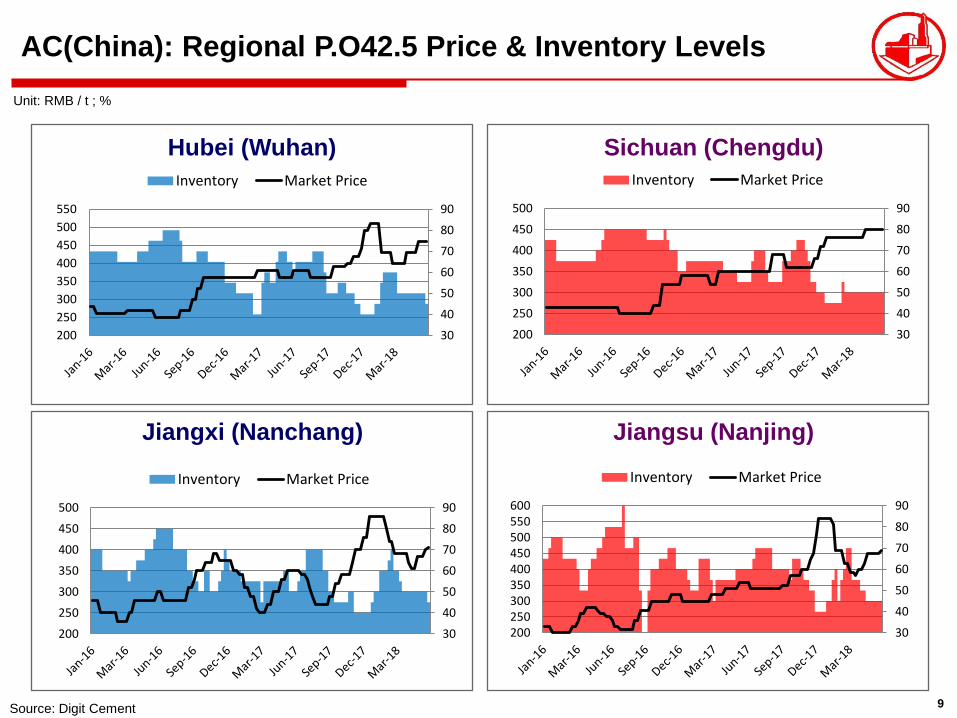
AC(China): Regional P.O42.5 Price & Inventory Levels
Source: Digit Cement
Unit: RMB / t ; %
Hubei (Wuhan) Sichuan (Chengdu)
Jiangxi (Nanchang) Jiangsu (Nanjing)
30
40
50
60
70
80
90
200
250
300
350
400
450
500
550
Inventory Market Price
30
40
50
60
70
80
90
200
250
300
350
400
450
500
Inventory Market Price
30
40
50
60
70
80
90
200
250
300
350
400
450
500
Inventory Market Price
30
40
50
60
70
80
90
200250300350400450500550600
Inventory Market Price
10
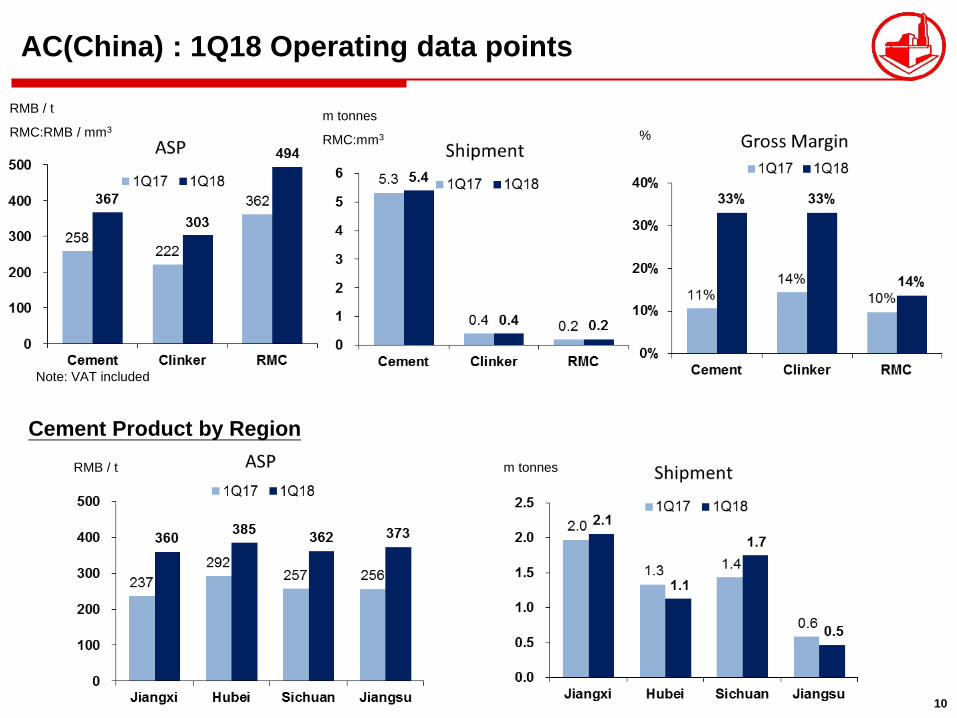
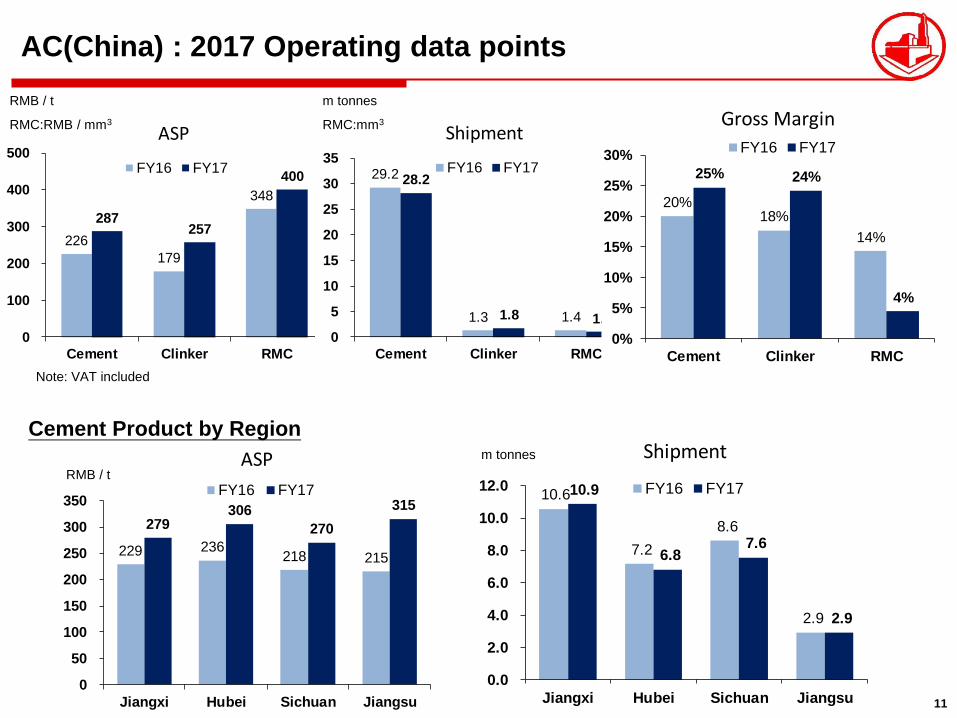
Cement Product by Region
RMB / t m tonnes
%
m tonnes
RMC:mm3
RMB / t
RMC:RMB / mm3
Note: VAT included
AC(China) : 1Q18 Operating data points
11
226
179
348
287 257
400
0
100
200
300
400
500
Cement Clinker RMC
ASP
FY16 FY17
10.6
7.2
8.6
2.9
10.9
6.8 7.6
2.9
0.0
2.0
4.0
6.0
8.0
10.0
12.0
Jiangxi Hubei Sichuan Jiangsu
Shipment
FY16 FY17
229 236 218 215
279 306
270
315
0
50
100
150
200
250
300
350
Jiangxi Hubei Sichuan Jiangsu
ASP
FY16 FY17
Cement Product by Region
RMB / t
m tonnes
% RMB / t
RMC:RMB / mm3
Note: VAT included
AC(China) : 2017 Operating data points
29.2
1.3 1.4
28.2
1.8 1.0
0
5
10
15
20
25
30
35
Cement Clinker RMC
Shipment
FY16 FY17
m tonnes
RMC:mm3
20%18%
14%
25% 24%
4%
0%
5%
10%
15%
20%
25%
30%
Cement Clinker RMC
Gross Margin
FY16 FY17

12
PRC Market Overview
13
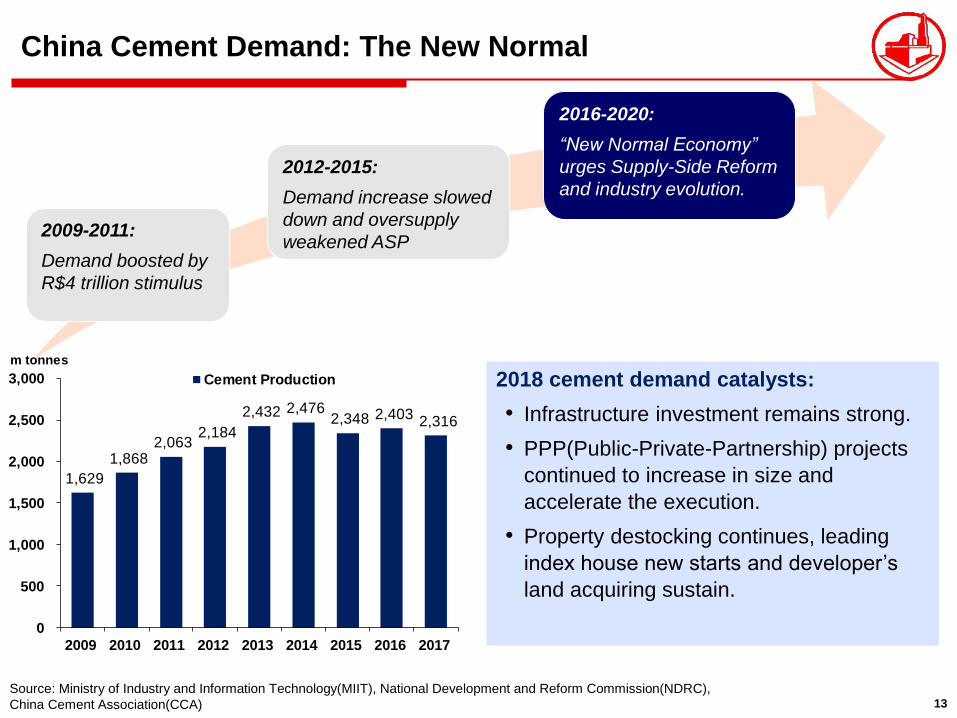
China Cement Demand: The New Normal
Source: Ministry of Industry and Information Technology(MIIT), National Development and Reform Commission(NDRC),
China Cement Association(CCA)
2018 cement demand catalysts:
• Infrastructure investment remains strong.
• PPP(Public-Private-Partnership) projects
continued to increase in size and
accelerate the execution.
• Property destocking continues, leading
index house new starts and developer’s
land acquiring sustain.
2009-2011:
Demand boosted by
R$4 trillion stimulus
2012-2015:
Demand increase slowed
down and oversupply
weakened ASP
2016-2020:
“New Normal Economy”
urges Supply-Side Reform
and industry evolution.
1,629
1,868 2,063
2,184
2,432 2,476 2,348 2,403
2,316
0
500
1,000
1,500
2,000
2,500
3,000
2009 2010 2011 2012 2013 2014 2015 2016 2017
m tonnes
Cement Production
14
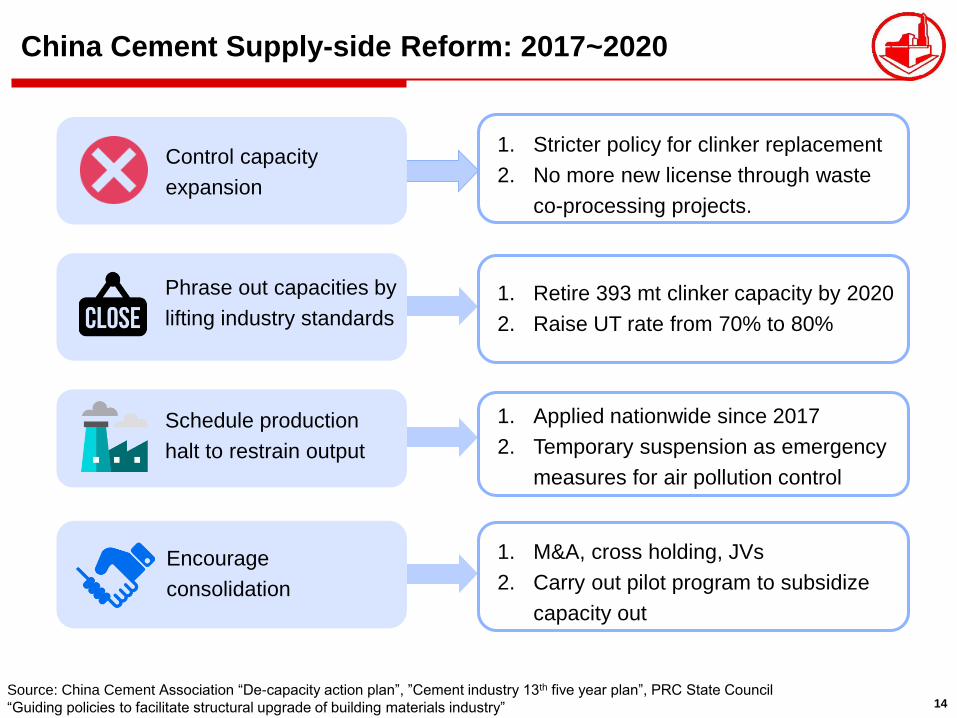
China Cement Supply-side Reform: 2017~2020
Control capacity
expansion
Source: China Cement Association “De-capacity action plan”, ”Cement industry 13th five year plan”, PRC State Council
“Guiding policies to facilitate structural upgrade of building materials industry”
1. Stricter policy for clinker replacement
2. No more new license through waste
co-processing projects.
Encourage
consolidation
1. M&A, cross holding, JVs
2. Carry out pilot program to subsidize
capacity out
Schedule production
halt to restrain output
1. Applied nationwide since 2017
2. Temporary suspension as emergency
measures for air pollution control
Phrase out capacities by
lifting industry standards
1. Retire 393 mt clinker capacity by 2020
2. Raise UT rate from 70% to 80%
15
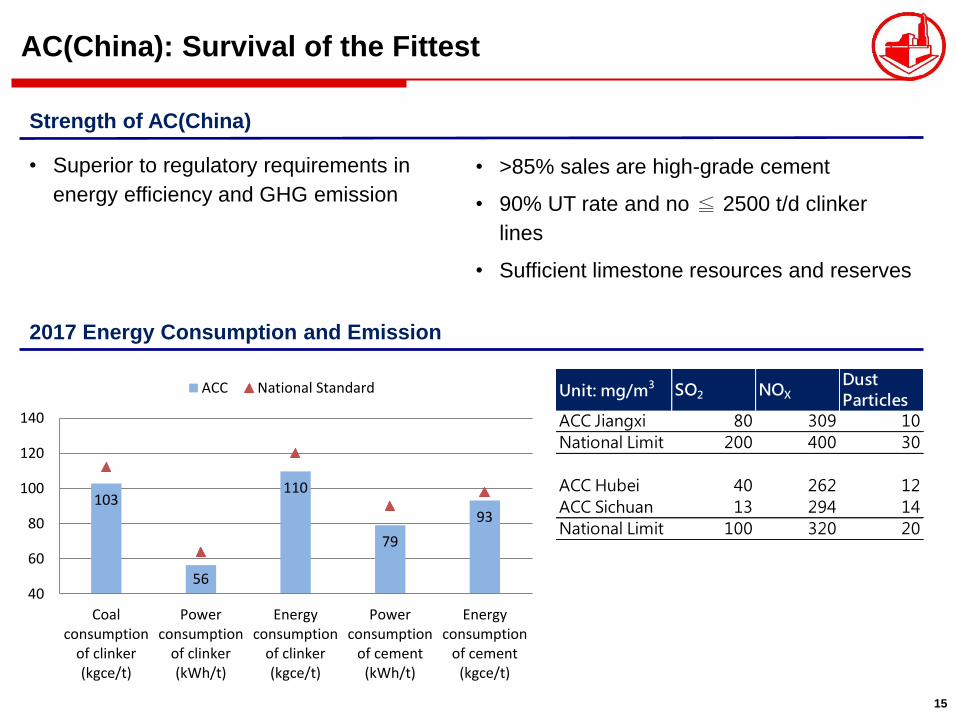
103
56
110
79
93
40
60
80
100
120
140
Coalconsumption
of clinker(kgce/t)
Powerconsumption
of clinker(kWh/t)
Energyconsumption
of clinker(kgce/t)
Powerconsumption
of cement(kWh/t)
Energyconsumption
of cement(kgce/t)
ACC National Standard
AC(China): Survival of the Fittest
• Superior to regulatory requirements in
energy efficiency and GHG emission
Strength of AC(China)
• >85% sales are high-grade cement
• 90% UT rate and no ≦ 2500 t/d clinker
lines
• Sufficient limestone resources and reserves
2017 Energy Consumption and Emission
Unit: mg/m3 SO2 NOX
Dust
Particles
ACC Jiangxi 80 309 10
National Limit 200 400 30
ACC Hubei 40 262 12
ACC Sichuan 13 294 14
National Limit 100 320 20
16
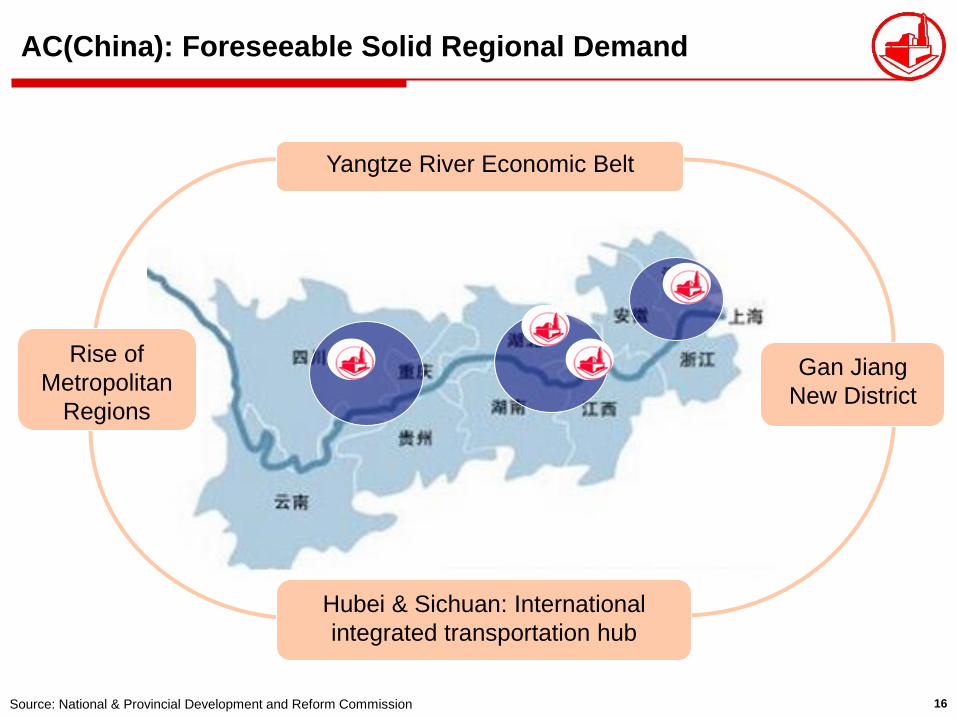
AC(China): Foreseeable Solid Regional Demand
Source: National & Provincial Development and Reform Commission
Gan Jiang
New District
Hubei & Sichuan: International
integrated transportation hub
Rise of
Metropolitan
Regions
Yangtze River Economic Belt
17
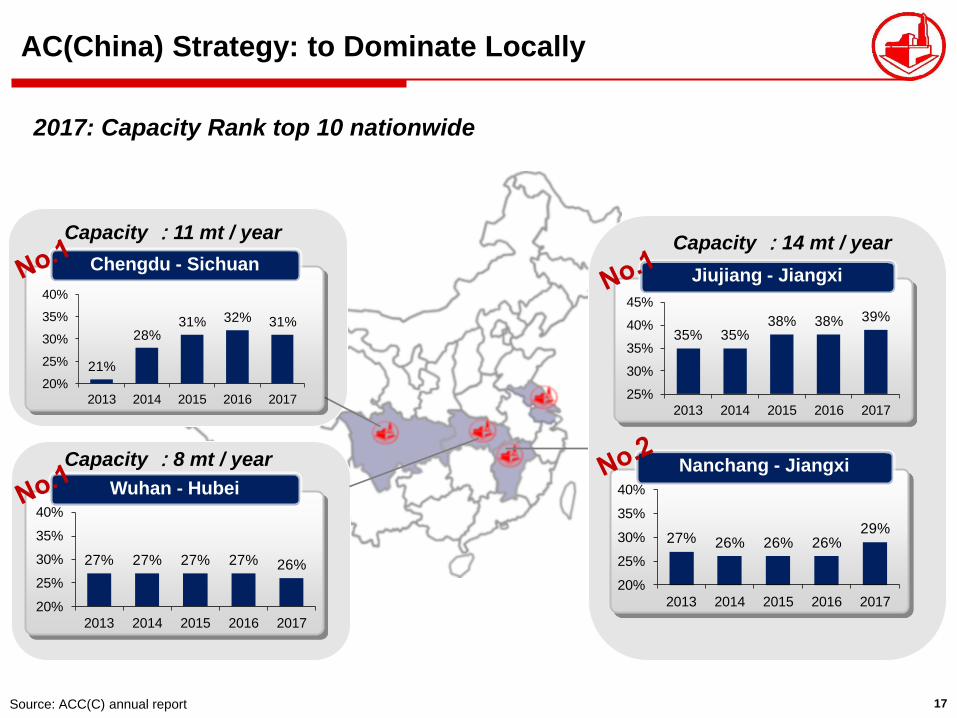
AC(China) Strategy: to Dominate Locally
2017: Capacity Rank top 10 nationwide
Source: ACC(C) annual report
Chengdu - Sichuan
Capacity :11 mt / year
Wuhan - Hubei
Capacity :8 mt / year Nanchang - Jiangxi
Jiujiang - Jiangxi
Capacity :14 mt / year
21%
28%31% 32% 31%
20%
25%
30%
35%
40%
2013 2014 2015 2016 2017
27% 27% 27% 27% 26%
20%
25%
30%
35%
40%
2013 2014 2015 2016 2017
35% 35%38% 38% 39%
25%
30%
35%
40%
45%
2013 2014 2015 2016 2017
27% 26% 26% 26%29%
20%
25%
30%
35%
40%
2013 2014 2015 2016 2017
18
Taiwan Market Overview
19
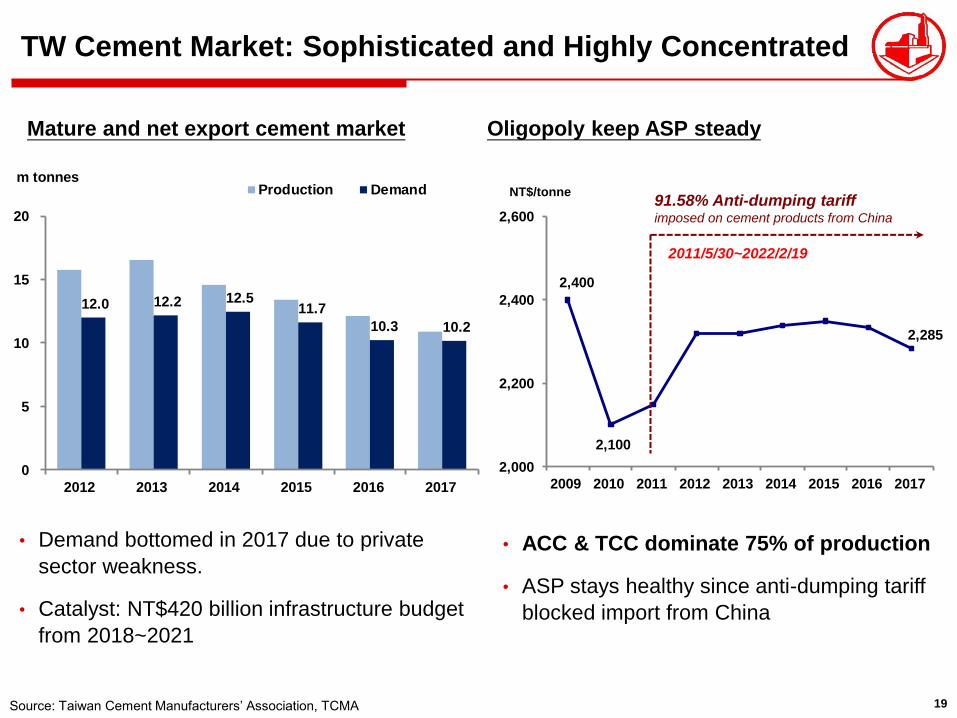
2,400
2,100
2,285
2,000
2,200
2,400
2,600
2009 2010 2011 2012 2013 2014 2015 2016 2017
NT$/tonne
TW Cement Market: Sophisticated and Highly Concentrated
• ACC & TCC dominate 75% of production
• ASP stays healthy since anti-dumping tariff
blocked import from China
Source: Taiwan Cement Manufacturers’ Association, TCMA
Mature and net export cement market Oligopoly keep ASP steady
91.58% Anti-dumping tariff imposed on cement products from China
2011/5/30~2022/2/19
• Demand bottomed in 2017 due to private
sector weakness.
• Catalyst: NT$420 billion infrastructure budget
from 2018~2021
12.0 12.2 12.5 11.7
10.3 10.2
0
5
10
15
20
2012 2013 2014 2015 2016 2017
m tonnesProduction Demand
20
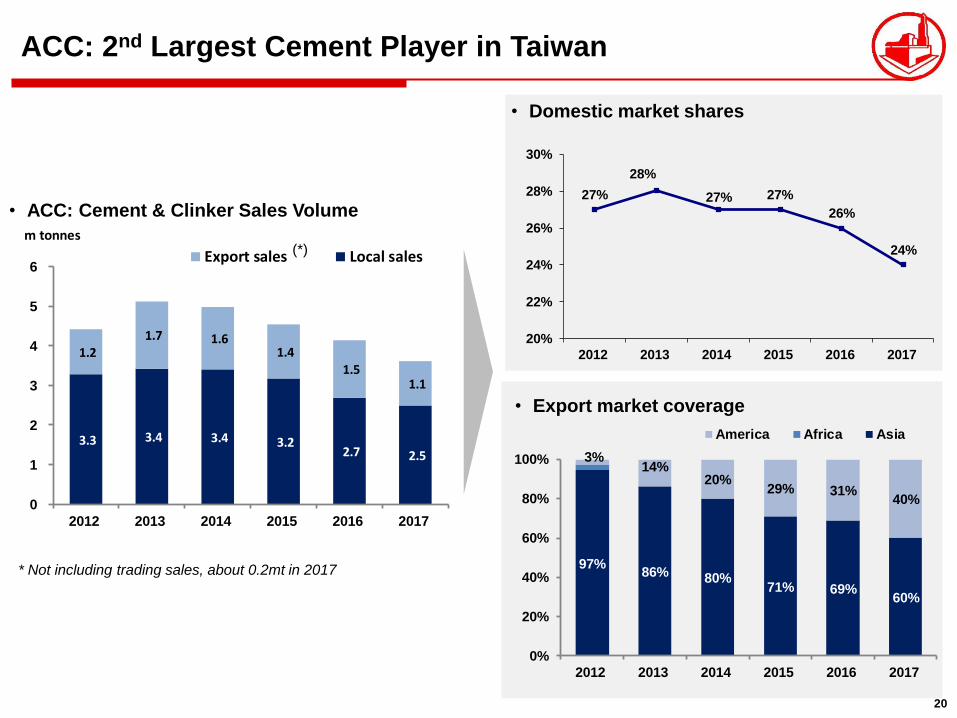
ACC: 2nd Largest Cement Player in Taiwan
• ACC: Cement & Clinker Sales Volume
* Not including trading sales, about 0.2mt in 2017
• Domestic market shares
(*)
• Export market coverage
3.3 3.4 3.4 3.2 2.7 2.5
1.2 1.7 1.6
1.4 1.5
1.1
0
1
2
3
4
5
6
2012 2013 2014 2015 2016 2017
m tonnes
Export sales Local sales
27%
28%
27% 27%
26%
24%
20%
22%
24%
26%
28%
30%
2012 2013 2014 2015 2016 2017
97%86% 80%
71% 69%60%
3%14%
20%29% 31%
40%
0%
20%
40%
60%
80%
100%
2012 2013 2014 2015 2016 2017
America Africa Asia
21
Dividend & Financials
22
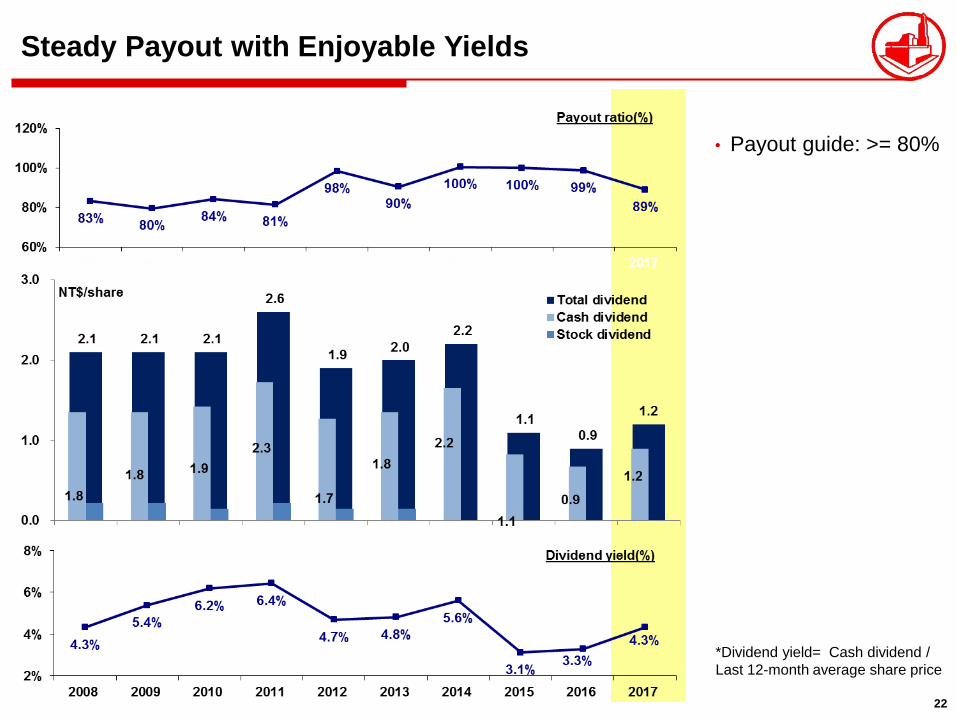
Steady Payout with Enjoyable Yields
*Dividend yield= Cash dividend /
Last 12-month average share price
• Payout guide: >= 80%
23
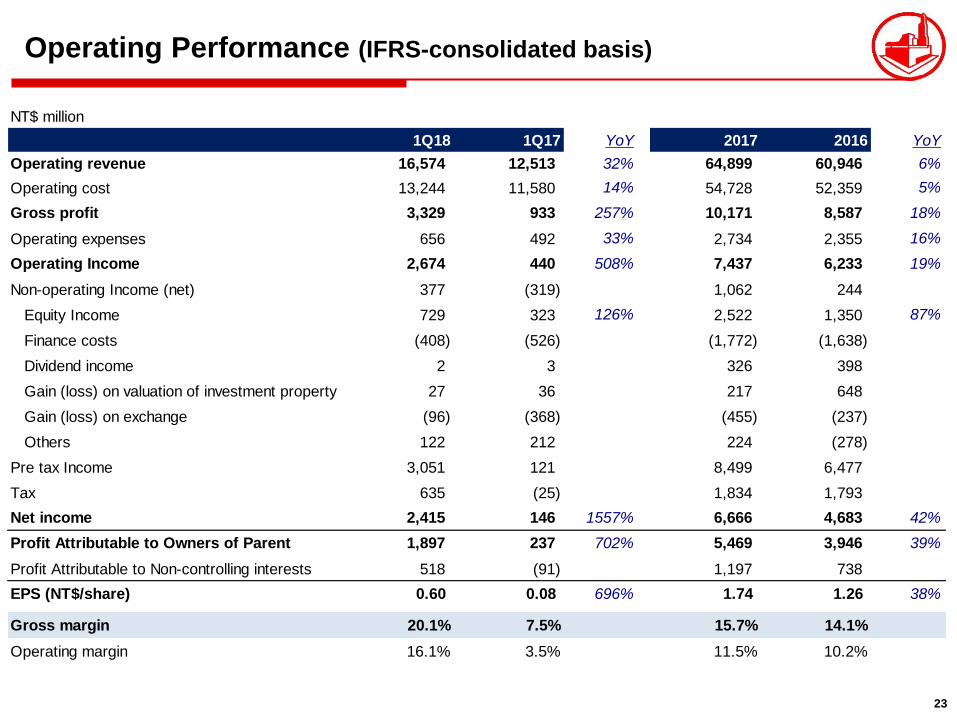
Operating Performance (IFRS-consolidated basis)
NT$ million
1Q18 1Q17 YoY 2017 2016 YoY
Operating revenue 16,574 12,513 32% 64,899 60,946 6%
Operating cost 13,244 11,580 14% 54,728 52,359 5%
Gross profit 3,329 933 257% 10,171 8,587 18%
Operating expenses 656 492 33% 2,734 2,355 16%
Operating Income 2,674 440 508% 7,437 6,233 19%
Non-operating Income (net) 377 (319) 1,062 244
Equity Income 729 323 126% 2,522 1,350 87%
Finance costs (408) (526) (1,772) (1,638)
Dividend income 2 3 326 398
Gain (loss) on valuation of investment property 27 36 217 648
Gain (loss) on exchange (96) (368) (455) (237)
Others 122 212 224 (278)
Pre tax Income 3,051 121 8,499 6,477
Tax 635 (25) 1,834 1,793
Net income 2,415 146 1557% 6,666 4,683 42%
Profit Attributable to Owners of Parent 1,897 237 702% 5,469 3,946 39%
Profit Attributable to Non-controlling interests 518 (91) 1,197 738
EPS (NT$/share) 0.60 0.08 696% 1.74 1.26 38%
Gross margin 20.1% 7.5% 15.7% 14.1%
Operating margin 16.1% 3.5% 11.5% 10.2%
24
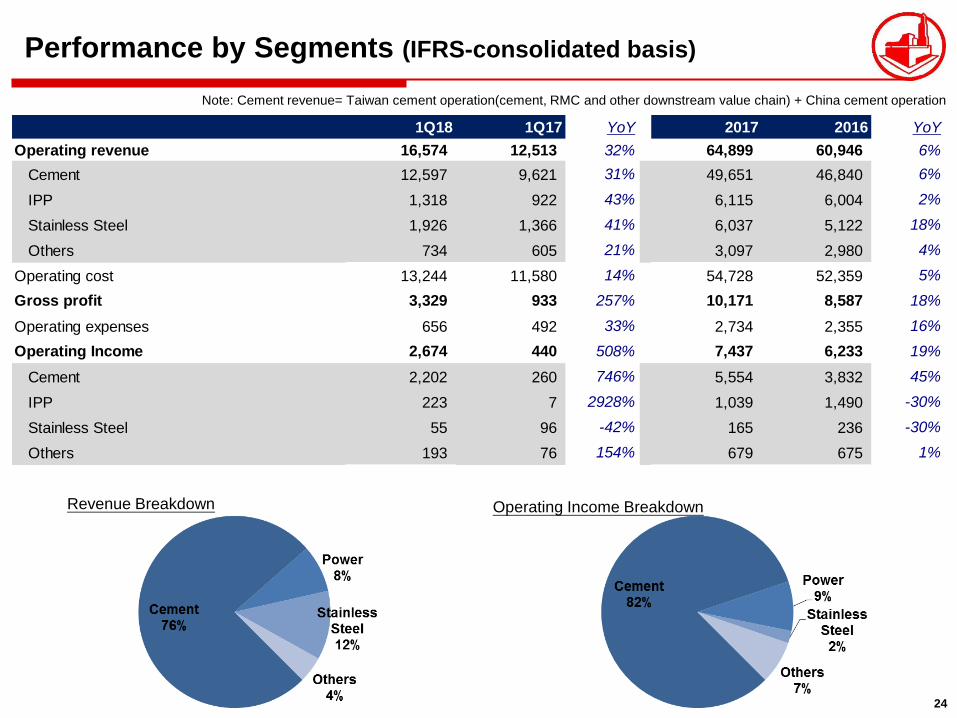
Performance by Segments (IFRS-consolidated basis)
Note: Cement revenue= Taiwan cement operation(cement, RMC and other downstream value chain) + China cement operation
Revenue Breakdown Operating Income Breakdown
1Q18 1Q17 YoY 2017 2016 YoY
Operating revenue 16,574 12,513 32% 64,899 60,946 6%
Cement 12,597 9,621 31% 49,651 46,840 6%
IPP 1,318 922 43% 6,115 6,004 2%
Stainless Steel 1,926 1,366 41% 6,037 5,122 18%
Others 734 605 21% 3,097 2,980 4%
Operating cost 13,244 11,580 14% 54,728 52,359 5%
Gross profit 3,329 933 257% 10,171 8,587 18%
Operating expenses 656 492 33% 2,734 2,355 16%
Operating Income 2,674 440 508% 7,437 6,233 19%
Cement 2,202 260 746% 5,554 3,832 45%
IPP 223 7 2928% 1,039 1,490 -30%
Stainless Steel 55 96 -42% 165 236 -30%
Others 193 76 154% 679 675 1%
25
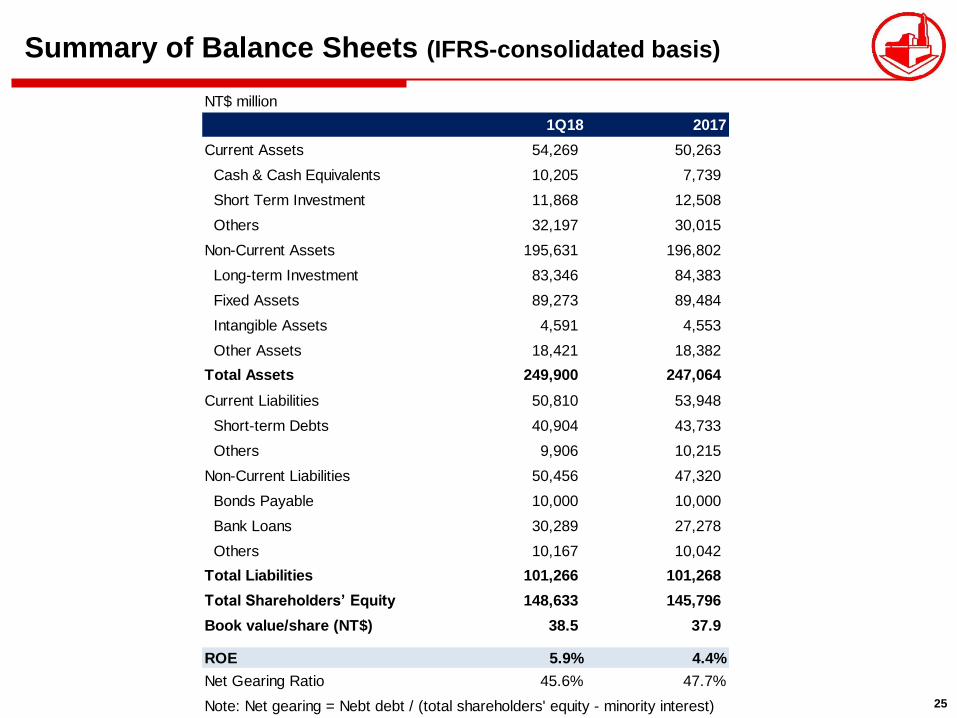
Summary of Balance Sheets (IFRS-consolidated basis)
NT$ million
1Q18 2017
Current Assets 54,269 50,263
Cash & Cash Equivalents 10,205 7,739
Short Term Investment 11,868 12,508
Others 32,197 30,015
Non-Current Assets 195,631 196,802
Long-term Investment 83,346 84,383
Fixed Assets 89,273 89,484
Intangible Assets 4,591 4,553
Other Assets 18,421 18,382
Total Assets 249,900 247,064
Current Liabilities 50,810 53,948
Short-term Debts 40,904 43,733
Others 9,906 10,215
Non-Current Liabilities 50,456 47,320
Bonds Payable 10,000 10,000
Bank Loans 30,289 27,278
Others 10,167 10,042
Total Liabilities 101,266 101,268
Total Shareholders’ Equity 148,633 145,796
Book value/share (NT$) 38.5 37.9
ROE 5.9% 4.4%
Net Gearing Ratio 45.6% 47.7%
Note: Net gearing = Nebt debt / (total shareholders' equity - minority interest)
26
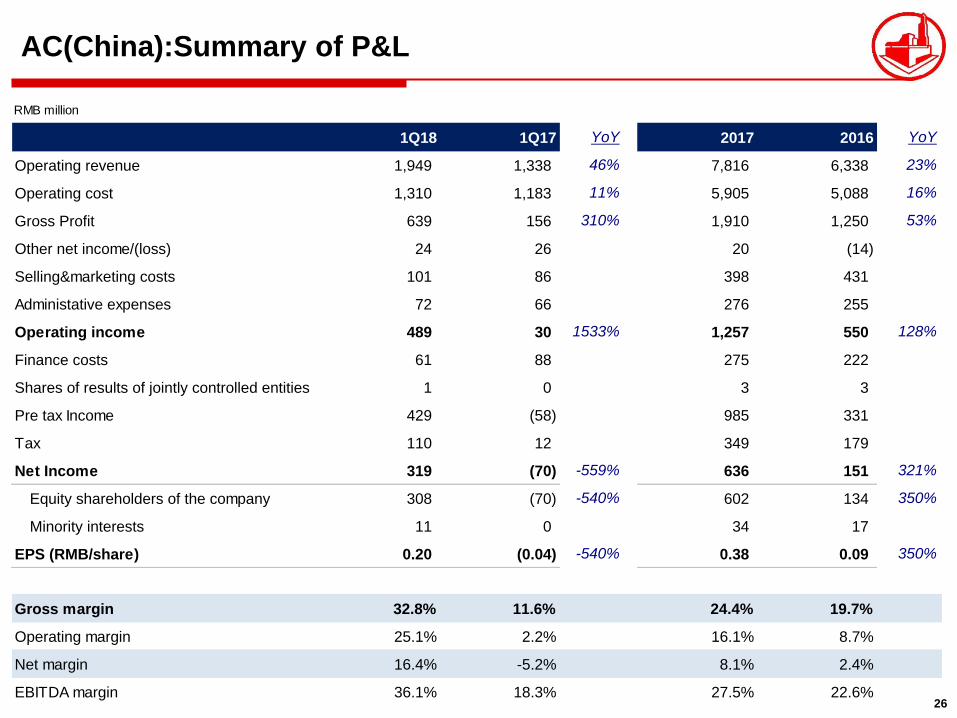
AC(China):Summary of P&L
RMB million
1Q18 1Q17 YoY 2017 2016 YoY
Operating revenue 1,949 1,338 46% 7,816 6,338 23%
Operating cost 1,310 1,183 11% 5,905 5,088 16%
Gross Profit 639 156 310% 1,910 1,250 53%
Other net income/(loss) 24 26 20 (14)
Selling&marketing costs 101 86 398 431
Administative expenses 72 66 276 255
Operating income 489 30 1533% 1,257 550 128%
Finance costs 61 88 275 222
Shares of results of jointly controlled entities 1 0 3 3
Pre tax Income 429 (58) 985 331
Tax 110 12 349 179
Net Income 319 (70) -559% 636 151 321%
Equity shareholders of the company 308 (70) -540% 602 134 350%
Minority interests 11 0 34 17
EPS (RMB/share) 0.20 (0.04) -540% 0.38 0.09 350%
Gross margin 32.8% 11.6% 24.4% 19.7%
Operating margin 25.1% 2.2% 16.1% 8.7%
Net margin 16.4% -5.2% 8.1% 2.4%
EBITDA margin 36.1% 18.3% 27.5% 22.6%
27
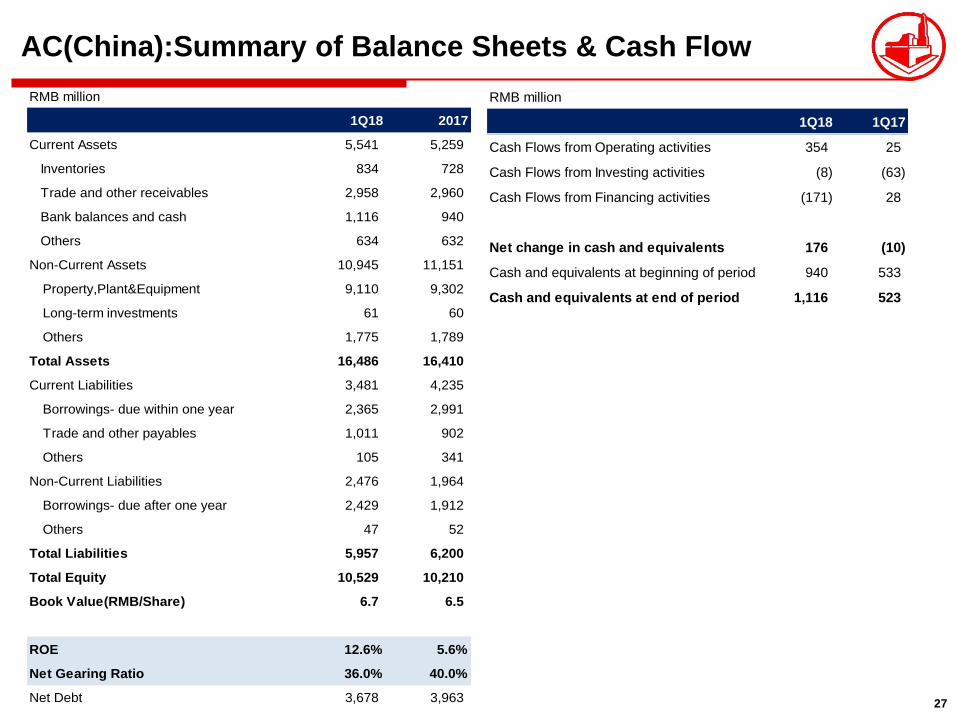
RMB million
1Q18 2017
Current Assets 5,541 5,259
Inventories 834 728
Trade and other receivables 2,958 2,960
Bank balances and cash 1,116 940
Others 634 632
Non-Current Assets 10,945 11,151
Property,Plant&Equipment 9,110 9,302
Long-term investments 61 60
Others 1,775 1,789
Total Assets 16,486 16,410
Current Liabilities 3,481 4,235
Borrowings- due within one year 2,365 2,991
Trade and other payables 1,011 902
Others 105 341
Non-Current Liabilities 2,476 1,964
Borrowings- due after one year 2,429 1,912
Others 47 52
Total Liabilities 5,957 6,200
Total Equity 10,529 10,210
Book Value(RMB/Share) 6.7 6.5
ROE 12.6% 5.6%
Net Gearing Ratio 36.0% 40.0%
Net Debt 3,678 3,963
AC(China):Summary of Balance Sheets & Cash Flow
RMB million
1Q18 1Q17
Cash Flows from Operating activities 354 25
Cash Flows from Investing activities (8) (63)
Cash Flows from Financing activities (171) 28
Net change in cash and equivalents 176 (10)
Cash and equivalents at beginning of period 940 533
Cash and equivalents at end of period 1,116 523

28
CSR Achievement
29
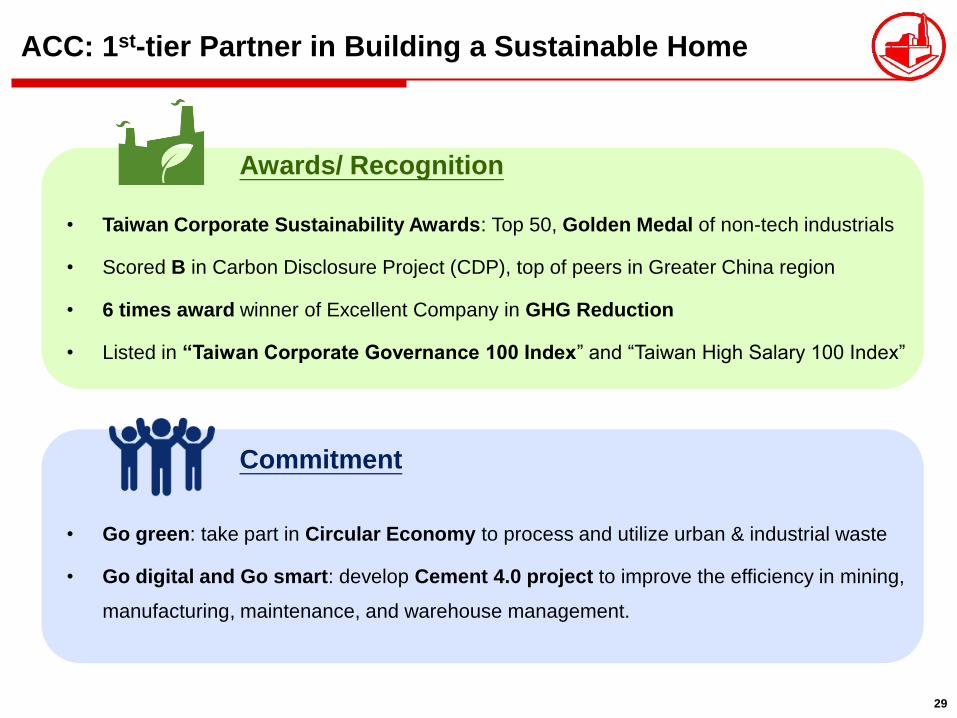
ACC: 1st-tier Partner in Building a Sustainable Home
• Taiwan Corporate Sustainability Awards: Top 50, Golden Medal of non-tech industrials
• Scored B in Carbon Disclosure Project (CDP), top of peers in Greater China region
• 6 times award winner of Excellent Company in GHG Reduction
• Listed in “Taiwan Corporate Governance 100 Index” and “Taiwan High Salary 100 Index”
• Go green: take part in Circular Economy to process and utilize urban & industrial waste
• Go digital and Go smart: develop Cement 4.0 project to improve the efficiency in mining,
manufacturing, maintenance, and warehouse management.
Awards/ Recognition
Commitment
30
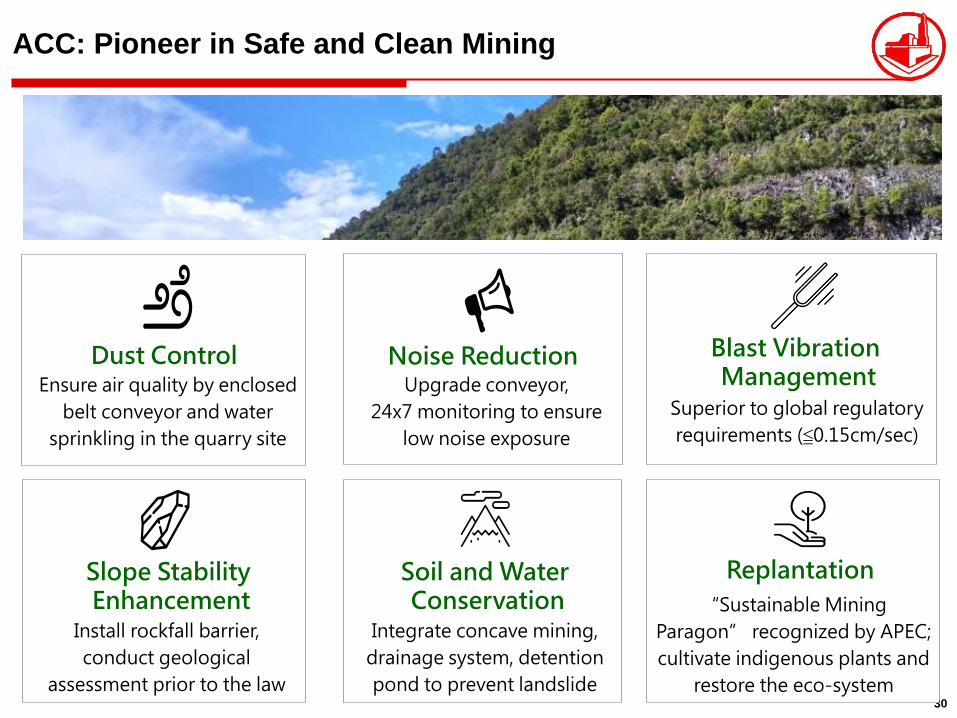
Dust Control Ensure air quality by enclosed
belt conveyor and water
sprinkling in the quarry site
Slope Stability Enhancement
Install rockfall barrier,
conduct geological
assessment prior to the law
Noise Reduction Upgrade conveyor,
24x7 monitoring to ensure
low noise exposure
Soil and Water Conservation
Integrate concave mining,
drainage system, detention
pond to prevent landslide
Replantation
“Sustainable Mining
Paragon” recognized by APEC;
cultivate indigenous plants and
restore the eco-system
Blast Vibration Management
Superior to global regulatory
requirements (≦0.15cm/sec)
ACC: Pioneer in Safe and Clean Mining

31
Capacity in Jiangxi, China

32
Capacity in Jiangxi, China Capacity in Hualien, Taiwan
33
Thank you [email protected]
http:// www.acc.com.tw
Q&A: Mining Concerns
Videos: ACC Eco-friendly
Achievements
Download: ACC Financials