Spiral systolic blood flow in the ascending aorta and ... · Spiral systolic blood flow in the...
14
Journal of Cardiology (2010) 56, 97—110 available at www.sciencedirect.com journal homepage: www.elsevier.com/locate/jjcc Original article Spiral systolic blood flow in the ascending aorta and aortic arch analyzed by echo-dynamography Motonao Tanaka (MD, FJCC) a,∗ , Tsuguya Sakamoto (MD, FJCC) b , Shigeo Sugawara (MD, FJCC) a , Hiroyuki Nakajima (RMS) a , Takeyoshi Kameyama (MD) a , Yoshiaki Katahira (MD) a , Shigeo Ohtsuki (PhD) c , Hiroshi Kanai (PhD) d a Cardiovascular Center, Tohoku Welfare Pension Hospital, Fukumuro 1-12-1, Miyagino-ku, Sendai, 983-0005, Japan b Hanzohmon Hospital, Kojimachi 1-14, Chiyoda-ku, Tokyo 102-0083, Japan c Institute of Medical Ultrasound Technology, Yokoyama 2-12-15, Sagamihara252-0242, Japan d Department of Electrical Engineering, Tohoku University, Aramaki-Aoba6-6-05, Aoba-ku, Sendai 980-8579, Japan Received 9 February 2010; accepted 8 March 2010 Available online 13 May 2010 KEYWORDS Flow structure; Twisted spiral flow; Vorticity; Changing acceleration of the flow direction; Velocity vector distribution; Ascending aorta; Echo-dynamography Summary Using echo-dynamography, systolic blood flow structure in the ascending aorta and aortic arch was investigated in 10 healthy volunteers. The blood flow structure was analyzed based on the two-dimensional (2D) and 1D velocity vector distributions, changing acceleration of flow direction (CAFD), vorticity distribution, and Doppler pressure distribution. To justify the results obtained in humans, in vitro experiments were done using straight and curved tube models of 20mm diameter. The distribution of the CAFD showed a spiral staircase pattern along the flow axis line. In addition, the changes in the velocity profile in the short-axis direction, 2D distribution of the vorticity, and velocity vector distribution on the aortic cross-section plane, all confirmed the presence of systolic twisted spiral flow rotating clockwise toward the peripheral part of the ascending aorta. The rotation cycle of this spiral flow correlated inversely with the maximum velocity of the aortic flow, so that this cycle was shorter in early systole and longer in late systole. The model experiments showed similar results. The spiral flow seemed to be produced by several factors: (i) anterior shift of the direction of ejected blood flow due to the anterior displacement of the projection of the aorta; (ii) accelerated high pressure flow ejected antero-upward; (iii) inertia resistance at the peripheral boundary of the sinus of Valsalva; and (iv) reflection caused by the concave spherical structure of the inner surface of the basal part of the aorta. ∗ Corresponding author. Tel.: +81 22 719 5161; fax: +81 22 719 5166. E-mail address: [email protected] (M. Tanaka). 0914-5087/$ — see front matter © 2010 Japanese College of Cardiology. Published by Elsevier Ireland Ltd. All rights reserved. doi:10.1016/j.jjcc.2010.03.008
Transcript of Spiral systolic blood flow in the ascending aorta and ... · Spiral systolic blood flow in the...
Journal of Cardiology (2010) 56, 97—110
avai lab le at www.sc iencedi rec t .com
journa l homepage: www.e lsev ier .com/ locate / j j cc
Original article
Spiral systolic blood flow in the ascending aorta andaortic arch analyzed by echo-dynamography
Motonao Tanaka (MD, FJCC)a,∗, Tsuguya Sakamoto (MD, FJCC)b,Shigeo Sugawara (MD, FJCC)a, Hiroyuki Nakajima (RMS)a,Takeyoshi Kameyama (MD)a, Yoshiaki Katahira (MD)a,Shigeo Ohtsuki (PhD)c, Hiroshi Kanai (PhD)d
a Cardiovascular Center, Tohoku Welfare Pension Hospital, Fukumuro 1-12-1, Miyagino-ku, Sendai, 983-0005, Japanb Hanzohmon Hospital, Kojimachi 1-14, Chiyoda-ku, Tokyo 102-0083, Japanc Institute of Medical Ultrasound Technology, Yokoyama 2-12-15, Sagamihara252-0242, Japand Department of Electrical Engineering, Tohoku University, Aramaki-Aoba6-6-05, Aoba-ku, Sendai 980-8579, Japan
Received 9 February 2010; accepted 8 March 2010Available online 13 May 2010
KEYWORDSFlow structure;Twisted spiral flow;Vorticity;Changingacceleration of theflow direction;Velocity vectordistribution;Ascending aorta;Echo-dynamography
Summary Using echo-dynamography, systolic blood flow structure in the ascending aorta andaortic arch was investigated in 10 healthy volunteers. The blood flow structure was analyzedbased on the two-dimensional (2D) and 1D velocity vector distributions, changing accelerationof flow direction (CAFD), vorticity distribution, and Doppler pressure distribution. To justifythe results obtained in humans, in vitro experiments were done using straight and curved tubemodels of 20 mm diameter.
The distribution of the CAFD showed a spiral staircase pattern along the flow axis line. Inaddition, the changes in the velocity profile in the short-axis direction, 2D distribution of thevorticity, and velocity vector distribution on the aortic cross-section plane, all confirmed thepresence of systolic twisted spiral flow rotating clockwise toward the peripheral part of theascending aorta.
The rotation cycle of this spiral flow correlated inversely with the maximum velocity of the
aortic flow, so that this cycle was shorter in early systole and longer in late systole. The modelexperiments showed similar results.The spiral flow seemed to be produced by several factors: (i) anterior shift of the directionto the anterior displacement of the projection of the aorta; (ii)
of ejected blood flow dueaccelerated high pressure flow ejected antero-upward; (iii) inertia resistance at the peripheralboundary of the sinus of Valsalva; and (iv) reflection caused by the concave spherical structureof the inner surface of the basal part of the aorta.
∗ Corresponding author. Tel.: +81 22 719 5161; fax: +81 22 719 5166.E-mail address: [email protected] (M. Tanaka).
0914-5087/$ — see front matter © 2010 Japanese College of Cardiology. Published by Elsevier Ireland Ltd. All rights reserved.doi:10.1016/j.jjcc.2010.03.008
98 M. Tanaka et al.
Because the main spiral flow axis line nearly coincided with the center line of the aorta, it isconcluded that the occurrence of the spiral flow plays an important role in maintaining the bloodflow direction passing through the cylindrical curved aortic arch and thus in keeping the most
in diardi
I
Thecs
de[bo
ctbai
uic
S
S
Ty
M
AvAmCwwrogvas
tmddDtb
b[ito
lati
em
(
(
MoefpeicMeeiqdifl
dotude of the acceleration vector was indicated by the lengthof a blue line, and the direction was shown by the inclination
effective ejection as well as© 2010 Japanese College of C
ntroduction
he structure of the accelerated blood flow accompanyingigh pressure in the ascending aorta during the very shortjection period seems to be complicated because of the spe-ific truncal anatomy of the aorta and the cylindrical curvedtructure of the inner surface of the aortic arch.
Accordingly, the blood flow structure and the flowynamics have been of interest in both clinical [1,2] andxperimental [3—5] fields including computer simulation6,7]. However, the flow structure in the aorta in a humaneing [8] has not been definitely clarified because of the lackf a suitable technique for measuring the flow structure.
Recently, magnetic resonance imaging (MRI) [9] and theolor Doppler method [10] have been proposed to measurehe aortic flow. The former disclosed the helical flow [9],ut the spatial resolution (ca 8—10 mm) is not enough forccurate measurement. The ultrasonic method has difficultyn obtaining the velocity as the vector.
In the present study, echo-dynamography [9—12] wastilized to investigate the flow structure in the ascend-ng aorta and aortic arch and to disclose the specificharacteristics.
ubjects and methods
ubjects
en presumably healthy adult volunteers aged from 20 to 50ears were the subjects of this study.
ethods
nalysis of the human blood flow structure in the leftentricle and aorta: in vivo studycquisition of the flow velocity data by ultrasound. Com-ercially available ultrasonic equipment (model 6500, Alokao., Tokyo, Japan) was used. The ultrasonic frequencyas 3 MHz, and supine or left lateral decubitus positionas selected. Two-dimensional (2D) echocardiograms were
ecorded whenever 2D sector scan with transthoracic apicalr parasternal approach was required. The most advanta-eous long axis was selected to analyze blood flow in theentricle, and the longitudinal section to the ascendingorta including the anterior part of the aortic arch was alsoelected.
After the 2D Doppler velocity data were recorded, allhe data were transferred to a personal computer throughagneto-optical disk memory. The Doppler flow velocity
ata were processed off-line by using software for echo-ynamography [11].etection of blood flow velocity vector and its representa-ion. The orthogonal velocity component to the ultrasoniceam direction was deduced from the Doppler velocity dataoMdflw
spersing the shear stress in the aortic wall.ology. Published by Elsevier Ireland Ltd. All rights reserved.
y using the flow function theory [11,13] of fluid mechanics14]. Then, the 2D distribution of flow velocity vector in var-ous points was calculated from the 2 velocity components,he one that was in the beam direction and the other, in therthogonal direction.
The magnitude of the velocity vector was shown by theength of a yellow line and the standard length of the vectors a reference (20 cm/s etc.) at the left upper corner ofhe screen. The direction of the vector was indicated by thenclination of a yellow line with a red mark at the tip.
The blood flow velocity vector overlapped with 2Dchocardiogram was depicted by the following 5 displayanners.
(i) 2D distribution of the vector overlapped with 2Dechocardiogram (Fig. 1, left),
(ii) 1D distribution of the vector overlapped with 2Dechocardiogram to display (a) and (b); i.e.(a) velocity vector on the central axis line of the aorta
displayed perpendicularly to the center line of theaorta (Fig. 2, right),
(b) the vector on the central axis line along this line(Fig. 2, left).
iii) 2D distribution of the velocity vector on the short-axiscross-section plane (Fig. 1, right)
iv) velocity profile in the short-axis direction of the aorta(Fig. 3)
easurement of the vorticity and its representation. Tobserve the various eddy components involved in thejected blood flow, the vorticity (ω) [14] was calculatedrom the rotation of the flow velocity vector in manylaces on the scanning plane and overlapped with 2Dchocardiogram by color (Fig. 6, left). The positive vortic-ty was shown by warm color and the negative one by coldolor.easurement of the 2D distribution of the changing accel-ration of flow direction. The information regarding theffect of the shape and structure of the aortic pathway tonstantaneously changing blood flow direction was obtaineduantitatively to estimate the flow structure and flowynamics. The product of the vorticity (ω) and the veloc-ty vector (v), which is defined as ‘‘changing acceleration ofow direction (CAFD) (v · ω)’’ was calculated [15].
From the 2D distribution of this acceleration and the 1Distribution in the central line of the aorta, characteristicsf the flow structure in the aorta were analyzed. The magni-
f the vector having a red mark at the tip.easurement of the Doppler pressure distribution. Toeduce the dynamic pressure from the distribution of theow velocity data, the Navier—Stokes’ equation of motionas applied for processing the Doppler velocity data, and
Spiral systolic blood flow in the ascending aorta and aortic arch 99
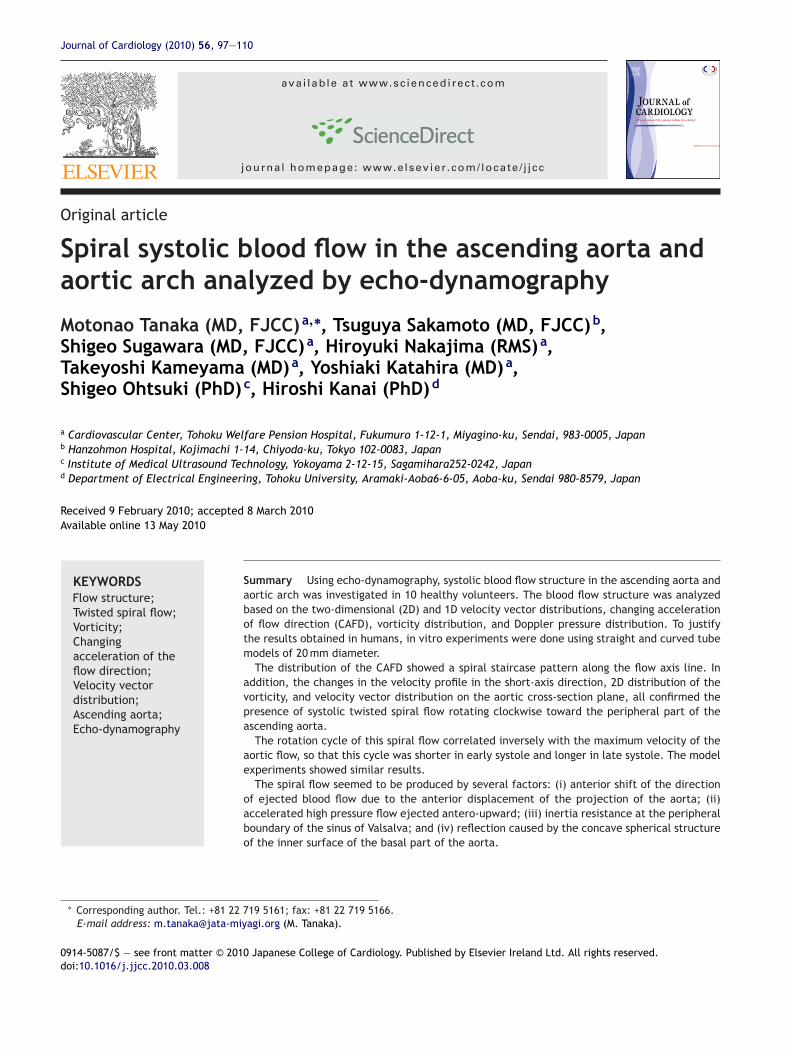
Figure 1 Left: Two-dimensional (2D) mapping of flow velocity vector on the longitudinal section plane of the ascending aortaduring systole in a healthy adult. The timing is shown on the ECG by a yellow line and the magnitude of the vector is indicated bythe length of the yellow line. The direction is displayed by the inclination of yellow lines with a red mark at the tip. Reference ofthe vector is shown by the yellow bar at the left upper corner of the figure. AO, aorta; LA, left atrium; ES, early systolic phase; MS,mid-systolic phase; LS, late systolic phase. Right: 2D mapping of the velocity vector on the cross-section of the ascending aorta.The section plane set in the short-axis direction corresponding to the white line (S) shown in Fig. 1 ES. Clockwise rotation of the
ctionferre
vector observed. Thick arrow (ES, right) indicates the flow direof the references to color in this figure legend, the reader is re
the theory of Helmholtz was applied to transfer fromthe velocity information as a vector value to the pres-sure information as a scalar value [16,17]. The latter wasdemonstrated by color overlapped with 2D echocardiogram.
Pc
d
. R, reversal flow appeared in late systole. (For interpretationd to the web version of the article.)
ositive component of the pressure was displayed with warmolor and negative one by cold color.
Detailed pressure distribution was estimated by the 1Display of a red line graph (Fig. 6, right).
100 M. Tanaka et al.
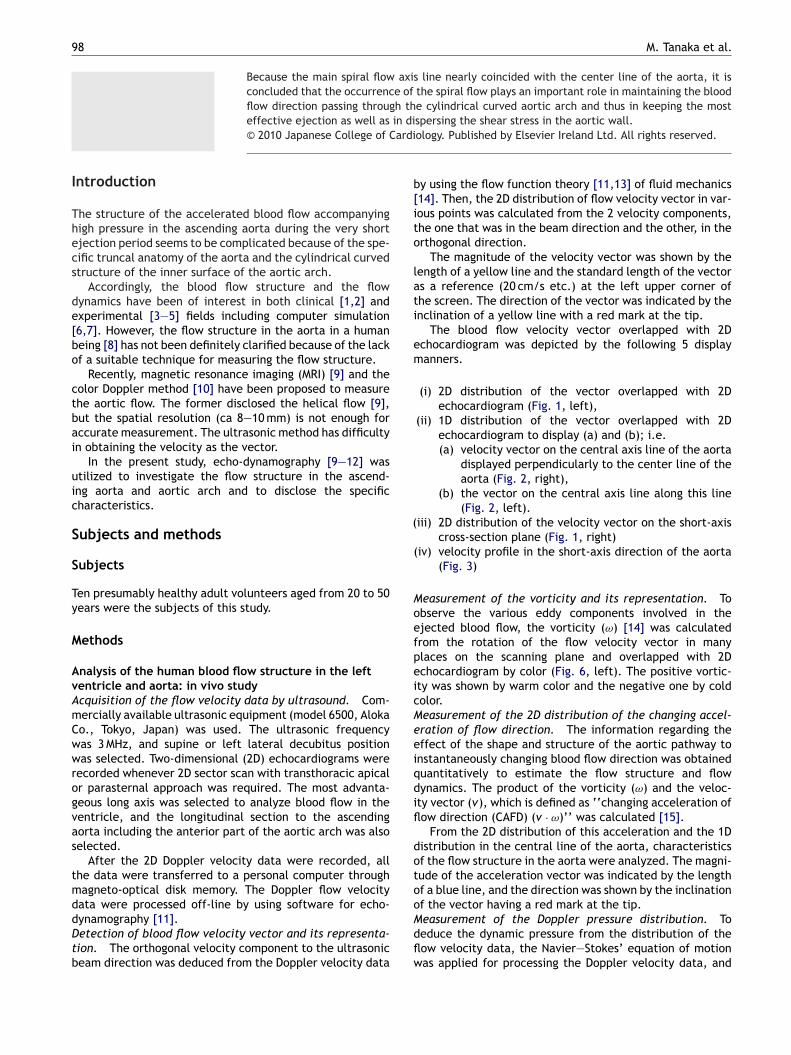
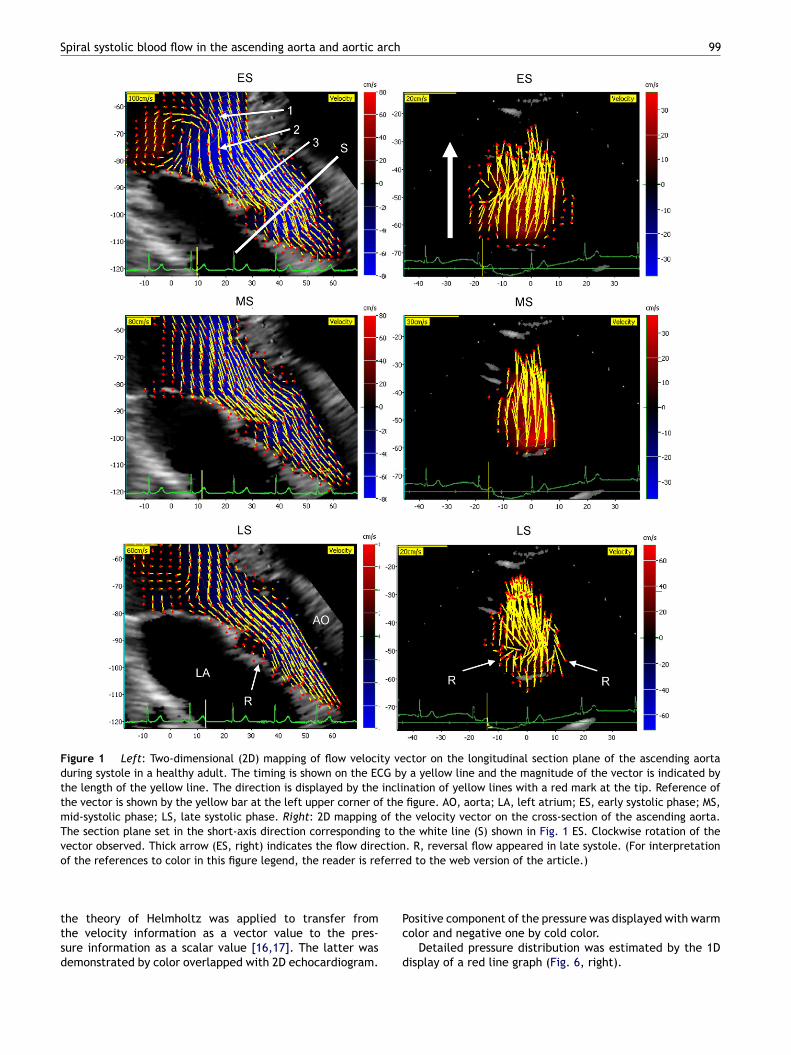
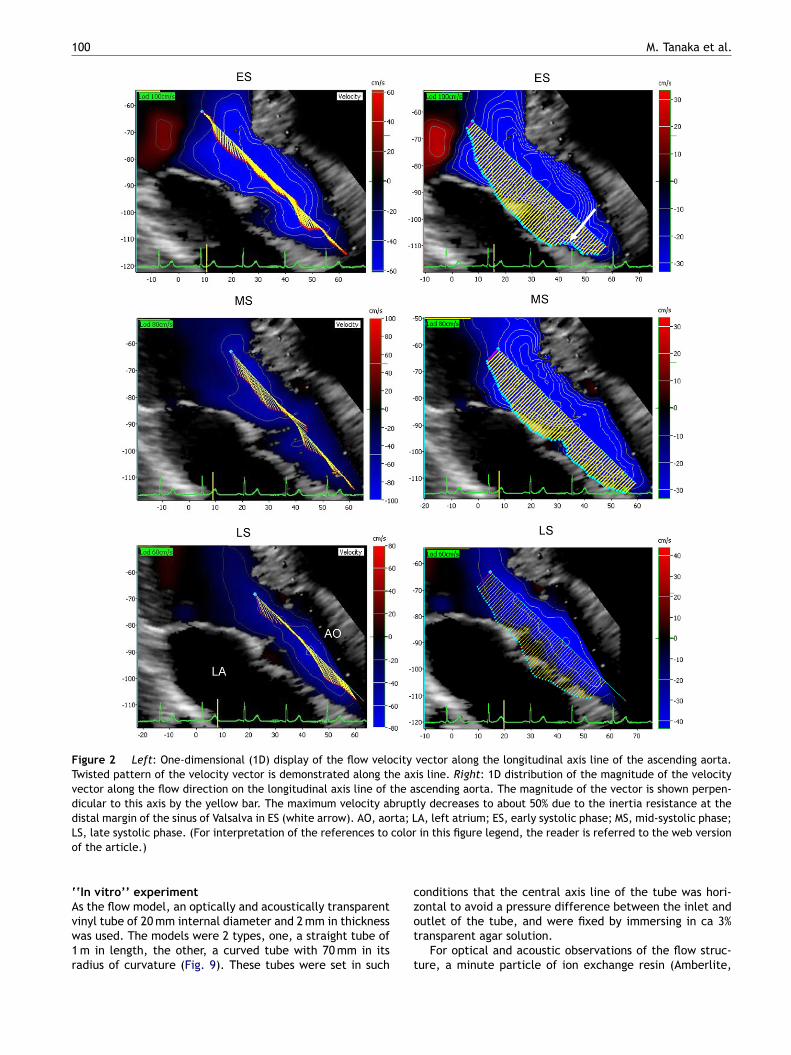
Figure 2 Left: One-dimensional (1D) display of the flow velocity vector along the longitudinal axis line of the ascending aorta.Twisted pattern of the velocity vector is demonstrated along the axis line. Right: 1D distribution of the magnitude of the velocityvector along the flow direction on the longitudinal axis line of the ascending aorta. The magnitude of the vector is shown perpen-dicular to this axis by the yellow bar. The maximum velocity abruptly decreases to about 50% due to the inertia resistance at thedistal margin of the sinus of Valsalva in ES (white arrow). AO, aorta; LA, left atrium; ES, early systolic phase; MS, mid-systolic phase;L coloro
‘Avw1r
c
S, late systolic phase. (For interpretation of the references tof the article.)
‘In vitro’’ experiment
s the flow model, an optically and acoustically transparentinyl tube of 20 mm internal diameter and 2 mm in thicknessas used. The models were 2 types, one, a straight tube ofm in length, the other, a curved tube with 70 mm in itsadius of curvature (Fig. 9). These tubes were set in such
zot
t
in this figure legend, the reader is referred to the web version
onditions that the central axis line of the tube was hori-
ontal to avoid a pressure difference between the inlet andutlet of the tube, and were fixed by immersing in ca 3%ransparent agar solution.For optical and acoustic observations of the flow struc-ure, a minute particle of ion exchange resin (Amberlite,
Spiral systolic blood flow in the ascending aorta and aortic arch 101
n at tferehase
pp
R
I
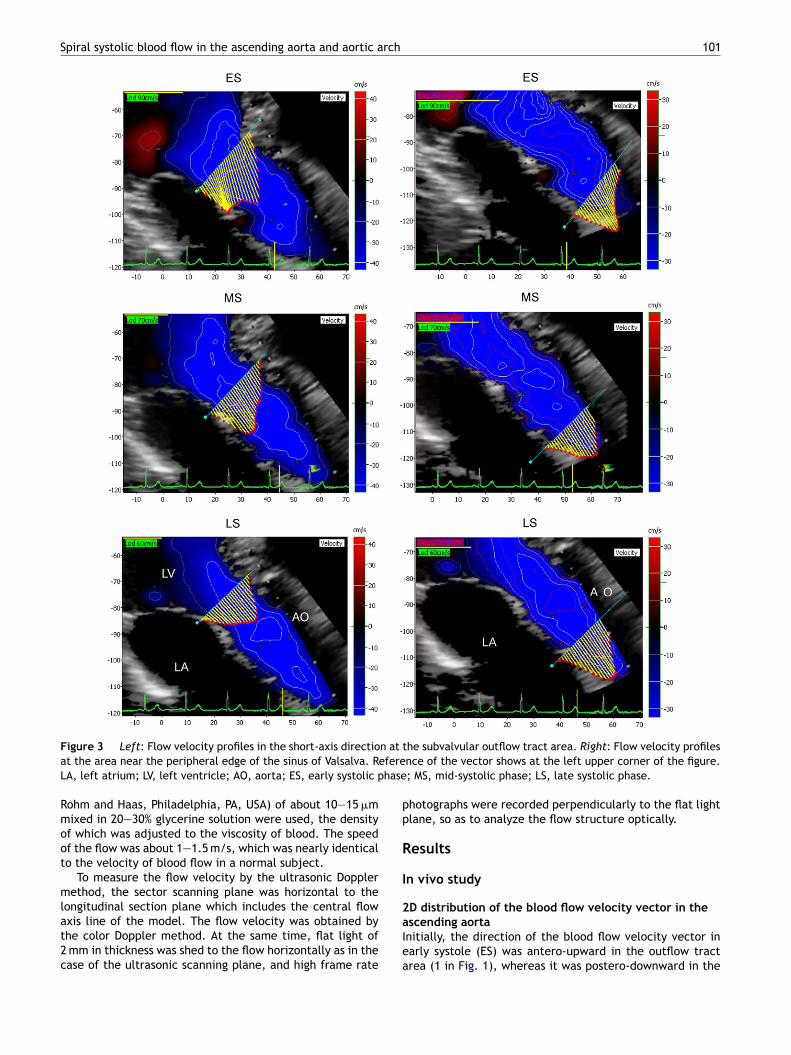
Figure 3 Left: Flow velocity profiles in the short-axis directioat the area near the peripheral edge of the sinus of Valsalva. ReLA, left atrium; LV, left ventricle; AO, aorta; ES, early systolic p
Rohm and Haas, Philadelphia, PA, USA) of about 10—15 �mmixed in 20—30% glycerine solution were used, the densityof which was adjusted to the viscosity of blood. The speedof the flow was about 1—1.5 m/s, which was nearly identicalto the velocity of blood flow in a normal subject.
To measure the flow velocity by the ultrasonic Dopplermethod, the sector scanning plane was horizontal to the
longitudinal section plane which includes the central flowaxis line of the model. The flow velocity was obtained bythe color Doppler method. At the same time, flat light of2 mm in thickness was shed to the flow horizontally as in thecase of the ultrasonic scanning plane, and high frame rate2aIea
he subvalvular outflow tract area. Right: Flow velocity profilesnce of the vector shows at the left upper corner of the figure.; MS, mid-systolic phase; LS, late systolic phase.
hotographs were recorded perpendicularly to the flat lightlane, so as to analyze the flow structure optically.
esults
n vivo study
D distribution of the blood flow velocity vector in thescending aortanitially, the direction of the blood flow velocity vector inarly systole (ES) was antero-upward in the outflow tractrea (1 in Fig. 1), whereas it was postero-downward in the
1
bappl
Fmoiitfst
02
asal area of the aorta (2 in Fig. 1), and then antero-upwardgain in the ascending aorta (3 in Fig. 1), resulting in a zigzagattern. About 100 ms later (in mid-systole, MS), this zigzagattern was nearly constant while it gradually subsided inate systole (LS).
clta
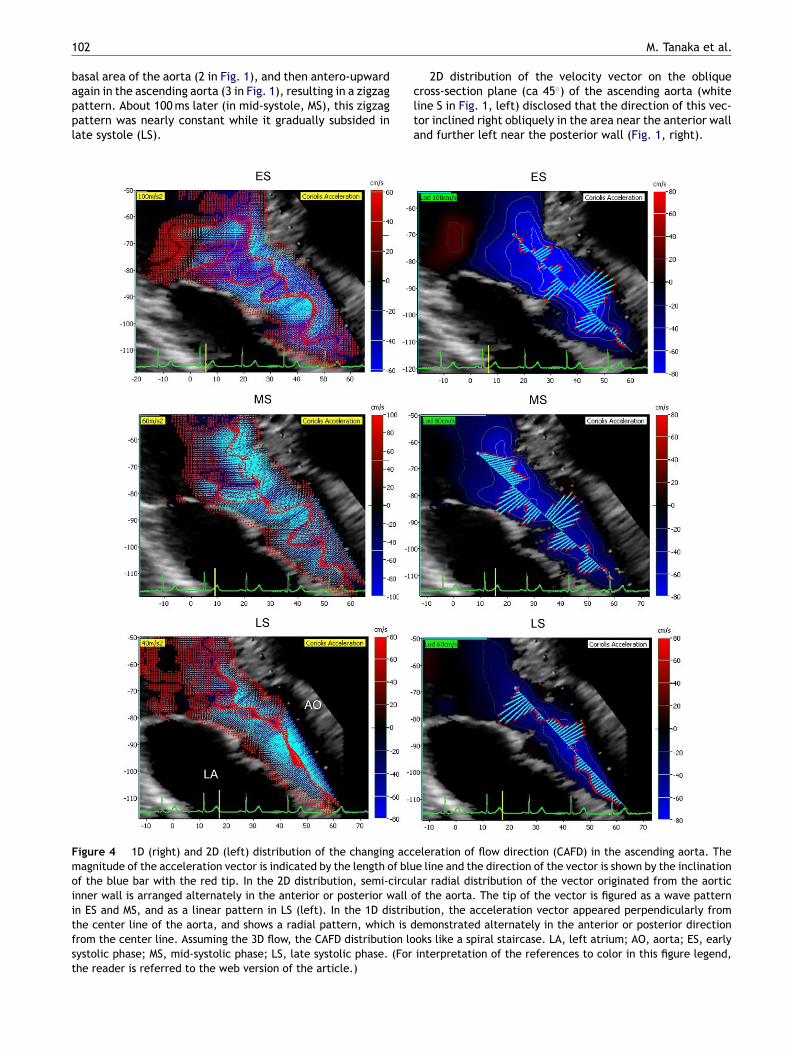
igure 4 1D (right) and 2D (left) distribution of the changing accagnitude of the acceleration vector is indicated by the length of blu
f the blue bar with the red tip. In the 2D distribution, semi-circulnner wall is arranged alternately in the anterior or posterior wall on ES and MS, and as a linear pattern in LS (left). In the 1D distribhe center line of the aorta, and shows a radial pattern, which is drom the center line. Assuming the 3D flow, the CAFD distribution loystolic phase; MS, mid-systolic phase; LS, late systolic phase. (Forhe reader is referred to the web version of the article.)
M. Tanaka et al.
2D distribution of the velocity vector on the obliqueross-section plane (ca 45◦) of the ascending aorta (whiteine S in Fig. 1, left) disclosed that the direction of this vec-or inclined right obliquely in the area near the anterior wallnd further left near the posterior wall (Fig. 1, right).
eleration of flow direction (CAFD) in the ascending aorta. Thee line and the direction of the vector is shown by the inclinationar radial distribution of the vector originated from the aorticf the aorta. The tip of the vector is figured as a wave patternution, the acceleration vector appeared perpendicularly fromemonstrated alternately in the anterior or posterior directionoks like a spiral staircase. LA, left atrium; AO, aorta; ES, earlyinterpretation of the references to color in this figure legend,
rch
TtIidEgTatrptto
Spiral systolic blood flow in the ascending aorta and aortic a
This confirmed the presence of the clockwise rotation ofblood flow in the ascending aorta. In LS, reversal blood flowvectors separating from the main flow were observed at thebasal part near the aortic wall (R in Fig. 1, LS).
The flow velocity vector profile on the long-axis line ofthe aortaThe tip of the flow velocity vector along the center line ofthe ascending aorta alternatively shifted anteriorly or poste-riorly. This means that the vector was twisted (Fig. 2, left).
As seen in the 1D distribution of the velocity vector profilealong the longitudinal-axis line of the ascending aorta, theflow velocity was maximum at the basal part and decreasedabruptly about 50% at the distal margin in the sinus ofValsalva in the ES (Fig. 2, right, white arrow). In MS and
afterward, velocity gradient in the basal part graduallydecreased and was steady in LS (Fig. 2, right). This abruptdecrement of the velocity indicated the presence of theinertia resistance from the blood in the peripheral aorticroute.dittl
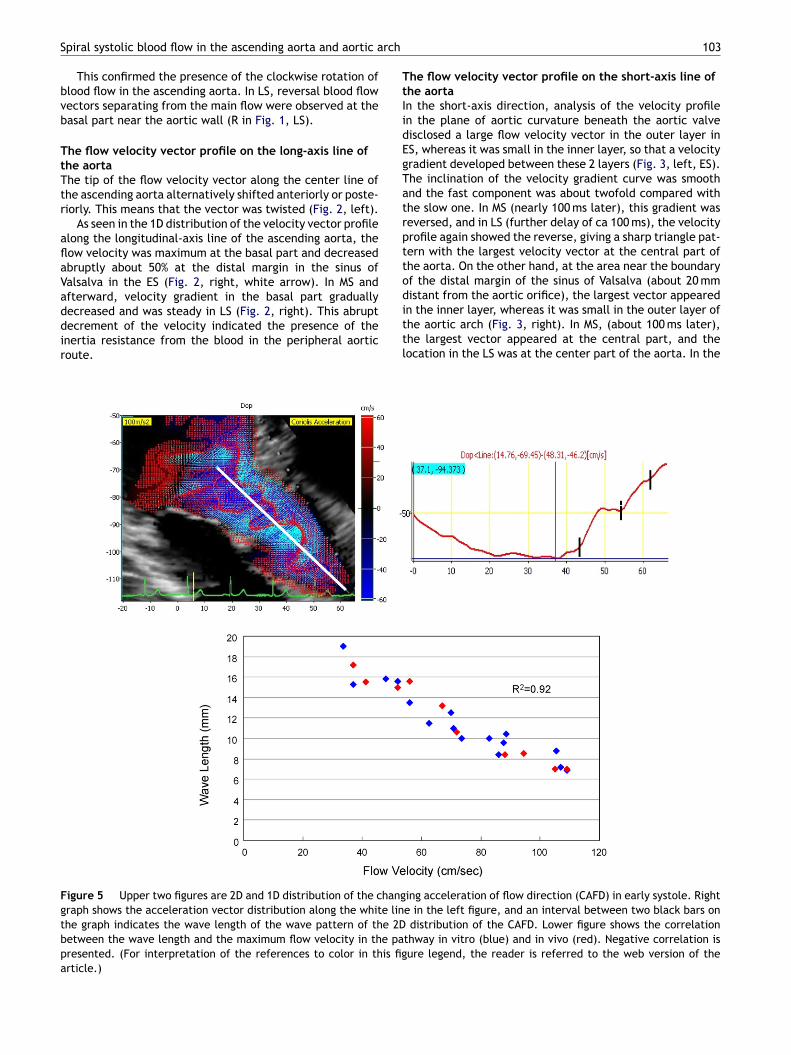
Figure 5 Upper two figures are 2D and 1D distribution of the changgraph shows the acceleration vector distribution along the white linthe graph indicates the wave length of the wave pattern of the 2Dbetween the wave length and the maximum flow velocity in the papresented. (For interpretation of the references to color in this figarticle.)
103
he flow velocity vector profile on the short-axis line ofhe aortan the short-axis direction, analysis of the velocity profilen the plane of aortic curvature beneath the aortic valveisclosed a large flow velocity vector in the outer layer inS, whereas it was small in the inner layer, so that a velocityradient developed between these 2 layers (Fig. 3, left, ES).he inclination of the velocity gradient curve was smoothnd the fast component was about twofold compared withhe slow one. In MS (nearly 100 ms later), this gradient waseversed, and in LS (further delay of ca 100 ms), the velocityrofile again showed the reverse, giving a sharp triangle pat-ern with the largest velocity vector at the central part ofhe aorta. On the other hand, at the area near the boundaryf the distal margin of the sinus of Valsalva (about 20 mm
istant from the aortic orifice), the largest vector appearedn the inner layer, whereas it was small in the outer layer ofhe aortic arch (Fig. 3, right). In MS, (about 100 ms later),he largest vector appeared at the central part, and theocation in the LS was at the center part of the aorta. In theing acceleration of flow direction (CAFD) in early systole. Righte in the left figure, and an interval between two black bars ondistribution of the CAFD. Lower figure shows the correlation
thway in vitro (blue) and in vivo (red). Negative correlation isure legend, the reader is referred to the web version of the
104 M. Tanaka et al.
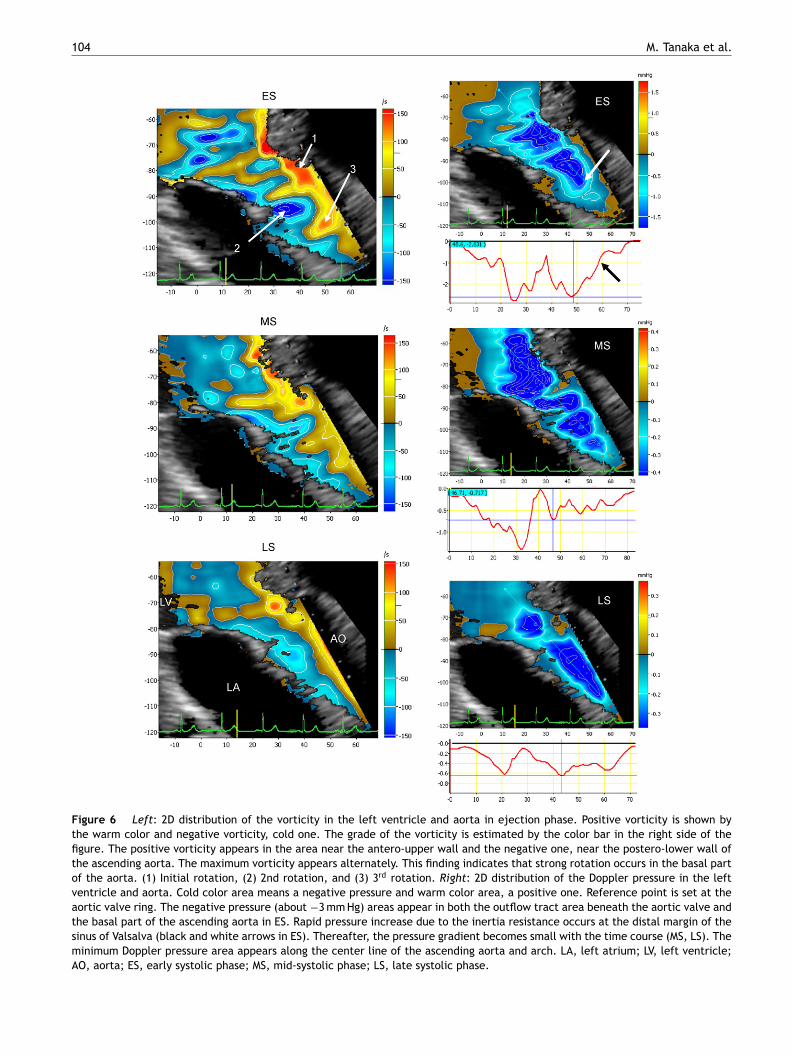
Figure 6 Left: 2D distribution of the vorticity in the left ventricle and aorta in ejection phase. Positive vorticity is shown bythe warm color and negative vorticity, cold one. The grade of the vorticity is estimated by the color bar in the right side of thefigure. The positive vorticity appears in the area near the antero-upper wall and the negative one, near the postero-lower wall ofthe ascending aorta. The maximum vorticity appears alternately. This finding indicates that strong rotation occurs in the basal partof the aorta. (1) Initial rotation, (2) 2nd rotation, and (3) 3rd rotation. Right: 2D distribution of the Doppler pressure in the leftventricle and aorta. Cold color area means a negative pressure and warm color area, a positive one. Reference point is set at theaortic valve ring. The negative pressure (about −3 mm Hg) areas appear in both the outflow tract area beneath the aortic valve andthe basal part of the ascending aorta in ES. Rapid pressure increase due to the inertia resistance occurs at the distal margin of thesinus of Valsalva (black and white arrows in ES). Thereafter, the pressure gradient becomes small with the time course (MS, LS). Theminimum Doppler pressure area appears along the center line of the ascending aorta and arch. LA, left atrium; LV, left ventricle;AO, aorta; ES, early systolic phase; MS, mid-systolic phase; LS, late systolic phase.
rch
ti
Spiral systolic blood flow in the ascending aorta and aortic a
space between the basal area of the outflow tract beneaththe aortic orifice and the distal margin of the sinus of Val-salva, the reversed velocity gradient was observed at every
certain time interval from the onset of the ejection and atevery certain distance from the orifice. The equilateral tri-angular or sharpened parabolic velocity profile (Fig. 3, LS)seemed to be produced by the rolling friction in the rotatingflow.r
2Ar
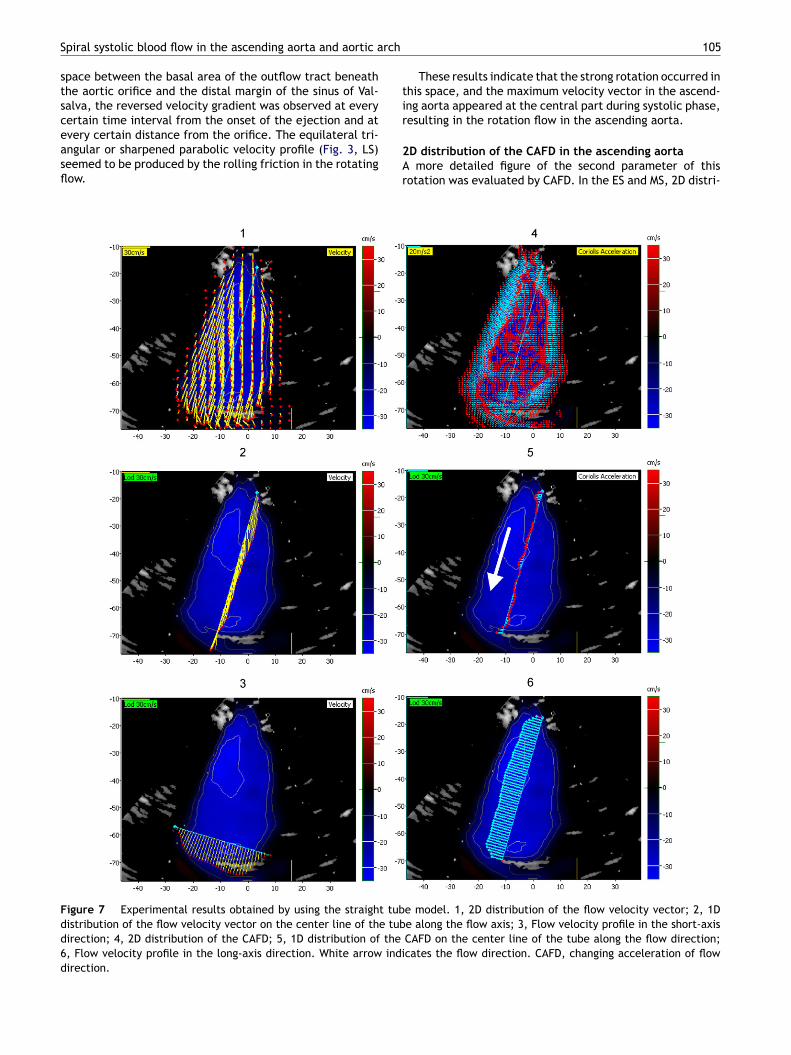
Figure 7 Experimental results obtained by using the straight tubdistribution of the flow velocity vector on the center line of the tubdirection; 4, 2D distribution of the CAFD; 5, 1D distribution of the6, Flow velocity profile in the long-axis direction. White arrow indidirection.
105
These results indicate that the strong rotation occurred inhis space, and the maximum velocity vector in the ascend-ng aorta appeared at the central part during systolic phase,
esulting in the rotation flow in the ascending aorta.D distribution of the CAFD in the ascending aortamore detailed figure of the second parameter of this
otation was evaluated by CAFD. In the ES and MS, 2D distri-
e model. 1, 2D distribution of the flow velocity vector; 2, 1De along the flow axis; 3, Flow velocity profile in the short-axisCAFD on the center line of the tube along the flow direction;cates the flow direction. CAFD, changing acceleration of flow
1
bdfvwaca
io
Fdd6a
06
ution of CAFD on the longitudinal section plane of the aortaemonstrated a fan of the radial pattern from the inner sur-ace of the aortic wall (Fig. 4, left). Many radially arranged
ectors alternately appeared from the anterior or posteriorall of the aorta. Thus, the line connecting the tips of thecceleration vector constituted a red snaky pattern in theentral area of the aorta. As systole progressed (LS), thecceleration vector originated perpendicularly from the wallptttv
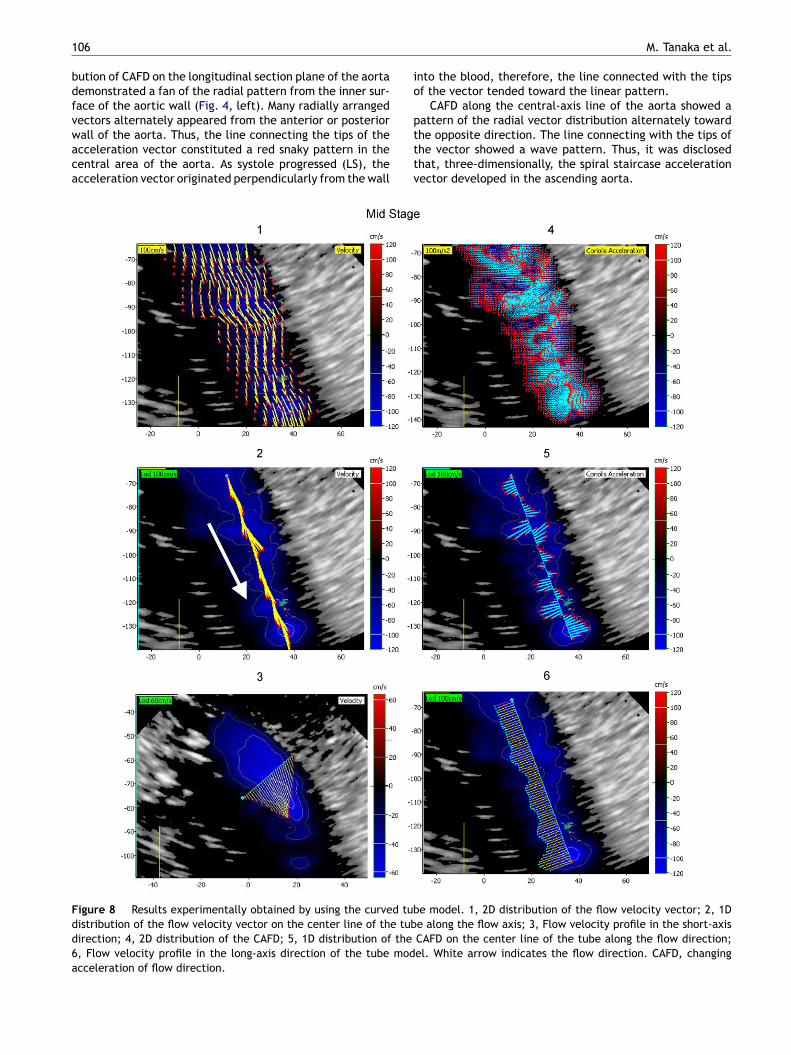
igure 8 Results experimentally obtained by using the curved tubistribution of the flow velocity vector on the center line of the tubirection; 4, 2D distribution of the CAFD; 5, 1D distribution of the, Flow velocity profile in the long-axis direction of the tube modcceleration of flow direction.
M. Tanaka et al.
nto the blood, therefore, the line connected with the tipsf the vector tended toward the linear pattern.
CAFD along the central-axis line of the aorta showed a
attern of the radial vector distribution alternately towardhe opposite direction. The line connecting with the tips ofhe vector showed a wave pattern. Thus, it was disclosedhat, three-dimensionally, the spiral staircase accelerationector developed in the ascending aorta.e model. 1, 2D distribution of the flow velocity vector; 2, 1De along the flow axis; 3, Flow velocity profile in the short-axisCAFD on the center line of the tube along the flow direction;el. White arrow indicates the flow direction. CAFD, changing
rch
oiVMla
I
S2ttddw
wpcw
CAsv
Spiral systolic blood flow in the ascending aorta and aortic a
The magnitude of the CAFD in ES was large in the antero-superior direction at the basal part of the ascending aortacompared to that in the peripheral part. On the other hand,the magnitude in the peripheral part became larger in MSand LS, indicating the occurrence of large rotation of theblood flow in the basal part of the aorta and progression tothe peripheral part of the aorta with time course.
The wave length of the wave pattern figured by the tipof the acceleration vector had an inverse correlation withthe maximum velocity in the aorta (Fig. 5), i.e. the higherthe velocity, the faster the rotation.
2D distribution of the vorticity of the blood flow in theascending aortaOne parameter of this rotation was the vorticity of theejecting flow. At the beginning of the ejection (Fig. 6,left), the maximum area of the positive vorticity (red area,100—150/s) appeared at the anterior part of the outflowtract beneath the aortic valve. On the other hand, the neg-ative vorticity area (blue area, −100 to −150/s) appearedposteriorly just above the aortic valve (2nd rotation (2)).These positive (+) and negative (−) components of the vor-ticity alternately appeared toward the peripheral part andthe vorticity gradually decreased after MS, both indicatingthe strong rotation produced at the part from the outflowtract to the basal part of the aorta.
2D distribution of the Doppler pressure in the ascendingaortaAbout −3 mm Hg negative pressure was shown in both theoutflow tract area beneath the valve ring and the basal area
fitbta
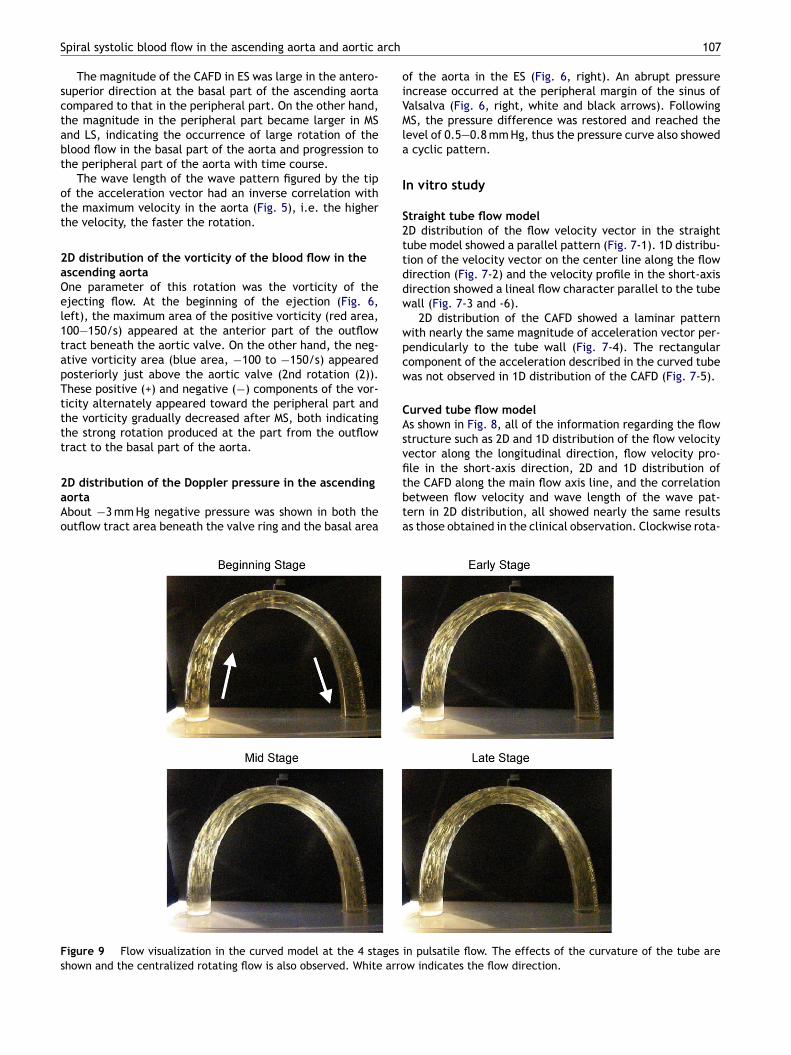
Figure 9 Flow visualization in the curved model at the 4 stagesshown and the centralized rotating flow is also observed. White arro
107
f the aorta in the ES (Fig. 6, right). An abrupt pressurencrease occurred at the peripheral margin of the sinus ofalsalva (Fig. 6, right, white and black arrows). FollowingS, the pressure difference was restored and reached the
evel of 0.5—0.8 mm Hg, thus the pressure curve also showedcyclic pattern.
n vitro study
traight tube flow modelD distribution of the flow velocity vector in the straightube model showed a parallel pattern (Fig. 7-1). 1D distribu-ion of the velocity vector on the center line along the flowirection (Fig. 7-2) and the velocity profile in the short-axisirection showed a lineal flow character parallel to the tubeall (Fig. 7-3 and -6).
2D distribution of the CAFD showed a laminar patternith nearly the same magnitude of acceleration vector per-endicularly to the tube wall (Fig. 7-4). The rectangularomponent of the acceleration described in the curved tubeas not observed in 1D distribution of the CAFD (Fig. 7-5).
urved tube flow models shown in Fig. 8, all of the information regarding the flowtructure such as 2D and 1D distribution of the flow velocityector along the longitudinal direction, flow velocity pro-
le in the short-axis direction, 2D and 1D distribution ofhe CAFD along the main flow axis line, and the correlationetween flow velocity and wave length of the wave pat-ern in 2D distribution, all showed nearly the same resultss those obtained in the clinical observation. Clockwise rota-in pulsatile flow. The effects of the curvature of the tube arew indicates the flow direction.
108 M. Tanaka et al.
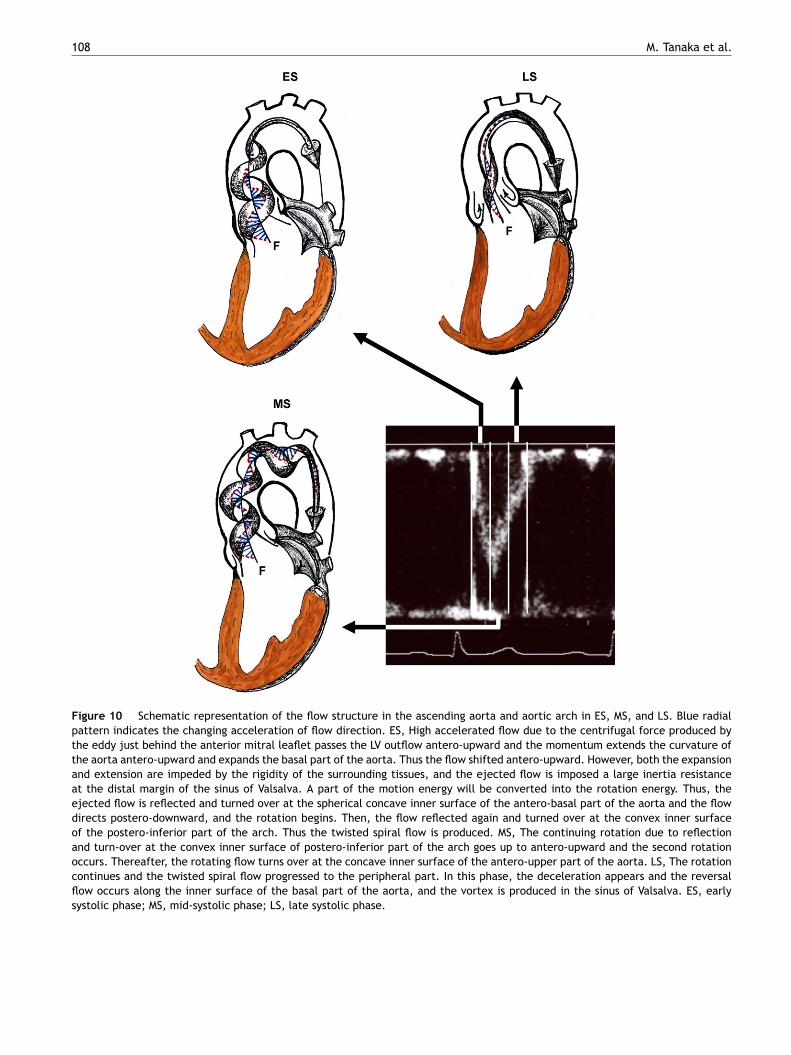
Figure 10 Schematic representation of the flow structure in the ascending aorta and aortic arch in ES, MS, and LS. Blue radialpattern indicates the changing acceleration of flow direction. ES, High accelerated flow due to the centrifugal force produced bythe eddy just behind the anterior mitral leaflet passes the LV outflow antero-upward and the momentum extends the curvature ofthe aorta antero-upward and expands the basal part of the aorta. Thus the flow shifted antero-upward. However, both the expansionand extension are impeded by the rigidity of the surrounding tissues, and the ejected flow is imposed a large inertia resistanceat the distal margin of the sinus of Valsalva. A part of the motion energy will be converted into the rotation energy. Thus, theejected flow is reflected and turned over at the spherical concave inner surface of the antero-basal part of the aorta and the flowdirects postero-downward, and the rotation begins. Then, the flow reflected again and turned over at the convex inner surfaceof the postero-inferior part of the arch. Thus the twisted spiral flow is produced. MS, The continuing rotation due to reflectionand turn-over at the convex inner surface of postero-inferior part of the arch goes up to antero-upward and the second rotationoccurs. Thereafter, the rotating flow turns over at the concave inner surface of the antero-upper part of the aorta. LS, The rotationcontinues and the twisted spiral flow progressed to the peripheral part. In this phase, the deceleration appears and the reversalflow occurs along the inner surface of the basal part of the aorta, and the vortex is produced in the sinus of Valsalva. ES, earlysystolic phase; MS, mid-systolic phase; LS, late systolic phase.
rch
flti
ftctbssstvphitireiw
ttbetwrc
C
Uflg
ttpltohtt
R
Spiral systolic blood flow in the ascending aorta and aortic a
tion of the ejected flow was also demonstrated in the curvedtube model.
Visualization of the flow in curved tube model using flatlight methodThe flow structure on the longitudinal cross-section exam-ined using flat light method (Fig. 9) disclosed that brightlines from the reflector in the flow were longer along theunder layer of the curved tube compared to those along theupper layer in the early stage of ejection. The flow velocityis faster in the under layer compared to those in the upperlayer (Fig. 9, beginning stage).
During early and mid-stage, the length of the bright linewas longer at the central area compared to that adjacent tothe wall, where the line became shorter and decreased andfinally converged toward the main flow axis line.
The main axis of the rotation flow in the curved tube wassupposed to coincide with the center line of the tube. Theflat-light method, which observed flow structure from thelongitudinal cross-section, disclosed that the transit timeof reflector passing through the flat light became long andthe length of the bright line also became long at the cen-tral area, but the reverse was true at the area adjacent tothe wall, confirming the occurrence of rotation flow duringejection.
Discussion
The results of the present study on the systolic bloodflow structure in the ascending aorta and aortic arch areschematically shown in Fig. 10.
The accelerated blood flow in the cylindrical tube curvedlike the aorta inevitably ensures secondary flow due to vis-cosity, pressure gradient, centrifugal force, etc., and showsthe high velocity component in the outside bend and lowone in the inside bend and also the slowly rotating helicalstructure [2,6,7]. Peronneau et al. [5] demonstrated in dogsthat the blood flow velocity distribution in the ascendingaorta was higher at the inner (under) part of the arch andlower in the outer (upper) part. Kilner et al. [9] reported theright-handed helical flow in the ascending aorta in humansubjects. Our data confirmed their results. In this respect,the data obtained by computer simulation were quite dif-ferent from the present study observed in the human being.
Our results further revealed the upward displacement ofthe base of the aorta and distension of the arch as well asthe diameter change. Therefore, the flow structure seemedto be complex including its rotation. However, the charac-teristics of such a flow structure have not been clarifiedyet.
Echo-dynamography enabled us to analyze 2D distribu-tion of the velocity both in the longitudinal- and short-axisdirections, vorticity, CAFD, and the development of thespiral twisted flow was definitely demonstrated. At thebeginning of ejection, the high accelerated ejection flowforcefully displaced the basal part of the aorta antero-
upward together with stretched curvature of the arch andexpansion of the aorta. Thus the ejected flow shifted inthe antero-upward direction and collided with and wasreflected at the spherical concave inner surface of theantero-basal part of the aorta. A brisk clockwise rotation109
ow was observed in the basal part of the aorta includinghe sinus of Valsalva, and the spiral twisted flow appearedn the ascending aorta.
The occurrence of the spiral twisted flow will have theollowing three merits for: one, stabilizing the flow direc-ion for passing through the curved pathway because theenter of rotation always coincided with the center line ofhe aorta, two, maintaining the most effective flow volumey defeating the high inertia resistance because of the rever-al correlation between the rotation rate and the maximumpeed of the ejected flow, and three, dispersing the sheartress in the aortic wall which occurred by passing throughhe high accelerated flow. From the 2D distribution of theorticity, it was considered that the rotating flow at the basalart of the aorta is produced by the momentum due to theigh accelerated ejection flow in the early stage of ejectionmpeded by the rigidity of the surrounding aortic tissue. Onhe other hand, the distal margin of the sinus of Valsalvamposes a large inertia resistance from the peripheral aorticoute. A part of the motion energy for ejection, which wasquivalent to the velocity decrement and dynamic pressurencrement (Fig. 2, ES, white arrow; Fig. 6, ES, black arrow),ill be converted into rotation energy.
Though the tube experiment has no dilated part such ashe sinus of Valsalva, the results were nearly the same aso the twisted spiral flow in the human beings. There maye a loose fixation of the entrance of the tube, but thisxperiment also clearly demonstrated the importance ofhe antero-upward displacement of the basal part togetherith shifting the flow direction antero-upward, the inertia
esistance, and the curvature of the inner surface of theylindrical curve of the tube to cause the spiral twisted flow.
onclusion
sing echo-dynamography, the complicated systolic bloodow structure in the ascending aorta and arch was investi-ated.
During ejection, the twisted spiral flow was produced inhe ascending aorta and arch, which started from the junc-ion of the left ventricle and aorta and proceeded to theeripheral part. The cycle of the rotation inversely corre-ated with the maximum flow velocity. It is concluded thathis twisted spiral flow is important to settle the directionf the accelerated blood flow under high pressure and is alsoelpful to disperse the shear stress in the aortic wall. Thushe blood was effectively ejected during the short periodhrough the curved aortic pathway.
eferences
[1] Hwang NHC, Normann NA. Cardiovascular flow dynamics andmeasurement. Baltimore: University Park Press; 1977. pp.1—216.
[2] Okino H, Sugawara M, Matsuo H. Cardiovascular dynamics andfundamental measurement. Tokyo: Kohdansha Co.; 1980. pp.
156—263.[3] Nerem RM. Hot film measurement of arterial blood flow andobservation of flow disturbances. In: Hwang NHC, NormannNA, editors. Cardiovascular flow dynamics and measurement.Baltimore: University Park Press; 1977. p. 191—215.
1
[
[
[
[
[
[
[
10
[4] Paulsen PK, Hasenkam JM. Three-dimensional visualizationof velocity profile in the ascending aorta in dogs, mea-sured with a hot-film anemometer. J Biomech 1983;16:201—10.
[5] Peronneau PA, Hinglais JR, Xhaard M, Delouche P, Philippo J.The effects of curvature and stenosis on pulsatile flow in vivoand in vitro. In: Reneman RS, editor. Cardiovascular applicationof ultrasound. Amsterdam: North-Holland Publishing Co.; 1974.p. 203—15.
[6] Yearwood TL, Chandran KB. Physiological pulsatile flow exper-iments in a model of the human aortic arch. J Biomech1984;15:683—704.
[7] Nakamura M, Wada S, Yamaguchi T. Computational analysis ofblood flow in an integrated model of the left ventricle and theaorta. J Biomech Eng 2006;128:837—43.
[8] Segadal L, Matre K. Blood velocity distribution in the humanascending aorta. Circulation 1987;76:90—100.
[9] Kilner PJ, Yang GZ, Mohiaddin RH, Firmin DN, Longmore DB.Helical and retrograde secondary flow pattern in the aortic
arch studied by three-directional magnetic resonance velocitymapping. Circulation 1993;88:2235—47.10] Tanaka M. Historical perspective of the development ofechocardiography and medical ultrasound. In: Proc IEEE Ultra-sonics Symp 2. 1998. p. 1517—24.
[
M. Tanaka et al.
11] Ohtsuki S, Tanaka M. The flow velocity distribution from theDoppler information on a plane in three dimensional flow. JVisual 2006;9:69—82.
12] Tanaka M, Nitta S, Yamamoto A, Sato N, Takahashi K, SaijoY, Ohtsuki S, Ohomote R, Ohba K, Ohno H. Developmentand application of non-invasive methods for the evaluationof cardiac function: measuring cardiac function. Asian Med J1994;37:397—400.
13] Ohtsuki S, Tanaka M. Flow function for streamline representa-tive of the flow on a plane in three dimensional flow. J VisualSoc J 1998;18:136—40.
14] Hino M. Introduction to fluid mechanics. Tokyo: Asakura BookCo.; 2002. pp. 41—9.
15] Tanaka M, Sakamoto T, Sugawara S, Nakajima H, Katahira Y,Ohtsuki S, Kanai H. Blood flow structure and dynamics, andejection mechanism in the left ventricle: analysis using echo-dynamography. J Cardiol 2008;52:86—101.
16] Tanaka M, Nitta S, Yamamoto A, Takahashi K, Saijo Y, OhtsukiS. Development and application of non-invasive method for
the evaluation of cardiac function: visualization of pressurechanges in heart chambers. Asian Med J 1994;37:341—4.17] Ohtsuki S, Tanaka M. Doppler pressure field deduced from theDoppler velocity field in an observation plane in a fluid. Ultra-sound Med Biol 2003;29:1431—8.