Panorama social 2013V8 - OGBL · Panorama social 2013V8 - OGBL ... +#

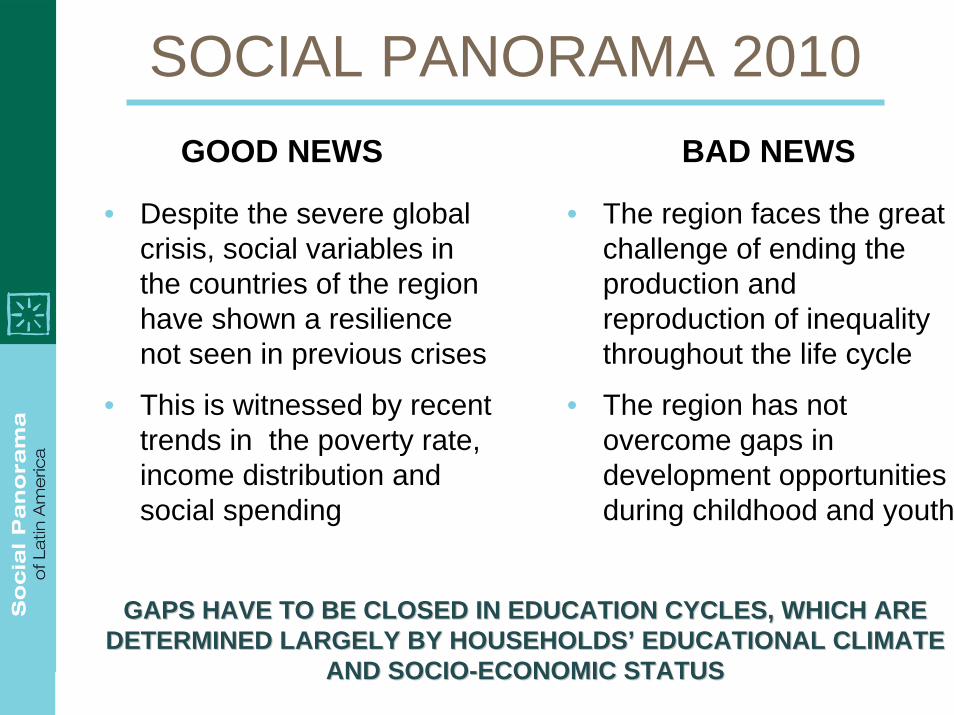
SOCIAL PANORAMA 2010
• Despite the severe global crisis, social variables in the countries of the region have shown a resilience not seen in previous crises
• This is witnessed by recent trends in the poverty rate, income distribution and social spending
• The region faces the great challenge of ending the production and reproduction of inequality throughout the life cycle
• The region has not overcome gaps in development opportunities during childhood and youth
GOOD NEWS BAD NEWS
GAPS HAVE TO BE CLOSED IN EDUCATION CYCLES, WHICH ARE GAPS HAVE TO BE CLOSED IN EDUCATION CYCLES, WHICH ARE DETERMINED LARGELY BY HOUSEHOLDSDETERMINED LARGELY BY HOUSEHOLDS’’ EDUCATIONAL CLIMATE EDUCATIONAL CLIMATE
AND SOCIOAND SOCIO--ECONOMIC STATUSECONOMIC STATUS
I. RECENT TRENDS IN POVERTY AND INCOME
DISTRIBUTION
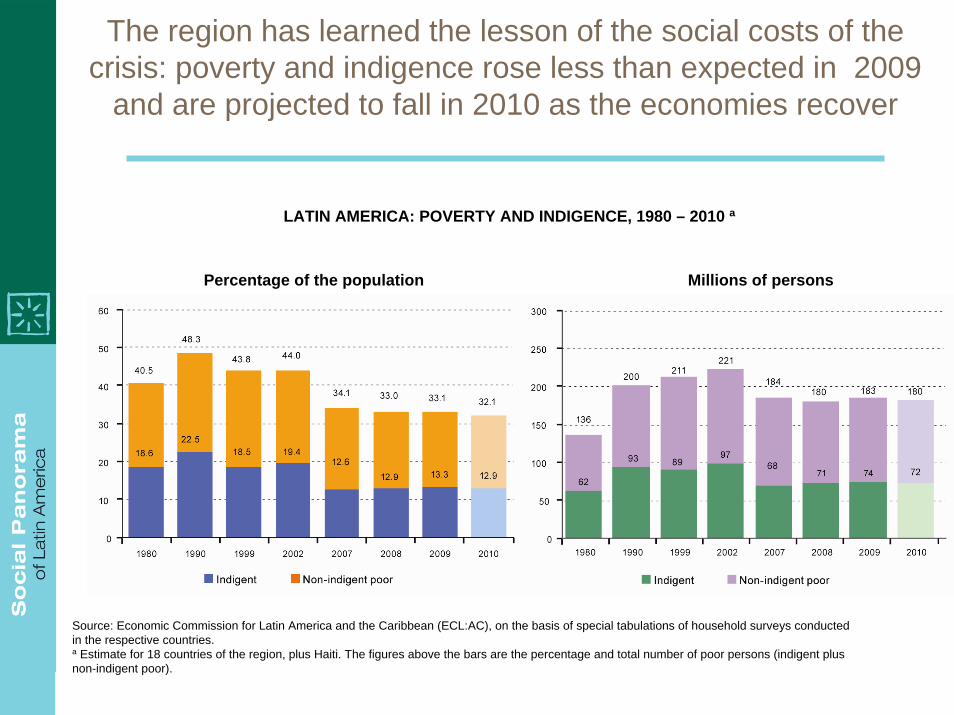
The region has learned the lesson of the social costs of the crisis: poverty and indigence rose less than expected in 2009
and are projected to fall in 2010 as the economies recover
LATIN AMERICA: POVERTY AND INDIGENCE, 1980 – 2010 a
Source: Economic Commission for Latin America and the Caribbean (ECL:AC), on the basis of special tabulations of household surveys conducted in the respective countries.a Estimate for 18 countries of the region, plus Haiti. The figures above the bars are the percentage and total number of poor persons (indigent plus non-indigent poor).
Percentage of the population Millions of persons
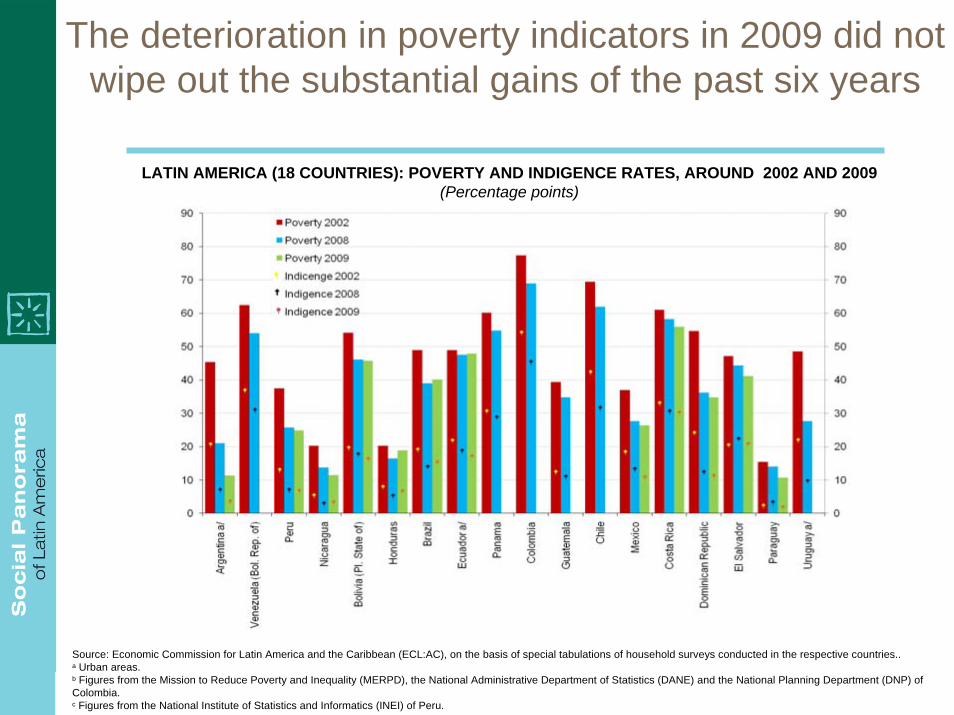
The deterioration in poverty indicators in 2009 did not wipe out the substantial gains of the past six years
LATIN AMERICA (18 COUNTRIES): POVERTY AND INDIGENCE RATES, AROUND 2002 AND 2009(Percentage points)
Source: Economic Commission for Latin America and the Caribbean (ECL:AC), on the basis of special tabulations of household surveys conducted in the respective countries..a Urban areas.b Figures from the Mission to Reduce Poverty and Inequality (MERPD), the National Administrative Department of Statistics (DANE) and the National Planning Department (DNP) of Colombia.c Figures from the National Institute of Statistics and Informatics (INEI) of Peru.
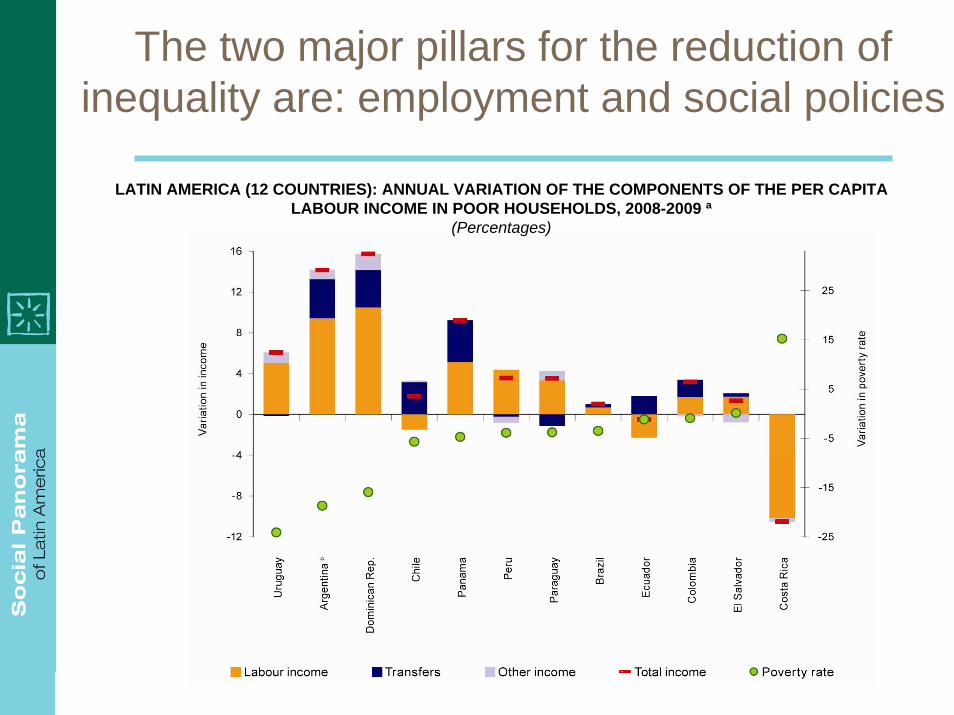
The two major pillars for the reduction of inequality are: employment and social policies
LATIN AMERICA (12 COUNTRIES): ANNUAL VARIATION OF THE COMPONENTS OF THE PER CAPITA LABOUR INCOME IN POOR HOUSEHOLDS, 2008-2009 a
(Percentages)
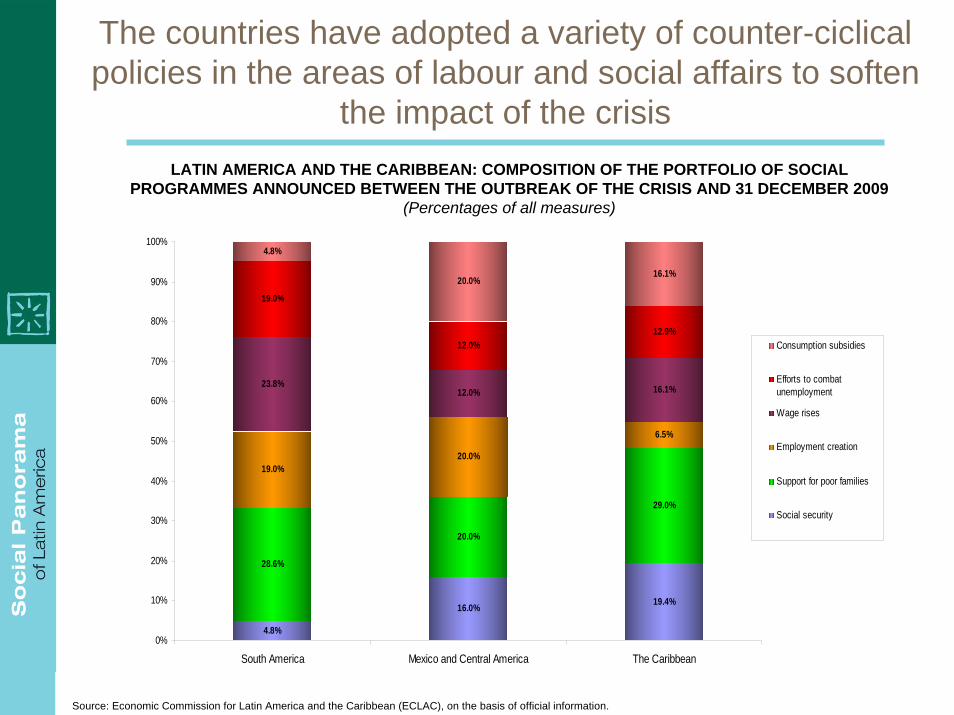
The countries have adopted a variety of counter-ciclicalpolicies in the areas of labour and social affairs to soften
the impact of the crisisLATIN AMERICA AND THE CARIBBEAN: COMPOSITION OF THE PORTFOLIO OF SOCIAL
PROGRAMMES ANNOUNCED BETWEEN THE OUTBREAK OF THE CRISIS AND 31 DECEMBER 2009(Percentages of all measures)
Source: Economic Commission for Latin America and the Caribbean (ECLAC), on the basis of official information.
4.8%
16.0% 19.4%
28.6%
20.0%
29.0%
19.0%20.0%
6.5%
23.8%12.0% 16.1%
19.0%
12.0%12.9%
4.8%
20.0%16.1%
0%
10%
20%
30%
40%
50%
60%
70%
80%
90%
100%
South America Mexico and Central America The Caribbean
Consumption subsidies
Efforts to combatunemployment
Wage rises
Employment creation
Support for poor families
Social security
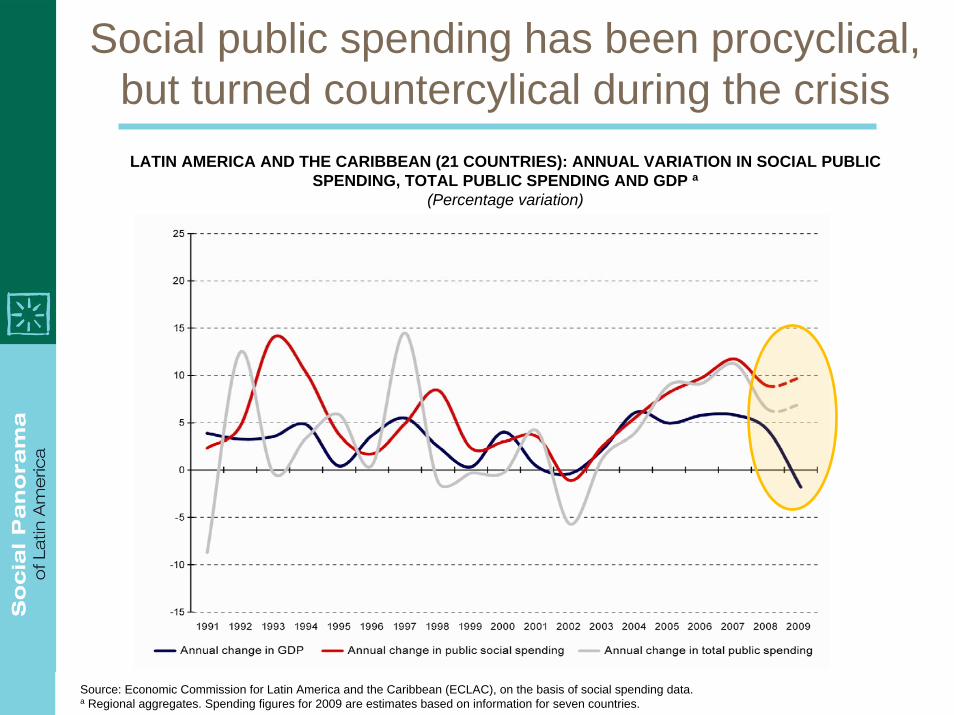
Social public spending has been procyclical, but turned countercylical during the crisis
Source: Economic Commission for Latin America and the Caribbean (ECLAC), on the basis of social spending data.a Regional aggregates. Spending figures for 2009 are estimates based on information for seven countries.
LATIN AMERICA AND THE CARIBBEAN (21 COUNTRIES): ANNUAL VARIATION IN SOCIAL PUBLIC SPENDING, TOTAL PUBLIC SPENDING AND GDP a
(Percentage variation)
Source: Economic Commission for Latin America and the Caribbean (ECLAC), on the basis of social spending data.
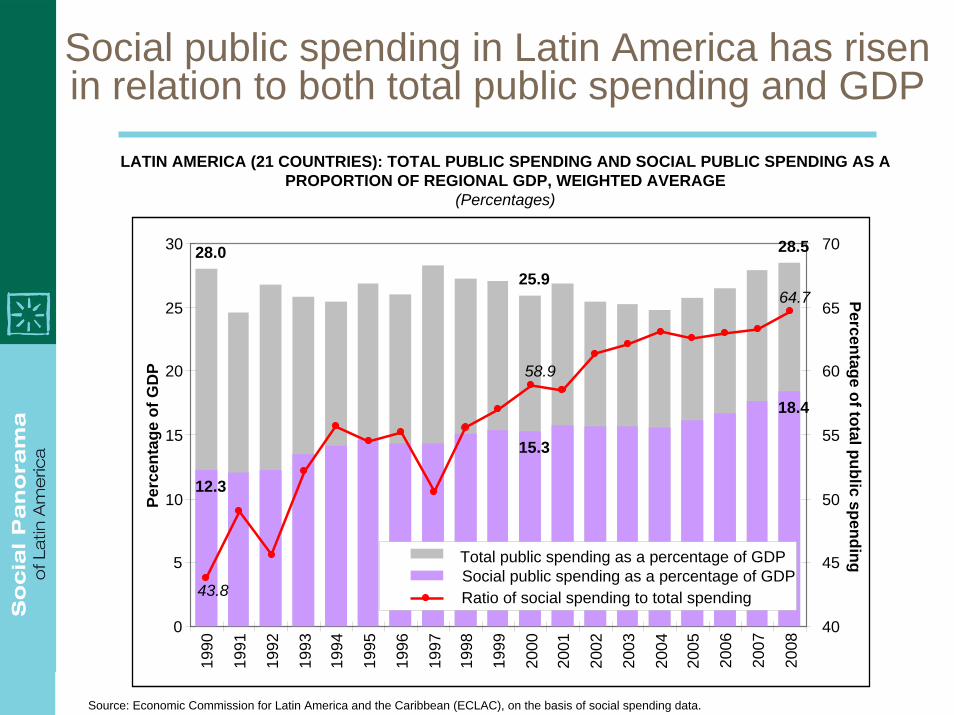
Social public spending in Latin America has risen in relation to both total public spending and GDP
LATIN AMERICA (21 COUNTRIES): TOTAL PUBLIC SPENDING AND SOCIAL PUBLIC SPENDING AS A PROPORTION OF REGIONAL GDP, WEIGHTED AVERAGE
(Percentages)
25.9
28.528.0
15.3
18.4
12.3
64.7
58.9
43.8
0
5
10
15
20
25
30
1990
1991
1992
1993
1994
1995
1996
1997
1998
1999
2000
2001
2002
2003
2004
2005
2006
2007
2008
Perc
enta
ge o
f GD
P
40
45
50
55
60
65
70
Percentage of total public spendingTotal public spending as a percentage of GDPSocial public spending as a percentage of GDPRatio of social spending to total spending
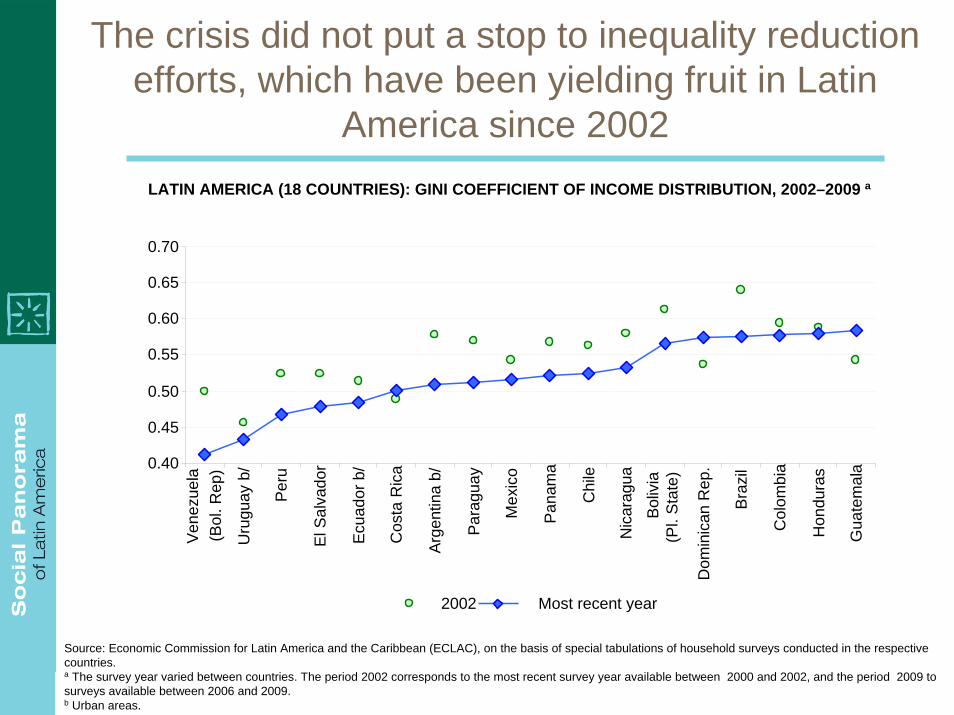
The crisis did not put a stop to inequality reduction efforts, which have been yielding fruit in Latin
America since 2002LATIN AMERICA (18 COUNTRIES): GINI COEFFICIENT OF INCOME DISTRIBUTION, 2002–2009 a
Source: Economic Commission for Latin America and the Caribbean (ECLAC), on the basis of special tabulations of household surveys conducted in the respective countries. a The survey year varied between countries. The period 2002 corresponds to the most recent survey year available between 2000 and 2002, and the period 2009 to surveys available between 2006 and 2009.b Urban areas.
0.40
0.45
0.50
0.55
0.60
0.65
0.70
Vene
zuel
a(B
ol. R
ep)
Uru
guay
b/
Per
u
El S
alva
dor
Ecua
dor b
/
Cos
ta R
ica
Arge
ntin
a b/
Para
guay
Mex
ico
Pan
ama
Chi
le
Nic
arag
ua
Boliv
ia(P
l. S
tate
)
Dom
inic
an R
ep.
Bra
zil
Col
ombi
a
Hon
dura
s
Gua
tem
ala
2002 Most recent year
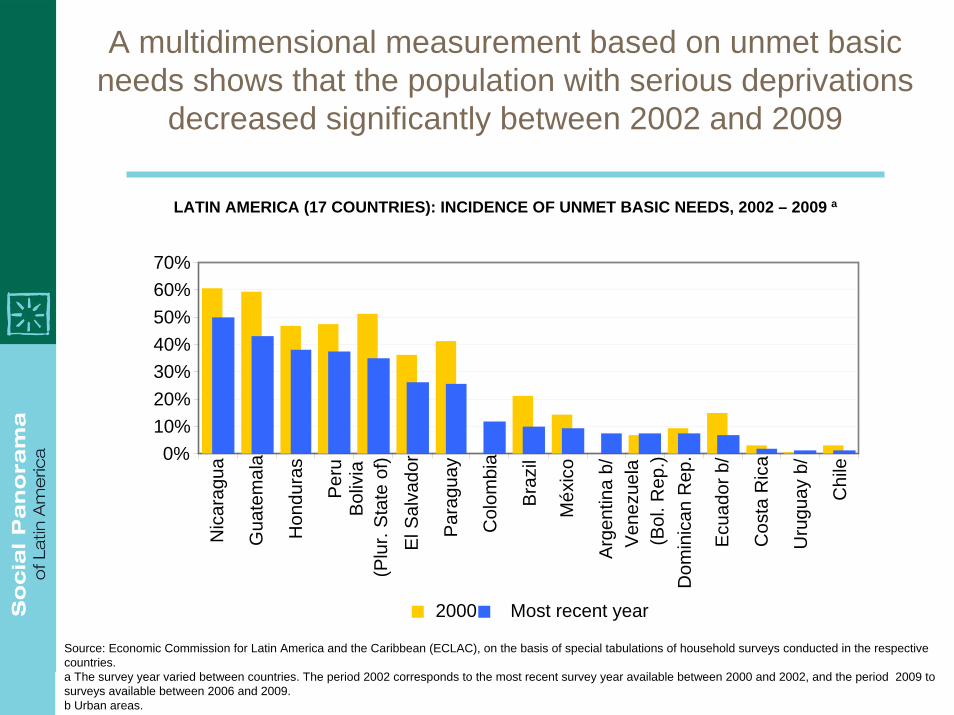
A multidimensional measurement based on unmet basic needs shows that the population with serious deprivations
decreased significantly between 2002 and 2009
LATIN AMERICA (17 COUNTRIES): INCIDENCE OF UNMET BASIC NEEDS, 2002 – 2009 a
Source: Economic Commission for Latin America and the Caribbean (ECLAC), on the basis of special tabulations of household surveys conducted in the respective countries.a The survey year varied between countries. The period 2002 corresponds to the most recent survey year available between 2000 and 2002, and the period 2009 to surveys available between 2006 and 2009.b Urban areas.
0%10%20%30%40%50%60%70%
Nic
arag
ua
Gua
tem
ala
Hon
dura
s
Per
uB
oliv
ia(P
lur.
Sta
te o
f)E
l Sal
vado
r
Par
agua
y
Col
ombi
a
Bra
zil
Méx
ico
Arg
entin
a b/
Ven
ezue
la(B
ol. R
ep.)
Dom
inic
an R
ep.
Ecu
ador
b/
Cos
ta R
ica
Uru
guay
b/
Chi
le
2000 Most recent year
In sum: in the period from 2002 to the most recent estimate
There is a general trend towards the reduction of poverty and extreme poverty
And increase of income in the poorer households
A better income distributionExplicit will and capacity of the countries
to mitigate the social costs of the crisis and advance towards more integrated social policies
II. EDUCATION: THE KEY TO ENDING OR
REPRODUCING EXCLUSION AND INEQUALITY
Education and equality: an equation still in the making
1. Education is the key stage and life cycle marker addressed in this edition of Social Panorama
2. Education is the main tool for decoupling life trajectories from gaps at origin.
3. New generations have joined the education system, but outcome and learning gaps by household socio-economic level persist.
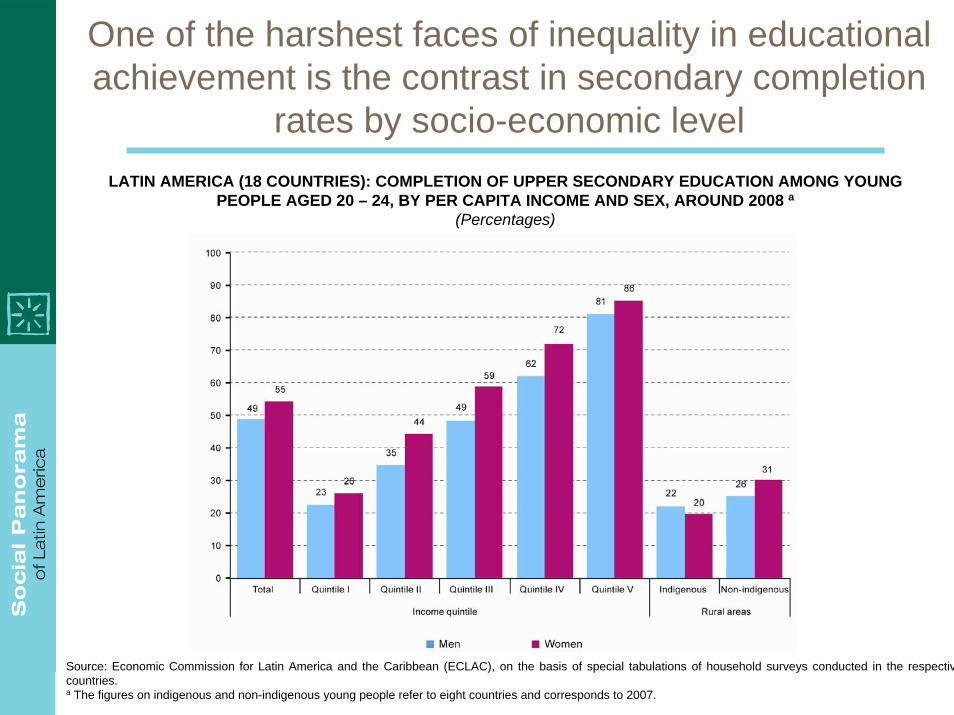
One of the harshest faces of inequality in educational achievement is the contrast in secondary completion
rates by socio-economic level
Source: Economic Commission for Latin America and the Caribbean (ECLAC), on the basis of special tabulations of household surveys conducted in the respectivcountries.a The figures on indigenous and non-indigenous young people refer to eight countries and corresponds to 2007.
LATIN AMERICA (18 COUNTRIES): COMPLETION OF UPPER SECONDARY EDUCATION AMONG YOUNG PEOPLE AGED 20 – 24, BY PER CAPITA INCOME AND SEX, AROUND 2008 a
(Percentages)
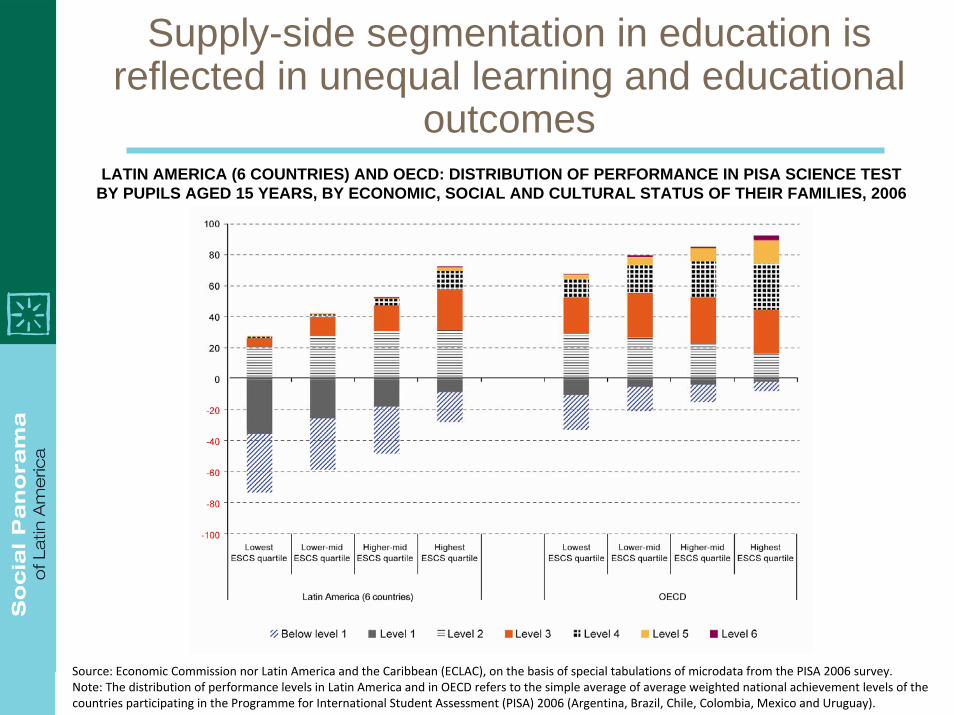
Supply-side segmentation in education is reflected in unequal learning and educational
outcomes
Source: Economic Commission nor Latin America and the Caribbean (ECLAC), on the basis of special tabulations of microdata from the PISA 2006 survey.Note: The distribution of performance levels in Latin America and in OECD refers to the simple average of average weighted national achievement levels of the countries participating in the Programme for International Student Assessment (PISA) 2006 (Argentina, Brazil, Chile, Colombia, Mexico and Uruguay).
LATIN AMERICA (6 COUNTRIES) AND OECD: DISTRIBUTION OF PERFORMANCE IN PISA SCIENCE TEST BY PUPILS AGED 15 YEARS, BY ECONOMIC, SOCIAL AND CULTURAL STATUS OF THEIR FAMILIES, 2006
(Percentages)
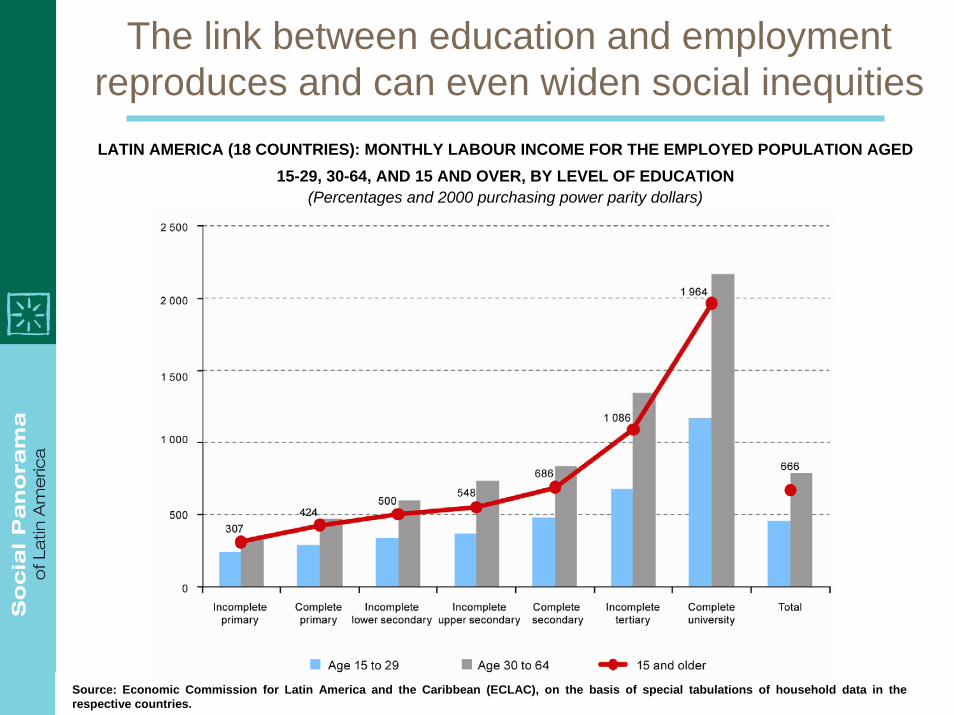
The link between education and employment reproduces and can even widen social inequities
Source: Economic Commission for Latin America and the Caribbean (ECLAC), on the basis of special tabulations of household data in the respective countries.
LATIN AMERICA (18 COUNTRIES): MONTHLY LABOUR INCOME FOR THE EMPLOYED POPULATION AGED 15-29, 30-64, AND 15 AND OVER, BY LEVEL OF EDUCATION
(Percentages and 2000 purchasing power parity dollars)
Social investment in education has risen significantly, but shows distributive biases
1. Education is the sector that allocates the greatest resources tochildren and young people.
2. Most of the countries increased spending per student between 2000 and 2008. In the last decade, countries focused on increasing coverage, which rose by 14 percentage points between 1990 and 2000, but has risen by only 5 percentage points since.
3. The increase in public spending per student in the region largely reflects economic growth and efforts to afford greater importance to education within national budgets.
4. The expansion of education has helped to make spending more progressive, especially in preschool, primary and lower secondary education. But, given more limited entry to higher education, spending at this level is not yet as progressive as might be wished.
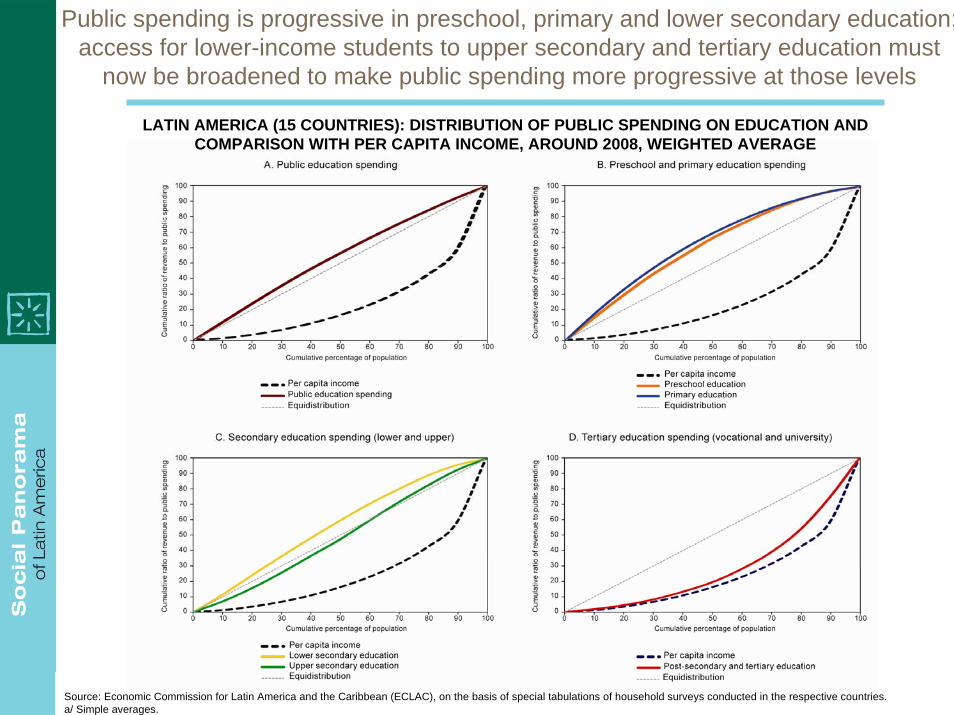
Public spending is progressive in preschool, primary and lower secondary education;access for lower-income students to upper secondary and tertiary education must
now be broadened to make public spending more progressive at those levels
Source: Economic Commission for Latin America and the Caribbean (ECLAC), on the basis of special tabulations of household surveys conducted in the respective countries. a/ Simple averages.
LATIN AMERICA (15 COUNTRIES): DISTRIBUTION OF PUBLIC SPENDING ON EDUCATION AND COMPARISON WITH PER CAPITA INCOME, AROUND 2008, WEIGHTED AVERAGE
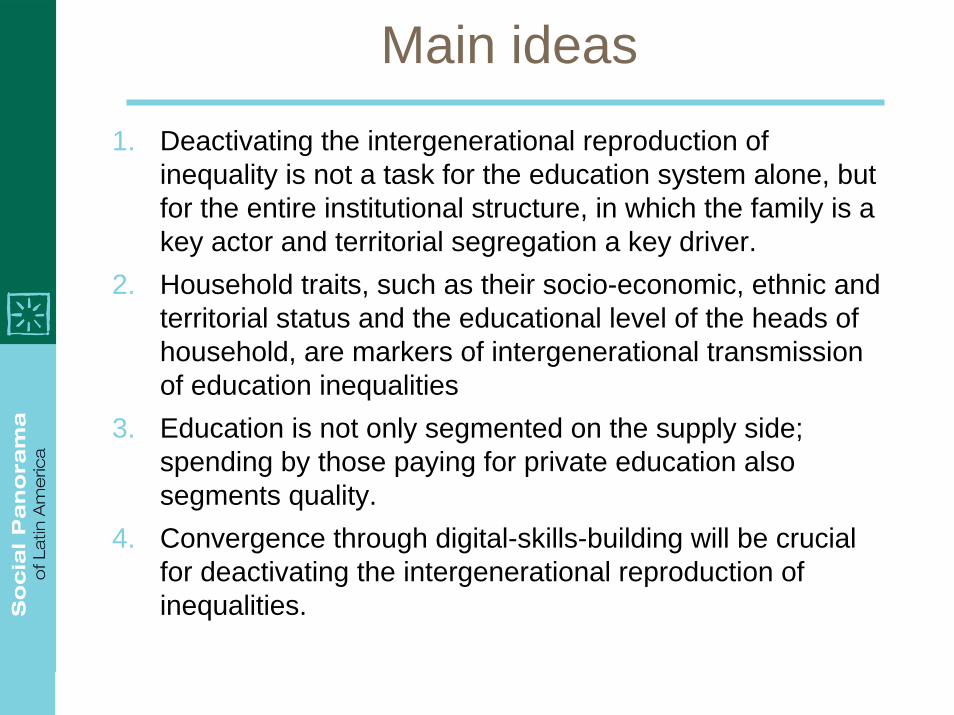
Main ideas1. Deactivating the intergenerational reproduction of
inequality is not a task for the education system alone, but for the entire institutional structure, in which the family is akey actor and territorial segregation a key driver.
2. Household traits, such as their socio-economic, ethnic and territorial status and the educational level of the heads of household, are markers of intergenerational transmission of education inequalities
3. Education is not only segmented on the supply side; spending by those paying for private education also segments quality.
4. Convergence through digital-skills-building will be crucial for deactivating the intergenerational reproduction of inequalities.
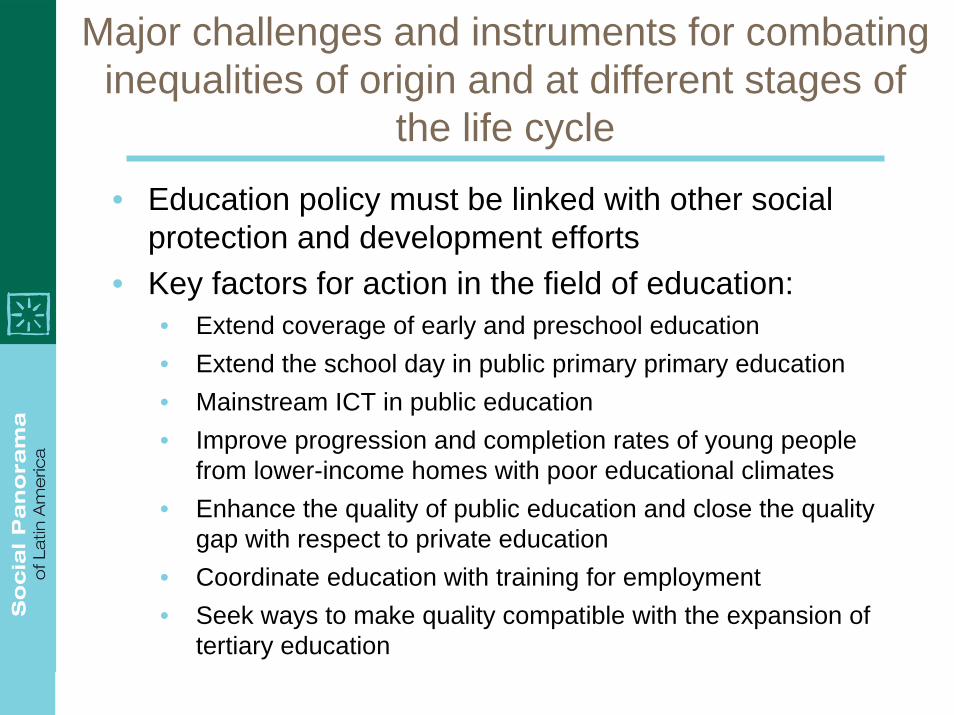
Major challenges and instruments for combating inequalities of origin and at different stages of
the life cycle
• Education policy must be linked with other social protection and development efforts
• Key factors for action in the field of education: • Extend coverage of early and preschool education• Extend the school day in public primary primary education• Mainstream ICT in public education• Improve progression and completion rates of young people
from lower-income homes with poor educational climates• Enhance the quality of public education and close the quality
gap with respect to private education• Coordinate education with training for employment• Seek ways to make quality compatible with the expansion of
tertiary education
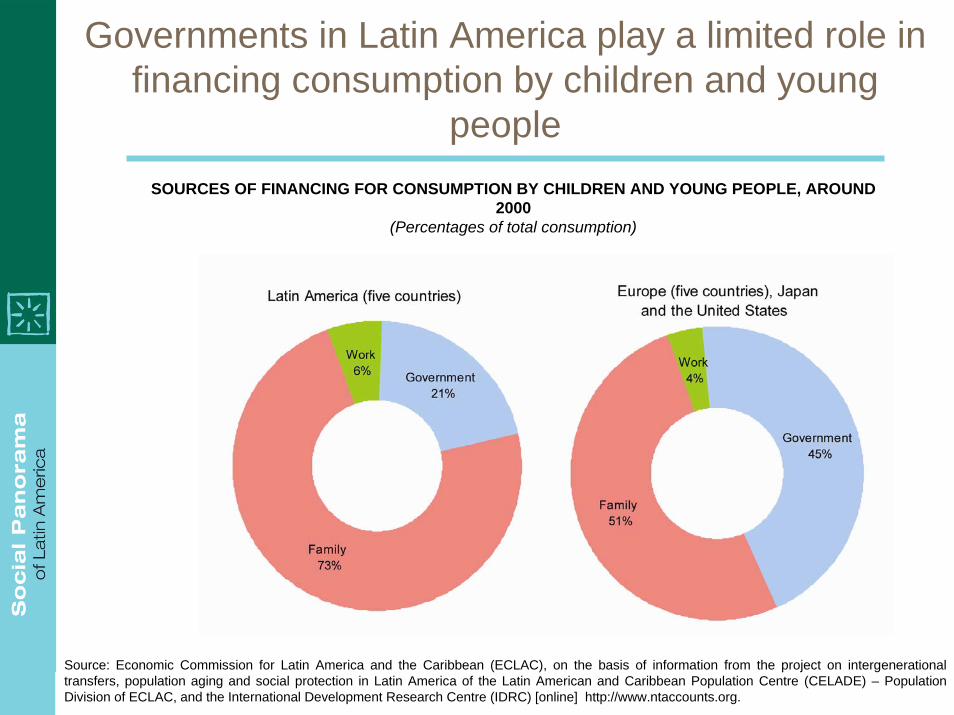
Governments in Latin America play a limited role in financing consumption by children and young
peopleSOURCES OF FINANCING FOR CONSUMPTION BY CHILDREN AND YOUNG PEOPLE, AROUND
2000(Percentages of total consumption)
Source: Economic Commission for Latin America and the Caribbean (ECLAC), on the basis of information from the project on intergenerational transfers, population aging and social protection in Latin America of the Latin American and Caribbean Population Centre (CELADE) – Population Division of ECLAC, and the International Development Research Centre (IDRC) [online] http://www.ntaccounts.org.
Public policy reflections
• The region has learned the lesson of the social costs of crises and the importance of softening their impact by means of countercyclical policies.
• The life cycle approach is important in identifying the links that must be deactivated to prevent the intergenerational reproduction of inequality.
• Public policies on education, in combination with other social policies, are very important for breaking the vicious cycle of inequality reproduction.
• It is crucial that young people complete upper secondary education, which is a threshold for social inclusion that helps to deactivate the mechanism of inequality reproduction.
• Social spending on education is very important at each stage of the cycle, as is investment in capacity-building.
• The transfers system, meanwhile, should be used to offset lacks in other social areas, to help prevent the loss of capacities whileinvestment projects are developed.