SAS Visual Analytics
9
Copyright © 2015, SAS Institute Inc. All rights reserved. SAS VISUAL ANALYTICS
-
Upload
marketingarrowecscz -
Category
Technology
-
view
67 -
download
1
Transcript of SAS Visual Analytics
C op yr i g h t © 2015, SAS Ins t i t u te Inc . A l l r i g h ts r eser v ed .
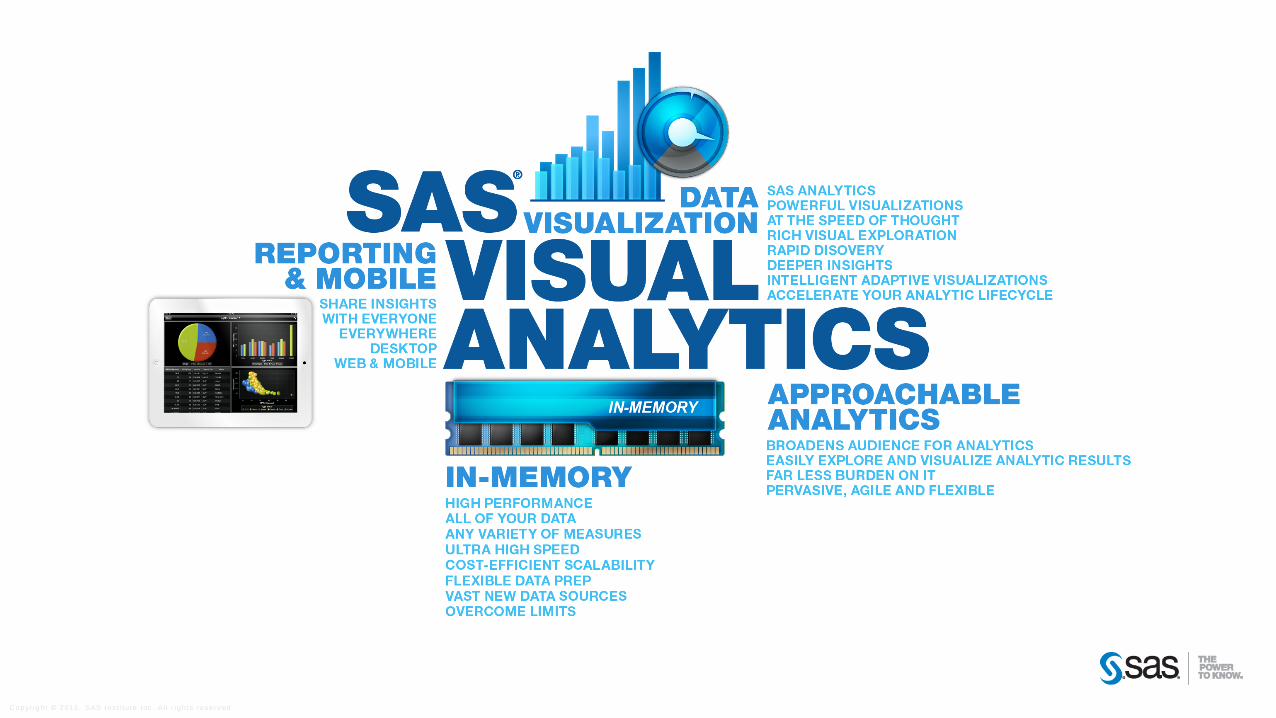
SAS VISUAL ANALYTICS
C op yr i g h t © 2015, SAS Ins t i t u te Inc . A l l r i g h ts r eser v ed .
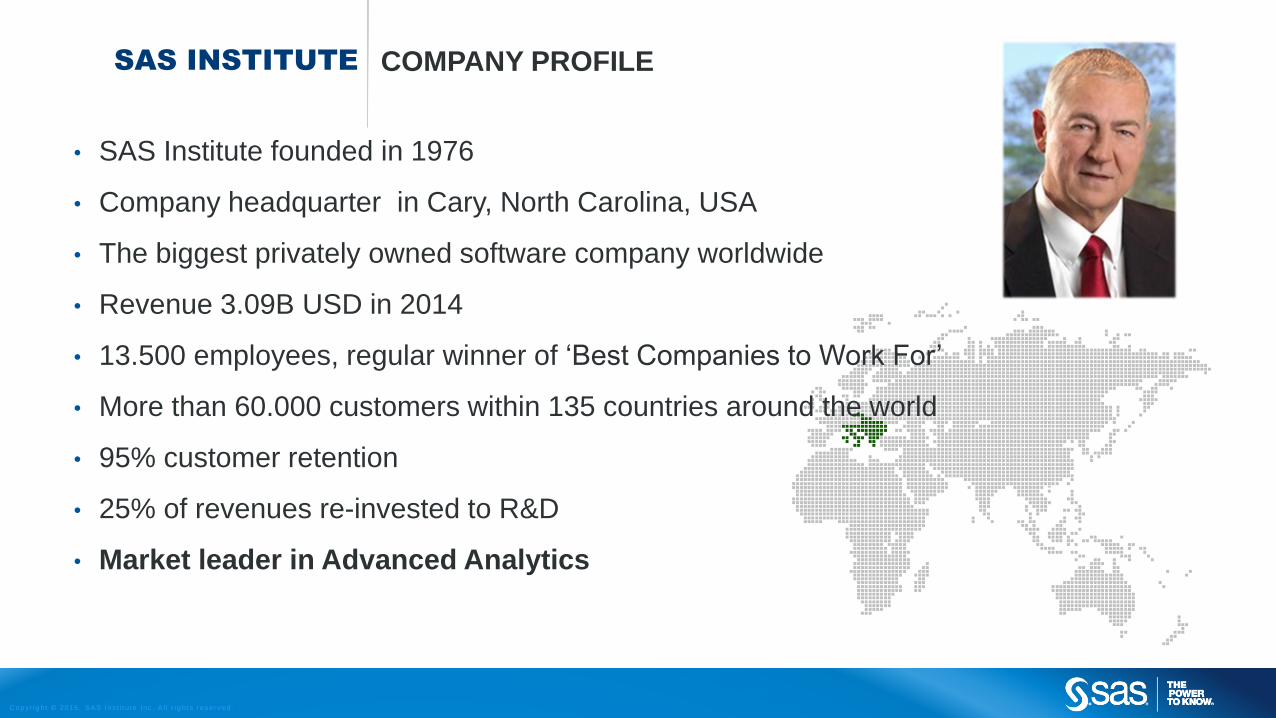
SAS INSTITUTE COMPANY PROFILE
• SAS Institute founded in 1976
• Company headquarter in Cary, North Carolina, USA
• The biggest privately owned software company worldwide
• Revenue 3.09B USD in 2014
• 13.500 employees, regular winner of ‘Best Companies to Work For’
• More than 60.000 customers within 135 countries around the world
• 95% customer retention
• 25% of revenues re-invested to R&D
• Market leader in Advanced Analytics
C op yr i g h t © 2015, SAS Ins t i t u te Inc . A l l r i g h ts r eser v ed .
C op yr i g h t © 2015, SAS Ins t i t u te Inc . A l l r i g h ts r eser v ed .
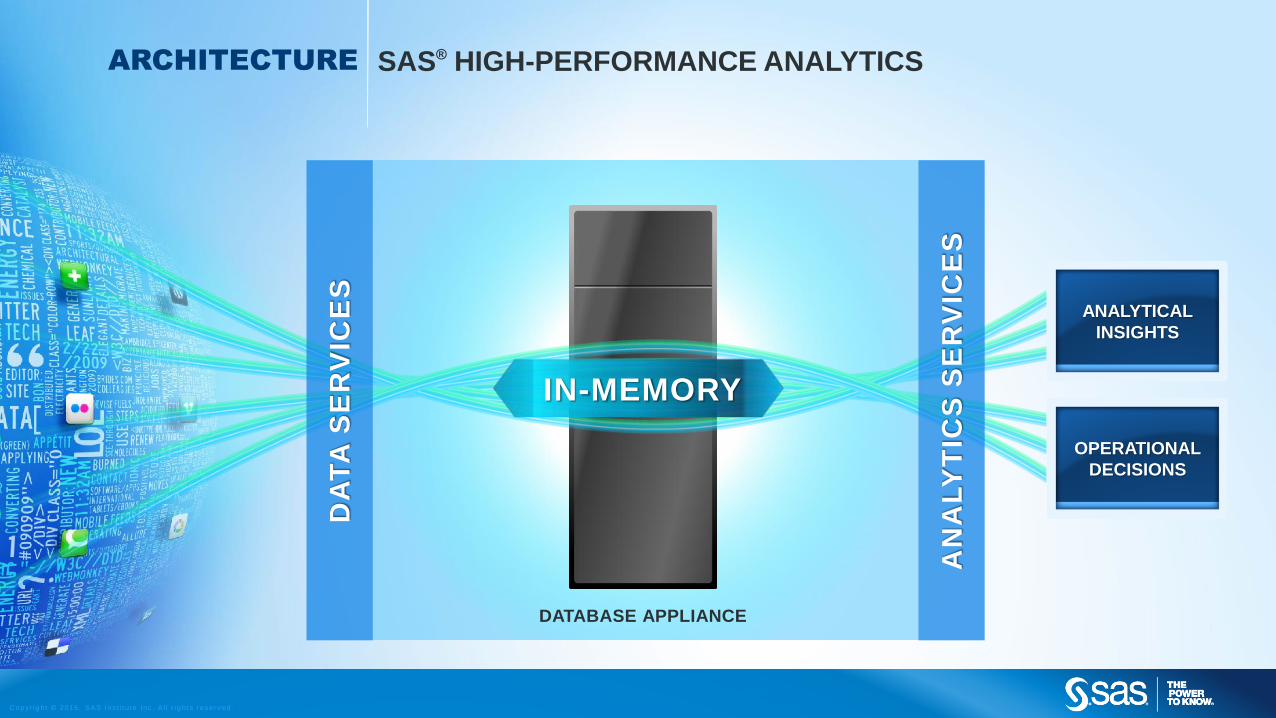
ANALYTICAL
INSIGHTS
OPERATIONAL
DECISIONS
DATABASE APPLIANCE
DA
TA
SE
RV
ICE
S
AN
AL
YT
ICS
SE
RV
ICE
S
ARCHITECTURE SAS® HIGH-PERFORMANCE ANALYTICS
IN-MEMORY
C op yr i g h t © 2015, SAS Ins t i t u te Inc . A l l r i g h ts r eser v ed .
SAS VISUAL
ANALYTICS
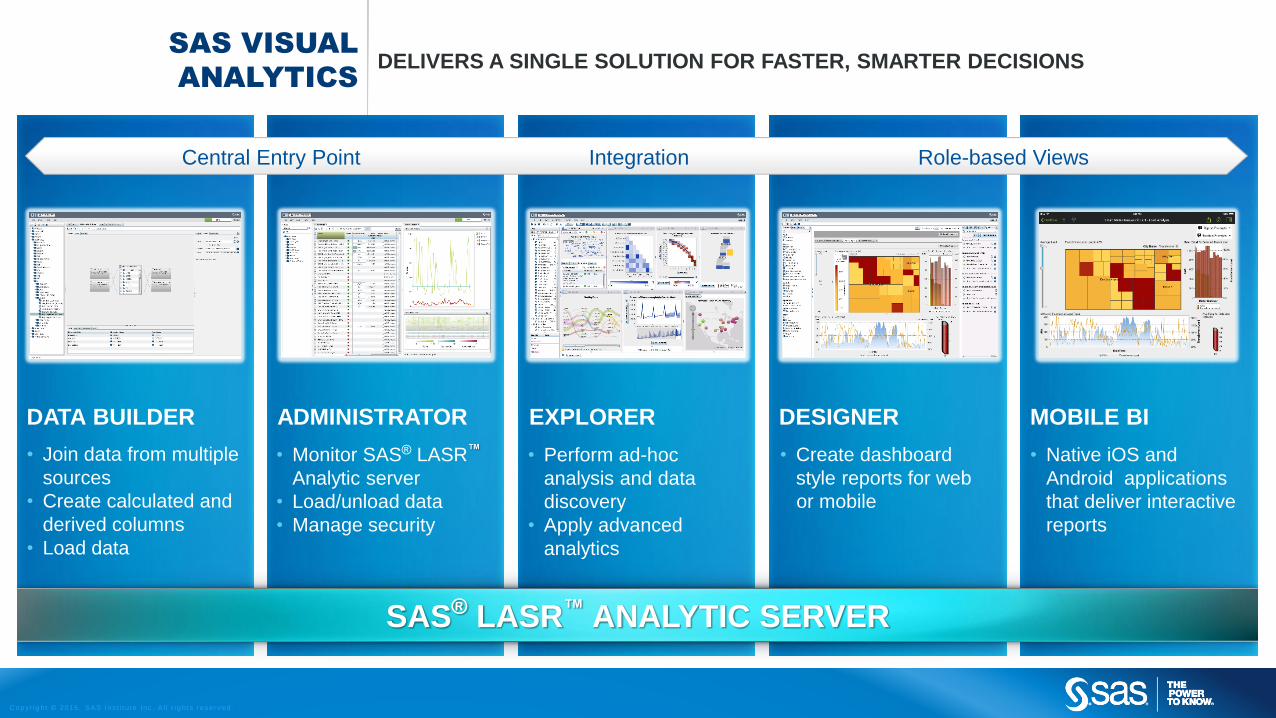
DELIVERS A SINGLE SOLUTION FOR FASTER, SMARTER DECISIONS
Central Entry Point Integration Role-based Views
MOBILE BI DATA BUILDER EXPLORER DESIGNER
• Native iOS and
Android applications
that deliver interactive
reports
• Join data from multiple
sources
• Create calculated and
derived columns
• Load data
• Perform ad-hoc
analysis and data
discovery
• Apply advanced
analytics
• Create dashboard
style reports for web
or mobile
SAS® LASR™ ANALYTIC SERVER
ADMINISTRATOR
• Monitor SAS® LASR™
Analytic server
• Load/unload data
• Manage security
C op yr i g h t © 2015, SAS Ins t i t u te Inc . A l l r i g h ts r eser v ed .
SAS VISUAL
ANALYTICS
DATA PREPARATION
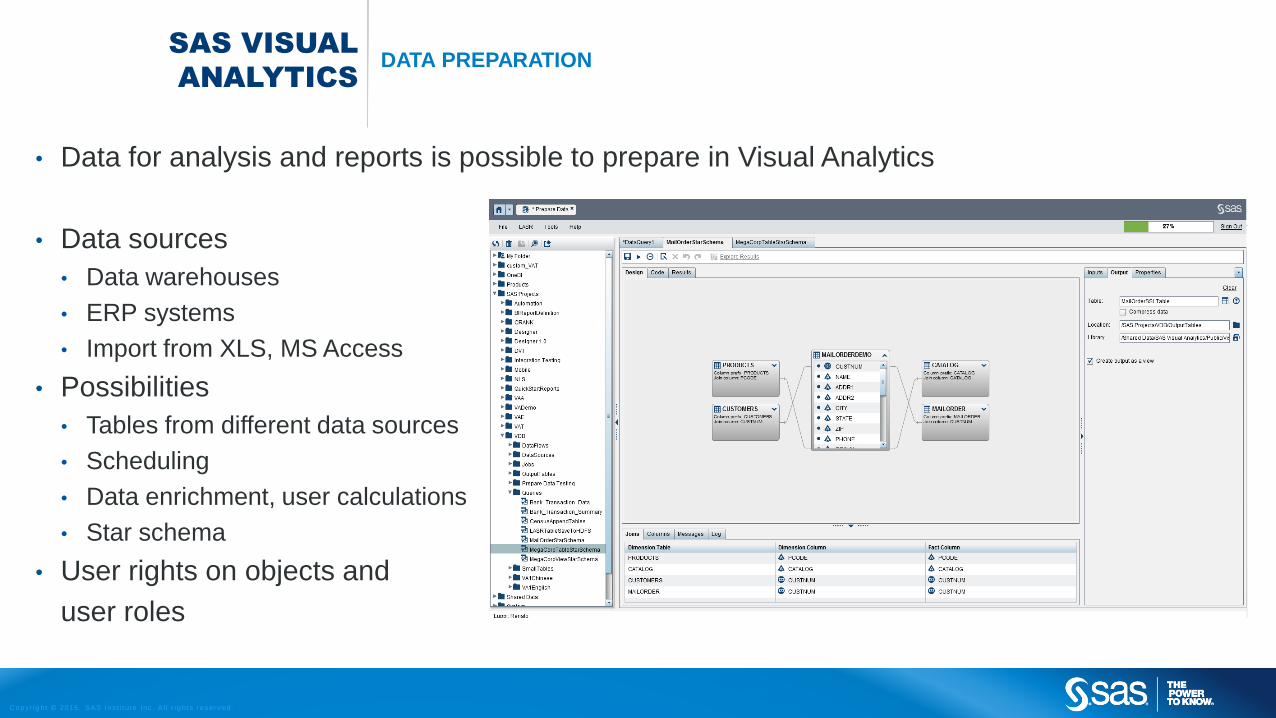
• Data for analysis and reports is possible to prepare in Visual Analytics
• Data sources
• Data warehouses
• ERP systems
• Import from XLS, MS Access
• Possibilities
• Tables from different data sources
• Scheduling
• Data enrichment, user calculations
• Star schema
• User rights on objects and
user roles
C op yr i g h t © 2015, SAS Ins t i t u te Inc . A l l r i g h ts r eser v ed .
SAS VISUAL
ANALYTICS
DATA PREPARATION
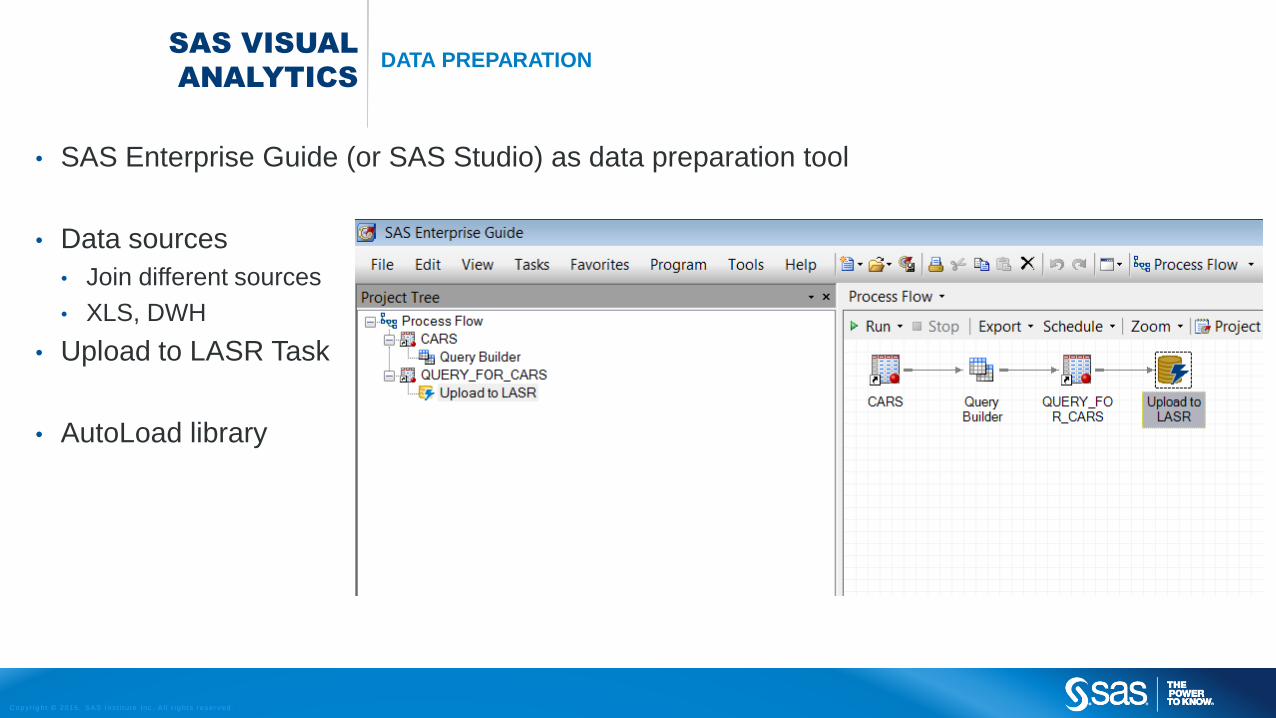
• SAS Enterprise Guide (or SAS Studio) as data preparation tool
• Data sources
• Join different sources
• XLS, DWH
• Upload to LASR Task
• AutoLoad library
C op yr i g h t © 2015, SAS Ins t i t u te Inc . A l l r i g h ts r eser v ed .
SAS VISUAL
ANALYTICS
REPORTING A VIZUALIZATIONS
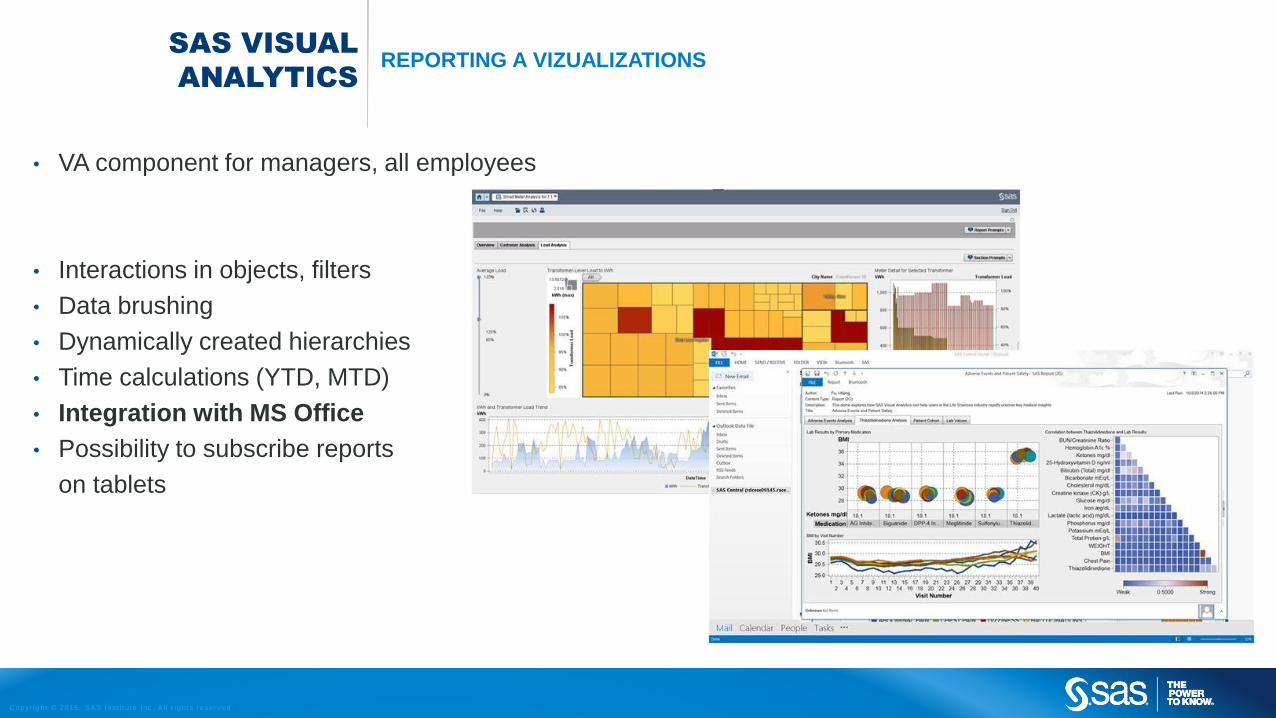
• VA component for managers, all employees
• Interactions in objects, filters
• Data brushing
• Dynamically created hierarchies
• Time calculations (YTD, MTD)
• Integration with MS Office
• Possibility to subscribe reports
on tablets
C op yr i g h t © 2015, SAS Ins t i t u te Inc . A l l r i g h ts r eser v ed .
SAS VISUAL
ANALYTICS
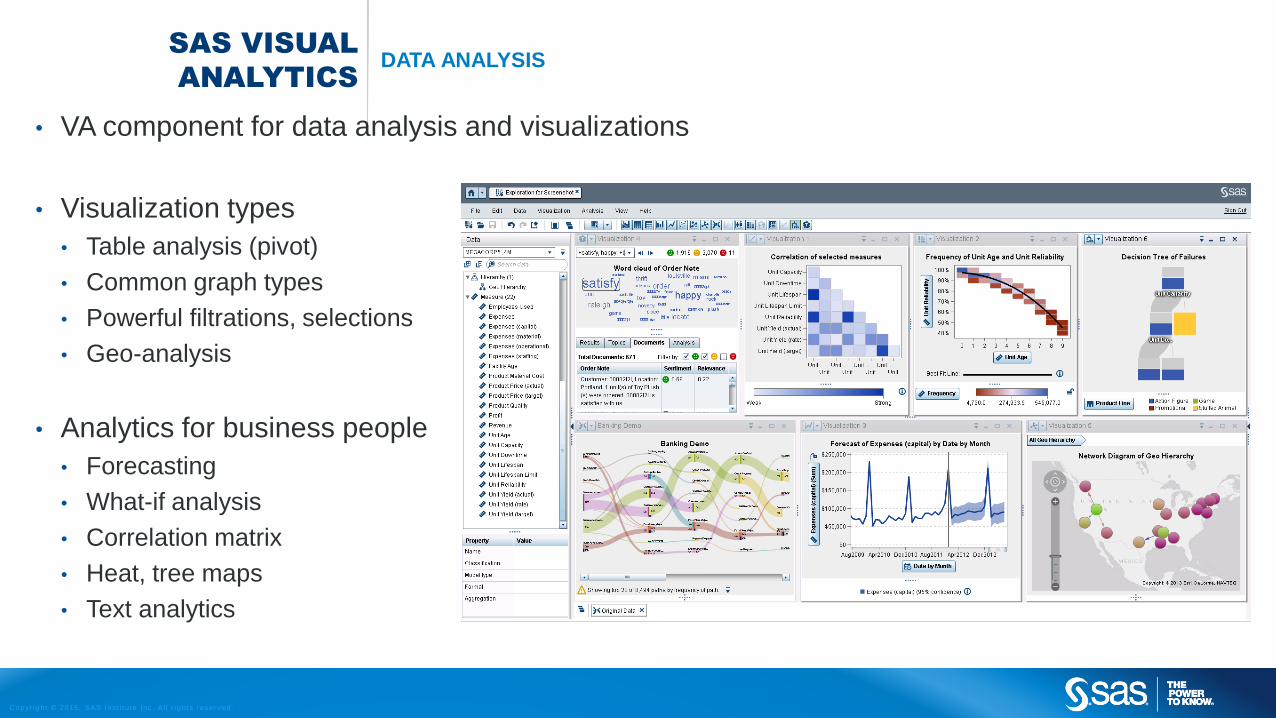
DATA ANALYSIS
• VA component for data analysis and visualizations
• Visualization types
• Table analysis (pivot)
• Common graph types
• Powerful filtrations, selections
• Geo-analysis
• Analytics for business people
• Forecasting
• What-if analysis
• Correlation matrix
• Heat, tree maps
• Text analytics