Residual properties of composites based on glass fiber ...
22
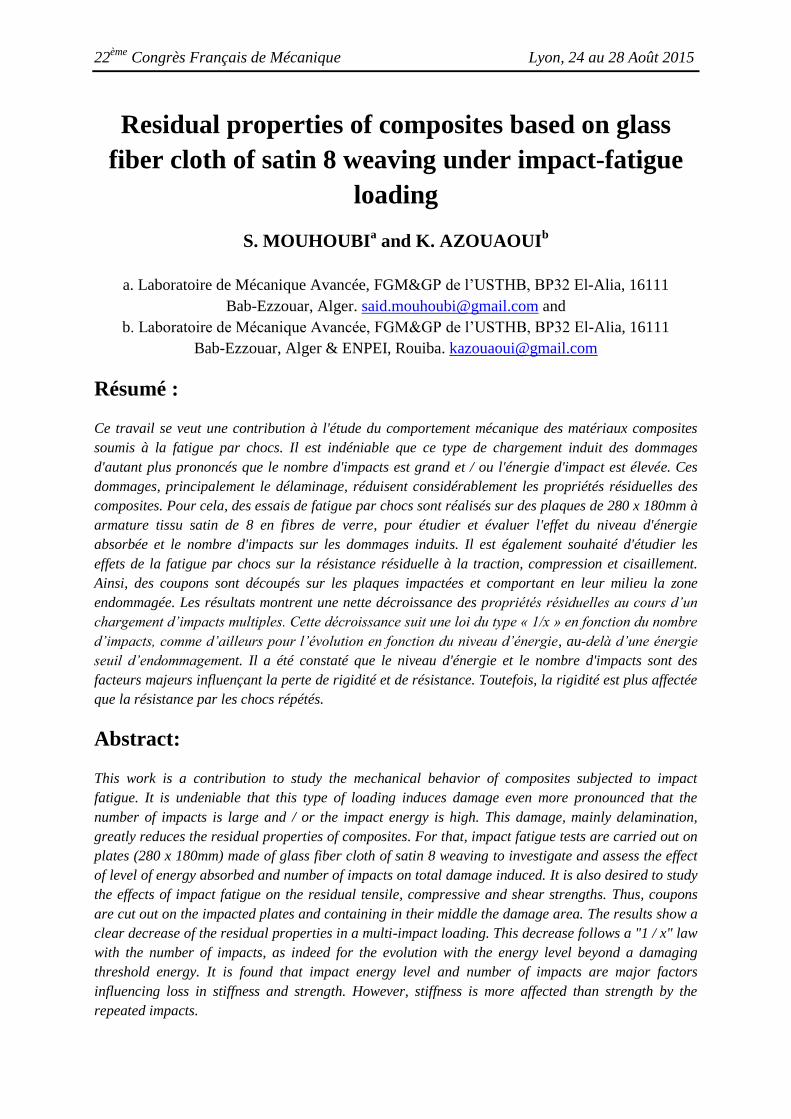
22 ème Congrès Français de Mécanique Lyon, 24 au 28 Août 2015 Residual properties of composites based on glass fiber cloth of satin 8 weaving under impact-fatigue loading S. MOUHOUBI a and K. AZOUAOUI b a. Laboratoire de Mécanique Avancée, FGM&GP de l’USTHB, BP32 El-Alia, 16111 Bab-Ezzouar, Alger. [email protected] and b. Laboratoire de Mécanique Avancée, FGM&GP de l’USTHB, BP32 El-Alia, 16111 Bab-Ezzouar, Alger & ENPEI, Rouiba. [email protected] Résumé : Ce travail se veut une contribution à l'étude du comportement mécanique des matériaux composites soumis à la fatigue par chocs. Il est indéniable que ce type de chargement induit des dommages d'autant plus prononcés que le nombre d'impacts est grand et / ou l'énergie d'impact est élevée. Ces dommages, principalement le délaminage, réduisent considérablement les propriétés résiduelles des composites. Pour cela, des essais de fatigue par chocs sont réalisés sur des plaques de 280 x 180mm à armature tissu satin de 8 en fibres de verre, pour étudier et évaluer l'effet du niveau d'énergie absorbée et le nombre d'impacts sur les dommages induits. Il est également souhaité d'étudier les effets de la fatigue par chocs sur la résistance résiduelle à la traction, compression et cisaillement. Ainsi, des coupons sont découpés sur les plaques impactées et comportant en leur milieu la zone endommagée. Les résultats montrent une nette décroissance des propriétés résiduelles au cours d’un chargement d’impacts multiples. Cette décroissance suit une loi du type « 1/x » en fonction du nombre d’impacts, comme d’ailleurs pour l’évolution en fonction du niveau d’énergie, au-delà d’une énergie seuil d’endommagement. Il a été constaté que le niveau d'énergie et le nombre d'impacts sont des facteurs majeurs influençant la perte de rigidité et de résistance. Toutefois, la rigidité est plus affectée que la résistance par les chocs répétés. Abstract: This work is a contribution to study the mechanical behavior of composites subjected to impact fatigue. It is undeniable that this type of loading induces damage even more pronounced that the number of impacts is large and / or the impact energy is high. This damage, mainly delamination, greatly reduces the residual properties of composites. For that, impact fatigue tests are carried out on plates (280 x 180mm) made of glass fiber cloth of satin 8 weaving to investigate and assess the effect of level of energy absorbed and number of impacts on total damage induced. It is also desired to study the effects of impact fatigue on the residual tensile, compressive and shear strengths. Thus, coupons are cut out on the impacted plates and containing in their middle the damage area. The results show a clear decrease of the residual properties in a multi-impact loading. This decrease follows a "1 / x" law with the number of impacts, as indeed for the evolution with the energy level beyond a damaging threshold energy. It is found that impact energy level and number of impacts are major factors influencing loss in stiffness and strength. However, stiffness is more affected than strength by the repeated impacts.
Transcript of Residual properties of composites based on glass fiber ...
22ème
Congrès Français de Mécanique Lyon, 24 au 28 Août 2015
Residual properties of composites based on glass
fiber cloth of satin 8 weaving under impact-fatigue
loading
S. MOUHOUBIa and K. AZOUAOUI
b
a. Laboratoire de Mécanique Avancée, FGM&GP de l’USTHB, BP32 El-Alia, 16111
Bab-Ezzouar, Alger. [email protected] and
b. Laboratoire de Mécanique Avancée, FGM&GP de l’USTHB, BP32 El-Alia, 16111
Bab-Ezzouar, Alger & ENPEI, Rouiba. [email protected]
Résumé :
Ce travail se veut une contribution à l'étude du comportement mécanique des matériaux composites
soumis à la fatigue par chocs. Il est indéniable que ce type de chargement induit des dommages
d'autant plus prononcés que le nombre d'impacts est grand et / ou l'énergie d'impact est élevée. Ces
dommages, principalement le délaminage, réduisent considérablement les propriétés résiduelles des
composites. Pour cela, des essais de fatigue par chocs sont réalisés sur des plaques de 280 x 180mm à
armature tissu satin de 8 en fibres de verre, pour étudier et évaluer l'effet du niveau d'énergie
absorbée et le nombre d'impacts sur les dommages induits. Il est également souhaité d'étudier les
effets de la fatigue par chocs sur la résistance résiduelle à la traction, compression et cisaillement.
Ainsi, des coupons sont découpés sur les plaques impactées et comportant en leur milieu la zone
endommagée. Les résultats montrent une nette décroissance des propriétés résiduelles au cours d’un
chargement d’impacts multiples. Cette décroissance suit une loi du type « 1/x » en fonction du nombre
d’impacts, comme d’ailleurs pour l’évolution en fonction du niveau d’énergie, au-delà d’une énergie
seuil d’endommagement. Il a été constaté que le niveau d'énergie et le nombre d'impacts sont des
facteurs majeurs influençant la perte de rigidité et de résistance. Toutefois, la rigidité est plus affectée
que la résistance par les chocs répétés.
Abstract:
This work is a contribution to study the mechanical behavior of composites subjected to impact
fatigue. It is undeniable that this type of loading induces damage even more pronounced that the
number of impacts is large and / or the impact energy is high. This damage, mainly delamination,
greatly reduces the residual properties of composites. For that, impact fatigue tests are carried out on
plates (280 x 180mm) made of glass fiber cloth of satin 8 weaving to investigate and assess the effect
of level of energy absorbed and number of impacts on total damage induced. It is also desired to study
the effects of impact fatigue on the residual tensile, compressive and shear strengths. Thus, coupons
are cut out on the impacted plates and containing in their middle the damage area. The results show a
clear decrease of the residual properties in a multi-impact loading. This decrease follows a "1 / x" law
with the number of impacts, as indeed for the evolution with the energy level beyond a damaging
threshold energy. It is found that impact energy level and number of impacts are major factors
influencing loss in stiffness and strength. However, stiffness is more affected than strength by the
repeated impacts.
22ème
Congrès Français de Mécanique Lyon, 24 au 28 Août 2015
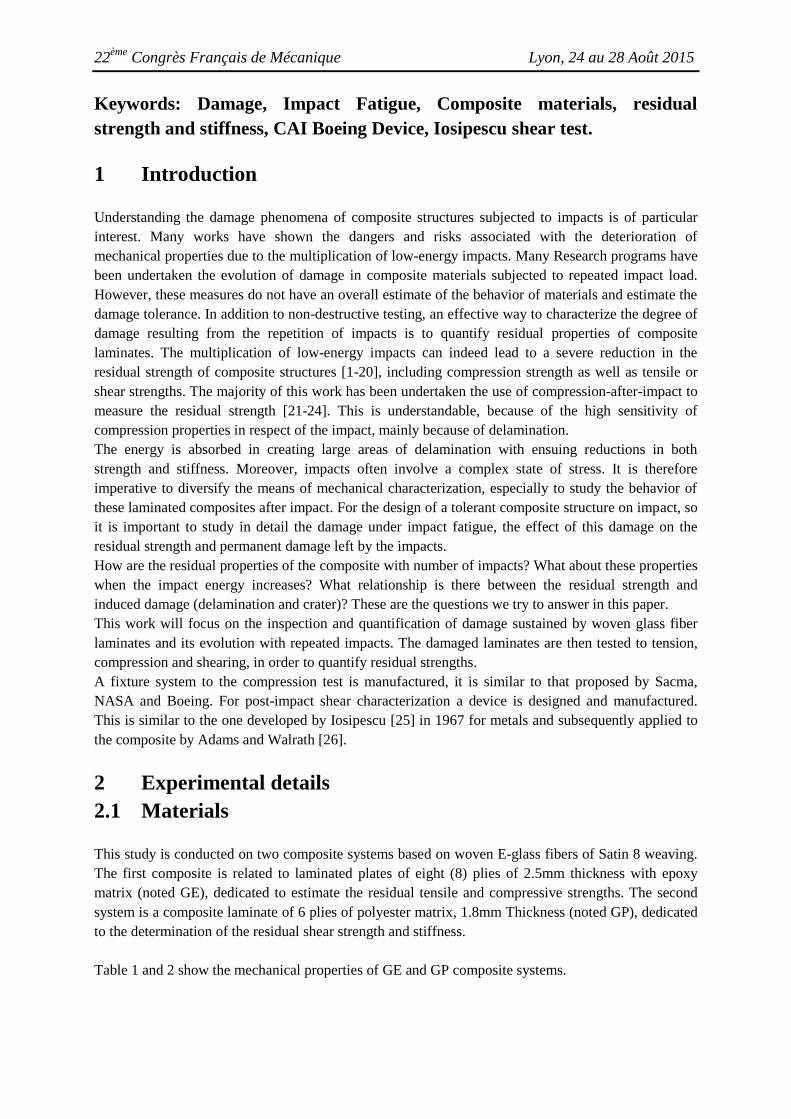
Keywords: Damage, Impact Fatigue, Composite materials, residual
strength and stiffness, CAI Boeing Device, Iosipescu shear test.
1 Introduction
Understanding the damage phenomena of composite structures subjected to impacts is of particular
interest. Many works have shown the dangers and risks associated with the deterioration of
mechanical properties due to the multiplication of low-energy impacts. Many Research programs have
been undertaken the evolution of damage in composite materials subjected to repeated impact load.
However, these measures do not have an overall estimate of the behavior of materials and estimate the
damage tolerance. In addition to non-destructive testing, an effective way to characterize the degree of
damage resulting from the repetition of impacts is to quantify residual properties of composite
laminates. The multiplication of low-energy impacts can indeed lead to a severe reduction in the
residual strength of composite structures [1-20], including compression strength as well as tensile or
shear strengths. The majority of this work has been undertaken the use of compression-after-impact to
measure the residual strength [21-24]. This is understandable, because of the high sensitivity of
compression properties in respect of the impact, mainly because of delamination.
The energy is absorbed in creating large areas of delamination with ensuing reductions in both
strength and stiffness. Moreover, impacts often involve a complex state of stress. It is therefore
imperative to diversify the means of mechanical characterization, especially to study the behavior of
these laminated composites after impact. For the design of a tolerant composite structure on impact, so
it is important to study in detail the damage under impact fatigue, the effect of this damage on the
residual strength and permanent damage left by the impacts.
How are the residual properties of the composite with number of impacts? What about these properties
when the impact energy increases? What relationship is there between the residual strength and
induced damage (delamination and crater)? These are the questions we try to answer in this paper.
This work will focus on the inspection and quantification of damage sustained by woven glass fiber
laminates and its evolution with repeated impacts. The damaged laminates are then tested to tension,
compression and shearing, in order to quantify residual strengths.
A fixture system to the compression test is manufactured, it is similar to that proposed by Sacma,
NASA and Boeing. For post-impact shear characterization a device is designed and manufactured.
This is similar to the one developed by Iosipescu [25] in 1967 for metals and subsequently applied to
the composite by Adams and Walrath [26].
2 Experimental details
2.1 Materials
This study is conducted on two composite systems based on woven E-glass fibers of Satin 8 weaving.
The first composite is related to laminated plates of eight (8) plies of 2.5mm thickness with epoxy
matrix (noted GE), dedicated to estimate the residual tensile and compressive strengths. The second
system is a composite laminate of 6 plies of polyester matrix, 1.8mm Thickness (noted GP), dedicated
to the determination of the residual shear strength and stiffness.
Table 1 and 2 show the mechanical properties of GE and GP composite systems.
22ème
Congrès Français de Mécanique Lyon, 24 au 28 Août 2015
Table 1. The ultimate stresses in tension and compression of woven GE system.
Material Tensile ultimate stress
(MPa)
Compressive ultimate
stress (MPa)
Glass/Epoxy 271 112
Table 2. Shear mechanical properties of woven GP system.
Material Shear ultimate stress
(MPa)
Shear modulus
(GPa)
Glass/Polyester 42,85 5,82
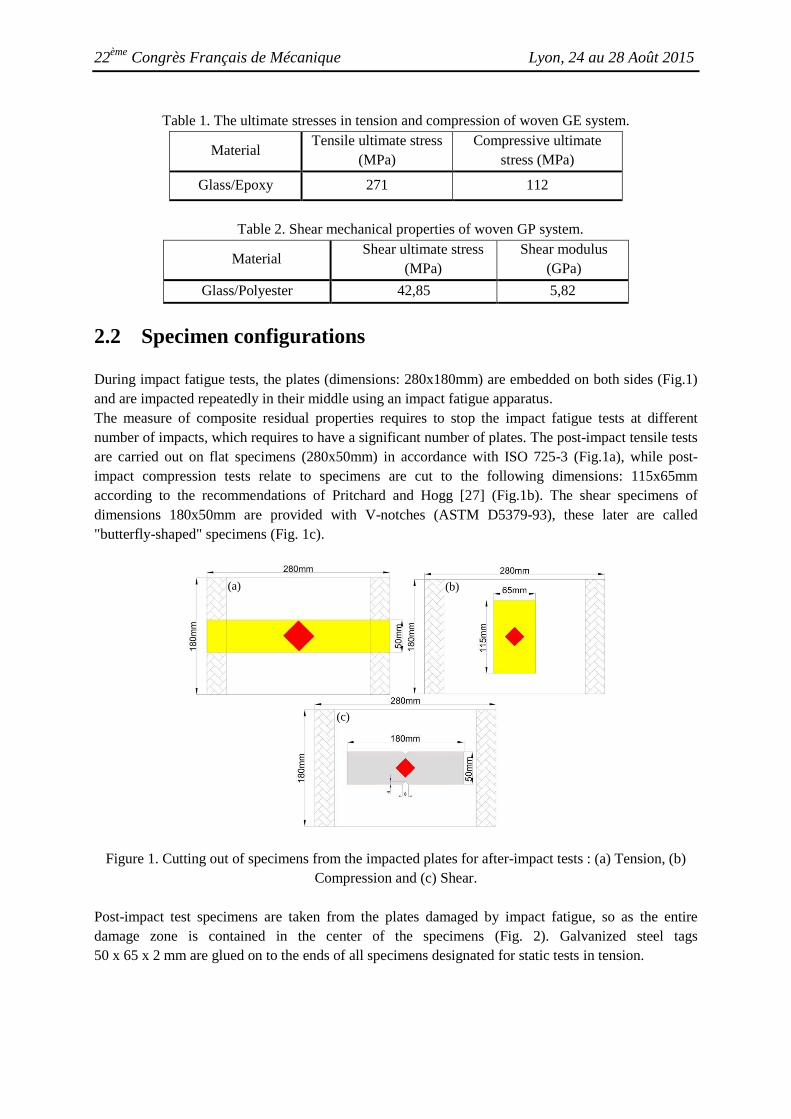
2.2 Specimen configurations
During impact fatigue tests, the plates (dimensions: 280x180mm) are embedded on both sides (Fig.1)
and are impacted repeatedly in their middle using an impact fatigue apparatus.
The measure of composite residual properties requires to stop the impact fatigue tests at different
number of impacts, which requires to have a significant number of plates. The post-impact tensile tests
are carried out on flat specimens (280x50mm) in accordance with ISO 725-3 (Fig.1a), while post-
impact compression tests relate to specimens are cut to the following dimensions: 115x65mm
according to the recommendations of Pritchard and Hogg [27] (Fig.1b). The shear specimens of
dimensions 180x50mm are provided with V-notches (ASTM D5379-93), these later are called
"butterfly-shaped" specimens (Fig. 1c).
Figure 1. Cutting out of specimens from the impacted plates for after-impact tests : (a) Tension, (b)
Compression and (c) Shear.
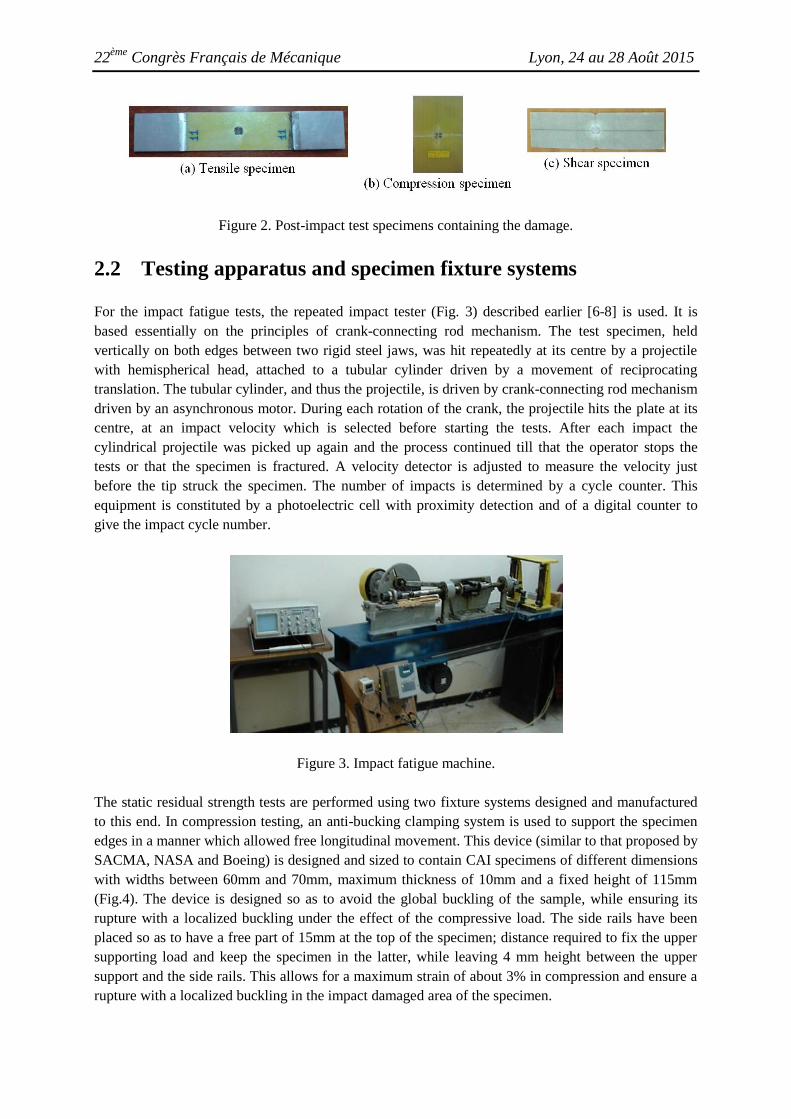
Post-impact test specimens are taken from the plates damaged by impact fatigue, so as the entire
damage zone is contained in the center of the specimens (Fig. 2). Galvanized steel tags
50 x 65 x 2 mm are glued on to the ends of all specimens designated for static tests in tension.
(a) (b)
(c)
22ème
Congrès Français de Mécanique Lyon, 24 au 28 Août 2015
Figure 2. Post-impact test specimens containing the damage.
2.2 Testing apparatus and specimen fixture systems
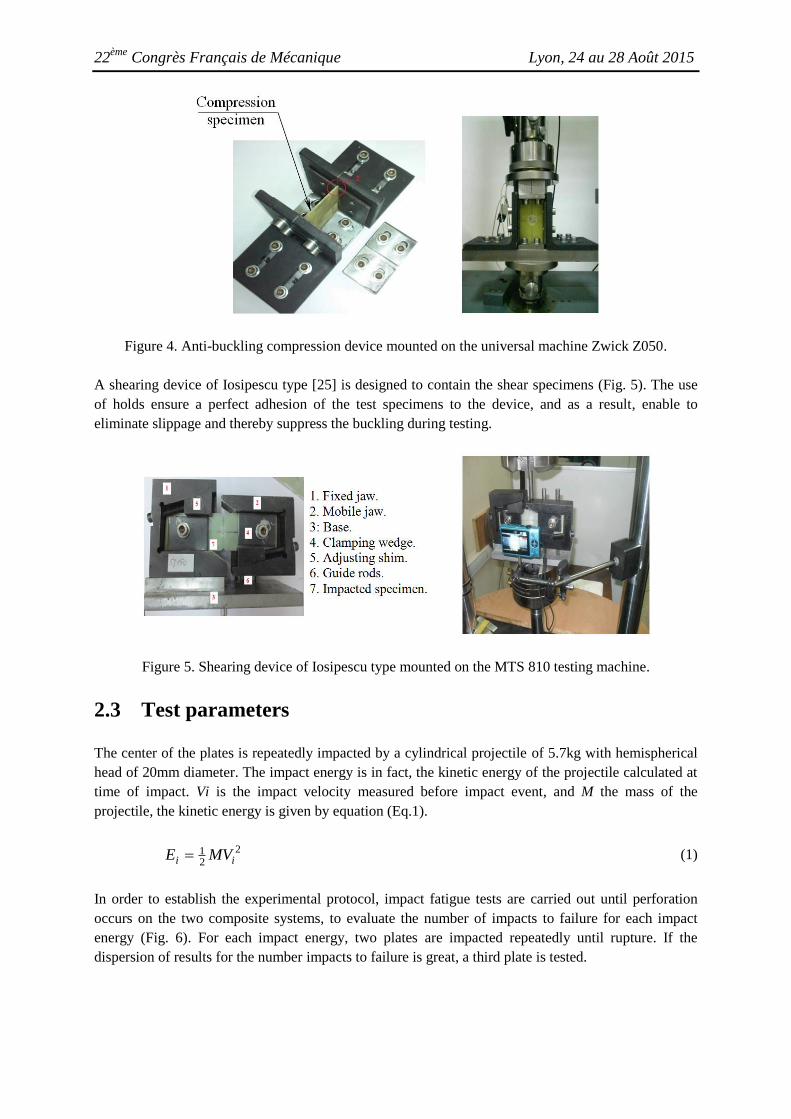
For the impact fatigue tests, the repeated impact tester (Fig. 3) described earlier [6-8] is used. It is
based essentially on the principles of crank-connecting rod mechanism. The test specimen, held
vertically on both edges between two rigid steel jaws, was hit repeatedly at its centre by a projectile
with hemispherical head, attached to a tubular cylinder driven by a movement of reciprocating
translation. The tubular cylinder, and thus the projectile, is driven by crank-connecting rod mechanism
driven by an asynchronous motor. During each rotation of the crank, the projectile hits the plate at its
centre, at an impact velocity which is selected before starting the tests. After each impact the
cylindrical projectile was picked up again and the process continued till that the operator stops the
tests or that the specimen is fractured. A velocity detector is adjusted to measure the velocity just
before the tip struck the specimen. The number of impacts is determined by a cycle counter. This
equipment is constituted by a photoelectric cell with proximity detection and of a digital counter to
give the impact cycle number.
Figure 3. Impact fatigue machine.
The static residual strength tests are performed using two fixture systems designed and manufactured
to this end. In compression testing, an anti-bucking clamping system is used to support the specimen
edges in a manner which allowed free longitudinal movement. This device (similar to that proposed by
SACMA, NASA and Boeing) is designed and sized to contain CAI specimens of different dimensions
with widths between 60mm and 70mm, maximum thickness of 10mm and a fixed height of 115mm
(Fig.4). The device is designed so as to avoid the global buckling of the sample, while ensuring its
rupture with a localized buckling under the effect of the compressive load. The side rails have been
placed so as to have a free part of 15mm at the top of the specimen; distance required to fix the upper
supporting load and keep the specimen in the latter, while leaving 4 mm height between the upper
support and the side rails. This allows for a maximum strain of about 3% in compression and ensure a
rupture with a localized buckling in the impact damaged area of the specimen.
22ème
Congrès Français de Mécanique Lyon, 24 au 28 Août 2015
Figure 4. Anti-buckling compression device mounted on the universal machine Zwick Z050.
A shearing device of Iosipescu type [25] is designed to contain the shear specimens (Fig. 5). The use
of holds ensure a perfect adhesion of the test specimens to the device, and as a result, enable to
eliminate slippage and thereby suppress the buckling during testing.
Figure 5. Shearing device of Iosipescu type mounted on the MTS 810 testing machine.
2.3 Test parameters
The center of the plates is repeatedly impacted by a cylindrical projectile of 5.7kg with hemispherical
head of 20mm diameter. The impact energy is in fact, the kinetic energy of the projectile calculated at
time of impact. Vi is the impact velocity measured before impact event, and M the mass of the
projectile, the kinetic energy is given by equation (Eq.1).
2
21
ii MVE (1)
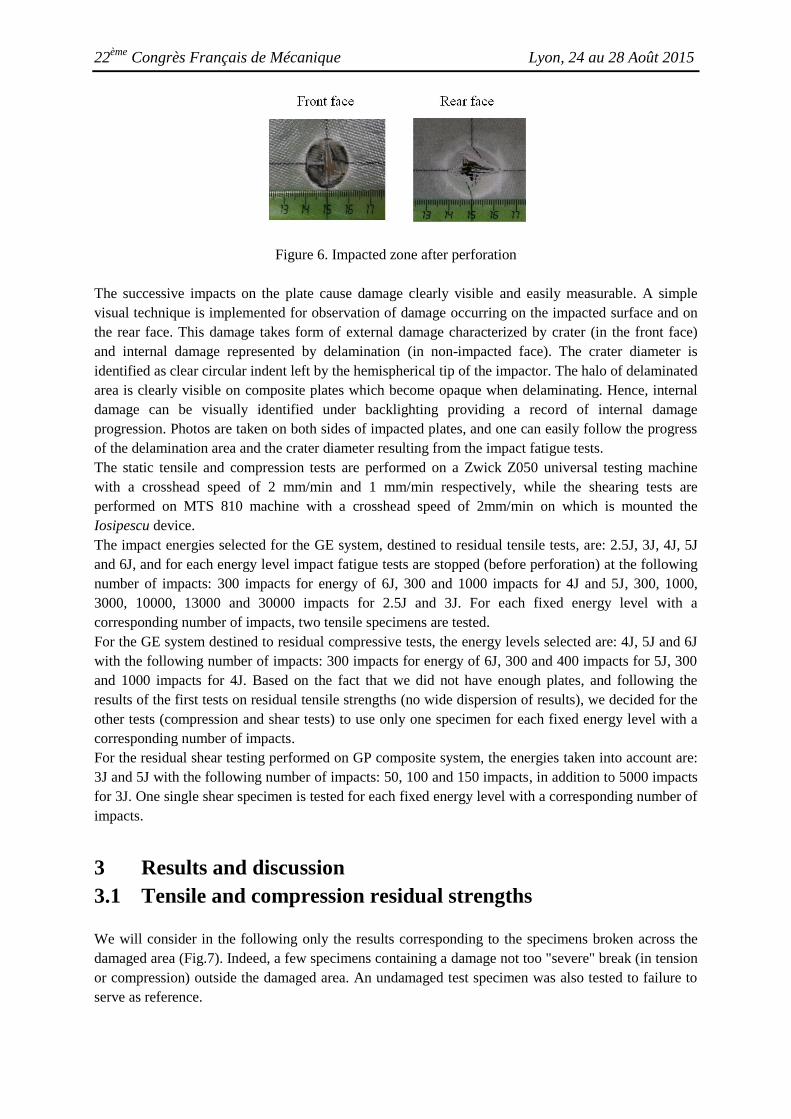
In order to establish the experimental protocol, impact fatigue tests are carried out until perforation
occurs on the two composite systems, to evaluate the number of impacts to failure for each impact
energy (Fig. 6). For each impact energy, two plates are impacted repeatedly until rupture. If the
dispersion of results for the number impacts to failure is great, a third plate is tested.
22ème
Congrès Français de Mécanique Lyon, 24 au 28 Août 2015
Figure 6. Impacted zone after perforation
The successive impacts on the plate cause damage clearly visible and easily measurable. A simple
visual technique is implemented for observation of damage occurring on the impacted surface and on
the rear face. This damage takes form of external damage characterized by crater (in the front face)
and internal damage represented by delamination (in non-impacted face). The crater diameter is
identified as clear circular indent left by the hemispherical tip of the impactor. The halo of delaminated
area is clearly visible on composite plates which become opaque when delaminating. Hence, internal
damage can be visually identified under backlighting providing a record of internal damage
progression. Photos are taken on both sides of impacted plates, and one can easily follow the progress
of the delamination area and the crater diameter resulting from the impact fatigue tests.
The static tensile and compression tests are performed on a Zwick Z050 universal testing machine
with a crosshead speed of 2 mm/min and 1 mm/min respectively, while the shearing tests are
performed on MTS 810 machine with a crosshead speed of 2mm/min on which is mounted the
Iosipescu device.
The impact energies selected for the GE system, destined to residual tensile tests, are: 2.5J, 3J, 4J, 5J
and 6J, and for each energy level impact fatigue tests are stopped (before perforation) at the following
number of impacts: 300 impacts for energy of 6J, 300 and 1000 impacts for 4J and 5J, 300, 1000,
3000, 10000, 13000 and 30000 impacts for 2.5J and 3J. For each fixed energy level with a
corresponding number of impacts, two tensile specimens are tested.
For the GE system destined to residual compressive tests, the energy levels selected are: 4J, 5J and 6J
with the following number of impacts: 300 impacts for energy of 6J, 300 and 400 impacts for 5J, 300
and 1000 impacts for 4J. Based on the fact that we did not have enough plates, and following the
results of the first tests on residual tensile strengths (no wide dispersion of results), we decided for the
other tests (compression and shear tests) to use only one specimen for each fixed energy level with a
corresponding number of impacts.
For the residual shear testing performed on GP composite system, the energies taken into account are:
3J and 5J with the following number of impacts: 50, 100 and 150 impacts, in addition to 5000 impacts
for 3J. One single shear specimen is tested for each fixed energy level with a corresponding number of
impacts.
3 Results and discussion
3.1 Tensile and compression residual strengths
We will consider in the following only the results corresponding to the specimens broken across the
damaged area (Fig.7). Indeed, a few specimens containing a damage not too "severe" break (in tension
or compression) outside the damaged area. An undamaged test specimen was also tested to failure to
serve as reference.
22ème
Congrès Français de Mécanique Lyon, 24 au 28 Août 2015
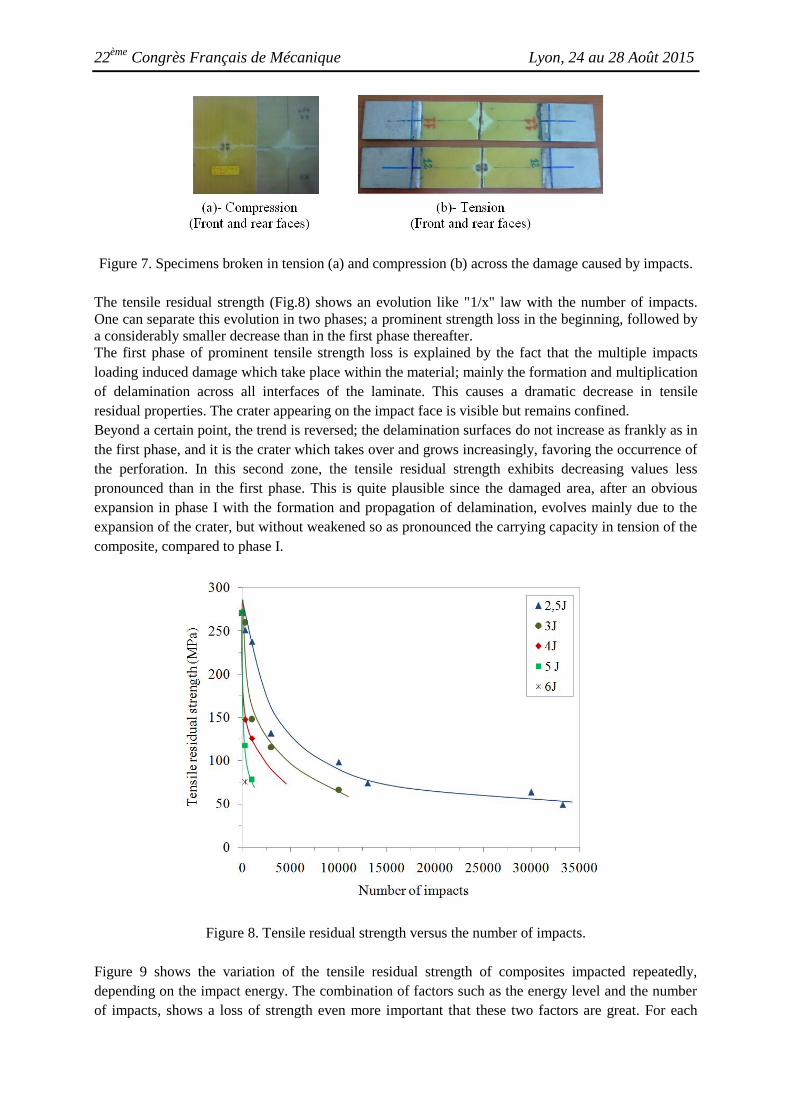
Figure 7. Specimens broken in tension (a) and compression (b) across the damage caused by impacts.
The tensile residual strength (Fig.8) shows an evolution like "1/x" law with the number of impacts.
One can separate this evolution in two phases; a prominent strength loss in the beginning, followed by
a considerably smaller decrease than in the first phase thereafter.
The first phase of prominent tensile strength loss is explained by the fact that the multiple impacts
loading induced damage which take place within the material; mainly the formation and multiplication
of delamination across all interfaces of the laminate. This causes a dramatic decrease in tensile
residual properties. The crater appearing on the impact face is visible but remains confined.
Beyond a certain point, the trend is reversed; the delamination surfaces do not increase as frankly as in
the first phase, and it is the crater which takes over and grows increasingly, favoring the occurrence of
the perforation. In this second zone, the tensile residual strength exhibits decreasing values less
pronounced than in the first phase. This is quite plausible since the damaged area, after an obvious
expansion in phase I with the formation and propagation of delamination, evolves mainly due to the
expansion of the crater, but without weakened so as pronounced the carrying capacity in tension of the
composite, compared to phase I.
Figure 8. Tensile residual strength versus the number of impacts.
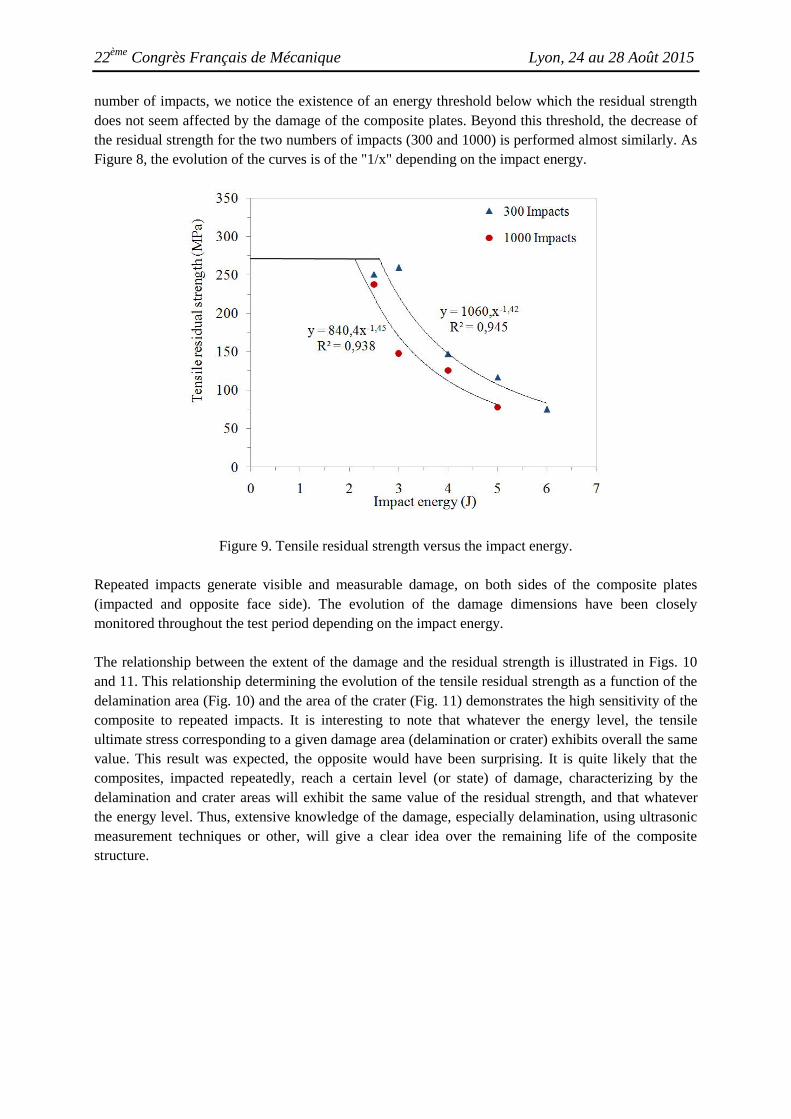
Figure 9 shows the variation of the tensile residual strength of composites impacted repeatedly,
depending on the impact energy. The combination of factors such as the energy level and the number
of impacts, shows a loss of strength even more important that these two factors are great. For each
22ème
Congrès Français de Mécanique Lyon, 24 au 28 Août 2015
number of impacts, we notice the existence of an energy threshold below which the residual strength
does not seem affected by the damage of the composite plates. Beyond this threshold, the decrease of
the residual strength for the two numbers of impacts (300 and 1000) is performed almost similarly. As
Figure 8, the evolution of the curves is of the "1/x" depending on the impact energy.
Figure 9. Tensile residual strength versus the impact energy.
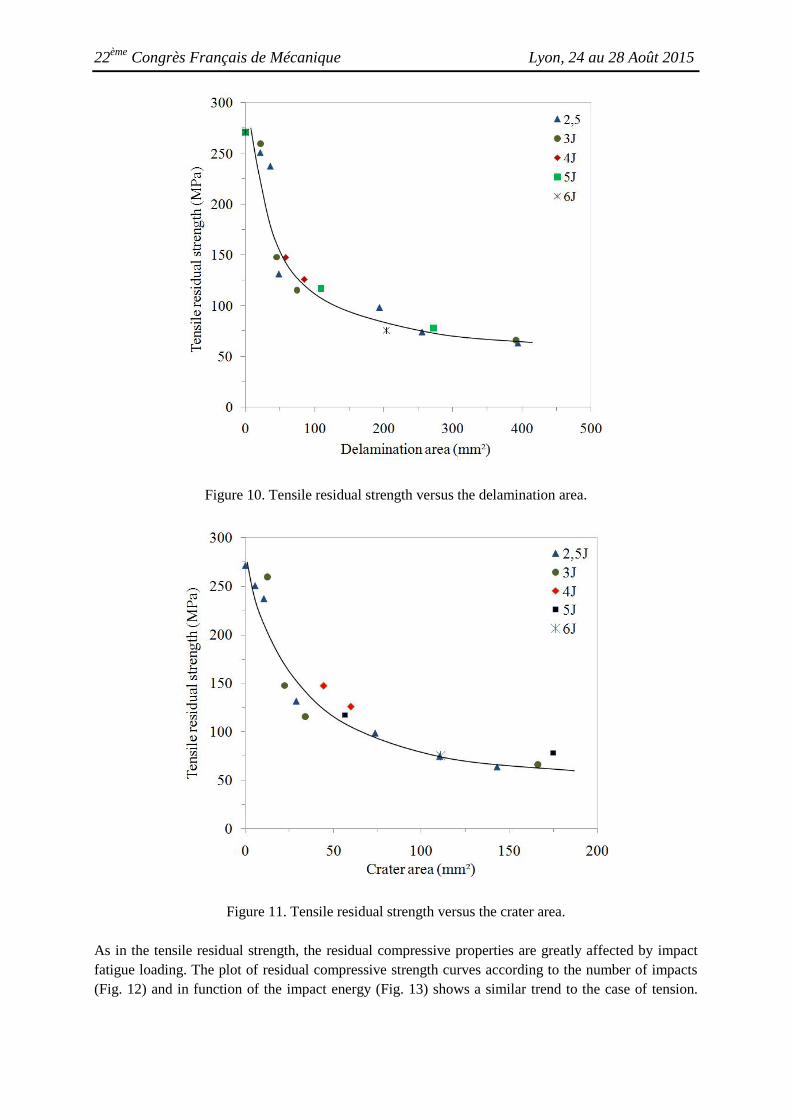
Repeated impacts generate visible and measurable damage, on both sides of the composite plates
(impacted and opposite face side). The evolution of the damage dimensions have been closely
monitored throughout the test period depending on the impact energy.
The relationship between the extent of the damage and the residual strength is illustrated in Figs. 10
and 11. This relationship determining the evolution of the tensile residual strength as a function of the
delamination area (Fig. 10) and the area of the crater (Fig. 11) demonstrates the high sensitivity of the
composite to repeated impacts. It is interesting to note that whatever the energy level, the tensile
ultimate stress corresponding to a given damage area (delamination or crater) exhibits overall the same
value. This result was expected, the opposite would have been surprising. It is quite likely that the
composites, impacted repeatedly, reach a certain level (or state) of damage, characterizing by the
delamination and crater areas will exhibit the same value of the residual strength, and that whatever
the energy level. Thus, extensive knowledge of the damage, especially delamination, using ultrasonic
measurement techniques or other, will give a clear idea over the remaining life of the composite
structure.
22ème
Congrès Français de Mécanique Lyon, 24 au 28 Août 2015
Figure 10. Tensile residual strength versus the delamination area.
Figure 11. Tensile residual strength versus the crater area.
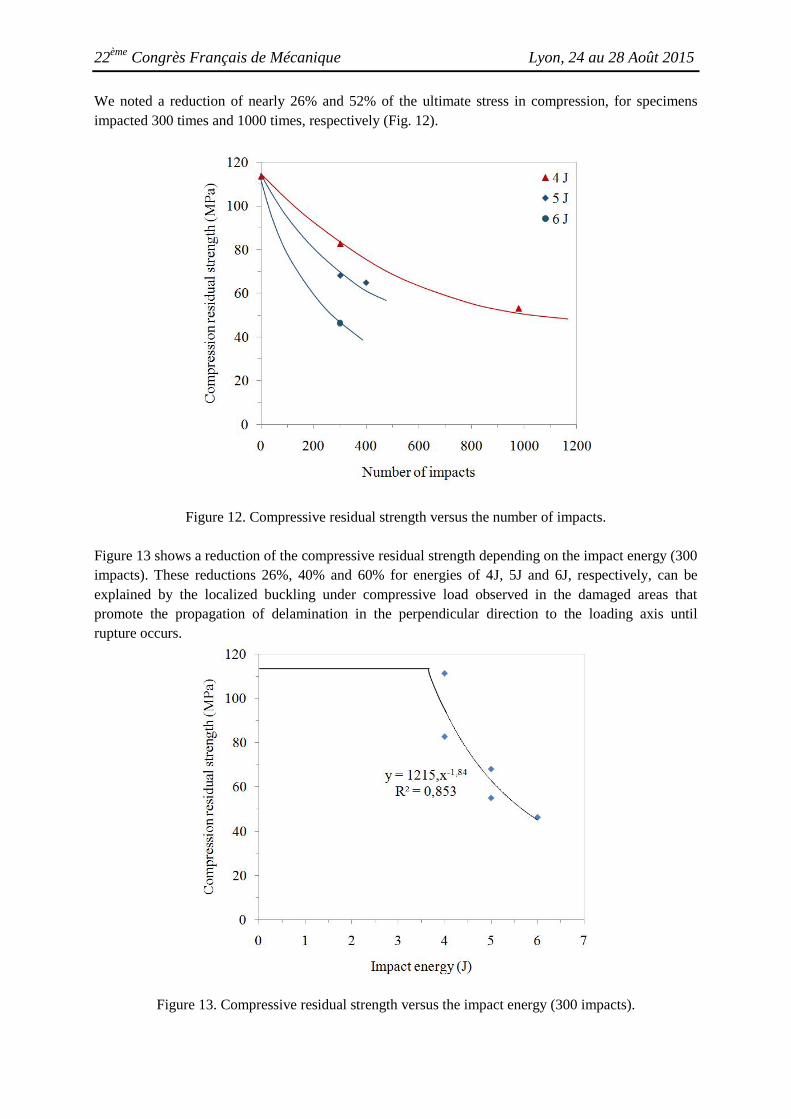
As in the tensile residual strength, the residual compressive properties are greatly affected by impact
fatigue loading. The plot of residual compressive strength curves according to the number of impacts
(Fig. 12) and in function of the impact energy (Fig. 13) shows a similar trend to the case of tension.
22ème
Congrès Français de Mécanique Lyon, 24 au 28 Août 2015
We noted a reduction of nearly 26% and 52% of the ultimate stress in compression, for specimens
impacted 300 times and 1000 times, respectively (Fig. 12).
Figure 12. Compressive residual strength versus the number of impacts.
Figure 13 shows a reduction of the compressive residual strength depending on the impact energy (300
impacts). These reductions 26%, 40% and 60% for energies of 4J, 5J and 6J, respectively, can be
explained by the localized buckling under compressive load observed in the damaged areas that
promote the propagation of delamination in the perpendicular direction to the loading axis until
rupture occurs.
Figure 13. Compressive residual strength versus the impact energy (300 impacts).
22ème
Congrès Français de Mécanique Lyon, 24 au 28 Août 2015
3.2 Shear residual properties
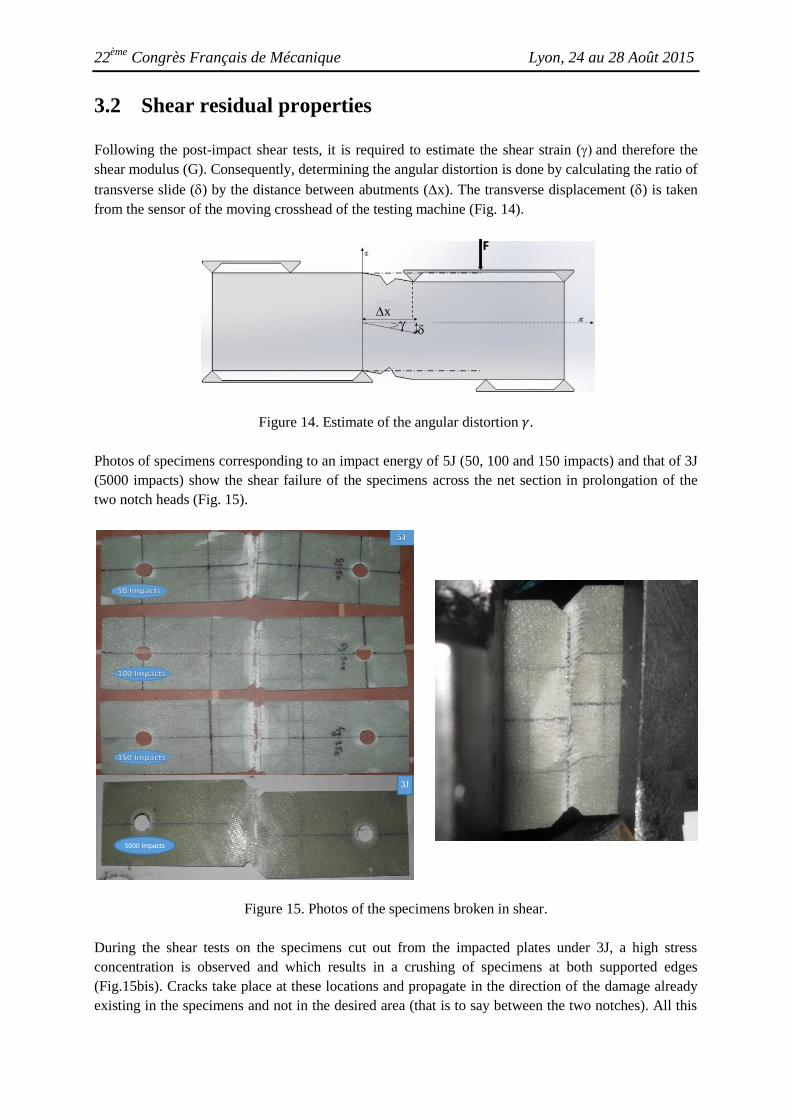
Following the post-impact shear tests, it is required to estimate the shear strain (and therefore the
shear modulus (G). Consequently, determining the angular distortion is done by calculating the ratio of
transverse slide () by the distance between abutments (x). The transverse displacement () is taken
from the sensor of the moving crosshead of the testing machine (Fig. 14).
Figure 14. Estimate of the angular distortion 𝛾.
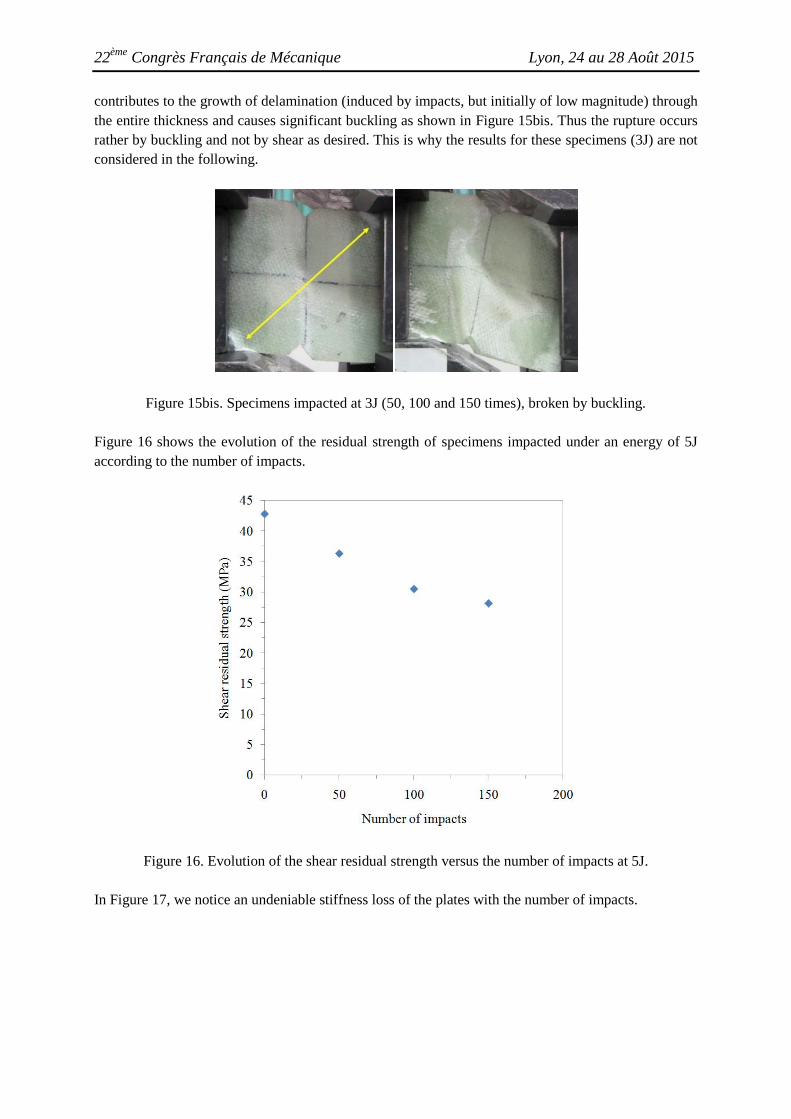
Photos of specimens corresponding to an impact energy of 5J (50, 100 and 150 impacts) and that of 3J
(5000 impacts) show the shear failure of the specimens across the net section in prolongation of the
two notch heads (Fig. 15).
Figure 15. Photos of the specimens broken in shear.
During the shear tests on the specimens cut out from the impacted plates under 3J, a high stress
concentration is observed and which results in a crushing of specimens at both supported edges
(Fig.15bis). Cracks take place at these locations and propagate in the direction of the damage already
existing in the specimens and not in the desired area (that is to say between the two notches). All this
x
3J
5000 Impacts
22ème
Congrès Français de Mécanique Lyon, 24 au 28 Août 2015
contributes to the growth of delamination (induced by impacts, but initially of low magnitude) through
the entire thickness and causes significant buckling as shown in Figure 15bis. Thus the rupture occurs
rather by buckling and not by shear as desired. This is why the results for these specimens (3J) are not
considered in the following.
Figure 15bis. Specimens impacted at 3J (50, 100 and 150 times), broken by buckling.
Figure 16 shows the evolution of the residual strength of specimens impacted under an energy of 5J
according to the number of impacts.
Figure 16. Evolution of the shear residual strength versus the number of impacts at 5J.
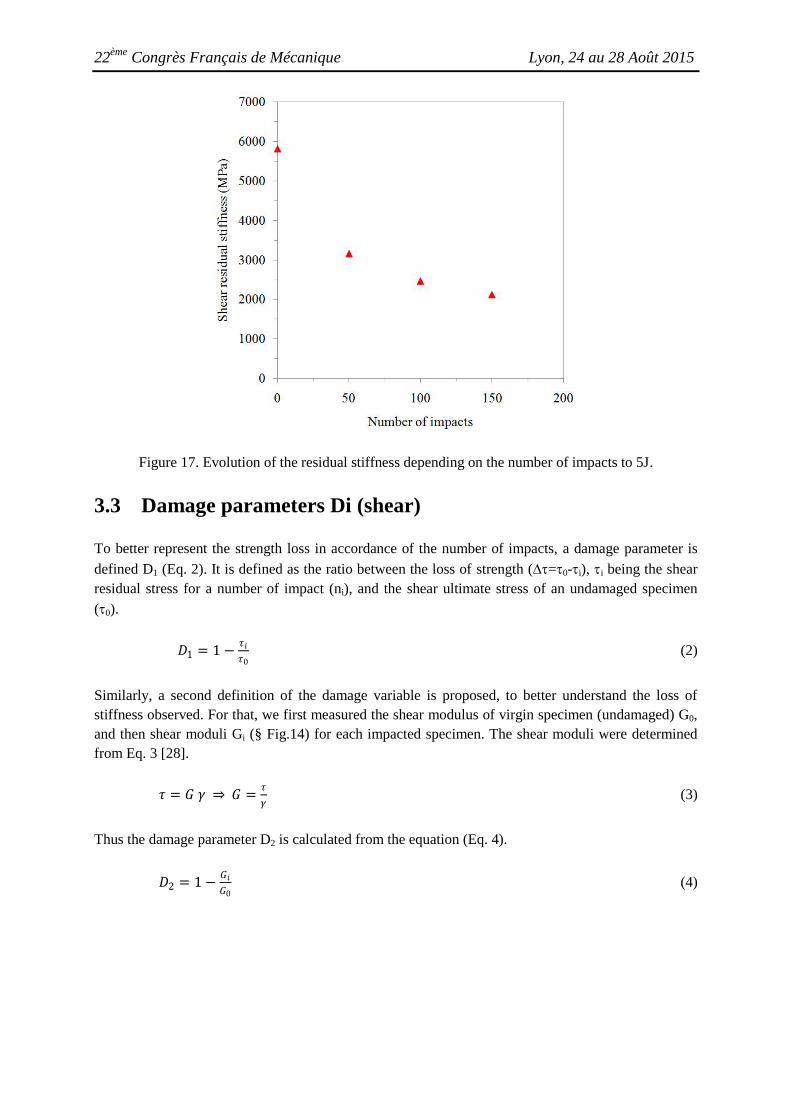
In Figure 17, we notice an undeniable stiffness loss of the plates with the number of impacts.
22ème
Congrès Français de Mécanique Lyon, 24 au 28 Août 2015
Figure 17. Evolution of the residual stiffness depending on the number of impacts to 5J.
3.3 Damage parameters Di (shear)
To better represent the strength loss in accordance of the number of impacts, a damage parameter is
defined D1 (Eq. 2). It is defined as the ratio between the loss of strength (=0-i), i being the shear
residual stress for a number of impact (ni), and the shear ultimate stress of an undamaged specimen
(0).
𝐷1 = 1 −𝜏𝑖
𝜏0 (2)
Similarly, a second definition of the damage variable is proposed, to better understand the loss of
stiffness observed. For that, we first measured the shear modulus of virgin specimen (undamaged) G0,
and then shear moduli Gi (§ Fig.14) for each impacted specimen. The shear moduli were determined
from Eq. 3 [28].
𝜏 = 𝐺 𝛾 ⇒ 𝐺 =𝜏
𝛾 (3)
Thus the damage parameter D2 is calculated from the equation (Eq. 4).
𝐷2 = 1 −𝐺𝑖
𝐺0 (4)

22ème
Congrès Français de Mécanique Lyon, 24 au 28 Août 2015
Figure 18. Evolution of damage parameters D1 and D2 depending on the delamination area (5J).
To highlight the loss of strength and stiffness with the size of delamination area we plotted the
evolution of variables of damage depending on the delamination area. Figure 18 shows in fact the
losses of strength and stiffness which result in the growth of the parameters of damage to the growth
of the delamination area.
Extrapolating the trend of experimental curves corresponding to Di = 0 (dashed lines in Fig. 18), give
threshold values, which are likely to think of thresholds below which the residual strength and
stiffness are not affected by the impacts. To these critical area values correspond impact number
thresholds collected in impact fatigue tests. From there, it is almost certainly easy to assume that the
shapes of the strength and stiffness curves are as shown in Fig. 19 (a and b).
Figure 19. Correction of the curves relating to strength (a) and stiffness (b).
22ème
Congrès Français de Mécanique Lyon, 24 au 28 Août 2015
3.4 Delamination and crater resulting from repeated impacts
During the impact fatigue tests we found, at the macroscopic scale, the delamination was the early
damage to occur and that from the first impacts, then darkening of the plate (impact side) is observed,
then a permanent indentation appears as a crater on the impact side. These damages are increasing
gradually with the number of impacts. Finally pulling-out and breakage of the fibers are the last
damage to appear before perforation. This break is done primarily for the last lamina (non impacted
face) and then propagates to the upper plies leading to perforation and thus ruin of the material.
Damages manifested by whitish zone appearing around the impact point and the rear side of the plate;
it's the cracking of the matrix that causes this whitening, this zone can also be explained by the
delamination occurring at the first impacts.
The delamination area grows until it reaches a threshold corresponding to slowdown phenomena. This
propagation is done more quickly for 5J level comparison to 3J. Also, blackening at the impact point is
noted and is growing gradually as the number of impacts is increasing, this is probably due to the high
heat induced by the impactor, following multiple impacts, and causing the burning of resin.
One note also a permanent indentation in the form of crater at the front face, and forming a bending
dome at the rear face. Both damages increase with the increased number of impacts and are more
pronounced for energy 5J than for 3J. Finally the breaking of the fiber bundles of the last lamina is
observed.
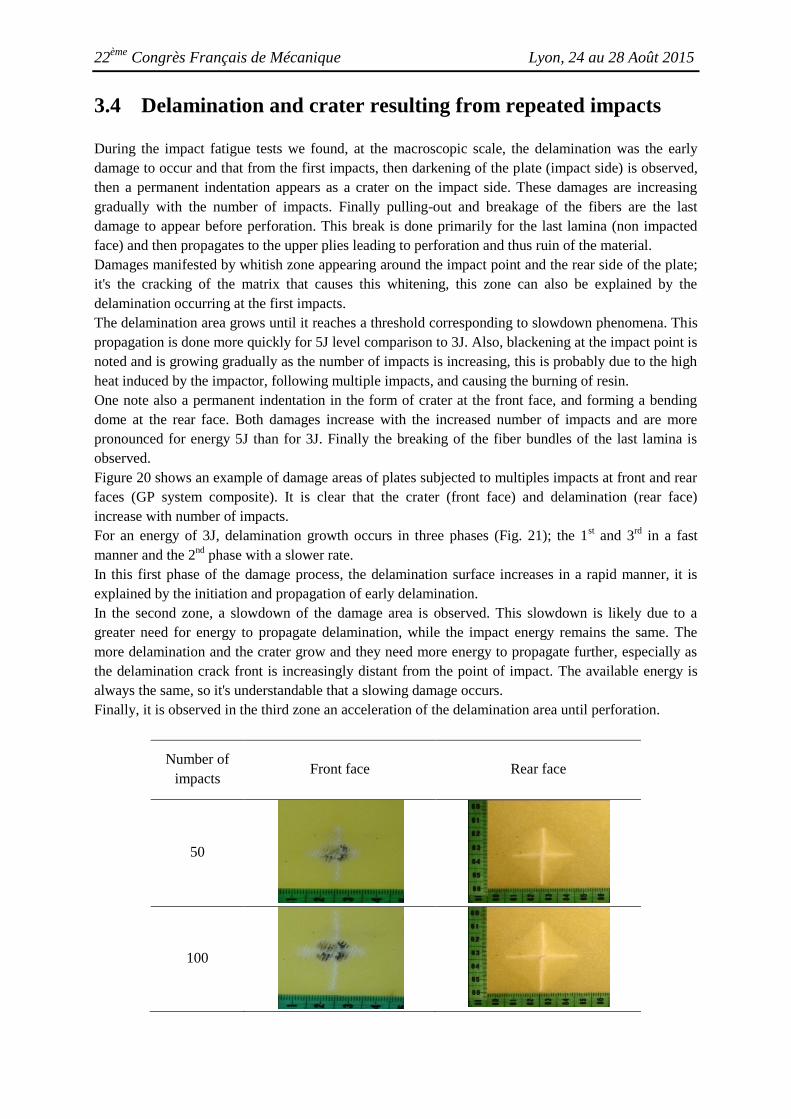
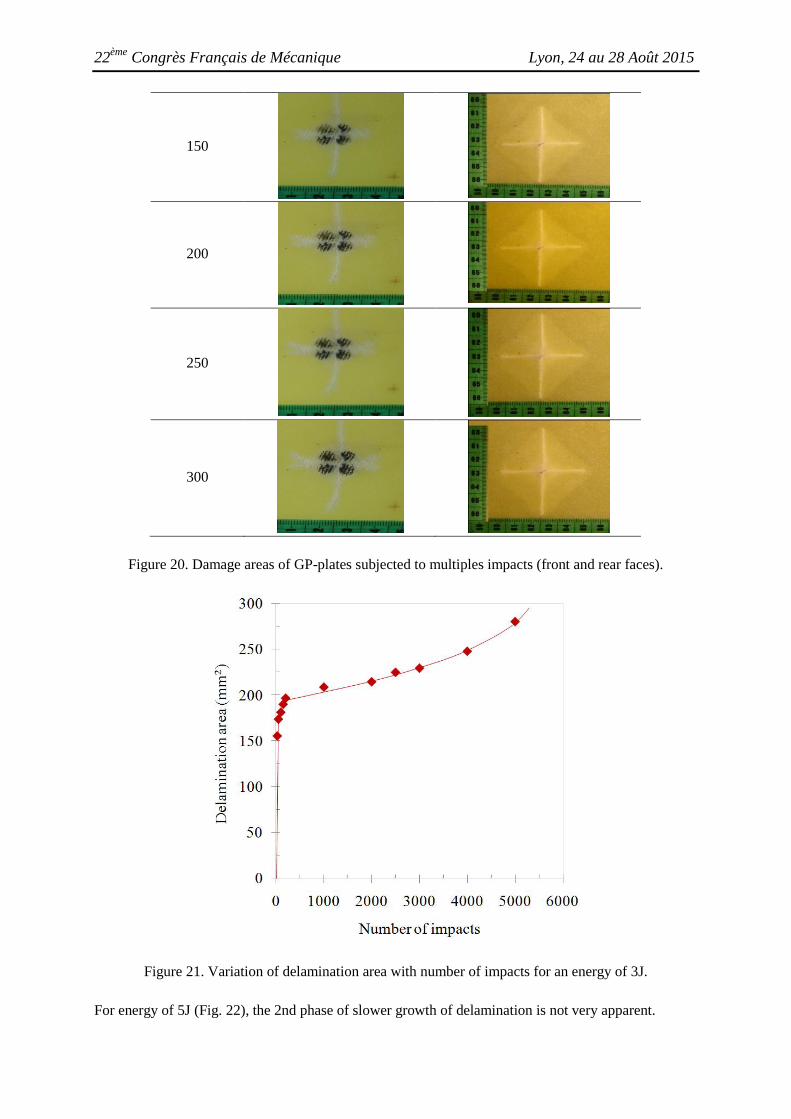
Figure 20 shows an example of damage areas of plates subjected to multiples impacts at front and rear
faces (GP system composite). It is clear that the crater (front face) and delamination (rear face)
increase with number of impacts.
For an energy of 3J, delamination growth occurs in three phases (Fig. 21); the 1st and 3
rd in a fast
manner and the 2nd
phase with a slower rate.
In this first phase of the damage process, the delamination surface increases in a rapid manner, it is
explained by the initiation and propagation of early delamination.
In the second zone, a slowdown of the damage area is observed. This slowdown is likely due to a
greater need for energy to propagate delamination, while the impact energy remains the same. The
more delamination and the crater grow and they need more energy to propagate further, especially as
the delamination crack front is increasingly distant from the point of impact. The available energy is
always the same, so it's understandable that a slowing damage occurs.
Finally, it is observed in the third zone an acceleration of the delamination area until perforation.
Number of
impacts Front face Rear face
50
100
22ème
Congrès Français de Mécanique Lyon, 24 au 28 Août 2015
150
200
250
300
Figure 20. Damage areas of GP-plates subjected to multiples impacts (front and rear faces).
Figure 21. Variation of delamination area with number of impacts for an energy of 3J.
For energy of 5J (Fig. 22), the 2nd phase of slower growth of delamination is not very apparent.
22ème
Congrès Français de Mécanique Lyon, 24 au 28 Août 2015
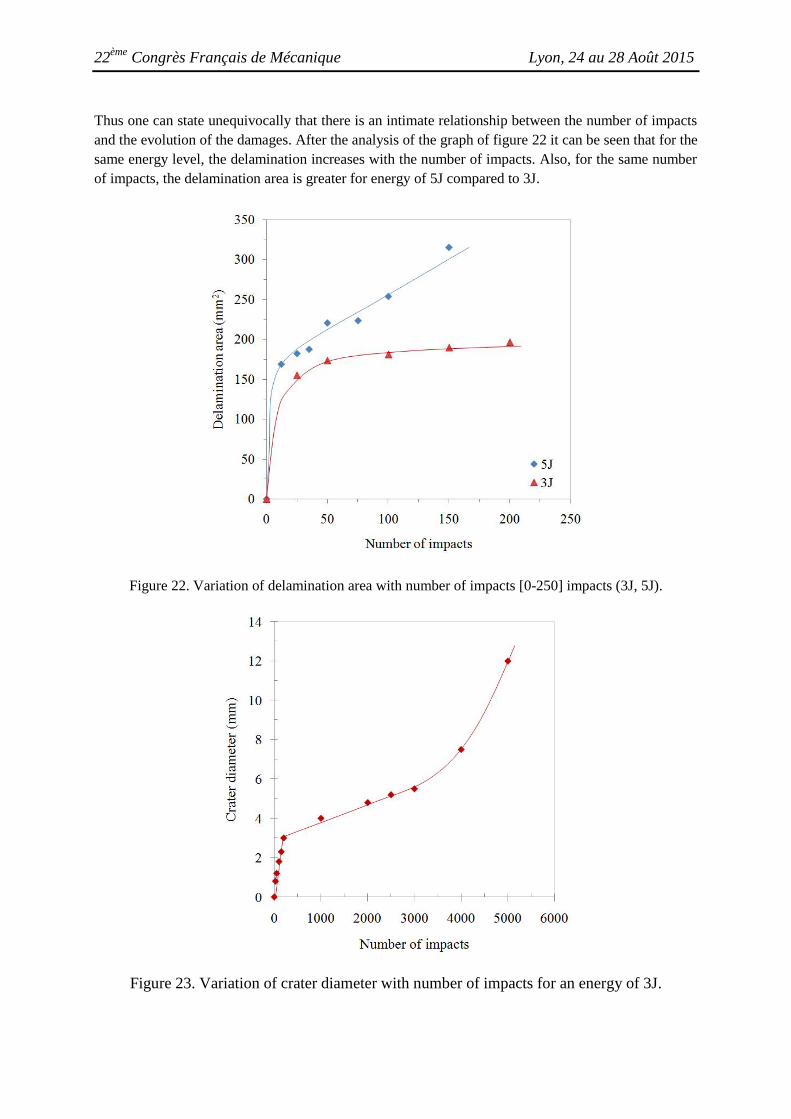
Thus one can state unequivocally that there is an intimate relationship between the number of impacts
and the evolution of the damages. After the analysis of the graph of figure 22 it can be seen that for the
same energy level, the delamination increases with the number of impacts. Also, for the same number
of impacts, the delamination area is greater for energy of 5J compared to 3J.
Figure 22. Variation of delamination area with number of impacts [0-250] impacts (3J, 5J).
Figure 23. Variation of crater diameter with number of impacts for an energy of 3J.
22ème
Congrès Français de Mécanique Lyon, 24 au 28 Août 2015
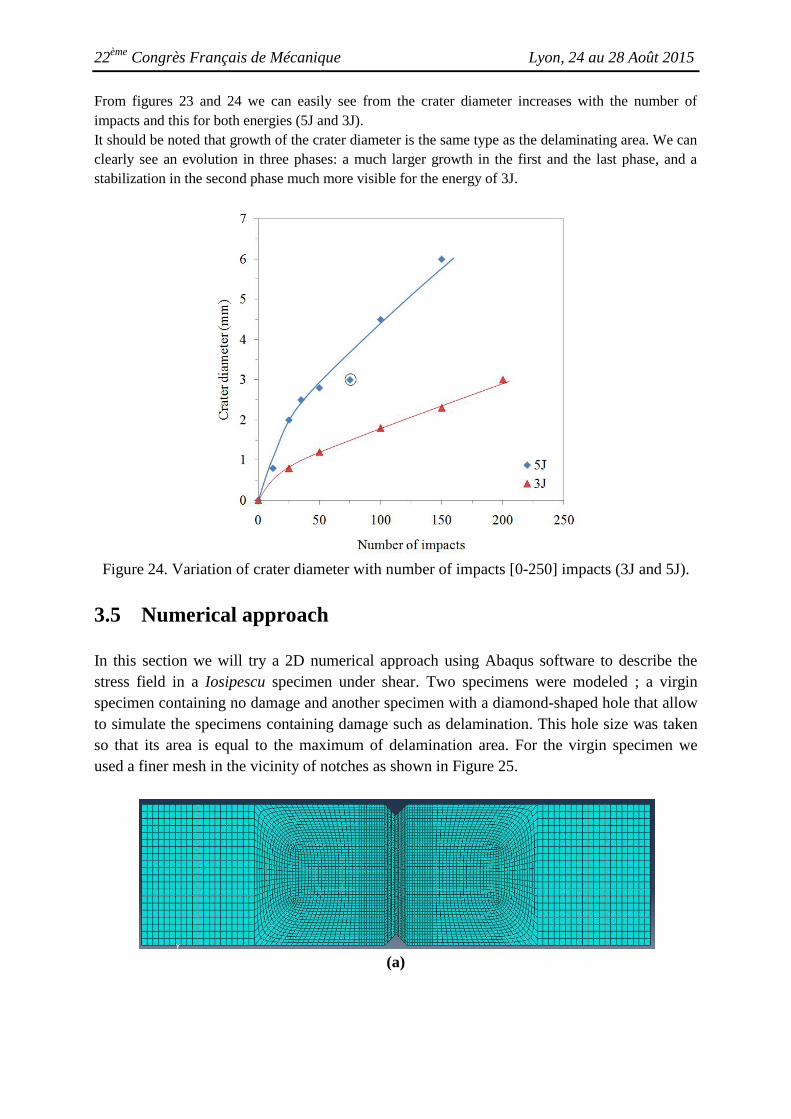
From figures 23 and 24 we can easily see from the crater diameter increases with the number of
impacts and this for both energies (5J and 3J).
It should be noted that growth of the crater diameter is the same type as the delaminating area. We can
clearly see an evolution in three phases: a much larger growth in the first and the last phase, and a
stabilization in the second phase much more visible for the energy of 3J.
Figure 24. Variation of crater diameter with number of impacts [0-250] impacts (3J and 5J).
3.5 Numerical approach
In this section we will try a 2D numerical approach using Abaqus software to describe the
stress field in a Iosipescu specimen under shear. Two specimens were modeled ; a virgin
specimen containing no damage and another specimen with a diamond-shaped hole that allow
to simulate the specimens containing damage such as delamination. This hole size was taken
so that its area is equal to the maximum of delamination area. For the virgin specimen we
used a finer mesh in the vicinity of notches as shown in Figure 25.
(a)
22ème
Congrès Français de Mécanique Lyon, 24 au 28 Août 2015
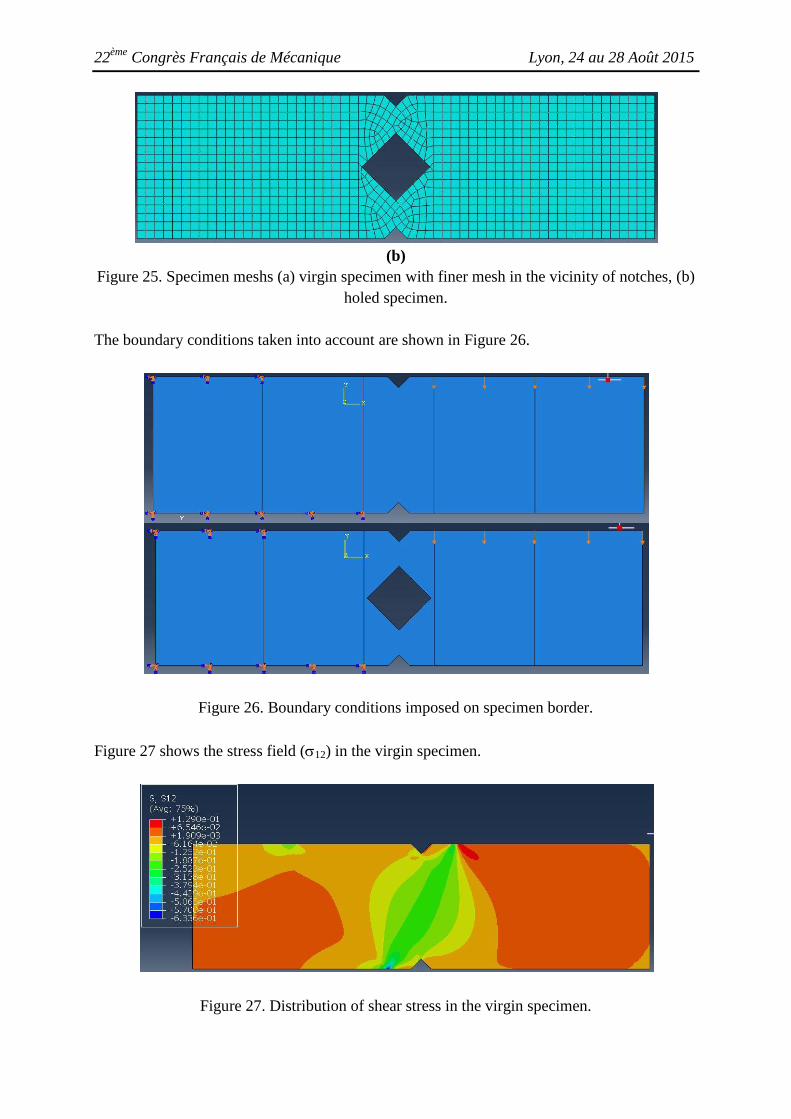
(b)
Figure 25. Specimen meshs (a) virgin specimen with finer mesh in the vicinity of notches, (b)
holed specimen.
The boundary conditions taken into account are shown in Figure 26.
Figure 26. Boundary conditions imposed on specimen border.
Figure 27 shows the stress field (12) in the virgin specimen.
Figure 27. Distribution of shear stress in the virgin specimen.
22ème
Congrès Français de Mécanique Lyon, 24 au 28 Août 2015
We note that the highest stress concentration is located at the supports of the specimen
especially for the support of the fixed jaw. A high stress concentration in the working area
between the two notches heads can also be noted.
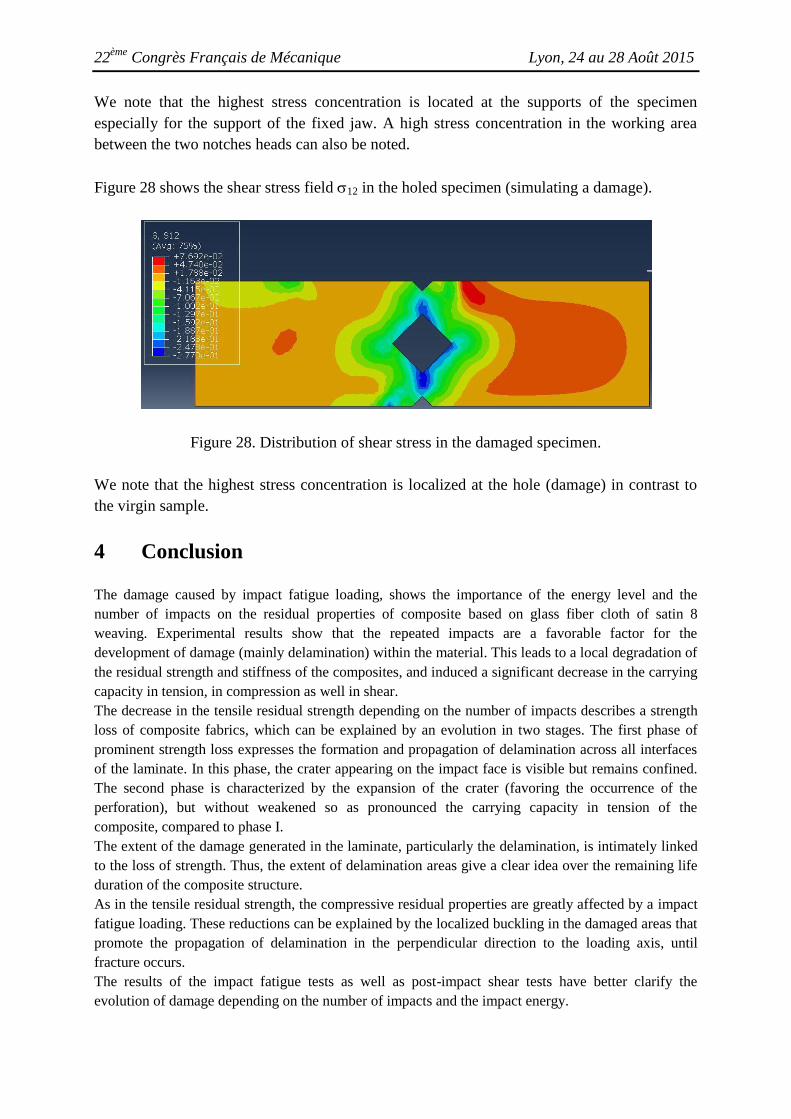
Figure 28 shows the shear stress field 12 in the holed specimen (simulating a damage).
Figure 28. Distribution of shear stress in the damaged specimen.
We note that the highest stress concentration is localized at the hole (damage) in contrast to
the virgin sample.
4 Conclusion
The damage caused by impact fatigue loading, shows the importance of the energy level and the
number of impacts on the residual properties of composite based on glass fiber cloth of satin 8
weaving. Experimental results show that the repeated impacts are a favorable factor for the
development of damage (mainly delamination) within the material. This leads to a local degradation of
the residual strength and stiffness of the composites, and induced a significant decrease in the carrying
capacity in tension, in compression as well in shear.
The decrease in the tensile residual strength depending on the number of impacts describes a strength
loss of composite fabrics, which can be explained by an evolution in two stages. The first phase of
prominent strength loss expresses the formation and propagation of delamination across all interfaces
of the laminate. In this phase, the crater appearing on the impact face is visible but remains confined.
The second phase is characterized by the expansion of the crater (favoring the occurrence of the
perforation), but without weakened so as pronounced the carrying capacity in tension of the
composite, compared to phase I.
The extent of the damage generated in the laminate, particularly the delamination, is intimately linked
to the loss of strength. Thus, the extent of delamination areas give a clear idea over the remaining life
duration of the composite structure.
As in the tensile residual strength, the compressive residual properties are greatly affected by a impact
fatigue loading. These reductions can be explained by the localized buckling in the damaged areas that
promote the propagation of delamination in the perpendicular direction to the loading axis, until
fracture occurs.
The results of the impact fatigue tests as well as post-impact shear tests have better clarify the
evolution of damage depending on the number of impacts and the impact energy.
22ème
Congrès Français de Mécanique Lyon, 24 au 28 Août 2015
Shear residual strength and stiffness decrease significantly with increasing number of impacts; the rate
of reduction of the shear residual stiffness of impacted plates are around 45.74%, 57.66% and 63.67%,
respectively for 50, 100 and 150 impacts. The residual strength shows for its part, lesser reductions of
the order of 15.15%, 28.70% and 34.21%, respectively for 50, 100 and 150 impacts. It is clear that the
stiffness is severely affected by repeated impact, as compared to the strength. Also, the damage
parameters D1 and D2 unambiguously show losses in residual strength and stiffness with number of
impacts. It is found that below a threshold number of impacts (impacts around 40 for D2, and 25 for
D1) the residual strength and stiffness are not affected by the impacts. Thus, the damage is much
greater by reference to (or relying on) the damage parameter defined on the basis of stiffness. As
against the strength point of view, the damage is lesser, so more conservative.
Delamination and the crater diameter have evolved in three phases as a function of the number of
impacts. The first is a initiation phase (mainly delamination), the second is a phase where the
propagation delayed because of the elastic response of the plates as well as the energy absorbed by the
heat dissipation at the impacted area, and in the third phase, the significance of the damage to the
plates make the impact energy is almost entirely absorbed by the damage and accelerating the
propagation of the damage is observed.
References
1. A.P. Mouritz, J. Gallagher, A.A. Goodwin, Flexural strength and interlaminar shear strength of
stitched GRP laminates following repeated impacts, Composites Science and Technology
(1997) 57, 509–522.
2. D.A. Wyrick, D.F. Adams, Residual Strength of a Carbon/Epoxy Composite Material Subjected
to Repeated Impact, Journal of Composite Materials (1988) 22 (8), 749–765.
3. G. Belingardi, M.P. Cavatorta, D.S. Paolino, Repeated impact response of hand lay-up and vacuum
infusion thick glass reinforced laminates, International Journal of impact Engineering (2008) 35(7),
609-619.
4. O.S. David-West, D.H. Nash, W.M. Banks, An experimental study of damage accumulation in
balanced CFRP laminates due to repeated impact, Composite structures (2007) 83 (3), 247–258.
5. B.S. Sugun, R.M.V.G.K. Rao, Low-velocity Impact Characterization of Glass, Carbon and Kevlar
Composites Using Repeated Drop Tests, Journal of Reinforced Plastics and Composites (2004)
23(15), 1583-1599.
6. K. Azouaoui, S. Rechak, Z. Azari, S. Benmedakhene, A. Laksimi, G. Pluvinage, Modelling of
damage and failure of glass/epoxy composite plates subject to impact fatigue, International
Journal of Fatigue (2001) 23(10), 877–885.
7. K. Azouaoui, N. Ouali, Y. Ouroua, A. Mesbah, T. Boukharouba, Damage characterisation of
glass/polyester composite plates subjected to low-energy impact fatigue, Journal of Sound and
Vibration (2007) 308(3-5), 504-513.
8. K. Azouaoui, Z. Azari, G. Pluvinage, Evaluation of impact fatigue damage in glass/epoxy
composite laminate, International Journal of Fatigue (2010) 32(2), 443–452.
9. W.A. De Morais, S.N. Monteiro, J.R.M. d’Almeida, Evaluation of repeated low energy impact
damage in carbon–epoxy composite materials, Composite Structures (2005) 67(3), 307-315.
10. Z.Y. Zhang, M.O.W Richardson, Low velocity impact induced damage evaluation and its effect on
the residual flexural properties of pultruded GRP composites, Composite Structures (2007) 81(2),
195-201.
11. R. Roy, B.K. Sarkar, A.K. Rana, E.N.R. Bose, Impact fatigue behaviour of carbon fibre-reinforced
vinylester resin composites, Bulletin of Materials Science (2001) 24(1), 79–86.
22ème
Congrès Français de Mécanique Lyon, 24 au 28 Août 2015
12. R. Roy, B.K. Sarkar, N.R. Bose, Impact fatigue of glass fibre–vinylester resin composites,
Composites: Part A (2001) 32(6), 871-876.
13. T. Yuanjian, D.H. Isaac, Impact and fatigue behaviour of hemp fibre composites, Composites
Science and Technology (2007) 67(15-16), 3300–3307.
14. A.M. Amaro, P.N.B. Reis, M.F.S.F. De Moura, M.A. Neto, Influence of multi-impacts on GFRP
composites laminates, Composites: Part B (2013) 52, 93–99.
15. J.P. Hou, G. Jeronimidis, Bending stiffness of composite plates with delamination, Composites:
Part A (2000) 31(2), 121–132.
16. E. Guades, T. Aravinthan, Residual properties of square FRP composite tubes subjected to
repeated axial impact, Composite Structures (2013) 95, 354–365.
17. E. Guades, T. Aravinthan, A. Manalo, M. Islam, Experimental investigation on the behaviour of
square FRP composite tubes under repeated axial impact, Composite Structures (2013) 97, 211–
221.
18. V. Ray, B.K. Sakar, N.R. Bose, Impact fatigue behaviour of vinylester resin matrix composites
reinforced with alkali treated jute fibres, Composites: Part A (2002) 33(2), 233–241.
19. G. Odegard, M. Kumosa, Determination of shear strength of unidirectional composite materials
with the Iosipescu and 10° off-axis shear tests, Composites Science and Technology (2000) 60(16),
2917-2943.
20. L. Niklas Melin, Measuring constitutive shear behavior of orthotropic composites and evaluation
of the modified Iosipescu test, Composite Structures (2006) 76(1-2), 106–115.
21. W. Cantwell, P. Curtis, J. Morton, Post-impact fatigue performance of carbon fibre laminates with
non-woven and mixed-woven layers, Composites (1983) 14(3), 301–305.
22. D. Liu, B.B. Raju, X. Dang, Size effects on impact response of composite laminates, Int. J. Impact
Eng. (1998) 21(10), 837–854.
23. H. Mahfuz, M. Saha, R. Biggs, S. Jeelani, Damage tolerance of resin-infiltrated composites under
low velocity impact—experimental and numerical studies, Key Eng. Mater. (1998) 141–143, 209–
234.
24. G. Zhou, Damage resistance and tolerance in thick laminated composite plates subjected to low-
velocity impact, Key Eng. Mater. (1998) 141–143, 305–334.
25. N. Iosipescu, New accurate procedure for single shear testing of metals, Journal of Materials
(1967) 2(3), 537-566.
26. D.F. Adams, D.E. Walrath, Current Status of the Iosipescu Shear Test Method, Journal of
Composite Materials (1987) 21(6); 494-507.
27. J.C. Prichard, P.J. Hogg, The role of impact damage in post-impact compression testing,
Composites (1990) 21(6), 503-511.
28. Chiang, M.Y.M. and Jianmei, H. An analytical assessment of using the losipescu shear test for
hybrid composites, Composites: Part B (2002) 33(6), 461–470.