Research Article Dielectric Properties and...
10
Research Article Dielectric Properties and Characterisation of Titanium Dioxide Obtained by Different Chemistry Methods Aleksandra Wypych, 1 Izabela Bobowska, 1 Milena Tracz, 2 Agnieszka Opasinska, 1 Slawomir Kadlubowski, 3 Alicja Krzywania-Kaliszewska, 4 Jaroslaw Grobelny, 2 and Piotr Wojciechowski 1 1 Department of Molecular Physics, Faculty of Chemistry, Lodz University of Technology, ˙ Zeromskiego 116, 90-924 Lodz, Poland 2 Department of Materials Technology and Chemistry, Faculty of Chemistry, University of Lodz, Pomorska 163, 90-236 Lodz, Poland 3 Institute of Applied Radiation Chemistry, Lodz University of Technology, Wr´ oblewskiego 15, 93-590 Lodz, Poland 4 Institute of Polymer and Dye Technology, Lodz University of Technology, Stefanowskiego 12/16, 90-924 Lodz, Poland Correspondence should be addressed to Aleksandra Wypych; [email protected] Received 10 January 2014; Accepted 11 February 2014; Published 19 March 2014 Academic Editor: Jean-Francois Hochepied Copyright © 2014 Aleksandra Wypych et al. is is an open access article distributed under the Creative Commons Attribution License, which permits unrestricted use, distribution, and reproduction in any medium, provided the original work is properly cited. We made comparison of titanium dioxide powders obtained from three syntheses including sol-gel and precipitation methods as well as using layered (tetramethyl)ammonium titanate as a source of TiO 2 . e obtained precursors were subjected to step annealing at elevated temperatures to transform into rutile form. e transformation was determined by Raman measurements in each case. e resulting products were characterised using Raman spectroscopy and dynamic light scattering. e main goal of the studies performed was to compare the temperature of the transformation in three titania precursors obtained by different methods of soſt chemistry routes and to evaluate dielectric properties of rutile products by means of broadband dielectric spectroscopy. Different factors affecting the electrical properties of calcinated products were discussed. It was found that sol-gel synthesis provided rutile form aſter annealing at 850 ∘ C with the smallest particles size about 20 nm, the highest value of dielectric permittivity equal to 63.7, and loss tangent equal to 0.051 at MHz frequencies. e other powders transformed to rutile at higher temperature, that is, 900 ∘ C, exhibit lower value of dielectric permittivity and had a higher value of particles size. e correlation between the anatase-rutile transformation temperature and the size of annealed particles was proposed. 1. Introduction In the last decade the production and use of titanium dioxide (TiO 2 ) have increased steadily due to its common availability, chemical stability, nontoxicity, optical-electronic properties, low cost, and high photocatalytic properties. TiO 2 crystallizes in several crystallographic polymorph phases. Among them the most popular are anatase and rutile. Anatase phase is mostly formed at low temperatures, while rutile is thermodynamically stable at higher temperatures [1]. e nanosized anatase has attracted considerable attention as a photocatalyst, being used for the chemical treatment of organic pollutants [2] or as a component of organic light emitting diodes facilitating charge transport and electrical injection [3]. Titanium dioxide in rutile form exhibits high dielectric constant and can be considered as a component in low temperature cofired ceramics (LTCC) [4] or as a filler in hybrid (i.e., organic-inorganic) composites [5, 6]. e dielectric properties of a composite material depend on the dielectric constants of the components, that is, polymer matrix and inorganic filler. erefore, the nanoparticles of rutile TiO 2 with nanometer size, low dispersity, and elevated values of dielectric permittivity are strongly required for application in modern electronics [7]. Nanostructured TiO 2 can be produced by laser chemical vapor deposition [8], physical vapor deposition [9], and large variety of chemical methods [10]. Wet chemistry methods are particularly valuable for the synthesis of oxide nanoparticles, Hindawi Publishing Corporation Journal of Nanomaterials Volume 2014, Article ID 124814, 9 pages http://dx.doi.org/10.1155/2014/124814
Transcript of Research Article Dielectric Properties and...
Research ArticleDielectric Properties and Characterisation of Titanium DioxideObtained by Different Chemistry Methods
Aleksandra Wypych1 Izabela Bobowska1 Milena Tracz2 Agnieszka Opasinska1
Slawomir Kadlubowski3 Alicja Krzywania-Kaliszewska4 Jaroslaw Grobelny2
and Piotr Wojciechowski1
1 Department of Molecular Physics Faculty of Chemistry Lodz University of Technology Zeromskiego 116 90-924 Lodz Poland2Department of Materials Technology and Chemistry Faculty of Chemistry University of Lodz Pomorska 163 90-236 Lodz Poland3 Institute of Applied Radiation Chemistry Lodz University of Technology Wroblewskiego 15 93-590 Lodz Poland4 Institute of Polymer and Dye Technology Lodz University of Technology Stefanowskiego 1216 90-924 Lodz Poland
Correspondence should be addressed to Aleksandra Wypych alwypychplodzpl
Received 10 January 2014 Accepted 11 February 2014 Published 19 March 2014
Academic Editor Jean-Francois Hochepied
Copyright copy 2014 Aleksandra Wypych et al This is an open access article distributed under the Creative Commons AttributionLicense which permits unrestricted use distribution and reproduction in any medium provided the original work is properlycited
We made comparison of titanium dioxide powders obtained from three syntheses including sol-gel and precipitation methods aswell as using layered (tetramethyl)ammonium titanate as a source of TiO
2The obtained precursors were subjected to step annealing
at elevated temperatures to transform into rutile formThe transformation was determined by Raman measurements in each caseThe resulting products were characterised using Raman spectroscopy and dynamic light scattering The main goal of the studiesperformed was to compare the temperature of the transformation in three titania precursors obtained by different methods of softchemistry routes and to evaluate dielectric properties of rutile products by means of broadband dielectric spectroscopy Differentfactors affecting the electrical properties of calcinated products were discussed It was found that sol-gel synthesis provided rutileform after annealing at 850∘C with the smallest particles size about 20 nm the highest value of dielectric permittivity equal to 637and loss tangent equal to 0051 at MHz frequencies The other powders transformed to rutile at higher temperature that is 900∘Cexhibit lower value of dielectric permittivity and had a higher value of particles size The correlation between the anatase-rutiletransformation temperature and the size of annealed particles was proposed
1 Introduction
In the last decade the production and use of titaniumdioxide (TiO
2) have increased steadily due to its common
availability chemical stability nontoxicity optical-electronicproperties low cost and high photocatalytic properties TiO
2
crystallizes in several crystallographic polymorph phasesAmong them themost popular are anatase and rutile Anatasephase is mostly formed at low temperatures while rutile isthermodynamically stable at higher temperatures [1] Thenanosized anatase has attracted considerable attention asa photocatalyst being used for the chemical treatment oforganic pollutants [2] or as a component of organic lightemitting diodes facilitating charge transport and electrical
injection [3] Titanium dioxide in rutile form exhibits highdielectric constant and can be considered as a componentin low temperature cofired ceramics (LTCC) [4] or as afiller in hybrid (ie organic-inorganic) composites [5 6]The dielectric properties of a composite material depend onthe dielectric constants of the components that is polymermatrix and inorganic filler Therefore the nanoparticles ofrutile TiO
2with nanometer size low dispersity and elevated
values of dielectric permittivity are strongly required forapplication in modern electronics [7]
Nanostructured TiO2can be produced by laser chemical
vapor deposition [8] physical vapor deposition [9] and largevariety of chemical methods [10]Wet chemistrymethods areparticularly valuable for the synthesis of oxide nanoparticles
Hindawi Publishing CorporationJournal of NanomaterialsVolume 2014 Article ID 124814 9 pageshttpdxdoiorg1011552014124814
2 Journal of Nanomaterials
because they are simple and economical and can be easilycontrolled giving highly pure and homogeneous productswith desired size and morphology Within wet chemistrymethods one can find thermohydrolysis sol-gel and precipi-tation as well as hydrothermal route that requires autoclave[11] The thermohydrolysis of TiCl
4in water leads usually
to a mixture of different TiO2phases (anatase rutile and
brookite) depending on the reagent ratio pH temperatureand time [12 13] whereas sol-gel and precipitation meth-ods provide to titania precursor or semicrystalline TiO
2in
anatase phase [14ndash16] A transformation from anatase torutile phase requires processing at elevated temperatures[17] During thermal treatment several undesirable effectsoccur that are adverse for nanopowder engineering that issintering connected with a grains growth aggregation anddisorders in desired morphology We believe that control ofinitial nanoscopic morphology of anatase particles and mildthermal treatment will allow for the preparation of rutileparticles with nanometer size and low dispersity
Recently Marinel et al [18] reported dielectric propertiesof TiO
2ceramics conventionally and microwave sintered at
the temperatures above 1000ndash1300∘CThe dielectric constantvalues were high and equal about 100 for measurementperformed at RT and at the frequency of 100Hz These highvalues were achieved by preparation of high density ceramicsinters however themorphology of the sinters precludes theiruse as fine-grained fillers in hybrid dielectrics
The objective of this study was to investigate the effectof thermal treatment on the structure morphology anddielectric properties of rutile nanoparticles obtained via softchemistry routes and mild thermal treatment The synthe-sised powders can be considered for potential application asa filler in high-120581 nanocomposites
2 Materials and Methods
21 Materials All reagents were commercially availableand used without further purification Titanium (IV) iso-propoxide (97 Ti (CH(CH
3)2) TIP) titanium (IV) chlo-
ride (ge990 TiCl4) and tetramethylammonium hydroxide
solution (25wt in H2O (CH
3)4N(OH) TMAOH) were
purchased from Sigma-Aldrich Glacial acetic acid (purissCH3COOH) ammonia solution (25wt in H
2O NH
3aq)sulfuric acid (puriss H
2SO4) and 2-propanol (puriss
(CH3)2CHOH) were purchased from Avantor Performance
Materials Poland
22 Synthesis Protocols
221 Synthesis (1) The titanium dioxide TiO2-(1) was syn-
thesised via sol-gel method at low temperature accordingto Behnajady et al [14] First 295mL (996mmol) of TIPwas mixed with 057mL (996mmol) of glacial acetic acidNext 360mL (2mol) of MilliQ water was added dropwiseunder vigorous stirring and maintaining the temperature ofthe mixture around 0∘C After 1 h the homogenous sol wasobtained that was stored in the darkness by 12 hours fornucleation process Thereafter the sol was annealed at the
temperature of 70∘C for gelation process The white gel wasdried at 100∘C for 12 h and subjected to step calcination
222 Synthesis (2) The TiO2-(2) was synthesised according
to the method described by Ohya et al [15] First 3mL(1013mmol) of TIP was added to 236mL (395mmol)15 wt water solution of TMAOH The 12 hours of vigorousstirring of mixture under nitrogen atmosphere yielded finallytwo-phase transparent sol A white precipitate was obtainedby adding an excess of 2-propanol to the sol The precipitatewas separated by centrifugation washed with 2-propanoland finally dried at 70∘C under vacuum
223 Synthesis (3) The TiO2-(3) was synthesised according
to protocols outlined by Li and Zeng [16] A 1mL (912mmol)of TiCl
4was slowly added to the 194mL of diluted 10wt
sulfuric acid maintaining the reaction temperature at 0∘CAfter 05 hours of vigorous stirring a gray solution wasobtained The mixture became transparent after annealingit at 60∘C The temperature was raised slowly to 80∘CThereafter the 25wt aqueous ammonia solutionwas addeddropwise to pH 7 The obtained white suspension was cooleddown to room temperature and stored for 12 hours Finallythe white sediment was centrifuged and dried at roomtemperature under vacuum
The dried powders obtained from specified (1 divide 3)syntheses were subjected to stepwise annealing procedures at300 500 600 750 850 and 900∘Cunder normal atmosphericconditions for two hours at each temperature
23 CharacterisationMethods Raman spectra were acquiredwith use of JobinYvon T64000 triple-gratings spectrometerequipped with the Olympus BX40 confocal microscope Ar-ion laser line 5145 nm was used for samples excitation
SEM images were obtained using a Hitachi S3000 scan-ning electron microscope (accelerating voltage of 25000V)
The dielectric properties of TiO2in the form of pellets
were investigated using a Novocontrol GmbH Concept 40broadband dielectric spectrometer (BDS) equipped withQuatro Cryosystem operating in the frequency range of 10minus1ndash106Hz and in the temperature range of minus140∘C to 200∘C (insteps of 10∘C) The obtained complex dielectric function (120576lowast)was measured by
120576lowast= 1205761015840minus 11989412057610158401015840 (1)
where 1205761015840 and 12057610158401015840 are the real part and the imaginary or losspart respectively The dielectric dissipation factor that isloss tangent (tan(120575)) was defined according to the relationtan(120575) = 120576101584010158401205761015840
To form pellets of the synthesised titanium dioxides thepowders obtained after synthesis and subsequent annealingwere pressed under a load of 445 kgmmminus2 for 10minutesThereceived pellets were very brittle thus they were additionallysintered for 2 h under normal atmospheric conditions at850∘Cor 900∘C depending on previous annealing procedurein order to improve their mechanical properties To providegood contact between the sample and external electrodes
Journal of Nanomaterials 3
during electrical investigations 150 nm thick gold electrodeswere deposited on both sites of each pellet The densities ofthe samples were evaluated based on the external dimensionsand mass of the pellets The relative density of preparedpellets was estimated through comparison with crystallo-graphic density of TiO
2(for anatase 389 gcm3 ICDD-PDF-
2 code number 00-021-1272 for rutile 425 gcm3 ICDD-PDF-2 code number 00-021-1276) To exclude the influenceof humidity each pellet was additionally dried at 90∘C forone hour under reduced pressure directly before dielectricmeasurement
Particle sizes obtained in a different step of calcina-tion were estimated from dynamic light scattering (DLS)technique For measurements Malvern Zetasizer Nano ZSinstrument equipped with He-Ne laser operating at 633 nmwas used To perform DLS measurements 000125M aque-ous solutions of titania obtained from described synthesisand annealed at different temperature were prepared Thesolutions were sonicated in an ultrasonic bath for one hourand additionally 3 minutes prior to measurement in orderto ensure proper dispersion of the particles DLS data werecollected in automatic duration mode for solution placed inquartz cuvettes with square aperture using the light beingdetected at an angle of 173∘ and at temperature stabilised toa value of 25∘CThe correlation function was processed usingthe density and refraction index parameters corresponding toTiO2 in anatase and rutile form and H
2O
3 Results and Discussion
31 Raman Spectroscopy Studies The as-synthesised sampleswere subjected to a subsequent annealing at the temperaturesranging from 500 to 900∘C The Raman spectroscopy wasused for structural identification of annealed samplesThe Raman spectra of titania polymorphs are enoughdistinctive and they are very useful for identificationof various TiO
2phases The anatase has six Raman-
active modes in the vibrational spectrum centeredaround 144 cmminus1 (Eg) 197 cmminus1 (Eg) 399 cmminus1 (B
1g)513 cmminus1 (A
1g) 519 cmminus1 (B1g) and 639 cmminus1 (Eg) [10]
The rutile TiO2
has four vibrational modes around145 cmminus1 (B
1g) 445 cmminus1(Eg) 610 cm
minus1(A1g) and 240 cm
minus1
for second-order effect (SOE) [19] The analysis of Ramanspectra of samples annealed at 600∘C (data not shown)revealed pure anatase phase with high crystallinity for allsynthesised TiO
2-(1) TiO
2-(2) and TiO
2-(3) samples
Further annealing leads to a gradual anatase to rutilephase transformation Figure 1 illustrates Raman spectraof the samples TiO
2-(1) TiO
2-(2) and TiO
2-(3) annealed
at 750∘C Spectra of TiO2-(2) and TiO
2-(3) show peaks
characteristic for anatase whereas the Raman spectrumof TiO
2-(1) obtained from sol-gel method shows Raman
peaks characteristic for both anatase and rutile phasesAn increase of the annealing temperature up to 850∘Cbrings profound changes in the Raman spectra (Figure 2)of TiO
2-(1) and TiO
2-(3) with a presence of bands typical
for rutile phase whereas the Raman spectrum of TiO2-(2)
200 400 600 800 1000
R AAA
A
A
R
(c)(b)(a)
Inte
nsity
Raman shift (cmminus1)
750∘C
Figure 1 Raman spectra of the TiO2powders annealed at 750∘C for
2 hours (a) TiO2-(1) (b) TiO
2-(2) and (c) TiO
2-(3) Raman modes
of anatase and rutile phases are denoted by A and R respectively
200 400 600 800 1000
A AA
R
RR
A R
A
(a)
(c)(b)
Inte
nsity
850∘C
Raman shift (cmminus1)
Figure 2 Raman spectra of the TiO2powders annealed at 850∘C for
2 hours (a) TiO2-(1) (b) TiO
2-(2) and (c) TiO
2-(3) Raman modes
of anatase and rutile phases are denoted by A and R respectively
exhibits bands indicative of both anatase and rutile phasesFigure 3 illustrates Raman spectra of products obtainedafter subsequent annealing at 900∘C The Raman spectraof TiO
2-(1) (Figure 3(a)) and TiO
2-(3) (Figure 3(c)) show
bands characteristic for rutile and compared to the Ramanspectra of these samples annealed at 850∘C one can see onlyslight narrowing of the widest bandsTheRaman spectrum ofthe sample TiO
2-(2) still exhibits strong bands characteristic
for anatase phase but the relative intensity of the highestband centered around 144 cmminus1is visibly lower comparedto the Raman spectrum shown in Figure 2(b) This changereveals progress in phase transformation from anatase torutile however the transformation of sample TiO
2-(2) was
not completed at this temperature
4 Journal of Nanomaterials
200 400 600 800 1000
AA
R
R
R
A
R
A
(c)(b)
Inte
nsity
(a)
Raman shift (cmminus1)
900∘C
Figure 3 Raman spectra of the TiO2powders annealed at 900∘C for
2 hours (a) TiO2-(1) (b) TiO
2-(2) and (c) TiO
2-(3) Raman modes
of anatase and rutile phases are denoted by A and R respectively
According to literature the temperature of anatase torutile phase transformation is about 915∘C [20] In thepresent study we observed a decrease in the transformationtemperature which is due to the nanocrystalline structureof synthesised samples Similar results were obtained instudies performed by Zhang et al [21] They observed dis-tinct changes in phase transformation temperatures betweensamples composed of anatase nanoparticles of different sizesranging from 7 to 60 nm According to this the temperatureof phase transformation for the initial anatase particlessmaller than 10 nm was lower than 600∘C the anatasenanoparticles with size in the range 10ndash60 nm transformedat the temperatures range between 900 and 1000∘C whereasparticles of a size greater than 60 nm transformed to rutile attemperature above 1000∘C The samples TiO
2-(1) and TiO
2-
(3) exhibit complete anatase to rutile phase transformationachieved at the annealing temperature of 850∘C whereasfor the sample TiO
2-(2) the phase transformation was still
incomplete up to the temperature of 900∘C Moreover theRaman analysis revealed that the first signs of the phasetransformation were observed for the sample TiO
2-(1) in the
temperature of 750∘C According to Zhang et al [21] andbased on the observed temperatures of phase transformationwe can assume that the smallest size of anatase nanoparticlescharacterises the sample TiO
2-(1) and the biggest particles
of anatase are in the sample TiO2-(2) The Raman spectrum
of sample TiO2-(2) shows bands characteristic for anatase
and rutile phases The anatase content in this partially trans-formed sample can be evaluated based on the work of Zhangand coworkers [17] where the Raman spectra of anatase-rutile mixtures with different composition were analysedThe authors presented the linear relationship between thearea ratios of the Raman band at 395 cmminus1 for anatase phaseto the band at 445 cmminus1 for rutile phase and the weightratios of anatase phase to rutile phase Based on this relation
the estimated anatase content in the sample TiO2-(2) after
annealing at 900∘C is less than 10wt
32 Dynamic Light Scattering Measurements Figure 4shows dynamic light scattering data weighted by numbers(Figure 4(a)) and volume (Figure 4(b)) of TiO
2(rutile)
particles obtained from three different syntheses TiO2
obtained via synthesis (1) was annealed at 850∘C whereasthe precursors obtained from syntheses (2) and (3) had to beannealed at 900∘C to transform in rutile phase The numberweighted DLS measurement of the product from synthesis(1) exhibits one peak corresponding to a fraction of particleswith size in the range of 10 divide 40 nm that corresponds tothe amount of 99 of all particles in the solution Thevolume-weighted representation exhibits three main peaksof decreasing magnitude located at about 20 nm 60 nm and230 nm whereas the fraction of nanoparticles with averagesize of about 20 nm constitutes 46 of the total volume ofthe dispersed phase Rutile nanoparticles obtained fromsyntheses (2) and (3) exhibit unimodal distributions ofparticle size both in number and volume representationsThe size of nanoparticles coming from synthesis (2) variesin the range 90 divide 260 nm with a mean value equal to150 Dispersity value called in the past a polydispersityindex (PDI) defined in ISO13321 Part 8 for this series ofnanoparticles is equal to 071 Nanoparticles from synthesis(3) exhibit slightly narrower size distribution than the (2)product with PDI equal to 043 In this case the size is rangingfrom 90 nm to 300 nm with a mean value equal to 160 nmand 180 nm as deduced from the representations given atFigures 4(a) and 4(b) From DLS measurements it can beconcluded that titania nanoparticles obtained via method(1) possess similar dispersity (PDI = 049) compared toseries (3) The same conclusion can be drawn through SEMmicrographs (see Figure 5) which were performed in orderto study the morphology of obtained rutile powders
33 Scanning Electron Microscopy Investigations Figure 5(a)shows the SEM image of TiO
2powder obtained via synthesis
(1) and annealed at the temperature of 850∘CThe average sizeof particles is about 20 nm and they are slightly agglomeratedFigures 5(b) and 5(c) show SEM images of TiO
2annealed
at the temperature of 900∘C obtained via syntheses (2) and(3) respectively Both images reveal large grains The SEMimage of TiO
2-(2) reveals also high dispersity of particles
size The size of the biggest rectangular grains equals 300 nmand the size of the smallest one is approximately 50 nm TheSEM image of TiO
2-(3) shows much bigger agglomerates
than these observed for TiO2-(1) however it can be observed
that the larger particles are composed of smaller grains TheSEM analysis confirms that the most uniform and the finestmorphology of rutile nanoparticles was obtained via sol-gelmethod whereas the highest dispersity characterises TiO
2-
(2) sample These findings are in agreement with results ofDLS investigations
34 Broadband Dielectric Spectroscopy Studies In order tocharacterise the dielectric properties of synthesised titania
Journal of Nanomaterials 5
1 10 100 1000
0
5
10
15
20
25
30N
umbe
r (
)
Size (nm)
TiO2-(1)TiO2-(2)TiO2-(3)
(a)
1 10 100 1000
0
5
10
15
20
25
30
Volu
me (
)
Size (nm)
TiO2-(1)TiO2-(2)TiO2-(3)
(b)
Figure 4 Dynamic light scattering (DLS)measurements of size dispersion of the titania in rutile form obtained from three different synthesesand subjected to annealing at 850∘C (synthesis (1)) and at 900∘C (syntheses (2) and (3)) Figures 4(a) and 4(b) represent data weighted bynumber and volume of particles respectively
100 nm
(a)
500 nm
(b)
500 nm
(c)
Figure 5 SEM images of titania samples annealed for two hours (a) TiO2-(1) at 850∘C (b) TiO
2-(2) at 900∘C and (c) TiO
2-(3) at 900∘C
we have applied the broadband dielectric spectroscopy thatallowed determining the physical properties useful for evalu-ation of ceramicrsquos applications such as dielectric permittivity(120576lowast) loss tangent (tan (120575)) and temperature coefficient ofresonant frequency (120591
120576) In Figure 6 one can see three dimen-
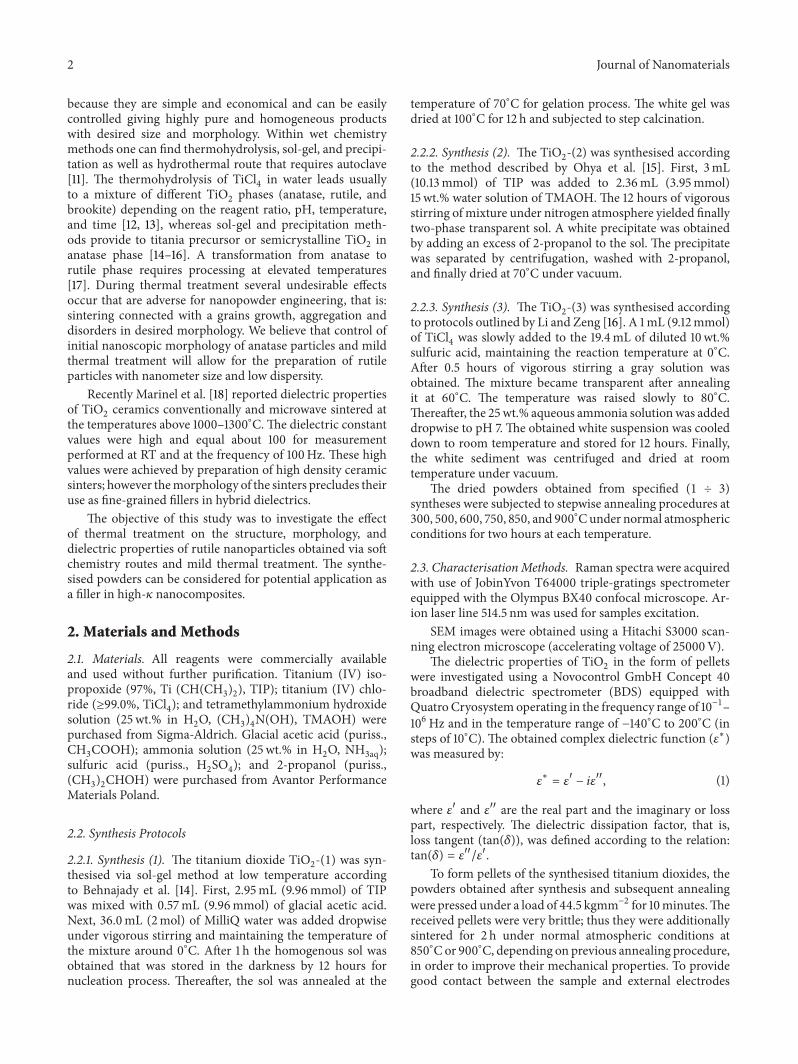
sional (3D) graphs comprising the temperature-frequencyrepresentations of dielectric permittivity (Figure 6(a)) andloss tangent (Figure 6(b)) corresponding to rutile obtainedvia synthesis (1) after annealing at 850∘C The loss tangentrepresentation exhibits that in a range of temperature fromminus20∘C to 120∘C there is a presence of relaxation phenomenonDespite this the increase of investigated variables at lowfrequency and at high temperature was evidenced that isconnected with contribution of ionic conductivity in suchexperimental conditions Figure 7 being a frequency rep-resentation of measured variables in chosen temperaturesshows that dielectric constant decreases with frequency
increase It results from the fact that in ceramic materials theelectric response is complex and composed of polarisationcontributions from different molecular levels as well as spacecharge polarisationsThe dipolar polarisation decreases whendipole rotation cannot follow electric field changes at highfrequencies that results in the decreasing value of dielectricconstant [22] A relaxation phenomenon pointed by arrow inloss tangent representation in Figure 7(b) can be connectedwith energy dissipation on the grain boundaries orand effectof electrode [23 24]These representations are exemplary alsofor other dielectrically investigated samples however theirloss maxima appear in different range of temperature
Figure 8 shows frequency dependence of the real part ofdielectric constant (1205761015840 ) and loss tangent (tan(120575)) measured at20∘C for three rutile samples obtained from different synthe-sis and after annealing conducted at 850∘C for (1) productand at 900∘C for (2) and (3) materials It can be observed
6 Journal of Nanomaterials
104
103
102
101
10minus1
102
105
108
minus200minus100
0100
200
Perm
ittiv
ity998400
Frequency (Hz)Temperature (∘ C)
(a)
10minus1
102
105
108 minus200
minus1000
100200
Frequency (Hz)Temperature (∘ C)
108
105
102
10minus1
10minus4
tan(
120575)
(b)
Figure 6 Temperature-frequency representation of (a) a real part of dielectric permittivity and (b) loss tangent measured for TiO2-(1)
annealed for 2 h at 850∘C
103
102
100
101
102
103
104
105
106
Temperatureminus20
∘C0∘C
20∘C
50∘C
70∘C
120576998400
Frequency (Hz)
(a)
Frequency (Hz)
100
101
102
103
104
10minus1
10minus2
tan(
120575)
100
101
102
103
104
105
106
Temperatureminus20
∘C0∘C
20∘C
50∘C
70∘C
(b)
Figure 7The frequency dependence of (a) dielectric constant and (b) loss tangent measured at different temperatures for TiO2-(1) annealed
for 2 h at 850∘C
that rutile sample obtained from synthesis (1) exhibits thehighest value of dielectric permittivity equal to 637 withdielectric loss of 0051 as measured at MHz frequencies It isworthmentioning that titania in anatase form obtained fromthe same synthesis and annealed at 600∘C exhibits muchlower dielectric constant equal to 189 and significantly higherloss tangent of 0130 in the same frequency range (resultnot presented) Titanium oxides from syntheses (2) and (3)after calcination at 900∘C possess dielectric constant equal to170 and 432 respectively which is illustrated in Figure 8(a)and the tan(120575) equal to 0055 and 4sdot10minus4 at 1MHz (seeFigure 8(b)) It is worth underlining that TiO
2-(3) exhibits
semiflat frequency response of dielectric permittivity value in
broad frequency range and the smallest values of loss tangentfrom all investigated rutile samples The dissipation factormeasured at 20∘C for TiO
2-(1) and TiO
2-(2) has similar
values Samples TiO2-(2) and TiO
2-(3) annealed at 900∘C
exhibit smaller values of 1205761015840 compared to rutile TiO2-(1) In
the case of TiO2-(2) this can be explained by uncompleted
anatase-rutile transformation gradually going on grainsrsquoboundary with formation of intermediate product with core-shell structure Zhang et al found that anatase-rutile transfor-mation is strongly dependent on particle size and going fromthe surface of particle to its centre or reverse depending onparticlesrsquo size [21] Taking into accountDLS and SEMresults itcan be concluded that rutile particles obtained from synthesis
Journal of Nanomaterials 7
10
100
101
102
103
104
105
106
120576998400
TiO2-(1)TiO2-(2)TiO2-(3)
100
Frequency (Hz)
(a)
100
100
101
101
102
102
103
104
105
106
Frequency (Hz)
10minus1
10minus2
10minus3
tan(
120575)
TiO2-(1)TiO2-(2)TiO2-(3)
(b)
Figure 8The frequency dependence of dielectric constant (a) and loss tangent (b) measured at 20∘C for investigated rutile samples annealedfor 2 h at 850∘C (synthesis (1)) and at 900∘C (syntheses (2) and (3))
(1) exhibit the smallest sizes thus this powder transformsto rutile particles at 850∘C and possesses the highest valueof dielectric permittivity Samples TiO
2-(2) and TiO
2-(3)
annealed at 900∘C have similar size as estimated by DLS butthey differ in dispersity index values TiO
2-(1) and TiO
2-(3)
have a similar PDI whereas the TiO2-(2) exhibits PDI equal
to 0715 meaning the broader variety in size of particles Thisfact seems to be crucial in anatase-rutile transformation ofTiO2-(2) sample which is a mixture of both crystallographic
forms as evidenced byRaman studies in Figure 3 and exhibitsthe lowest value of dielectric permittivity Specimen TiO
2-
(3) transformed to rutile phase after annealing at 850∘C asshown in Figure 2 Because dielectric studies evidenced lowvalues of dielectric constant the sample was additionallyannealed during two hours at 900∘C The comparison offrequency representation for TiO
2-(3) annealed at 850∘C and
900∘C and measured at 20∘C allowed observing an increaseof 1205761015840 and the lowering of tan(120575) values in the case of sampleannealed at higher temperature (data presented in Table 1)With regard to Raman spectroscopy applied in our studiesit is worth underlining that this technique is very usefulfor detecting transformation ratio in titania however itssensitivity depends on used excitation line In the case ofcore-shell structure of investigated powder that is anatase-rutile hybrid it may give response either from outer or innerphase thus leading to debated results and some inconsistencywith dielectric results as evidenced in the case of TiO
2-
(3) sample annealed at 850∘C TiO2-(1) annealed at 850∘C
exhibits the highest value of dielectric permittivity but itsdissipation factor is elevated and comparable to sample TiO
2-
(2) annealed at 900∘C (see Figure 8) It results from thesmallest size of TiO
2-(1) nanoparticles which pressed to
pellet form exhibits significant area of grains boundaries thatis a source of dissipation energy in studied system
The obtained dielectric permittivity values for inves-tigated samples are slightly lower from previously founddielectric constants for powders of the anatase and rutilephases that have been reported to be equal to 48 [25] and
89 [26] respectively It can be due to the known relationshipbetween density of the sample and its dielectric propertiesaccording to which higher density that is lower porosityresults in a higher dielectric permittivity that improves alsoquality factor value The relative density of ceramic pelletsstudied by us was varying from 58 to 74 It means thatmeasured materials were partially porous thus they can beconsidered as capacitor composed of ceramic and air Takinginto account the relative density of TiO
2-(1) sample annealed
at 850∘C the recorded value of dielectric permittivity is ingood agreement with above cited value for rutile form
Figure 9 shows temperature dependence of dielectricconstant and loss tangent measured at 115MHz for threerutile samples obtained from different syntheses and anneal-ing procedure conducted at 850∘C for (1) product and at900∘C for (2) and (3) materials It can be observed thatdielectric constant follows the linear dependence in the rangeof temperature from minus140∘C to 20∘C From the range of thelinearity marked in Figure 9(a) the temperature coefficient(120591120576) was calculated according to
120591120576
100381610038161003816100381610038161003816
20∘Cminus140∘C =
1
120576(minus140
∘C)(
Δ120576
Δ119879
) ppm ∘C (2)
The temperature coefficient for TiO2-(1) annealed at
850∘C was calculated to be negative and equal minus579 ppm∘Cthat gives a comparable value found for titania (120591
120576(TiO2) lt
minus500 ppm ∘C) [27]The lower value of 120591120576was found forTiO
2-
(3) annealed at 900∘C (120591120576= minus87) It is worth underlining
that these two samples have a similar PDI index howeverthey differ in grain size This fact seems to have significantinfluence both on temperature coefficient and on loss tangentvaluesThe temperature coefficient value calculated for TiO
2-
(2) annealed at 900∘C was not taken into account in abovecomparison because this rutile sample is contaminated byanatase form The electric parameters of all investigatedsamples are gathered in Table 1
8 Journal of Nanomaterials
100
75
50
25
0
minus150 minus100 minus50 0 50 100 150 200 250
120576998400
Range in linearity
Temperature (∘C)
TiO2-(1)TiO2-(2)TiO2-(3)
(a)
100
10minus1
10minus2
10minus3
10minus4
10minus5
minus150 minus100 minus50 0 50 100 150 200 250
Temperature (∘C)TiO2-(1)TiO2-(2)TiO2-(3)
tan(
120575)
(b)
Figure 9 The temperature dependence of (a) dielectric constant and (b) loss tangent measured at 115MHz for investigated rutile samplesannealed for 2 h at 850∘C (synthesis (1)) and at 900∘C (syntheses (2) and (3))
Table 1 Relative densities and dielectric properties of the TiO2 pellets measured at 115MHz and at temperature of 20∘C The titania pelletswere additionally annealed for 2 hours at the same temperature as the temperature applied during annealing of powder
SynthesisAnnealing temperature
of TiO2 powder[∘C]
Relativedensity []
Dielectricconstant (120576) tan(120575) Temperature coefficient
[ppm∘C]
(1) 600(anatase) 61 189 0130 mdash(1) 850(rutile) 74 637 0051 minus579(2) 900(anatase-rutile) 58 170 0055 minus68lowast
(3) 850(rutile) 59 230 0032 mdash(3) 900(rutile) 66 432 4 sdot 10
minus4minus87
lowastValue calculated in a temperature range from minus140∘C to minus10∘C
4 Conclusion
According to the Raman spectra the anatase-rutile phasetransformation of sample synthesised via sol-gel method isinitiated at about 750∘C whereas the anatase phase com-pletely transforms to the rutile phase when the sample isannealed at temperature up to 850∘C The transformationof TiO
2synthesised via precipitation method is completed
between 850 and 900∘C whereas the transformation of TiO2
synthesised via hybrid layered tetramethyl (ammonium)titanate precursor is not completed up to 900∘CThe compar-ison of Raman results with analysis of samplesmicrostructure(DLS and SEM) reveals that the lowest temperature ofcomplete transformation is observed for the sample contain-ing the smallest grains that is TiO
2-(1) Titania obtained
from syntheses (2) and (3) and annealed at 900∘C showssimilar mean size of particles however the transformationof sample TiO
2-(2) was not completed The TiO
2-(2) sample
characterised by the highest dispersity index has the highesttemperature of transformation The obtained results seemto indicate the relation between the anatase-rutile structuraltransformation and size and dispersity of grains subjectedto annealing The rutile nanoparticles obtained via sol-gelmethod and annealed at 850∘C exhibit the lowest size ofgrains and the lowest PDI value that can be associated withthe highest value of dielectric permittivity obtained for this
sample The dielectric constant measured at room temper-ature is equal to 637 whereas its dielectric temperaturecoefficient equals minus579 ppm∘C and presents characteristicnegative tendency For samples TiO
2-(3) annealed at 900∘C
the lowest loss tangent and temperature coefficient valueswere detected that probably results from uniform grainstructure and smaller area of grain boundary than in the caseof TiO
2-(1) annealed at 850∘C It was found that dielectric
parameters strictly depended on a rate of anatase-rutiletransformation morphology of investigated powders andrelative density of measured pellets
Conflict of Interests
The authors declare that there is no conflict of interestsregarding the publication of this paper
Acknowledgments
This work was financially supported by the National Sci-ence Center (Poland) grant awarded by Decision no DEC-201103DST506074 The authors are grateful to ProfessorAdam Tracz from the Polish Academy of Science in Lodz forhis help in performing SEM investigations
Journal of Nanomaterials 9
References
[1] H Zhang and J F Banfield ldquoKinetics of crystallization andcrystal growth of nanocrystalline anatase in nanometer-sizedamorphous titaniardquo Chemistry of Materials vol 14 no 10 pp4145ndash4154 2002
[2] R J Tayade P K Surolia R G Kulkarni and R V JasraldquoPhotocatalytic degradation of dyes and organic contaminantsin water using nanocrystalline anatase and rutile TiO
2rdquo Science
and Technology of AdvancedMaterials vol 8 no 6 pp 455ndash4622007
[3] B A Al-Asbahi M H H Jumali C C Yap and M MSalleh ldquoInfluence of TiO
2nanoparticles on enhancement of
optoelectronic properties of PFO-based light emitting dioderdquoJournal of Nanomaterials vol 2013 Article ID 561534 7 pages2013
[4] L-X Pang H Wang D Zhou and X Yao ldquoLow-temperaturesintering and microwave dielectric properties of TiO
2-based
LTCCmaterialsrdquo Journal of Materials Science vol 21 no 12 pp1285ndash1292 2010
[5] M Crippa A Bianchi D Cristofori et al ldquoHigh dielectric con-stant rutile-polystyrene composite with enhanced percolativethresholdrdquo Journal ofMaterials Chemistry C vol 1 pp 484ndash4922013
[6] XHuang Z Pu L Tong ZWang andX Liu ldquoPreparation anddielectric properties of surface modified TiO
2PEN composite
films with high thermal stability and flexibilityrdquo Journal ofMaterials Science vol 23 pp 2089ndash2097 2012
[7] R P Ortiz A Facchetti and T J Marks ldquoHigh-k organicinorganic and hybrid dielectrics for low-voltage organic field-effect transistorsrdquoChemical Reviews vol 110 no 1 pp 205ndash2392010
[8] J Shi and X Wang ldquoGrowth of rutile titanium dioxidenanowires by pulsed chemical vapor depositionrdquo CrystalGrowth and Design vol 11 no 4 pp 949ndash954 2011
[9] C J Tavares S M Marques L Rebouta et al ldquoPVD-Grownphotocatalytic TiO
2thin films on PVDF substrates for sensors
and actuators applicationsrdquoThin Solid Films vol 517 no 3 pp1161ndash1166 2008
[10] X Chen and S S Mao ldquoTitanium dioxide nanomaterialssynthesis properties modifications and applicationsrdquoChemicalReviews vol 107 no 7 pp 2891ndash2959 2007
[11] H Yin Y Wada T Kitamura et al ldquoHydrothermal synthesisof nanosized anatase and ruffle TiO
2using amorphous phase
TiO2rdquo Journal of Materials Chemistry vol 11 no 6 pp 1694ndash
1703 2001[12] A di Paola M Bellardita R Ceccato L Palmisano and F
Parrino ldquoHighly active photocatalytic TiO2powders obtained
by thermohydrolysis of TiCl4in waterrdquo Journal of Physical
Chemistry C vol 113 no 34 pp 15166ndash15174 2009[13] S Cassaignon M Koelsch and J-P Jolivet ldquoSelective synthesis
of brookite anatase and rutile nanoparticles thermolysis ofTiCl4in aqueous nitric acidrdquo Journal of Materials Science vol
42 no 16 pp 6689ndash6695 2007[14] M A Behnajady H Eskandarloo N Modirshahla and M
Shokri ldquoSol-gel low-temperature synthesis of stable anatase-type TiO
2nanoparticles under different conditions and its
photocatalytic activityrdquo Photochemistry and Photobiology vol87 no 5 pp 1002ndash1008 2011
[15] T Ohya A Nakayama T Ban Y Ohya and Y TakahashildquoSynthesis and characterization of halogen-free transparent
aqueous colloidal titanate solutions from titanium alkoxiderdquoChemistry of Materials vol 14 no 7 pp 3082ndash3089 2002
[16] W Li and T Zeng ldquoPreparation of TiO2anatase nanocrystals
by TiCl4hydrolysis with additive H
2SO4rdquo PLoS ONE vol 6 no
6 Article ID e21082 2011[17] J Zhang M Li Z Feng J Chen and C Li ldquoUV raman
spectroscopic study on TiO2mdashI Phase transformation at thesurface and in the bulkrdquo Journal of Physical Chemistry B vol110 no 2 pp 927ndash935 2006
[18] S Marinel D H Choi R Heuguet D Agrawal and M Lana-gan ldquoBroadband dielectric characterization of TiO
2ceram-
ics sintered through microwave and conventional processesrdquoCeramics International vol 39 pp 299ndash306 2013
[19] Y Zhang C X Harris P Wallenmeyer J Murowchick andX Chen ldquoAsymmetric lattice vibrational Characteristics ofRutile TiO
2as revealed by laser power dependent raman
spectroscopyrdquo Journal of Physical Chemistry C vol 117 pp24015ndash24022 2013
[20] I E Campbell and E M Sherwood Eds High-TemperatureMaterials and Technology Wiley New York NY USA 1967
[21] J Zhang Q Xu M Li Z Feng and C Li ldquoUV Ramanspectroscopic study on TiO
2mdashII Effect of nanoparticle size
on the outerinner phase transformationsrdquo Journal of PhysicalChemistry C vol 113 no 5 pp 1698ndash1704 2009
[22] D H Wang W C Goh M Ning and C K Ong ldquoEffectof Ba doping on magnetic ferroelectric and magnetoelectricproperties inmutiferroic BiFeO
3at room temperaturerdquoApplied
Physics Letters vol 88 no 21 Article ID 212907 2006[23] J J Mohamed S D Hutagalung M F Ain and Z A Ahmad
ldquoEffect of excess TiO2in CaCu
3Ti4O12
on the microstruc-ture and dielectric propertiesrdquo Journal of Ceramic ProcessingResearch vol 12 no 5 pp 496ndash499 2011
[24] M C Romeu R G M Oliveira and A J M Sales ldquoImpedancespectroscopy study of TiO
2addition on the ceramic matrix
Na2Nb4O11rdquo Journal of Materials Science-Materials in Electron-
ics vol 24 pp 4993ndash4999 2013[25] L A Harris ldquoTitanium dioxide hydrogen detectorrdquo Journal of
the Electrochemical Society vol 127 no 12 pp 2657ndash2662 1980[26] F A Grant ldquoProperties of rutile (titanium dioxide)rdquo Reviews of
Modern Physics vol 31 no 3 pp 646ndash674 1959[27] K Haga T Ishii J-I Mashiyama and T Ikeda ldquoDielectric
properties of two-phase mixture ceramics composed of rutileand its compoundsrdquo Japanese Journal of Applied Physics vol 31no 9 pp 3156ndash3159 1992
Submit your manuscripts athttpwwwhindawicom
ScientificaHindawi Publishing Corporationhttpwwwhindawicom Volume 2014
CorrosionInternational Journal of
Hindawi Publishing Corporationhttpwwwhindawicom Volume 2014
Polymer ScienceInternational Journal of
Hindawi Publishing Corporationhttpwwwhindawicom Volume 2014
Hindawi Publishing Corporationhttpwwwhindawicom Volume 2014
CeramicsJournal of
Hindawi Publishing Corporationhttpwwwhindawicom Volume 2014
CompositesJournal of
NanoparticlesJournal of
Hindawi Publishing Corporationhttpwwwhindawicom Volume 2014
Hindawi Publishing Corporationhttpwwwhindawicom Volume 2014
International Journal of
Biomaterials
Hindawi Publishing Corporationhttpwwwhindawicom Volume 2014
NanoscienceJournal of
TextilesHindawi Publishing Corporation httpwwwhindawicom Volume 2014
Journal of
NanotechnologyHindawi Publishing Corporationhttpwwwhindawicom Volume 2014
Journal of
CrystallographyJournal of
Hindawi Publishing Corporationhttpwwwhindawicom Volume 2014
The Scientific World JournalHindawi Publishing Corporation httpwwwhindawicom Volume 2014
Hindawi Publishing Corporationhttpwwwhindawicom Volume 2014
CoatingsJournal of
Advances in
Materials Science and EngineeringHindawi Publishing Corporationhttpwwwhindawicom Volume 2014
Smart Materials Research
Hindawi Publishing Corporationhttpwwwhindawicom Volume 2014
Hindawi Publishing Corporationhttpwwwhindawicom Volume 2014
MetallurgyJournal of
Hindawi Publishing Corporationhttpwwwhindawicom Volume 2014
BioMed Research International
MaterialsJournal of
Hindawi Publishing Corporationhttpwwwhindawicom Volume 2014
Nano
materials
Hindawi Publishing Corporationhttpwwwhindawicom Volume 2014
Journal ofNanomaterials
2 Journal of Nanomaterials
because they are simple and economical and can be easilycontrolled giving highly pure and homogeneous productswith desired size and morphology Within wet chemistrymethods one can find thermohydrolysis sol-gel and precipi-tation as well as hydrothermal route that requires autoclave[11] The thermohydrolysis of TiCl
4in water leads usually
to a mixture of different TiO2phases (anatase rutile and
brookite) depending on the reagent ratio pH temperatureand time [12 13] whereas sol-gel and precipitation meth-ods provide to titania precursor or semicrystalline TiO
2in
anatase phase [14ndash16] A transformation from anatase torutile phase requires processing at elevated temperatures[17] During thermal treatment several undesirable effectsoccur that are adverse for nanopowder engineering that issintering connected with a grains growth aggregation anddisorders in desired morphology We believe that control ofinitial nanoscopic morphology of anatase particles and mildthermal treatment will allow for the preparation of rutileparticles with nanometer size and low dispersity
Recently Marinel et al [18] reported dielectric propertiesof TiO
2ceramics conventionally and microwave sintered at
the temperatures above 1000ndash1300∘CThe dielectric constantvalues were high and equal about 100 for measurementperformed at RT and at the frequency of 100Hz These highvalues were achieved by preparation of high density ceramicsinters however themorphology of the sinters precludes theiruse as fine-grained fillers in hybrid dielectrics
The objective of this study was to investigate the effectof thermal treatment on the structure morphology anddielectric properties of rutile nanoparticles obtained via softchemistry routes and mild thermal treatment The synthe-sised powders can be considered for potential application asa filler in high-120581 nanocomposites
2 Materials and Methods
21 Materials All reagents were commercially availableand used without further purification Titanium (IV) iso-propoxide (97 Ti (CH(CH
3)2) TIP) titanium (IV) chlo-
ride (ge990 TiCl4) and tetramethylammonium hydroxide
solution (25wt in H2O (CH
3)4N(OH) TMAOH) were
purchased from Sigma-Aldrich Glacial acetic acid (purissCH3COOH) ammonia solution (25wt in H
2O NH
3aq)sulfuric acid (puriss H
2SO4) and 2-propanol (puriss
(CH3)2CHOH) were purchased from Avantor Performance
Materials Poland
22 Synthesis Protocols
221 Synthesis (1) The titanium dioxide TiO2-(1) was syn-
thesised via sol-gel method at low temperature accordingto Behnajady et al [14] First 295mL (996mmol) of TIPwas mixed with 057mL (996mmol) of glacial acetic acidNext 360mL (2mol) of MilliQ water was added dropwiseunder vigorous stirring and maintaining the temperature ofthe mixture around 0∘C After 1 h the homogenous sol wasobtained that was stored in the darkness by 12 hours fornucleation process Thereafter the sol was annealed at the
temperature of 70∘C for gelation process The white gel wasdried at 100∘C for 12 h and subjected to step calcination
222 Synthesis (2) The TiO2-(2) was synthesised according
to the method described by Ohya et al [15] First 3mL(1013mmol) of TIP was added to 236mL (395mmol)15 wt water solution of TMAOH The 12 hours of vigorousstirring of mixture under nitrogen atmosphere yielded finallytwo-phase transparent sol A white precipitate was obtainedby adding an excess of 2-propanol to the sol The precipitatewas separated by centrifugation washed with 2-propanoland finally dried at 70∘C under vacuum
223 Synthesis (3) The TiO2-(3) was synthesised according
to protocols outlined by Li and Zeng [16] A 1mL (912mmol)of TiCl
4was slowly added to the 194mL of diluted 10wt
sulfuric acid maintaining the reaction temperature at 0∘CAfter 05 hours of vigorous stirring a gray solution wasobtained The mixture became transparent after annealingit at 60∘C The temperature was raised slowly to 80∘CThereafter the 25wt aqueous ammonia solutionwas addeddropwise to pH 7 The obtained white suspension was cooleddown to room temperature and stored for 12 hours Finallythe white sediment was centrifuged and dried at roomtemperature under vacuum
The dried powders obtained from specified (1 divide 3)syntheses were subjected to stepwise annealing procedures at300 500 600 750 850 and 900∘Cunder normal atmosphericconditions for two hours at each temperature
23 CharacterisationMethods Raman spectra were acquiredwith use of JobinYvon T64000 triple-gratings spectrometerequipped with the Olympus BX40 confocal microscope Ar-ion laser line 5145 nm was used for samples excitation
SEM images were obtained using a Hitachi S3000 scan-ning electron microscope (accelerating voltage of 25000V)
The dielectric properties of TiO2in the form of pellets
were investigated using a Novocontrol GmbH Concept 40broadband dielectric spectrometer (BDS) equipped withQuatro Cryosystem operating in the frequency range of 10minus1ndash106Hz and in the temperature range of minus140∘C to 200∘C (insteps of 10∘C) The obtained complex dielectric function (120576lowast)was measured by
120576lowast= 1205761015840minus 11989412057610158401015840 (1)
where 1205761015840 and 12057610158401015840 are the real part and the imaginary or losspart respectively The dielectric dissipation factor that isloss tangent (tan(120575)) was defined according to the relationtan(120575) = 120576101584010158401205761015840
To form pellets of the synthesised titanium dioxides thepowders obtained after synthesis and subsequent annealingwere pressed under a load of 445 kgmmminus2 for 10minutesThereceived pellets were very brittle thus they were additionallysintered for 2 h under normal atmospheric conditions at850∘Cor 900∘C depending on previous annealing procedurein order to improve their mechanical properties To providegood contact between the sample and external electrodes
Journal of Nanomaterials 3
during electrical investigations 150 nm thick gold electrodeswere deposited on both sites of each pellet The densities ofthe samples were evaluated based on the external dimensionsand mass of the pellets The relative density of preparedpellets was estimated through comparison with crystallo-graphic density of TiO
2(for anatase 389 gcm3 ICDD-PDF-
2 code number 00-021-1272 for rutile 425 gcm3 ICDD-PDF-2 code number 00-021-1276) To exclude the influenceof humidity each pellet was additionally dried at 90∘C forone hour under reduced pressure directly before dielectricmeasurement
Particle sizes obtained in a different step of calcina-tion were estimated from dynamic light scattering (DLS)technique For measurements Malvern Zetasizer Nano ZSinstrument equipped with He-Ne laser operating at 633 nmwas used To perform DLS measurements 000125M aque-ous solutions of titania obtained from described synthesisand annealed at different temperature were prepared Thesolutions were sonicated in an ultrasonic bath for one hourand additionally 3 minutes prior to measurement in orderto ensure proper dispersion of the particles DLS data werecollected in automatic duration mode for solution placed inquartz cuvettes with square aperture using the light beingdetected at an angle of 173∘ and at temperature stabilised toa value of 25∘CThe correlation function was processed usingthe density and refraction index parameters corresponding toTiO2 in anatase and rutile form and H
2O
3 Results and Discussion
31 Raman Spectroscopy Studies The as-synthesised sampleswere subjected to a subsequent annealing at the temperaturesranging from 500 to 900∘C The Raman spectroscopy wasused for structural identification of annealed samplesThe Raman spectra of titania polymorphs are enoughdistinctive and they are very useful for identificationof various TiO
2phases The anatase has six Raman-
active modes in the vibrational spectrum centeredaround 144 cmminus1 (Eg) 197 cmminus1 (Eg) 399 cmminus1 (B
1g)513 cmminus1 (A
1g) 519 cmminus1 (B1g) and 639 cmminus1 (Eg) [10]
The rutile TiO2
has four vibrational modes around145 cmminus1 (B
1g) 445 cmminus1(Eg) 610 cm
minus1(A1g) and 240 cm
minus1
for second-order effect (SOE) [19] The analysis of Ramanspectra of samples annealed at 600∘C (data not shown)revealed pure anatase phase with high crystallinity for allsynthesised TiO
2-(1) TiO
2-(2) and TiO
2-(3) samples
Further annealing leads to a gradual anatase to rutilephase transformation Figure 1 illustrates Raman spectraof the samples TiO
2-(1) TiO
2-(2) and TiO
2-(3) annealed
at 750∘C Spectra of TiO2-(2) and TiO
2-(3) show peaks
characteristic for anatase whereas the Raman spectrumof TiO
2-(1) obtained from sol-gel method shows Raman
peaks characteristic for both anatase and rutile phasesAn increase of the annealing temperature up to 850∘Cbrings profound changes in the Raman spectra (Figure 2)of TiO
2-(1) and TiO
2-(3) with a presence of bands typical
for rutile phase whereas the Raman spectrum of TiO2-(2)
200 400 600 800 1000
R AAA
A
A
R
(c)(b)(a)
Inte
nsity
Raman shift (cmminus1)
750∘C
Figure 1 Raman spectra of the TiO2powders annealed at 750∘C for
2 hours (a) TiO2-(1) (b) TiO
2-(2) and (c) TiO
2-(3) Raman modes
of anatase and rutile phases are denoted by A and R respectively
200 400 600 800 1000
A AA
R
RR
A R
A
(a)
(c)(b)
Inte
nsity
850∘C
Raman shift (cmminus1)
Figure 2 Raman spectra of the TiO2powders annealed at 850∘C for
2 hours (a) TiO2-(1) (b) TiO
2-(2) and (c) TiO
2-(3) Raman modes
of anatase and rutile phases are denoted by A and R respectively
exhibits bands indicative of both anatase and rutile phasesFigure 3 illustrates Raman spectra of products obtainedafter subsequent annealing at 900∘C The Raman spectraof TiO
2-(1) (Figure 3(a)) and TiO
2-(3) (Figure 3(c)) show
bands characteristic for rutile and compared to the Ramanspectra of these samples annealed at 850∘C one can see onlyslight narrowing of the widest bandsTheRaman spectrum ofthe sample TiO
2-(2) still exhibits strong bands characteristic
for anatase phase but the relative intensity of the highestband centered around 144 cmminus1is visibly lower comparedto the Raman spectrum shown in Figure 2(b) This changereveals progress in phase transformation from anatase torutile however the transformation of sample TiO
2-(2) was
not completed at this temperature
4 Journal of Nanomaterials
200 400 600 800 1000
AA
R
R
R
A
R
A
(c)(b)
Inte
nsity
(a)
Raman shift (cmminus1)
900∘C
Figure 3 Raman spectra of the TiO2powders annealed at 900∘C for
2 hours (a) TiO2-(1) (b) TiO
2-(2) and (c) TiO
2-(3) Raman modes
of anatase and rutile phases are denoted by A and R respectively
According to literature the temperature of anatase torutile phase transformation is about 915∘C [20] In thepresent study we observed a decrease in the transformationtemperature which is due to the nanocrystalline structureof synthesised samples Similar results were obtained instudies performed by Zhang et al [21] They observed dis-tinct changes in phase transformation temperatures betweensamples composed of anatase nanoparticles of different sizesranging from 7 to 60 nm According to this the temperatureof phase transformation for the initial anatase particlessmaller than 10 nm was lower than 600∘C the anatasenanoparticles with size in the range 10ndash60 nm transformedat the temperatures range between 900 and 1000∘C whereasparticles of a size greater than 60 nm transformed to rutile attemperature above 1000∘C The samples TiO
2-(1) and TiO
2-
(3) exhibit complete anatase to rutile phase transformationachieved at the annealing temperature of 850∘C whereasfor the sample TiO
2-(2) the phase transformation was still
incomplete up to the temperature of 900∘C Moreover theRaman analysis revealed that the first signs of the phasetransformation were observed for the sample TiO
2-(1) in the
temperature of 750∘C According to Zhang et al [21] andbased on the observed temperatures of phase transformationwe can assume that the smallest size of anatase nanoparticlescharacterises the sample TiO
2-(1) and the biggest particles
of anatase are in the sample TiO2-(2) The Raman spectrum
of sample TiO2-(2) shows bands characteristic for anatase
and rutile phases The anatase content in this partially trans-formed sample can be evaluated based on the work of Zhangand coworkers [17] where the Raman spectra of anatase-rutile mixtures with different composition were analysedThe authors presented the linear relationship between thearea ratios of the Raman band at 395 cmminus1 for anatase phaseto the band at 445 cmminus1 for rutile phase and the weightratios of anatase phase to rutile phase Based on this relation
the estimated anatase content in the sample TiO2-(2) after
annealing at 900∘C is less than 10wt
32 Dynamic Light Scattering Measurements Figure 4shows dynamic light scattering data weighted by numbers(Figure 4(a)) and volume (Figure 4(b)) of TiO
2(rutile)
particles obtained from three different syntheses TiO2
obtained via synthesis (1) was annealed at 850∘C whereasthe precursors obtained from syntheses (2) and (3) had to beannealed at 900∘C to transform in rutile phase The numberweighted DLS measurement of the product from synthesis(1) exhibits one peak corresponding to a fraction of particleswith size in the range of 10 divide 40 nm that corresponds tothe amount of 99 of all particles in the solution Thevolume-weighted representation exhibits three main peaksof decreasing magnitude located at about 20 nm 60 nm and230 nm whereas the fraction of nanoparticles with averagesize of about 20 nm constitutes 46 of the total volume ofthe dispersed phase Rutile nanoparticles obtained fromsyntheses (2) and (3) exhibit unimodal distributions ofparticle size both in number and volume representationsThe size of nanoparticles coming from synthesis (2) variesin the range 90 divide 260 nm with a mean value equal to150 Dispersity value called in the past a polydispersityindex (PDI) defined in ISO13321 Part 8 for this series ofnanoparticles is equal to 071 Nanoparticles from synthesis(3) exhibit slightly narrower size distribution than the (2)product with PDI equal to 043 In this case the size is rangingfrom 90 nm to 300 nm with a mean value equal to 160 nmand 180 nm as deduced from the representations given atFigures 4(a) and 4(b) From DLS measurements it can beconcluded that titania nanoparticles obtained via method(1) possess similar dispersity (PDI = 049) compared toseries (3) The same conclusion can be drawn through SEMmicrographs (see Figure 5) which were performed in orderto study the morphology of obtained rutile powders
33 Scanning Electron Microscopy Investigations Figure 5(a)shows the SEM image of TiO
2powder obtained via synthesis
(1) and annealed at the temperature of 850∘CThe average sizeof particles is about 20 nm and they are slightly agglomeratedFigures 5(b) and 5(c) show SEM images of TiO
2annealed
at the temperature of 900∘C obtained via syntheses (2) and(3) respectively Both images reveal large grains The SEMimage of TiO
2-(2) reveals also high dispersity of particles
size The size of the biggest rectangular grains equals 300 nmand the size of the smallest one is approximately 50 nm TheSEM image of TiO
2-(3) shows much bigger agglomerates
than these observed for TiO2-(1) however it can be observed
that the larger particles are composed of smaller grains TheSEM analysis confirms that the most uniform and the finestmorphology of rutile nanoparticles was obtained via sol-gelmethod whereas the highest dispersity characterises TiO
2-
(2) sample These findings are in agreement with results ofDLS investigations
34 Broadband Dielectric Spectroscopy Studies In order tocharacterise the dielectric properties of synthesised titania
Journal of Nanomaterials 5
1 10 100 1000
0
5
10
15
20
25
30N
umbe
r (
)
Size (nm)
TiO2-(1)TiO2-(2)TiO2-(3)
(a)
1 10 100 1000
0
5
10
15
20
25
30
Volu
me (
)
Size (nm)
TiO2-(1)TiO2-(2)TiO2-(3)
(b)
Figure 4 Dynamic light scattering (DLS)measurements of size dispersion of the titania in rutile form obtained from three different synthesesand subjected to annealing at 850∘C (synthesis (1)) and at 900∘C (syntheses (2) and (3)) Figures 4(a) and 4(b) represent data weighted bynumber and volume of particles respectively
100 nm
(a)
500 nm
(b)
500 nm
(c)
Figure 5 SEM images of titania samples annealed for two hours (a) TiO2-(1) at 850∘C (b) TiO
2-(2) at 900∘C and (c) TiO
2-(3) at 900∘C
we have applied the broadband dielectric spectroscopy thatallowed determining the physical properties useful for evalu-ation of ceramicrsquos applications such as dielectric permittivity(120576lowast) loss tangent (tan (120575)) and temperature coefficient ofresonant frequency (120591
120576) In Figure 6 one can see three dimen-
sional (3D) graphs comprising the temperature-frequencyrepresentations of dielectric permittivity (Figure 6(a)) andloss tangent (Figure 6(b)) corresponding to rutile obtainedvia synthesis (1) after annealing at 850∘C The loss tangentrepresentation exhibits that in a range of temperature fromminus20∘C to 120∘C there is a presence of relaxation phenomenonDespite this the increase of investigated variables at lowfrequency and at high temperature was evidenced that isconnected with contribution of ionic conductivity in suchexperimental conditions Figure 7 being a frequency rep-resentation of measured variables in chosen temperaturesshows that dielectric constant decreases with frequency
increase It results from the fact that in ceramic materials theelectric response is complex and composed of polarisationcontributions from different molecular levels as well as spacecharge polarisationsThe dipolar polarisation decreases whendipole rotation cannot follow electric field changes at highfrequencies that results in the decreasing value of dielectricconstant [22] A relaxation phenomenon pointed by arrow inloss tangent representation in Figure 7(b) can be connectedwith energy dissipation on the grain boundaries orand effectof electrode [23 24]These representations are exemplary alsofor other dielectrically investigated samples however theirloss maxima appear in different range of temperature
Figure 8 shows frequency dependence of the real part ofdielectric constant (1205761015840 ) and loss tangent (tan(120575)) measured at20∘C for three rutile samples obtained from different synthe-sis and after annealing conducted at 850∘C for (1) productand at 900∘C for (2) and (3) materials It can be observed
6 Journal of Nanomaterials
104
103
102
101
10minus1
102
105
108
minus200minus100
0100
200
Perm
ittiv
ity998400
Frequency (Hz)Temperature (∘ C)
(a)
10minus1
102
105
108 minus200
minus1000
100200
Frequency (Hz)Temperature (∘ C)
108
105
102
10minus1
10minus4
tan(
120575)
(b)
Figure 6 Temperature-frequency representation of (a) a real part of dielectric permittivity and (b) loss tangent measured for TiO2-(1)
annealed for 2 h at 850∘C
103
102
100
101
102
103
104
105
106
Temperatureminus20
∘C0∘C
20∘C
50∘C
70∘C
120576998400
Frequency (Hz)
(a)
Frequency (Hz)
100
101
102
103
104
10minus1
10minus2
tan(
120575)
100
101
102
103
104
105
106
Temperatureminus20
∘C0∘C
20∘C
50∘C
70∘C
(b)
Figure 7The frequency dependence of (a) dielectric constant and (b) loss tangent measured at different temperatures for TiO2-(1) annealed
for 2 h at 850∘C
that rutile sample obtained from synthesis (1) exhibits thehighest value of dielectric permittivity equal to 637 withdielectric loss of 0051 as measured at MHz frequencies It isworthmentioning that titania in anatase form obtained fromthe same synthesis and annealed at 600∘C exhibits muchlower dielectric constant equal to 189 and significantly higherloss tangent of 0130 in the same frequency range (resultnot presented) Titanium oxides from syntheses (2) and (3)after calcination at 900∘C possess dielectric constant equal to170 and 432 respectively which is illustrated in Figure 8(a)and the tan(120575) equal to 0055 and 4sdot10minus4 at 1MHz (seeFigure 8(b)) It is worth underlining that TiO
2-(3) exhibits
semiflat frequency response of dielectric permittivity value in
broad frequency range and the smallest values of loss tangentfrom all investigated rutile samples The dissipation factormeasured at 20∘C for TiO
2-(1) and TiO
2-(2) has similar
values Samples TiO2-(2) and TiO
2-(3) annealed at 900∘C
exhibit smaller values of 1205761015840 compared to rutile TiO2-(1) In
the case of TiO2-(2) this can be explained by uncompleted
anatase-rutile transformation gradually going on grainsrsquoboundary with formation of intermediate product with core-shell structure Zhang et al found that anatase-rutile transfor-mation is strongly dependent on particle size and going fromthe surface of particle to its centre or reverse depending onparticlesrsquo size [21] Taking into accountDLS and SEMresults itcan be concluded that rutile particles obtained from synthesis
Journal of Nanomaterials 7
10
100
101
102
103
104
105
106
120576998400
TiO2-(1)TiO2-(2)TiO2-(3)
100
Frequency (Hz)
(a)
100
100
101
101
102
102
103
104
105
106
Frequency (Hz)
10minus1
10minus2
10minus3
tan(
120575)
TiO2-(1)TiO2-(2)TiO2-(3)
(b)
Figure 8The frequency dependence of dielectric constant (a) and loss tangent (b) measured at 20∘C for investigated rutile samples annealedfor 2 h at 850∘C (synthesis (1)) and at 900∘C (syntheses (2) and (3))
(1) exhibit the smallest sizes thus this powder transformsto rutile particles at 850∘C and possesses the highest valueof dielectric permittivity Samples TiO
2-(2) and TiO
2-(3)
annealed at 900∘C have similar size as estimated by DLS butthey differ in dispersity index values TiO
2-(1) and TiO
2-(3)
have a similar PDI whereas the TiO2-(2) exhibits PDI equal
to 0715 meaning the broader variety in size of particles Thisfact seems to be crucial in anatase-rutile transformation ofTiO2-(2) sample which is a mixture of both crystallographic
forms as evidenced byRaman studies in Figure 3 and exhibitsthe lowest value of dielectric permittivity Specimen TiO
2-
(3) transformed to rutile phase after annealing at 850∘C asshown in Figure 2 Because dielectric studies evidenced lowvalues of dielectric constant the sample was additionallyannealed during two hours at 900∘C The comparison offrequency representation for TiO
2-(3) annealed at 850∘C and
900∘C and measured at 20∘C allowed observing an increaseof 1205761015840 and the lowering of tan(120575) values in the case of sampleannealed at higher temperature (data presented in Table 1)With regard to Raman spectroscopy applied in our studiesit is worth underlining that this technique is very usefulfor detecting transformation ratio in titania however itssensitivity depends on used excitation line In the case ofcore-shell structure of investigated powder that is anatase-rutile hybrid it may give response either from outer or innerphase thus leading to debated results and some inconsistencywith dielectric results as evidenced in the case of TiO
2-
(3) sample annealed at 850∘C TiO2-(1) annealed at 850∘C
exhibits the highest value of dielectric permittivity but itsdissipation factor is elevated and comparable to sample TiO
2-
(2) annealed at 900∘C (see Figure 8) It results from thesmallest size of TiO
2-(1) nanoparticles which pressed to
pellet form exhibits significant area of grains boundaries thatis a source of dissipation energy in studied system
The obtained dielectric permittivity values for inves-tigated samples are slightly lower from previously founddielectric constants for powders of the anatase and rutilephases that have been reported to be equal to 48 [25] and
89 [26] respectively It can be due to the known relationshipbetween density of the sample and its dielectric propertiesaccording to which higher density that is lower porosityresults in a higher dielectric permittivity that improves alsoquality factor value The relative density of ceramic pelletsstudied by us was varying from 58 to 74 It means thatmeasured materials were partially porous thus they can beconsidered as capacitor composed of ceramic and air Takinginto account the relative density of TiO
2-(1) sample annealed
at 850∘C the recorded value of dielectric permittivity is ingood agreement with above cited value for rutile form
Figure 9 shows temperature dependence of dielectricconstant and loss tangent measured at 115MHz for threerutile samples obtained from different syntheses and anneal-ing procedure conducted at 850∘C for (1) product and at900∘C for (2) and (3) materials It can be observed thatdielectric constant follows the linear dependence in the rangeof temperature from minus140∘C to 20∘C From the range of thelinearity marked in Figure 9(a) the temperature coefficient(120591120576) was calculated according to
120591120576
100381610038161003816100381610038161003816
20∘Cminus140∘C =
1
120576(minus140
∘C)(
Δ120576
Δ119879
) ppm ∘C (2)
The temperature coefficient for TiO2-(1) annealed at
850∘C was calculated to be negative and equal minus579 ppm∘Cthat gives a comparable value found for titania (120591
120576(TiO2) lt
minus500 ppm ∘C) [27]The lower value of 120591120576was found forTiO
2-
(3) annealed at 900∘C (120591120576= minus87) It is worth underlining
that these two samples have a similar PDI index howeverthey differ in grain size This fact seems to have significantinfluence both on temperature coefficient and on loss tangentvaluesThe temperature coefficient value calculated for TiO
2-
(2) annealed at 900∘C was not taken into account in abovecomparison because this rutile sample is contaminated byanatase form The electric parameters of all investigatedsamples are gathered in Table 1
8 Journal of Nanomaterials
100
75
50
25
0
minus150 minus100 minus50 0 50 100 150 200 250
120576998400
Range in linearity
Temperature (∘C)
TiO2-(1)TiO2-(2)TiO2-(3)
(a)
100
10minus1
10minus2
10minus3
10minus4
10minus5
minus150 minus100 minus50 0 50 100 150 200 250
Temperature (∘C)TiO2-(1)TiO2-(2)TiO2-(3)
tan(
120575)
(b)
Figure 9 The temperature dependence of (a) dielectric constant and (b) loss tangent measured at 115MHz for investigated rutile samplesannealed for 2 h at 850∘C (synthesis (1)) and at 900∘C (syntheses (2) and (3))
Table 1 Relative densities and dielectric properties of the TiO2 pellets measured at 115MHz and at temperature of 20∘C The titania pelletswere additionally annealed for 2 hours at the same temperature as the temperature applied during annealing of powder
SynthesisAnnealing temperature
of TiO2 powder[∘C]
Relativedensity []
Dielectricconstant (120576) tan(120575) Temperature coefficient
[ppm∘C]
(1) 600(anatase) 61 189 0130 mdash(1) 850(rutile) 74 637 0051 minus579(2) 900(anatase-rutile) 58 170 0055 minus68lowast
(3) 850(rutile) 59 230 0032 mdash(3) 900(rutile) 66 432 4 sdot 10
minus4minus87
lowastValue calculated in a temperature range from minus140∘C to minus10∘C
4 Conclusion
According to the Raman spectra the anatase-rutile phasetransformation of sample synthesised via sol-gel method isinitiated at about 750∘C whereas the anatase phase com-pletely transforms to the rutile phase when the sample isannealed at temperature up to 850∘C The transformationof TiO
2synthesised via precipitation method is completed
between 850 and 900∘C whereas the transformation of TiO2
synthesised via hybrid layered tetramethyl (ammonium)titanate precursor is not completed up to 900∘CThe compar-ison of Raman results with analysis of samplesmicrostructure(DLS and SEM) reveals that the lowest temperature ofcomplete transformation is observed for the sample contain-ing the smallest grains that is TiO
2-(1) Titania obtained
from syntheses (2) and (3) and annealed at 900∘C showssimilar mean size of particles however the transformationof sample TiO
2-(2) was not completed The TiO
2-(2) sample
characterised by the highest dispersity index has the highesttemperature of transformation The obtained results seemto indicate the relation between the anatase-rutile structuraltransformation and size and dispersity of grains subjectedto annealing The rutile nanoparticles obtained via sol-gelmethod and annealed at 850∘C exhibit the lowest size ofgrains and the lowest PDI value that can be associated withthe highest value of dielectric permittivity obtained for this
sample The dielectric constant measured at room temper-ature is equal to 637 whereas its dielectric temperaturecoefficient equals minus579 ppm∘C and presents characteristicnegative tendency For samples TiO
2-(3) annealed at 900∘C
the lowest loss tangent and temperature coefficient valueswere detected that probably results from uniform grainstructure and smaller area of grain boundary than in the caseof TiO
2-(1) annealed at 850∘C It was found that dielectric
parameters strictly depended on a rate of anatase-rutiletransformation morphology of investigated powders andrelative density of measured pellets
Conflict of Interests
The authors declare that there is no conflict of interestsregarding the publication of this paper
Acknowledgments
This work was financially supported by the National Sci-ence Center (Poland) grant awarded by Decision no DEC-201103DST506074 The authors are grateful to ProfessorAdam Tracz from the Polish Academy of Science in Lodz forhis help in performing SEM investigations
Journal of Nanomaterials 9
References
[1] H Zhang and J F Banfield ldquoKinetics of crystallization andcrystal growth of nanocrystalline anatase in nanometer-sizedamorphous titaniardquo Chemistry of Materials vol 14 no 10 pp4145ndash4154 2002
[2] R J Tayade P K Surolia R G Kulkarni and R V JasraldquoPhotocatalytic degradation of dyes and organic contaminantsin water using nanocrystalline anatase and rutile TiO
2rdquo Science
and Technology of AdvancedMaterials vol 8 no 6 pp 455ndash4622007
[3] B A Al-Asbahi M H H Jumali C C Yap and M MSalleh ldquoInfluence of TiO
2nanoparticles on enhancement of
optoelectronic properties of PFO-based light emitting dioderdquoJournal of Nanomaterials vol 2013 Article ID 561534 7 pages2013
[4] L-X Pang H Wang D Zhou and X Yao ldquoLow-temperaturesintering and microwave dielectric properties of TiO
2-based
LTCCmaterialsrdquo Journal of Materials Science vol 21 no 12 pp1285ndash1292 2010
[5] M Crippa A Bianchi D Cristofori et al ldquoHigh dielectric con-stant rutile-polystyrene composite with enhanced percolativethresholdrdquo Journal ofMaterials Chemistry C vol 1 pp 484ndash4922013
[6] XHuang Z Pu L Tong ZWang andX Liu ldquoPreparation anddielectric properties of surface modified TiO
2PEN composite
films with high thermal stability and flexibilityrdquo Journal ofMaterials Science vol 23 pp 2089ndash2097 2012
[7] R P Ortiz A Facchetti and T J Marks ldquoHigh-k organicinorganic and hybrid dielectrics for low-voltage organic field-effect transistorsrdquoChemical Reviews vol 110 no 1 pp 205ndash2392010
[8] J Shi and X Wang ldquoGrowth of rutile titanium dioxidenanowires by pulsed chemical vapor depositionrdquo CrystalGrowth and Design vol 11 no 4 pp 949ndash954 2011
[9] C J Tavares S M Marques L Rebouta et al ldquoPVD-Grownphotocatalytic TiO
2thin films on PVDF substrates for sensors
and actuators applicationsrdquoThin Solid Films vol 517 no 3 pp1161ndash1166 2008
[10] X Chen and S S Mao ldquoTitanium dioxide nanomaterialssynthesis properties modifications and applicationsrdquoChemicalReviews vol 107 no 7 pp 2891ndash2959 2007
[11] H Yin Y Wada T Kitamura et al ldquoHydrothermal synthesisof nanosized anatase and ruffle TiO
2using amorphous phase
TiO2rdquo Journal of Materials Chemistry vol 11 no 6 pp 1694ndash
1703 2001[12] A di Paola M Bellardita R Ceccato L Palmisano and F
Parrino ldquoHighly active photocatalytic TiO2powders obtained
by thermohydrolysis of TiCl4in waterrdquo Journal of Physical
Chemistry C vol 113 no 34 pp 15166ndash15174 2009[13] S Cassaignon M Koelsch and J-P Jolivet ldquoSelective synthesis
of brookite anatase and rutile nanoparticles thermolysis ofTiCl4in aqueous nitric acidrdquo Journal of Materials Science vol
42 no 16 pp 6689ndash6695 2007[14] M A Behnajady H Eskandarloo N Modirshahla and M
Shokri ldquoSol-gel low-temperature synthesis of stable anatase-type TiO
2nanoparticles under different conditions and its
photocatalytic activityrdquo Photochemistry and Photobiology vol87 no 5 pp 1002ndash1008 2011
[15] T Ohya A Nakayama T Ban Y Ohya and Y TakahashildquoSynthesis and characterization of halogen-free transparent
aqueous colloidal titanate solutions from titanium alkoxiderdquoChemistry of Materials vol 14 no 7 pp 3082ndash3089 2002
[16] W Li and T Zeng ldquoPreparation of TiO2anatase nanocrystals
by TiCl4hydrolysis with additive H
2SO4rdquo PLoS ONE vol 6 no
6 Article ID e21082 2011[17] J Zhang M Li Z Feng J Chen and C Li ldquoUV raman
spectroscopic study on TiO2mdashI Phase transformation at thesurface and in the bulkrdquo Journal of Physical Chemistry B vol110 no 2 pp 927ndash935 2006
[18] S Marinel D H Choi R Heuguet D Agrawal and M Lana-gan ldquoBroadband dielectric characterization of TiO
2ceram-
ics sintered through microwave and conventional processesrdquoCeramics International vol 39 pp 299ndash306 2013
[19] Y Zhang C X Harris P Wallenmeyer J Murowchick andX Chen ldquoAsymmetric lattice vibrational Characteristics ofRutile TiO
2as revealed by laser power dependent raman
spectroscopyrdquo Journal of Physical Chemistry C vol 117 pp24015ndash24022 2013
[20] I E Campbell and E M Sherwood Eds High-TemperatureMaterials and Technology Wiley New York NY USA 1967
[21] J Zhang Q Xu M Li Z Feng and C Li ldquoUV Ramanspectroscopic study on TiO
2mdashII Effect of nanoparticle size
on the outerinner phase transformationsrdquo Journal of PhysicalChemistry C vol 113 no 5 pp 1698ndash1704 2009
[22] D H Wang W C Goh M Ning and C K Ong ldquoEffectof Ba doping on magnetic ferroelectric and magnetoelectricproperties inmutiferroic BiFeO
3at room temperaturerdquoApplied
Physics Letters vol 88 no 21 Article ID 212907 2006[23] J J Mohamed S D Hutagalung M F Ain and Z A Ahmad
ldquoEffect of excess TiO2in CaCu
3Ti4O12
on the microstruc-ture and dielectric propertiesrdquo Journal of Ceramic ProcessingResearch vol 12 no 5 pp 496ndash499 2011
[24] M C Romeu R G M Oliveira and A J M Sales ldquoImpedancespectroscopy study of TiO
2addition on the ceramic matrix
Na2Nb4O11rdquo Journal of Materials Science-Materials in Electron-
ics vol 24 pp 4993ndash4999 2013[25] L A Harris ldquoTitanium dioxide hydrogen detectorrdquo Journal of
the Electrochemical Society vol 127 no 12 pp 2657ndash2662 1980[26] F A Grant ldquoProperties of rutile (titanium dioxide)rdquo Reviews of
Modern Physics vol 31 no 3 pp 646ndash674 1959[27] K Haga T Ishii J-I Mashiyama and T Ikeda ldquoDielectric
properties of two-phase mixture ceramics composed of rutileand its compoundsrdquo Japanese Journal of Applied Physics vol 31no 9 pp 3156ndash3159 1992
Submit your manuscripts athttpwwwhindawicom
ScientificaHindawi Publishing Corporationhttpwwwhindawicom Volume 2014
CorrosionInternational Journal of
Hindawi Publishing Corporationhttpwwwhindawicom Volume 2014
Polymer ScienceInternational Journal of
Hindawi Publishing Corporationhttpwwwhindawicom Volume 2014
Hindawi Publishing Corporationhttpwwwhindawicom Volume 2014
CeramicsJournal of
Hindawi Publishing Corporationhttpwwwhindawicom Volume 2014
CompositesJournal of
NanoparticlesJournal of
Hindawi Publishing Corporationhttpwwwhindawicom Volume 2014
Hindawi Publishing Corporationhttpwwwhindawicom Volume 2014
International Journal of
Biomaterials
Hindawi Publishing Corporationhttpwwwhindawicom Volume 2014
NanoscienceJournal of
TextilesHindawi Publishing Corporation httpwwwhindawicom Volume 2014
Journal of
NanotechnologyHindawi Publishing Corporationhttpwwwhindawicom Volume 2014
Journal of
CrystallographyJournal of
Hindawi Publishing Corporationhttpwwwhindawicom Volume 2014
The Scientific World JournalHindawi Publishing Corporation httpwwwhindawicom Volume 2014
Hindawi Publishing Corporationhttpwwwhindawicom Volume 2014
CoatingsJournal of
Advances in
Materials Science and EngineeringHindawi Publishing Corporationhttpwwwhindawicom Volume 2014
Smart Materials Research
Hindawi Publishing Corporationhttpwwwhindawicom Volume 2014
Hindawi Publishing Corporationhttpwwwhindawicom Volume 2014
MetallurgyJournal of
Hindawi Publishing Corporationhttpwwwhindawicom Volume 2014
BioMed Research International
MaterialsJournal of
Hindawi Publishing Corporationhttpwwwhindawicom Volume 2014
Nano
materials
Hindawi Publishing Corporationhttpwwwhindawicom Volume 2014
Journal ofNanomaterials
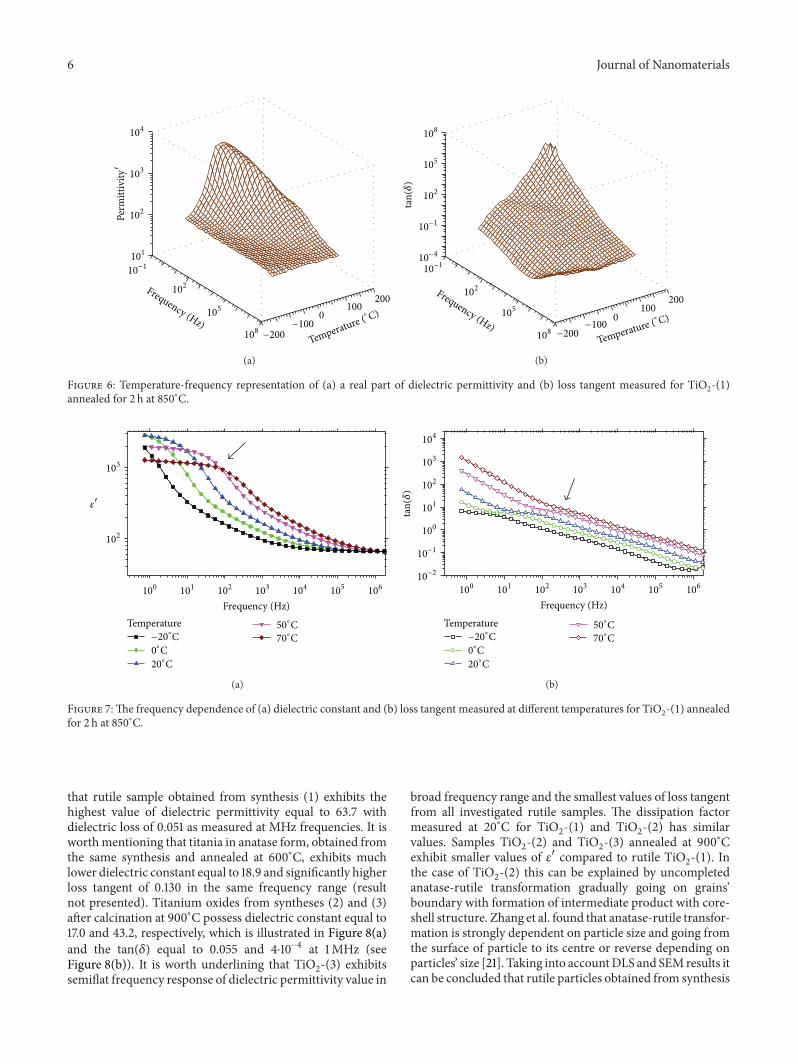
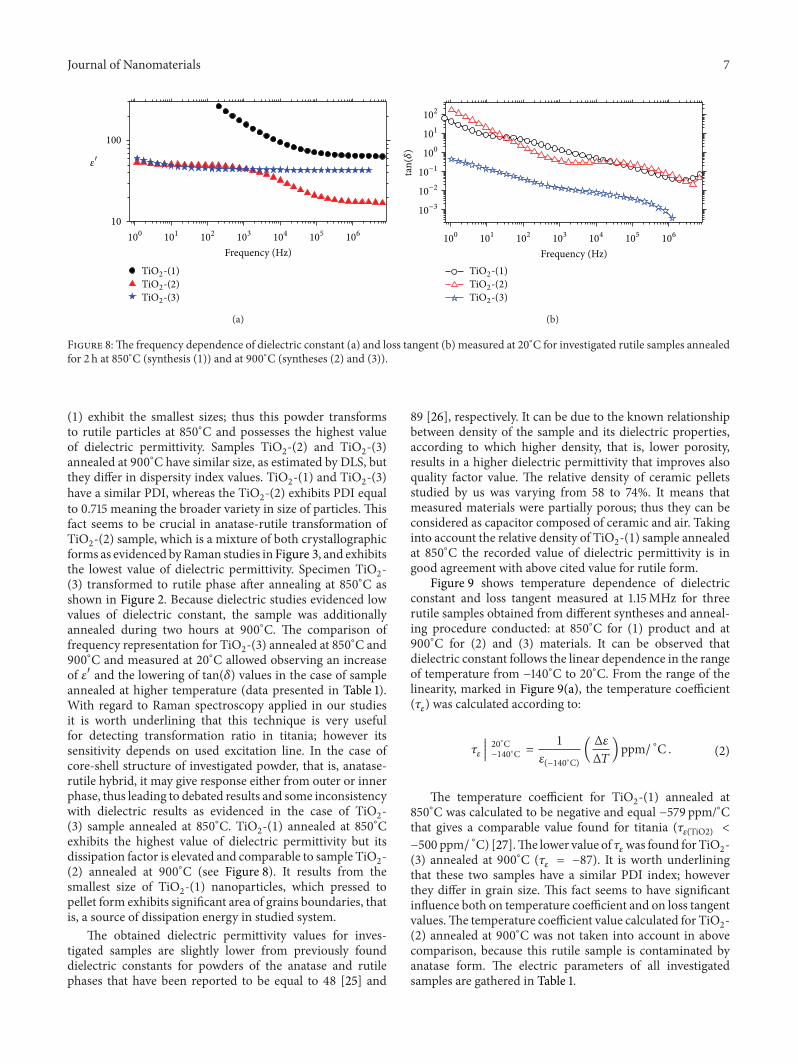
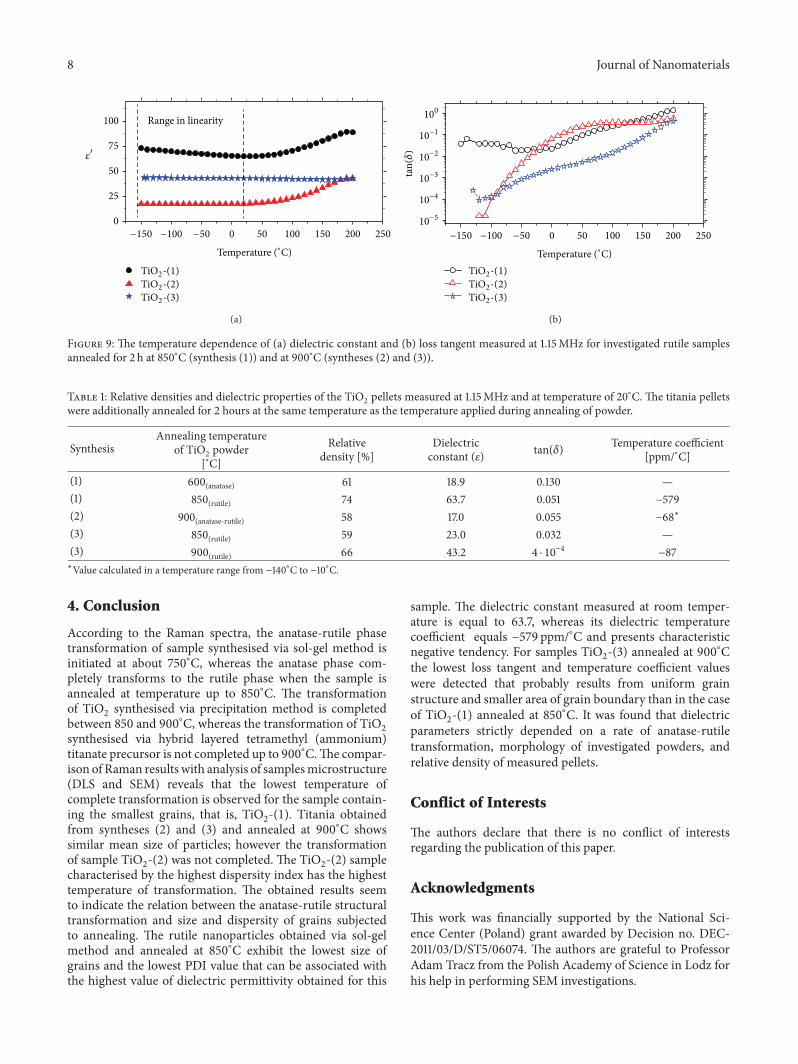