Ferroelectric and Dielectric Properties of Poly(vinylidene ...
62
Ferroelectric and Dielectric Properties of Poly(vinylidene fluoride) Nanocomposite Films Filled with Iron Oxide Nanoparticles Karlsruhe Optics and Photonics (KSOP), KIT Chengcheng Yan Matriculation No. 1510589 KSOP Advisor: Prof. Dr. rer. nat. Uli Lemmer Lichttechnisches Institut, KIT Co-Advisor: Dr. Kamal Asadi, Hamed Sharifi Dehsari Max Planck Institute for Polymer Research, Mainz Submitted date: 22. January 2018
Transcript of Ferroelectric and Dielectric Properties of Poly(vinylidene ...
Ferroelectric and Dielectric Properties of
Poly(vinylidene fluoride) Nanocomposite Films
Filled with Iron Oxide Nanoparticles
Karlsruhe Optics and Photonics (KSOP), KIT
Chengcheng Yan
Matriculation No. 1510589
KSOP Advisor: Prof. Dr. rer. nat. Uli Lemmer
Lichttechnisches Institut, KIT
Co-Advisor: Dr. Kamal Asadi, Hamed Sharifi Dehsari
Max Planck Institute for Polymer Research, Mainz
Submitted date: 22. January 2018

i
Erklärung
Hiermit versichere ich, die vorliegende Arbeit selbständig angefertigt, alle dem
Wortlaut order Sinn nach entnommenen Inhalte andere Werke an den
entsprechenden Stellen unter Angabe der Quellen kenntlich gemacht und keine
weiteren Hilfsmittel verwendet zu haben.
Chengcheng Yan
Karlsruhe, den 22. Januar 2017

ii
iii
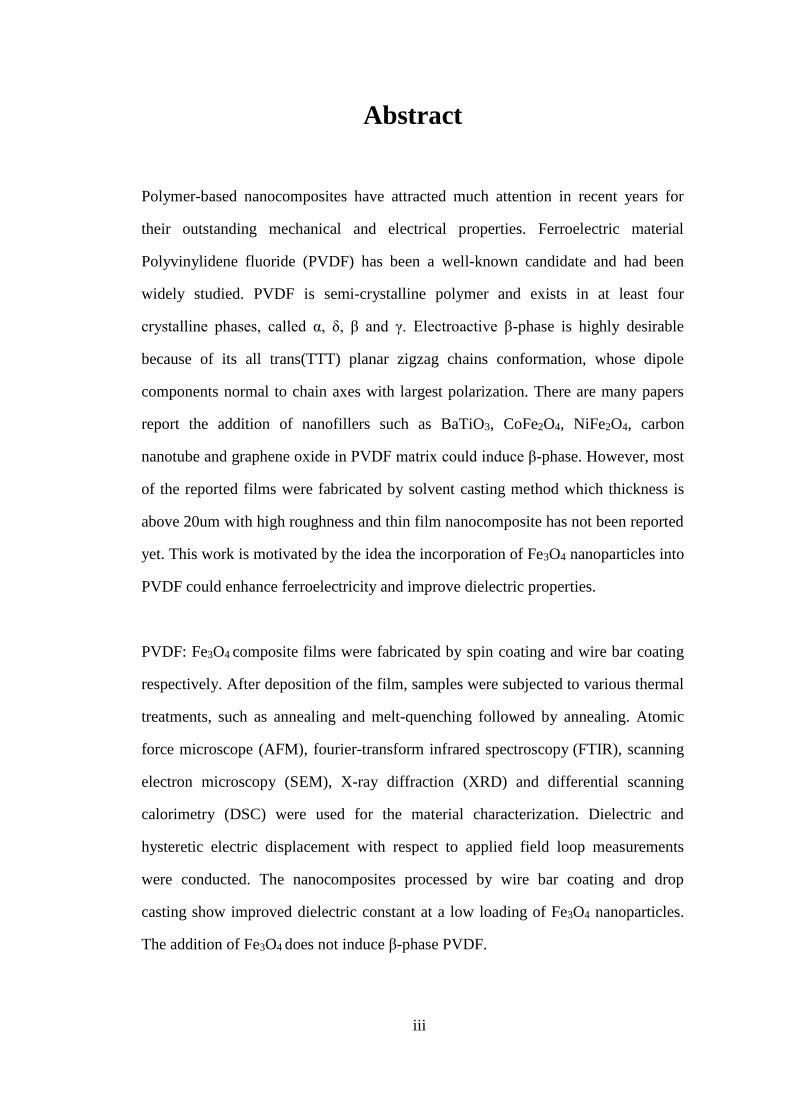
Abstract
Polymer-based nanocomposites have attracted much attention in recent years for
their outstanding mechanical and electrical properties. Ferroelectric material
Polyvinylidene fluoride (PVDF) has been a well-known candidate and had been
widely studied. PVDF is semi-crystalline polymer and exists in at least four
crystalline phases, called α, δ, β and γ. Electroactive β-phase is highly desirable
because of its all trans(TTT) planar zigzag chains conformation, whose dipole
components normal to chain axes with largest polarization. There are many papers
report the addition of nanofillers such as BaTiO3, CoFe2O4, NiFe2O4, carbon
nanotube and graphene oxide in PVDF matrix could induce β-phase. However, most
of the reported films were fabricated by solvent casting method which thickness is
above 20um with high roughness and thin film nanocomposite has not been reported
yet. This work is motivated by the idea the incorporation of Fe3O4 nanoparticles into
PVDF could enhance ferroelectricity and improve dielectric properties.
PVDF: Fe3O4 composite films were fabricated by spin coating and wire bar coating
respectively. After deposition of the film, samples were subjected to various thermal
treatments, such as annealing and melt-quenching followed by annealing. Atomic
force microscope (AFM), fourier-transform infrared spectroscopy (FTIR), scanning
electron microscopy (SEM), X-ray diffraction (XRD) and differential scanning
calorimetry (DSC) were used for the material characterization. Dielectric and
hysteretic electric displacement with respect to applied field loop measurements
were conducted. The nanocomposites processed by wire bar coating and drop
casting show improved dielectric constant at a low loading of Fe3O4 nanoparticles.
The addition of Fe3O4 does not induce β-phase PVDF.

iv
v
CONTENTS
List of Figures .................................................................................................................. vii
List of Tables ...................................................................................................................... x
1 Introduction .................................................................................................................... 1
1.1 Multiferroic Magnetoelectric Materials ............................................................ 1
1.2 Ferroelectric Materials....................................................................................... 2
1.3 Polymer Nanocomposite Dielectrics ................................................................. 6
1.4 Thesis Outline .................................................................................................... 7
2 Experimental ................................................................................................................... 8
2.1 Materials ............................................................................................................ 8
2.2 PVDF: Fe3O4 Nanocomposite Preparation ........................................................ 8
2.3 Film Deposition ................................................................................................. 9
2.4 Material Characterization ................................................................................ 10
2.4.1 Atomic Force Microscopy (AFM).................................................... 10
2.4.2 Fourier Transform Infrared Spectroscopy (FTIR) ............................ 11
2.5 Electrical Characterization .............................................................................. 11
2.5.1 Sawyer-Tower Circuit ...................................................................... 11
2.5.2 Dielectric Spectroscopy .................................................................... 12
3 PVDF Thin Film Processing ........................................................................................ 14
3.1 Spin coated PVDF Thin Films ........................................................................ 14
3.2 Wire-bar coated PVDF Thin Films ................................................................. 17
3.3 Summary.......................................................................................................... 19
4 PVDF: Fe3O4 Nanocomposite Thin Films .................................................................. 20
4.1 Experimental process....................................................................................... 20
4.1.1 Synthesis of Fe3O4 Nanoparticles ..................................................... 20
4.1.2 PVDF: Fe3O4 Nanocomposite .......................................................... 20
4.1.3 Capacitor Device Fabrication ........................................................... 21
4.2 Morphology of PVDF Nanocomposite Thin Films ......................................... 22
4.3 Ferroelectric Properties of PVDF: Fe3O4 Thin Films...................................... 24
4.3 Dielectric Properties of PVDF: Fe3O4 Thin Films .......................................... 25
4.4 Summary.......................................................................................................... 26
5 PVDF: Fe3O4 Nanocomposite Thick Films ................................................................ 27
5.1 Wire-bar Coated PVDF Nanocomposite Thick Films..................................... 27
vi
5.1.1 Morphology Characterization ........................................................... 28
5.1.2 Fourier Transformed Infrared Spectroscopy .................................... 29
5.1.3 Differential Scanning Calorimetry ................................................... 30
5.1.4 Thermogravimetric Analysis ............................................................ 32
5.1.5 Ferroelectric Properties .................................................................... 33
5.1.6 Dielectric Properties ......................................................................... 35
5.2 Drop cast PVDF: Fe3O4 Nanocomposite Thick Films .................................... 37
5.2.1 Morphology Characterization ........................................................... 37
5.2.2 Fourier Transformed Infrared Spectroscopy .................................... 38
5.2.3 X-ray Diffraction .............................................................................. 40
5.2.4 Dielectric Properties ......................................................................... 40
5.3 Summary.......................................................................................................... 42
6 Conclusions and Outlook ............................................................................................. 43
6.1 Conclusions ..................................................................................................... 43
6.2 Outlook ............................................................................................................ 44
Bibliography ..................................................................................................................... 45
vii
List of Figures
Figure 1. Schematic representation of magnetoelectric nanocomposite
and mutual control of polarization (P) and magnetization (M)
by electric (E) and magnetization (M) by electric (E) and
magnetic fields (H) .................................................................................... 2
Figure 2. (a) Hysteresis loops for a number of PbTiO3/SrTiO3 samples. (b)
The corresponding current–voltage loops. ................................................ 3
Figure 3. (a) Hysteresis loops during poling. (b) Hysteresis loops for the
same thin-film capacitor after poling. (c) Molecular structure
of α phase and (d) β phase of PVDF. ........................................................ 5
Figure 4. Schematic to illustrate the spin coating process........................................... 9
Figure 5. K102 K Control Coater from RK PrintCoat .............................................. 10
Figure 6. Schematic of a Sawyer Tower circuit for P-E loop
measurements. ......................................................................................... 12
Figure 7. AFM images of PVDF thin films spin coated at: (a) 25 °C, (b)
40 °C, (c) 60 °C, (d) 80 °C, (e) 100 °C; and (f) thickness and
roughness as a function of temperature. The solution
concentration is 50 mg/ml in DMF. ........................................................ 15
Figure 8. The film thickness and roughness as a function of solution
concentration. (a) 2000 rpm, 2000 rpm s-1. (b) 3000 rpm, 3000
rpm s-1 and (c) 4000 rpm, 4000 rpm s-1. The spinning duration
for each sample is 60s.............................................................................. 16
Figure 9. AFM images of PVDF thin films wire-bar coated at: (a) 25 °C,
(b) 40 °C, (c) 60 °C, (d) 100°C, (e) 120°C; and (f) thickness
and roughness as a function of temperature. The solution
concentration is 75 mg/ml in DMF. ........................................................ 17
Figure 10. The film thickness and roughness as a function of solution
concentration. (a) US 5 and (b) US 4. ..................................................... 18
Figure 11. (a) TEM image of nanoparticles. (b) XRD patterns of the
standard reference nanoparticles (black line) and the
corresponding modeling result (solid red line). ....................................... 21
viii
Figure 12. Architecture of capacitor device on a glass substrate. ............................. 22
Figure 13. AFM images of nanocomposite films. (a) The height image of
PVDF: Fe3O4 nanocomposite film with 1 wt % nanoparticle
content without further thermal treatment. (b) The height
image of PVDF: Fe3O4 nanocomposite film with 1 wt %
nanoparticle content after annealing. (c) and (d) The height
and phase images of PVDF: Fe3O4 nanocomposite film with 1
wt % nanoparticle content after melt-quenching and annealing.
(e) and (f) The height and phase images of PVDF: Fe3O4
nanocomposite film with 1 wt % nanoparticle content without
further thermal treatment respectively. .................................................... 23
Figure 14. Ferroelectric hysteresis loop. (a) Pure PVDF thin film during
poling and (b) after poling. (c) and (d) PVDF: Fe3O4
nanocomposite thin films with 1 wt % and 4 wt %
nanoparticle contents respectively. .......................................................... 24
Figure 15. Average dielectric constant of PVDF: Fe3O4 nanocomposite
films as a function of composition at 103 Hz. .......................................... 26
Figure 16. AFM height images. (a) Pure PVDF film. (b), (c) and (d)
PVDF nanocomposite films with 1 wt %, 3 wt % and 5 wt %
nanoparticle contents respectively. .......................................................... 28
Figure 17. SEM images of 5 wt % PVDF nanocomposite film. (a) Top
surface view and (b) cross- sectional view. ............................................. 29
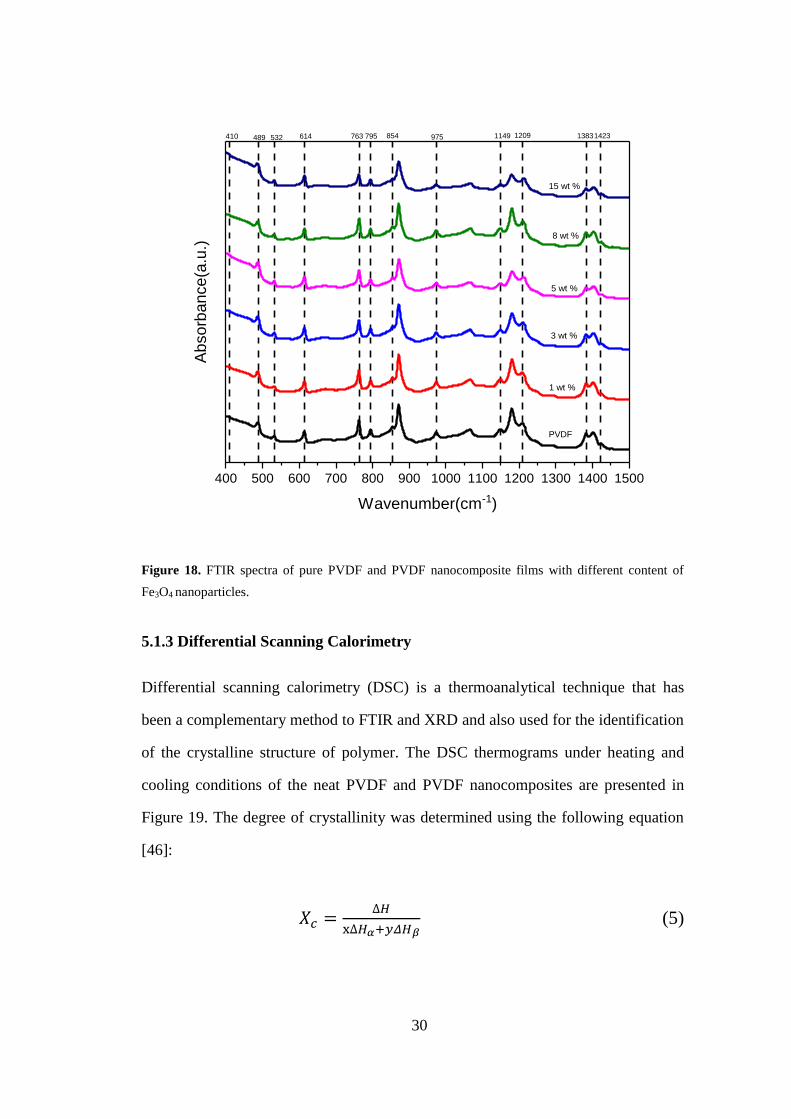
Figure 18. FTIR spectra of pure PVDF and PVDF nanocomposite films
with different content of Fe3O4 nanoparticles.......................................... 30
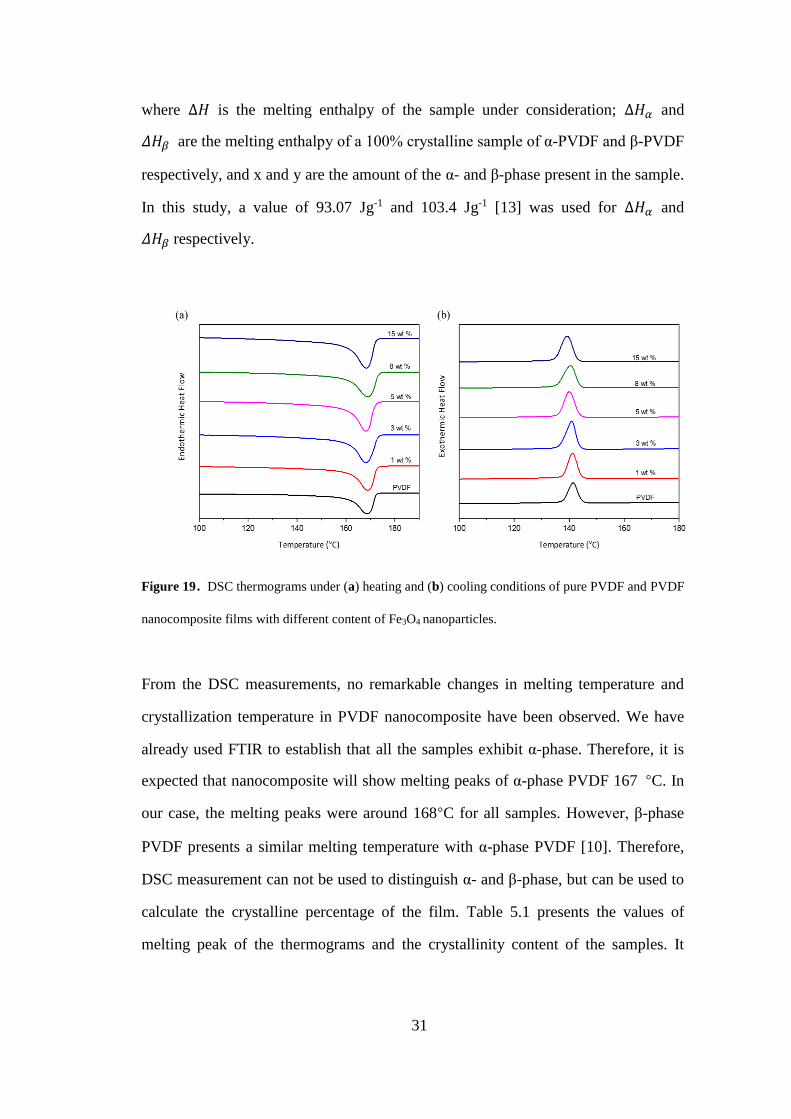
Figure 19. DSC thermograms under (a) heating and (b) cooling
conditions of pure PVDF and PVDF nanocomposite films
with different content of Fe3O4 nanoparticles.......................................... 31
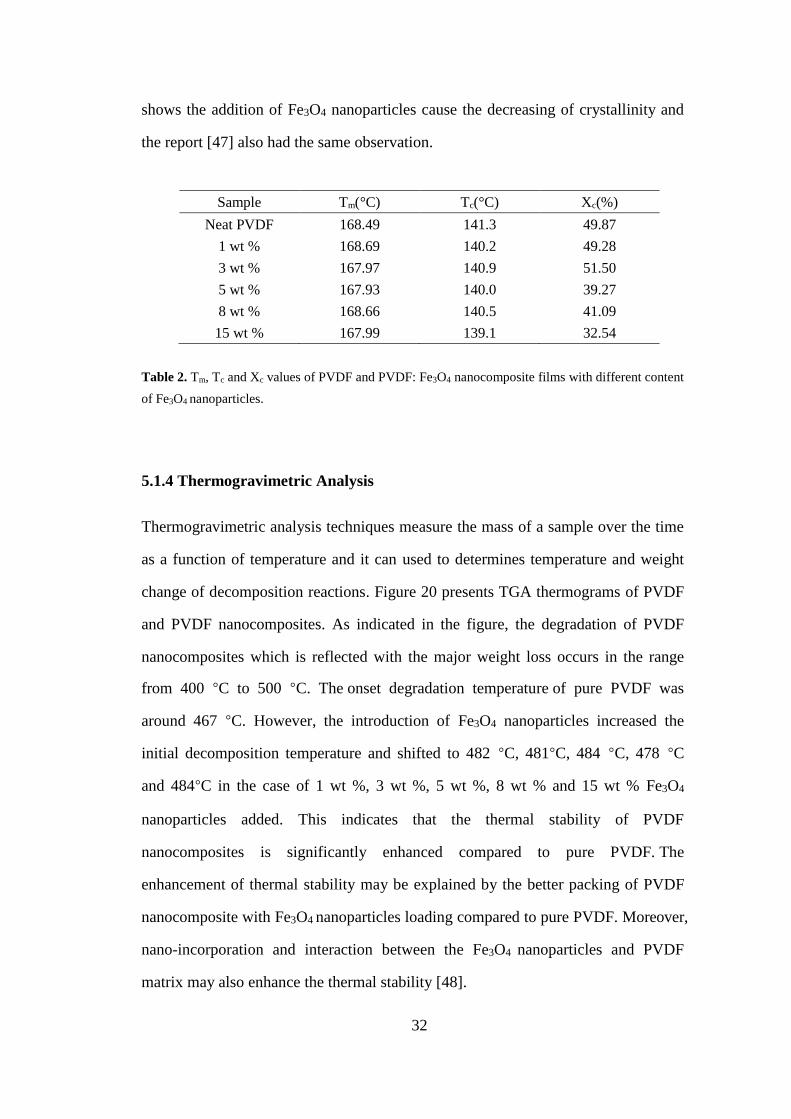
Figure 20. TGA thermograms of PVDF and PVDF nanocomposites with
different content of Fe3O4 nanoparticles. ................................................. 33
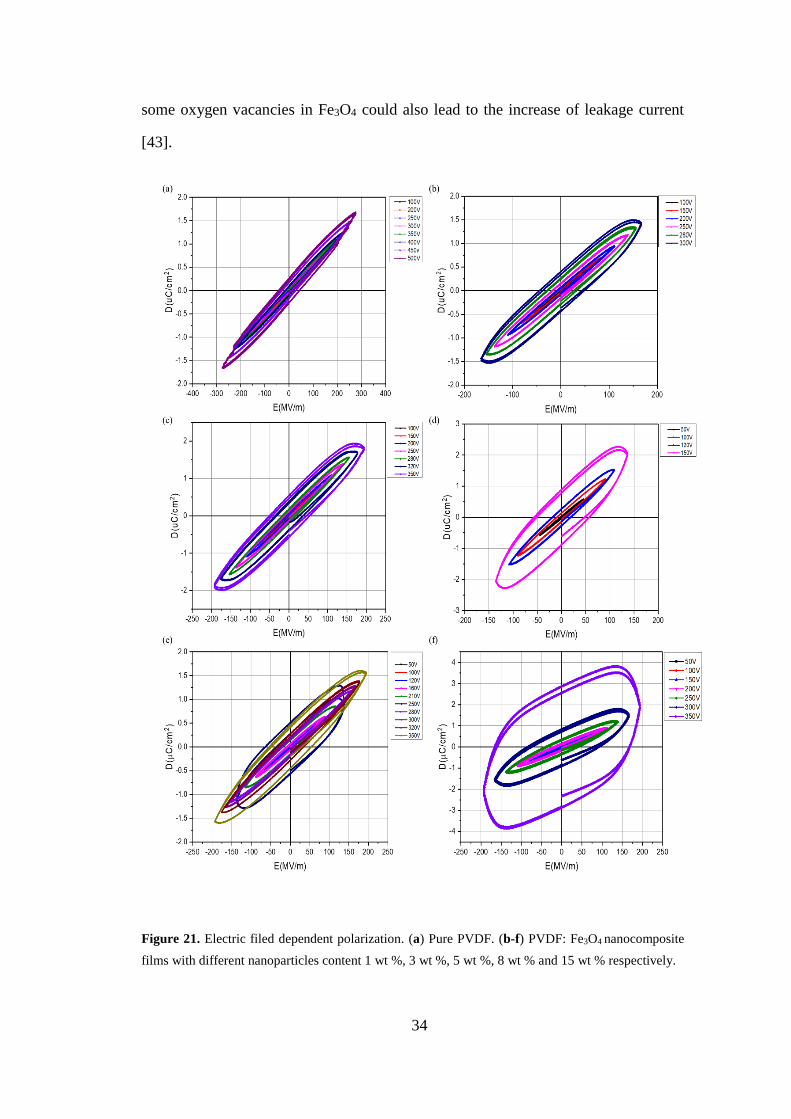
Figure 21. Electric filed dependent polarization. (a) Pure PVDF. (b-f)
PVDF: Fe3O4 nanocomposite films with different
nanoparticles content 1 wt %, 3 wt %, 5 wt %, 8 wt % and 15
wt % respectively. ................................................................................... 34
ix
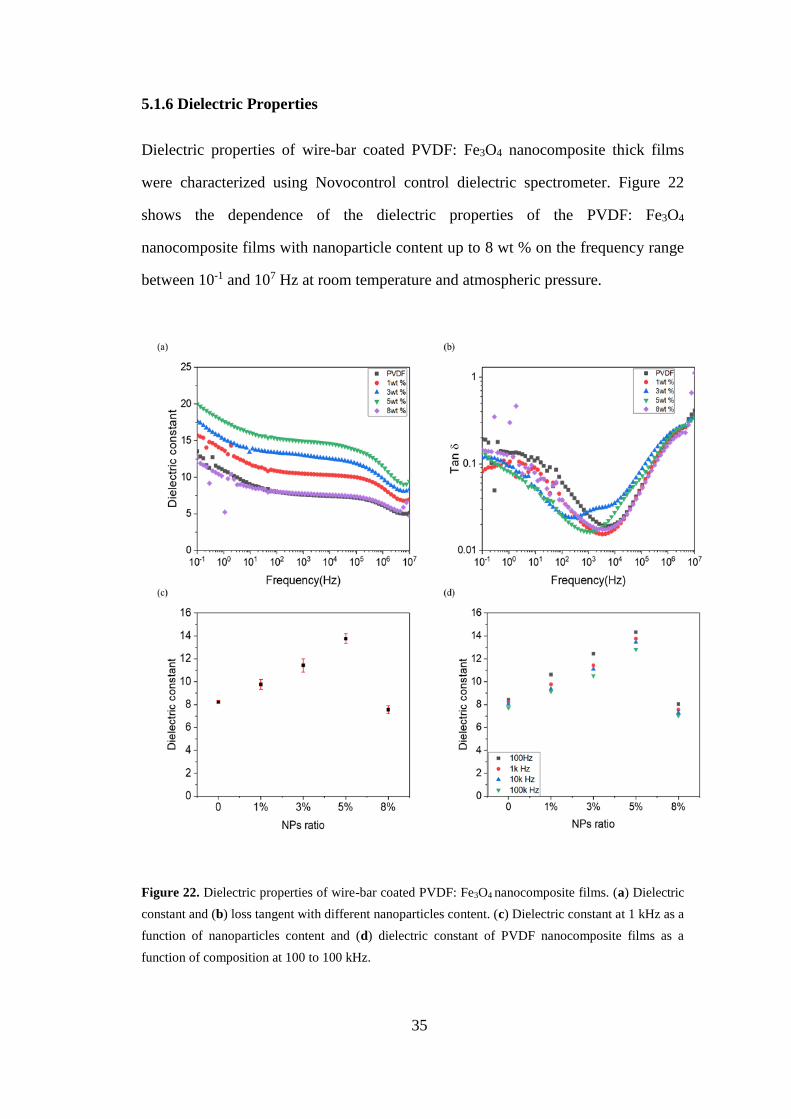
Figure 22. Dielectric properties of wire-bar coated PVDF: Fe3O4
nanocomposite films. (a) Dielectric constant and (b) loss
tangent with different nanoparticles content. (c) Dielectric
constant at 1 kHz as a function of nanoparticles content and (d)
dielectric constant of PVDF nanocomposite films as a
function of composition at 100 to 100 kHz. ............................................ 35
Figure 23. SEM images of 5 wt % PVDF nanocomposite film. (a) Top
view and (b) cross section ....................................................................... 38
Figure 24. FTIR spectra of pure PVDF and PVDF: Fe3O4 nanocomposite
films processed by drop casting. ............................................................. 39
Figure 25. X-ray diffraction patterns of pure PVDF and PVDF
nanocomposite films containing various amounts of Fe3O4
nanoparticles. ........................................................................................... 40
Figure 26. (a) Frequency dependence of dielectric constant and (b)
dielectric loss tangent of the PVDF: Fe3O4 nanocomposite
films processed by drop casting. ............................................................. 42
x
List of Tables
Table 1. Dielectric constant of polymer nanocomposites as reported in
the literature. .............................................................................................. 7
Table 2. Tm, Tc and Xc values of PVDF and PVDF: Fe3O4 nanocomposite
films with different content of Fe3O4 nanoparticles. ............................... 32
1
Chapter 1
1 Introduction
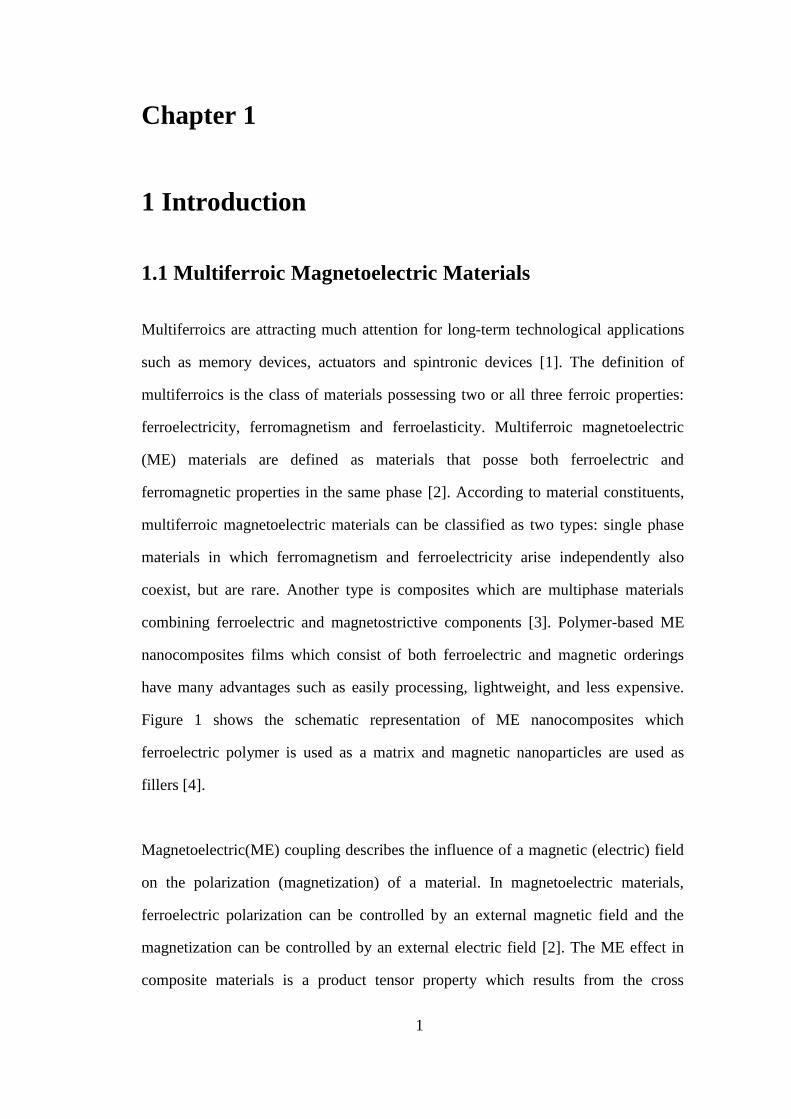
1.1 Multiferroic Magnetoelectric Materials
Multiferroics are attracting much attention for long-term technological applications
such as memory devices, actuators and spintronic devices [1]. The definition of
multiferroics is the class of materials possessing two or all three ferroic properties:
ferroelectricity, ferromagnetism and ferroelasticity. Multiferroic magnetoelectric
(ME) materials are defined as materials that posse both ferroelectric and
ferromagnetic properties in the same phase [2]. According to material constituents,
multiferroic magnetoelectric materials can be classified as two types: single phase
materials in which ferromagnetism and ferroelectricity arise independently also
coexist, but are rare. Another type is composites which are multiphase materials
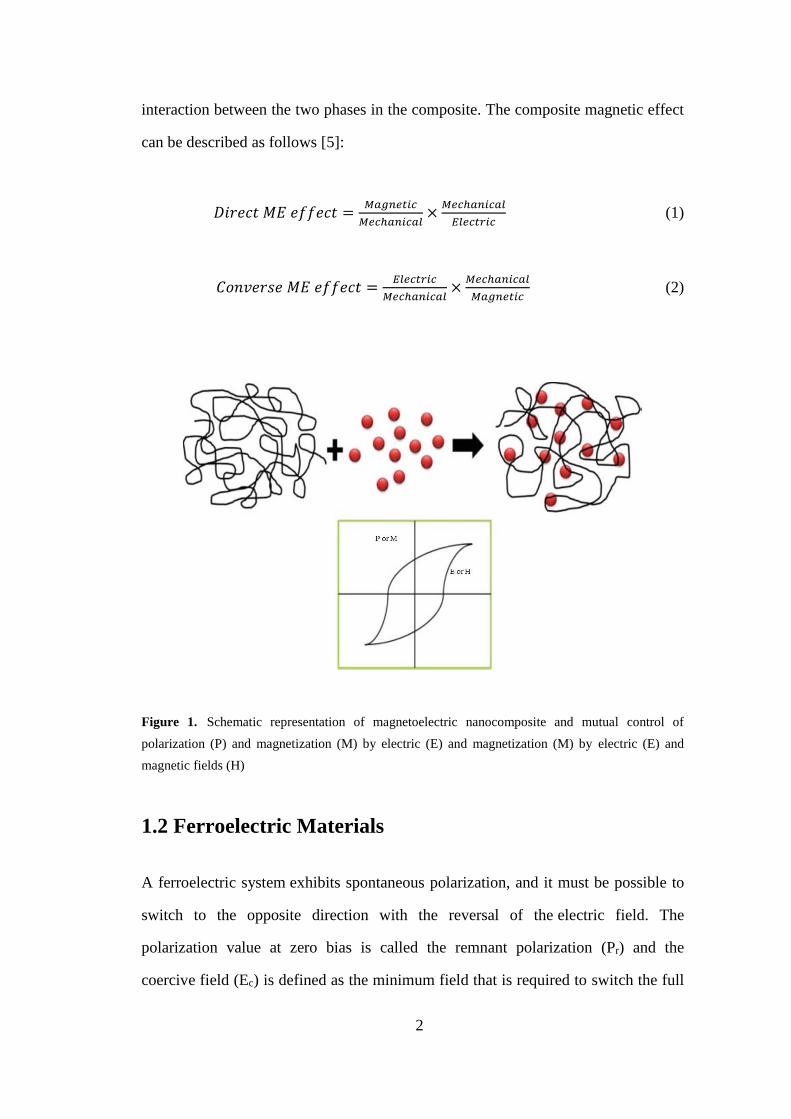
combining ferroelectric and magnetostrictive components [3]. Polymer-based ME
nanocomposites films which consist of both ferroelectric and magnetic orderings
have many advantages such as easily processing, lightweight, and less expensive.
Figure 1 shows the schematic representation of ME nanocomposites which
ferroelectric polymer is used as a matrix and magnetic nanoparticles are used as
fillers [4].
Magnetoelectric(ME) coupling describes the influence of a magnetic (electric) field
on the polarization (magnetization) of a material. In magnetoelectric materials,
ferroelectric polarization can be controlled by an external magnetic field and the
magnetization can be controlled by an external electric field [2]. The ME effect in
composite materials is a product tensor property which results from the cross
2
interaction between the two phases in the composite. The composite magnetic effect
can be described as follows [5]:
𝐷𝑖𝑟𝑒𝑐𝑡 𝑀𝐸 𝑒𝑓𝑓𝑒𝑐𝑡 =𝑀𝑎𝑔𝑛𝑒𝑡𝑖𝑐
𝑀𝑒𝑐ℎ𝑎𝑛𝑖𝑐𝑎𝑙×
𝑀𝑒𝑐ℎ𝑎𝑛𝑖𝑐𝑎𝑙
𝐸𝑙𝑒𝑐𝑡𝑟𝑖𝑐 (1)
𝐶𝑜𝑛𝑣𝑒𝑟𝑠𝑒 𝑀𝐸 𝑒𝑓𝑓𝑒𝑐𝑡 =𝐸𝑙𝑒𝑐𝑡𝑟𝑖𝑐
𝑀𝑒𝑐ℎ𝑎𝑛𝑖𝑐𝑎𝑙×
𝑀𝑒𝑐ℎ𝑎𝑛𝑖𝑐𝑎𝑙
𝑀𝑎𝑔𝑛𝑒𝑡𝑖𝑐 (2)
Figure 1. Schematic representation of magnetoelectric nanocomposite and mutual control of
polarization (P) and magnetization (M) by electric (E) and magnetization (M) by electric (E) and
magnetic fields (H)
1.2 Ferroelectric Materials
A ferroelectric system exhibits spontaneous polarization, and it must be possible to
switch to the opposite direction with the reversal of the electric field. The
polarization value at zero bias is called the remnant polarization (Pr) and the
coercive field (Ec) is defined as the minimum field that is required to switch the full
3
remnant polarization. The hysteresis loop (electric displacement with respect to
applied field) is one of the most common and straightforward tools to characterize
ferroelectrics. In general, a ferroelectric film can only be measured when it is
fabricated as a device (typically a capacitor). For an ideal linear dielectric, there is a
straight line in the D-E loop. For an ideal resistor, an ellipse or a football shape will
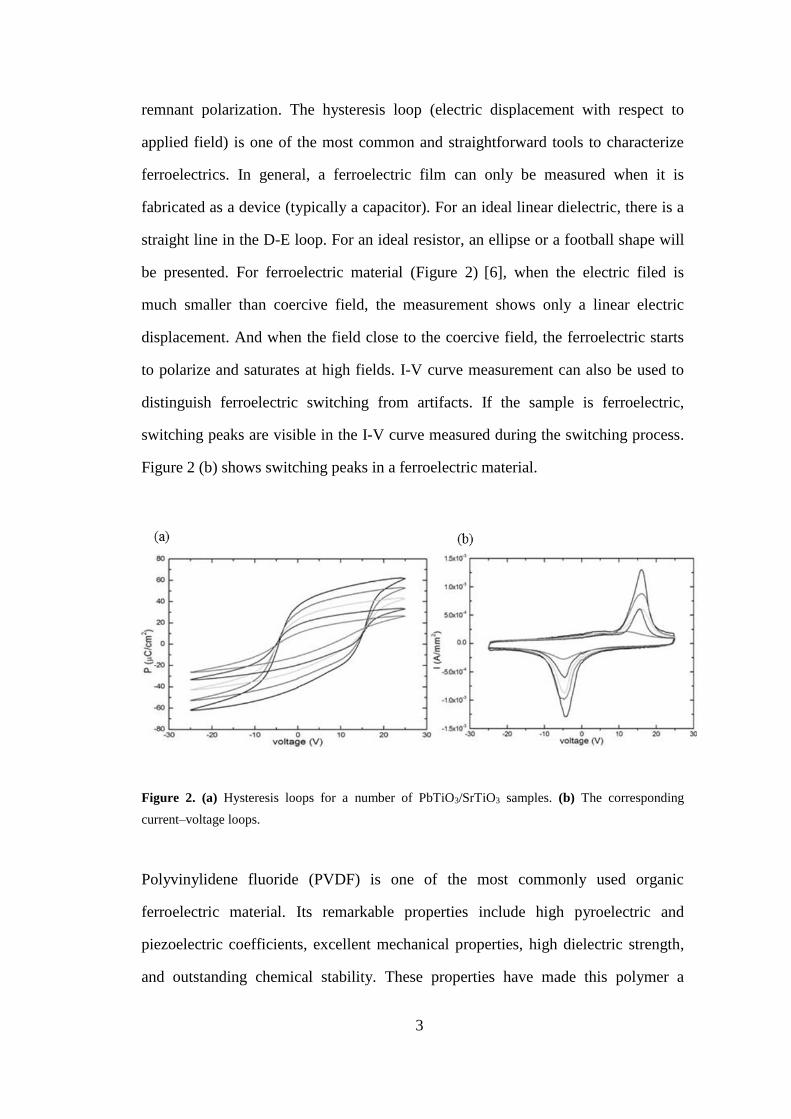
be presented. For ferroelectric material (Figure 2) [6], when the electric filed is
much smaller than coercive field, the measurement shows only a linear electric
displacement. And when the field close to the coercive field, the ferroelectric starts
to polarize and saturates at high fields. I-V curve measurement can also be used to
distinguish ferroelectric switching from artifacts. If the sample is ferroelectric,
switching peaks are visible in the I-V curve measured during the switching process.
Figure 2 (b) shows switching peaks in a ferroelectric material.
Figure 2. (a) Hysteresis loops for a number of PbTiO3/SrTiO3 samples. (b) The corresponding
current–voltage loops.
Polyvinylidene fluoride (PVDF) is one of the most commonly used organic
ferroelectric material. Its remarkable properties include high pyroelectric and
piezoelectric coefficients, excellent mechanical properties, high dielectric strength,
and outstanding chemical stability. These properties have made this polymer a
4
suitable candidate for many technological applications, such as sensors, actuators
and non-volatile memory device [7,8]. PVDF is a semi-crystalline polymer with a
chemical formula of (CH2–CF2)n that can crystallize into at least four phases, called
α, β, γ, and δ [9]. The nonpolar α phase is most commonly obtained due to its high
thermodynamic stability and can usually be produced by crystallization from the
melt or from dimethylformamide or dimethylacetamide solutions at temperatures
above 120 °C [10]. For α phase PVDF, dipole components normal to the chain axes
are antiparallel and the net dipole moment vanishes [4]. Although the dipole
moments of α phase are internally vanished, a polar analog, that is δ phase can be
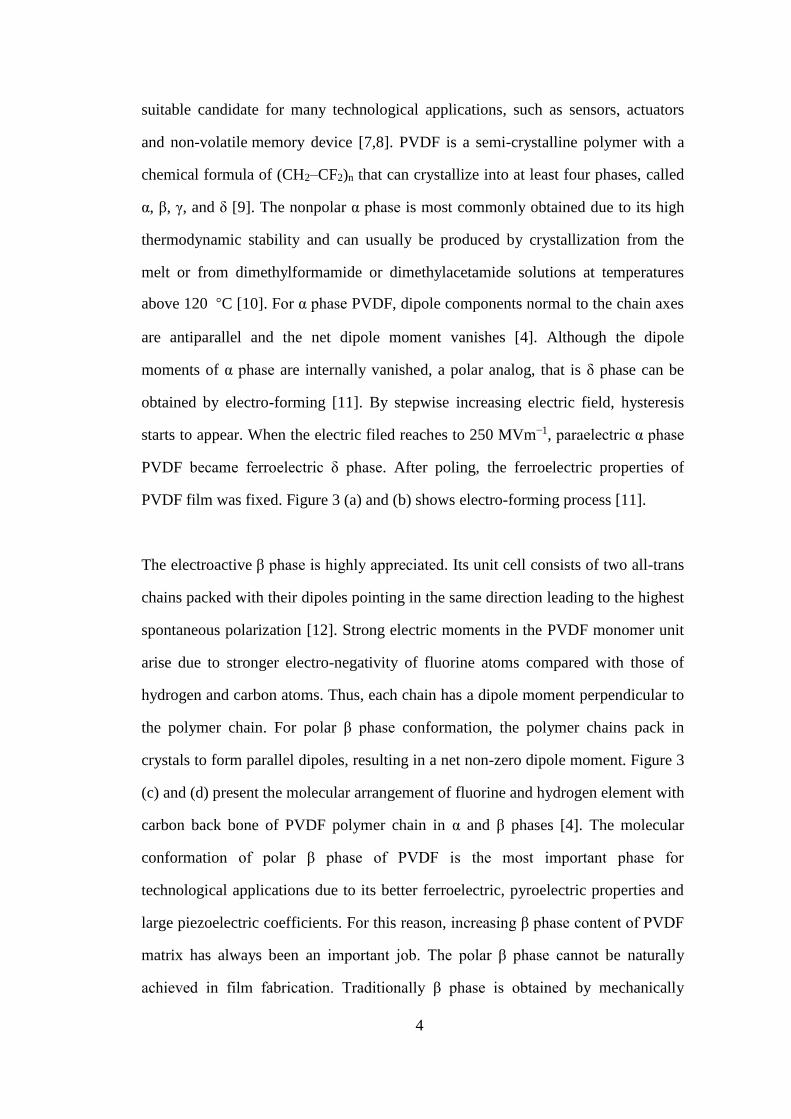
obtained by electro-forming [11]. By stepwise increasing electric field, hysteresis
starts to appear. When the electric filed reaches to 250 MVm−1, paraelectric α phase
PVDF became ferroelectric δ phase. After poling, the ferroelectric properties of
PVDF film was fixed. Figure 3 (a) and (b) shows electro-forming process [11].
The electroactive β phase is highly appreciated. Its unit cell consists of two all-trans
chains packed with their dipoles pointing in the same direction leading to the highest
spontaneous polarization [12]. Strong electric moments in the PVDF monomer unit
arise due to stronger electro-negativity of fluorine atoms compared with those of
hydrogen and carbon atoms. Thus, each chain has a dipole moment perpendicular to
the polymer chain. For polar β phase conformation, the polymer chains pack in
crystals to form parallel dipoles, resulting in a net non-zero dipole moment. Figure 3
(c) and (d) present the molecular arrangement of fluorine and hydrogen element with
carbon back bone of PVDF polymer chain in α and β phases [4]. The molecular
conformation of polar β phase of PVDF is the most important phase for
technological applications due to its better ferroelectric, pyroelectric properties and
large piezoelectric coefficients. For this reason, increasing β phase content of PVDF
matrix has always been an important job. The polar β phase cannot be naturally
achieved in film fabrication. Traditionally β phase is obtained by mechanically
5
stretching non-polar α phase films [13]. However, this method has obvious
limitations for electronic applications that usually require the preparation of thin
films directly on substrates. An alternative method for the formation of the β phase
PVDF is by solvent casting from an appropriate solvent (e.g. from
Dimethylformamide) below 70 °C. However, the ferroelectric polymers prepared at
low evaporation temperature results in high porosity films and poor electrical and
mechanical properties [14].
Figure 3. (a) Hysteresis loops during poling. (b) Hysteresis loops for the same thin-film capacitor
after poling. (c) Molecular structure of α phase and (d) β phase of PVDF.
There are some papers report the inclusion of nanofillers such as BaTiO3 [15],
graphene oxide [16], clay [17] and ferrite nanoparticles [18] in polymer, the
electroactive β phase content has been enhanced. However, most of the reported
films were fabricated by solvent casting method which thickness is above 20um with
high roughness and ferroelectric hysteresis loop has not been exhibited. The possible
reason is the PVDF nanocomposite films obtained in this way shows high porosity
6
leading to poor electrical properties and it is very difficult to give enough voltage to
such thick film. PVDF nanocomposite thin films with good electrical properties
have not been reported yet. Taking this as an initial point, we add Fe3O4
nanoparticles into PVDF polymer to fabricate thin film, investigating the influence
of nanoparticles in PVDF polymer matrix.
1.3 Polymer Nanocomposite Dielectrics
PVDF possesses outstanding dielectric properties, such as high permittivity, high
breakdown strength and relatively low dielectric loss that makes it a suitable
candidate for applications in high energy density storage [19]. However, the intrinsic
low dielectric constant values (<10) of polymer materials restricts their
developments into industry. The introduction of inorganic nanoparticles into an
insulating polymer is an important approach to enhance the overall dielectric
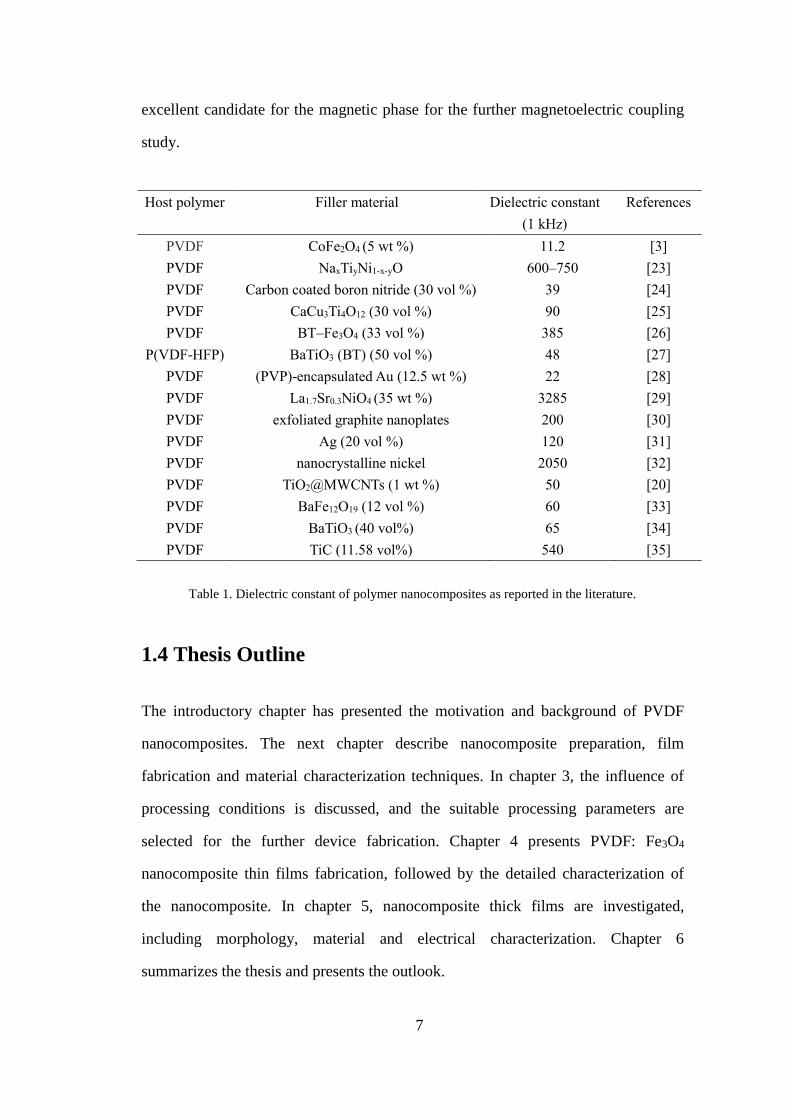
constant. Table 1.1 summarize the dielectric properties of polymer composites as
reported in the literature. Ceramic materials of large permittivity such as BaTiO3 is
most commonly used. However, high volume fraction (>50 vol%) of ceramics was
needed to achieve the high dielectric constant and the resulting material suffers from
low flexibility, low electrical breakdown strength and poor mechanical performance
[20]. By adding conductive nanofiller such as graphene nanoribbon (GNR), the
dielectric constant can be greatly enhanced. However, conductive filler
nanocomposites always exhibit very high dielectric loss due to the
insulator−conductor transition occurring at the percolation threshold [21].
Nano-sized ferrites have gained much attention due to their interesting surface
reactivity, electrical and magnetic properties [22]. In this work, Fe3O4 was chosen as
the nanofiller due to its large magnetostrictive coefficient value [4], which can act as
7
excellent candidate for the magnetic phase for the further magnetoelectric coupling
study.
Host polymer Filler material Dielectric constant
(1 kHz)
References
PVDF CoFe2O4 (5 wt %) 11.2 [3]
PVDF NaxTiyNi1-x-yO 600–750 [23]
PVDF Carbon coated boron nitride (30 vol %) 39 [24]
PVDF CaCu3Ti4O12 (30 vol %) 90 [25]
PVDF BT–Fe3O4 (33 vol %) 385 [26]
P(VDF-HFP) BaTiO3 (BT) (50 vol %) 48 [27]
PVDF
PVDF
PVDF
PVDF
PVDF
PVDF
PVDF
PVDF
PVDF
(PVP)-encapsulated Au (12.5 wt %)
La1.7Sr0.3NiO4 (35 wt %)
exfoliated graphite nanoplates
Ag (20 vol %)
nanocrystalline nickel
TiO2@MWCNTs (1 wt %)
BaFe12O19 (12 vol %)
BaTiO3 (40 vol%)
TiC (11.58 vol%)
22
3285
200
120
2050
50
60
65
540
[28]
[29]
[30]
[31]
[32]
[20]
[33]
[34]
[35]
Table 1. Dielectric constant of polymer nanocomposites as reported in the literature.
1.4 Thesis Outline
The introductory chapter has presented the motivation and background of PVDF
nanocomposites. The next chapter describe nanocomposite preparation, film
fabrication and material characterization techniques. In chapter 3, the influence of
processing conditions is discussed, and the suitable processing parameters are
selected for the further device fabrication. Chapter 4 presents PVDF: Fe3O4
nanocomposite thin films fabrication, followed by the detailed characterization of
the nanocomposite. In chapter 5, nanocomposite thick films are investigated,
including morphology, material and electrical characterization. Chapter 6
summarizes the thesis and presents the outlook.
8
Chapter 2
2 Experimental
2.1 Materials
Poly(vinylidene fluoride) (PVDF)(Mw 180 and 275 kg/mol) was supplied in pellet
form by Sigma-Aldrich and was used as received. N,N-dimethylformamide (DMF,
pure grade) was used as solvent. Fe3O4 magnetic nanoparticles with average
diameter 11 nm were used in this work and synthesized by Hamed Sharifi Dehsari.
The corresponding synthesis method of Fe3O4 nanoparticles can be found in report
[36, 37].
2.2 PVDF: Fe3O4 Nanocomposite Preparation
The synthesized Fe3O4 nanoparticles were initially dissolved and saved in toluene. In
order to separate Fe3O4 nanoparticles, antisolvent ethanol was used to mix with
toluene solution, typically in 1:3 ratio by volume. Then shaking the mixed solution
and put the solution next to the magnet, since Fe3O4 nanoparticles have magnetic
properties, Fe3O4 nanoparticles would attach to the vial’ wall and separate from
liquid. Finally, the colorless liquid was discarded by pipette and then Fe3O4
nanoparticles were dried in vacuum oven at 60 °C overnight.
We use solution-mixing method to prepare nanocomposite solution. PVDF pellets
were dissolved in N,N dimethylformamide(DMF) through magnetic stirring at a
temperature around 100 °C for 2 hours to ensure wholly dissolution. Separately, the
desired amount of dry Fe3O4 nanoparticle power was add to DMF solvent followed
by ultrasonic stirring for 4 hours to get a homogenous dispersion. PVDF: Fe3O4
9
composite solution was obtained by directly mixing the polymer solution with
nanoparticle suspension under continuous ultrasonication for 6 hours.
2.3 Film Deposition
Deposition of thin films from solutions can be achieved by several approaches,
including spin coating, wire bar coating and solution casting. In the polymer solution
casting method, nanocomposite solution is directly dropped onto the substrate, and
then the solvent evaporates spontaneously, allowing film formation. The produced
film may be stripped from the substrate and to get a free-standing film. However, the
coating across the surface is usually poor uniformity and it is hard to control film
thickness.
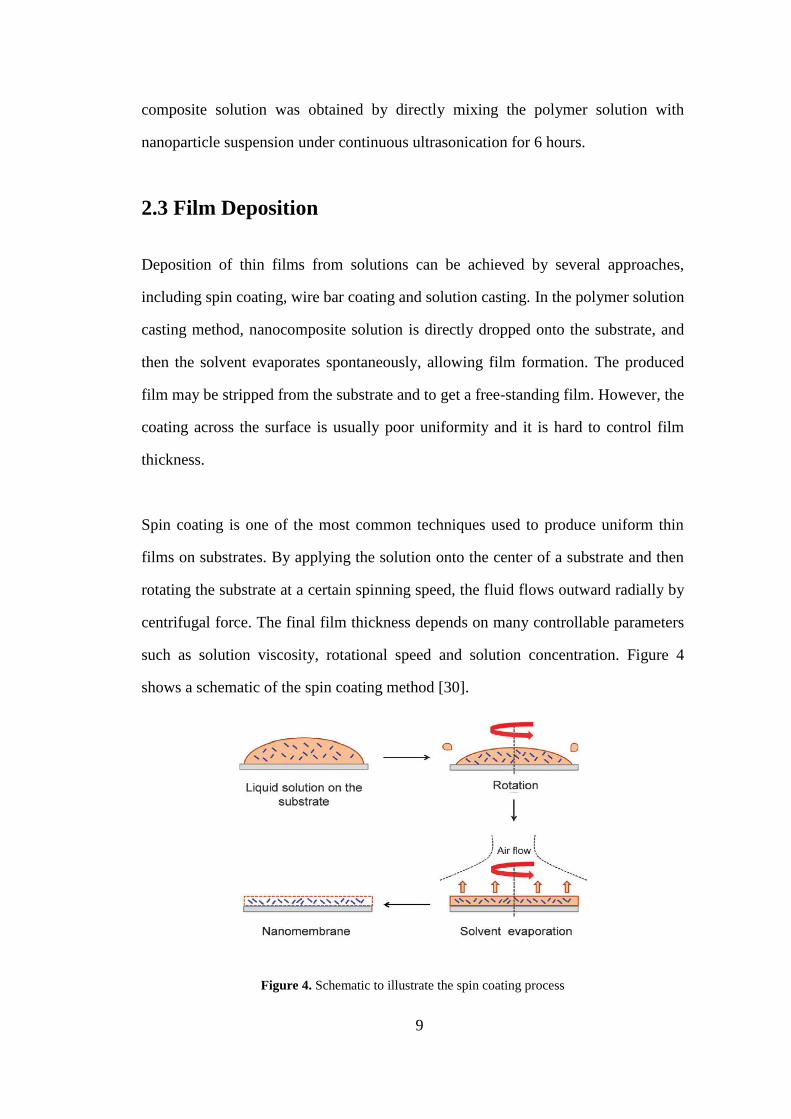
Spin coating is one of the most common techniques used to produce uniform thin
films on substrates. By applying the solution onto the center of a substrate and then
rotating the substrate at a certain spinning speed, the fluid flows outward radially by
centrifugal force. The final film thickness depends on many controllable parameters
such as solution viscosity, rotational speed and solution concentration. Figure 4
shows a schematic of the spin coating method [30].
Figure 4. Schematic to illustrate the spin coating process
10
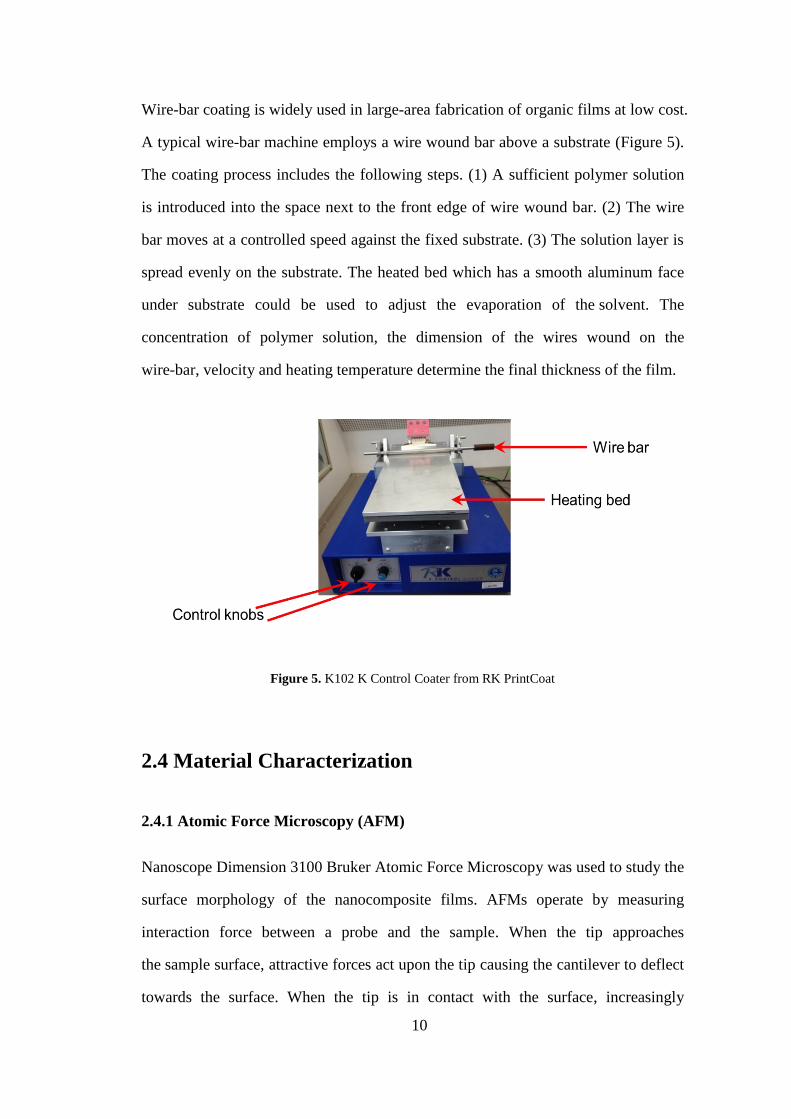
Wire-bar coating is widely used in large-area fabrication of organic films at low cost.
A typical wire-bar machine employs a wire wound bar above a substrate (Figure 5).
The coating process includes the following steps. (1) A sufficient polymer solution
is introduced into the space next to the front edge of wire wound bar. (2) The wire
bar moves at a controlled speed against the fixed substrate. (3) The solution layer is
spread evenly on the substrate. The heated bed which has a smooth aluminum face
under substrate could be used to adjust the evaporation of the solvent. The
concentration of polymer solution, the dimension of the wires wound on the
wire-bar, velocity and heating temperature determine the final thickness of the film.
Figure 5. K102 K Control Coater from RK PrintCoat
2.4 Material Characterization
2.4.1 Atomic Force Microscopy (AFM)
Nanoscope Dimension 3100 Bruker Atomic Force Microscopy was used to study the
surface morphology of the nanocomposite films. AFMs operate by measuring
interaction force between a probe and the sample. When the tip approaches
the sample surface, attractive forces act upon the tip causing the cantilever to deflect
towards the surface. When the tip is in contact with the surface, increasingly
11
repulsive force takes over according to Hooke’s law. The beam deflection method is
used to detect cantilever deflections towards or away from the surface. A position
sensitive detector can be used to track probe motion change and has to be calibrated
into electrical signal and the topographic map of the sample surface features can be
generated.
2.4.2 Fourier Transform Infrared Spectroscopy (FTIR)
The phase identification of nanocomposite film was analyzed by Fourier transform
infrared (FTIR) spectroscopy. FTIR spectra were recorded using a Bruker Tensor II
FTIR spectrometer at a spectral resolution of 4 cm-1. In FTIR analyses, Infrared light
from the light source passes the sample through the interferometer and reaches the
detector. Then the signal is converted to digital signal which is transferred to a
computer and Fourier transform is performed. Since chemical structures (molecules)
produce specific IR fingerprints, the FTIR spectra with pattern provide sample
structural information.
2.5 Electrical Characterization
2.5.1 Sawyer-Tower Circuit
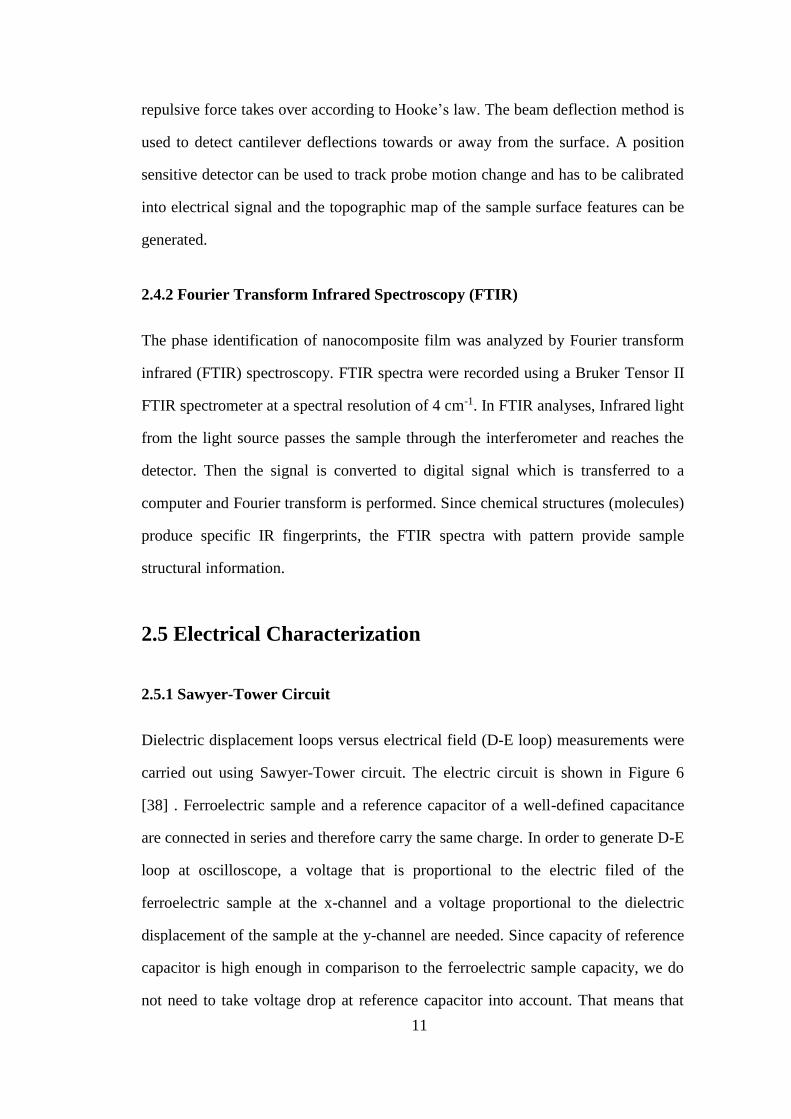
Dielectric displacement loops versus electrical field (D-E loop) measurements were
carried out using Sawyer-Tower circuit. The electric circuit is shown in Figure 6
[38] . Ferroelectric sample and a reference capacitor of a well-defined capacitance
are connected in series and therefore carry the same charge. In order to generate D-E
loop at oscilloscope, a voltage that is proportional to the electric filed of the
ferroelectric sample at the x-channel and a voltage proportional to the dielectric
displacement of the sample at the y-channel are needed. Since capacity of reference
capacitor is high enough in comparison to the ferroelectric sample capacity, we do
not need to take voltage drop at reference capacitor into account. That means that
12
the voltage at ferroelectric sample is almost equal to the supply voltage which can be
read from x-channel. At the same time, the oscilloscope is connected to measure the
voltage across the reference capacitor, the polarization of the ferroelectric sample is
proportional to the voltage of y-channel. and the P-E loop can be easily obtained.
The ferroelectric samples were measured with a continuous triangular wave signal at
a frequency of 100 Hz, using a reference capacitor of 220 nF.
Figure 6. Schematic of a Sawyer Tower circuit for P-E loop measurements.
2.5.2 Dielectric Spectroscopy
Dielectric properties were characterized using a Novocontrol spectrometer with a
frequency sweep from 0.1 Hz to 10 MHz. Dielectric spectroscopy measures the
dielectric permittivity as a function of frequency. The material permittivity is a
complex number, which consists of a real part ε’ and an imaginary part ε”. ε’ is a
measure of the energy stored whereas ε” is a measure of energy loss. Another useful
quantity is the loss factor
tan 𝛿 =𝜀”
𝜀’ (3)
The term tanδ is called loss tangent and loss angle δ is correlated with impedance
phase angle θ, for a lossless capacitor, voltage drop always lags current by 90°, so
13
the impedance phase angle is -90° and tanδ is 0. But because of material absorption,
the impedance phase angle of the real capacitor is
𝜃 = −(90 − 𝛿) (4)
14
Chapter 3
3 PVDF Thin Film Processing
Ferroelectric polymer thin films for micro-electronic applications require
high-quality films with transparent and smooth surfaces. However, PVDF thin films
prepared at room temperature and at relative humidities greater than 25% possessed
a cloudy appearance and a rough surface [39, 40] which were hard for electric
characterization. In this chapter the processing condition for polyvinylidene fluoride
(PVDF) thin film was investigated. Experimental results indicate that PVDF film
qualities are affected by deposition temperature. At high deposition temperature,
PVDF thin films presented low roughness.
3.1 Spin coated PVDF Thin Films
PVDF solutions were prepared by dissolving PVDF pellets (Mw = 180 000 g/mol,
Sigma-Aldrich) in N,N-dimethylformamide (DMF) with a magnetic stirrer at 100°C
for 2 hours to get transparent solutions. The PVDF concentration was 50 mg/ml.
Thin films were prepared by spin coating (spinning speed, acceleration and time of
3000 rpm, 3000rpm s-1 and 60s, respectively) onto thoroughly cleaned glass
substrates an elevated temperature in ambient air. These substrates were rinsed with
distilled water, acetone, isopropanol and dried with nitrogen. Prior to use, the
substrates were further applied a UV-ozone treatment for 10 minutes to remove
contamination and improve wetting ability. The substrates were heated by a heat gun
and the temperature was detected by an infrared thermometer (RS 1327K). The
morphology and roughness of films were characterized by atomic force microscopy
(AFM), DEKTAK surface profilometer was used to measure film thicknesses.
15
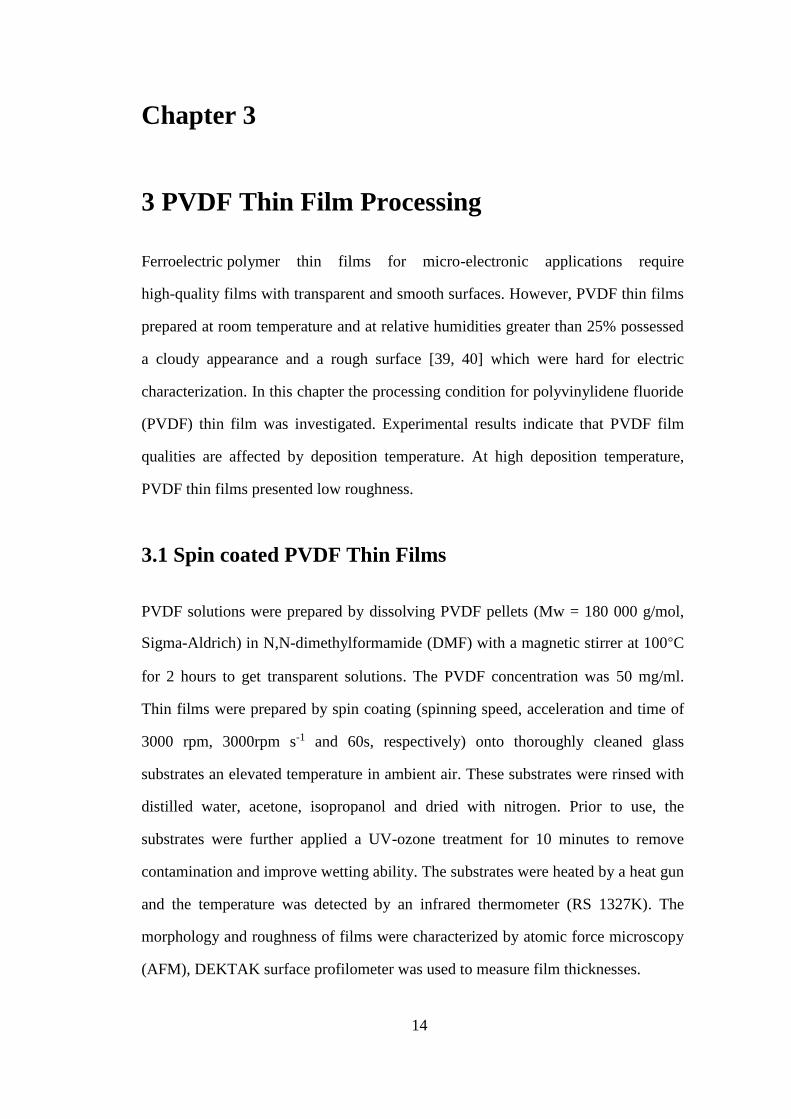
Figure 3.1 shows the AFM images of PVDF thin films (Figures 7 a-e) and the
thickness and roughness (Figure 7 f) as a function of deposition temperature. It was
found that average thickness of coated film increases with increasing deposition
temperature, which could be due to the increased solution viscosity at high
temperature. It should be noted that the roughness of coated film is around 10 nm
even the film thickness increases. The experimental results indicate that PVDF thin
films with smooth and flat surface can be obtained at high deposition temperature by
spin coating method.
Figure 7. AFM images of PVDF thin films spin coated at: (a) 25 °C, (b) 40 °C, (c) 60 °C, (d) 80 °C,
(e) 100 °C; and (f) thickness and roughness as a function of temperature. The solution concentration
is 50 mg/ml in DMF.
16
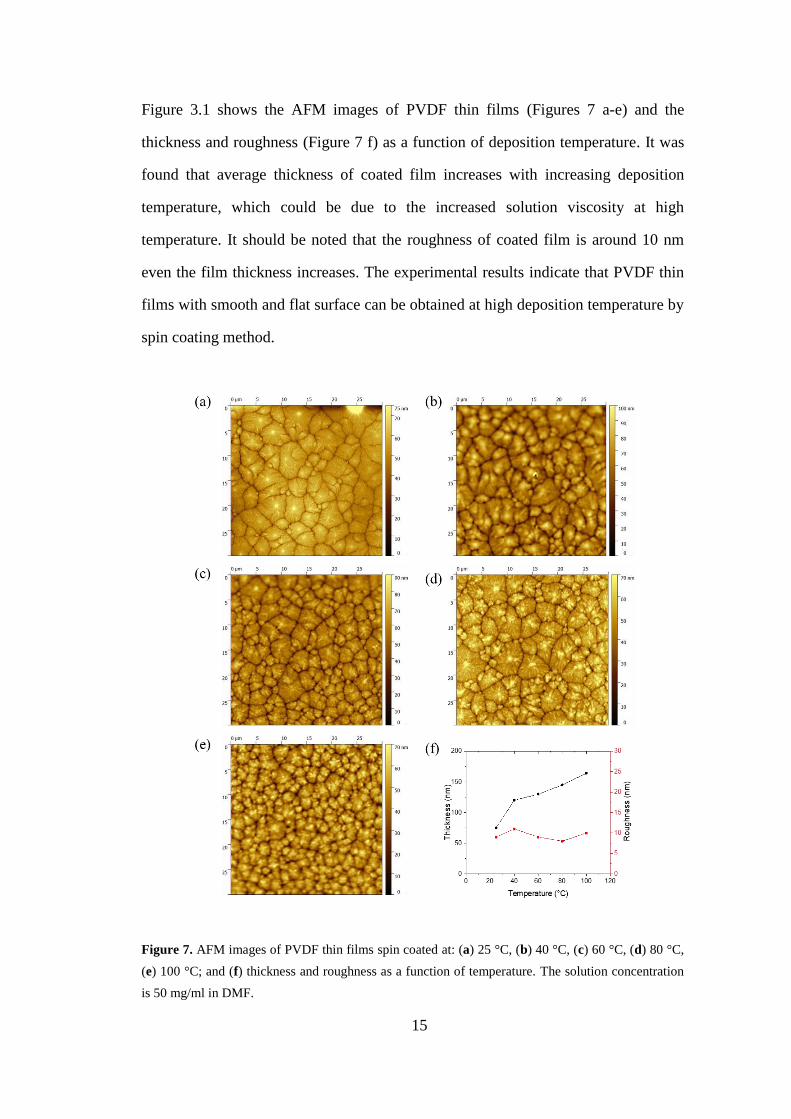
The influence of solution concentration and spinning speed on the thickness of
PVDF thin films deposited by spin coating at about 100 °C was studied. Figure 8
exhibits the effects of spinning speed and solution concentration on the PVDF film
thickness and roughness. The average thickness of coated film increases with
decreasing spinning speed and increasing solution concentration; however, the
roughness of PVDF films increase simultaneously, which means the film surface
profile becomes less smooth. To obtain thickness of film around 300nm with
corresponding roughness around 15nm, PVDF solution concentration at 75mg/ml
with spinning speed at 3000 rpm are suitable parameters for further device
fabrication.
Figure 8. The film thickness and roughness as a function of solution concentration. (a) 2000 rpm,
2000 rpm s-1. (b) 3000 rpm, 3000 rpm s-1 and (c) 4000 rpm, 4000 rpm s-1. The spinning duration for
each sample is 60s.
17
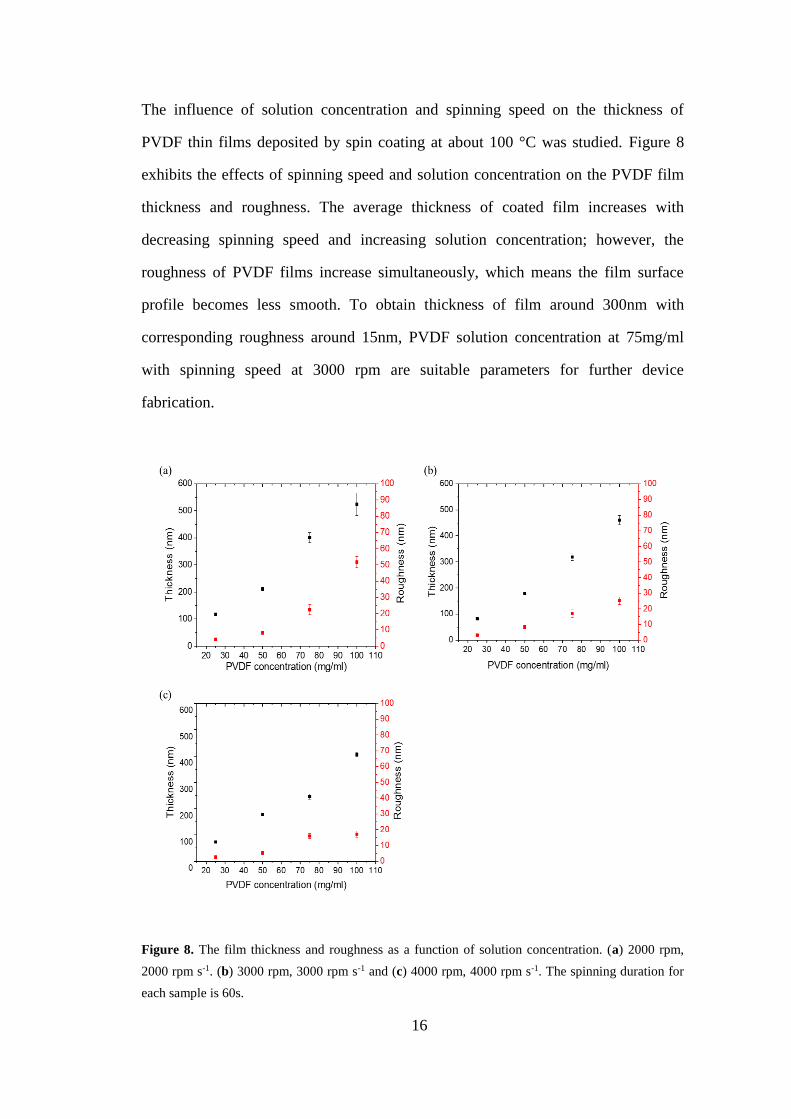
3.2 Wire-bar coated PVDF Thin Films
Wire-bar coating is a mature deposition technique [2], which could control
deposition temperature accurately. PVDF thin films were prepared by wire-bar
coating with solution concentration at 75 mg/ml and 5% relative humidity. The
substrates temperature was controlled by the heated bed below the substrates. The
surface morphologies of PVDF films with different deposition temperature are
shown in Figure 9.
Figure 9. AFM images of PVDF thin films wire-bar coated at: (a) 25 °C, (b) 40 °C, (c) 60 °C, (d)
100°C, (e) 120°C; and (f) thickness and roughness as a function of temperature. The solution
concentration is 75 mg/ml in DMF.
18
It was revealed that the difference in film quality at different deposition temperature.
At room temperature, the films with porous structure because of the slower
evaporation rate of DMF. The morphology changed substantially after increasing
deposition temperature. The high deposition temperature increases solvent
evaporation rate, leading films with a dense and smooth surface. It is also to notice
the thickness and roughness difference at different deposition temperature. The film
thickness and roughness systematically decrease with increasing deposition
temperature. We chose PVDF film preparation temperature at 100 °C for further
study.
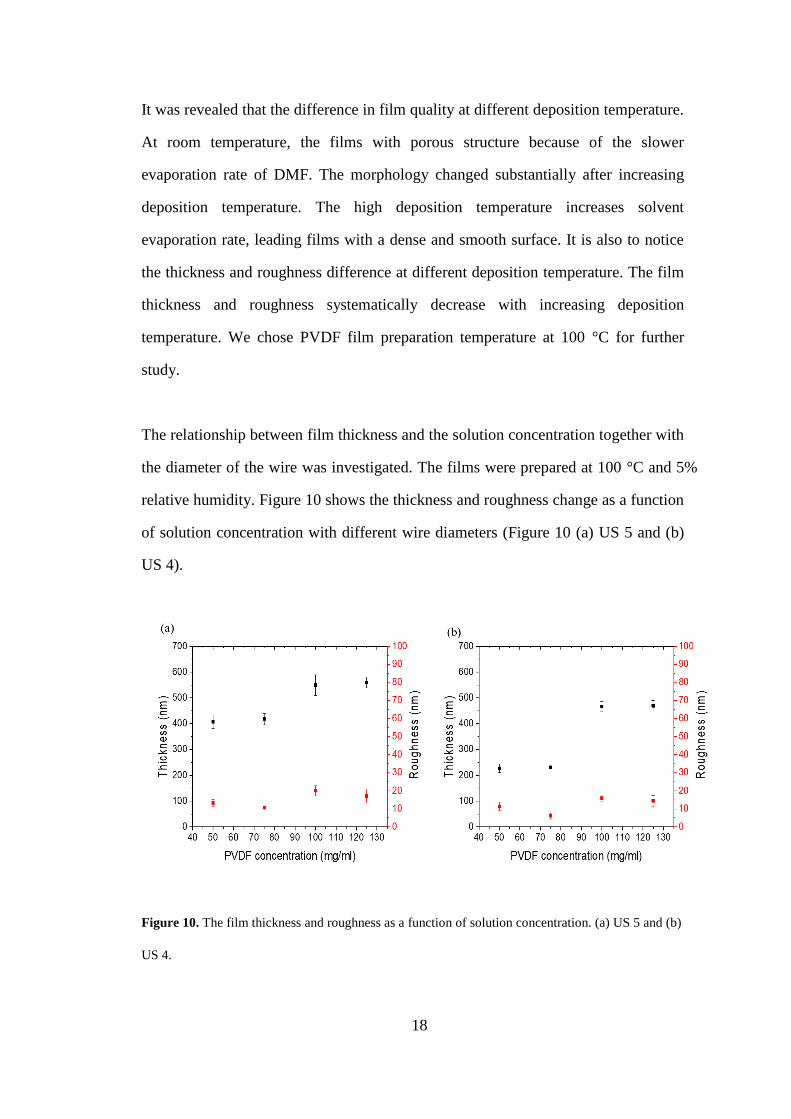
The relationship between film thickness and the solution concentration together with
the diameter of the wire was investigated. The films were prepared at 100 °C and 5%
relative humidity. Figure 10 shows the thickness and roughness change as a function
of solution concentration with different wire diameters (Figure 10 (a) US 5 and (b)
US 4).
Figure 10. The film thickness and roughness as a function of solution concentration. (a) US 5 and (b)
US 4.
19
3.3 Summary
The effect of deposition temperature and coating parameters (spin coating and
wire-bar coating) for PVDF thin films were investigated. It was revealed that the
quality of films prepared at an elevated temperature was significantly improved.
Porosity is greatly eliminated compared to those prepared at room temperature. For
thin film device fabrication, the desired thickness is around 300 nm. From our
experimental result, spin coating at 100 °C is suitable for device fabrication to
achieve transparent and smooth surface with low roughness.
20
Chapter 4
4 PVDF: Fe3O4 Nanocomposite Thin Films
In this chapter, we systematically investigated the morphology and physical
properties including ferroelectric properties and dielectric properties of PVDF
nanocomposite thin film containing Fe3O4 nanoparticles. The size and crystal
structure of the synthesized Fe3O4 nanoparticles were characterized using
transmission electron microscopy (TEM) and X-ray diffraction (XRD) respectively.
Scanning electron microscopy (SEM) and atomic force microscopy (AFM) were
performed to analyze the dispersion of synthesized Fe3O4 nanoparticles in polymer
matrix and microstructural feature.
4.1 Experimental process
4.1.1 Synthesis of Fe3O4 Nanoparticles
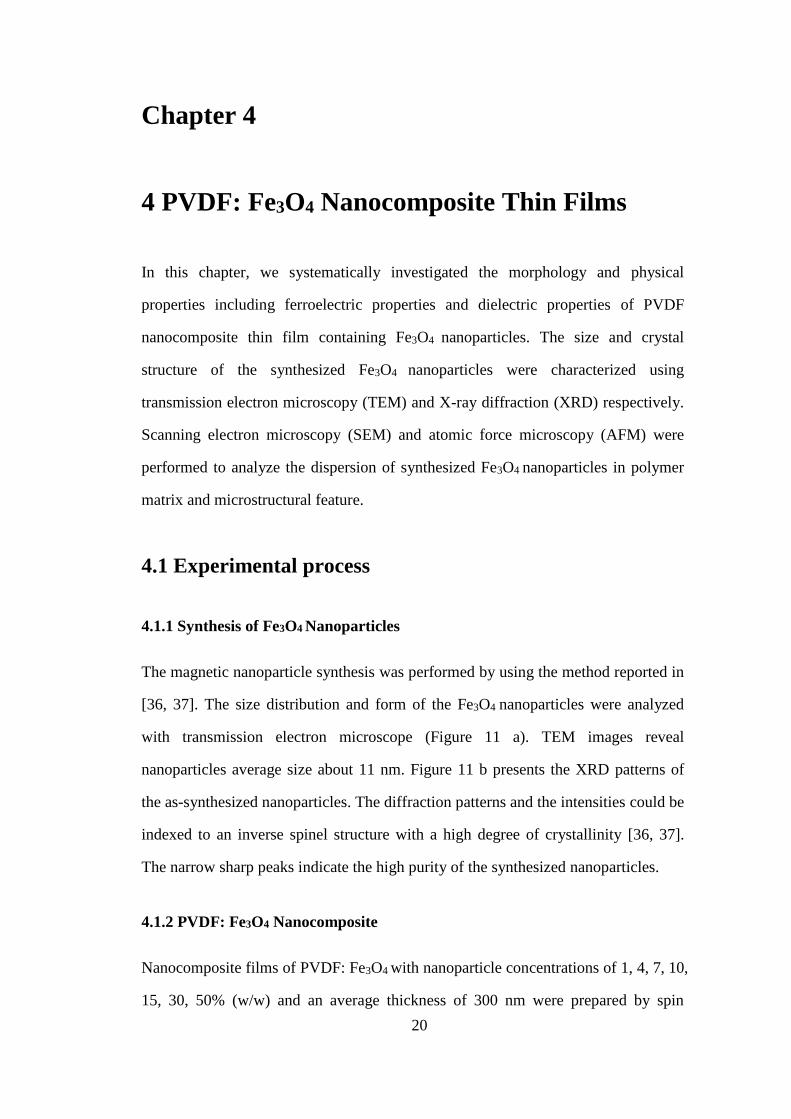
The magnetic nanoparticle synthesis was performed by using the method reported in
[36, 37]. The size distribution and form of the Fe3O4 nanoparticles were analyzed
with transmission electron microscope (Figure 11 a). TEM images reveal
nanoparticles average size about 11 nm. Figure 11 b presents the XRD patterns of
the as-synthesized nanoparticles. The diffraction patterns and the intensities could be
indexed to an inverse spinel structure with a high degree of crystallinity [36, 37].
The narrow sharp peaks indicate the high purity of the synthesized nanoparticles.
4.1.2 PVDF: Fe3O4 Nanocomposite
Nanocomposite films of PVDF: Fe3O4 with nanoparticle concentrations of 1, 4, 7, 10,
15, 30, 50% (w/w) and an average thickness of 300 nm were prepared by spin
21
coating at 100 °C. Initially, certain amount dried Fe3O4 nanoparticle powder was
dispersed in DMF and placed in an ultrasound bath for 6 hours. Separately, certain
amount PVDF pellets were added to DMF under magnetic stirring and heated at
100 °C for 2 hours and then filtered with 1 um filter to form a clear solution. The
polymer solution concentration is 75 mg/ml. Nanocomposite suspension was
prepared by directly blending the particle suspension with polymer solution. The
final mixtures were ultra-sonicated for 4 hours.
Figure 11. (a) TEM image of nanoparticles. (b) XRD patterns of the standard reference nanoparticles
(black line) and the corresponding modeling result (solid red line).
4.1.3 Capacitor Device Fabrication
5×5 matrix architecture which is also known as cross-bar type capacitor devices
were developed (Figure 12). Firstly, 1 nm thick chromium (Cr) was deposited on a
clean glass substrate to improve adhesion property. A Gold (Au) layer was
evaporated (50 nm) through shadow mask of width 400 µm which acts as the bottom
electrode. Nanocomposite films were spin coated on the bottom electrode from the
resulting nanocomposite suspension. In order to identify the appropriate thermal
processing conditions, the as-casted nanocomposite films were applied further
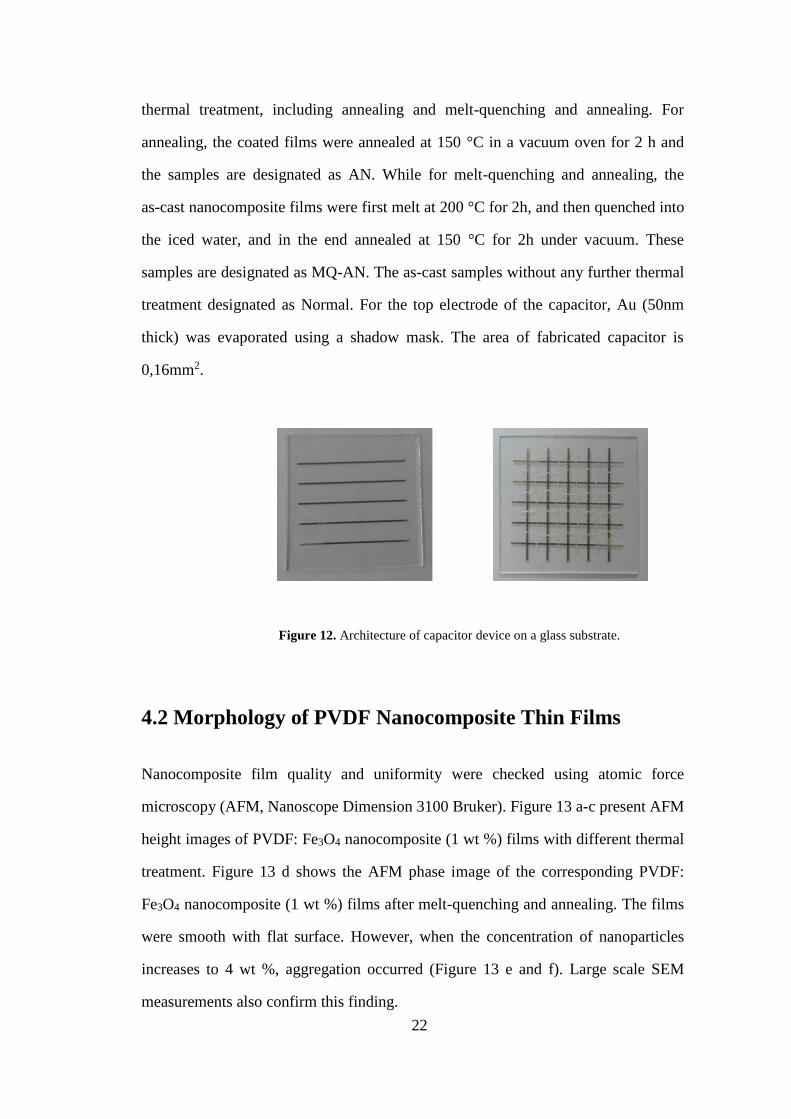
22
thermal treatment, including annealing and melt-quenching and annealing. For
annealing, the coated films were annealed at 150 °C in a vacuum oven for 2 h and
the samples are designated as AN. While for melt-quenching and annealing, the
as-cast nanocomposite films were first melt at 200 °C for 2h, and then quenched into
the iced water, and in the end annealed at 150 °C for 2h under vacuum. These
samples are designated as MQ-AN. The as-cast samples without any further thermal
treatment designated as Normal. For the top electrode of the capacitor, Au (50nm
thick) was evaporated using a shadow mask. The area of fabricated capacitor is
0,16mm2.
Figure 12. Architecture of capacitor device on a glass substrate.
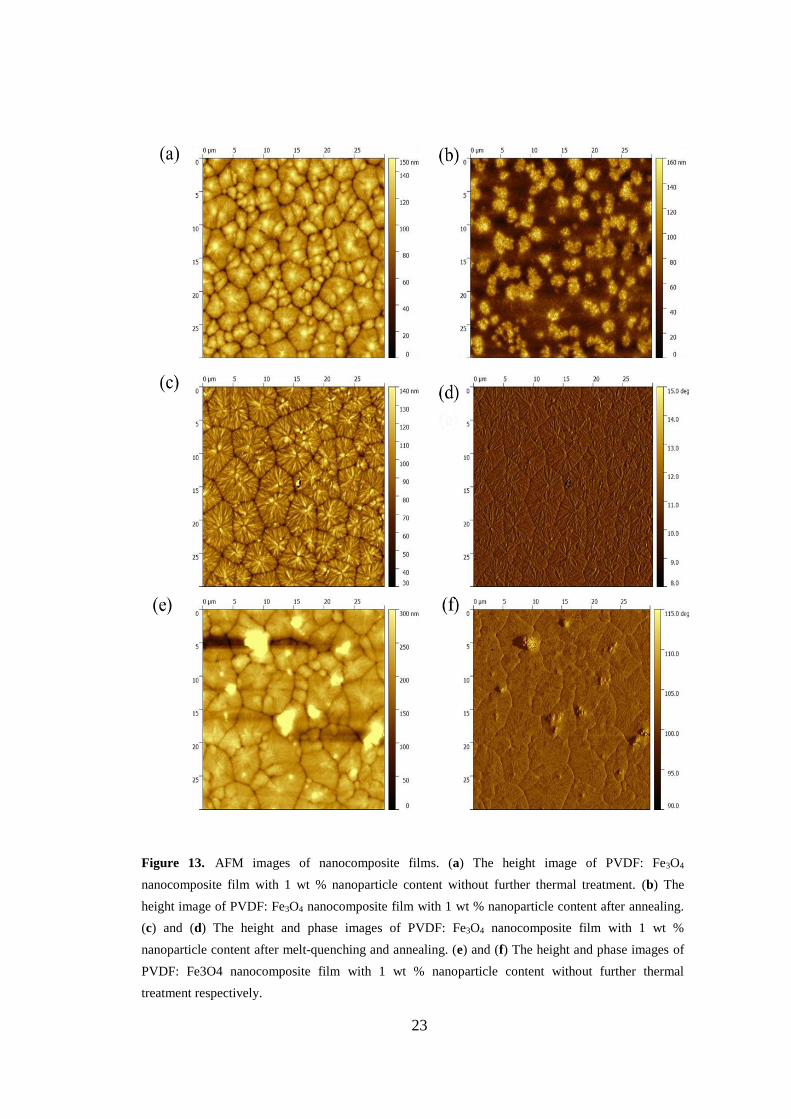
4.2 Morphology of PVDF Nanocomposite Thin Films
Nanocomposite film quality and uniformity were checked using atomic force
microscopy (AFM, Nanoscope Dimension 3100 Bruker). Figure 13 a-c present AFM
height images of PVDF: Fe3O4 nanocomposite (1 wt %) films with different thermal
treatment. Figure 13 d shows the AFM phase image of the corresponding PVDF:
Fe3O4 nanocomposite (1 wt %) films after melt-quenching and annealing. The films
were smooth with flat surface. However, when the concentration of nanoparticles
increases to 4 wt %, aggregation occurred (Figure 13 e and f). Large scale SEM
measurements also confirm this finding.
23
Figure 13. AFM images of nanocomposite films. (a) The height image of PVDF: Fe3O4
nanocomposite film with 1 wt % nanoparticle content without further thermal treatment. (b) The
height image of PVDF: Fe3O4 nanocomposite film with 1 wt % nanoparticle content after annealing.
(c) and (d) The height and phase images of PVDF: Fe3O4 nanocomposite film with 1 wt %
nanoparticle content after melt-quenching and annealing. (e) and (f) The height and phase images of
PVDF: Fe3O4 nanocomposite film with 1 wt % nanoparticle content without further thermal
treatment respectively.
24
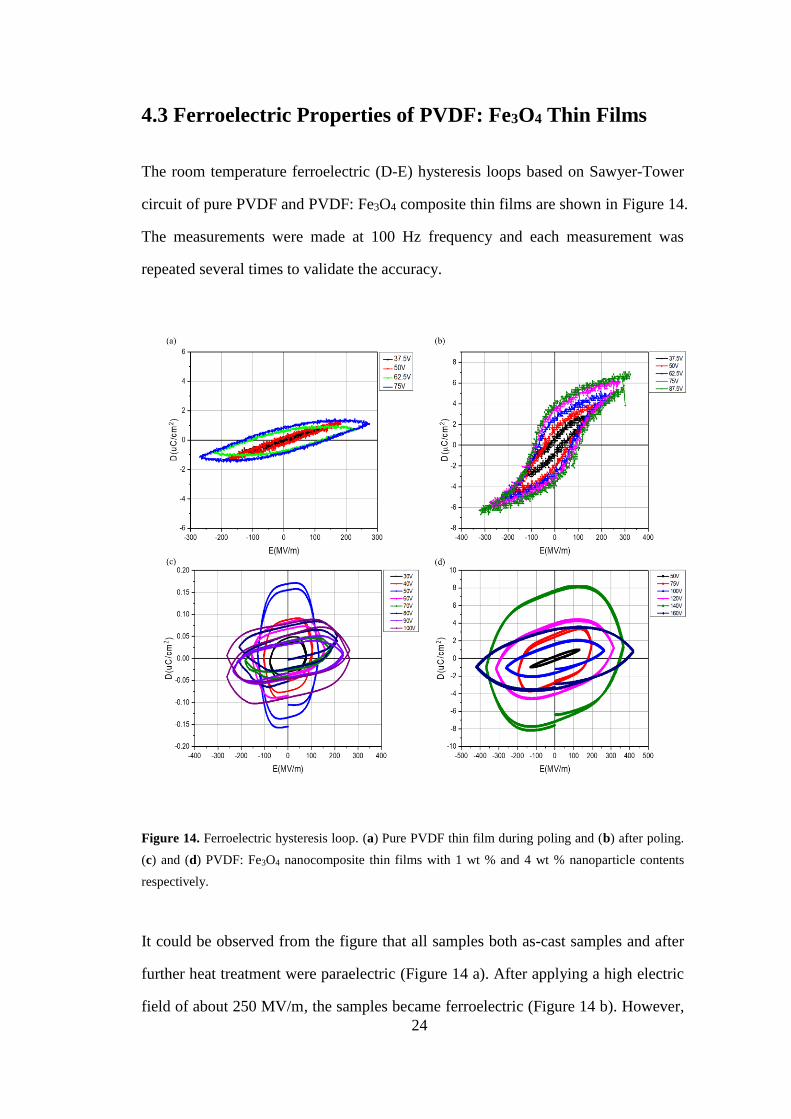
4.3 Ferroelectric Properties of PVDF: Fe3O4 Thin Films
The room temperature ferroelectric (D-E) hysteresis loops based on Sawyer-Tower
circuit of pure PVDF and PVDF: Fe3O4 composite thin films are shown in Figure 14.
The measurements were made at 100 Hz frequency and each measurement was
repeated several times to validate the accuracy.
Figure 14. Ferroelectric hysteresis loop. (a) Pure PVDF thin film during poling and (b) after poling.
(c) and (d) PVDF: Fe3O4 nanocomposite thin films with 1 wt % and 4 wt % nanoparticle contents
respectively.
It could be observed from the figure that all samples both as-cast samples and after
further heat treatment were paraelectric (Figure 14 a). After applying a high electric
field of about 250 MV/m, the samples became ferroelectric (Figure 14 b). However,
25
significant change in polarization was observed for Fe3O4 loaded samples. Even for
1 wt% nanoparticles added, the D-E loop became rounded and dielectric leakage
increased. At the same time, δ phase could not be induced anymore. For high
concentration of nanoparticles, electric breakdown filed reduces dramatically. One
of the possible reason is the rotation of molecular chain was prohibited due to the
existence of nanoparticles inside of polymer matrix. Another possible reason is the
resistivity of Fe3O4 is 0.01 Ohm cm at room temperature and present metallic
character [42]. Therefore, the addition of Fe3O4 nanoparticles decreases the overall
resistivity in the system. Moreover, there are some oxygen vacancies in Fe3O4 could
also lead to the increase of leakage current [43].
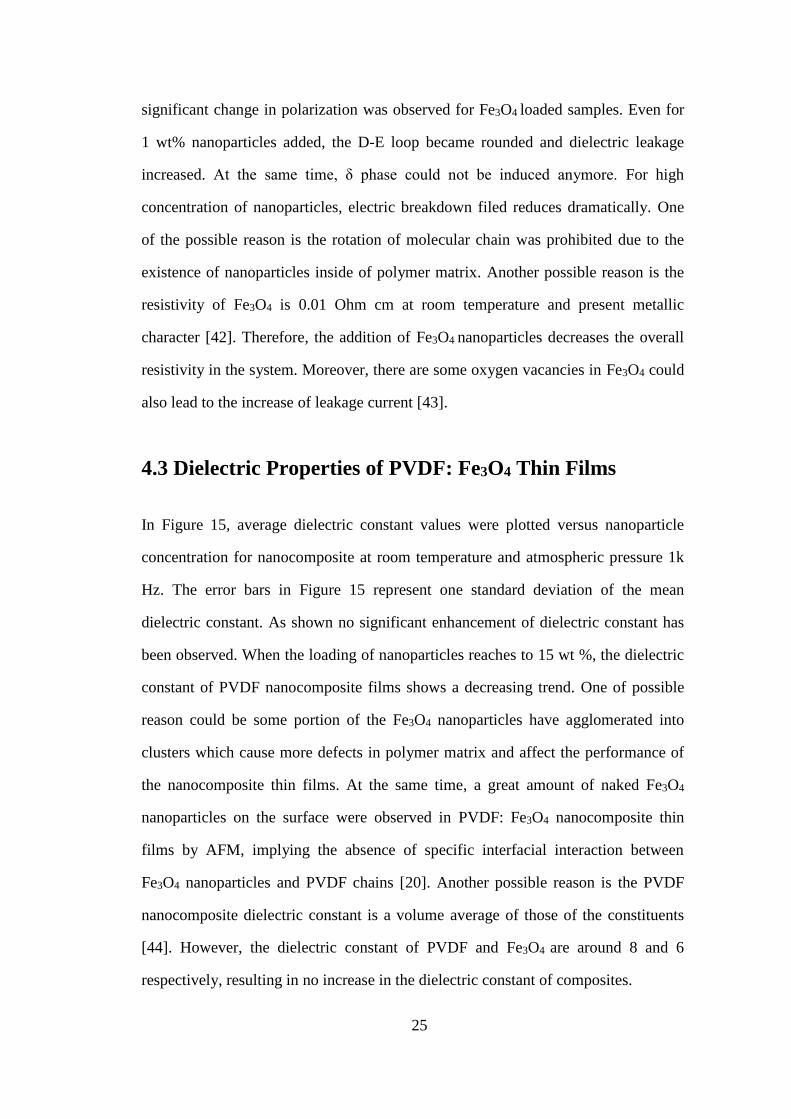
4.3 Dielectric Properties of PVDF: Fe3O4 Thin Films
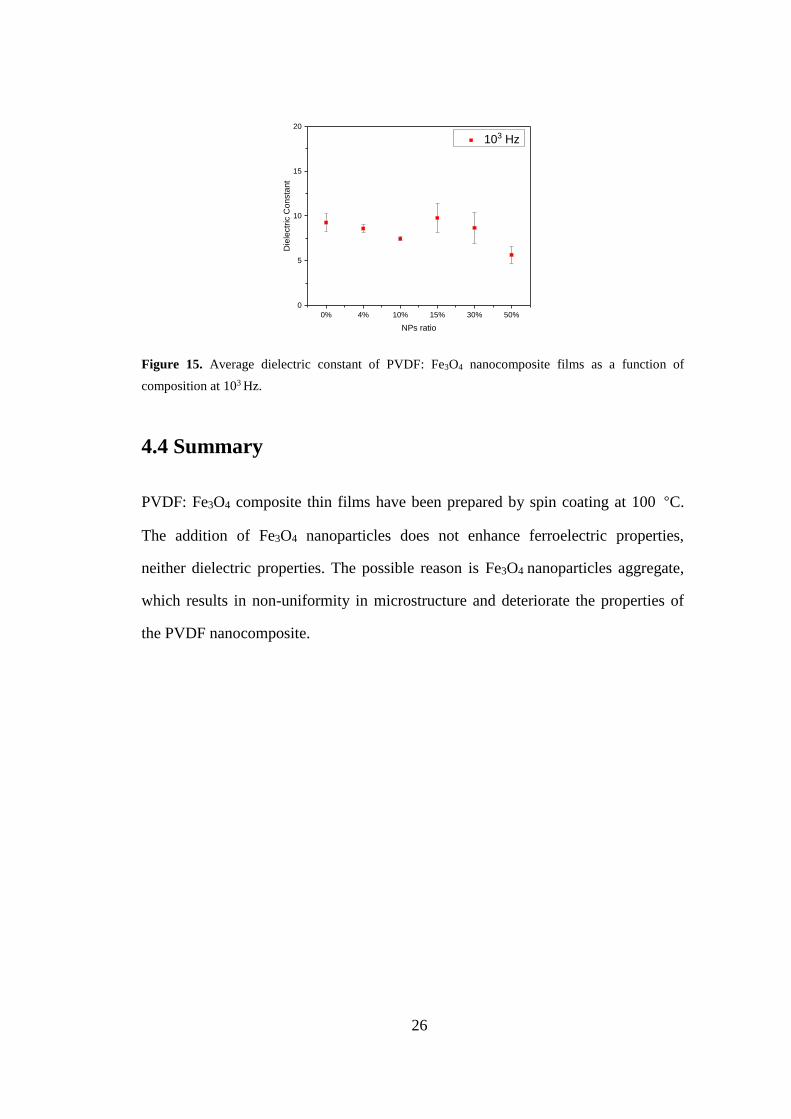
In Figure 15, average dielectric constant values were plotted versus nanoparticle
concentration for nanocomposite at room temperature and atmospheric pressure 1k
Hz. The error bars in Figure 15 represent one standard deviation of the mean
dielectric constant. As shown no significant enhancement of dielectric constant has
been observed. When the loading of nanoparticles reaches to 15 wt %, the dielectric
constant of PVDF nanocomposite films shows a decreasing trend. One of possible
reason could be some portion of the Fe3O4 nanoparticles have agglomerated into
clusters which cause more defects in polymer matrix and affect the performance of
the nanocomposite thin films. At the same time, a great amount of naked Fe3O4
nanoparticles on the surface were observed in PVDF: Fe3O4 nanocomposite thin
films by AFM, implying the absence of specific interfacial interaction between
Fe3O4 nanoparticles and PVDF chains [20]. Another possible reason is the PVDF
nanocomposite dielectric constant is a volume average of those of the constituents
[44]. However, the dielectric constant of PVDF and Fe3O4 are around 8 and 6
respectively, resulting in no increase in the dielectric constant of composites.
26
Figure 15. Average dielectric constant of PVDF: Fe3O4 nanocomposite films as a function of
composition at 103 Hz.
4.4 Summary
PVDF: Fe3O4 composite thin films have been prepared by spin coating at 100 °C.
The addition of Fe3O4 nanoparticles does not enhance ferroelectric properties,
neither dielectric properties. The possible reason is Fe3O4 nanoparticles aggregate,
which results in non-uniformity in microstructure and deteriorate the properties of
the PVDF nanocomposite.
0% 4% 10% 15% 30% 50%
0
5
10
15
20
103 Hz
Die
lectr
ic C
onsta
nt
NPs ratio
27
Chapter 5
5 PVDF: Fe3O4 Nanocomposite Thick Films
This chapter reports on the design and development of PVDF: Fe3O4 nanocomposite
thick films fabricated by wire-bar coating and drop casting respectively. The effects
of Fe3O4 nanoparticle content on the structural, crystalline phase, thermal,
ferroelectric properties and dielectric properties in PVDF matrix were discussed.
The PVDF: Fe3O4 nanocomposite thick films exhibit composition-dependent
dielectric properties. A high dielectric constant accompanied with low dielectric loss
upon addition of 5 wt % Fe3O4 nanoparticles to PVDF has been observed. Nearly 62%
increase of dielectric constant was observed in PVDF: Fe3O4 nanocomposite films
as compared to pure PVDF films prepared under identical conditions. Fourier
transformed infrared spectroscopy (FTIR) and X-ray diffraction (XRD) results
reveal that the inclusion of Fe3O4 nanoparticles does not affect the PVDF crystalline
phase, the processing conditions being the main reason for the formation of the α- or
β-phase.
5.1 Wire-bar Coated PVDF Nanocomposite Thick Films
The PVDF: Fe3O4 nanocomposite suspension was prepared by using the same
method described in chapter 4. PVDF polymer (Mw = 275 000 g/mol,
Sigma-Aldrich) was used and the solution concentration is 150 mg/ml. PVDF
nanocomposite thick films were prepared by a wire-bar coating deposition method at
95 °C, using a K102 K Control Coater from RK Print Coat Instruments Ltd. The
thickness of the obtained thick films was controlled by the dimension of the wires
wound on the wire-bar. The coated films were melt at 200 °C for 2h in a vacuum
oven and then quenched in ice water and subsequent annealed at 150 °C for 2h.
28
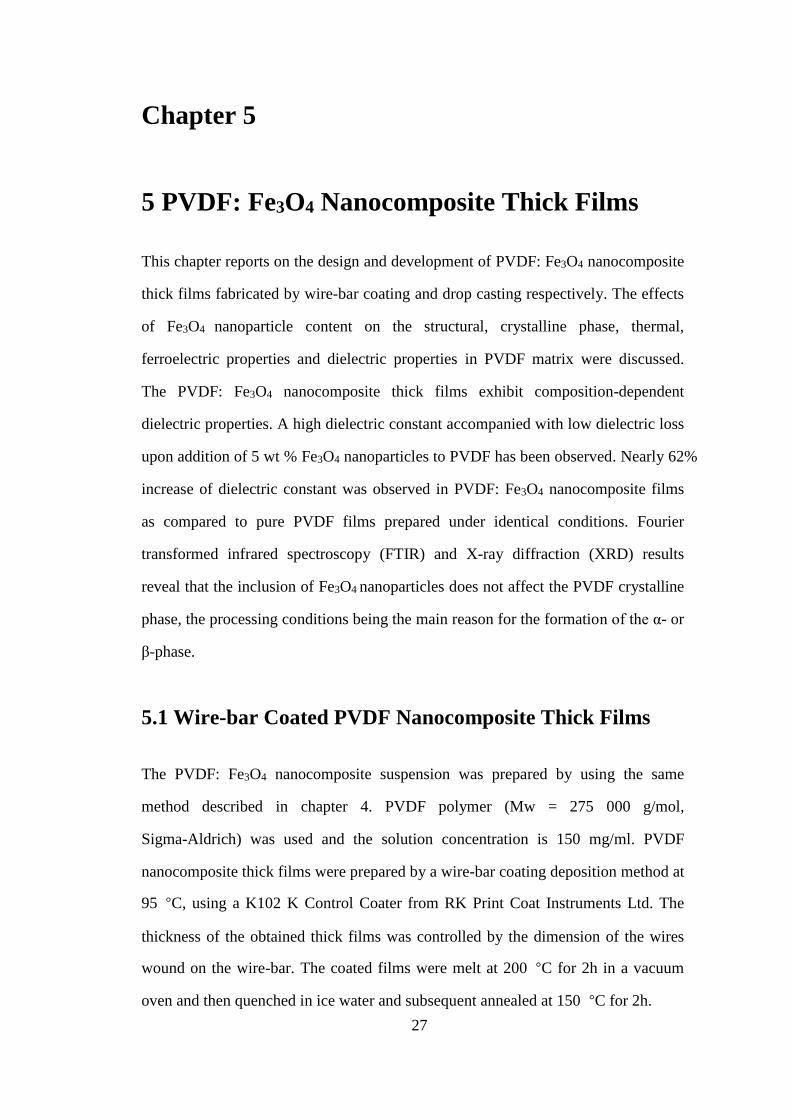
5.1.1 Morphology Characterization
To study the influence of Fe3O4 nanoparticles on the PVDF microstructure, AFM
height images of nanocomposite films were presented in Figure 16. At low ratio of
Fe3O4 nanoparticles (Figure 16 a-c), significant change was not observed. However,
when the ratio of Fe3O4 nanoparticles reaches to 5 wt % (Figure 16 d), aggregation
was observed. Moreover, the roughness of the film increased.
Figure 16. AFM height images. (a) Pure PVDF film. (b), (c) and (d) PVDF nanocomposite films
with 1 wt %, 3 wt % and 5 wt % nanoparticle contents respectively.
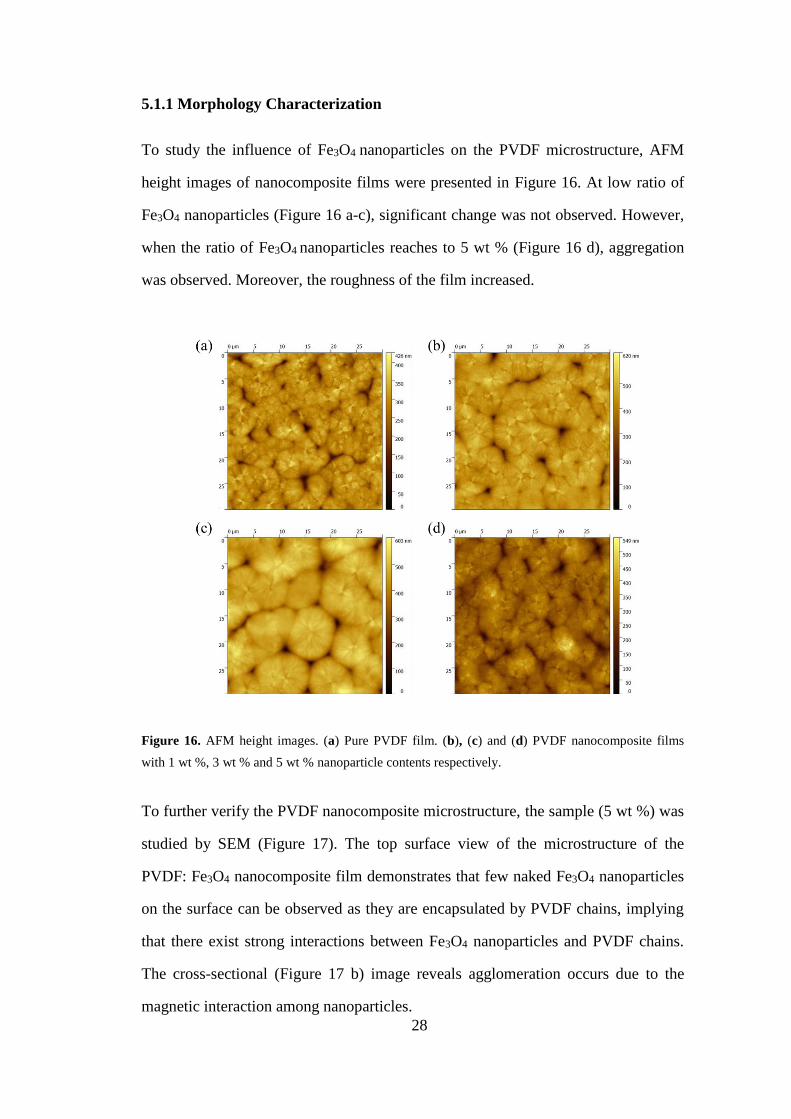
To further verify the PVDF nanocomposite microstructure, the sample (5 wt %) was
studied by SEM (Figure 17). The top surface view of the microstructure of the
PVDF: Fe3O4 nanocomposite film demonstrates that few naked Fe3O4 nanoparticles
on the surface can be observed as they are encapsulated by PVDF chains, implying
that there exist strong interactions between Fe3O4 nanoparticles and PVDF chains.
The cross-sectional (Figure 17 b) image reveals agglomeration occurs due to the
magnetic interaction among nanoparticles.
29
Figure 17. SEM images of 5 wt % PVDF nanocomposite film. (a) Top surface view and (b) cross-
sectional view.
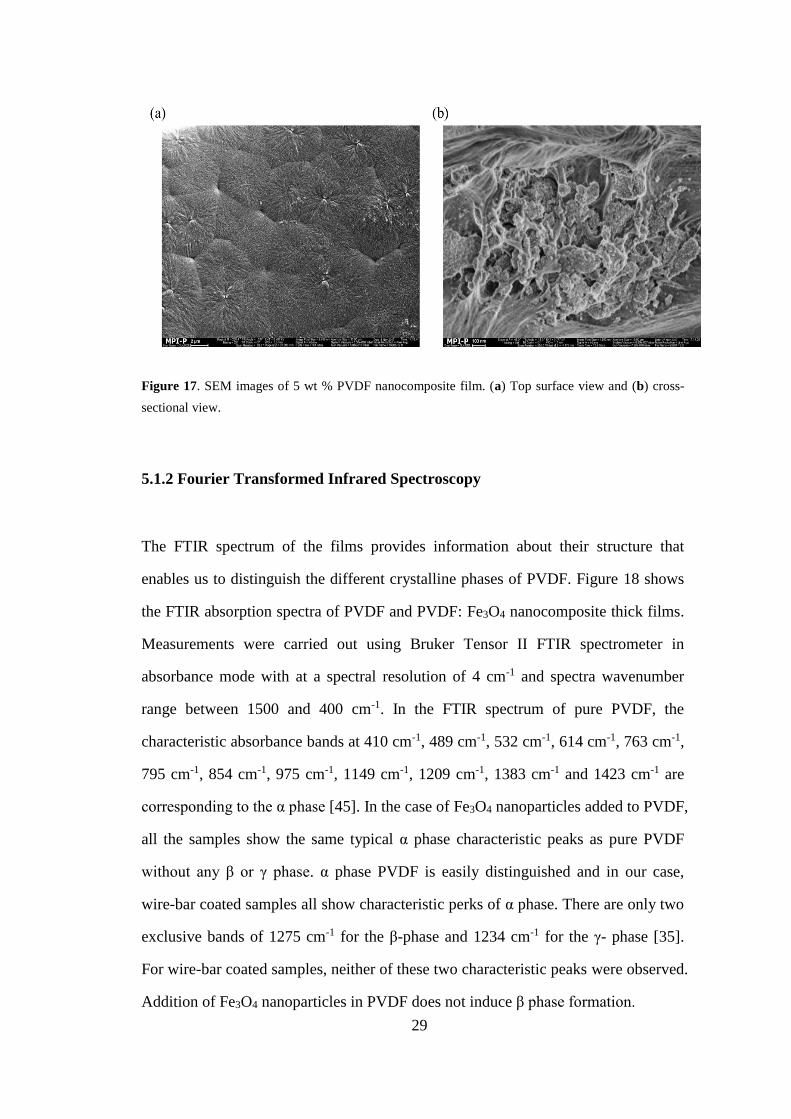
5.1.2 Fourier Transformed Infrared Spectroscopy
The FTIR spectrum of the films provides information about their structure that
enables us to distinguish the different crystalline phases of PVDF. Figure 18 shows
the FTIR absorption spectra of PVDF and PVDF: Fe3O4 nanocomposite thick films.
Measurements were carried out using Bruker Tensor II FTIR spectrometer in
absorbance mode with at a spectral resolution of 4 cm-1 and spectra wavenumber
range between 1500 and 400 cm-1. In the FTIR spectrum of pure PVDF, the
characteristic absorbance bands at 410 cm-1, 489 cm-1, 532 cm-1, 614 cm-1, 763 cm-1,
795 cm-1, 854 cm-1, 975 cm-1, 1149 cm-1, 1209 cm-1, 1383 cm-1 and 1423 cm-1 are
corresponding to the α phase [45]. In the case of Fe3O4 nanoparticles added to PVDF,
all the samples show the same typical α phase characteristic peaks as pure PVDF
without any β or γ phase. α phase PVDF is easily distinguished and in our case,
wire-bar coated samples all show characteristic perks of α phase. There are only two
exclusive bands of 1275 cm-1 for the β-phase and 1234 cm-1 for the γ- phase [35].
For wire-bar coated samples, neither of these two characteristic peaks were observed.
Addition of Fe3O4 nanoparticles in PVDF does not induce β phase formation.
30
Figure 18. FTIR spectra of pure PVDF and PVDF nanocomposite films with different content of
Fe3O4 nanoparticles.
5.1.3 Differential Scanning Calorimetry
Differential scanning calorimetry (DSC) is a thermoanalytical technique that has
been a complementary method to FTIR and XRD and also used for the identification
of the crystalline structure of polymer. The DSC thermograms under heating and
cooling conditions of the neat PVDF and PVDF nanocomposites are presented in
Figure 19. The degree of crystallinity was determined using the following equation
[46]:
𝑋𝑐 =Δ𝐻
xΔ𝐻𝛼+𝑦𝛥𝐻𝛽 (5)
400 500 600 700 800 900 1000 1100 1200 1300 1400 1500
15 wt %
8 wt %
5 wt %
3 wt %
1 wt %
Ab
so
rba
nce
(a.u
.)
Wavenumber(cm-1)
410 532489 614 763 795 854 975 1149 1209 13831423
PVDF
31
where Δ𝐻 is the melting enthalpy of the sample under consideration; Δ𝐻𝛼 and
𝛥𝐻𝛽 are the melting enthalpy of a 100% crystalline sample of α-PVDF and β-PVDF
respectively, and x and y are the amount of the α- and β-phase present in the sample.
In this study, a value of 93.07 Jg-1 and 103.4 Jg-1 [13] was used for Δ𝐻𝛼 and
𝛥𝐻𝛽 respectively.
Figure 19.DSC thermograms under (a) heating and (b) cooling conditions of pure PVDF and PVDF
nanocomposite films with different content of Fe3O4 nanoparticles.
From the DSC measurements, no remarkable changes in melting temperature and
crystallization temperature in PVDF nanocomposite have been observed. We have
already used FTIR to establish that all the samples exhibit α-phase. Therefore, it is
expected that nanocomposite will show melting peaks of α-phase PVDF 167 °C. In
our case, the melting peaks were around 168°C for all samples. However, β-phase
PVDF presents a similar melting temperature with α-phase PVDF [10]. Therefore,
DSC measurement can not be used to distinguish α- and β-phase, but can be used to
calculate the crystalline percentage of the film. Table 5.1 presents the values of
melting peak of the thermograms and the crystallinity content of the samples. It
32
shows the addition of Fe3O4 nanoparticles cause the decreasing of crystallinity and
the report [47] also had the same observation.
Sample Tm(°C) Tc(°C) Xc(%)
Neat PVDF 168.49 141.3 49.87
1 wt % 168.69 140.2 49.28
3 wt % 167.97 140.9 51.50
5 wt % 167.93 140.0 39.27
8 wt % 168.66 140.5 41.09
15 wt % 167.99 139.1 32.54
Table 2. Tm, Tc and Xc values of PVDF and PVDF: Fe3O4 nanocomposite films with different content
of Fe3O4 nanoparticles.
5.1.4 Thermogravimetric Analysis
Thermogravimetric analysis techniques measure the mass of a sample over the time
as a function of temperature and it can used to determines temperature and weight
change of decomposition reactions. Figure 20 presents TGA thermograms of PVDF
and PVDF nanocomposites. As indicated in the figure, the degradation of PVDF
nanocomposites which is reflected with the major weight loss occurs in the range
from 400 °C to 500 °C. The onset degradation temperature of pure PVDF was
around 467 °C. However, the introduction of Fe3O4 nanoparticles increased the
initial decomposition temperature and shifted to 482 °C, 481°C, 484 °C, 478 °C
and 484°C in the case of 1 wt %, 3 wt %, 5 wt %, 8 wt % and 15 wt % Fe3O4
nanoparticles added. This indicates that the thermal stability of PVDF
nanocomposites is significantly enhanced compared to pure PVDF. The
enhancement of thermal stability may be explained by the better packing of PVDF
nanocomposite with Fe3O4 nanoparticles loading compared to pure PVDF. Moreover,
nano-incorporation and interaction between the Fe3O4 nanoparticles and PVDF
matrix may also enhance the thermal stability [48].
33
Figure 20. TGA thermograms of PVDF and PVDF nanocomposites with different content of Fe3O4
nanoparticles.
5.1.5 Ferroelectric Properties
The room temperature ferroelectric (D-E) hysteresis loops of pure PVDF and PVDF:
Fe3O4 nanocomposite films with different contents of Fe3O4 nanoparticle are shown
in Figure 21. As indicated in the figure, all the samples behave paraelectric α phase.
At the same time, the inclusion of Fe3O4 nanoparticles reduce electric breakdown
field. After applying a high electric field of about 250 MV/m, δ phase formation has
not been observed. For high concentration of nanoparticles, electric breakdown filed
reduces dramatically. One of the possible reason is the rotation of molecular chain
was prohibited due to the existence of nanoparticles inside of polymer matrix.
Another possible reason is the resistivity of Fe3O4 is 0.01 Ohm cm at room
temperature and present metallic character [42]. Therefore, the addition of Fe3O4
nanoparticles decreases the overall resistivity in the system. Moreover, there are
300 400 500 600
0.0
0.2
0.4
0.6
0.8
1.0
We
igh
t
Temperature (C)
PVDF
1wt%
3wt%
5wt%
8wt%
15wt%
467 480
34
some oxygen vacancies in Fe3O4 could also lead to the increase of leakage current
[43].
Figure 21. Electric filed dependent polarization. (a) Pure PVDF. (b-f) PVDF: Fe3O4 nanocomposite
films with different nanoparticles content 1 wt %, 3 wt %, 5 wt %, 8 wt % and 15 wt % respectively.
35
5.1.6 Dielectric Properties
Dielectric properties of wire-bar coated PVDF: Fe3O4 nanocomposite thick films
were characterized using Novocontrol control dielectric spectrometer. Figure 22
shows the dependence of the dielectric properties of the PVDF: Fe3O4
nanocomposite films with nanoparticle content up to 8 wt % on the frequency range
between 10-1 and 107 Hz at room temperature and atmospheric pressure.
Figure 22. Dielectric properties of wire-bar coated PVDF: Fe3O4 nanocomposite films. (a) Dielectric
constant and (b) loss tangent with different nanoparticles content. (c) Dielectric constant at 1 kHz as a
function of nanoparticles content and (d) dielectric constant of PVDF nanocomposite films as a
function of composition at 100 to 100 kHz.
36
As it can be seen in Figure 22 a, a significant improvement in dielectric constant up
to 5 wt % the PVDF nanocomposite film in comparison to pure PVDF film was
observed. The average dielectric constant values were plotted versus nanoparticle
content at 1 kHz and the error bars represent the standard deviation of the mean
dielectric constant (Figure 22 c). The dielectric constant of pure PVDF film was 8 at
100 Hz, with values increasing to about 10 for 1 wt % nanocomposite films, to about
12 for 3 wt % nanocomposite films. A maximum dielectric constant of 14 is
observed for 5 wt % nanocomposite films, while maintaining low loss. Further
doping of Fe3O4 nanoparticles decreases the value of dielectric constant. The
observed behavior is consistent with the reported data [18]. Generally, there are
several reasons responsible for the observed increase in dielectric constant of
nanocomposites. The first one is Maxwell-Wagner-Sillars (MWS) polarization
effect [49] which occurs in heterogeneous medium consisting of phases with
different permittivity and conductivity due to accumulation of the mobile charges at
an interface between electrode and nanocomposite films. This effect can be observed
particularly in the low frequency range [30]. At low Fe3O4 nanoparticles
concentration, the Fe3O4 nanoparticles are well separated from each other with no
effective interaction between them. With increasing Fe3O4 nanoparticles content, the
number of nanoparticles and their interfacial area per unit volume increases with a
decrease in the interparticle distance which improves the interfacial polarization [50].
Higher doping concentrations of the Fe3O4 nanoparticles increase void space and
without sufficient matrix polymer to fill the space between particles, the interstitial
void space (with a dielectric constant of 1) increases [51], resulting in a decrease in
dielectric constant. Paper [44] also reported the enhancement of the dielectric
constant with low dielectric constant fillers. The model they used is based on the
electric multilayer, the surface-area-to-volume plays an important role on the overall
polarization response. An optimal distance of the surface of the fillers leads to high
local dielectric constant. However, an increased or decreased distance between the
37
nearest nanofillers, both of which will result in a decreased dielectric constant.
Another possible reason is the formation of a network of micro-capacitors in the
nanocomposite due to the inclusion of nanoparticles. When the nanoparticles are
loaded into PVDF matrix, they could act as micro-capacitor and lead to an overall
increase in dielectric constant of nanocomposites compared with pure PVDF [52].
Figure 22 b shows frequency dependence of loss tangent (tan δ) of PVDF: Fe3O4
nanocomposite films and pure PVDF film. As shown from the figure, the increase in
dielectric loss with decreasing frequency at the low frequency region (𝑓 < 103 𝐻𝑧)
is mainly dominated by dc conductivity [50]. It is interesting to note that the
dielectric losses of PVDF nanocomposite were suppressed in the low frequency
range (𝑓 < 103 𝐻𝑧) with respect to pure PVDF which may be explained by the low
dc conductivity and decreased crystallinity in PVDF: Fe3O4 nanocomposites.
However, at the high frequency region ( 𝑓 > 103 𝐻𝑧 ), both micro-Brownian
moments of the amorphous chain segments and molecular motion on the interfaces
can attribute to dielectric loss [20].
5.2 Drop cast PVDF: Fe3O4 Nanocomposite Thick Films
The nanocomposite solution used is the same solution with wire-bar coated films.
Free-standing films with 50-90 μm were prepared by spreading the suspension on
clean glass substrates. Solvent evaporation was performed inside the vacuum oven at
a temperature of 60 °C for 24 h. The temperature of 60 °C was chosen in order to
obtain β-phase PVDF. Pure PVDF films were also prepared under identical
conditions for comparison.
5.2.1 Morphology Characterization
The microstructure of the prepared films was analyzed by scanning electron
microscopy (SEM). Figure 23 shows the SEM images of PVDF nanocomposite
38
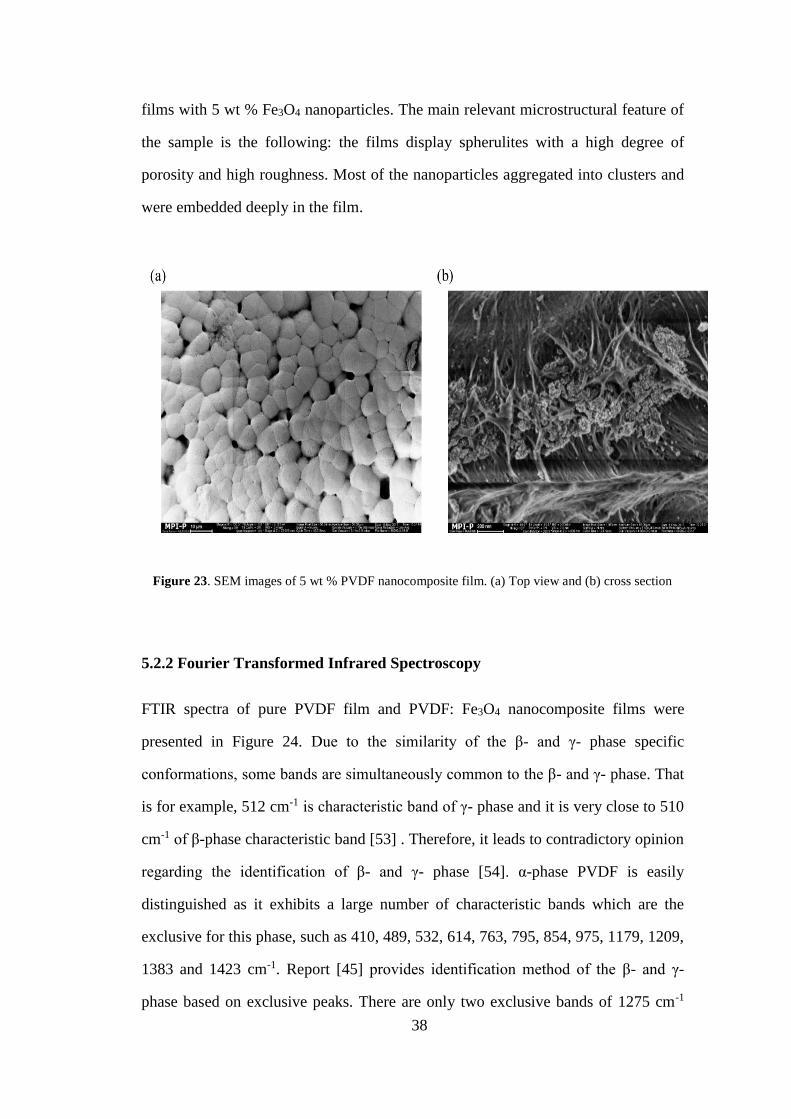
films with 5 wt % Fe3O4 nanoparticles. The main relevant microstructural feature of
the sample is the following: the films display spherulites with a high degree of
porosity and high roughness. Most of the nanoparticles aggregated into clusters and
were embedded deeply in the film.
Figure 23. SEM images of 5 wt % PVDF nanocomposite film. (a) Top view and (b) cross section
5.2.2 Fourier Transformed Infrared Spectroscopy
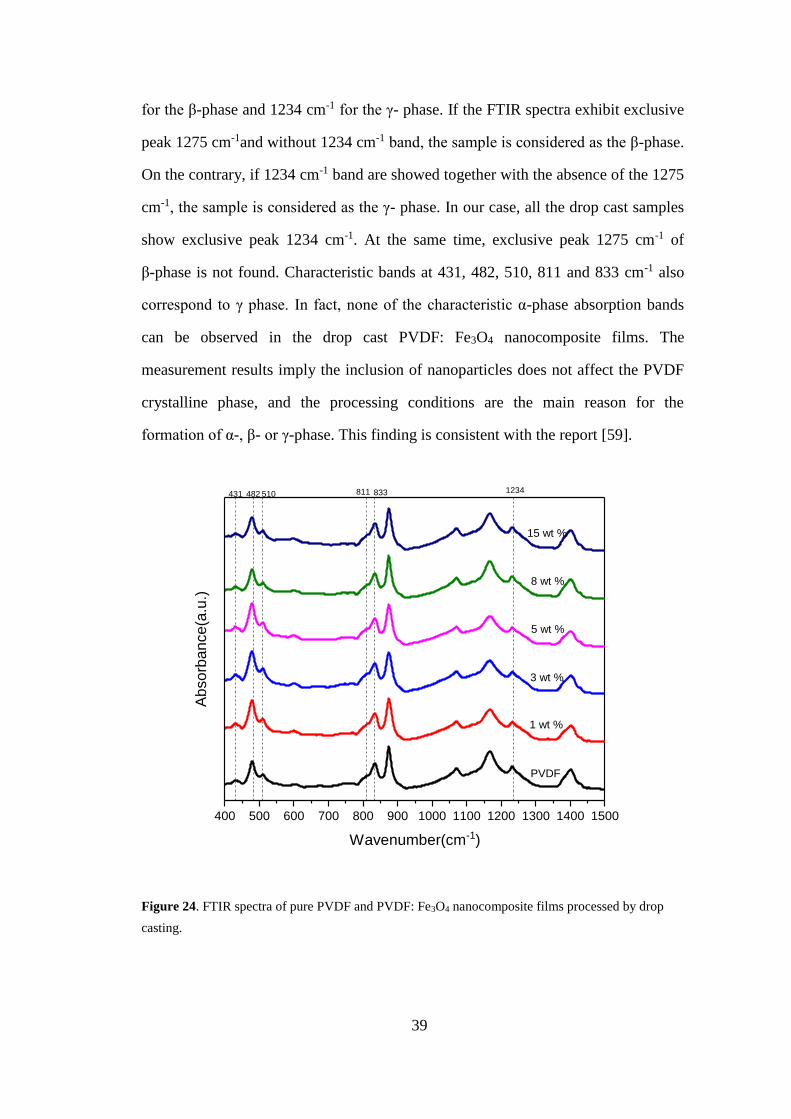
FTIR spectra of pure PVDF film and PVDF: Fe3O4 nanocomposite films were
presented in Figure 24. Due to the similarity of the β- and γ- phase specific
conformations, some bands are simultaneously common to the β- and γ- phase. That
is for example, 512 cm-1 is characteristic band of γ- phase and it is very close to 510
cm-1 of β-phase characteristic band [53] . Therefore, it leads to contradictory opinion
regarding the identification of β- and γ- phase [54]. α-phase PVDF is easily
distinguished as it exhibits a large number of characteristic bands which are the
exclusive for this phase, such as 410, 489, 532, 614, 763, 795, 854, 975, 1179, 1209,
1383 and 1423 cm-1. Report [45] provides identification method of the β- and γ-
phase based on exclusive peaks. There are only two exclusive bands of 1275 cm-1
39
for the β-phase and 1234 cm-1 for the γ- phase. If the FTIR spectra exhibit exclusive
peak 1275 cm-1and without 1234 cm-1 band, the sample is considered as the β-phase.
On the contrary, if 1234 cm-1 band are showed together with the absence of the 1275
cm-1, the sample is considered as the γ- phase. In our case, all the drop cast samples
show exclusive peak 1234 cm-1. At the same time, exclusive peak 1275 cm-1 of
β-phase is not found. Characteristic bands at 431, 482, 510, 811 and 833 cm-1 also
correspond to γ phase. In fact, none of the characteristic α-phase absorption bands
can be observed in the drop cast PVDF: Fe3O4 nanocomposite films. The
measurement results imply the inclusion of nanoparticles does not affect the PVDF
crystalline phase, and the processing conditions are the main reason for the
formation of α-, β- or γ-phase. This finding is consistent with the report [59].
Figure 24. FTIR spectra of pure PVDF and PVDF: Fe3O4 nanocomposite films processed by drop
casting.
400 500 600 700 800 900 1000 1100 1200 1300 1400 1500
15 wt %
8 wt %
5 wt %
3 wt %
1 wt %
Ab
so
rba
nce
(a.u
.)
Wavenumber(cm-1)
431 482 510 811 833 1234
PVDF
40
5.2.3 X-ray Diffraction
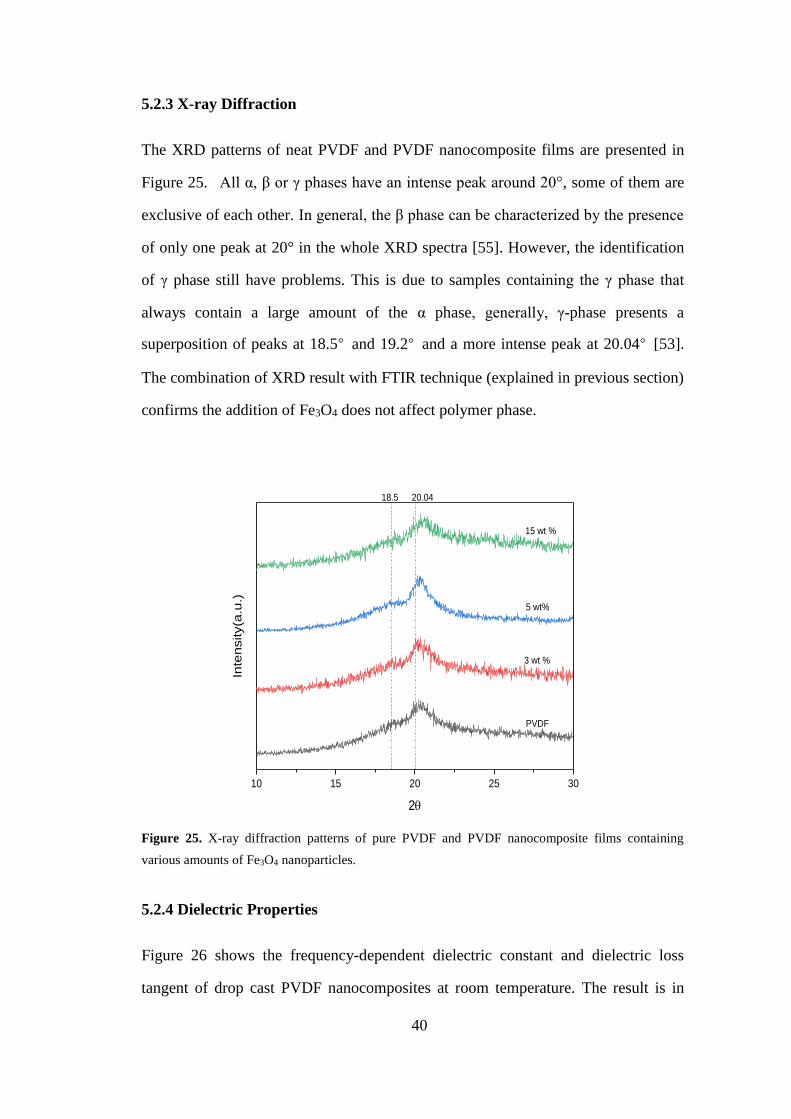
The XRD patterns of neat PVDF and PVDF nanocomposite films are presented in
Figure 25. All α, β or γ phases have an intense peak around 20°, some of them are
exclusive of each other. In general, the β phase can be characterized by the presence
of only one peak at 20° in the whole XRD spectra [55]. However, the identification
of γ phase still have problems. This is due to samples containing the γ phase that
always contain a large amount of the α phase, generally, γ-phase presents a
superposition of peaks at 18.5° and 19.2° and a more intense peak at 20.04° [53].
The combination of XRD result with FTIR technique (explained in previous section)
confirms the addition of Fe3O4 does not affect polymer phase.
10 15 20 25 30
Inte
nsity(a
.u.)
2
PVDF
3 wt %
5 wt%
15 wt %
18.5 20.04
Figure 25. X-ray diffraction patterns of pure PVDF and PVDF nanocomposite films containing
various amounts of Fe3O4 nanoparticles.
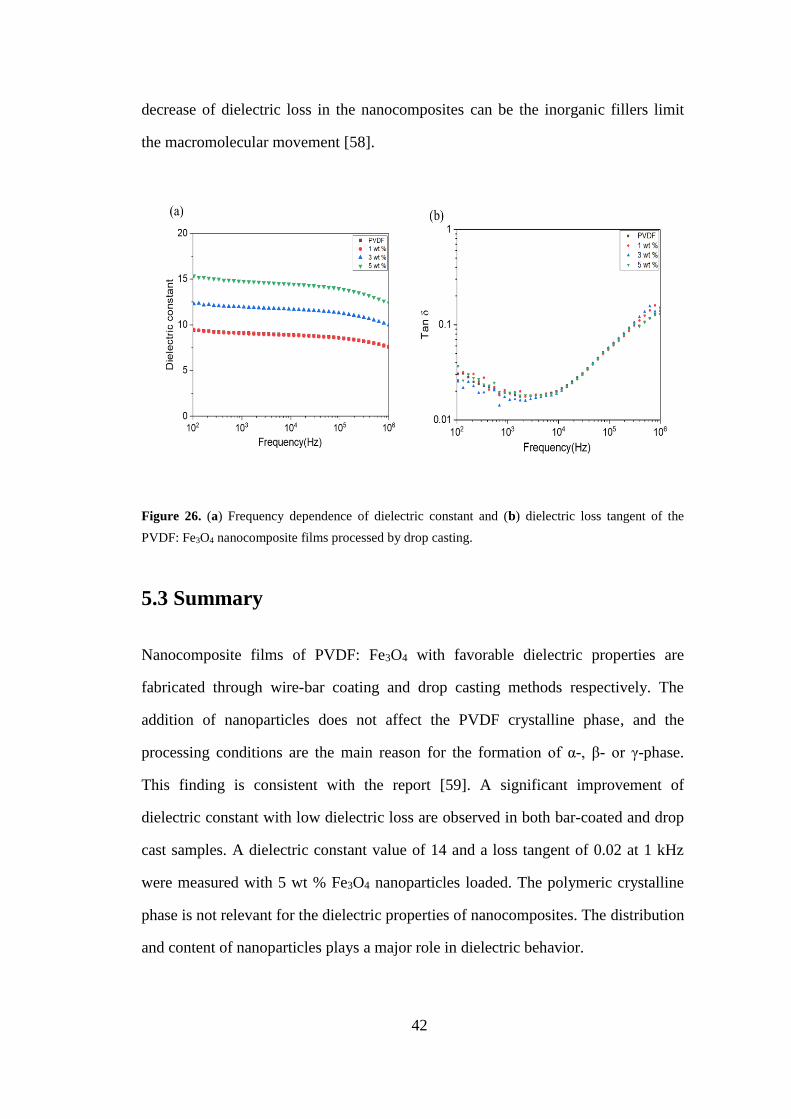
5.2.4 Dielectric Properties
Figure 26 shows the frequency-dependent dielectric constant and dielectric loss
tangent of drop cast PVDF nanocomposites at room temperature. The result is in
41
good agreement with wire-bar coated samples. One can see from Figure 26 (a) that
the frequency dependence of the dielectric properties of the drop cast nanocomposite
films shows similar behavior to the wire-bar coated PVDF: Fe3O4 nanocomposite
films. It can be found that the dielectric constant of the PVDF: Fe3O4 nanocomposite
films increases with gradually increasing nanoparticles content. The maximum
dielectric constant of the PVDF: Fe3O4 nanocomposite films is 14 when the content
of Fe3O4 nanoparticles is 5 wt %. In comparison with pure PVDF (ε= 8), the
dielectric constant of the composite is nearly 2 times higher. This indicates that
incorporating Fe3O4 nanoparticles into the polymer matrix results in an enhancement
in dielectric constant. The significant increase in dielectric constant of PVDF: Fe3O4
nanocomposite films can be attributed to the formation of a quantity of
micro-capacitors. With increased nanoparticles concentration, more
micro-capacitance structures are constructed and greater interfacial areas are
introduced in the composite, resulting in higher dielectric constant relative to that of
pure PVDF. In addition, charges can be accumulated at the interfaces between Fe3O4
nanoparticles and polymer matrix due to their different dielectric constant as well as
conductivity, thus interfacial polarization (Maxwell-Wagner-Sillars effect) can also
makes a remarkable contribution to the increase in dielectric constant of PVDF:
Fe3O4 nanocomposites in the low-frequency range [56]. The decrease in dielectric
constant of PVDF nanocomposites with frequency may be explained that it becomes
difficult for dipoles to execute the flipping motion and accumulation process needs
to have a relatively long time with frequency increasing. Therefore there would be
losses arising due to the dipolar relaxation [3]. All the drop cast samples show the
similar dielectric loss tangent compared with pure PVDF. In fact, many works
reported that the nanocomposite exhibit lower dielectric loss tangent at high
frequencies [57]. Since the dielectric loss at higher frequencies mainly originates
from the electrical conduction and dipolar polarization. The possible reason for the
42
decrease of dielectric loss in the nanocomposites can be the inorganic fillers limit
the macromolecular movement [58].
Figure 26. (a) Frequency dependence of dielectric constant and (b) dielectric loss tangent of the
PVDF: Fe3O4 nanocomposite films processed by drop casting.
5.3 Summary
Nanocomposite films of PVDF: Fe3O4 with favorable dielectric properties are
fabricated through wire-bar coating and drop casting methods respectively. The
addition of nanoparticles does not affect the PVDF crystalline phase, and the
processing conditions are the main reason for the formation of α-, β- or γ-phase.
This finding is consistent with the report [59]. A significant improvement of
dielectric constant with low dielectric loss are observed in both bar-coated and drop
cast samples. A dielectric constant value of 14 and a loss tangent of 0.02 at 1 kHz
were measured with 5 wt % Fe3O4 nanoparticles loaded. The polymeric crystalline
phase is not relevant for the dielectric properties of nanocomposites. The distribution
and content of nanoparticles plays a major role in dielectric behavior.
43
Chapter 6
6 Conclusions and Outlook
6.1 Conclusions
In this thesis, firstly the suitable processing condition was determined to get
transparent, flat and smooth films. The films processed at an elevated temperature
and low relative humidity exhibited low roughness. In order to investigate the effect
of thermal treatment, after deposition of the film, the samples were received melt
quenching with subsequent annealing and only annealing treatment. From the
experimental results, melt quenching with subsequent annealing samples showed
high breakdown strength.
PVDF: Fe3O4 nanocomposite thin films were prepared by spin coating at 100 °C,
the thickness was around 300nm. Ferroelectric properties and dielectric properties
were investigated. The addition of nanoparticles did not enhance ferroelectric
properties and dielectric properties. The possible reason is Fe3O4 nanoparticles
aggregated into clusters causing more defects in polymer matrix which was
confirmed by AMF and SEM measurements and affect the physical properties of
PVDF nanocomposite thin films.
PVDF: Fe3O4 nanocomposite thick films were fabricated by wire-bar coating and
drop casting respectively. The frequency dependent dielectric constant and the loss
tangent were studied for the PVDF nanocomposite thick films. Inclusion of Fe3O4
nanoparticles in PVDF matrix significantly enhances dielectric properties of the
polymer. A dielectric constant value of 14 and loss tangent of 0.02 at 103 Hz were
measured at a Fe3O4 nanoparticle concentration of 5 wt %. Possible mechanisms
44
responsible for these observed improvements in dielectric properties have been
discussed. At the same time, crystalline phase of PVDF: Fe3O4 nanocomposite films
was studied by FTIR and XRD, the addition of Fe3O4 nanoparticles did not induce β
phase. The processing conditions are the main reason for the formation of α-, β- or
γ-phase. The polymeric crystalline phase is not relevant for the dielectric properties
of nanocomposites. The distribution and content of nanoparticles plays a major role
in dielectric behavior. All these results suggest that this polymer nanocomposite
material system is promising candidates for energy storage and multiferroic
magnetoelectric applications.
6.2 Outlook
The experimental results suggest the uniform distribution of nanoparticles in PVDF
polymer matrix without particle agglomeration plays an important role for the
physical properties of PVDF nanocomposite. As a future work, nanoparticle
distribution in polymer matrix can be controlled through surface modification of
nanoparticles. By tailoring interactions between nanoparticles and polymer matrix,
improved dielectric and ferroelectric properties can be achieved. The
magnetoelectric effect will be investigated in PVDF: Fe3O4 nanocomposites.
45
Bibliography
[1] M. F. Nicola A. Spaldin, “The Renaissance of Magnetoelectric Multiferroics,”
Science (80-. )., vol. 309, no. July, pp. 391–392, 2005.
[2] M. Fiebig, “Revival of the magnetoelectric effect,” J. Phys. D. Appl. Phys., vol.
38, no. 8, 2005.
[3] G. Suresh, S. Jatav, M. S. Ramachandra Rao, and D. K. Satapathy,
“Enhancement of dielectric and ferroelectric properties in cobalt ferrite doped
poly(vinylidene fluoride) multiferroic composites,” Mater. Res. Express, vol. 4,
no. 7, 2017.
[4] T. Prabhakaran and J. Hemalatha, “Poly ( vinylidene fluoride ) -Based
Magnetoelectric Polymer Nanocomposite Films,” Magnetoelectric Polym.
Compos. Fundam. Appl., 2017.
[5] P. Martins and S. Lanceros-Méndez, “Polymer-based magnetoelectric materials,”
Adv. Funct. Mater., vol. 23, no. 27, pp. 3371–3385, 2013.
[6] K. M. Rabe, C. H. Ahn, J. M.-M. Triscone, M. Dawber, and C. Lichtensteiger,
Physics of Ferroelectrics, vol. 105, no. 2007. 2007.
[7] Q. X. Chen and P. A. Payne, “Industrial applications of piezoelectric polymer
transducers,” Meas. Sci. Technol., vol. 6, no. 3, pp. 249–267, 1995.
[8] N. Tsutsumi, X. Bai, and W. Sakai, “Towards nonvolatile memory devices
based on ferroelectric polymers,” AIP Adv., vol. 2, no. 1, 2012.
[9] R. Gregorio and E. M. Ueno, “Effect of crystalline phase, orientation and
temperature on the dielectric properties of poly (vinylidene fluoride) (PVDF),”
J. Mater. Sci., vol. 34, no. 18, pp. 4489–4500, 1999.
[10] R. Crecorio and M. Cestari, “Effect of Crystallization Temperature on the
Crystalline Phase Content and Morphology of Poly ( vinylidene Fluoride ),” J.
Polym. Sci. Part B Polym. Phys., vol. Vol. 32, pp. 859–870, 1994.
[11] M. Li, H. J. Wondergem, M. J. Spijkman, K. Asadi, I. Katsouras, P. W. M.
Blom, and D. M. De Leeuw, “Revisiting the δ-phase of poly(vinylidene fluoride)
for solution-processed ferroelectric thin films,” Nat. Mater., 2013.
[12] A. J. Lovinger, “Ferroelectric Polymers,” Science (80-. )., vol. 220, no. 4602, pp.
1115–1121, 1983.
[13] S. Lanceros-Méndez, J. F. Mano, A. M. Costa, and V. H. Schmidt, “Ftir and
Dsc Studies of Mechanically Deformed Β-Pvdf Films,” J. Macromol. Sci. Part
B, vol. 40, no. 3–4, pp. 517–527, 2001.
[14] V. Sencadas, R. Gregorio Filho, and S. Lanceros-Mendez, “Processing and
characterization of a novel nonporous poly(vinilidene fluoride) films in the β
phase,” J. Non. Cryst. Solids, vol. 352, no. 21–22, pp. 2226–2229, 2006.
[15] B. H. Fan, J. W. Zha, D. Wang, J. Zhao, and Z. M. Dang, “Size-dependent
low-frequency dielectric properties in the BaTiO 3/poly(vinylidene fluoride)
nanocomposite films,” Appl. Phys. Lett., vol. 100, no. 1, 2012.
46
[16] M. Sharma, G. Madras, and S. Bose, “Contrasting Effects of Graphene Oxide
and Poly(ethylenimine) on the Polymorphism in Poly(vinylidene fluoride),”
Cryst. Growth Des., vol. 15, no. 7, pp. 3345–3355, 2015.
[17] L. Priya and J. P. Jog, “Poly(vinylidene fluoride)/clay nanocomposites prepared
by melt intercalation: Crystallization and dynamic mechanical behavior studies,”
J. Polym. Sci. Part B Polym. Phys., vol. 40, no. 15, pp. 1682–1689, 2002.
[18] R. Gonçalves, P. M. Martins, C. Caparrós, P. Martins, M. Benelmekki, G.
Botelho, S. Lanceros-Mendez, A. Lasheras, J. Gutiérrez, and J. M. Barandiarán,
“Nucleation of the electroactive β-phase, dielectric and magnetic response of
poly(vinylidene fluoride) composites with Fe2O 3 nanoparticles,” J. Non. Cryst.
Solids, vol. 361, no. 1, pp. 93–99, 2013.
[19] J. Li, S. Il Seok, B. Chu, F. Dogan, Q. Zhang, and Q. Wang, “Nanocomposites
of ferroelectric polymers with TiO2 nanoparticles exhibiting significantly
enhanced electrical energy density,” Adv. Mater., vol. 21, no. 2, pp. 217–221,
2009.
[20] L. Yang, J. Qiu, H. Ji, K. Zhu, and J. Wang, “Enhanced dielectric and
ferroelectric properties induced by TiO2@MWCNTs nanoparticles in flexible
poly(vinylidene fluoride) composites,” Compos. Part A Appl. Sci. Manuf., vol.
65, pp. 125–134, 2014.
[21] M. Arjmand, S. Sadeghi, M. Khajehpour, and U. Sundararaj, “Carbon
nanotube/graphene nanoribbon/polyvinylidene fluoride hybrid nanocomposites:
Rheological and dielectric properties,” J. Phys. Chem. C, vol. 121, no. 1, pp.
169–181, 2017.
[22] P. Martins, R. Gonçalves, S. Lanceros-Mendez, A. Lasheras, J. Gutiérrez, and J.
M. Barandiarán, “Effect of filler dispersion and dispersion method on the
piezoelectric and magnetoelectric response of CoFe2O4/P(VDF-TrFE)
nanocomposites,” Appl. Surf. Sci., vol. 313, pp. 215–219, 2014.
[23] D. Bhadra, S. C. Sarkar, and B. K. Chaudhuri, “RSC Advances Enhanced
dielectric and ferroelectric properties in NaTNO / PVDF nanocomposites : a
new flexible material for capacitor application,” RSC Adv., vol. 5, no.
December 2016, pp. 36924–36932, 2015.
[24] M. Yang, H. Zhao, D. He, C. Hu, H. Chen, and J. Bai, “Carbon coated boron
nitride nanosheets for polymer nanocomposites with enhanced dielectric
performance,” Materials (Basel)., vol. 10, no. 7, 2017.
[25] P. Thomas, S. Satapathy, K. Dwarakanath, and K. B. R. Varma, “Dielectric
properties of poly (vinylidene fluoride)/CaCu3Ti4O12 nanocrystal composite
thick films,” Express Polym. Lett., vol. 4, no. 10, pp. 632–643, 2010.
[26] C. Zhang, Q. Chi, J. Dong, Y. Cui, X. Wang, L. Liu, and Q. Lei, “Enhanced
dielectric properties of poly(vinylidene fluoride) composites filled with nano
iron oxide-deposited barium titanate hybrid particles,” Sci. Rep., vol. 6, no. June,
pp. 4–12, 2016.
47
[27] H. Luo, D. Zhang, C. Jiang, X. Yuan, C. Chen, and K. Zhou, “Improved
dielectric properties and energy storage density of poly(vinylidene
fluoride-co-hexafluoropropylene) nanocomposite with hydantoin epoxy resin
coated BaTiO3,” ACS Appl. Mater. Interfaces, vol. 7, no. 15, pp. 8061–8069,
2015.
[28] A. Toor, H. So, and A. P. Pisano, “Improved dielectric properties of
polyvinylidene fluoride nanocomposite embedded with poly(vinyl pyrrolidone)
coated gold nanoparticles,” ACS Appl. Mater. Interfaces, p. acsami.6b13900,
2017.
[29] K. Meeporn, P. Thongbai, T. Yamwong, and S. Maensiri, “Greatly enhanced
dielectric permittivity in La1.7Sr0.3NiO4/poly(vinylidene fluoride)
nanocomposites that retained a low loss tangent,” RSC Adv., vol. 7, no. 28, pp.
17128–17136, 2017.
[30] F. He, S. Lau, H. L. Chan, and J. Fan, “High dielectric permittivity and low
percolation threshold in nanocomposites based on poly(vinylidene fluoride) and
exfoliated graphite nanoplates,” Adv. Mater., vol. 21, no. 6, pp. 710–715, 2009.
[31] X. Huang, P. Jiang, and L. Xie, “Ferroelectric polymer/silver nanocomposites
with high dielectric constant and high thermal conductivity,” Appl. Phys. Lett.,
vol. 95, no. 24, pp. 1–4, 2009.
[32] M. Panda, V. Srinivas, and A. K. Thakur, “On the question of percolation
threshold in polyvinylidene fluoride/nanocrystalline nickel composites,” Appl.
Phys. Lett., vol. 92, no. 13, pp. 10–13, 2008.
[33] P. Anithakumari, B. P. Mandal, E. Abdelhamid, R. Naik, and A. K. Tyagi,
“Enhancement of dielectric, ferroelectric and magneto-dielectric properties in
PVDF–BaFe12O19 composites: a step towards miniaturizated electronic devices,”
RSC Adv., vol. 6, no. 19, pp. 16073–16080, 2016.
[34] J. Fu, Y. Hou, M. Zheng, Q. Wei, M. Zhu, and H. Yan, “Improving Dielectric
Properties of PVDF Composites by Employing Surface Modified Strong
Polarized BaTiO3 Particles Derived by Molten Salt Method,” ACS Appl. Mater.
Interfaces, vol. 7, no. 44, pp. 24480–24491, 2015.
[35] F. Wang, D. Zhou, and S. Gong, “Dielectric behavior of TiC-PVDF
nanocomposites,” Phys. Status Solidi - Rapid Res. Lett., vol. 3, no. 1, pp. 22–24,
2009.
[36] H. Sharifi Dehsari, A. Halda Ribeiro, B. Ersӧz, W. Tremel, G. Jakob, and K.
Asadi, “Effect of precursor concentration on size evolution of iron oxide
nanoparticles,” CrystEngComm, vol. 19, no. 1, pp. 6694–6702, 2017.
[37] H. Sharifi Dehsari, M. Heidari, A. Halda Ribeiro, W. Tremel, G. Jakob, D.
Donadio, R. Potestio, and K. Asadi, “Combined Experimental and Theoretical
Investigation of Heating Rate on Growth of Iron Oxide Nanoparticles,” Chem.
Mater., vol. 29, no. 22, pp. 9648–9656, 2017.
[38] M. Stewart, M. G. Cain, and D. Hall, “Ferroelectric Hysteresis Measurement &
Analysis,” NPL Rep. C., no. May, pp. 1–57, 1999.
48
[39] M. Li, I. Katsouras, C. Piliego, G. Glasser, I. Lieberwirth, P. W. M. Blom, and
D. M. de Leeuw, “Controlling the microstructure of poly(vinylidene-fluoride)
(PVDF) thin films for microelectronics,” J. Mater. Chem. C, vol. 1, no. 46, p.
7695, 2013.
[40] H. S. Dehsari, J. J. Michels, and K. Asadi, “Processing of ferroelectric polymers
for microelectronics: from morphological analysis to functional devices,” J.
Mater. Chem. C, vol. 5, pp. 10490–10497, 2017.
[41] C. E. Murphy, L. Yang, S. Ray, L. Yu, S. Knox, and N. Stingelin, “Wire-bar
coating of semiconducting polythiophene/insulating polyethylene blend thin
films for organic transistors,” J. Appl. Phys., vol. 110, no. 9, 2011.
[42] R. Prakash, R. J. Choudhary, L. S. Sharath Chandra, N. Lakshmi, and D. M.
Phase, “Electrical and magnetic transport properties of Fe3O4 thin films on a
GaAs(100) substrate,” J. Phys. Condens. Matter, vol. 19, no. 48, 2007.
[43] O. D. Jayakumar, B. P. Mandal, J. Majeed, G. Lawes, R. Naik, and A. K. Tyagi,
“Inorganic–organic multiferroic hybrid films of Fe3O4 and PVDF with
significant magneto-dielectric coupling,” J. Mater. Chem. C, vol. 1, no. 23, p.
3710, 2013.
[44] Y. Thakur, T. Zhang, C. Iacob, T. Yang, J. Bernholc, L. Q. Chen, J. Runt, and
Q. M. Zhang, “Enhancement of the dielectric response in polymer
nanocomposites with low dielectric constant fillers,” Nanoscale, vol. 3, pp.
10992–10997, 2017.
[45] X. Cai, T. Lei, D. Sun, and L. Lin, “A critical analysis of the α, β and γ phases
in poly(vinylidene fluoride) using FTIR,” RSC Adv., vol. 7, no. 25, pp. 15382–
15389, 2017.
[46] C. Ribeiro, V. Sencadas, J. L. G. Ribelles, and S. Lanceros-Méndez, “Influence
of processing conditions on polymorphism and nanofiber morphology of
electroactive poly(vinylidene fluoride) electrospun membranes,” Soft Mater.,
vol. 8, no. 3, pp. 274–287, 2010.
[47] P. Martins, C. M. Costa, and S. Lanceros-Mendez, “Nucleation of electroactive
ß-phase poly(vinilidene fluoride) with CoFe2O4 and NiFe2O4 nanofillers: A new
method for the preparation of multiferroic nanocomposites,” Appl. Phys. A
Mater. Sci. Process., vol. 103, no. 1, pp. 233–237, 2011.
[48] R. K. Layek, A. K. Das, M. J. Park, N. H. Kim, and J. H. Lee, “Enhancement of
physical, mechanical, and gas barrier properties in noncovalently functionalized
graphene oxide/poly(vinylidene fluoride) composites,” Carbon N. Y., vol. 81,
no. 1, pp. 329–338, 2015.
[49] P. Lunkenheimer, V. Bobnar, V. Bobnar, A. V. Pronin, A. V. Pronin, A. I. Ritus,
A. A. Volkov, and A. Loidl, “Origin of apparent colossal dielectric constants,”
Phys. Rev. B - Condens. Matter Mater. Phys., vol. 66, no. 5, pp. 521051–
521054, 2002.
[50] P. Thakur, A. Kool, B. Bagchi, S. Das, and P. Nandy, “Effect of in situ
synthesized Fe2O3 and Co3O4 nanoparticles on electroactive β phase
49
crystallization and dielectric properties of poly(vinylidene fluoride) thin films,”
Phys. Chem. Chem. Phys., vol. 17, no. 2, pp. 1368–1378, 2015.
[51] Y. N. Hao, K. Bi, S. O’Brien, X. X. Wang, J. Lombardi, F. Pearsall, W. L. Li,
M. Lei, Y. Wu, and L. T. Li, “Interface structure, precursor rheology and
dielectric properties of BaTiO3 /PVDF–hfp nanocomposite films prepared from
colloidal perovskite nanoparticles,” RSC Adv., vol. 7, no. 52, pp. 32886–32892,
2017.
[52] P. Fakhri, H. Mahmood, B. Jaleh, and A. Pegoretti, “Improved electroactive
phase content and dielectric properties of flexible PVDF nanocomposite films
filled with Au- and Cu-doped graphene oxide hybrid nanofiller,” Synth. Met.,
vol. 220, pp. 653–660, 2016.
[53] R. Gregorio, “Determination of the alpha, beta, and gamma crystalline phases
of poly(vinylidene fluoride) films prepared at different conditions,” J. Appl.
Polym. Sci., vol. 100, no. 4, pp. 3272–3279, 2006.
[54] T. Boccaccio, A. Bottino, G. Capannelli, and P. Piaggio, “Characterization of
PVDF membranes by vibrational spectroscopy,” J. Memb. Sci., vol. 210, no. 2,
pp. 315–329, 2002.
[55] P. Martins, A. C. Lopes, and S. Lanceros-Mendez, “Electroactive phases of
poly(vinylidene fluoride): Determination, processing and applications,” Prog.
Polym. Sci., vol. 39, no. 4, pp. 683–706, 2014.
[56] E. El Shafee, M. El Gamal, and M. Isa, “Electrical properties of multi walled
carbon nanotubes/ poly(vinylidene fluoride/trifluoroethylene) nanocomposites,”
J. Polym. Res., vol. 19, no. 1, pp. 1–8, 2012.
[57] L. Xie, X. Huang, K. Yang, S. Li, and P. Jiang, “‘Grafting to’ route to
PVDF-HFP-GMA/BaTiO3 nanocomposites with high dielectric constant and
high thermal conductivity for energy storage and thermal management
applications,” J. Mater. Chem. A, vol. 2, no. 15, p. 5244, 2014.
[58] M. Zhu, X. Huang, K. Yang, X. Zhai, J. Zhang, J. He, and P. Jiang, “Energy
storage in ferroelectric polymer nanocomposites filled with core-shell structured
polymer@BaTiO3 nanoparticles: Understanding the role of polymer shells in
the interfacial regions,” ACS Appl. Mater. Interfaces, vol. 6, no. 22, pp. 19644–
19654, 2014.
[59] S. Firmino Mendes, C. M. Costa, V. Sencadas, J. Serrado Nunes, P. Costa, R.
Gregorio, and S. Lanceros-Méndez, “Effect of the ceramic grain size and
concentration on the dynamical mechanical and dielectric behavior of
poly(vinilidene fluoride)/Pb(Zr0.53Ti0.47)O3 composites,” Appl. Phys. A Mater.
Sci. Process., vol. 96, no. 4, pp. 899–908, 2009.
50
Acknowledgment
I would like to thank my thesis advisor, Dr. Kamal Asadi who gave me this
opportunity to do this project. He spent countless hours in the lab explaining and
showing me how to do everything and for sacrificing his time to help me. I am very
grateful for his scientific advice and knowledge and many insightful discussions and
suggestions. I would like to express my deepest appreciation to Hamed Sharifi Dehsari
who served as my supervisor and provided invaluable guidance. I always feel I have
been extremely lucky to have a supervisor who cared so much about my work, and
who responded to my questions and queries so promptly. I wish him further success in
his all endeavors.
I express my sincere gratitude to Prof. Uli Lemmer who act as my thesis advisor and
has been a great teacher. Prof. Uli Lemmer has always been helpful in providing
advice many times during my master study in KSOP. He was and remains my best role
model for a scientist, mentor, and teacher.
I would like to express my thanks to Gunnar Glaßer, Verona Maus, Michael Steiert,
Frank Keller and Christian Bauer who provided technical support and helped me in
handling the instruments. In particular I would like to thank all the group members
from Dr. Kamal Asadi for their great support. I enjoyed stimulating research
discussions with them.
Finally, I would like to thank my parents for their love and continuous support.
Without their encouragement and support, I doubt that I would be in this place today.