Research and Development of Orbital Debris Removal … · Research and Development of Orbital...
11
35 Vol. 49 No. 1 2016 Research and Development of Orbital Debris Removal using Low Density Material TASAKI Mitsuhiko : Kyushu University HAMADA Hiroaki : Kyushu University AE Kazuaki : Kyushu University DOI Akira : Kyushu University HANADA Toshiya : Professor Dr., Kyushu University KITAZAWA Yukihito : Professor Dr., Kyushu Institute of Technology Manager, Aero-Engine & Space Operations, IHI Corporation Currently, the danger due to debris in earth orbit is increasing. Furthermore, methods for the removal of such orbital debris have become the subject of attention. This paper proposes a concept for passive Orbital Debris Removal (ODR). In the passive ODR described in this research, a large area of polyimide foil is opened. Low earth orbit micro-debris decelerate due to their passing through the opened foil, and eventually reenter the atmosphere. In order to achieve efficient debris removal, as part of this research an unfolding mechanism has been invented that can open a large area of polyimide foil in low earth orbit. To demonstrate the effectiveness of this orbital debris removal concept, an event equivalent to the breaking up of a satellite by Chinese anti-satellite testing has been assumed. In order to give consideration to the perturbation of the orbital debris removal spacecraft, removal effectiveness was compared with regard to the direction of orbit injection, the effective cross sectional area, and orbit injection time as parameters. 1. Introduction The accidental collision between American and Russian communication satellites in 2009 generated a large amount of orbital debris (space debris) and aroused interest in orbital debris removal. The collision of two complete artificial satellites in an orbit was unprecedented. Previously, China destroyed a satellite (Fengyun 1C) as an experiment using a destructive weapon. The orbital debris environment has drastically changed. The Chinese experiment that destroyed the Fengyun 1C satellite generated at least 150 000 pieces of 1 cm or larger, and the collision between the American and Russian communication satellites generated at least 60 000 pieces of debris in sizes of 1 cm or larger. It is likely that hundreds of millions of pieces of debris in even smaller sizes of 100 mm or less were generated by these two incidents. Orbital debris is therefore a threat to space development because even debris in tiny sizes of 100 mm that collides with an operating spacecraft, can damage that spacecraft seriously enough to disable it. There are mainly two methods for orbital debris removal also called Orbital Debris Removal (ODR). One method utilizes artificial satellites and the other is a ground-based method using laser irradiation. The method using satellites can be further classified into Active Debris Removal (ADR) and Passive Debris Removal (PDR). ADR is effective for individual collection of a small number of large pieces of debris but applying ADR to micro-debris is not practical because there are too many pieces of micro-debris to allow accurately identifying all of their respective orbits. The PDR method on the other hand is effective for removing micro-debris because it collectively removes debris by allowing the debris to collide with a substance extended over a wide area in an orbit with a high flux (flow rate of debris). This research proposes satellite systems for the PDR and verifies debris removal effects of respective PDR satellites with the aim of removing micro-debris which has grown sharply in number in recent years and poses an increasing risk of collisions. The proposed satellite systems are based on a concept of making the micro-debris reenter the atmosphere in a manner that decelerates micro-debris without destroying it by allowing it to pass through a low density material extending over a large area unfolded in orbit. Figure 1 shows concept diagrams of PDR satellites. In his previous research, Ariyoshi verified a simple method to remove background debris by using fluxes at different altitudes. However, no analyses have been conducted to verify these micro-debris removal methods on the basis of a satellite breakup model. (1) Hirayama proposed a micro-debris removal method using polyimide foil and calculated the foil thickness needed to decelerate the micro-debris. However, he only introduced two examples of effective cross sectional areas and did not verify methods for storing the polyimide foil in a rocket and unfolding it in space. (2) Therefore, this research aims at verifying the effects of the micro-debris removal method by efficient use of polyimide foil on the basis of the breakup model. There are three possible techniques for debris removal satellites: ① access and removal of a large debris, ② collective removal of a group of small debris, and ③ removal of
Transcript of Research and Development of Orbital Debris Removal … · Research and Development of Orbital...
35Vo l . 4 9 N o . 1 2 016
Research and Development of Orbital Debris Removal
using Low Density Material
TASAKI Mitsuhiko : Kyushu University HAMADA Hiroaki : Kyushu University AE Kazuaki : Kyushu University DOI Akira : Kyushu University HANADA Toshiya : Professor Dr., Kyushu University KITAZAWA Yukihito : Professor Dr., Kyushu Institute of Technology Manager, Aero-Engine & Space Operations, IHI Corporation
Currently, the danger due to debris in earth orbit is increasing. Furthermore, methods for the removal of such orbital debris have become the subject of attention. This paper proposes a concept for passive Orbital Debris Removal (ODR). In the passive ODR described in this research, a large area of polyimide foil is opened. Low earth orbit micro-debris decelerate due to their passing through the opened foil, and eventually reenter the atmosphere. In order to achieve efficient debris removal, as part of this research an unfolding mechanism has been invented that can open a large area of polyimide foil in low earth orbit. To demonstrate the effectiveness of this orbital debris removal concept, an event equivalent to the breaking up of a satellite by Chinese anti-satellite testing has been assumed. In order to give consideration to the perturbation of the orbital debris removal spacecraft, removal effectiveness was compared with regard to the direction of orbit injection, the effective cross sectional area, and orbit injection time as parameters.
1. Introduction
The accidental collision between American and Russian communication satellites in 2009 generated a large amount of orbital debris (space debris) and aroused interest in orbital debris removal. The collision of two complete artificial satellites in an orbit was unprecedented. Previously, China destroyed a satellite (Fengyun 1C) as an experiment using a destructive weapon. The orbital debris environment has drastically changed. The Chinese experiment that destroyed the Fengyun 1C satellite generated at least 150 000 pieces of 1 cm or larger, and the collision between the American and Russian communication satellites generated at least 60 000 pieces of debris in sizes of 1 cm or larger. It is likely that hundreds of millions of pieces of debris in even smaller sizes of 100 mm or less were generated by these two incidents. Orbital debris is therefore a threat to space development because even debris in tiny sizes of 100 mm that collides with an operating spacecraft, can damage that spacecraft seriously enough to disable it.
There are mainly two methods for orbital debris removal also called Orbital Debris Removal (ODR). One method utilizes artificial satellites and the other is a ground-based method using laser irradiation. The method using satellites can be further classified into Active Debris Removal (ADR) and Passive Debris Removal (PDR). ADR is effective for individual collection of a small number of large pieces of debris but applying ADR to micro-debris is not practical because there are too many pieces of micro-debris to allow accurately identifying all of their respective orbits.
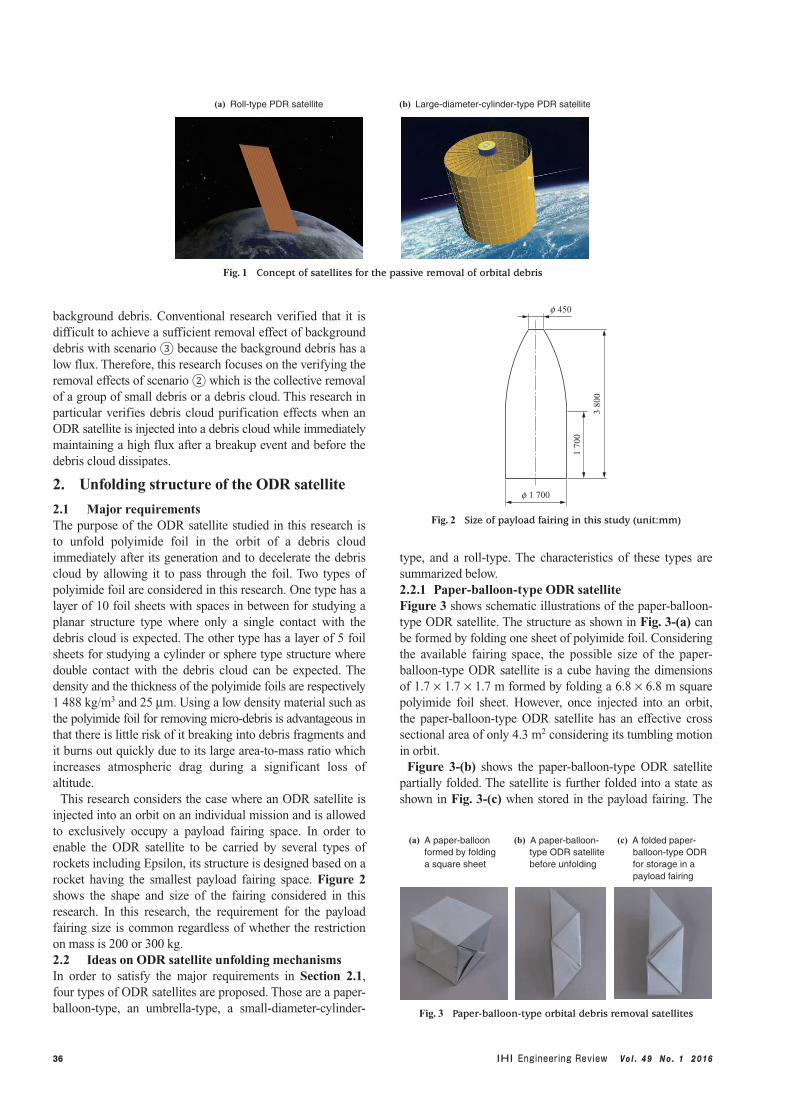
The PDR method on the other hand is effective for removing micro-debris because it collectively removes debris by allowing the debris to collide with a substance extended over a wide area in an orbit with a high flux (flow rate of debris). This research proposes satellite systems for the PDR and verifies debris removal effects of respective PDR satellites with the aim of removing micro-debris which has grown sharply in number in recent years and poses an increasing risk of collisions. The proposed satellite systems are based on a concept of making the micro-debris reenter the atmosphere in a manner that decelerates micro-debris without destroying it by allowing it to pass through a low density material extending over a large area unfolded in orbit. Figure 1 shows concept diagrams of PDR satellites.
In his previous research, Ariyoshi verified a simple method to remove background debris by using fluxes at different altitudes. However, no analyses have been conducted to verify these micro-debris removal methods on the basis of a satellite breakup model.(1) Hirayama proposed a micro-debris removal method using polyimide foil and calculated the foil thickness needed to decelerate the micro-debris. However, he only introduced two examples of effective cross sectional areas and did not verify methods for storing the polyimide foil in a rocket and unfolding it in space.(2) Therefore, this research aims at verifying the effects of the micro-debris removal method by efficient use of polyimide foil on the basis of the breakup model.
There are three possible techniques for debris removal satellites: ① access and removal of a large debris, ② collective removal of a group of small debris, and ③ removal of
36 Vo l . 4 9 N o . 1 2 016
background debris. Conventional research verified that it is difficult to achieve a sufficient removal effect of background debris with scenario ③ because the background debris has a low flux. Therefore, this research focuses on the verifying the removal effects of scenario ② which is the collective removal of a group of small debris or a debris cloud. This research in particular verifies debris cloud purification effects when an ODR satellite is injected into a debris cloud while immediately maintaining a high flux after a breakup event and before the debris cloud dissipates.
2. Unfolding structure of the ODR satellite
2.1 Major requirementsThe purpose of the ODR satellite studied in this research is to unfold polyimide foil in the orbit of a debris cloud immediately after its generation and to decelerate the debris cloud by allowing it to pass through the foil. Two types of polyimide foil are considered in this research. One type has a layer of 10 foil sheets with spaces in between for studying a planar structure type where only a single contact with the debris cloud is expected. The other type has a layer of 5 foil sheets for studying a cylinder or sphere type structure where double contact with the debris cloud can be expected. The density and the thickness of the polyimide foils are respectively 1 488 kg/m3 and 25 mm. Using a low density material such as the polyimide foil for removing micro-debris is advantageous in that there is little risk of it breaking into debris fragments and it burns out quickly due to its large area-to-mass ratio which increases atmospheric drag during a significant loss of altitude.
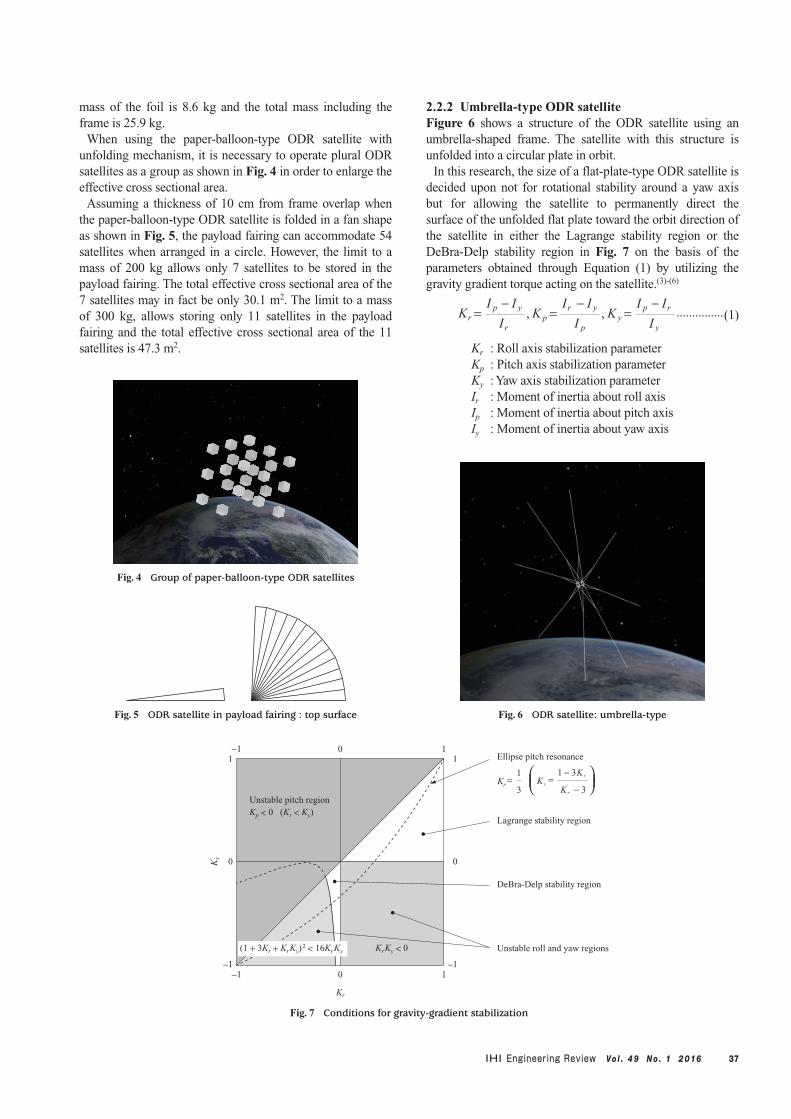
This research considers the case where an ODR satellite is injected into an orbit on an individual mission and is allowed to exclusively occupy a payload fairing space. In order to enable the ODR satellite to be carried by several types of rockets including Epsilon, its structure is designed based on a rocket having the smallest payload fairing space. Figure 2 shows the shape and size of the fairing considered in this research. In this research, the requirement for the payload fairing size is common regardless of whether the restriction on mass is 200 or 300 kg. 2.2 Ideas on ODR satellite unfolding mechanismsIn order to satisfy the major requirements in Section 2.1, four types of ODR satellites are proposed. Those are a paper-balloon-type, an umbrella-type, a small-diameter-cylinder-
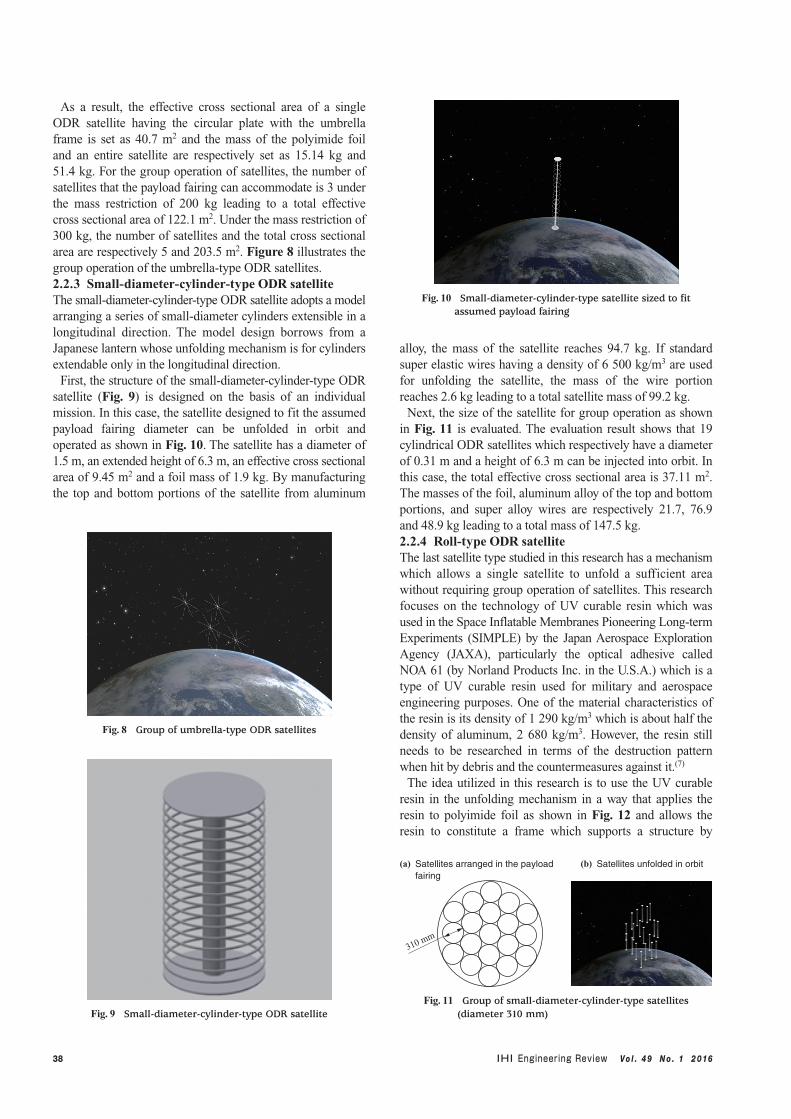
type, and a roll-type. The characteristics of these types are summarized below.2.2.1 Paper-balloon-type ODR satelliteFigure 3 shows schematic illustrations of the paper-balloon-type ODR satellite. The structure as shown in Fig. 3-(a) can be formed by folding one sheet of polyimide foil. Considering the available fairing space, the possible size of the paper-balloon-type ODR satellite is a cube having the dimensions of 1.7 × 1.7 × 1.7 m formed by folding a 6.8 × 6.8 m square polyimide foil sheet. However, once injected into an orbit, the paper-balloon-type ODR satellite has an effective cross sectional area of only 4.3 m2 considering its tumbling motion in orbit.
Figure 3-(b) shows the paper-balloon-type ODR satellite partially folded. The satellite is further folded into a state as shown in Fig. 3-(c) when stored in the payload fairing. The
(a) A paper-balloon formed by folding a square sheet
(b) A paper-balloon- type ODR satellite before unfolding
(c) A folded paper- balloon-type ODR for storage in a payload fairing
Fig. 3 Paper-balloon-type orbital debris removal satellites
3 80
0
1 70
0
f 1 700
f 450
Fig. 2 Size of payload fairing in this study (unit:mm)
(a) Roll-type PDR satellite (b) Large-diameter-cylinder-type PDR satellite
Fig. 1 Concept of satellites for the passive removal of orbital debris
37Vo l . 4 9 N o . 1 2 016
mass of the foil is 8.6 kg and the total mass including the frame is 25.9 kg.
When using the paper-balloon-type ODR satellite with unfolding mechanism, it is necessary to operate plural ODR satellites as a group as shown in Fig. 4 in order to enlarge the effective cross sectional area.
Assuming a thickness of 10 cm from frame overlap when the paper-balloon-type ODR satellite is folded in a fan shape as shown in Fig. 5, the payload fairing can accommodate 54 satellites when arranged in a circle. However, the limit to a mass of 200 kg allows only 7 satellites to be stored in the payload fairing. The total effective cross sectional area of the 7 satellites may in fact be only 30.1 m2. The limit to a mass of 300 kg, allows storing only 11 satellites in the payload fairing and the total effective cross sectional area of the 11 satellites is 47.3 m2.
2.2.2 Umbrella-type ODR satelliteFigure 6 shows a structure of the ODR satellite using an umbrella-shaped frame. The satellite with this structure is unfolded into a circular plate in orbit.
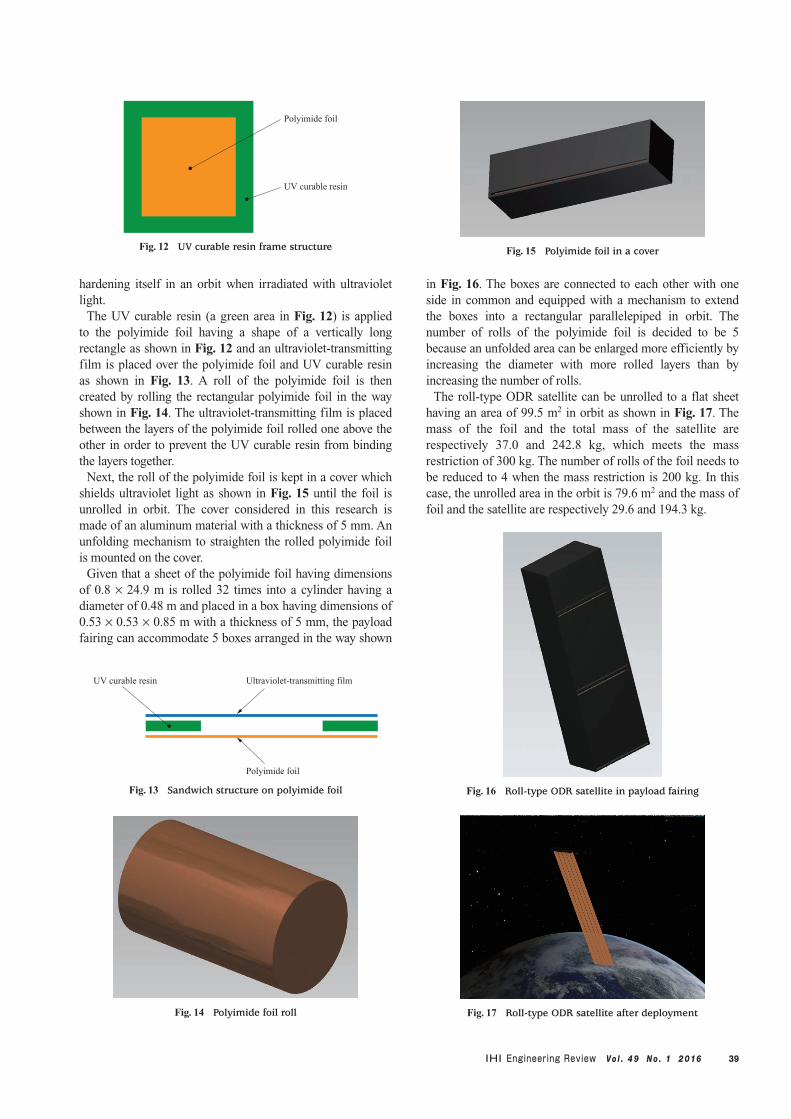
In this research, the size of a flat-plate-type ODR satellite is decided upon not for rotational stability around a yaw axis but for allowing the satellite to permanently direct the surface of the unfolded flat plate toward the orbit direction of the satellite in either the Lagrange stability region or the DeBra-Delp stability region in Fig. 7 on the basis of the parameters obtained through Equation (1) by utilizing the gravity gradient torque acting on the satellite.(3)-(6)
KI I
Iyp r
y
=−I I
Ip y
r
=−
, ,Kr K p
I I
Ir y
p
=−
...............(1)
Kr : Roll axis stabilization parameterKp : Pitch axis stabilization parameterKy : Yaw axis stabilization parameterIr : Moment of inertia about roll axisIp : Moment of inertia about pitch axisIy : Moment of inertia about yaw axis
Fig. 4 Group of paper-balloon-type ODR satellites
Fig. 6 ODR satellite: umbrella-typeFig. 5 ODR satellite in payload fairing : top surface
−1
−1−1 −1
0
0
0 0
1 11
1
Ky
Kr
Unstable pitch regionKp < 0 (Kr < Ky)
Lagrange stability region
DeBra-Delp stability region
Unstable roll and yaw regionsKrKy < 0
Ellipse pitch resonance
Kp=
1
3
(1 + 3Kr + KrKy)2 < 16KrKy
1 3K
K
Ky
r
r
=−
−
3
Fig. 7 Conditions for gravity-gradient stabilization
38 Vo l . 4 9 N o . 1 2 016
As a result, the effective cross sectional area of a single ODR satellite having the circular plate with the umbrella frame is set as 40.7 m2 and the mass of the polyimide foil and an entire satellite are respectively set as 15.14 kg and 51.4 kg. For the group operation of satellites, the number of satellites that the payload fairing can accommodate is 3 under the mass restriction of 200 kg leading to a total effective cross sectional area of 122.1 m2. Under the mass restriction of 300 kg, the number of satellites and the total cross sectional area are respectively 5 and 203.5 m2. Figure 8 illustrates the group operation of the umbrella-type ODR satellites.2.2.3 Small-diameter-cylinder-type ODR satelliteThe small-diameter-cylinder-type ODR satellite adopts a model arranging a series of small-diameter cylinders extensible in a longitudinal direction. The model design borrows from a Japanese lantern whose unfolding mechanism is for cylinders extendable only in the longitudinal direction.
First, the structure of the small-diameter-cylinder-type ODR satellite (Fig. 9) is designed on the basis of an individual mission. In this case, the satellite designed to fit the assumed payload fairing diameter can be unfolded in orbit and operated as shown in Fig. 10. The satellite has a diameter of 1.5 m, an extended height of 6.3 m, an effective cross sectional area of 9.45 m2 and a foil mass of 1.9 kg. By manufacturing the top and bottom portions of the satellite from aluminum
alloy, the mass of the satellite reaches 94.7 kg. If standard super elastic wires having a density of 6 500 kg/m3 are used for unfolding the satellite, the mass of the wire portion reaches 2.6 kg leading to a total satellite mass of 99.2 kg.
Next, the size of the satellite for group operation as shown in Fig. 11 is evaluated. The evaluation result shows that 19 cylindrical ODR satellites which respectively have a diameter of 0.31 m and a height of 6.3 m can be injected into orbit. In this case, the total effective cross sectional area is 37.11 m2. The masses of the foil, aluminum alloy of the top and bottom portions, and super alloy wires are respectively 21.7, 76.9 and 48.9 kg leading to a total mass of 147.5 kg.2.2.4 Roll-type ODR satelliteThe last satellite type studied in this research has a mechanism which allows a single satellite to unfold a sufficient area without requiring group operation of satellites. This research focuses on the technology of UV curable resin which was used in the Space Inflatable Membranes Pioneering Long-term Experiments (SIMPLE) by the Japan Aerospace Exploration Agency (JAXA), particularly the optical adhesive called NOA 61 (by Norland Products Inc. in the U.S.A.) which is a type of UV curable resin used for military and aerospace engineering purposes. One of the material characteristics of the resin is its density of 1 290 kg/m3 which is about half the density of aluminum, 2 680 kg/m3. However, the resin still needs to be researched in terms of the destruction pattern when hit by debris and the countermeasures against it.(7)
The idea utilized in this research is to use the UV curable resin in the unfolding mechanism in a way that applies the resin to polyimide foil as shown in Fig. 12 and allows the resin to constitute a frame which supports a structure by
Fig. 8 Group of umbrella-type ODR satellites
Fig. 9 Small-diameter-cylinder-type ODR satellite
Fig. 10 Small-diameter-cylinder-type satellite sized to fit assumed payload fairing
(a) Satellites arranged in the payload fairing
(b) Satellites unfolded in orbit
310 mm
Fig. 11 Group of small-diameter-cylinder-type satellites (diameter 310 mm)
39Vo l . 4 9 N o . 1 2 016
hardening itself in an orbit when irradiated with ultraviolet light.
The UV curable resin (a green area in Fig. 12) is applied to the polyimide foil having a shape of a vertically long rectangle as shown in Fig. 12 and an ultraviolet-transmitting film is placed over the polyimide foil and UV curable resin as shown in Fig. 13. A roll of the polyimide foil is then created by rolling the rectangular polyimide foil in the way shown in Fig. 14. The ultraviolet-transmitting film is placed between the layers of the polyimide foil rolled one above the other in order to prevent the UV curable resin from binding the layers together.
Next, the roll of the polyimide foil is kept in a cover which shields ultraviolet light as shown in Fig. 15 until the foil is unrolled in orbit. The cover considered in this research is made of an aluminum material with a thickness of 5 mm. An unfolding mechanism to straighten the rolled polyimide foil is mounted on the cover.
Given that a sheet of the polyimide foil having dimensions of 0.8 × 24.9 m is rolled 32 times into a cylinder having a diameter of 0.48 m and placed in a box having dimensions of 0.53 × 0.53 × 0.85 m with a thickness of 5 mm, the payload fairing can accommodate 5 boxes arranged in the way shown
in Fig. 16. The boxes are connected to each other with one side in common and equipped with a mechanism to extend the boxes into a rectangular parallelepiped in orbit. The number of rolls of the polyimide foil is decided to be 5 because an unfolded area can be enlarged more efficiently by increasing the diameter with more rolled layers than by increasing the number of rolls.
The roll-type ODR satellite can be unrolled to a flat sheet having an area of 99.5 m2 in orbit as shown in Fig. 17. The mass of the foil and the total mass of the satellite are respectively 37.0 and 242.8 kg, which meets the mass restriction of 300 kg. The number of rolls of the foil needs to be reduced to 4 when the mass restriction is 200 kg. In this case, the unrolled area in the orbit is 79.6 m2 and the mass of foil and the satellite are respectively 29.6 and 194.3 kg.
UV curable resin
Polyimide foil
Fig. 12 UV curable resin frame structure
Fig. 14 Polyimide foil roll
Ultraviolet-transmitting film
Polyimide foil
UV curable resin
Fig. 13 Sandwich structure on polyimide foil
Fig. 15 Polyimide foil in a cover
Fig. 16 Roll-type ODR satellite in payload fairing
Fig. 17 Roll-type ODR satellite after deployment
40 Vo l . 4 9 N o . 1 2 016
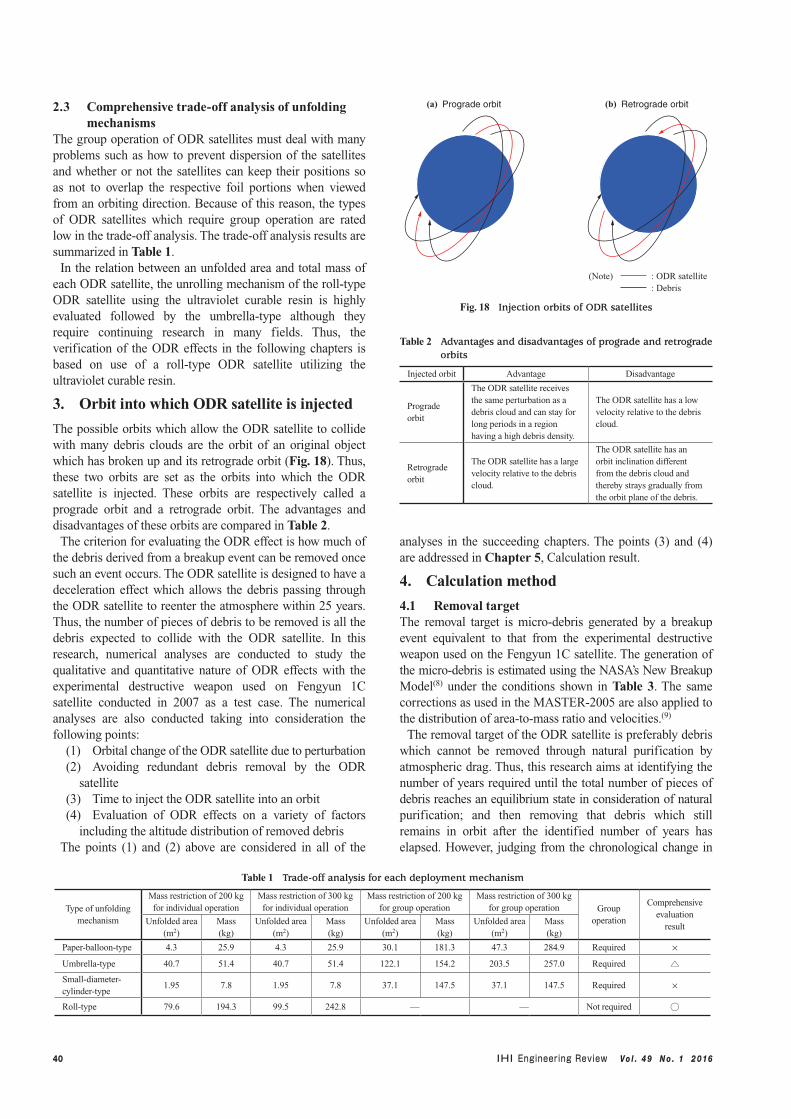
2.3 Comprehensive trade-off analysis of unfolding mechanisms
The group operation of ODR satellites must deal with many problems such as how to prevent dispersion of the satellites and whether or not the satellites can keep their positions so as not to overlap the respective foil portions when viewed from an orbiting direction. Because of this reason, the types of ODR satellites which require group operation are rated low in the trade-off analysis. The trade-off analysis results are summarized in Table 1.
In the relation between an unfolded area and total mass of each ODR satellite, the unrolling mechanism of the roll-type ODR satellite using the ultraviolet curable resin is highly evaluated followed by the umbrella-type although they require continuing research in many fields. Thus, the verification of the ODR effects in the following chapters is based on use of a roll-type ODR satellite utilizing the ultraviolet curable resin.
3. Orbit into which ODR satellite is injected
The possible orbits which allow the ODR satellite to collide with many debris clouds are the orbit of an original object which has broken up and its retrograde orbit (Fig. 18). Thus, these two orbits are set as the orbits into which the ODR satellite is injected. These orbits are respectively called a prograde orbit and a retrograde orbit. The advantages and disadvantages of these orbits are compared in Table 2.
The criterion for evaluating the ODR effect is how much of the debris derived from a breakup event can be removed once such an event occurs. The ODR satellite is designed to have a deceleration effect which allows the debris passing through the ODR satellite to reenter the atmosphere within 25 years. Thus, the number of pieces of debris to be removed is all the debris expected to collide with the ODR satellite. In this research, numerical analyses are conducted to study the qualitative and quantitative nature of ODR effects with the experimental destructive weapon used on Fengyun 1C satellite conducted in 2007 as a test case. The numerical analyses are also conducted taking into consideration the following points:
(1) Orbital change of the ODR satellite due to perturbation(2) Avoiding redundant debris removal by the ODR
satellite(3) Time to inject the ODR satellite into an orbit(4) Evaluation of ODR effects on a variety of factors
including the altitude distribution of removed debrisThe points (1) and (2) above are considered in all of the
analyses in the succeeding chapters. The points (3) and (4) are addressed in Chapter 5, Calculation result.
4. Calculation method
4.1 Removal targetThe removal target is micro-debris generated by a breakup event equivalent to that from the experimental destructive weapon used on the Fengyun 1C satellite. The generation of the micro-debris is estimated using the NASA’s New Breakup Model(8) under the conditions shown in Table 3. The same corrections as used in the MASTER-2005 are also applied to the distribution of area-to-mass ratio and velocities.(9)
The removal target of the ODR satellite is preferably debris which cannot be removed through natural purification by atmospheric drag. Thus, this research aims at identifying the number of years required until the total number of pieces of debris reaches an equilibrium state in consideration of natural purification; and then removing that debris which still remains in orbit after the identified number of years has elapsed. However, judging from the chronological change in
Table 1 Trade-off analysis for each deployment mechanism
Type of unfolding mechanism
Mass restriction of 200 kg for individual operation
Mass restriction of 300 kg for individual operation
Mass restriction of 200 kg for group operation
Mass restriction of 300 kg for group operation Group
operation
Comprehensive evaluation
resultUnfolded area
(m2)Mass(kg)
Unfolded area(m2)
Mass(kg)
Unfolded area(m2)
Mass(kg)
Unfolded area(m2)
Mass(kg)
Paper-balloon-type 4.3 25.9 4.3 25.9 30.1 181.3 47.3 284.9 Required ×
Umbrella-type 40.7 51.4 40.7 51.4 122.1 154.2 203.5 257.0 Required
Small-diameter-cylinder-type
1.95 7.8 1.95 7.8 37.1 147.5 37.1 147.5 Required ×
Roll-type 79.6 194.3 99.5 242.8 — — Not required
(a) Prograde orbit (b) Retrograde orbit
(Note) : ODR satellite : Debris
Fig. 18 Injection orbits of ODR satellites
Table 2 Advantages and disadvantages of prograde and retrograde orbits
Injected orbit Advantage Disadvantage
Prograde orbit
The ODR satellite receives the same perturbation as a debris cloud and can stay for long periods in a region having a high debris density.
The ODR satellite has a low velocity relative to the debris cloud.
Retrograde orbit
The ODR satellite has a large velocity relative to the debris cloud.
The ODR satellite has an orbit inclination different from the debris cloud and thereby strays gradually from the orbit plane of the debris.
41Vo l . 4 9 N o . 1 2 016
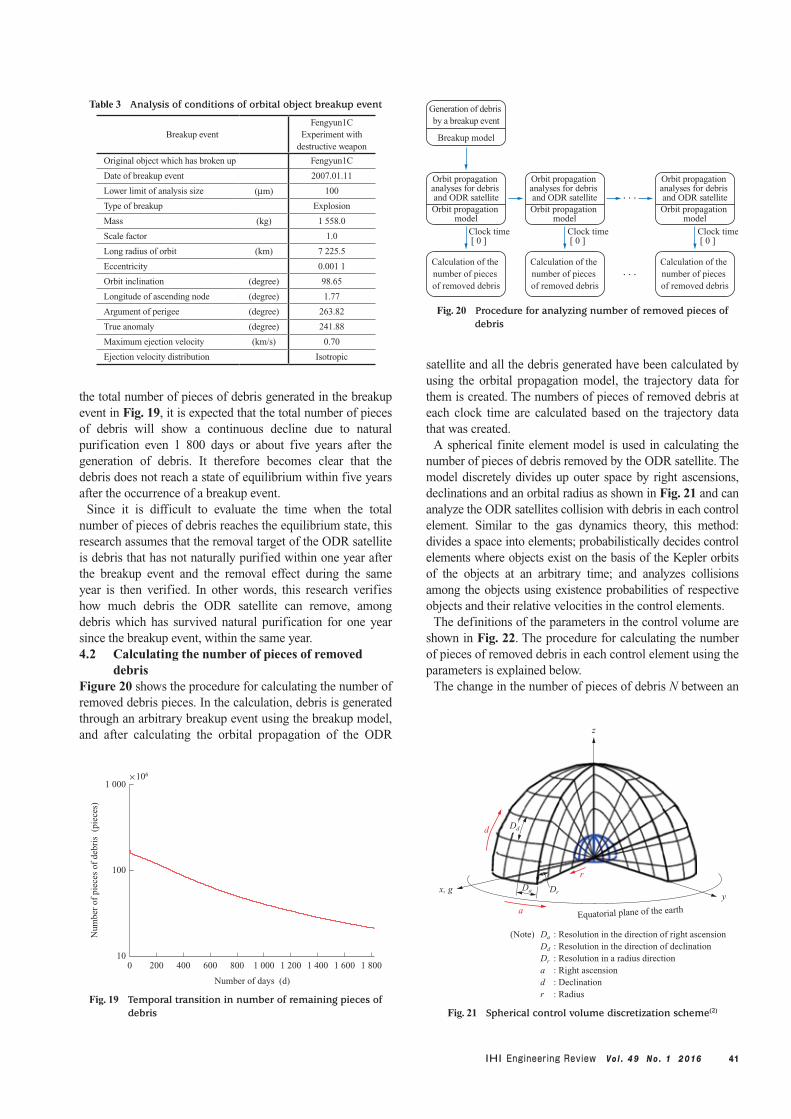
the total number of pieces of debris generated in the breakup event in Fig. 19, it is expected that the total number of pieces of debris will show a continuous decline due to natural purification even 1 800 days or about five years after the generation of debris. It therefore becomes clear that the debris does not reach a state of equilibrium within five years after the occurrence of a breakup event.
Since it is difficult to evaluate the time when the total number of pieces of debris reaches the equilibrium state, this research assumes that the removal target of the ODR satellite is debris that has not naturally purified within one year after the breakup event and the removal effect during the same year is then verified. In other words, this research verifies how much debris the ODR satellite can remove, among debris which has survived natural purification for one year since the breakup event, within the same year.4.2 Calculating the number of pieces of removed
debrisFigure 20 shows the procedure for calculating the number of removed debris pieces. In the calculation, debris is generated through an arbitrary breakup event using the breakup model, and after calculating the orbital propagation of the ODR
satellite and all the debris generated have been calculated by using the orbital propagation model, the trajectory data for them is created. The numbers of pieces of removed debris at each clock time are calculated based on the trajectory data that was created.
A spherical finite element model is used in calculating the number of pieces of debris removed by the ODR satellite. The model discretely divides up outer space by right ascensions, declinations and an orbital radius as shown in Fig. 21 and can analyze the ODR satellites collision with debris in each control element. Similar to the gas dynamics theory, this method: divides a space into elements; probabilistically decides control elements where objects exist on the basis of the Kepler orbits of the objects at an arbitrary time; and analyzes collisions among the objects using existence probabilities of respective objects and their relative velocities in the control elements.
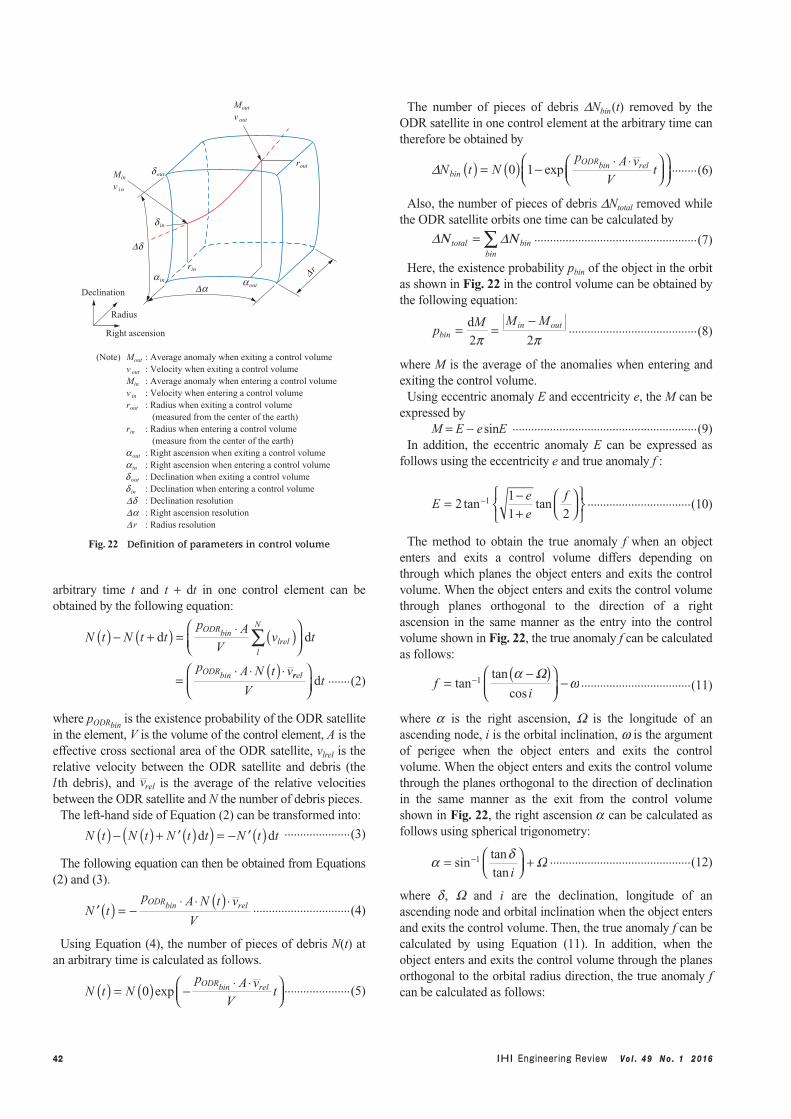
The definitions of the parameters in the control volume are shown in Fig. 22. The procedure for calculating the number of pieces of removed debris in each control element using the parameters is explained below.
The change in the number of pieces of debris N between an
1 000
100
100 200 400 600 800 1 000 1 200 1 400 1 600 1 800
Number of days (d)
Num
ber
of p
iece
s of
deb
ris
(pi
eces
)
×106
Fig. 19 Temporal transition in number of remaining pieces of debris
Generation of debris by a breakup event
Clock time [ 0 ]
Calculation of the number of pieces of removed debris
Calculation of the number of pieces of removed debris
Calculation of the number of pieces of removed debris
Breakup model
Orbit propagation analyses for debris and ODR satelliteOrbit propagation
model
Orbit propagation analyses for debris and ODR satelliteOrbit propagation
model
Orbit propagation analyses for debris and ODR satelliteOrbit propagation
model
Clock time [ 0 ]
Clock time [ 0 ]
・・・
・・・
Fig. 20 Procedure for analyzing number of removed pieces of debris
DrDa
Ddd
a
x, gy
z
r
Equatorial plane of the earth
(Note) Da : Resolution in the direction of right ascension Dd : Resolution in the direction of declination Dr : Resolution in a radius direction a : Right ascension d : Declination r : Radius
Fig. 21 Spherical control volume discretization scheme(2)
Table 3 Analysis of conditions of orbital object breakup event
Breakup eventFengyun1C
Experiment with destructive weapon
Original object which has broken up Fengyun1C
Date of breakup event 2007.01.11
Lower limit of analysis size (mm) 100
Type of breakup Explosion
Mass (kg) 1 558.0
Scale factor 1.0
Long radius of orbit (km) 7 225.5
Eccentricity 0.001 1
Orbit inclination (degree) 98.65
Longitude of ascending node (degree) 1.77
Argument of perigee (degree) 263.82
True anomaly (degree) 241.88
Maximum ejection velocity (km/s) 0.70
Ejection velocity distribution Isotropic
42 Vo l . 4 9 N o . 1 2 016
arbitrary time t and t + dt in one control element can be obtained by the following equation:
− +N t N t dtp A
Vv dt
ODRbinlrel
l
N
( ) ( ) = ⋅ ( )
∑
p A N t vODRbin=⋅ ⋅ ( )⋅ rrel
Vdt
.......(2)
where pODRbin is the existence probability of the ODR satellite
in the element, V is the volume of the control element, A is the effective cross sectional area of the ODR satellite, vlrel is the relative velocity between the ODR satellite and debris (the l th debris), and vrel is the average of the relative velocities between the ODR satellite and N the number of debris pieces.
The left-hand side of Equation (2) can be transformed into:
N t N t N t dt N t dt( ) − ( ) + ′ ( )( ) = − ′ ( ) .....................(3)
The following equation can then be obtained from Equations (2) and (3).
′ ( ) = −⋅ ⋅ ( )⋅
N tp A N t v
V
ODRbin rel ...............................(4)
Using Equation (4), the number of pieces of debris N(t) at an arbitrary time is calculated as follows.
N t Np A v
Vt
ODRbin rel( ) = ( ) − ⋅ ⋅
0 exp .....................(5)
The number of pieces of debris DNbin (t) removed by the ODR satellite in one control element at the arbitrary time can therefore be obtained by
DN t Np A v
Vtbin
ODRbin rel( ) = ( ) − ⋅ ⋅
0 1 exp ........(6)
Also, the number of pieces of debris DNtotal removed while the ODR satellite orbits one time can be calculated by
DN DNtotal binbin
= ∑ ....................................................(7)
Here, the existence probability pbin of the object in the orbit as shown in Fig. 22 in the control volume can be obtained by the following equation:
pdM M M
binin out= =
−2 2p p
.........................................(8)
where M is the average of the anomalies when entering and exiting the control volume.
Using eccentric anomaly E and eccentricity e, the M can be expressed by
M = E - e sinE ...........................................................(9)In addition, the eccentric anomaly E can be expressed as
follows using the eccentricity e and true anomaly f :
Ee
e
f= −+
−21
1 21tan tan .................................(10)
The method to obtain the true anomaly f when an object enters and exits a control volume differs depending on through which planes the object enters and exits the control volume. When the object enters and exits the control volume through planes orthogonal to the direction of a right ascension in the same manner as the entry into the control volume shown in Fig. 22, the true anomaly f can be calculated as follows:
fi
=−( )
−−tantan
cos1
aw
W ...................................(11)
where a is the right ascension, W is the longitude of an ascending node, i is the orbital inclination, w is the argument of perigee when the object enters and exits the control volume. When the object enters and exits the control volume through the planes orthogonal to the direction of declination in the same manner as the exit from the control volume shown in Fig. 22, the right ascension a can be calculated as follows using spherical trigonometry:
a d=
+−sintan
tan1
iW .............................................(12)
where d, W and i are the declination, longitude of an ascending node and orbital inclination when the object enters and exits the control volume. Then, the true anomaly f can be calculated by using Equation (11). In addition, when the object enters and exits the control volume through the planes orthogonal to the orbital radius direction, the true anomaly f can be calculated as follows:
Min
v in
Mout
v out
rout
rin
dout
din
aout
D r
Da
Dd
ain
Radius
Right ascension
Declination
(Note) Mout : Average anomaly when exiting a control volume v out : Velocity when exiting a control volume Min : Average anomaly when entering a control volume v in : Velocity when entering a control volume rout : Radius when exiting a control volume (measured from the center of the earth) rin : Radius when entering a control volume (measure from the center of the earth) aout : Right ascension when exiting a control volume ain : Right ascension when entering a control volume dout : Declination when exiting a control volume din : Declination when entering a control volume Dd : Declination resolution Da : Right ascension resolution D r : Radius resolution
Fig. 22 Definition of parameters in control volume
43Vo l . 4 9 N o . 1 2 016
fa e r
r e=
−( ) −⋅
−cos 1
21 ........................................(13)
where r is the radius, a is the orbital long radius and e is the eccentricity when the object enters and exits the control volume. Thus, the existence probability p of the ODR satellite and debris can be calculated by using Equations (8) to (13).
Also, the volume Vbin of the control element is geometrically expressed by
V r r rbin = + ( )
2
33
1
4 22 2D d Dd DaDcos sin
....(14)
The relative velocity vrel between the ODR satellite and debris when they pass through the control volume can be expressed as follows using the velocity vectors
vODR and
vl.
v v v vrel rel ODR l= = −
...........................................(15)
Moreover, each velocity vector in the control volume can be expressed as an average of velocity vectors when entering and exiting the control volume.
vv vin out= +
2 ............................................................(16)
The relative velocity between the ODR satellite and the debris can therefore be obtained from Equations (15) and (16).
The calculation results based on the spherical finite element model depend on the resolution when dividing a space. Thus, higher resolution means the availability of more detailed calculation results but also the need for a longer calculation time. Table 4 shows the calculation conditions for the model used in this research. As shown in Table 4, the resolution in the right ascension and declination is 1.0 degree and that in the orbital altitude is 20 km. The resolution in the MASTER when analyzing fragmented debris in low orbit regions is 20 degrees for the right ascension, 5 degrees for declination and 20 km for the orbital altitude. Clearly, the resolution used in this research is sufficiently high compared to that of the MASTER.4.3 Avoidance of redundant debris removal by the
ODR satelliteIn addition to debris which can be naturally purified within one year, the debris removed by the ODR satellite in previous time steps is preferably excluded from the removal target in the new time step. Although our calculations show that adjustment or no adjustment in the ODR satellite removal target in each time step does not make a significant difference in the number of pieces of debris to be removed by the ODR satellite, the calculation results explained in the following
chapter consider take into account such an adjustment in the removal target.
5. Calculation results
5.1 Debris removal effectsThe debris removal effects of the ODR satellite are verified by calculating how much debris the ODR satellite can remove in one year excluding the debris expected to be naturally purified within one year.
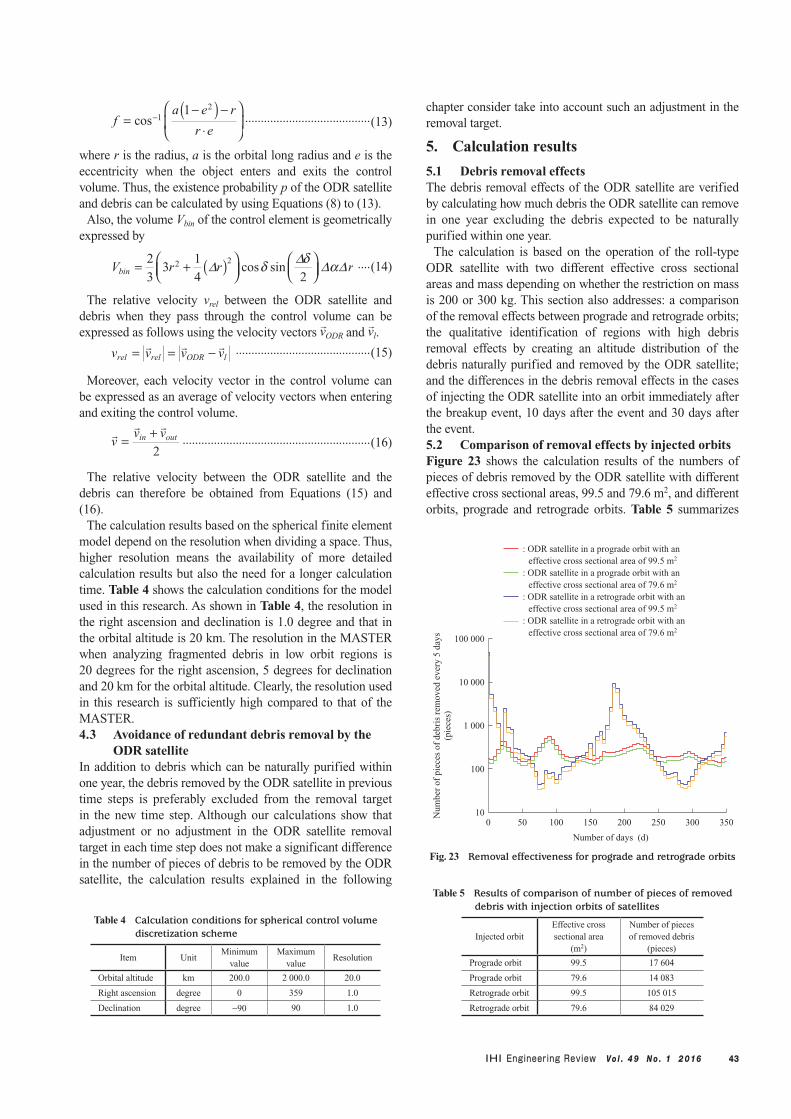
The calculation is based on the operation of the roll-type ODR satellite with two different effective cross sectional areas and mass depending on whether the restriction on mass is 200 or 300 kg. This section also addresses: a comparison of the removal effects between prograde and retrograde orbits; the qualitative identification of regions with high debris removal effects by creating an altitude distribution of the debris naturally purified and removed by the ODR satellite; and the differences in the debris removal effects in the cases of injecting the ODR satellite into an orbit immediately after the breakup event, 10 days after the event and 30 days after the event.5.2 Comparison of removal effects by injected orbitsFigure 23 shows the calculation results of the numbers of pieces of debris removed by the ODR satellite with different effective cross sectional areas, 99.5 and 79.6 m2, and different orbits, prograde and retrograde orbits. Table 5 summarizes
Table 4 Calculation conditions for spherical control volume discretization scheme
Item UnitMinimum
valueMaximum
valueResolution
Orbital altitude km 200.0 2 000.0 20.0
Right ascension degree 0 359 1.0
Declination degree -90 90 1.0
100 000
10 000
1 000
100
010
50 100 150 200 250 300 350
Number of days (d)
Num
ber
of p
iece
s of
deb
ris
rem
oved
eve
ry 5
day
s(p
iece
s)
: ODR satellite in a prograde orbit with an effective cross sectional area of 99.5 m2
: ODR satellite in a prograde orbit with an effective cross sectional area of 79.6 m2
: ODR satellite in a retrograde orbit with an effective cross sectional area of 99.5 m2
: ODR satellite in a retrograde orbit with an effective cross sectional area of 79.6 m2
Fig. 23 Removal effectiveness for prograde and retrograde orbits
Table 5 Results of comparison of number of pieces of removed debris with injection orbits of satellites
Injected orbitEffective cross sectional area
(m2)
Number of pieces of removed debris
(pieces)
Prograde orbit 99.5 17 604
Prograde orbit 79.6 14 083
Retrograde orbit 99.5 105 015
Retrograde orbit 79.6 84 029
44 Vo l . 4 9 N o . 1 2 016
the comparison of these debris removal effects. In conclusion, the debris removal effect is larger when the ODR satellite is injected into a retrograde orbit rather than a prograde orbit.5.3 Comparison of the removal effects by effective
cross sectional areasThe blue and yellow lines in Fig. 23 indicate changes in the number of pieces of debris removed by the ODR satellite every 5 days in the retrograde orbit with respective effective cross sectional areas of 99.5 and 79.6 m2. Although the two lines show almost identical changes, the debris removal effect is slightly higher with an effective cross sectional area of 99.5 m2 rather than 79.6 m2. As a general trend, the debris removal effect starts to decline at around the 40th day, hits bottom in the second month and recovers to a local maximum in the sixth month.
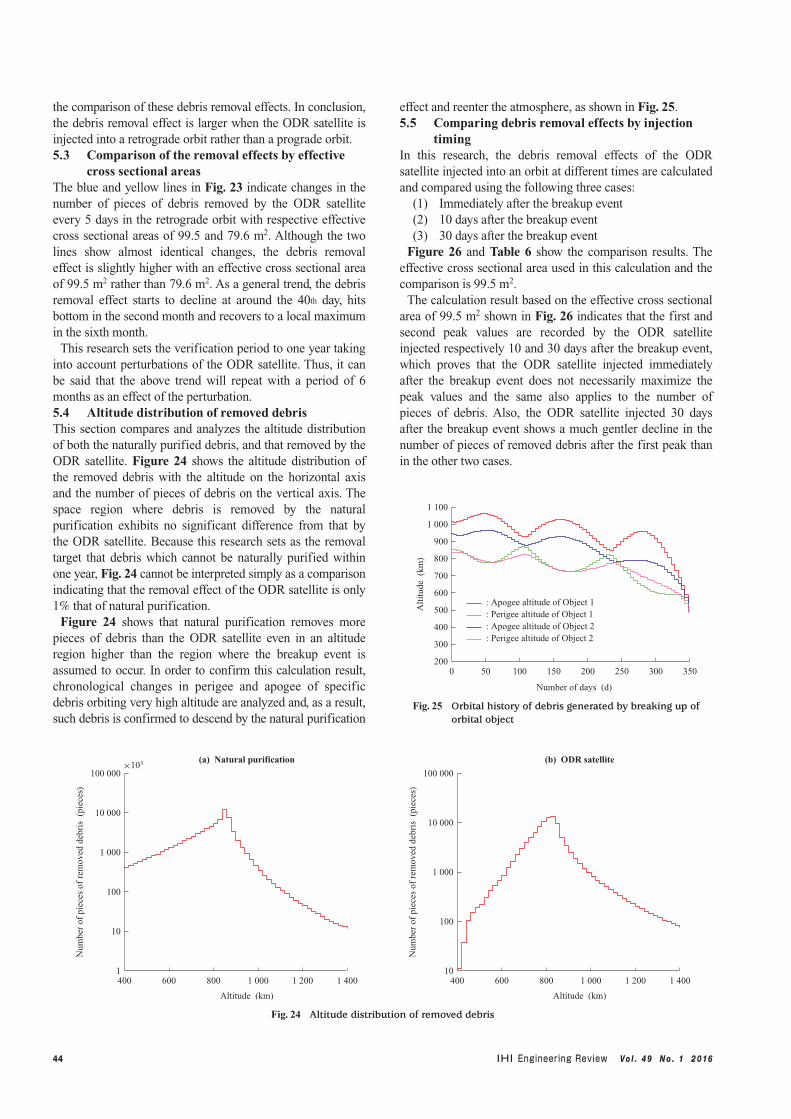
This research sets the verification period to one year taking into account perturbations of the ODR satellite. Thus, it can be said that the above trend will repeat with a period of 6 months as an effect of the perturbation.5.4 Altitude distribution of removed debrisThis section compares and analyzes the altitude distribution of both the naturally purified debris, and that removed by the ODR satellite. Figure 24 shows the altitude distribution of the removed debris with the altitude on the horizontal axis and the number of pieces of debris on the vertical axis. The space region where debris is removed by the natural purification exhibits no significant difference from that by the ODR satellite. Because this research sets as the removal target that debris which cannot be naturally purified within one year, Fig. 24 cannot be interpreted simply as a comparison indicating that the removal effect of the ODR satellite is only 1% that of natural purification.
Figure 24 shows that natural purification removes more pieces of debris than the ODR satellite even in an altitude region higher than the region where the breakup event is assumed to occur. In order to confirm this calculation result, chronological changes in perigee and apogee of specific debris orbiting very high altitude are analyzed and, as a result, such debris is confirmed to descend by the natural purification
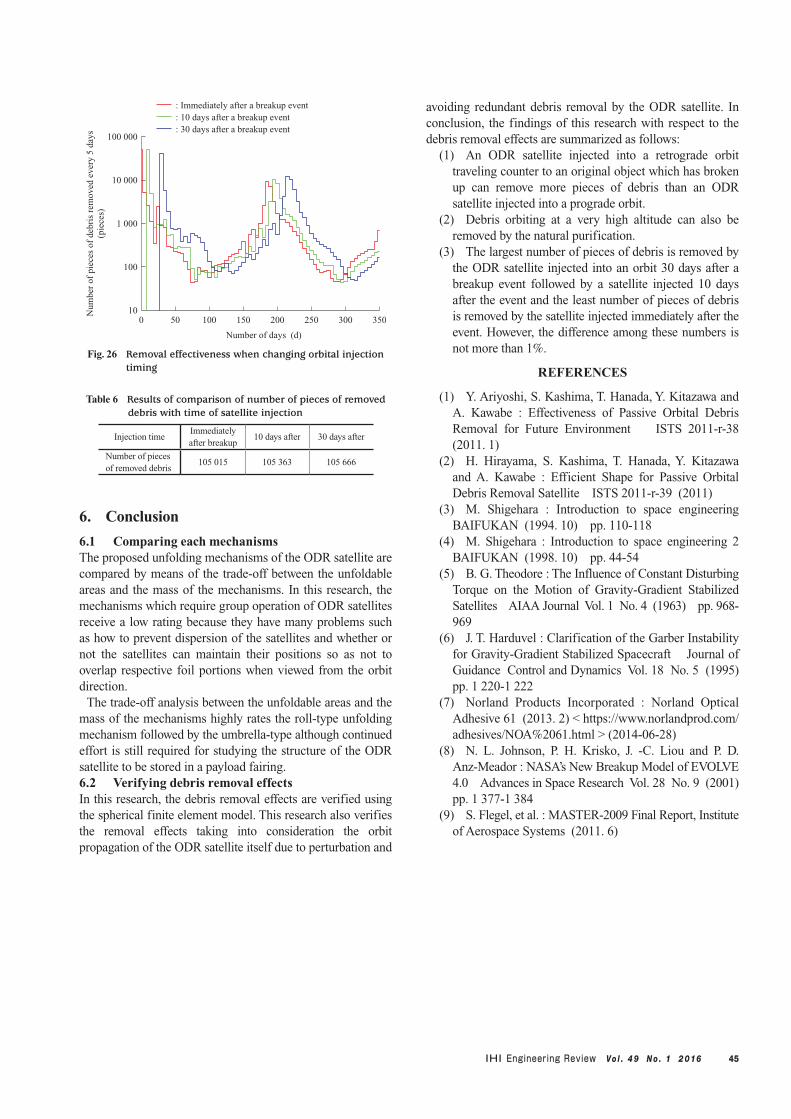
effect and reenter the atmosphere, as shown in Fig. 25.5.5 Comparing debris removal effects by injection
timingIn this research, the debris removal effects of the ODR satellite injected into an orbit at different times are calculated and compared using the following three cases:
(1) Immediately after the breakup event(2) 10 days after the breakup event(3) 30 days after the breakup event
Figure 26 and Table 6 show the comparison results. The effective cross sectional area used in this calculation and the comparison is 99.5 m2.
The calculation result based on the effective cross sectional area of 99.5 m2 shown in Fig. 26 indicates that the first and second peak values are recorded by the ODR satellite injected respectively 10 and 30 days after the breakup event, which proves that the ODR satellite injected immediately after the breakup event does not necessarily maximize the peak values and the same also applies to the number of pieces of debris. Also, the ODR satellite injected 30 days after the breakup event shows a much gentler decline in the number of pieces of removed debris after the first peak than in the other two cases.
(a) Natural purification (b) ODR satellite
400 600 800 1 000 1 200 1 4001
10
100
1 000
10 000
100 000
Altitude (km)
Num
ber
of p
iece
s of
rem
oved
deb
ris
(pi
eces
)
400 600 800 1 000 1 200 1 40010
100
1 000
10 000
100 000
Altitude (km)
Num
ber
of p
iece
s of
rem
oved
deb
ris
(pi
eces
)
×103
Fig. 24 Altitude distribution of removed debris
1 100
1 000
900
800
600
700
500
400
300
0200
50 100 150 200 250 300 350
Number of days (d)
Alt
itud
e (
km)
: Apogee altitude of Object 1: Perigee altitude of Object 1: Apogee altitude of Object 2: Perigee altitude of Object 2
Fig. 25 Orbital history of debris generated by breaking up of orbital object
45Vo l . 4 9 N o . 1 2 016
6. Conclusion
6.1 Comparing each mechanismsThe proposed unfolding mechanisms of the ODR satellite are compared by means of the trade-off between the unfoldable areas and the mass of the mechanisms. In this research, the mechanisms which require group operation of ODR satellites receive a low rating because they have many problems such as how to prevent dispersion of the satellites and whether or not the satellites can maintain their positions so as not to overlap respective foil portions when viewed from the orbit direction.
The trade-off analysis between the unfoldable areas and the mass of the mechanisms highly rates the roll-type unfolding mechanism followed by the umbrella-type although continued effort is still required for studying the structure of the ODR satellite to be stored in a payload fairing.6.2 Verifying debris removal effectsIn this research, the debris removal effects are verified using the spherical finite element model. This research also verifies the removal effects taking into consideration the orbit propagation of the ODR satellite itself due to perturbation and
avoiding redundant debris removal by the ODR satellite. In conclusion, the findings of this research with respect to the debris removal effects are summarized as follows:
(1) An ODR satellite injected into a retrograde orbit traveling counter to an original object which has broken up can remove more pieces of debris than an ODR satellite injected into a prograde orbit.
(2) Debris orbiting at a very high altitude can also be removed by the natural purification.
(3) The largest number of pieces of debris is removed by the ODR satellite injected into an orbit 30 days after a breakup event followed by a satellite injected 10 days after the event and the least number of pieces of debris is removed by the satellite injected immediately after the event. However, the difference among these numbers is not more than 1%.
REFERENCES
(1) Y. Ariyoshi, S. Kashima, T. Hanada, Y. Kitazawa and A. Kawabe : Effectiveness of Passive Orbital Debris Removal for Future Environment ISTS 2011-r-38 (2011. 1)
(2) H. Hirayama, S. Kashima, T. Hanada, Y. Kitazawa and A. Kawabe : Efficient Shape for Passive Orbital Debris Removal Satellite ISTS 2011-r-39 (2011)
(3) M. Shigehara : Introduction to space engineering BAIFUKAN (1994. 10) pp. 110-118
(4) M. Shigehara : Introduction to space engineering 2 BAIFUKAN (1998. 10) pp. 44-54
(5) B. G. Theodore : The Influence of Constant Disturbing Torque on the Motion of Gravity-Gradient Stabilized Satellites AIAA Journal Vol. 1 No. 4 (1963) pp. 968-969
(6) J. T. Harduvel : Clarification of the Garber Instability for Gravity-Gradient Stabilized Spacecraft Journal of Guidance Control and Dynamics Vol. 18 No. 5 (1995) pp. 1 220-1 222
(7) Norland Products Incorporated : Norland Optical Adhesive 61 (2013. 2) < https://www.norlandprod.com/ adhesives/NOA%2061.html > (2014-06-28)
(8) N. L. Johnson, P. H. Krisko, J. -C. Liou and P. D. Anz-Meador : NASA’s New Breakup Model of EVOLVE 4.0 Advances in Space Research Vol. 28 No. 9 (2001) pp. 1 377-1 384
(9) S. Flegel, et al. : MASTER-2009 Final Report, Institute of Aerospace Systems (2011. 6)
: Immediately after a breakup event: 10 days after a breakup event: 30 days after a breakup event
0 50 100 150 200 250 300 350
Number of days (d)
100 000
10 000
1 000
100
10Num
ber
of p
iece
s of
deb
ris
rem
oved
eve
ry 5
day
s(p
iece
s)
Fig. 26 Removal effectiveness when changing orbital injection timing
Table 6 Results of comparison of number of pieces of removed debris with time of satellite injection
Injection timeImmediately after breakup
10 days after 30 days after
Number of pieces of removed debris
105 015 105 363 105 666