Regional Municipal Development Project · DENR – Department of ... PRMDP – Philippine Regional...
53
Completion Report Project Number: 22102 Loan Number: 1367 May 2006 Philippines: Regional Municipal Development Project
-
Upload
truongkhanh -
Category
Documents
-
view
213 -
download
1
Transcript of Regional Municipal Development Project · DENR – Department of ... PRMDP – Philippine Regional...

Completion Report
Project Number: 22102 Loan Number: 1367 May 2006
Philippines: Regional Municipal Development Project
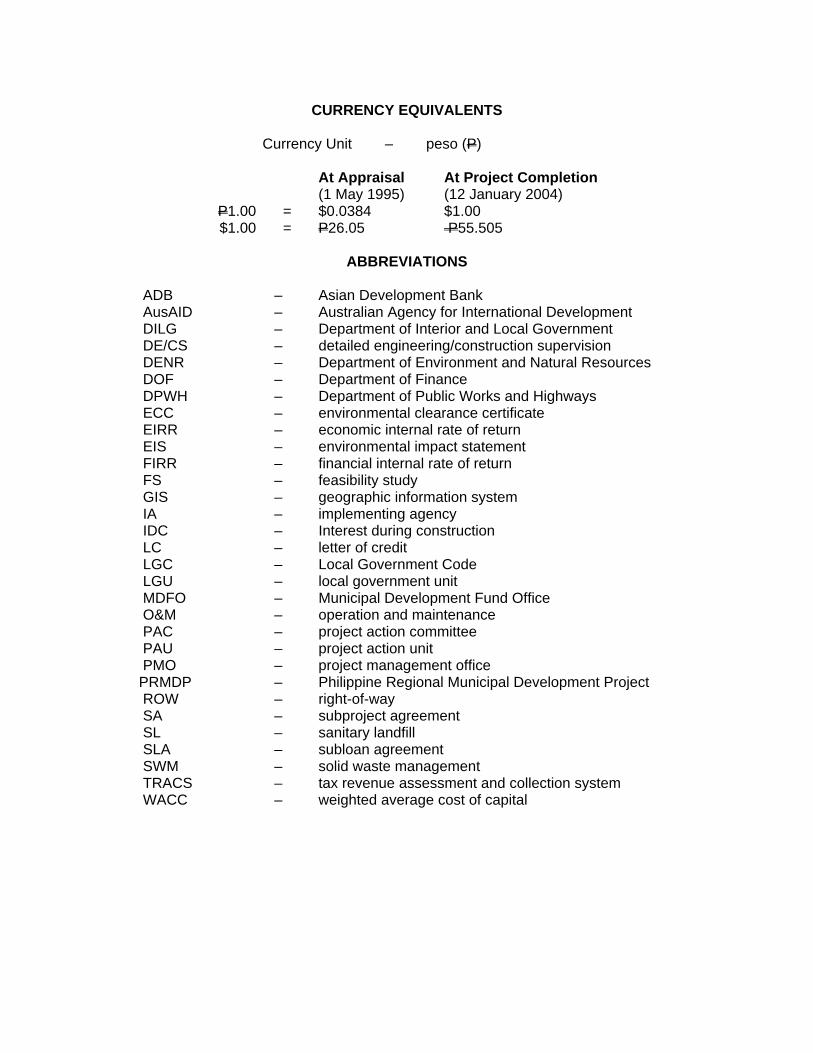
CURRENCY EQUIVALENTS
Currency Unit – peso (P)
At Appraisal At Project Completion (1 May 1995) (12 January 2004)
P1.00 = $0.0384 $1.00 $1.00 = P26.05 P55.505
ABBREVIATIONS
ADB – Asian Development Bank AusAID – Australian Agency for International Development DILG – Department of Interior and Local Government DE/CS – detailed engineering/construction supervision DENR – Department of Environment and Natural Resources DOF – Department of Finance DPWH – Department of Public Works and Highways ECC – environmental clearance certificate EIRR – economic internal rate of return EIS – environmental impact statement FIRR – financial internal rate of return FS – feasibility study GIS – geographic information system IA – implementing agency IDC – Interest during construction LC – letter of credit LGC – Local Government Code LGU – local government unit MDFO – Municipal Development Fund Office O&M – operation and maintenance PAC – project action committee PAU – project action unit PMO – project management office PRMDP – Philippine Regional Municipal Development Project ROW – right-of-way SA – subproject agreement SL – sanitary landfill SLA – subloan agreement SWM – solid waste management TRACS – tax revenue assessment and collection system WACC – weighted average cost of capital

WEIGHTS AND MEASURES
ha – hectare m – meter m2 – square meter km – kilometer kg – kilogram
NOTES
(i) The fiscal year (FY) of the Government ends on 31 December. (ii) In this report, "$" refers to US dollars.
Vice President L. Greenwood, Jr., Operations Group 2 Director General
R. Nag, Southeast Asia Department
Director
S. Lateef, Social Sectors Division, Southeast Asia Department
Team leader
F. Steinberg, Housing and Urban Development Specialist, Southeast Asia Department

CONTENTS
Page
BASIC DATA ii
MAP vii
I. PROJECT DESCRIPTION 1
II. EVALUATION OF DESIGN AND IMPLEMENTATION 2 A. Relevance of Design and Formulation 2 B. Project Outputs 2 C. Project Costs 4 D. Disbursements 5 E. Project Schedule 5 F. Implementation Arrangements 7 G. Conditions and Covenants 8 H. Consultant Recruitment and Procurement 8 I. Performance of Consultants, Contractors, and Suppliers 9 J. Performance of the Borrower and the Executing Agency 9 K. Performance of the Asian Development Bank 10
III. EVALUATION OF PERFORMANCE 10 A. Relevance 10 B. Effectiveness in Achieving Outcome 10 C. Efficiency in Achieving Outcome and Outputs 11 D. Preliminary Assessment of Sustainability 11 E. Impacts 12
IV. OVERALL ASSESSMENT AND RECOMMENDATIONS 13 A. Overall Assessment 13 B. Lessons 13 C. Recommendations 14
APPENDIXES 1. Project Framework 16 2. Project Costs (Appraisal vs. Actual) 19 3. Revisions in Loan Allocation 22 4. Analysis of Subproject Costs 24 5. Project Implementation Schedule 28 6. Project Management Structure 30 7. Status of Compliance with Loan Covenants 33 8. Financial and Economic Evaluation 37

BASIC DATA A. Loan Identification 1. Country 2. Loan Number 3. Project Title 4. Borrower 5. Executing Agency 6. Amount of Loan 7. Project Completion Report Number
Philippines 1367 Regional Municipal Development Project Republic of the Philippines Department of Interior and Local Government $30.0 million PCR:PHI 926
B. Loan Data 1. Appraisal – Date Started – Date Completed 2. Loan Negotiations – Date Started – Date Completed 3. Date of Board Approval 4. Date of Loan Agreement 5. Date of Loan Effectiveness – In Loan Agreement – Actual – Number of Extensions 6. Closing Date – In Loan Agreement – Actual – Number of Extensions 7. Terms of Loan – Interest Rate – Maturity (years) – Grace Period (years) 8. Terms of Relending – Interest Rate – Maturity (years) – Grace Period (years) – Second-Step Borrower
6 April 1995 28 April 1995 27 July 1995 31 July 1995 30 August 1995 27 November 1995 27 February 1996 31 March 1997 2 30 June 2001 12 January 2004 2 Variable 25 (including grace period) 5 14% per year 15 (including grace period) 3 cities

iii
9. Disbursements a. Dates Initial Disbursement
29 August 1997
Final Disbursement
22 September 2003
Time Interval
72 months
Effective Date
31 March 1997
Original Closing Date
30 June 2001
Time Interval
51 months
b. Amount ($) Category
Original Allocation
Last Revised Allocation
Amount Canceled
Net Amount Available
Amount Disbursed
Undisbursed Balancea
01 Civil Works 13,787,000 6,599,906 7,187,094 6,599,906 6,208,974 390,932 01A DPWH 937,000 2,485,566 (1,548,566) 2,485,566 3,014,690 (529,124) 01B Bacolod 2,321,000 0 2,321,000 0 0 0 01C General Santos 1,729,000 0 1,729,000 0 0 0 01D Iligan 1,344,000 1,470,425 (126,425) 1,470,425 829,113 641,312 01E Legaspi 1,728,000 0 1,728,000 0 0 0 01F Lucena 3,008,000 0 3,008,000 0 0 0 01G Puerto Princesa 1,744,000 2,512,500 (768,500) 2,512,500 2,233,756 278,744 01H Tagbilaran 976,000 131,415 844,585 131,415 131,415 0
02 Equipment 5,146,000 2,564,669 2,581,331 2,564,669 1,747,878 816,791 02A Bacolod 379,000 0 379,000 0 0 0 02B General Santos 1,009,000 0 1,009,000 0 0 0 02C Legaspi 810,000 0 810,000 0 0 0 02D Puerto Princesa 1,510,000 1,245,253 264,747 1,245,253 745,253 500,000 02E Tagbilaran 1,438,000 1,319,416 118,584 1,319416 1,002,625 316,791
03 Consulting Services 1,608,000 1,613,013 (5,013) 1,613,013 1,613,714 (701) 04 Interest and Commitment Charges
5,700,000 4,234,497 1,465,503 4,234,497 2,468,601 1,765,896
05 Unallocated 3,759,000 0 0 0 0 0 Total 30,000,000 15,012,085 14,987,915 15,012,085 12,039,167 2,972,918
( ) = negative, DPWH = Department of Public Works and Highways. a Final cancellation on 12 January 2004.
10. Local Costs (Financed) - Amount ($) 0.0 - Percent of Local Costs 0.0 - Percent of Total Cost 40.0 C. Project Data
1. Project Cost ($ million) Cost Appraisal Estimate Actual
Foreign Exchange Cost 41.5 23.8 Local Currency Cost 22.7 14.5 Total 64.2 38.3

iv
2. Financing Plan ($ million) Appraisal Estimate Actual Source Foreign
ExchangeLocal
CurrencyTotal
Foreign
Exchange Local
CurrencyTotal
A. External Sources 1. ADB 30.0 0.0 30.0 12.0 0.0 12.0 2. AusAID 11.5 0.0 11.5 11.8 0.0 11.8 B. Domestic Sources Local Government Units 0.0 16.4 16.4 0.0 7.8 7.8 C. National Government 1. DILG 0.0 5.7 5.7 0.0 4.4 4.4 2. DPWH 0.0 0.6 0.6 0.0 2.3 2.3 Total 41.5 22.7 64.2 23.8 14.5 38.3 ADB = Asian Development Bank, AusAID = Australian Aid for International Development, DILG = Department of Interior and Local Government, DPWH = Department of Public Works and Highways. Note: Totals might not add due to rounding.
3. Cost Breakdown by Project Component ($ million) Appraisal Estimate Actual Component Foreign
ExchangeLocal
CurrencyTotal Foreign
Exchange Local
CurrencyTotal
A. Institutional Development 1. Training and Project Administration a. Training 0.0 0.5 0.5 0.0 0.3 0.3 b. Consulting Services Incremental 1.7 2.8 4.5 1.6 1.4 3.0 c. Administration 0.0 4.6 4.6 0.0 3.8 3.8 2. Capacity Building 11.5 0.0 11.5 11.7 0.0 11.7 Subtotal 13.2 7.9 21.1 13.3 5.5 18.8 B. Physical Infrastructure 1. Land 0.0 0.8 0.8 0.0 0.7 0.7 2. Civil Works 16.4 10.2 26.6 6.2 6.8 13.0 3. Equipment 6.1 1.1 7.2 1.7 0.3 2.0 4. Design and Supervision 0.0 2.7 2.7 0.0 1.3 1.3 Subtotal 22.5 14.8 37.3 7.9 9.1 17.0 C. Interest During Construction 5.7 0.0 5.7 2.5 0.0 2.5 Total 41.5 22.7 64.2 23.7 14.6 38.3 Note: Totals might not add due to rounding. 4. Project Schedule
Item Appraisal Estimate Actual Part A. Institutional Development 1. Award of Contract to Consultants November 1996 July 1997 2. Completion of Consultant Contract June 2000 October 2001 Part B. Physical Infrastructure 1. Date of Commencement a. Local Infrastructure (LGUs) i. Iligan - Draining System Improvement January 1998 December 2000 - Bus and Jeepneya Terminal January 1997 September 2001 - Public Market January 1997 September 2001
v
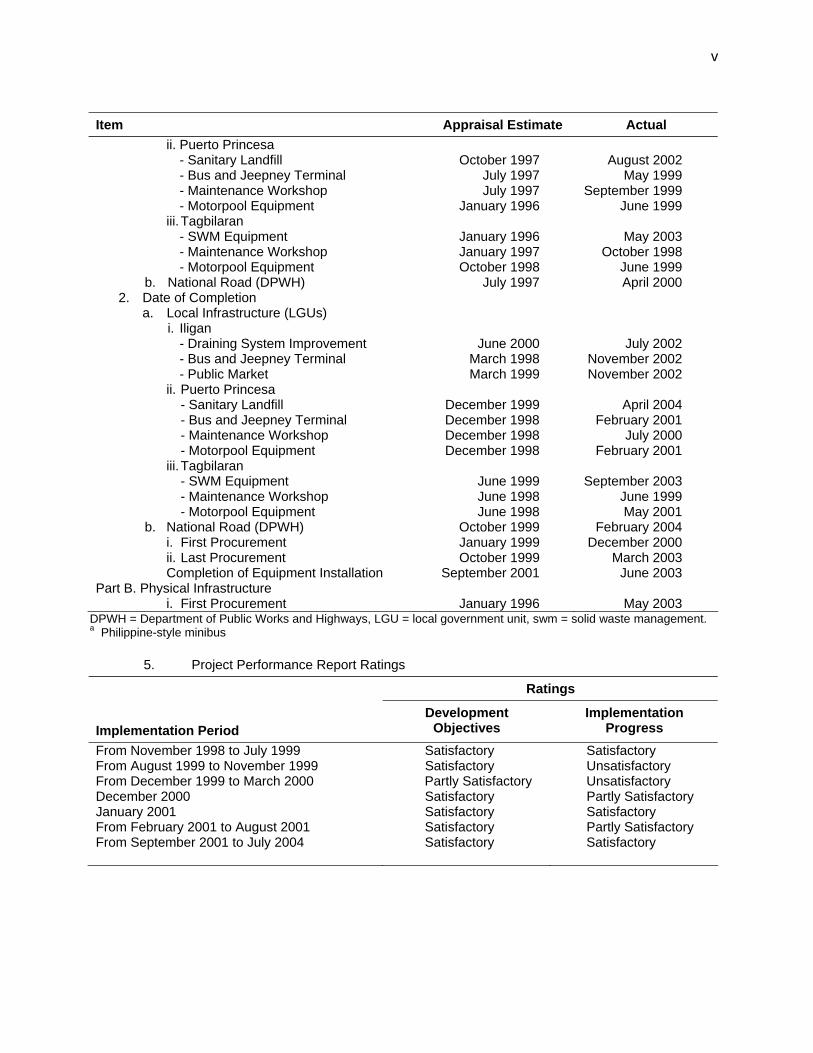
Item Appraisal Estimate Actual ii. Puerto Princesa - Sanitary Landfill October 1997 August 2002 - Bus and Jeepney Terminal July 1997 May 1999 - Maintenance Workshop July 1997 September 1999 - Motorpool Equipment January 1996 June 1999 iii. Tagbilaran - SWM Equipment January 1996 May 2003 - Maintenance Workshop January 1997 October 1998 - Motorpool Equipment October 1998 June 1999 b. National Road (DPWH) July 1997 April 2000 2. Date of Completion a. Local Infrastructure (LGUs) i. Iligan - Draining System Improvement June 2000 July 2002 - Bus and Jeepney Terminal March 1998 November 2002 - Public Market March 1999 November 2002 ii. Puerto Princesa - Sanitary Landfill December 1999 April 2004 - Bus and Jeepney Terminal December 1998 February 2001 - Maintenance Workshop December 1998 July 2000 - Motorpool Equipment December 1998 February 2001 iii. Tagbilaran - SWM Equipment June 1999 September 2003 - Maintenance Workshop June 1998 June 1999 - Motorpool Equipment June 1998 May 2001 b. National Road (DPWH) October 1999 February 2004 i. First Procurement January 1999 December 2000 ii. Last Procurement October 1999 March 2003 Completion of Equipment Installation September 2001 June 2003 Part B. Physical Infrastructure i. First Procurement January 1996 May 2003
DPWH = Department of Public Works and Highways, LGU = local government unit, swm = solid waste management. a Philippine-style minibus 5. Project Performance Report Ratings
Ratings Implementation Period
Development Objectives
Implementation Progress
From November 1998 to July 1999 Satisfactory Satisfactory From August 1999 to November 1999 Satisfactory Unsatisfactory From December 1999 to March 2000 Partly Satisfactory Unsatisfactory December 2000 Satisfactory Partly Satisfactory January 2001 Satisfactory Satisfactory From February 2001 to August 2001 Satisfactory Partly Satisfactory From September 2001 to July 2004 Satisfactory Satisfactory

vi
D. Data on Asian Development Bank Missions
Name of Mission
Date
No. of Persons
No. of Person-Days
Specialization of Membersa
Special Loan Administration 19–20 December 1996 2 4 a, l Administration 10–21 February 1997 2 4 a, l Special Loan Administration 17–29 December 1997 4 21 a, b, f, l Administration 8 January–3 February
1998
3
13
a, f, l Loan Review 1 3–7 August 1998
13 August 1998
4
18
b, e, j, l Loan Review 2 16–18 November 1998 2 4 b, k 7–9 December 1998 2 6 b, k 15 January 1999 2 4 b, k Midterm Review 1 October–15 November
1999
7
184
b, f, g, h, l, m, n Loan Review 3 6 June–1 August 2000 4 114 c, b, e, l Loan Review 4 19 January–2 February
2001
2
10
c, l Loan Review 5 3–27 February 2003 2 13 d, l Project Completion Reviewb 2–20 September 2005 3 21 i, l, o Total During Implementation
39
416
a a = project engineer, b = urban development specialist, c = urban environment specialist, d = principal urban development specialist, e = young professional, f = senior urban development specialist, g = senior procurement specialist, h = social development specialist, i = housing and urban development specialist, j = manager, Agriculture East, Water Supply and Urban Division, k = financial analyst, l = assistant project analyst, m = urban development specialist (staff consultant), n = financial and economic analyst (staff consultant), o = evaluation specialist/financial analyst (staff consultant).
b The project completion report was prepared by Florian Steinberg (Housing and Urban Development Specialist/Mission Leader), Riza Gloria A. Apolonio (Assistant Project Analyst), and Senen Ricasio (Evaluation Specialist/Financial Analyst/Staff Consultant).


I. PROJECT DESCRIPTION 1. The Philippine Regional Municipal Development Project (the Project) was conceived in 1991 with the aim of improving the living conditions, public health standards, and urban environment in seven secondary cities. To achieve these objectives, the Project was to provide basic infrastructure, and strengthen the cities’ capability and capacity to provide, operate, manage, and maintain infrastructure and essential municipal services.1 The Project consisted of two components (Table 1). Part A was an institutional development component that included training and project administration funded by the Asian Development Bank (ADB), as well as capacity building funded by a grant from the Australian Agency for International Development (AusAID). Part B entailed financing physical infrastructure. In Part A, the ADB-funded subcomponent included training designed to support implementation of the infrastructure subprojects financed by ADB in (i) community preparation; (ii) consultation and participation in project design and implementation; (iii) contract bidding, evaluation, and awards; (iv) project implementation and construction supervision; (v) infrastructure maintenance; (vi) workshop management; (vii) solid waste management; (viii) traffic management; (ix) preparation of contract documents; (x) financial management; and (xi) economic enterprise management. The AusAID-funded program was aimed at longer-term capacity building in revenue collection and administration, as well as human resource development, geographical and land information systems, engineering and solid waste management, and urban planning and development. Part B involved the provision/improvement of roads, traffic management, drainage, solid waste management (SWM), public markets, maintenance workshops, and SWM and maintenance equipment. 2. The Project was designed to support the Government’s urban development policy, which fosters (i) dispersing growth through the development of important provincial cities, (ii) decentralizing authority, (iii) devolving responsibilities for local development to local government units (LGU), and (iv) improving local governance. Its objectives were consistent with ADB’s urban sector strategy, which aimed to strengthen LGUs’ ability to manage urban areas efficiently; enhance economic development; create jobs; and improve living conditions, particularly for the poor. The Project was implemented a few years after the approval of the Local Government Code (LGC 1991), which implemented the Government’s decentralization policy (Appendix 1). 3. The Project was ADB’s first integrated urban development project in the Philippines, involving the provision of infrastructure, related training, and capacity building. ADB’s previous assistance to the urban sector focused mainly on water and sanitation.
Table 1: Project Components Amount Funding Agency Project Components ($) Appraisal Actual Part A.1 Training and project administration 9,611.4 ADB, Government ADB, Government Part A.2 Capacity building 11,500.0 AusAID, Government AusAID, Government Part B.1 Physical infrastructure Bacolod City 5,274.2 ADB, Government Canceled General Santos City 5,364.2 ADB, Government Canceled Iligan City 3,386.3 ADB, Government ADB, Government Legaspi City 5,157.6 ADB, Government Canceled 1 ADB. 1990. Technical Assistance to the Republic of the Philippines for the Urban Development Project. Manila (No.
1265-PHI).The Project was identified as a result of this ADB-financed technical assistance. The cities included are Bacolod, General Santos, Iligan, Legaspi, Lucena, Puerto Princesa, and Tagbilaran.

2
Amount Funding Agency Project Components ($) Appraisal Actual Lucena City 5,725.4 ADB, Government Canceled Puerto Princesa 6,301.6 ADB, Government ADB, Government Tagbilaran 4,506.3 ADB, Government ADB, Government Part B.2 National road component 1,700.0 ADB, Government ADB, Government ADB = Asian Development Bank, AusAID = Australian Aid for International Development. Source: Asian Development Bank.
II. EVALUATION OF DESIGN AND IMPLEMENTATION A. Relevance of Design and Formulation 4. The design and formulation of the Project2 was consistent with the Government’s urban development policy and ADB’s urban sector strategy for the country.3 The cities preselected to participate in the Project were rapidly developing regional growth centers. The subprojects reflected the urgent needs of the cities at that time, as their high social acceptability demonstrated. However, LGU ownership was not sufficiently strong and was diluted after municipal elections, which led to the withdrawal of four of the seven participating cities. The training and capacity building programs that ADB and AusAID funded included courses needed to develop the capabilities of the cities to carry out their tasks effectively under the decentralized framework of the LGC. However, the Department of Interior and Local Government (DILG), as the Executing Agency, was limited by the rigidity of the project loan modality, which did not permit the replacement of cities that withdrew from the Project. LGUs also were prohibited from substituting subprojects with other subprojects, or increasing funding due to price escalations and implementation delays. The relevance of the Project at appraisal and at completion must be considered different due to the withdrawal of four of seven cities. Originally considered highly relevant it became less relevant towards the end of the Project. B. Project Outputs 5. Table 2 shows the project outputs expected at appraisal and those achieved at loan and at project completion.4
Table 2: Project Outputs Component Appraisal Project Completion Participating LGUs 7 3 Part A.1 Training and project administration 1,020 officials/staff 3,178 officials and/or staff (ADB-funded) 4,540 training days 10,364 training days Part A.2 Capacity building 4,157 LGU officials and/or (AusAID-funded) staff trained Part B.1 Physical infrastructure and/or equipment Sanitary landfill (civil works) 4 1 Road improvement and traffic 4 0 management
2 TA 1265-PHI was relevant for the Project design, but did not anticipate the inflexibilities inherent with the format of
the project loan. 3 ADB. 1999. Urban Sector Profile. National Urban Development and Housing Framework. Manila. 4 Delayed project start-up, cancellation of four cities and half the subprojects, and design changes reduced the ADB
loan to 40% of the original allocation, extended the project schedule by about 3 years, and lowered the economic internal rate of return (EIRR) for one subproject. On the other hand, the EIRRs of two nonrevenue-generating subprojects improved, while one subproject had a higher financial internal rate of return than at appraisal.
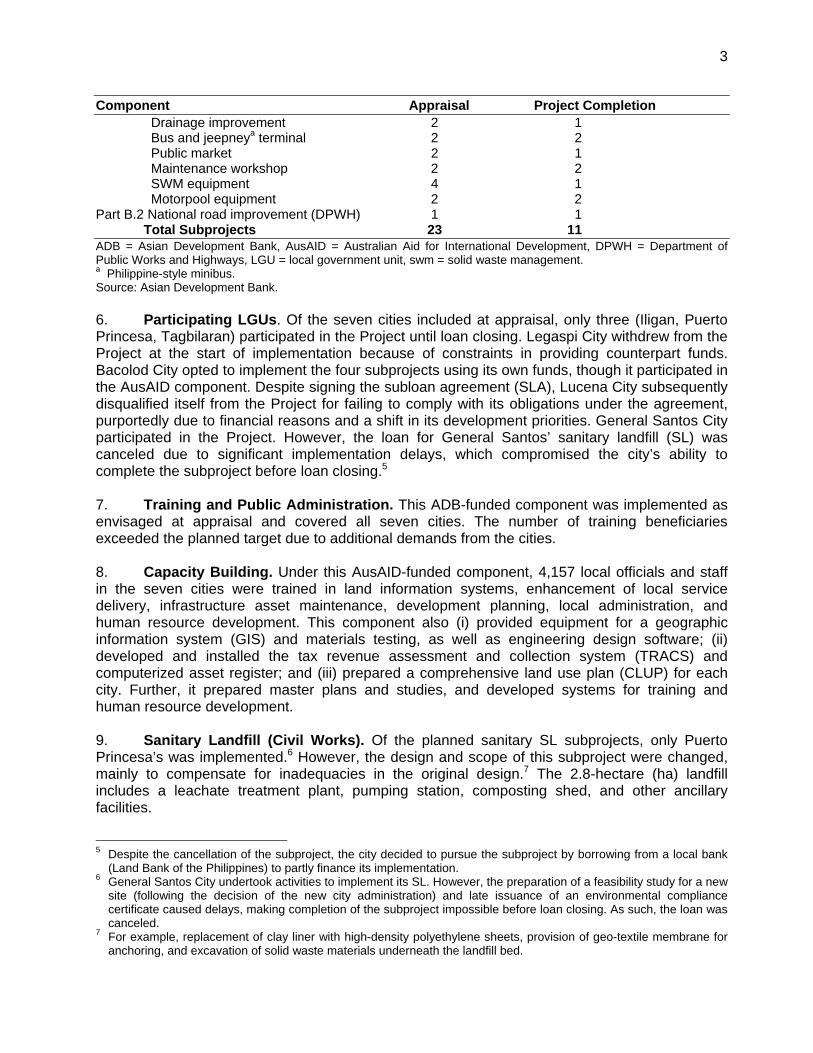
3
Component Appraisal Project Completion Drainage improvement 2 1 Bus and jeepneya terminal 2 2 Public market 2 1 Maintenance workshop 2 2 SWM equipment 4 1 Motorpool equipment 2 2 Part B.2 National road improvement (DPWH) 1 1 Total Subprojects 23 11 ADB = Asian Development Bank, AusAID = Australian Aid for International Development, DPWH = Department of Public Works and Highways, LGU = local government unit, swm = solid waste management. a Philippine-style minibus. Source: Asian Development Bank. 6. Participating LGUs. Of the seven cities included at appraisal, only three (Iligan, Puerto Princesa, Tagbilaran) participated in the Project until loan closing. Legaspi City withdrew from the Project at the start of implementation because of constraints in providing counterpart funds. Bacolod City opted to implement the four subprojects using its own funds, though it participated in the AusAID component. Despite signing the subloan agreement (SLA), Lucena City subsequently disqualified itself from the Project for failing to comply with its obligations under the agreement, purportedly due to financial reasons and a shift in its development priorities. General Santos City participated in the Project. However, the loan for General Santos’ sanitary landfill (SL) was canceled due to significant implementation delays, which compromised the city’s ability to complete the subproject before loan closing.5 7. Training and Public Administration. This ADB-funded component was implemented as envisaged at appraisal and covered all seven cities. The number of training beneficiaries exceeded the planned target due to additional demands from the cities. 8. Capacity Building. Under this AusAID-funded component, 4,157 local officials and staff in the seven cities were trained in land information systems, enhancement of local service delivery, infrastructure asset maintenance, development planning, local administration, and human resource development. This component also (i) provided equipment for a geographic information system (GIS) and materials testing, as well as engineering design software; (ii) developed and installed the tax revenue assessment and collection system (TRACS) and computerized asset register; and (iii) prepared a comprehensive land use plan (CLUP) for each city. Further, it prepared master plans and studies, and developed systems for training and human resource development. 9. Sanitary Landfill (Civil Works). Of the planned sanitary SL subprojects, only Puerto Princesa’s was implemented.6 However, the design and scope of this subproject were changed, mainly to compensate for inadequacies in the original design.7 The 2.8-hectare (ha) landfill includes a leachate treatment plant, pumping station, composting shed, and other ancillary facilities.
5 Despite the cancellation of the subproject, the city decided to pursue the subproject by borrowing from a local bank
(Land Bank of the Philippines) to partly finance its implementation. 6 General Santos City undertook activities to implement its SL. However, the preparation of a feasibility study for a new
site (following the decision of the new city administration) and late issuance of an environmental compliance certificate caused delays, making completion of the subproject impossible before loan closing. As such, the loan was canceled.
7 For example, replacement of clay liner with high-density polyethylene sheets, provision of geo-textile membrane for anchoring, and excavation of solid waste materials underneath the landfill bed.

4
10. Road and Traffic Improvement. Neither the road improvement nor the traffic management subproject for Bacolod City was implemented due to the city’s withdrawal from the Project. 11. Drainage Improvement. With the cancellation of the loan for Legaspi City, only the drainage subproject for Iligan City was implemented. Financial limitations on counterpart funds, however, substantially reduced its scope. Baslayan Creek and Pala-o Creek were dropped, and only the 791 meters (m) Salabao diversion channel was improved. The subproject involved the relocation of 123 affected families to a resettlement site 12 kilometers (km) away. 12. Bus and Jeepney Terminal. The subprojects in the cities of Iligan and Puerto Princesa were implemented. The Puerto Princesa bus terminal is a two-storey building with berths for 14 buses and more than 20 jeepneys, and with 275 square meters (m2) of additional bus sheds, stalls, and office space. The terminal in Iligan (5.6 ha) includes a main building with 376 m2 of bus sheds, a separate jeepney shed (194 m2), and stalls (475 m2). 13. Public Market. Only the Bagsakan Market in Iligan City was constructed. The facility includes a building with 32 stalls (9 m2 each), a separate building with 28 market stalls for small farmers (4 m2 each), and 22 wholesaler areas (1.5 m2 each). Although the structure has been completed, the facilities remain idle. 14. Maintenance Workshop. The workshops for Puerto Princesa and Tagbilaran were constructed as originally designed. The 450 m2 shed in Puerto Princesa has nine bays for heavy equipment and a mezzanine floor housing important tools. The facility in Tagbilaran City includes a motorpool shed (240 m2) and an equipment shed (216 m2). 15. Solid Waste Management Equipment. SWM equipment was procured only in Tagbilaran City as an alternative to the SL that was canceled because the Department of Environment and Natural Resources (DENR) denied an environmental compliance certificate (ECC). However, only two of the three pieces of heavy equipment were delivered due to the city’s problems opening letters of credit (LC), and the proximity of the procurement to loan closing date. 16. Motorpool Equipment. Equipment was purchased for the new motorpool facilities in Puerto Princesa and Tagbilaran. Instead of the heavy equipment that had been planned, the participating cities opted to procure servicing equipment, workshop equipment, and hand tools. 17. National Road Improvement. Significant changes were made to the original design and scope of this subproject, which was implemented in Iligan City. Instead of a two-lane road, as originally planned, the subproject was expanded into six lanes with concrete sidewalks. It also includes widening of the 154 m Mandulog Bridge, which was not part of the original scope. C. Project Costs 18. At appraisal, the Project was estimated to cost $64.2 million equivalent. ADB was to provide $30 million (47%) to finance Part A.1, Part B, and interest during construction (IDC). AusAID was to provide a grant of $11.5 million (18%) for Part A.2. The Government was to contribute $22.7 million equivalent (35%), with DILG providing $4.5 million, the Department of Public Works and Highways (DPWH) $0.6 million, and the cities $16.4 million as equity. At loan

5
closing,8 the Project cost $38.3 million, including $12 million disbursed from ADB’s allocation of $30.0 million. 19. Table 3 gives a breakdown of the main component costs at appraisal and project completion. Appendix 2 provides details of the costs at appraisal and project completion.
Table 3: Project Costs ($’000)
Components Appraisal Actual Part A.1 Training and project administration (ADB-funded) 9,611.4 7,068.8 Part A.2 Capacity building (AusAID-funded) 11,500.0 11,774.2 Part B.1 Physical infrastructure Bacolod City 5,274.2 0.0 General Santos City 5,364.2 271.1 Iligan City 3,386.3 3,845.6 Legaspi City 5,157.6 0.0 Lucena City 5,725.4 0.0 Puerto Princesa City 6,301.6 5,953.8 Tagbilaran City 4,506.3 1,608.4 Part B.2 National road improvement 1,700.0 5,312.7 Total base cost 58,526.9 35,563.5 Interest during construction 5,675.0 2,468.6 Total cost 64,201.9 38,303.1 ADB = Asian Development Bank, AusAID = Australian Aid for International Development. Source: Asian Development Bank. 20. The actual project cost of $38.3 million equivalent was 59.7% of the estimate at appraisal. It consisted of (i) ADB loan of $12.04 million (31%), (ii) AusAID grant of $11.77 million (31%), and (iii) Government counterpart funds of $14.49 million equivalent (38%). The reduction in project costs resulted from cancellations, devaluation of the peso, and changes in the scope of subprojects. Variation orders and price escalation partly offset these cost reductions. Appendix 3 provides details of the canceled loans, while Appendix 4 shows the cost changes for each infrastructure subproject. D. Disbursements 21. Due to cancellations, peso devaluation, and delays in the implementation of infrastructure subprojects, disbursements9 from the ADB loan reached $12.04 million—or 40.1% of the original $30 million allocation. At the original closing date in June 2001, disbursements totaled only $5.82 million (29.0%), and by the first extension date of 30 December 2002 they amounted to $9.25 million (62%). E. Project Schedule 22. As envisaged, the Project should have started in 1995 and been completed in 2000. However, implementation began in 1997 due to the 13-month delay in loan effectiveness and the late signing of subproject agreements (SA) and SLAs between the participating cities and DILG, and with Department of Finance (DOF). The loan became effective on 31 March 1997, more than 8 The loan closing date, originally 30 June 2001, was extended twice to 31 December 2002 and
then to 30 September 2003. The loan account was closed on 12 January 2004. 9 Available funds totaled $41.5 million, consisting of ADB’s loan allocation ($30 million) and AusAID’s grant ($11.5
million).
6
a year after the original date of 27 February 1996. SLAs for Iligan and Puerto Princesa were signed on 11 December 1996, and for Tagbilaran on 26 February 1997. 23. Appendix 5 compares the project implementation schedule at appraisal and at completion. In addition to the delays in the loan becoming effective and in signing the SAs and SLAs, delays also occurred during preconstruction and construction phases.
1. Puerto Princesa City 24. A new feasibility study (FS) and an environmental impact statement (EIS) had to be prepared for the sanitary landfill because of changes in subproject scope and price escalation resulting from a delayed start (from the fourth quarter of 1995 at appraisal to mid-2000). DENR issued the ECC in November 2000, 17 months after submission of the revised EIS. Local officials elected in 1998 called for a rebidding of the civil works contract, which ADB denied. Still, the extended negotiations with the lowest evaluated and substantially responsive bidder for a price reduction further delayed the subproject. The construction contract had to be extended to April 2004 to accommodate additional works overlooked in the design (i.e., removal of underlying solid waste materials, replacement of excavated excessive solid waste (SW). Construction lasted for 14 months, 4 months less than estimated at appraisal, and was completed in April 2004. The sanitary landfill has become one of Puerto Princesa’s flagship environmental improvement projects.10 25. Implementation of the bus terminal should have started in the fourth quarter of 1995 and been completed in the fourth quarter of 1998. However, construction did not begin until May 1999. The construction contract was extended because of (i) frequent rains that delayed backfilling and compacting works, (ii) frequent equipment breakdowns, and (iii) the city’s takeover of construction due to the default of the main contractor. Construction of the terminal took 21 months, compared with 18 months estimated at appraisal, and was completed in February 2001. 26. Construction of the maintenance workshop was delayed for the same reasons as the bus terminal, as the subprojects were on the same site and had the same contractor. Consequently, procurement of equipment had to be timed with the completion of the motorpool facility. However, changes in the list of equipment delayed procurement. Construction of the workshop required 10 months, compared with 18 months estimated at appraisal, and was completed in July 2000.
2. Tagbilaran City 27. Procurement of SWM equipment started only after ADB, in May 2001, approved the city’s request to use part of the loan proceeds originally targeted for the sanitary landfill, which was canceled after being denied an ECC. However, the SLA had to be amended, which pushed the signing of supply contracts to May and June 2003. Problems opening LCs with a local bank, as required under the commitment procedures, delayed the process further. Due to the proximity of the loan closing date, only two of the three batches of equipment were delivered. 28. Construction of the maintenance workshop started in November 1998 and was completed in June 1999 (7 months vs. 18 months estimated at appraisal). Because of changes in the list of equipment, most equipment was delivered in April 2000.
10 The Philippine Daily Inquirer. 2006; The Philippine Star. 2006. Puerto Princesa City Inaugurates RP’s First Integrated
Sanitary Landfill and Waste Water Treatment Facility. 14 March.

7
3. Iligan City 29. Improvement of the Salabao diversion channel started much later than originally scheduled. The detailed engineering/construction supervision (DE/CS) contract was not awarded until May 1999 due to the change in administrations following the 1998 elections, and prolonged negotiation with the highest ranked bidder. Right-of-way (ROW) acquisition problems, frequent rains, and extra work orders delayed construction, which began in December 2000. Construction required 19 months, compared with the appraisal estimate of 30 months, and was completed in July 2002. 30. The new administration’s decision to change the site for the bus terminal necessitated a new site selection study and FS, which took almost a year to complete. The detailed engineering (DE) contract was issued in January 2000, and construction started in September 2001. Delays occurred due to (i) bad weather, (ii) a fiesta celebration on site that interrupted work, and (iii) additional work. Despite the delays, the terminal was completed in November 2002 (14 months vs. an appraisal estimate of 18 months). 31. The Bagsakan Market experienced the same delays as the bus terminal, as the subprojects were constructed on the same site.
4. National Road Component 32. Changes in the original design and scope of the subproject, including widening of the Mandulog Bridge, and the rebidding of the civil works contract due to the failure of the original bidding process under Government guidelines delayed the start of construction to September 2000. Construction lasted for 41 months, compared with an original estimate of 30 months, because of (i) ROW acquisition problems, (ii) presence of water and electric utilities within the ROW, and (iii) approval of the supplemental agreement to fund Mandulog Bridge.
5. Institutional Development 33. This component was implemented as envisaged at appraisal. The AusAID-funded component had to be extended to June 2002 to integrate the Commission on Audit’s recommendations on TRACS. F. Implementation Arrangements 34. DILG was the project Executing Agency. Participating cities were responsible for implementing the infrastructure and equipment subprojects, while DPWH implemented the national road component. The Municipal Development Finance Office (MDFO) administered the ADB loan funds and its relending to the cities. The implementation arrangements of the Project were adequate. 35. An interagency project advisory board (PAB) was created to guide policy and supervise the Project. Within DILG, a project management office (PMO) was established to manage and coordinate project operations. Each city formed a project action committee (PAC) to provide policy and planning direction, as well as a project action unit (PAU) to oversee the day-to-day management and implementation of project components. 36. The active involvement of the cities and DPWH (Region X, i.e. Northern Mindanao) fitted well with the decentralized framework of the LGC. Implementation started slowly because the

8
cities lacked the preparedness/technical skills to implement the Project, and local elections created disruptions. However, the initial hurdles were overcome through project orientation seminars, training, coaching, and a demand-responsive “just-in-time” strategy for capacity building adopted by PMO and the consultant. 37. In 2000, when project accomplishments were still well below expectations, PMO reorganized itself from a functionally oriented organization concerned primarily with monitoring to a city-focused organization.11 Appendix 6 shows the final organization. PMO designated area managers, and carried out high-level visits to the cities. Its focus shifted to supporting and assisting the PAUs, particularly in facilitating implementation, resolving issues, and complying with the time-bound action plans that were agreed upon during ADB’s Mission. To facilitate coordination among participants in the Project, PMO also initiated monthly project coordination meetings with the consulting team leaders. Further, PMO held quarterly project management consultative conferences with PAUs, project management consultants, and AusAID consultants. The cities responded positively to these initiatives, which had a significant impact on project implementation. G. Conditions and Covenants 38. Appendix 7 shows the status of compliance with the loan covenants. Except for the covenant on participation, which was not met fully because of the cancellations, all other covenants generally were complied with. Compliance with some covenants was delayed due to late loan effectiveness. Further, two were modified to suit the needs of the Project better: (i) training responsibilities were shifted from the Local Government Academy to the PMO consultant to coordinate training more effectively with project implementation, and (ii) results monitoring evaluation was used instead of benefit monitoring evaluation for monitoring project accomplishments. 39. The covenants on private sector participation and on fees were partly complied with. The cities have identified the activities for possible private sector involvement, and economic enterprise units have been created. However, no further efforts were made to privatize any of these activities. Regarding fees, while cost recovery studies were prepared for the revenue-generating subprojects, the resulting fees were considered high. As such, incremental fee increases were adopted. For SWM in Puerto Princesa, the fees have not been imposed on, or collected from, households. The cities still are subsidizing the operation of SWM, bus terminals, and the market. Thus, financial sustainability is not assured. H. Consultant Recruitment and Procurement 40. Due to the delay in loan effectiveness, the consultant contract was not signed until May 1997, and the consultant was not mobilized until August 1997. At appraisal, loan effectiveness was anticipated in February 1996. PMO hired a single consulting firm, instead of two as originally planned, to provide the training and project implementation assistance to the cities. The PMO consultant was demobilized in October 2001, and PMO assumed responsibility for providing advisory assistance over the remaining 2 years of the Project. 41. The cities and DPWH followed ADB’s Guidelines on the Use of Consultants and ADB’s Procurement Guidelines in procuring detailed DE/CS and civil works consultants. ADB reviewed and concurred on all contracts. 11 The shift was one of the recommendations of ADB’s Review Mission in October–November 1999.
9
I. Performance of Consultants, Contractors, and Suppliers 42. The PMO’s consultant performed satisfactorily and in accordance with the terms of reference and subsequent amendments to the contract. 43. The DE/CS consultants performed satisfactorily, except for the firms hired by Puerto Princesa to design its SL subproject. These consultants failed to provide for a geo-textile membrane anchoring of the isolation materials, and to consider the underlying solid waste on the proposed SL site. These oversights required additional design work, increasing the cost of the subproject. 44. The civil works contractors also performed satisfactorily, except for the firm hired for the bus terminal and maintenance workshop in Puerto Princesa. These facilities were assessed as poor, and the city declared the firm in default for failing to pay its laborers, subcontractors, and suppliers. As a result, the city took over construction, leading to an additional 13-month delay in implementation and raising the cost of the consulting contract. Except for this case, the contractors completed their works more quickly than estimated at appraisal, despite some delays in construction of other infrastructure subprojects. 45. The suppliers delivered the equipment on time, except for one vibratory compactor (Tagbilaran). This was canceled due to the proximity to loan closing, which was caused by problems in opening an LC. J. Performance of the Borrower and the Executing Agency 46. DILG-PMO. PMO’s overall performance is rated partially satisfactory. PMO faced initial problems and coordination weaknesses due to its functional orientation, which was deemed not well suited to the Project. Subsequently, PMO facilitated the completion of the subprojects by (i) reorganizing to provide direct assistance to the implementing agencies (IA); (ii) strengthening coordination with LGUs through monthly meetings, as well as consultative conferences with PAUs and AusAID consultants; and (iii) coaching and adopting “just-in-time” strategies for capacity building. This shift to an area-focused strategy helped resolve some issues that delayed subproject implementation at the city level. However, the PAB rarely met and did not perform as expected, leaving DILG with all supervision. The capacities of DILG were adequate, as assessed during appraisal. DILG’s PMO performed well and adequately. 47. DOF-MDFO. The IAs found MDFO’s documentation requirements for subloan application and releases burdensome. Further, the loan interest rates were higher than those charged by other financial institutions. MFDO’s location in Manila increased the IAs’ transaction costs, and was deemed inconvenient. Despite these complaints, the cities never indicated that funding was delayed due to these shortcomings. MDFO’s performance is rated partially satisfactory. 48. Implementing Agencies (Cities and DPWH). The cities encountered some initial problems, which delayed implementation of the subprojects. These included changes in the local administration (in Iligan and Puerto Princesa) that led to the selection of new sites, and changes in the original design and scope of subprojects. These changes required new feasibility and other studies, which pushed implementation significantly beyond the original schedules. The cities’ lack of preparedness to implement the subprojects, problems with a contractor (Puerto Princesa), technical difficulties with ROW acquisition and resettlement of 123 families (Iligan) also delayed implementation. Although these issues generally were resolved, subprojects were completed well

10
after the deadlines. Despite the implementation delays, the performance of the cities is rated partially satisfactory. However, participating cities commented positively about the significant and relevant contributions of the capacity building activities (para. 8). They said these were responsible for strengthening LGU staff and management capacity in general. 49. In the case of DPWH, the national road improvement was completed after the original deadline due to substantial changes in the scope and design of the subproject, including the addition of the Mandulog Bridge. Problems with ROW acquisition also contributed to the delays. DPWH’s performance is rated satisfactory. K. Performance of the Asian Development Bank 50. Since approval of the loan in 1995, ADB staff conducted only five loan review missions, two special loan review missions, two loan administration missions, and a midterm review mission involving a combined 395 person-days. The missions highlighted urgent issues affecting project implementation, and helped facilitate execution through their recommendations. However, ADB failed to provide adequate backstopping, and was not proactive in addressing or providing guidance on cancellations. The rigidity in the project loan design and project administration, as well as mounting implementation delays, exacerbated these issues, especially during the first half of the Project. Although alternative implementation arrangements could have been put in place through a major change of scope, this was not pursued on advice of ADB staff. To accelerate procurement, ADB sent a staff member to conduct training in procurement, while a resettlement specialist provided technical assistance in redesigning the resettlement plan for Iligan’s drainage subproject. Overall, the performance of ADB is rated as less satisfactory.
III. EVALUATION OF PERFORMANCE A. Relevance 51. The Project was highly relevant to the Government’s development policy. Its objectives also were consistent with ADB’s urban sector strategy for the country. However, the inflexibility of the project loan approach limited the DILG’s ability to replace cities that dropped out of the Project. Further, the approach restricted the LGUs’ ability to substitute equally relevant subprojects, or to increase funding due to cost escalation resulting from delayed implementation and design changes. This reduced the number of participating cities and outputs. Neither DILG nor ADB pursued a major change of scope or extension of the Project due to complications involved with such adjustments. Because of the limited scope, and reduced geographical coverage, the Project is rated partly relevant. B. Effectiveness in Achieving Outcome 52. Overall, the Project did not achieve its purpose fully due to cancellations of four of the subprojects. However, in the three participating cities, outputs generally achieved or exceeded the targets. The bus terminals in Iligan and Puerto Princesa have decongested the city centers by limiting the entry of intercity traffic. The Iligan road improvements have reduced travel time by about half. Although only one phase of the three-phase drainage improvement subproject was completed in Iligan, it has prevented flooding in three affected barangays (neighborhoods) and resettled the previously affected families to a new location. The sanitary landfill (Puerto Princesa) is providing a more environmentally sound and viable alternative to the open dumpsite that is being closed gradually. Procurement of additional SWM equipment (Tagbilaran) has increased garbage collection coverage from four to 15 barangays. The maintenance workshop and
11
equipment are saving money on equipment utilization. In addition to facilitating the flow of goods from other cities and hinterland barangays, the Bagsakan Market (Iligan) is expected to help decongest the city center. Thus, the Project is rated less efficacious as it ended up covering only three of the seven selected cities. C. Efficiency in Achieving Outcome and Outputs 53. The implementation of the subprojects was delayed due to (i) changes in local administration; (ii) preparation of new FS following the selection of new sites, and changes in the design or scope of some subprojects; and (iii) delayed issuance of ECC. Additional costs also were incurred as a result. However, shorter construction periods than estimated at appraisal helped offset delays in start-up of most subprojects. 54. The 11 subprojects underwent financial and economic reevaluations (Table 4). Details of the analyses are in Appendix 8. The economic internal rates of return (EIRR) for nonrevenue subprojects, except for the maintenance workshop and equipment in Tagbilaran, exceeded the economic opportunity cost of capital. The financial internal rates of return (FIRR) for the bus terminal and market (Iligan) were also above their computed weighted average cost of capital (WACC). Only the bus terminal in Puerto Princesa did not meet the required FIRR, because the planned stalls have not been constructed and nonpaying government offices occupy a large portion of the commercial space. Investments in AusAID-funded TRACS, GIS, and related capacity-building components also have increased business tax revenue by 7–23% for the cities, compared to annual increases of 3–10% before the systems were implemented. Business tax collection in Tagbilaran for the first 6 months of 2005 exceeded total collections for 2004 by 5.5%. With these results, the Project’s performance is rated as efficient.
Table 4: Internal Rates of Return at Appraisal and Project Completion (%)
Appraisal Project Completion Project City Subproject FIRR EIRR FIRR EIRR Puerto Princesa Sanitary landfill 11.4 16.2 Bus/jeepney terminal 31.5 10.0 Maintenance workshop/equipment 26.3 20.8 Tagbilaran SWM equipment 18.6 Maintenance workshop/equipment 17.0 7.7 Iligan Drainage improvement 22.5 12.6 Bus/jeepney terminal 23.8 29.7 Public market 20.6 20.1 National road improvement 20.1 39.0 EIRR = economic internal rate of return, FIRR = financial internal rate of return, SWM = solid waste management. Source: Asian Development Bank. D. Preliminary Assessment of Sustainability 55. Sustainability is assessed in terms of (i) the policy and institutional mechanisms put in place to support the investments and capacity building initiatives, and (ii) financial sustainability of the investments. 56. The cities have created appropriate institutions to manage and operate their new infrastructure (bus terminals, public market), while existing organizational units (SWM, motorpool, drainage) were improved and strengthened through training and other capacity building provided under the Project. Allocations for operation and maintenance (O&M), including for the road component by DPWH, also are being provided through regular city budgets. However,

12
appropriated O&M budgets are often lower than required, which could jeopardize the economic life of the assets. Financially, revenue-generating investments, such as the landfill and bus terminals, are being highly subsidized. The lack of commercially sound, cost-recoverable tariff policies could put the long-term financial sustainability of these investments at risk. A review of such policies is needed. 57. For TRACS, GIS, and related components under the AusAID component, the cities are providing significant support by increasing the initial investments in computer technology through the acquisition of additional hardware that will increase local revenue. GIS has acquired new service applications, which has enabled it to generate some revenues to finance its operations. The CLUP processes are being mainstreamed for the preparation of barangay plans. Training needs are being addressed through the institutionalization of the training management system, human resource development office, city trainers pool, and learning resource center. Sustainability is likely given these developments. E. Impacts 58. Environmental and Economic Impact. The impact of the subprojects on the physical environment of the participating cities is positive and significant. With the establishment of the sanitary landfill, the open dumpsite in Puerto Princesa gradually is being closed.12 Garbage collection has reduced the amount of uncollected waste in Puerto Princesa and Tagbilaran significantly, resulting in a cleaner and healthier environment. Improvement of the Salabao drainage channel has turned the once-waterlogged area into a more habitable site and alleviated the plight of some 200 relocated families. The two bus terminals have decongested the city centers of intercity traffic, reduced pollution, and enhanced mobility within the core. The public market, although still not operational, is expected to decongest the inner city further, as well as provide a cleaner place to trade agricultural and other goods. 59. Impact on the Poor. The social impact of the Project was generally positive, and affected substantial sectors of the urban community. Improved drainage, solid waste management, and roads enhanced public health and safety. Economic activities were generated. Jobs were created during construction and after the Project through new organizational units set up to operate and maintain the facilities. 60. Social Safeguards. The construction of the drainage subproject in Iligan necessitated the resettlement of 123 families to Barangay Dalipuga. The community’s resettlement, which complied with ADB’s safeguard policies and followed an approved resettlement plan, is rated partially successful. Various organizations, including Habitat for Humanity (housing) and the European Union (livelihood), supported the resettlement project. Over time, the settlers established their livelihoods, though for many this meant coping with high transportation costs for commuting to and from Iligan. However, 20% of the original families have moved on, or even moved back to the city center, because they could not cope with the isolation and the 12 km travel from this hillside resettlement colony to the city. Transport costs, lack of income opportunities, and shortage of water supply and electricity were the major problems. This experience suggests that this resettlement project faced sustainability problems. Resettlement
12 The introduction of the sanitary landfill is in line with requirements of the Ecological Solid Waste Management Act
(Republic Act No. 9003). Few LGUs are able to comply with this legal provision.

13
projects are complicated and conflictive, and this project did receive a reasonable amount of initial support. However, the choice of location has made this difficult.13 61. Institutional Impact. The capacity-building component, partly funded by AusAID, is the most successful part of the Project with the widest impacts. However, assessed with the environmental, social, and other impacts, the Project impacts are rated as moderate.
IV. OVERALL ASSESSMENT AND RECOMMENDATIONS A. Overall Assessment 62. Overall, the Project was partly successful, as only three cities participated and less than half the identified subprojects were implemented. Only 40.1% of the available loan, or $12,039,167 of the $30 million loan, was disbursed.14 B. Lessons 63. The Project provided some important lessons, including:
(i) Flexibility in project design. The project loan approach was too rigid. It did not offer the Executing Agency (DILG) and IAs the possibility of replacing cities or subprojects. A more flexible approach (e.g., sector loan) would have reduced the Government’s commitment fees, while enabling more cities to be accommodated and equally worthy subprojects to be considered. A major change of project scope could have allowed the replacement or redefinition of subprojects, or the replacement of cities that dropped out of the Project. However, this was not pursued due to the lengthy processing time required. The loan amounts per city were considered too small relative to the transaction costs involved.
(ii) Greater attention to risks, including political risks. Changes in local
administrations can disrupt project implementation. Project designs should consider the 3-year terms of local governments, and insist on longer-tem commitments. Advocacy is needed to ensure project sustainability.
(iii) Anticipate and prepare ECC requirements. Environmentally sensitive projects
require EIS and ECCs. Proponents should be made aware that the processing of ECCs takes time. Tests and documentary requirements should be prepared in advance. If the proposed sites for the Project are risky, alternatives should be identified.
(iv) Review of feasibility studies and engineering designs. For the sanitary landfill
in Puerto Princesa, the failure of the design to consider all possible technical details, such as the provision of geo-textile membrane for anchoring of the isolation materials, proved costly. The detailed engineering design did not anticipate significant excavation works of underlying wastes since necessary soil
13 However, a nongovernment organization developed another housing colony at practically the same location occupied
by the families relocated because of the construction of the drainage subproject. 14 However, considering only the three participating cities, the Project is rated successful. All project components and
almost all subprojects were implemented in those cities, and outputs met or exceeded the targets. Shorter-than-anticipated construction periods partly offset implementation delays. PMO’s area-focused strategy, closer coordination, and ADB Mission’s recommendations helped to recover ground lost during the first half of the Project.

14
investigations were not conducted. Thorough technical reviews, or a second technical opinion, should have been sought for important and environmentally sensitive projects such as the Puerto Princesa landfill.
(v) Assessment of LGU borrowing capacity. This assessment should consider all
information that could affect an LGU’s ability to borrow funds. The failure to consider Legaspi City’s plan to float municipal bonds overrated its borrowing capacity, which eventually led to its decision to withdraw from the Project. All cities declared that they had more capacity to borrow than DILG/MDFO recognized. Further, they stated they would have liked additional loan funding for, among other things, investments in (a) drainage and storm water control, (b) improvement/maintenance of the road network (asphalt batching), (c) water resource management, and (d) sewerage treatment. All LGUs would agree to provide collateral in the form of city assets or their budgeted internal revenue allocations (IRA).
(vi) Fund channels for LGUs. Cities found the documentary requirements of MDFO
cumbersome and the process time-consuming. They also found transacting business with MDFO in Manila to be more costly than with other financial institutions with branches in the cities.15 Processing paperwork at MDFO was considered too time-consuming and centralized. In contrast, working with the Development Bank of the Philippines or Land Bank of the Philippines is considered easier since they have local branches in the participating cities. The cities would like to have direct loan agreements with ADB, or to have access to a municipal financing facility that is flexible and responsive to their requirements.
(vii) Combination of loan and grant financing. All participating cities considered ADB
funds expensive. The combination of the AusAID-funded capacity building assistance with ADB-financed support for infrastructure subprojects has been widely appreciated as a successful and attractive model that provides added value to the recipients as well as to DILG and the funding agencies involved.
(viii) Relocation. Distant relocation sites, as in the case of Iligan, can generate
livelihood problems that require mitigation measures under the Project. LGUs often will incur additional costs, and will need to seek support of other funding agencies.
(ix) ADB review missions. More frequent review missions could have helped to avert
some of the loan cancellations, or to introduce a major change in scope of the Project in time, as the IAs desired.
C. Recommendations
1. Project Related
64. The experience of the three project cities demonstrates that the day-to-day mindset and urban management of city affairs are not fully anchored in business-like operations. On the
15 Tagbilaran almost backed out from the ADB loan, because its interest rates were considered higher than those of
commercial banks. However, the fact that the AusAID component was seen as part of the Project prevented Tagbilaran from doing so.

15
contrary, political concerns still override the rationale for cost recovery and sustainability. Thus, the following activities are suggested to improve the financial and economic impact of the Project:
(i) LGUs should review tariff policies for SWM, bus terminal, and market with the aim of achieving greater financial sustainability for the investments in 2006.
(ii) Starting in 2006, Puerto Princesa should explore alternatives to direct city investments, including build-operate-transfer, to finance the construction of commercial stalls within the bus terminal, which have been deferred due to funding limitations.
(iii) Starting in 2006, Iligan City should operate the market by limiting wholesale deliveries to Pala-o market, and optimize utilization of the Iligan (north) bus terminal by limiting development of the new south terminal.
(iv) Iligan City must monitor the social and economic situation of the people relocated due to the drainage project; and, if needed, provide additional post-project livelihood support in 2006.
2. General
65. Future ADB projects should consider the following general recommendations, based on the key lessons learned from this project review:
(i) Project design. Utilize the more flexible sector loan approach rather than the project loan approach for municipal development projects that require flexibility during implementation.
(ii) Election risk. Consider the 3-year local election interval a real political risk, and develop mitigation measures in the project design to ensure project sustainability.
(iii) Loan-grant mix. If possible, combine ADB loan funds with bilateral grants when financing similar types of projects to increase the attractiveness and development impact of the project.
(iv) LGU borrowing capacity. Get the borrower to confirm the results of the borrowing capacity analysis, and require full disclosure of information that could affect the project design.
(v) Fund channels. Consider least-cost, but more efficient, channels for LGU loans, preferably with local representation.
(vi) Municipal infrastructure lending facility. One of the principal suggestions that emerged from discussions about future ADB assistance in the sector is to support the establishment of a municipal infrastructure lending facility with a strong customer orientation. This should take into account the latest changes in ADB’s policy toward local currency lending, as well as subsovereign lending through financial intermediaries.16
16 The current Mindanao Basic Urban Services Sector Project has adopted some of these points, such as working
through Land Bank of the Philippines (ADB. 2001. Report and Recommendation of the President to the Board of Directors on a Proposed Loan to the Republic of the Philippines for the Basic Urban Services Sector Project. Manila). Others, such as the establishment of a municipal infrastructure lending facility, might become the substance of a later municipal development project.
16 Appendix 1
PROJECT FRAMEWORK
Design Summary Appraisal Targets Project Achievement Key Issues/ Recommendation
1. Goals
1. Improve the living conditions, public health standards, and urban environment in seven LGUs: (i) Bacolod; (ii) General Santos; (iii) Iligan; (iv) Legaspi; (v) Lucena; (vi) Puerto Princessa, and (vii) Tagbilaran.
1. About 1.86 million
people, including approximately 550,000 urban poor, will benefit from improved environment and living conditions by 2000.
2. Approximately 2,000 new
employment and livelihood opportunities will be created by 2000.
a. By 2004, about 0.97
million people received direct benefits from improved infrastructure; living conditions improved.
b. By 2004, about 3,000
new employment and livelihood opportunities were created.
2. Purpose (Immediate
Objectives)
1. To increase the capability and capacity of LGUs to assume responsibility for the provision, operation management, and maintenance of urban infrastructures and services.
2. To provide new and improved infrastructure and equipment.
1. The LGUs borrow from
the MDF and repay on schedule.
2. The LGUs procure and
construct the agreed equipment, urban infrastructure, and municipal facilities by 2000.
a. Same as approved. b. By 2004, the LGUs
procured the equipment and constructed the infrastructure facilities.
3. Components and Outputsa
3.1 Trained officials and staff in:
a) local government
management and admission;
b) financial management; c) urban planning; d) project planning; e) project management;
1,020 local officials and LGU staff receive training for 4,540 training days. By 2000, 75% (by volume) of solid waste generated in the service areas are to be collected. Fees to be collected from 85% of nondomestic users.
By 2003, about 3,184 local officials and LGU staff received training for a total of 10,382 training days. By 2004, 80% (by volume) of solid waste generated in service areas was collected. Fees were collected from 100% of commercial establishments; 0% from households.

Appendix 1 17
Design Summary Appraisal Targets Project Achievement Key Issues/ Recommendation
f) municipal enterprise management;
g) solid waste
management; h) traffic management; i) water and sanitation
engineering; and j) infrastructure and
equipment maintenance.
Bus terminals are operating at 100% capacity by 2000, and user fee collection efficiency is 85%. Markets have 100% stall occupancy by 2000, and user fee collection efficiency is 85%. 1 fully staffed and operational PMO is established by DILG. 7 fully staffed and operational PAUs are established by LGUs.
By 2005, bus terminals operated at 100% in Puerto Princesa and 40% in Iligan; user fee collection efficiency was 75% and 100%, respectively. By 2004, public market (Iligan) had 0% occupancy. PMO became operational in 1996. PACs and PAUs are operational.
3.2 Urban infrastructure
and municipal facilities constructed
and operational
a) New and improved roads
b) Improved traffic
management c) Improved drainage d) New and improved solid
waste collection and disposal facilities
e) New public markets f) New bus terminals g) Improved maintenance
workshop and equipment.
By project completion in 2000, the following components will be in place: 18 km of new and improved urban roads 17 city road junctions with traffic signals 24 km of new and improved urban drainage 4 new waste disposal sites and collection equipment 2 new markets with 600 stalls 2 bus terminals serving 80,000 commuters, 400 buses, and 2,000 jeepneys per day 2 improved maintenance workshops with tools and equipment
By 2004, the following urban infrastructure facilities were constructed: 4.6 km national road (Iligan) widened; 154 m Mandulog bridge widened and improved 791 m Salabao Diversion Channel improved; 123 families resettled New 2.8 ha sanitary landfill (Puerto Princesa) with leachate treatment plant and ancillary facilities; solid waste collection equipment procured (Tagbilaran) 1 market (Iligan) with 32 stalls constructed, but not operational 2 bus terminals (Puerto Princesa and Iligan) serving 8,250 commuters and 430 different transport vehicles daily
Low O&M allocation by DPWH Review existing tariff policy to achieve cost recovery and reduce subsidy Operationalize the market; limit agricultural deliveries to Pala-o market Review user fees; limit competition from South Terminal Optimize utilization of equipment; rent out the equipment

18 Appendix 1
Design Summary Appraisal Targets Project Achievement Key Issues/ Recommendation
2 new maintenance workshops (Puerto Princesa and Tagbilaran), with heavy and light equipment and tools.
4. Activities
4.1 Urban infrastructure and municipal facilities
a) Overall project
management and coordination.
b) Prepare detailed
engineering designs and contract documents. Supervise construction and procurement.
c) Conduct contract
bidding evaluation and award.
d) Procure equipment and
construct facilities.
Inputs $34.6 million equivalent (without DE/CS and IDC). 220 person-months of consultant services, including 55 person-months of international consultants and 165 person-months of local consultants for project implementation assistance. $2.7 million equivalent for detailed engineering design and contract supervision consultants.
$15.7 million equivalent (without DE/CS and IDC). 284.55 person-months of consultant services, including 64.4 person-months of international consultants and 220.2 person-months of local consultants. $1.3 million equivalent of detailed engineering design and contract supervision.
4.2 Institutional
development
a) Design training program.
b) Conduct training. c) Evaluate training.
4.3 Capacity building
a) Design capacity
building.
b) Implement.
c) Monitor and evaluate.
$4.6 million equivalent. 60 person-months of consultants service for design of training program, and conduct of training. $11.5 million equivalent (AusAID grant) Project cost is $64.2 million, including contingencies and IDC.
$3.0 million equivalent. 28.67 person-months of consultant services for design of training program, and conduct of training. $11.8 million equivalent (AusAID grant) Project cost is $38.0 million, including contingencies and IDC.
AusAID = Australian Aid for International Development, DE/CS = detailed engineering/construction supervision, DILG = Department of Interior and Local Government, DPWH = Department of Public Works and Highways, ha = hectare, IDC = interest during construction, km = kilometer, LGU = local government unit, m = meter, MDF = municipal development fund, O&M = operation and maintenance, PAC = project action committee, PAU = project action unit, PMO = project management office. a The cities of Bacolod, General Santos, Legaspi, and Lucena canceled their loans and did not participate. Source: Loan 1367-PHI Report and Recommendation of the President (RRP).

Appendix 2 19
PROJECT COSTS (APPRAISAL VS. ACTUAL) ($)
Original Cost Actual Cost Item ADB
Loan Government
Equity
Total ADB Loan
Government Equity
Total
I. Part A–Capacity Building Component A. Training and Project Administration 1,700,000.00 7,911,428.38 9,611,428.38 1,613,713.82 5,455,105.90 7,068,819.72 B. Capacity Building (Grant) 11,500,000.00 11,500,000.00 11,774,244.96 11,774,244.96
Total for Part A 13,200,000.00 7,911,428.38 21,111,428.38 13,387,958.78 5,455,105.90 18,834,064.69 II. Part B1–Physical Infrastructure Component
A. Local Infrastructure 1. Iligan City
a. Drainage i. Land 96, 882.69 96,882.69 51,114.92 51,114.92 ii. Detailed Engineering 50,467.50 50,467.50 51,856.88 51,856.88 iii. Construction Supervision 86,135.70 86,135.70 211,324.12 211,324.12 iv.Civil Works 997,080.74 752,372.51 1,749,453.25 267,922.61 173,962.32 441,884.93 v. Equipment
Subtotal 997,080.74 985,858.40 1,982,939.14 267,992.61 488,258.24 756,180.85 b.Bus Terminal
i. Land 153,461.54 153,461.54 372,360.86 372,360.86 ii. Detailed Engineering 24,057.76 24,057.76 34,908.22 34,908.22 iii.Construction Supervision 40,805.09 40,805.09 81,000.26 81,000.26 iv.Civil Works 470,461.54 354,997.43 825,458.97 483,732.08 1,623,546.21 2,107,278.29 v. Equipment Subtotal 470,461.54 573,321.82 1,043,783.36 483,732.08 2,111,815.55 2,595,547.63 c. Market i. Land 64,615.38 64,615.38 155,012.80 155,012.80 ii. Detailed Engineering 8,005.40 8,005.40 5,422.41 5,422.41 iii. Construction Supervision 14,185.52 14,185.52 16,346.39 16,346.39 iv.Civil Works 155,457.34 117,274.54 272,731.88 77,458.49 239,592.52 317,051.01 v. Equipment Subtotal 155,457.34 204,080.84 359,538.18 77,458.49 416,394.11 493,852.60 Total for Iligan City 1,622,999.61 1,763,261.06 3,386,260.68 829,113.18 3,016.467.90 3,845,581.08

20 Appendix 2
Original Cost Actual Cost Item ADB
Loan Government
Equity
Total ADB Loan
Government Equity
Total
2. Puerto Princesa City a. Bus Terminal i. Land 57,692.31 57,692.31 33,789.00 33,789.00 ii. Detailed Engineering 20,614.14 20,614.14 14,258.96 14,258.96 iii. Construction Supervision 34,659.24 32,659.24 45,682.73 45,682.73 iv.Civil Works 397,413.61 299,803.36 697,216.97 261,338.51 328,371.07 589,709.58 v. Equipment Subtotal 397,413.61 412,769.05 810,782.66 261,338.51 422,101.75 683,440.26
b. Motorpool i. Land ii. Detailed Engineering 32,806.95 32,806.95 11,220.09 11,220.09 iii. Construction Supervision 94,072.53 94,072.53 72,166.09 72,166.09 iv.Civil Works 72,914.18 55,005.60 127,919.74 40,138.27 64,071.01 104,209.28 v. Equipment 840,462.92 148,316.82 988,779.74 745,252.85 82,484.55 827,737.40
Subtotal 913,377.10 330,201.91 1,243,579.00 785,391.12 229,941.73 1,015,332.85 c. Solid Waste Management i. Land 76,573.15 76,573.15 ii. Detailed Engineering 76,925.18 76,925.18 40,851.31 40,851.31 iii. Construction Supervision 139,910.38 139,910.38 317,761.78 314,761.78 iv.Civil Works 1,631,516.82 1,230,545.29 2,862,062.12 1,932,278.80 1,890,519.99 3,822,792.79 v. Equipment 993,559.87 175,334.10 1,168,893.97 Subtotal 2,625,076.70 1,622,714.95 4,247,791.65 1,932,278.80 2,322,706.23 4,253,985.03 Total for Puerto
Princesa City 3,935,867.41 2,365,685.91 6,301,553.31 2,979,008.43 2,974,749.71 5,953,758.14
3. Tagbilaran City a. Solid Waste Management i. Land 108,230.77 108,230.77 ii. Detailed Engineering 77,876.62 77,876.62 iii. Construction Supervision 133,109.10 133,109.10 iv.Civil Works 978,147.78 737,900.57 1,716,048.34 v. Equipment 832,937.27 146,988.93 979,926.20 283,210.00 283,210.00 Subtotal 1,811,085.05 1,204,105.98 3,015,191.03 283,210.00 283,210.00

Appendix 2 21
Original Cost Actual Cost Item ADB
Loan Government
Equity
Total ADB Loan
Government Equity
Total
b. Maintenance Workshop
i. Land ii. Detailed Engineering 40,182.58 40,182.58 28,422.39 28,422.39 iii. Construction Supervision 68,156.00 68,156.00 56,306.31 56,306.31 iv.Civil Works 190,039.10 143,363.22 333,402.32 131,414.75 186,220.57 317,635.32 v. Equipment 891,952.52 157,399.11 1,049,324.63 719,415.00 203,397.75 922,812.75
Subtotal 1,081,946.68 409,100.91 1,491,065.54 850,829.75 474,347.03 1,325,176.78 Total for Tagbilaran
City 2,893,049.68 1,613,206.89 4,506,256.57 1,134,039.75 474,347.03 1,608,386.78
Total for Part B1 21,524,999.00 14,190,496.87 35,715,496.42 4,942,161.36 6,736,639.78 11,678,801.14 III. Part B2–National Road Component
A. DPWH 1. Road Widening
a. Land b. Detailed Engineering 45,501.26 45,501.26 c. Construction Supervision 77,177.33 77,177.33 47,626.59 47,626.59 d. Civil Works 1,099,999.98 477,321.42 1,577,321.40 3,014,690.13 2,250,357.90 5,268,048.03 e. Equipment Subtotal 1,099,999.98 600,000.01 1,699,999.99 3,014,690.13 2,297,984.49 5,312,674.62 Total for Part B2 1,099,999.98 600,000.01 1,699,999.99 3,014,690.13 2,297,984.49 5,312,674.62 Total for Part B 22,64,999.54 14,790,496.87 37,415,496.41 7,956,851.49 9,034,624.27 16,991,475.76 IV.Part C–Interest During Construction 5,675,000.00 5,675,000.00 2,468,600.71 2,468,600.71
Grand Total 41,499,999.54 22,701,925.25 64,201,924.79 23,813,410.98 14,489,730.17 38,303,141.15 ADB = Asian Development Bank, DPWH = Department of Public Works and Highways. Source: ADB and Department of Interior and Local Government.

22 Appendix 3
REVISIONS IN LOAN ALLOCATION
1. The Asian Development Bank (ADB) loan, which was originally for $30.0 million, was reduced five times by a total of $17.9 million because of cancellations of several subprojects. The final loan amount was $12.1 million. 2. Table A3.1 provides the details of the cancellations and reallocations. Table A3.2 summarizes the cancellations in chronological order.
Table A3.1: Asian Development Bank Loan Allocation
DPWH = Department of Public Works and Highways. a The Asian Development Bank approved the widening of Mandulog Bridge in Iligan City on 7 January 2002. Source: Department of Interior and Local Government.
Reallocation Disbursed Original Cancellation of Loan Cancellation Amount Undisbursed
No. Item Allocation First Second Proceedsa Third Fourth (as of
12 Jan 2004) Amount 01 Civil Works 13,787,000 12,059,000 6,730,000 8,694,991 7,221,764 6,599,906 6,208,974 390,932 A DPWH 937,000 937,000 937,000 2,485,566 2,485,566 2,485,566 3,014,690 (529,124) B Bacolod 2,321,000 2,321,000 0 0 0 0 0 0
C General
Santos 1,729,000 1,729,000 1,729,000 1,729,000 1,055,620 0 0 0 D Iligan 1,344,000 1,344,000 1,344,000 1,470,425 1,470,425 1,470,425 829,113 641,312 E Legaspi 1,728,000 0 0 0 0 0 0 0 F Lucena 3,008,000 3,008,000 0 0 0 0 0 0
G Puerto Princesa 1,744,000 1,744,000 1,744,000 2,034,000 2,034,000 2,512,500 2,233,756 278,744
H Tagbilaran 976,000 976,000 976,000 976,000 176,153 131,415 131,415 0 02 Equipment 5,146,000 4,336,000 3,957,000 3,957,000 3,503,516 2,564,669 1,747,878 816,791 A Bacolod 379,000 379,000 0 0 0 0 0 0
B General
Santos 1,009,000 1,009,000 1,009,000 1,009,000 622,940 0 0 0 C Legaspi 810,000 0 0 0 0 0 0 0
D Puerto Princesa 1,510,000 1,510,000 1,510,000 1,510,000 1,442,576 1,245,253 745,253 500,000
E Tagbilaran 1,438,000 1,438,000 1,438,000 1,438,000 1,438,000 1,319,416 1,002,625 316,791 03 Consulting
Services 1,608,000 1,608,000 1,608,000 1,613,013 1,613,013 1,613,013 1,613,714 (701) 04 Interest and
Commitment Charge 5,700,000 5,700,000 5,700,000 5,700,000 4,234,497 4,234,497 2,468,601 1,765,896
05 Unallocated 3,759,000 3,261,000 2,160,000 189,996 189,996 0 0 0
Total 30,000,000 26,964,000 20,155,000 20,155,000 16,762,786 15,012,085 12,039,167 2,972,918

Appendix 3 23
Table A3.2: Dates of Reduction in Loan Amount
Date of Loan Reduction Amount of Reduction New Loan Amount ($ million) 27 May 1998a 3.0 27.0 20 March 2000b 6.8 20.2 19 March 2002c 3.4 16.8 26 September 2002d 1.8 15.0 12 January 2004e 3.0 12.0
Note: Totals might not add up due to rounding. a Lucena City was declared ineligible to participate under the Project due to lack of borrowing
capacity. b The cities of Bacolod and Lucena pulled out of the Project. Bacolod implemented the proposed
road and bridge subproject using its own funds, and eventually ventured into a build-operate-transfer scheme. Lucena pulled out of the Project because the mayor at the time was unable to obtain approval from the city council for a realignment of city funds for the proposed road subproject.
c The devaluation of the peso reduced the allocations for subprojects of General Santos, Tagbilaran, and Puerto Princesa.
d General Santos subprojects were canceled. Adjustments were made in the loan allocation for Puerto Princesa subprojects. The unallocated portion of the loan proceeds was canceled.
e The undisbursed loan amount of $3.0 million was canceled at loan account closing on 12 January 2004.
Source: Asian Development Bank.
24 Appendix 4
ANALYSIS OF SUBPROJECT COSTS ($)
Civil Works Equipment Total
Item Land Equity
DE/CS Equity Loan Equity Subtotal Loan Equity Subtotal Loan Equity Subtotal
I. Iligan City A. Drainage 1. Appraisal Cost 96.88 136.60 997.08 752.37 1,749.45 0 0 0 997.08 985.85 1,982.93 2. Contract Cost 51.11 211.75 106.86 174.49 281.35 0 0 0 106.86 437.35 544.21 3. Actual Cost 51.11 263.18 267.92 173.96 441.88 0 0 0 267.92 488.25 756.17 Cost Variance (45.77) 126.58 (729.16) (578.41) (1,307.57) 0 0 0 (729.16) (497.60) (1,226.76) 4. Details of Cost
Changes a. Price Escalation 0.00 123.23 0.00 123.23 123.23 b. Change in Scope (489.42) (499.01) (988.43) 0 0 0 (489.42) (499.01) (988.43) c. Variation Order 51.43 (0.76) (0.76) 0 0 0 0.00 50.67 50.67 d. Peso Devaluation (45.77) (48.08) (239.73) (78.63) (318.36) 0 0 0 (239.73) (172.48) (412.21) Total (45.77) 126.58 (729.15) (578.40) (1,307.55) 0 0 0 (729.15) (497.59) (1,226.74) B. Bus and Jeepney
Terminal 1. Appraisal Cost 153.46 64.86 470.46 355.00 825.46 0 0 0 470.46 573.32 1,043.78 2. Contract Cost 372.36 44.40 483.73 1,490.93 1,974.66 0 0 0 483.73 1,907.69 2,391.42 3. Actual Cost 372.36 115.91 483.73 1,623.55 2,107.28 0 0 0 483.73 2,111.82 2,595.55 Cost Variance 218.90 51.05 13.27 1,268.55 1,281.82 0 0 0 13.27 1,538.50 1,551.77 4. Details of Cost Changes a. Price Escalation b. Change in Scope 295.02 6.83 246.64 1,275.75 1,522.39 0 0 0 246.64 1,577.60 1,824.24 c. Variation Order 71.50 132.62 132.62 0 0 0 0.00 204.12 204.12 d. Peso Devaluation (76.12) (27.29) (233.37) (139.82) (373.19) 0 0 0 (233.37) (243.23) (476.60) Total 218.90 51.04 13.27 1,268.55 1,281.82 0 0 0 13.27 1,538.49 1,551.76 C. Bagsakan Public
Market 1. Appraisal Cost 64.62 22.19 155.46 117.27 272.73 0 0 0 155.46 204.08 359.54 2. Contract Cost 155.01 43.90 77.46 64.89 142.35 0 0 0 77.46 263.80 341.26 3. Actual Cost 155.01 21.79 77.46 239.59 317.05 0 0 0 77.46 416.39 493.85 Cost Variance 90.39 (0.40) (78.00) 122.32 44.32 0 0 0 (78.00) 212.31 134.31

Appendix 4 25
Civil Works Equipment Total
Item Land Equity
DE/CS Equity Loan Equity Subtotal Loan Equity Subtotal Loan Equity Subtotal
4. Details of Cost Changes a. Price Escalation b. Change in Scope 122.82 30.58 (8.05) (8.05) 0 0 0 0.00 145.35 145.35 c. Variation Order (22.11) 0.00 174.71 174.71 0 0 0 0.00 152.60 152.60 d. Peso Devaluation (32.42) (8.87) (78.00) (44.34) (122.34) 0 0 0 (78.00) (85.63) (163.63) Total 90.40 (0.40) (78.00) 122.32 44.32 0 0 0 (78.00) 212.32 134.32 II. Puerto Princesa
A. Bus and Jeepney Terminal 1. Appraisal Cost 57.69 55.27 397.41 299.80 697.21 0 0 0 397.41 412.76 810.17 2. Contract Cost 33.79 32.57 416.28 178.41 594.69 0 0 0 416.28 244.77 661.05 3. Actual Cost 33.79 59.94 261.34 328.37 589.71 0 0 0 261.34 422.10 683.44 Cost Variance (23.90) 4.67 (136.07) 28.57 (107.50) 0 0 0 (136.07) 9.34 (126.73) 4. Details of Cost Changes a. Price Escalation b. Change in Scope (6.19) 183.52 (36.70) 146.82 0 0 0 183.52 (42.89) 140.63 c. Variation Order 27.38 (154.94) 149.97 (4.97) 0 0 0 (154.94) 177.35 22.41 d. Peso Devaluation (23.90) (16.52) (164.66) (84.70) (249.36) 0 0 0 (164.66) (125.12) (289.78) Total (23.90) 4.67 (136.08) 28.57 (107.51) 0 0 0 (136.08) 9.34 (126.74) B. Motorpool Shed 1. Appraisal Cost 126.88 72.91 55.01 127.92 840.47 148.32 988.78 913.38 330.21 1,243.59 2. Contract Cost 78.50 49.00 85.17 134.17 746.86 82.49 829.35 795.86 246.16 1,042.02 3. Actual Cost 52.07 40.14 64.07 104.21 745.25 82.48 827.74 785.39 198.62 984.01 Cost Variance (74.81) (32.77) 9.06 (23.71) (95.22) (65.84) (161.04) (127.99) (131.59) (259.58) 4. Details of Cost Changes a. Price Escalation b. Change in Scope (56.68) 0.00 29.90 29.90 (93.60) (65.83) (159.43) (93.60) (92.61) (186.21) c. Variation Order 0.36 38.04 6.14 44.18 (1.61115) 0.00 (1.61) 36.43 6.50 42.93 d. Peso Devaluation (18.48) (70.81) (26.98) (97.79) (70.81) (45.46) (116.27) Total (74.80) (32.77) 9.06 (23.71) (95.21) (65.83) (161.04) (127.98) (131.57) (259.55) C. Sanitary Landfill 1. Appraisal Cost 216.84 1,631.52 1,230.55 2,862.07 993.56 175.33 1,168.89 2,625.08 1,622.72 4,247.80 2. Contract Cost 76.57 311.59 1,462.00 1,106.70 2,568.70 1,462.00 1,494.86 2,956.86 3. Actual Cost 76.57 355.61 1,932.28 1,890.52 3,822.80 1,932.28 2,322.70 4,254.98 Cost Variance 76.57 138.77 300.76 659.97 960.73 (993.56) (175.33) (1,168.89) (692.80) 699.98 7.18

26 Appendix 4
Civil Works Equipment Total
Item Land Equity
DE/CS Equity Loan Equity Subtotal Loan Equity Subtotal Loan Equity Subtotal
4. Details of Cost Changes a. Price Escalation b. Change in Scope 76.57 184.98 917.40 355.94 1,273.34 (993.56) (175.33) (1,168.89) (76.16) 442.16 366.00 c. Variation Order 44.02 232.18 783.82 1,016.00 232.18 827.84 1,060.02 d. Peso Devaluation (90.23) (848.82) (479.78) (1,328.60) (848.82) (570.01) (1,418.83) Total 76.57 138.77 300.76 659.98 960.74 (993.56) (175.33) (1,168.89) (692.80) 699.99 7.19 III. Tagbilaran City A. Motorpool Shed 1. Appraisal Cost 108.34 190.04 143.36 333.40 891.93 157.40 1,049.32 1,081.97 409.10 1,491.07 2. Contract Cost 84.73 131.41 172.68 304.09 346.72 203.40 550.12 478.13 460.81 938.94 3. Actual Cost 84.73 131.41 186.22 317.63 719.42 203.40 922.81 850.83 474.35 1,325.18 Cost Variance (23.61) (58.63) 42.86 (15.77) (172.51) 46.00 (126.51) (231.14) 65.25 (165.89) 4. Details of Cost Changes a. Price Escalation b. Change in Scope (1.24) 0.24 53.66 53.90 (545.20) 46.00 (499.20) (544.96) 98.42 (446.54) c. Variation Order 13.54 13.54 372.69 372.69 372.69 13.54 386.23 d. Peso
Devaluation (22.37) (58.86) (24.34) (83.20) (58.86) (46.71) (105.57) Total (23.61) (58.62) 42.86 (15.76) (172.51) 46.00 (126.51) (231.13) 65.25 (165.88) B. Sanitary Landfill 1. Appraisal Cost 108.23 210.99 978.15 737.90 1,716.05 832.94 146.99 979.93 1,811.09 1,204.11 3,015.20 2. Contract Cost 719.42 719.42 719.42 0.00 719.42 3. Actual Cost 283.21 283.21 283.21 0.00 283.21 Cost Variance (108.23) (210.99) (978.15) (737.90) (1,716.05) (549.73) (146.99) (696.72) (1,527.88) (1,204.11) (2,731.99) 4. Details of Cost Changes a. Price Escalation b. Change in Scope (108.23) (210.99) (978.15) (737.90) (1,716.05) (113.52) (146.99) (260.51) (1,091.67) (1,204.11) (2,295.78) c. Variation Order (436.21) (436.21) (436.21) 0.00 (436.21) d. Peso
Devaluation 0.00 0.00 Total (108.23) (210.99) (978.15) (737.90) (1,716.05) (549.73) (146.99) (696.72) (1,527.88) (1,204.11) (2,731.99) Totals Appraisal Cost 480.88 941.97 4,893.03 3,691.26 8,584.29 3,558.90 628.04 4,186.92 8,451.93 5,742.15 14,194.08 Contract Cost 688.84 807.44 2,726.74 3,273.27 6,000.01 1,813.00 285.89 2,098.89 4,539.74 5,055.44 9,595.18
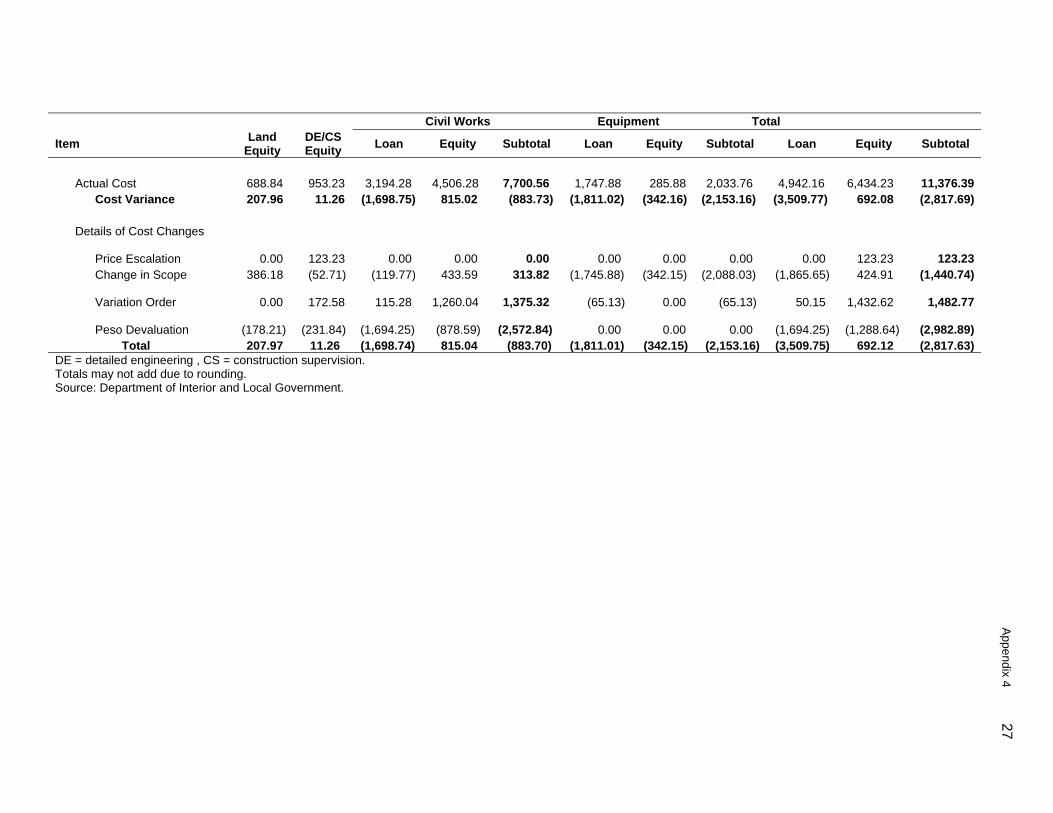
Appendix 4 27
Civil Works Equipment Total
Item Land Equity
DE/CS Equity Loan Equity Subtotal Loan Equity Subtotal Loan Equity Subtotal
Actual Cost 688.84 953.23 3,194.28 4,506.28 7,700.56 1,747.88 285.88 2,033.76 4,942.16 6,434.23 11,376.39 Cost Variance 207.96 11.26 (1,698.75) 815.02 (883.73) (1,811.02) (342.16) (2,153.16) (3,509.77) 692.08 (2,817.69) Details of Cost Changes
Price Escalation 0.00 123.23 0.00 0.00 0.00 0.00
0.00 0.00 0.00 123.23 123.23 Change in Scope 386.18 (52.71) (119.77) 433.59 313.82 (1,745.88) (342.15) (2,088.03) (1,865.65) 424.91 (1,440.74)
Variation Order 0.00 172.58 115.28 1,260.04 1,375.32 (65.13)
0.00 (65.13) 50.15 1,432.62 1,482.77
Peso Devaluation (178.21) (231.84) (1,694.25) (878.59) (2,572.84) 0.00
0.00 0.00 (1,694.25) (1,288.64) (2,982.89) Total 207.97 11.26 (1,698.74) 815.04 (883.70) (1,811.01) (342.15) (2,153.16) (3,509.75) 692.12 (2,817.63) DE = detailed engineering , CS = construction supervision. Totals may not add due to rounding. Source: Department of Interior and Local Government.
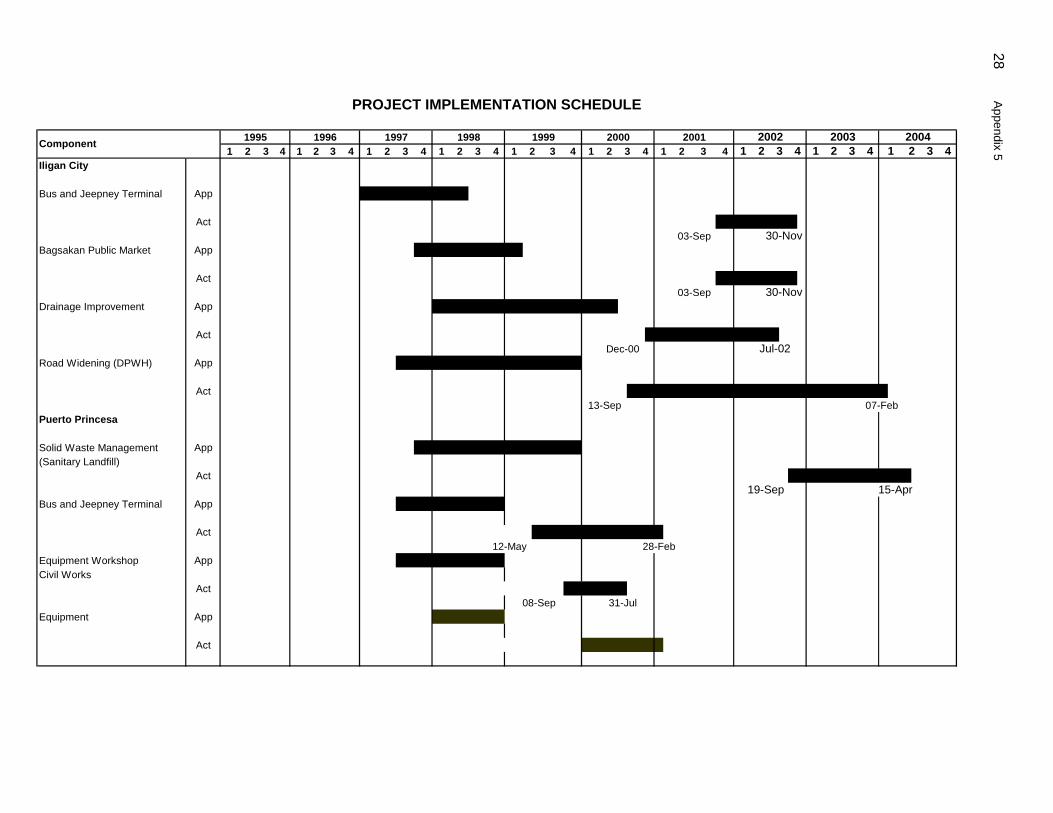
28 Appendix 5
PROJECT IMPLEMENTATION SCHEDULE
Iligan City
Bus and Jeepney Terminal App
Act
Bagsakan Public Market App
Act
Drainage Improvement App
Act
Road Widening (DPWH) App
Act
Puerto Princesa
Solid Waste Management App(Sanitary Landfill)
Act
Bus and Jeepney Terminal App
Act
Equipment Workshop AppCivil Works
Act
Equipment App
Act
Component 1995 19961 2 3 41 2 3 4
19971 2 3 4
1998 1999 2000 2001 2002 2003 20044321432132 43212 3214
31-Jul
3
Dec-00
28-Feb
13-Sep
08-Sep
03-Sep
03-Sep
12-May
30-Nov
30-Nov
Jul-02
07-Feb
19-Sep 15-Apr
1 1432 1 4 4
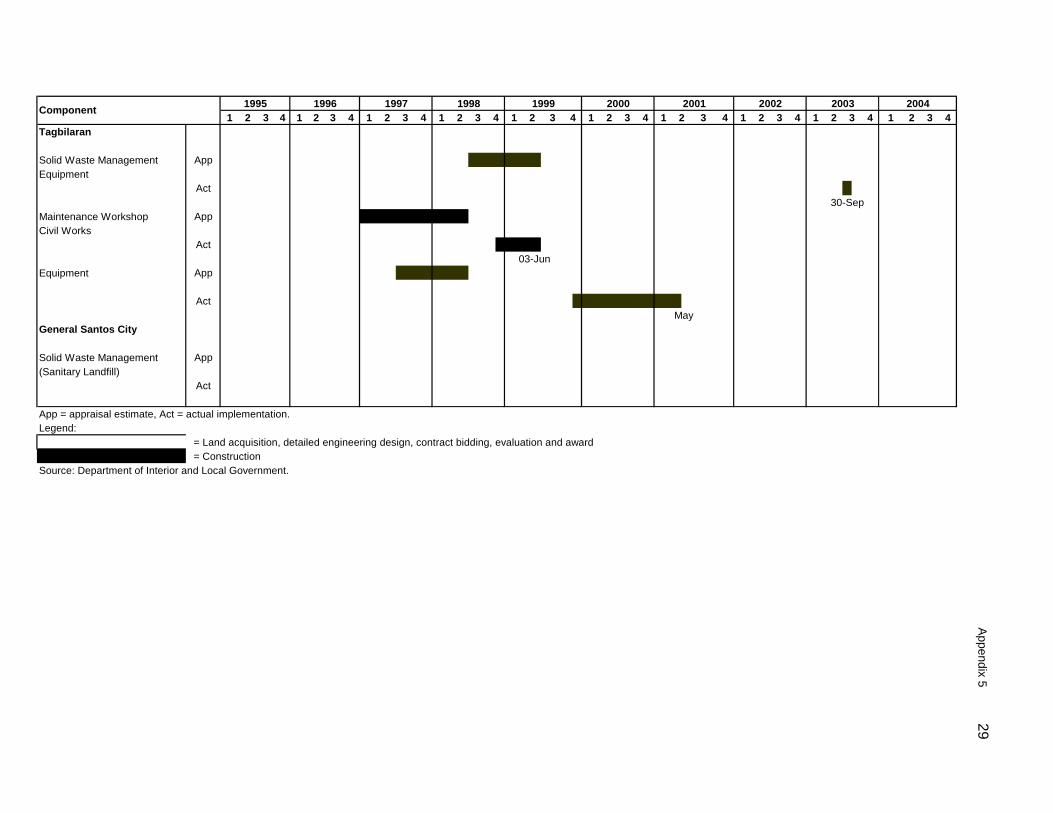
Appendix 5 29
Tagbilaran
Solid Waste Management AppEquipment
Act
Maintenance Workshop AppCivil Works
Act
Equipment App
ActMay
General Santos City
Solid Waste Management App(Sanitary Landfill)
Act
App = appraisal estimate, Act = actual implementation.Legend:
= Land acquisition, detailed engineering design, contract bidding, evaluation and award = Construction
Source: Department of Interior and Local Government.
30-Sep
03-Jun
Component 2002 2003 200420013 4
1996 1997 1998 2000199919951 2 31 2 3 41 2 4 1 2 3 4 1 2 3 4 1 2 3 4 1 2 3 4 1 3 4 12 3 4 1 2 3 42
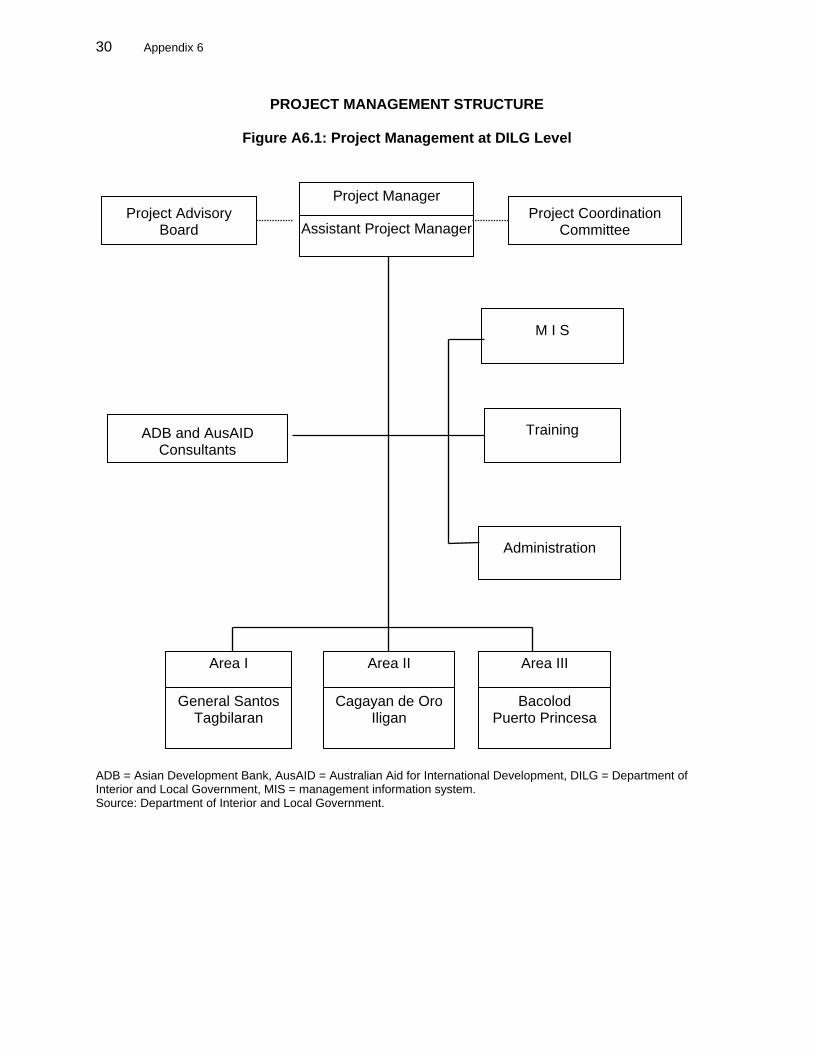
30 Appendix 6
PROJECT MANAGEMENT STRUCTURE
Figure A6.1: Project Management at DILG Level
ADB = Asian Development Bank, AusAID = Australian Aid for International Development, DILG = Department of Interior and Local Government, MIS = management information system. Source: Department of Interior and Local Government.
Project Manager
Assistant Project ManagerProject Coordination
Committee Project Advisory
Board
Training
M I S
Administration
Area II
Cagayan de Oro Iligan
Area III
Bacolod Puerto Princesa
Area I
General Santos Tagbilaran
ADB and AusAID Consultants
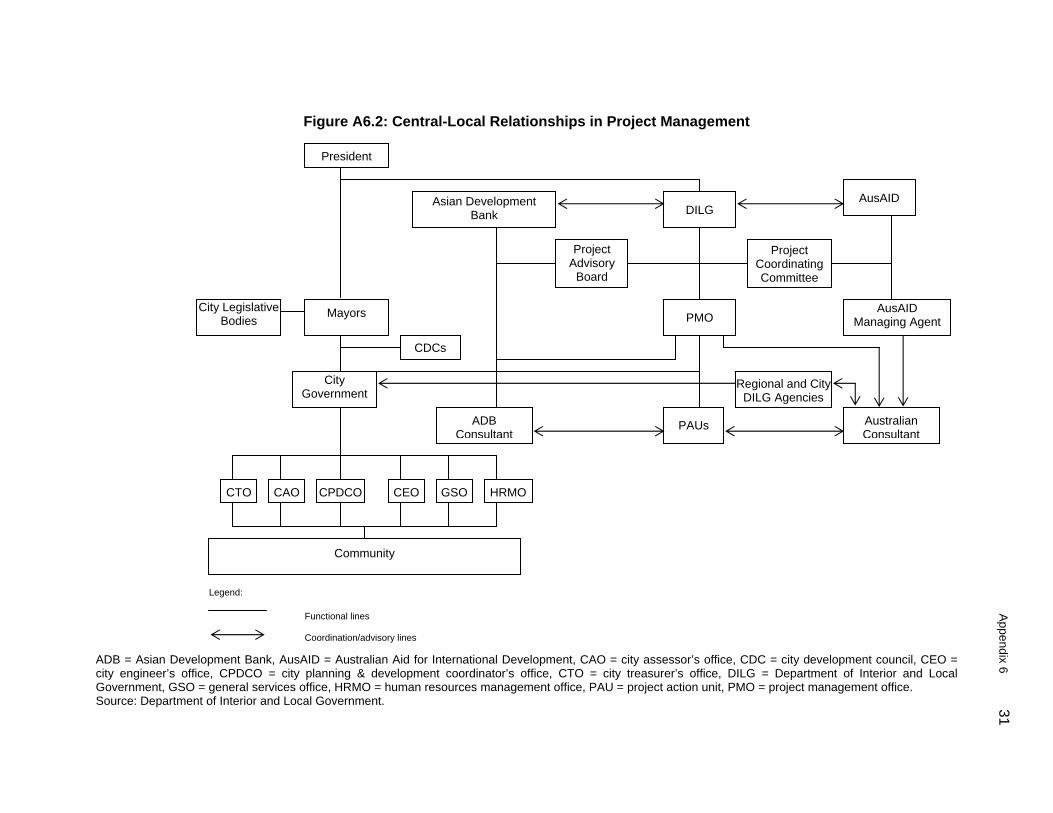
Appendix 6 31
Figure A6.2: Central-Local Relationships in Project Management
ADB = Asian Development Bank, AusAID = Australian Aid for International Development, CAO = city assessor’s office, CDC = city development council, CEO = city engineer’s office, CPDCO = city planning & development coordinator’s office, CTO = city treasurer’s office, DILG = Department of Interior and Local Government, GSO = general services office, HRMO = human resources management office, PAU = project action unit, PMO = project management office. Source: Department of Interior and Local Government.
President
Mayors
Regional and CityDILG Agencies
Asian Development Bank
PAUs
PMO
DILG
Australian Consultant
AusAID Managing Agent
AusAID
Project Coordinating Committee
ADB Consultant
Project Advisory
Board
City Legislative Bodies
City Government
CDCs
Community
CTO CAO CPDCO CEO GSO HRMO
Functional lines Coordination/advisory lines
Legend:

32 Appendix 6
Figure A6.3: City Project Management Structure
City Mayor
Assistant City Project Manager
City Project Manager
Project Action Committee
Support Group
Construction Management
and Supervision
Detailed Engineer-
ing Group
ADB Component
AusAID Component
Finance/Administration
MIS
Administration/ HRM Facilitator
Planning Develop-
ment Facilitator
Engineering and SWM Facilitator
LIS Facilitator
ADB = Asian Development Bank, AusAID = Australian Aid for International Development, LIS = land information system, SWM = solid waste management, HRM = human resources management, MIS = management information system. Source: Department of Interior and Local Government

Appendix 7 33
STATUS OF COMPLIANCE WITH LOAN COVENANTS
Covenant Reference in Loan Agreement
Status of Compliance
Particular Covenants 1. The Borrower shall cause DILG, DPWH, and the
LGUs to carry out the Project with due diligence and efficiency and in conformity with sound administrative, financial, engineering, environmental, and urban development practices.
Article IV, Section 4.01(a)
Complied with.
2. In carrying out the Project and operation of the project facilities, the Borrower shall perform, or cause to be performed, all obligations set forth in Schedule 6 to this Loan Agreement.
Article IV, Section 4.01(b)
Complied with.
3. The Borrower shall make available to DILG, DPWH, and the LGUs, promptly as needed, the funds, facilities, services, and other resources which are required, in addition to the proceeds of the loan and the AusAID grant, for carrying out the Project and for the operation and maintenance of the project facilities.
Article IV, Section 4.02
Complied with.
4. The Borrower shall cause DILG, DPWH, and the LGUs to carry out the Project in accordance with plans, design standards, specifications, work schedules, and construction methods acceptable to the Borrower and ADB.
Article IV, Section 4.03(b)
Complied with.
5. The Borrower shall ensure that the activities of DILG, DPWH, the LGUs, and its other departments and agencies with respect to carrying out the Project and operation of the project facilities are conducted and coordinated in accordance with sound administrative policies and procedures.
Article IV, Section 4.04
Complied with.
6. The Borrower, through DILG, DPWH, and the LGUs, shall make arrangements satisfactory to ADB for insurance of the project facilities to such extent and against such risks and in such amounts as shall be consistent with sound practice.
Article IV, Section 4.05(a)
Complied with.
7. The Borrower shall cause DPWH and the LGUs to ensure that the concerned project facilities are operated, maintained, and repaired in accordance with sound administrative, financial, engineering, environmental, urban development, and maintenance and operational practices.
Article IV Section 4.09
Complied with.
8. A PAB shall be established under the chairmanship of the DILG secretary, with members drawn from DPWH, NEDA, DOF, DBM, and a representative of the LGUs.
Schedule 6, para. 5
Complied with. PAB was created under the RMDP interagency MOA in July 1996. A technical committee was also created to support PAB activities.

34 Appendix 7
Covenant Reference in Loan Agreement
Status of Compliance
Sector Covenants 9. DILG shall establish and make operational a
Project Management Office (PMO) and designate a project manager with qualifications and experience satisfactory to ADB. The PMO shall be responsible for project management implementation, monitoring, and coordination among agencies of the Borrower and LGUs.
Schedule 6, para. 6
Complied with. PMO was established in July 1996.
10. Each LGU shall establish a Project Action Committee (PAC) to oversee project development, determine local policy guidelines for the relevant components, and provide local policy and planning direction.
Schedule 6, para. 7
Complied with.
11. Each LGU shall establish a Project Action Unit (PAU) under its City Planning and Development Office to be responsible for the detailed design and implementation of the LGUs’ components under the Project.
Schedule 6, para. 8
Complied with.
12. The training component under Part A.1 of the Project shall be implemented by DILG through the Local Government Academy, with consultant support for training development, and in close consultation with the LGUs.
Schedule 6, para. 9
Complied with. Development of training modules and conduct of training were incorporated into the project management consultants’ terms of reference, to synchronize activities with the AusAID component.
Environmental Covenants 13. Construction and procurement contracts for solid
waste management components of the Project will not be awarded until all necessary clearances are obtained from the Environmental Management Bureau.
RRP, Section VI, para. 91, Subsection C (iv)
ECC for Puerto Princesa and General Santos issued.
Social Covenants 14. No contract shall be awarded for construction of
the Bacolod public market, Iligan Drainage, and Lucena road until specific and detailed arrangements for location shall have been made with the affected individuals and implemented satisfactorily in accordance with applicable laws, regulations, and policies of the Government and the relevant LGUs.
RRP, Section VI, para. 91, Subsection C (iii)
Complied with. Iligan City resettlement plan was implemented in 2004. The Project relocated 123 families to Barangay Dalipuga.

Appendix 7 35
Covenant Reference in Loan
Agreement Status of Compliance
15. The Borrower shall maintain, or cause DILG, DPWH, and the LGUs to maintain, records and accounts for their respective components of the Project adequate to identify the goods and services and other items of expenditure financed out of the proceeds of the loan.
Article IV, Section 4.06(a)
Complied with.
Financial Covenants 16. The Borrower shall (i) cause DILG, DPWH, and
the LGUs to maintain separate accounts for their respective components of the Project; (ii) have such accounts and related financial statements consolidated and audited annually, in accordance with appropriate auditing standards consistently applied, by independent auditors whose qualifications, experience and terms of reference are acceptable to ADB; (iii) furnish to ADB, as soon as available but in any event not later than 12 months after the end of each related fiscal year, certified copies of such consolidated report of the auditors relating thereto.
Article IV, Section 4.06(b)
Complied with.
17. The Borrower shall enable ADB, upon ADB’s request, to discuss the financial statements of DILG, DPWH, and the LGUs for their respective components of the Project and their respective financial affairs related to the Project from time to time with the Borrower’s auditors, and shall authorize and require any representative of such auditors to participate in any such discussions requested by ADB.
Article IV, Section 4.06(c)
Complied with.
Economic Covenants 18. By 31 December 1996, or such other date as
may be agreed by ADB, each LGU shall, with assistance from PMO, develop and introduce specific, time-bound, financial, institutional, and operational action plans to improve revenue generation, collection efficiency, and operations and maintenance performance.
Schedule 6, para. 12
Complied with. Each LGU developed realistic time-bound action plans in collaboration with ADB review missions.
19. Each LGU shall, with the assistance from the PMO, prepare within 2 years after the Effective Date a time-bound plan for private sector participation in the operation and management of municipal enterprises and other appropriate municipal services such as public markets, bus terminals, and solid waste collection by 2000.
Schedule 6, para. 13(a)
Partly complied with. Although LGUs identified municipal services for possible privatization, no further efforts were made towards private sector participation in their operation and management.

36 Appendix 7
Covenant Reference in Loan
Agreement Status of Compliance
20. For as long as such facilities remain in the public sector, the LGUs shall set, impose, and regularly review fees, rentals, and other charges. For public markets and bus terminals, the charges shall be sufficient to ensure recovery of capital cost, debt service, operation and maintenance charges. For solid waste collection service, the charge shall be sufficient to recover operations and maintenance costs.
Schedule 6, para. 13(b)
Partly complied with. Cost recovery studies were prepared, though fees were found to be too high.
Others 21. Fielding of Consultants
In carrying out the Project, the Borrower shall cause competent and qualified consultants and contractors, acceptable to the Borrower and ADB, to be employed by DILG, DPWH, and the LGUs, to an extent and upon terms and conditions satisfactory to the Borrower and ADB.
Article IV, Section 4.03(a)
Complied with.
22. Progress Report: The Borrower, through DILG, shall furnish or cause to be furnished to ADB semiannual reports on carrying out the Project and on the operation and management of the project facilities.
Article IV, Section 4.07(b)
Complied with.
23. Budget Monitoring and Evaluation (BME) Report: The PMO shall develop a comprehensive BME system. Such BME shall provide for strong community involvement and shall cover public health and socioeconomic changes, environmental improvements, property value increases, and improvements in LGU operational efficiency.
Schedule 6, para. 16(a)
Complied with. The Government’s new results monitoring and evaluation have been instituted.
24. Promptly after physical completion of the Project, but in any event not later than 3 months thereafter or such later date as may be agreed for this purpose between the Borrower and ADB, the Borrower shall, through DILG, prepare and furnish to ADB a consolidated report, in such form and in such detail as ADB shall reasonably request, on the execution and initial operation of the Project, including its cost, the performance by the Borrower of its obligations under the Loan Agreement, and the accomplishment of the purposes of the loan.
Article IV, Section 4.07(c)
Complied with.
ADB = Asian Development Bank, AusAID = Australian Agency for Institutional Development, BME = benefits monitoring and evaluation, DBM = Department of Budget and Management, DILG = Department of the Interior and Local Government, DOF = Department of Finance, DPWH = Department of Public Works and Highways, ECC = Environmental Clearance Certificate, LGU = local government unit, MOA = memorandum of agreement, NEDA = National Economic and Development Authority, PAB = project advisory board, PAC = project action committee, PAU = project action unit, PMO = project management office, PMU = project management unit, RMDP = Regional Municipal Development Project, RRP = report and recommendation of the president.

Appendix 8 37
FINANCIAL AND ECONOMIC EVALUATION
A. Financial Analysis
1. Evaluation Approach 1. As was done at appraisal, a financial evaluation was performed only for the two bus and jeepney1 terminals, as well as the public market. The sanitary landfill underwent an economic analysis, rather than a financial analysis, because the revenues that are collected from business establishments only are insufficient to cover investments and operating costs. The bus terminals and market were evaluated in their entirety—not incrementally—since they are new facilities, not improvements to existing facilities. Cash flows were prepared based on (i) actual and projected revenues derived from user fees over the 20-year economic life of the subprojects, and (ii) costs that include investments and recurring operation and maintenance (O&M). Prices were set at 2005 levels.
2. Bus and Jeepney Terminal (Puerto Princesa City) 2. Vehicles. Buses, shuttle vans, jeepneys, multicabs,2 and tricycles use the terminal. Volumes were projected to 2021 based on 2004 and 2005 data, as well as the number of vehicle units of companies that use the facility. 3. Stalls and Office Space. Five stalls are available. An additional 24 stalls, whose construction has been deferred, were assumed to be available starting in 2007. Office space, currently occupied by two city offices, was assumed to be rented out in 2008. 4. User Fees. Per city ordinance, user fees include the terminal fee, parking fee, rental fees for stalls and office space, and toilet fee. Fees were assumed not to change until the 2007 elections. However, they were assumed to increase every 3 years starting in 2008 to cover at least cumulative inflation. Inflation was assumed to be 6% a year from 2008 onwards. 5. O&M Costs. Expenditures in 2004 were P3.0 million. For 2005, P3.1 million was allocated, which is 2.5% of investments. Projected O&M expenditures were based on the actual costs, increased annually based on inflation. 6. Weighted Average Cost of Capital (WACC). WACC was estimated at 11.53% based on a loan-equity mix of 38.2%:61.8%; with the Municipal Development Fund Office (MDFO) loan at 14% interest rate/year and equity at 10%.
3. Bus and Jeepney Terminal (Iligan City) 7. Vehicles. Buses, jeepneys, armaks,3 and vans use the terminal. Volumes were projected to 2022 based on 2004 and 2005 data, the number of vehicle units per company, and the expected volume of traffic diverted from the South Terminal starting in 2006. City officials will prioritize traffic coming from the southern towns of Kauswagan and Linamon.
1 Philippine-style minibus. 2 Small jeeps. 3 Pick-ups.

38 Appendix 8
8. Stalls. Varying in size from 15 to 32 square meters (m2), 23 stalls are available, while 12 stalls are occupied. As traffic volume increases, gradual occupancy was assumed until full utilization is achieved in 2007. An additional 10 mini-stalls (2–5 m2), which are planned to be made available starting in 2006, were assumed to be rented out in 2007. 9. User Fees. Fees include the terminal fee, rental fees for stalls, and toilet fee. Fees were assumed not to change until the local elections in 2007. However, they were assumed to increase every 3 years starting in 2008 based on cumulative inflation. Inflation was assumed to be 6% a year from 2008 onwards. 10. O&M Costs. Expenditures in 2003 and 2004 were P5.5 million and P6.0 million, respectively, or 4% of total investments. O&M expenditures were projected to 2022 based on current levels, increased annually based on inflation. 11. WACC. WACC was estimated at 10.75% based on a loan-equity mix of 18.7%:81.3%; with MDFO loan at 14% interest rate/year and equity at 10%.
4. Public Market (Iligan City) 12. Occupancy. Although completed in November 2002, the Bagsakan market has not been operational. During the Asian Development Bank (ADB) Project Completion Review Mission in September 2005, local officials indicated that efforts are being made to operate the facility in November 2005. The operation has started in January 2006. 13. Commercial Spaces. Thirty-two wholesaler stalls of 9 m2 each are available for lease, plus 28 small farmer areas (1.5 m2 each) and 22 wholesaler areas (4 m2 each). The city traffic division occupies 47 m2 of farmer and wholesaler areas. In the absence of any plan by the city, the analysis assumed continued occupancy of this space. For the remaining areas, full occupancy was assumed in 2008. 14. Fees. Fees were assumed not to change until 2007, after which they would increase based on cumulative inflation every 3 years until 2022. 15. WACC. WACC is estimated at 10.63% based on a loan-equity mix of 84.3%:15.7%, with MDFO loan of 14% interest rate/year and equity rate of 10%.
5. Financial Internal Rate of Return (FIRR) 16. Base case. Results of the financial evaluation, compared to appraisal estimates, are in Table A8.1. The FIRR for the Iligan bus terminal is 29.7% and for the public market is 20.1%. The FIRRs, which are above their computed WACC, are at par with or exceed appraisal estimates. The Puerto Princesa bus terminal has an FIRR of 10%, which is lower than the computed WACC and below the appraisal estimate. The main reasons for the deviation are the lower-than-expected revenue from stalls, whose construction has been deferred, and the continued occupancy of a large section of office space by nonpaying government offices.

Appendix 8 39
Table A8.1: Financial Internal Rates of Return FIRR (%) Project City Subproject At Appraisal At Completion Iligan Bus and jeepney terminal 23.8 29.7 Puerto Princesa Bus and jeepney terminal 31.5 10.0 Public market 20.6 20.1 FIRR = financial internal rate of return. LGUs of Puerto Princesa and Iligan. 17. Sensitivity Analysis. Three scenarios were tested to evaluate their impact on the financial viability of the three subprojects: (i) increasing O&M by 20%, (ii) reducing revenue by 10%, and (iii) combining both scenarios. The results are in Table A8.2.
Table A8.2: FIRR Sensitivity Analysis FIRR (%) Project City Subproject Case 1 Case 2 Case 3 Iligan Bus and jeepney terminal 29.3 28.0 27.5 Puerto Princesa Bus and jeepney terminal 8.6 8.6 7.1 Public market 19.6 18.6 18.2 FIRR = financial internal rate of return LGUs of Puerto Princesa and Iligan. B. Economic Analysis
1. Evaluation Approach 18. As was done at appraisal, nonrevenue subprojects (drainage, national road improvement, maintenance workshops, and equipment), including the sanitary landfill, underwent an economic analysis. Financial costs (capital investment and O&M) were reduced by the amount of duties and taxes, and were converted to economic costs by applying (i) a shadow exchange rate factor of 1.2 to tradable components, and (ii) a shadow wage rate factor for unskilled labor of 0.6 following the National Economic Development Authority guidelines. Benefits were valued at 2005 prices and converted to their economic equivalent by using a standard conversion factor of 0.83. The economic internal rates of return (EIRR) were computed using a discount rate of 12%, which is the assumed economic opportunity cost of capital (EOCC).
2. Drainage System Improvement (Iligan City) 19. Benefits. The reduction in damage to properties (residential, commercial) within the influence area of the Salabao drainage channel was the only benefit considered. As health benefits were difficult to quantify, they were not included in the analysis. 20. Beneficiaries. Beneficiaries include households and commercial establishments along the Salabao channel (Barangay Saray), as well as the adjoining Barangay Villaverde and Barangay San Miguel along the intersecting Baslayan Creek. Approximately 20% of the population resides within the drainage influence area. Commercial establishments conservatively were assumed at 5% of residential structures.

40 Appendix 8
21. Flood Damage. Direct flood damage was calculated based on (i) the average residential floor area of 42.5–68 m2 (geographic information system data) and 375 m2 for commercial, (ii) property value (from the city property tax division) of P1,863–P3,519/m2 for residential and P3,623/m2 for commercial structures, and (iii) flood damage coefficient (based on a previous study) of 4.4%. Indirect damage was maintained at 15% of direct damage, as assumed at appraisal. 22. O&M Costs. Expenditures in 2003 and 2004 averaged P1.0 million, or 4.5% of capital investments. This ratio was used to project O&M to 2022.
3. National Road Improvement (Iligan City) 23. Benefits. The benefits considered were savings in vehicle operating costs (VOC), and travel time savings. VOC and vehicle count data were obtained through Department of Public Works and Highways surveys. Traffic volumes were projected to 2023 using average growth rates of 5–7.8% for different types of vehicle. Time savings were estimated using (i) “with” and “without” project estimates of travel time within the 4.7 kilometer (km) highway, (ii) passenger volume based on traffic, and (iii) assumptions of gainful employment of 52% and per capita income of P21,084 (2005). The analysis did not consider possible traffic diversion to the planned C-3 road. 24. O&M Costs. These were estimated at 2.5% of investments.
4. Sanitary Landfill (Puerto Princesa City) 25. Benefits. Economic benefits include (i) the imputed revenue based on each household’s willingness to pay, and (ii) the value of recyclable materials. Health benefits were not considered due to quantification problems. Fee revenue was assumed to come from households not currently levied the service fees, and estimated at 1% of average household monthly income of P5,365. The value of recyclable materials was computed using the following assumptions (i) waste generation of 0.58 kilogram (kg)/capita, (ii) nonbiodegradable materials of 52% of total wastes collected, (iii) recyclable materials comprising a maximum of 25% of segregated wastes, and (iv) saleable recyclable materials making up 60%. The composition of recyclables, based on an earlier study, were 10% tin cans, 45% cartons, 30% plastics, and 15% other materials. Existing prices per kg for recyclables are P60 for cans, P9 for cartons, P13 for plastics, and P3 for other materials. 26. Costs. Investments include capital investments for the four remaining phases of the landfill, as estimated in the feasibility study, to extend the analysis to a full 20-year life. The current phase of 2.8 hectares (ha) (with an investment of P106,892 million) is estimated to have a useful life of only 4–5 years. Investment estimates for the other phases (P210,002 million), calculated in 1999, were adjusted to 2005 prices using inflation and applied in 2008, 2014, 2017, and 2020. O&M costs, which totaled P17 million in 2005, were projected at 7.5% of investments.
5. Solid Waste Management (SWM) Equipment (Tagbilaran City) 27. Benefits. An incremental analysis was used to evaluate the benefits from additional wastes collected by the two additional 10-ton compactors. Benefits include the imputed revenue from households, and the value of recyclable materials. Revenue was computed based on (i) per capita waste generation of 0.45 kg; (ii) collection frequency of two trips per day; and (iii)

Appendix 8 41
service fee of P100 per year, as per existing policy, increasing to P300 as proposed in 2008 (In 2011 it will have reached P400). The market value of recyclables was estimated assuming nonbiodegradables of 37%, maximum recyclables of 15%, and saleable recyclables of 60%. Composition of recyclables includes tin cans (10%), cartons (45%), plastics (30%), and others (15%), with market prices of P60, P9, P13, and P3 per kg, respectively. 28. O&M Costs. These include the salaries for one driver and two collectors for each compactor at P75,000 and P59,388, respectively. The salaries are based on (i) prevailing rate for each position; (ii) personnel benefits of 20% of salaries; and (iii) costs of diesel, oil, repairs, and maintenance. Diesel consumption is 2 km to a liter; repairs and maintenance were based on current costs.
6. Maintenance Workshops and Equipment (Puerto Princesa, Tagbilaran)
29. Benefits. These include savings on equipment rental for local infrastructure construction and maintenance. The amount of savings was assumed at 20% of investments for road maintenance, and 60% for new constructions, per estimates of the respective city engineering units. Investments were increased by 25% annually for Tagbilaran and by inflation for Puerto Princesa, per suggestions of the city planning and engineering units based on previous allocations. 30. Costs. Investments include procurement of new equipment to replace depreciated units with an assumed of only 5 years. New investments in equipment were needed to make full use of the economic life of the maintenance workshop facilities.
7. Economic Internal Rate of Return (EIRR) 31. Base Case. Results of the economic evaluation, compared to appraisal estimates, are in Table A8.3. Except for the maintenance workshop and equipment (Tagbilaran), the EIRRs for all subprojects were above the EOCC. However, the EIRR for the maintenance workshop and equipment (Puerto Princesa) and drainage were lower than appraisal estimates. The lower-than-expected savings from equipment, the reduced scope of the drainage subproject, and the exclusion of health benefits accounted for the reduction in the EIRRs. Low infrastructure investments and replacement costs for equipment also reduced the EIRR for workshop/equipment (Tagbilaran) to 6.4%.
Table A8.3: Economic Internal Rates of Return EIRR (%) Project City Subproject Appraisal At Completion Puerto Princesa Sanitary landfill 11.4 16.2 Maintenance workshop/equipment 26.3 20.8 Tagbilaran SWM equipment - 18.6 Maintenance workshop/equipment 17.0 7.7 Iligan Drainage improvement 22.5 12.6 National road improvement 20.1 39.0 EIRR = economic internal rate of return, swm = solid waste management. Source: LGUs of Puerto Princesa, Tagbilaran and Iligan. 32. Sensitivity Analysis. The impact of three scenarios on subproject economic viability was tested: (i) increasing O&M by 20%, (ii) reducing benefits by 10%, and (iii) combining the increased O&M and reduced benefits. The results are in Table A8.4.
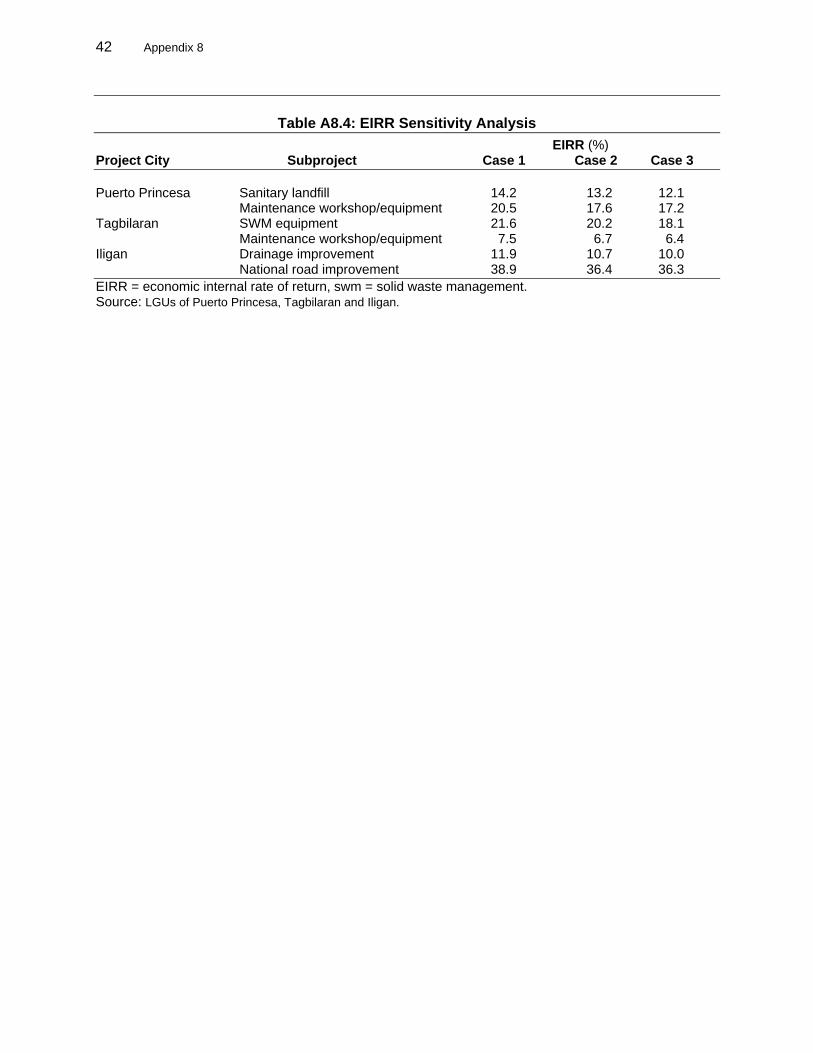
42 Appendix 8
Table A8.4: EIRR Sensitivity Analysis
EIRR (%) Project City Subproject Case 1 Case 2 Case 3 Puerto Princesa Sanitary landfill 14.2 13.2 12.1 Maintenance workshop/equipment 20.5 17.6 17.2 Tagbilaran SWM equipment 21.6 20.2 18.1 Maintenance workshop/equipment 7.5 6.7 6.4 Iligan Drainage improvement 11.9 10.7 10.0 National road improvement 38.9 36.4 36.3 EIRR = economic internal rate of return, swm = solid waste management. Source: LGUs of Puerto Princesa, Tagbilaran and Iligan.

Appendix 8 43
Table A8.5: Financial and Economic Internal Rates of Return
FIRR (%) EIRR (%) Project City/Location
Subproject Appraisal Actual Appraisal Actual Reasons for Deviation from Appraisal Estimates
I. Puerto Princesa Sanitary Landfill 11.4 16.2 High value of recyclable materials as subproject benefit.
Bus and Jeepneya
Terminal 31.5 10.0 Low fees; planned stalls not constructed; large section of
office space occupied by nonpaying government offices. Maintenance
Workshopb 26.3 20.8 Reinvestments in workshop tools and equipment with
shorter economic life to match the economic life of the workshop facility.
Motorpool Equipment
II. Tagbilaran SWM Equipment 18.6 No EIRR estimate at appraisal; reduced amount of equipment (two of the three originally planned.)
Maintenance Workshopc
17.0 7.7 Low utilization of equipment due to low levels of investments in infrastructure development and road maintenance; reinvestments in equipment to match economic life of workshop facility.
Motorpool Equipment
III. Iligan Drainage System Improvement
22.5 12.6 Reduced scope of subproject from three creeks to one; exclusion of health improvement as economic benefit.
Bus and Jeepney Terminal
23.8 29.7 High rental fees for stalls; mini-stalls made available.
Public Market 20.6 20.1 Delayed revenue compensated by higher occupancy rate of stalls due to assumed diversion of agricultural crop deliveries from Pala-o market; reduced rental revenue due to occupation of rentable stall spaces by a government office.
IV. Iligan National Road Component
20.1 39.0 Assumes no diversion of traffic to planned C-3; shorter travel time due to larger road capacity as a result of wider roadway and widening of Mandulog Bridge.
EIRR = economic internal rate of return, FIRR = financial internal rate of return, SWM = solid waste management. a Philippine-style minibus. b Based on recalculated internal rates of return in the report and recommendation of the President for Regional Municipal Development Project (ADB. 1995.
Report and Recommendation of the President to the Board of Directors on a Proposed Loan to the Republic of the Philippines for the Regional Municipal Development Project. Manila (approved 8 August).
c The economic evaluation of this subproject includes the motorpool equipment. Source: LGUs of Puerto Princesa, Tagbilaran, and Iligan.