Quality by design (QbD) in process development - …€¦ · Process mapping Risk analysis DoE...
54
Quality by design (QbD) in process development DCVMN 10 March 2017
Transcript of Quality by design (QbD) in process development - …€¦ · Process mapping Risk analysis DoE...
Quality by design (QbD) in process development
DCVMN 10 March 2017
Product quality cannot be ensured by inspections, it has to be designed into the product by a robust production process
Process mapping Risk analysis
DoEDesign space
definition
3
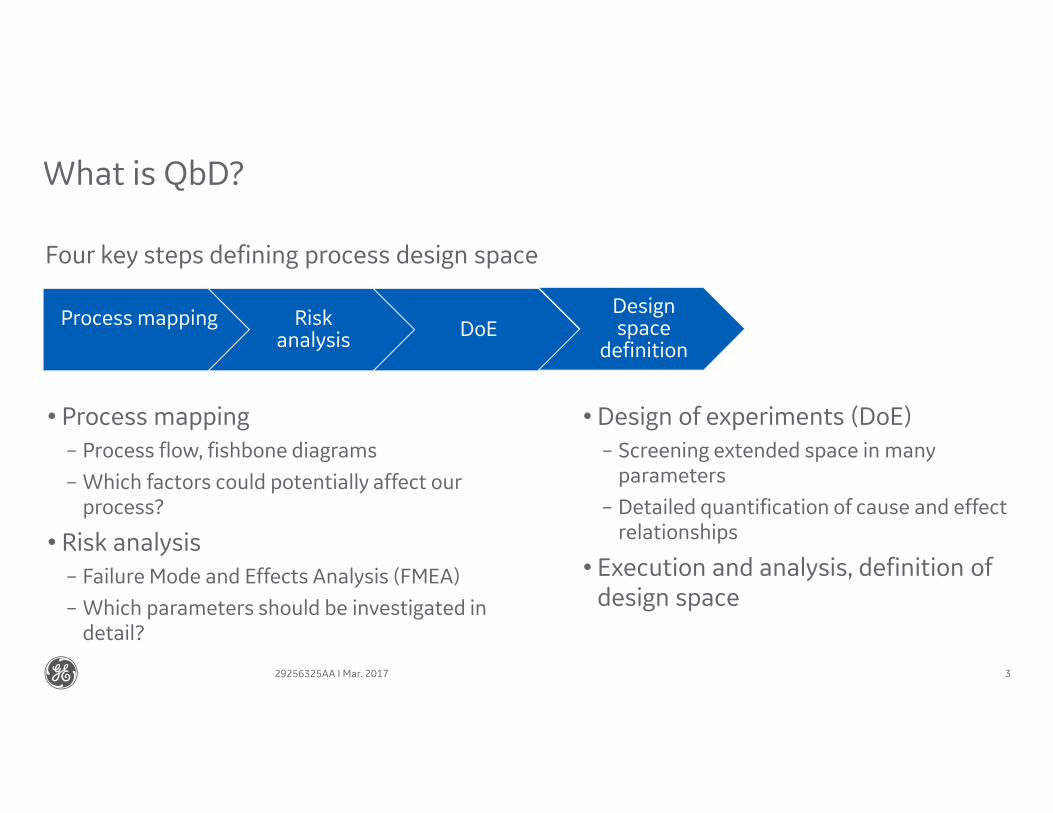
What is QbD?
• Process mapping
– Process flow, fishbone diagrams
– Which factors could potentially affect our process?
• Risk analysis
– Failure Mode and Effects Analysis (FMEA)
– Which parameters should be investigated in detail?
• Design of experiments (DoE)
– Screening extended space in many parameters
– Detailed quantification of cause and effect relationships
• Execution and analysis, definition of design space
Four key steps defining process design space
29256325AA I Mar. 2017
4
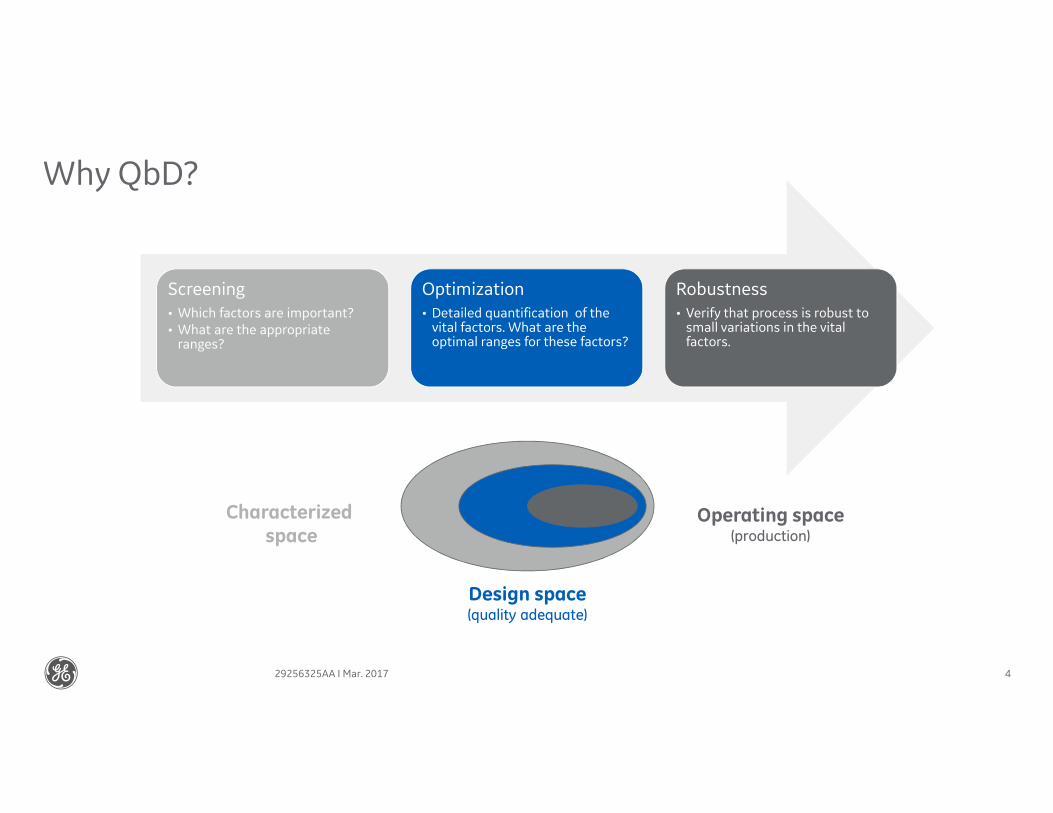
Why QbD?
Screening
• Which factors are important?• What are the appropriate
ranges?
Optimization
• Detailed quantification of the vital factors. What are the optimal ranges for these factors?
Robustness
• Verify that process is robust to small variations in the vital factors.
Operating space(production)
Characterized space
Design space(quality adequate)
29256325AA I Mar. 2017
Risk analysis
6
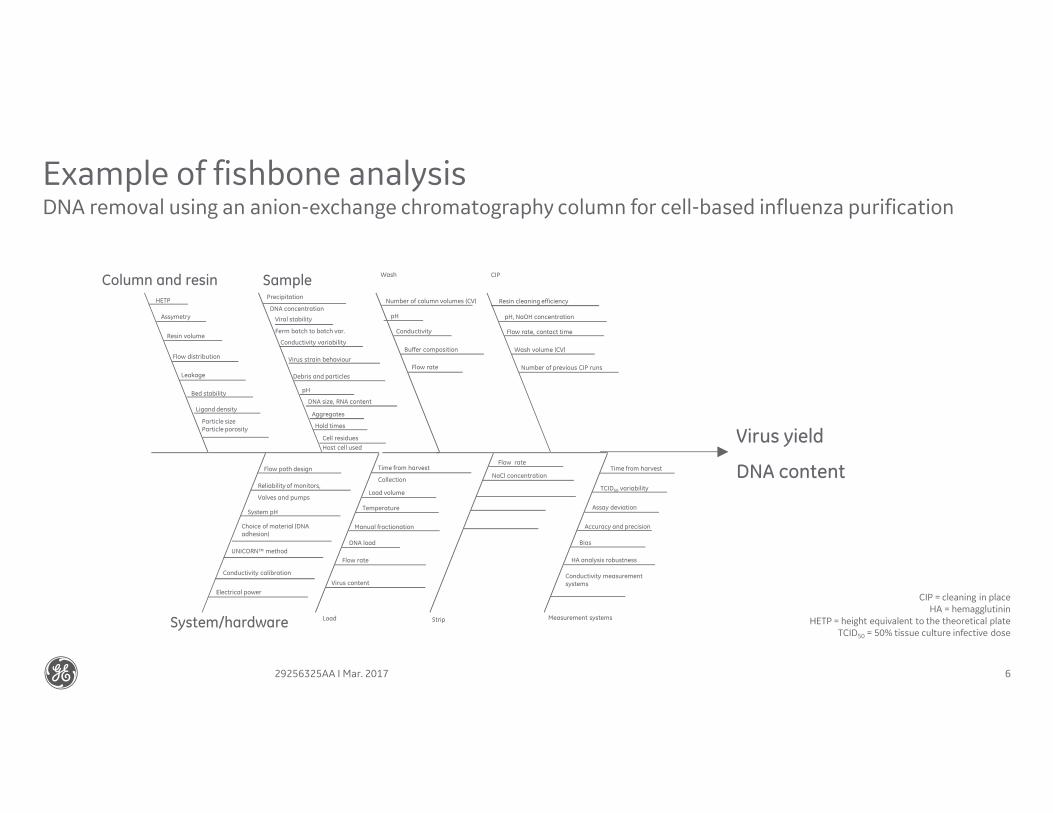
Example of fishbone analysisDNA removal using an anion-exchange chromatography column for cell-based influenza purification
Cell residues
Host cell used
Column and resinHETP
Assymetry
Resin volume
Flow distribution
Leakage
Bed stability
Ligand density
SamplePrecipitation
DNA concentration
Viral stability
Ferm batch to batch var.
Conductivity variability
Virus strain behaviour
Debris and particles
pH
Hold times
pH
Wash
Conductivity
Buffer composition
Flow rate
Number of column volumes (CV)
CIP
pH, NaOH concentration
Flow rate, contact time
Wash volume (CV)
Number of previous CIP runs
Resin cleaning efficiency
Measurement systems
Conductivity measurement systems
Bias
TCID50 variability
Time from harvest
Assay deviation
Accuracy and precision
HA analysis robustness
Strip
NaCl concentration
Flow rate
Load
DNA load
Load volume
Time from harvest
Collection
Temperature
Manual fractionation
Flow rate
Virus content
System/hardware
Flow path design
Reliability of monitors,
Valves and pumps
System pH
Choice of material (DNA adhesion)
Virus yield
DNA content
UNICORN™ method
Conductivity calibration
Electrical power
Particle size Particle porosity
DNA size, RNA content
Aggregates
CIP = cleaning in placeHA = hemagglutinin
HETP = height equivalent to the theoretical plateTCID50 = 50% tissue culture infective dose
29256325AA I Mar. 2017
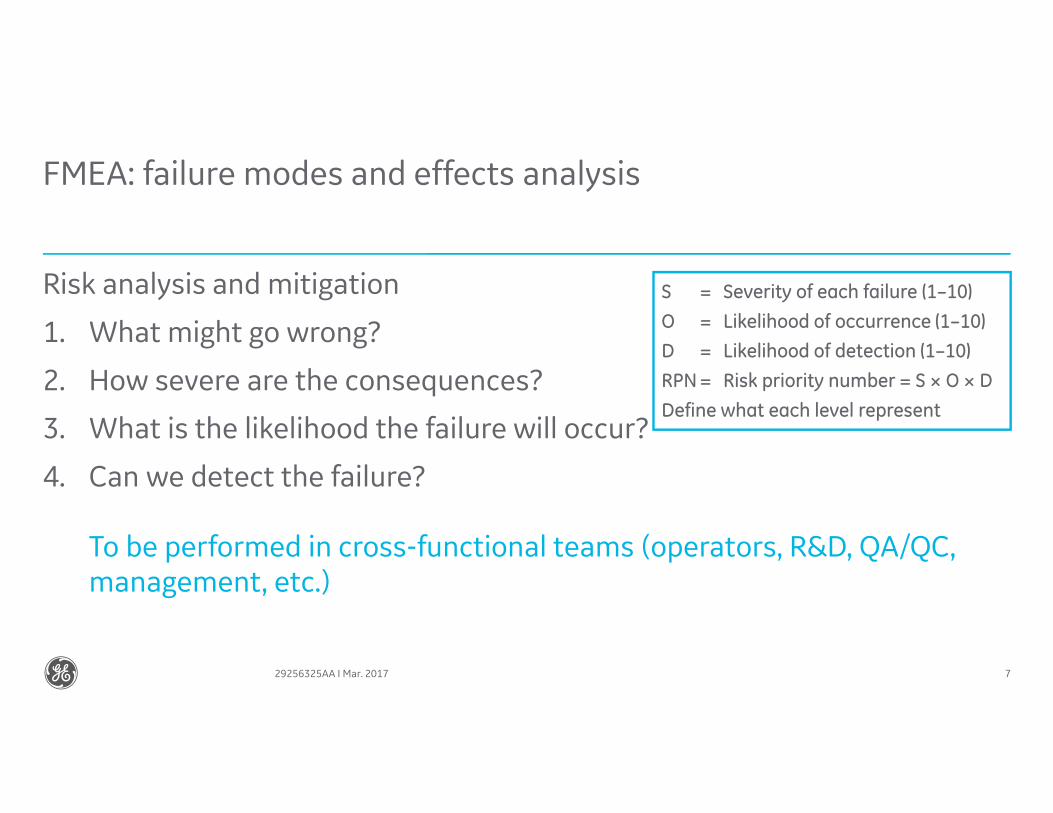
FMEA: failure modes and effects analysis
Risk analysis and mitigation
1. What might go wrong?
2. How severe are the consequences?
3. What is the likelihood the failure will occur?
4. Can we detect the failure?
To be performed in cross-functional teams (operators, R&D, QA/QC, management, etc.)
7
S = Severity of each failure (1–10)
O = Likelihood of occurrence (1–10)
D = Likelihood of detection (1–10)
RPN = Risk priority number = S × O × D
Define what each level represent
29256325AA I Mar. 2017
DoE essentials
What is DoE?
DoE is a systematic way of changing process inputs and analyzing the resulting process outputs in order to quantify the cause and effect relationship between them while using a minimum number of runs.
929256325AA I Mar. 2017
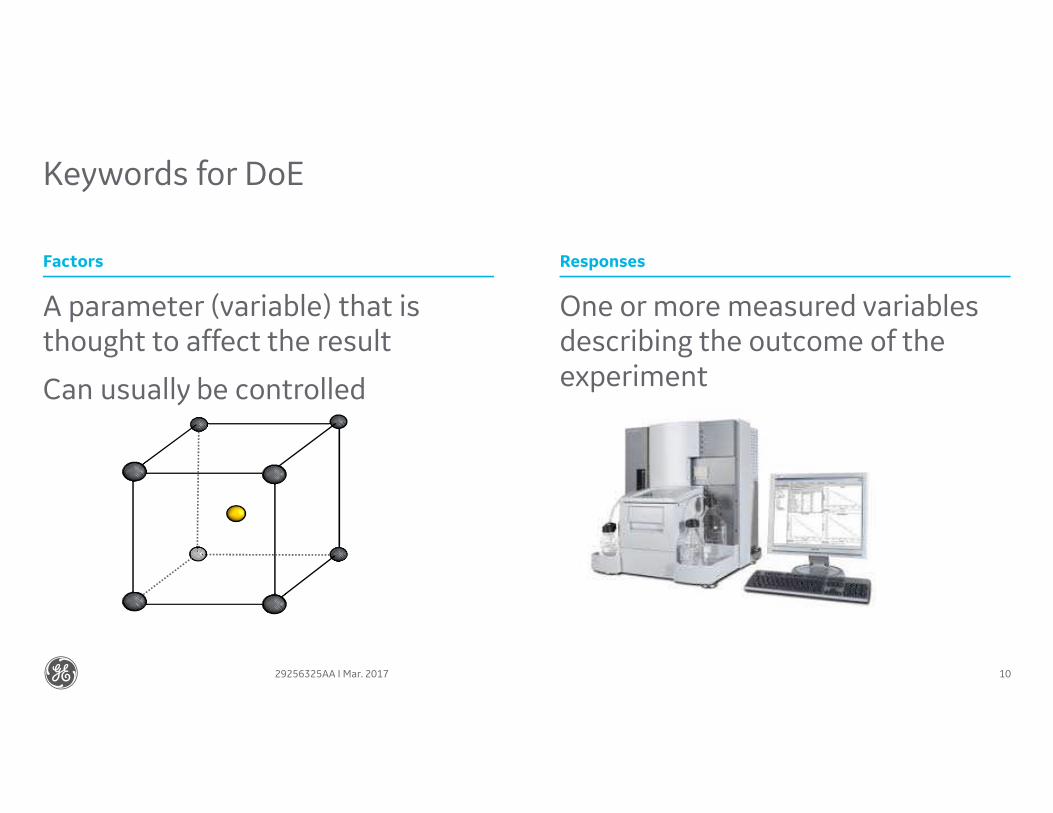
Keywords for DoE
A parameter (variable) that is thought to affect the result
Can usually be controlled
One or more measured variables describing the outcome of the experiment
Factors Responses
1029256325AA I Mar. 2017
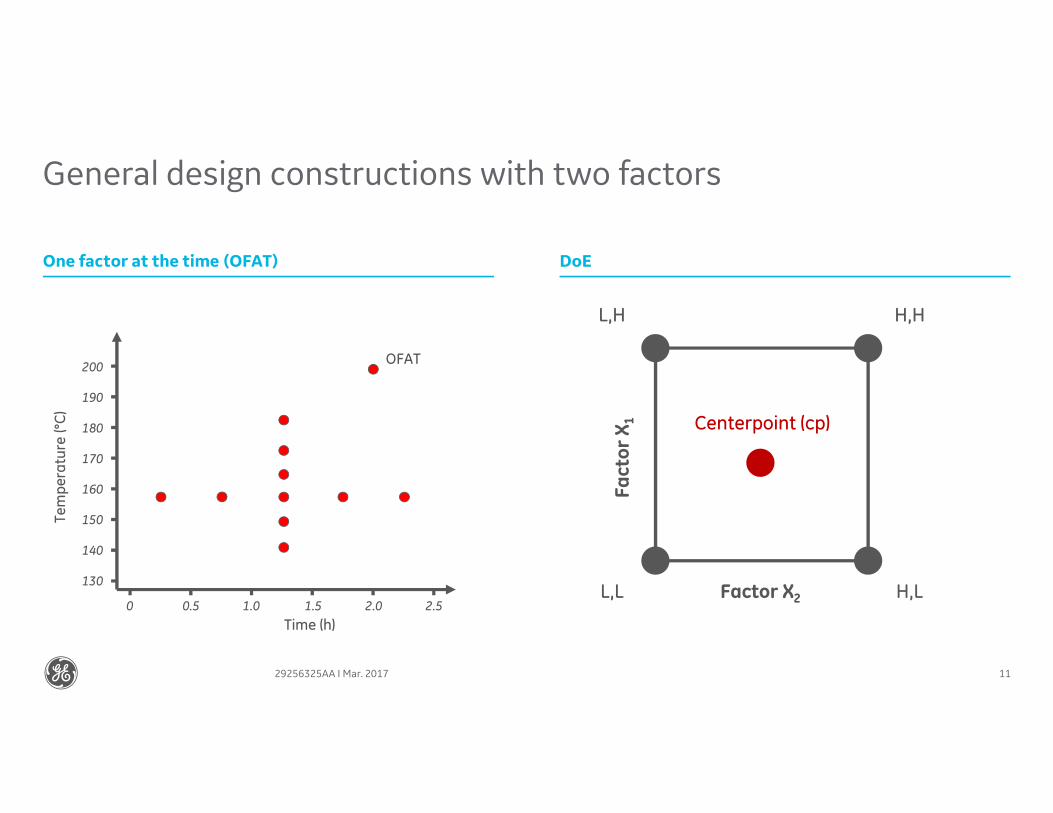
General design constructions with two factors
One factor at the time (OFAT) DoE
11
200
130
190
180
170
160
150
140
0 2.50.5 1.0 1.5 2.0
Te
mp
era
ture
(°C
)
Time (h)
OFAT
Factor X2
Fa
cto
r X
1
L,L
L,H H,H
H,L
Centerpoint (cp)
29256325AA I Mar. 2017
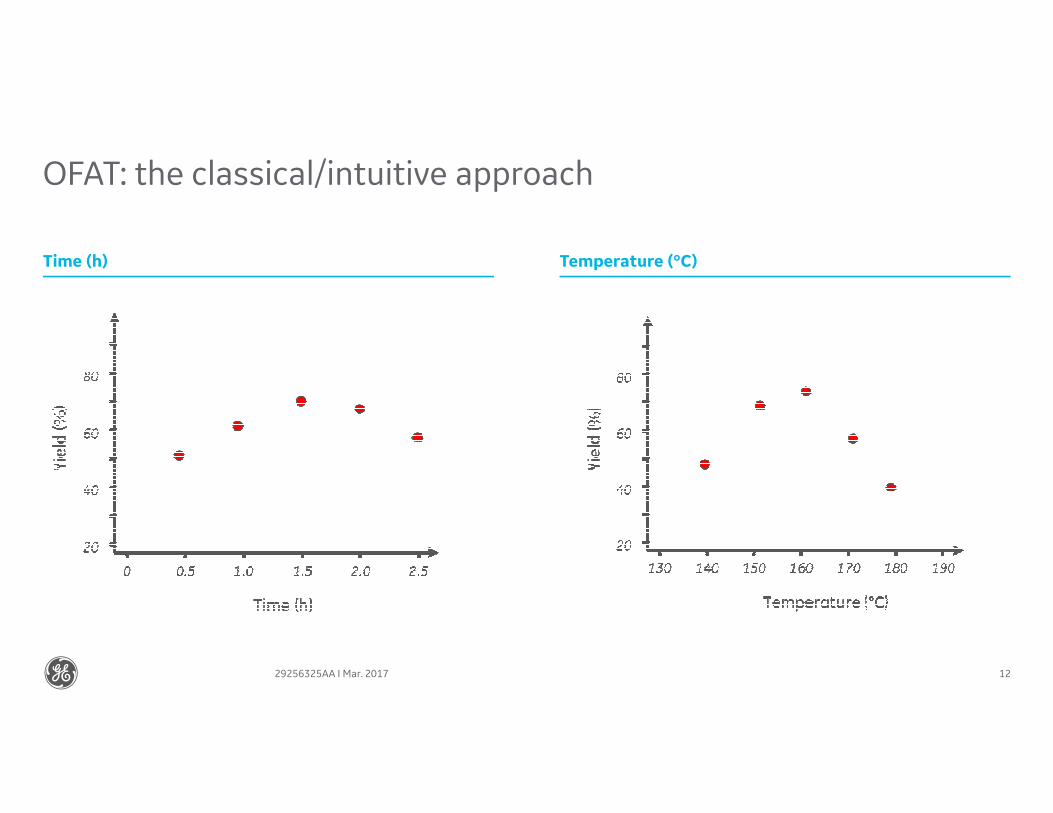
OFAT: the classical/intuitive approach
Time (h) Temperature (°C)
1229256325AA I Mar. 2017
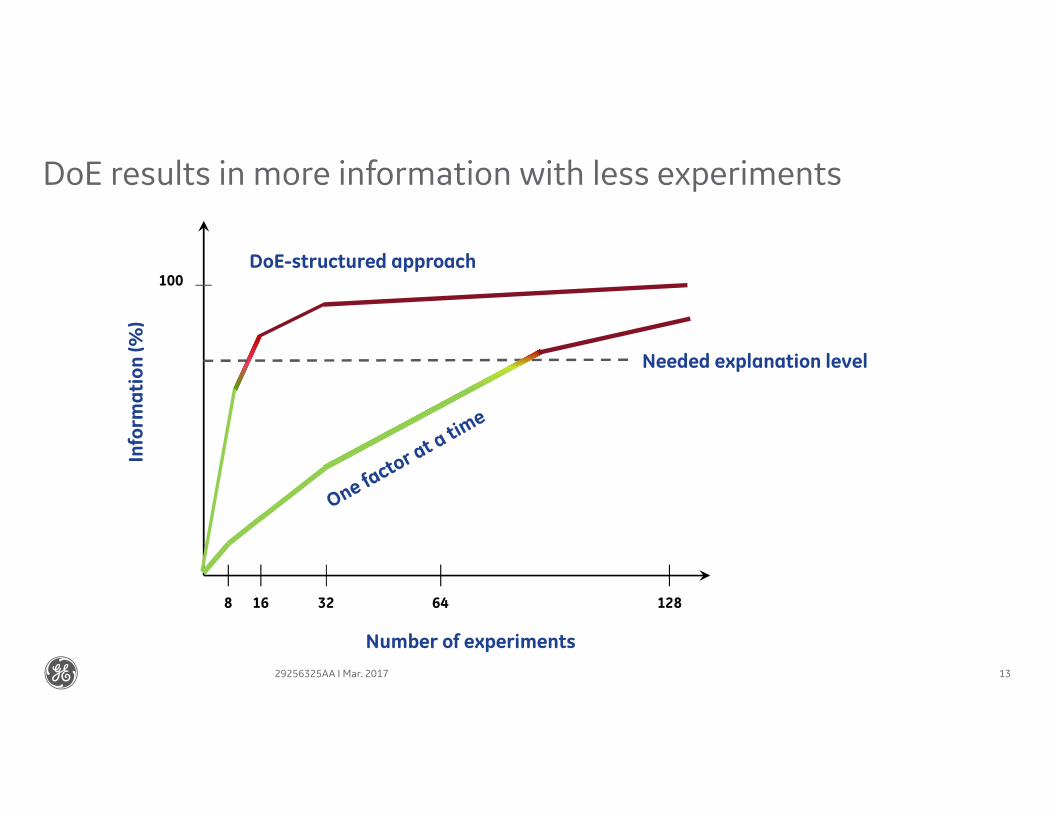
DoE results in more information with less experiments
13
8 16 32 64 128
100DoE-structured approach
Number of experiments
Info
rma
tio
n (
%)
Needed explanation level
29256325AA I Mar. 2017
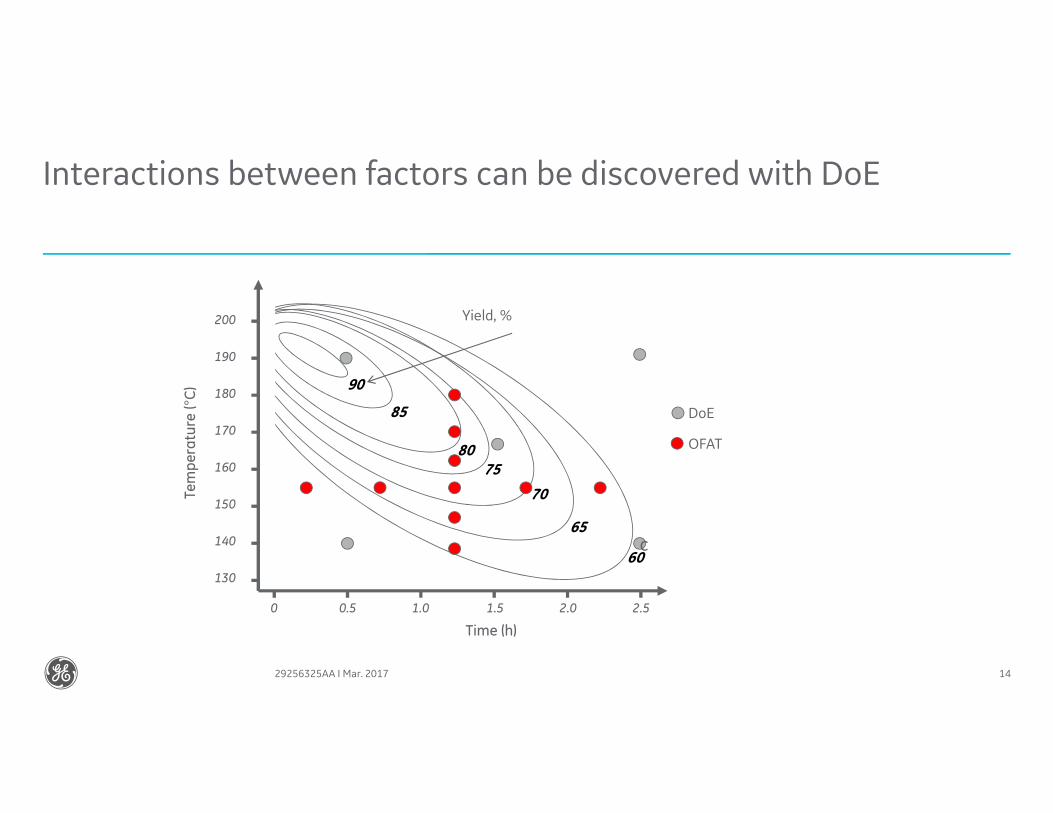
Interactions between factors can be discovered with DoE
14
60
65
70
80
85
90
75
200
130
190
180
170
160
150
140
0 2.50.5 1.0 1.5 2.0
Tem
pe
ratu
re (°C
)
Time (h)
Yield, %
DoE
OFAT
c
29256325AA I Mar. 2017
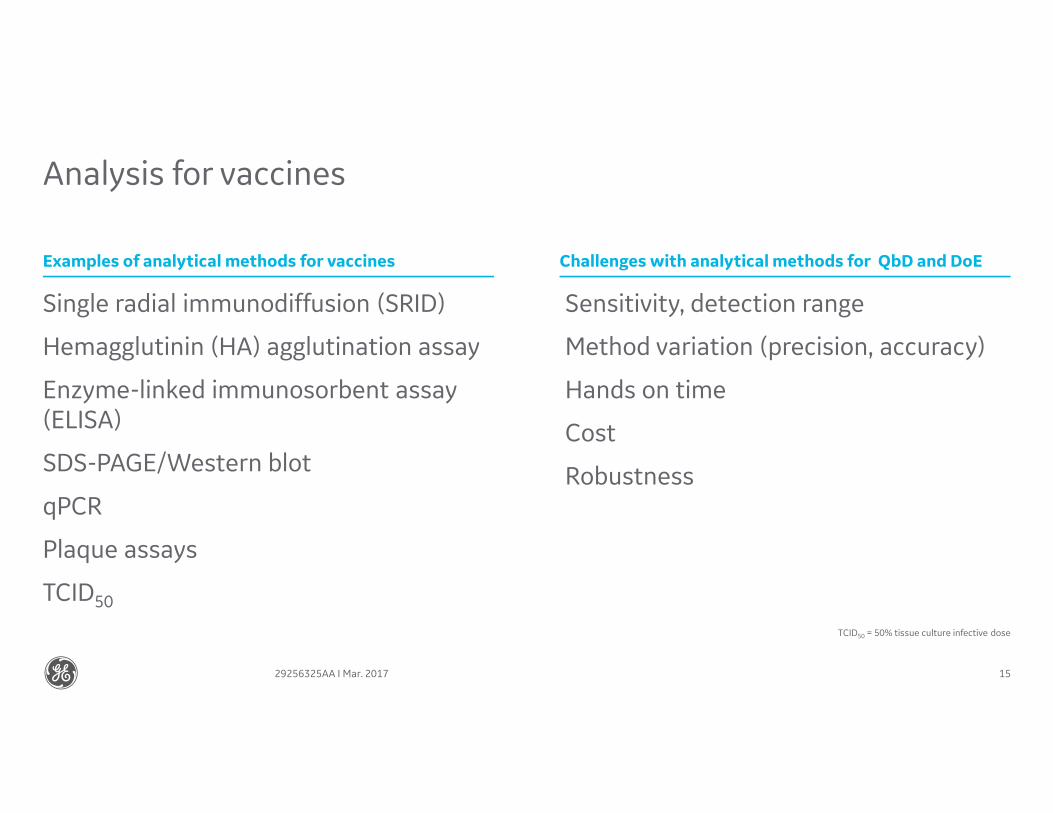
Analysis for vaccines
Single radial immunodiffusion (SRID)
Hemagglutinin (HA) agglutination assay
Enzyme-linked immunosorbent assay (ELISA)
SDS-PAGE/Western blot
qPCR
Plaque assays
TCID50
Sensitivity, detection range
Method variation (precision, accuracy)
Hands on time
Cost
Robustness
Examples of analytical methods for vaccines Challenges with analytical methods for QbD and DoE
15
TCID50 = 50% tissue culture infective dose
29256325AA I Mar. 2017
DoE case study:DNA reduction in vaccine processing
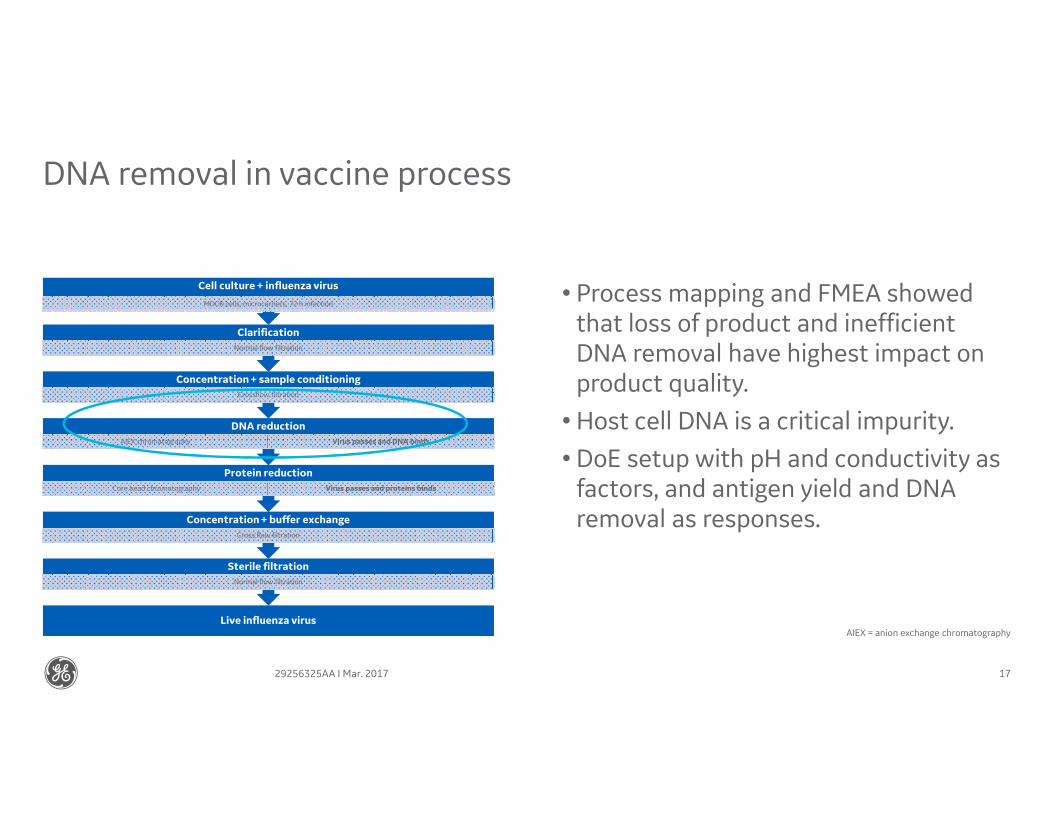
Live influenza virus
Sterile filtration
Normal flow filtration
Concentration + buffer exchange
Cross flow filtration
Protein reduction
Core bead chromatography Virus passes and proteins binds
DNA reduction
AIEX chromatography Virus passes and DNA binds
Concentration + sample conditioning
Crossflow filtration
Clarification
Normal flow filtration
Cell culture + influenza virus
MDCK cells, microcarriers, 72 h infection
DNA removal in vaccine process
17
• Process mapping and FMEA showed that loss of product and inefficient DNA removal have highest impact on product quality.
• Host cell DNA is a critical impurity.
• DoE setup with pH and conductivity as factors, and antigen yield and DNA removal as responses.
AIEX = anion exchange chromatography
29256325AA I Mar. 2017
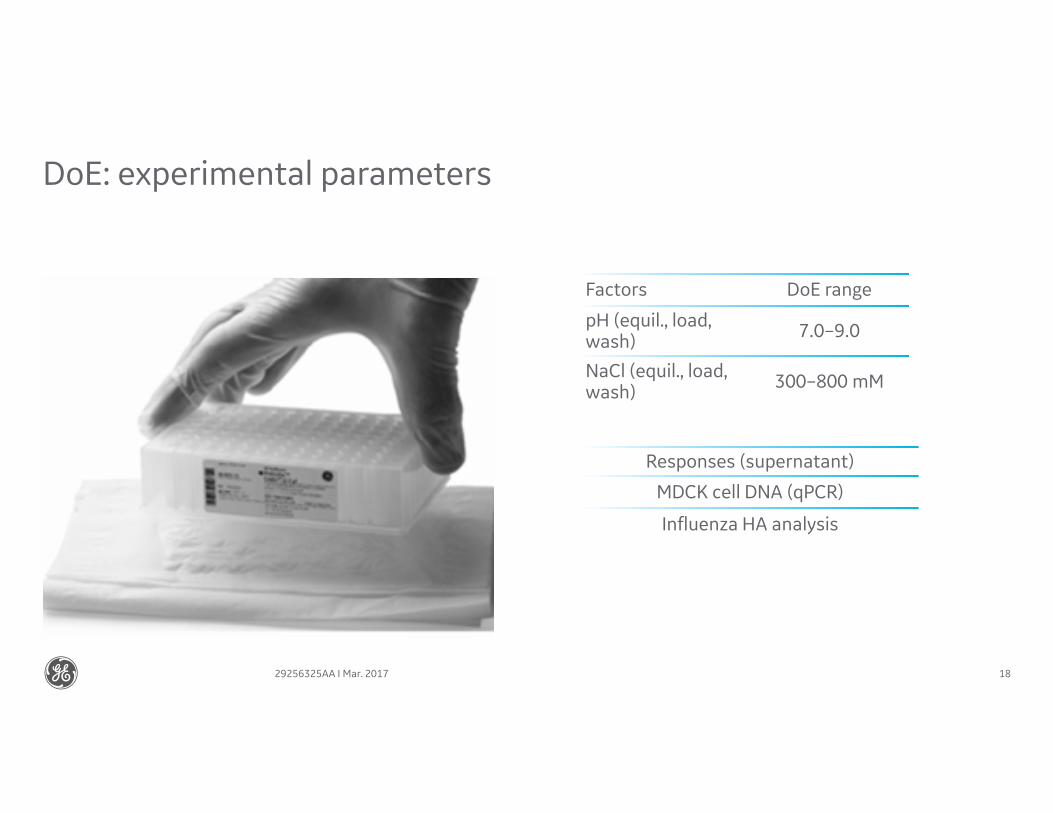
DoE: experimental parameters
18
Factors DoE range
pH (equil., load, wash)
7.0–9.0
NaCl (equil., load, wash)
300–800 mM
Responses (supernatant)
MDCK cell DNA (qPCR)
Influenza HA analysis
29256325AA I Mar. 2017
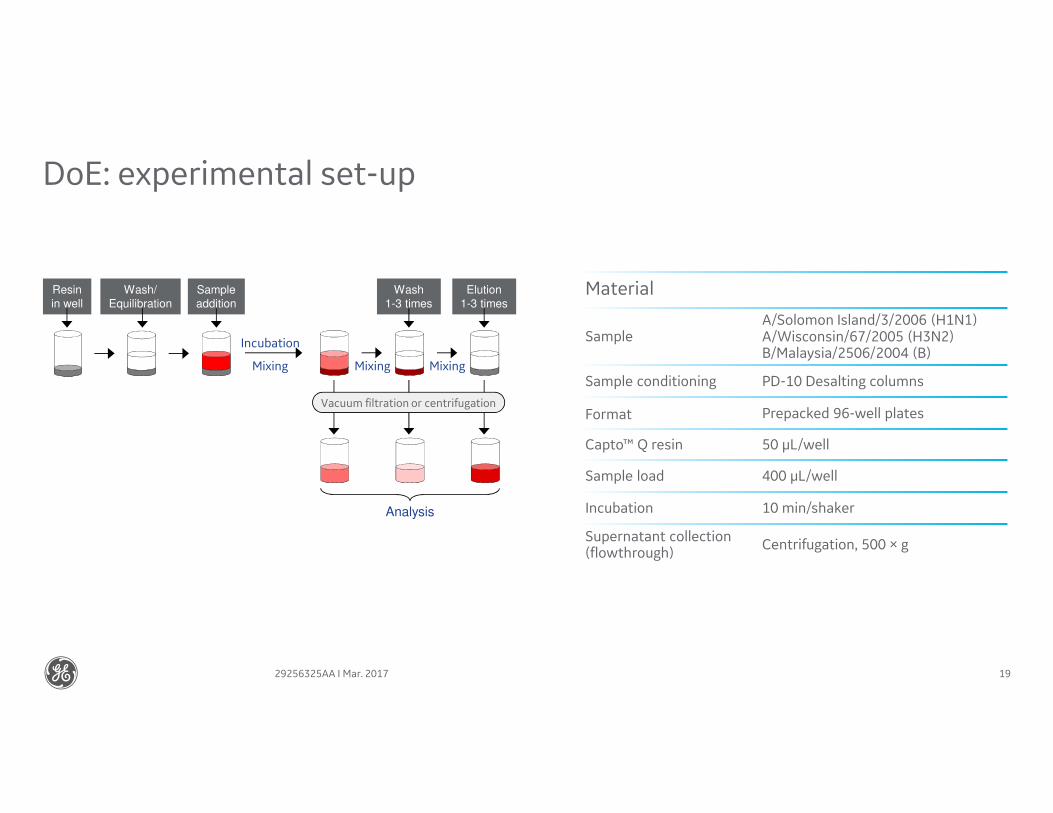
DoE: experimental set-up
19
Material
SampleA/Solomon Island/3/2006 (H1N1)A/Wisconsin/67/2005 (H3N2)B/Malaysia/2506/2004 (B)
Sample conditioning PD-10 Desalting columns
Format Prepacked 96-well plates
Capto™ Q resin 50 µL/well
Sample load 400 µL/well
Incubation 10 min/shaker
Supernatant collection(flowthrough)
Centrifugation, 500 × g
Resin
in well
Wash/
Equilibration
Sample
addition
Wash
1-3 times
Elution
1-3 times
Incubation
Vacuum filtration or centrifugation
Mixing Mixing Mixing
Analysis
29256325AA I Mar. 2017
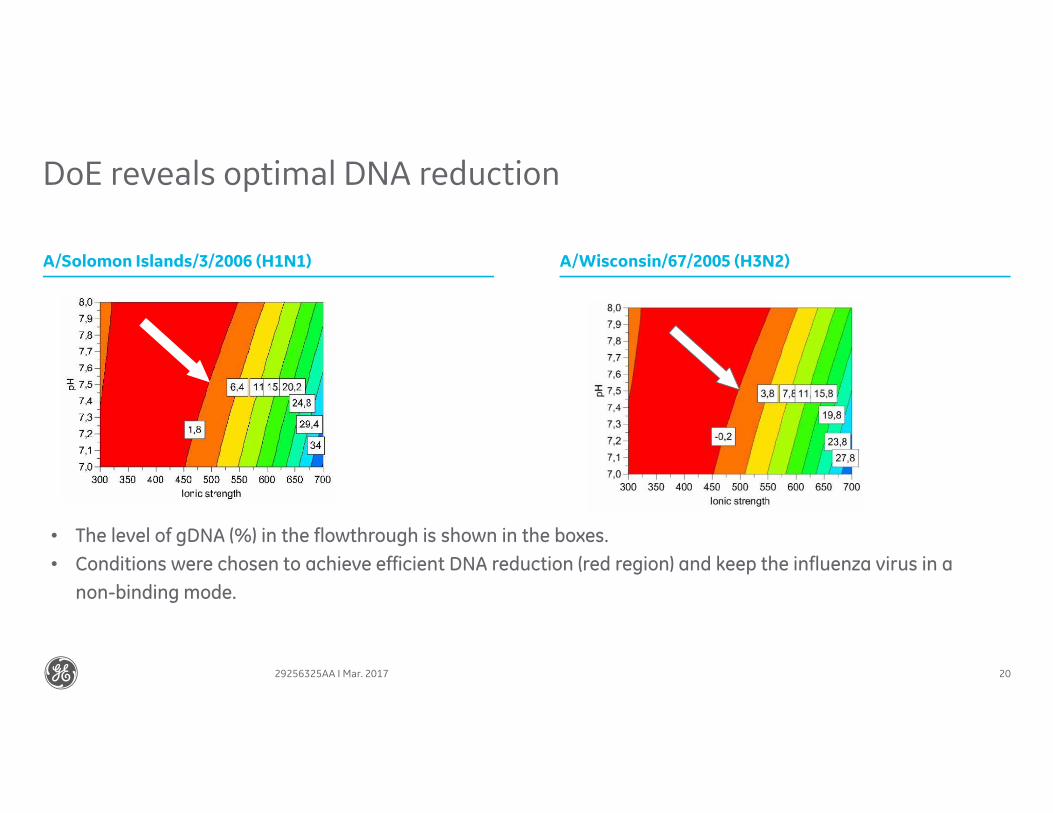
DoE reveals optimal DNA reduction
A/Solomon Islands/3/2006 (H1N1) A/Wisconsin/67/2005 (H3N2)
20
• The level of gDNA (%) in the flowthrough is shown in the boxes.
• Conditions were chosen to achieve efficient DNA reduction (red region) and keep the influenza virus in a
non-binding mode.
29256325AA I Mar. 2017
21
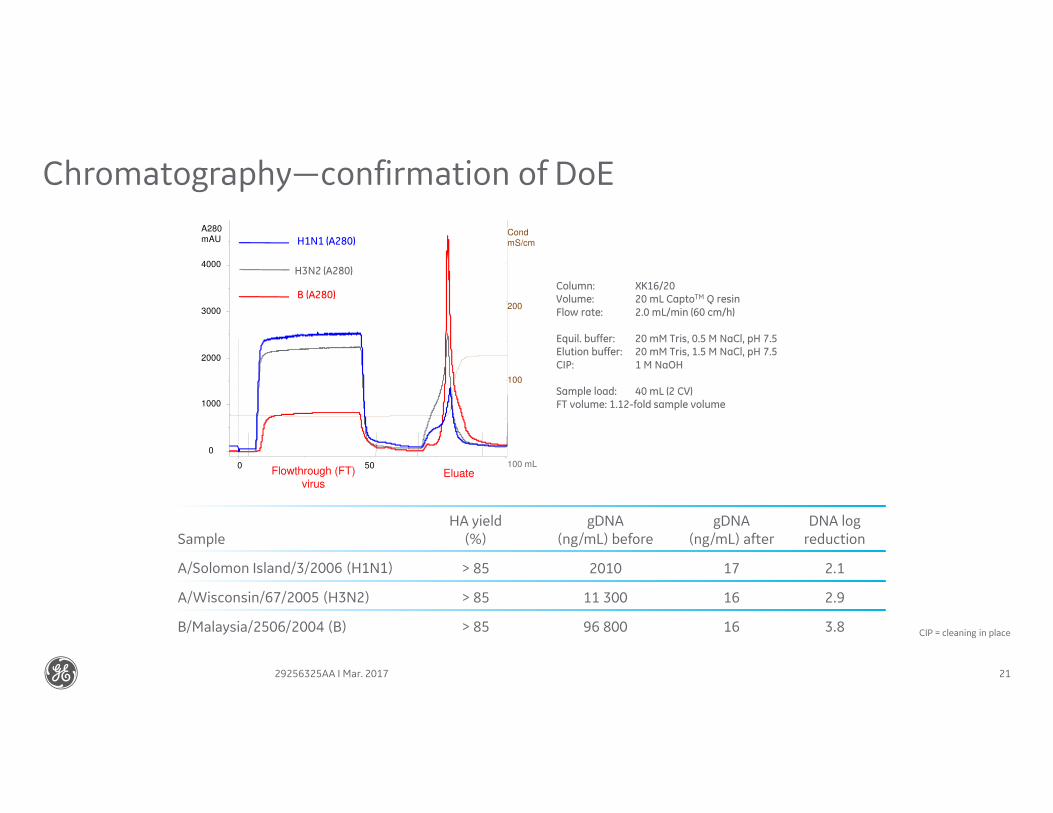
Chromatography—confirmation of DoE
SampleHA yield
(%)gDNA
(ng/mL) beforegDNA
(ng/mL) afterDNA log
reduction
A/Solomon Island/3/2006 (H1N1) > 85 2010 17 2.1
A/Wisconsin/67/2005 (H3N2) > 85 11 300 16 2.9
B/Malaysia/2506/2004 (B) > 85 96 800 16 3.8
0
1000
2000
3000
4000
A280
mAU
0 50Flowthrough (FT)
virusEluate
H1N1 (A280)
H3N2 (A280)
B (A280)
0
100
200
Cond
mS/cm
0
Cond
mS/cm
200
100
100 mL
Column: XK16/20Volume: 20 mL CaptoTM Q resin
Flow rate: 2.0 mL/min (60 cm/h)
Equil. buffer: 20 mM Tris, 0.5 M NaCl, pH 7.5Elution buffer: 20 mM Tris, 1.5 M NaCl, pH 7.5
CIP: 1 M NaOH
Sample load: 40 mL (2 CV)FT volume: 1.12-fold sample volume
CIP = cleaning in place
29256325AA I Mar. 2017
QbD DoE
Systematic approach to identify potential sources of process variability and parameters likely to have greatest impact on product quality.
Summary: benefits of QbD and DoE
22
Systematically vary several experimental parameters simultaneously to obtain sufficient information with minimum number of experiments.
Analytical methods are crucial for a successful DoE
29256325AA I Mar. 2017

Introduction to QbD exercice
Process mapping Risk analysis
DoEDesign space
definition
24
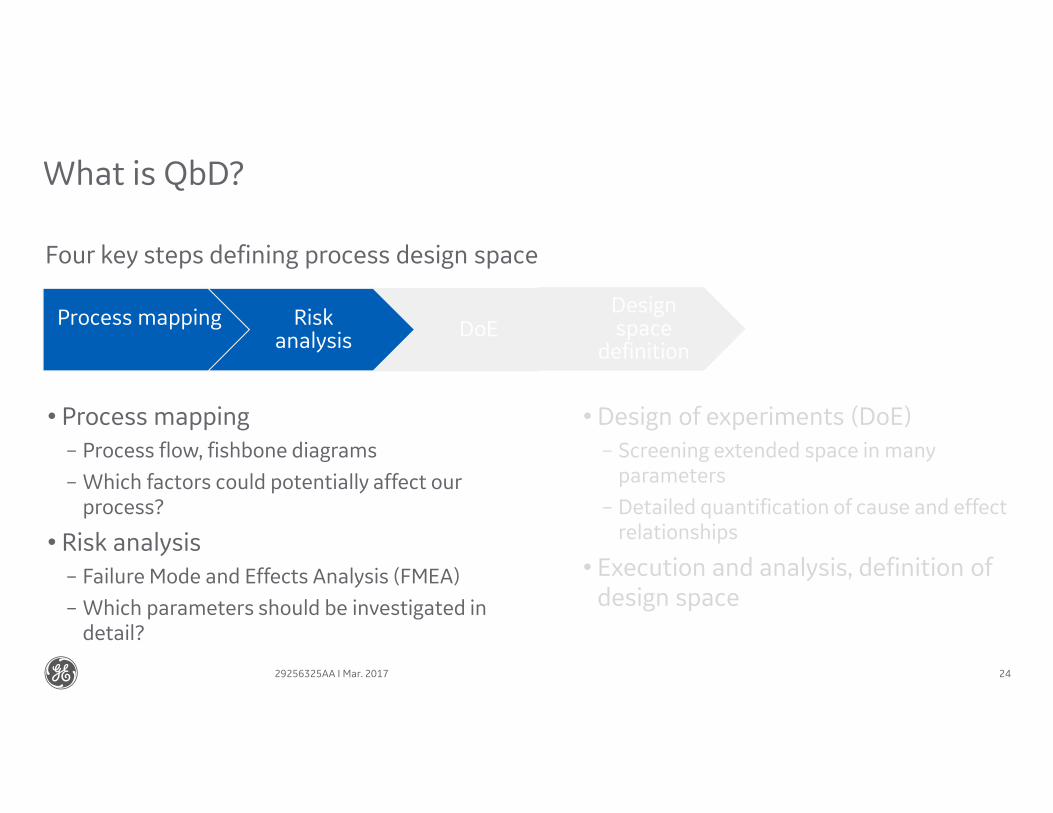
What is QbD?
• Process mapping
– Process flow, fishbone diagrams
– Which factors could potentially affect our process?
• Risk analysis
– Failure Mode and Effects Analysis (FMEA)
– Which parameters should be investigated in detail?
• Design of experiments (DoE)
– Screening extended space in many parameters
– Detailed quantification of cause and effect relationships
• Execution and analysis, definition of design space
Four key steps defining process design space
29256325AA I Mar. 2017
Process mapping
25
• Which factors could potentially affect our process?• Tools: High level process maps
Fishbone diagrams
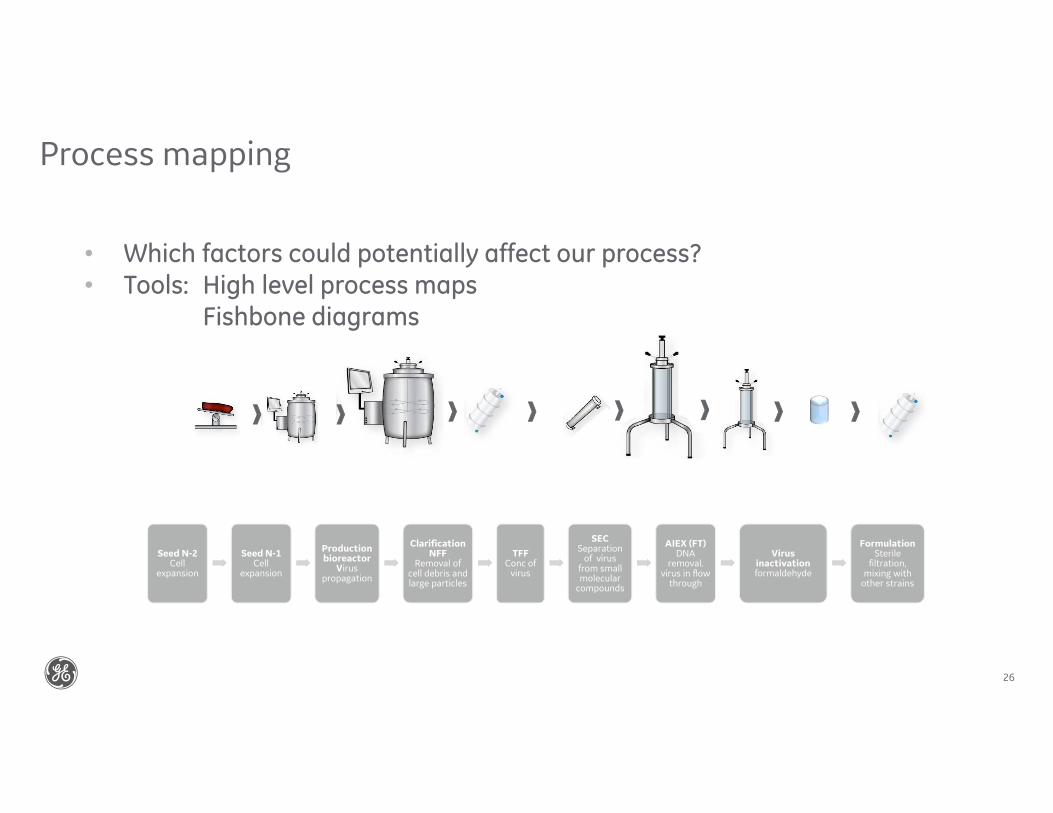
Process mapping
26
Seed N-2 Cell
expansion
Seed N-1 Cell
expansion
Production bioreactor
Virus propagation
Clarification NFF
Removal of cell debris and large particles
TFFConc of
virus
SEC Separation
of virus from small molecular
compounds
AIEX (FT) DNA
removal. virus in flow
through
Virus inactivation formaldehyde
Formulation Sterile
filtration, mixing with
other strains
• Which factors could potentially affect our process?• Tools: High level process maps
Fishbone diagrams
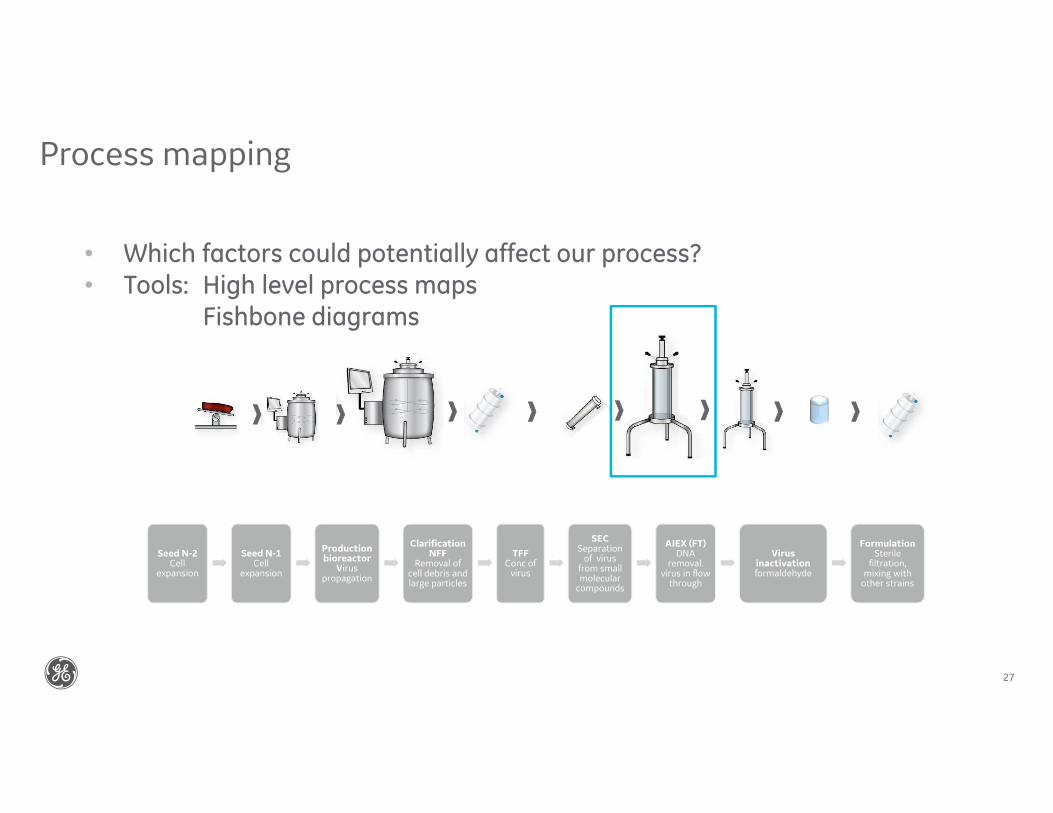
Process mapping
27
Seed N-2 Cell
expansion
Seed N-1 Cell
expansion
Production bioreactor
Virus propagation
Clarification NFF
Removal of cell debris and large particles
TFFConc of
virus
SEC Separation
of virus from small molecular
compounds
AIEX (FT) DNA
removal. virus in flow
through
Virus inactivation formaldehyde
Formulation Sterile
filtration, mixing with
other strains
• Which factors could potentially affect our process?• Tools: High level process maps
Fishbone diagrams
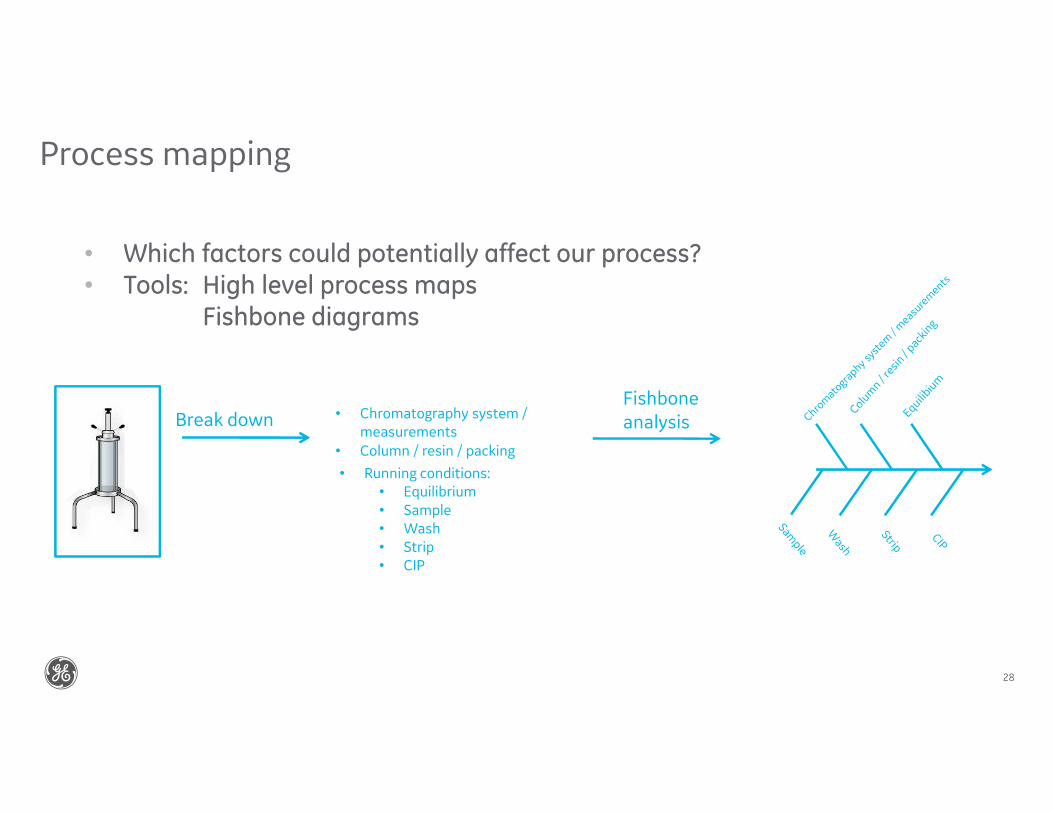
Process mapping
28
• Which factors could potentially affect our process?• Tools: High level process maps
Fishbone diagrams
Break down • Chromatography system / measurements
• Column / resin / packing
• Running conditions:• Equilibrium
• Sample• Wash
• Strip• CIP
Fishbone analysis
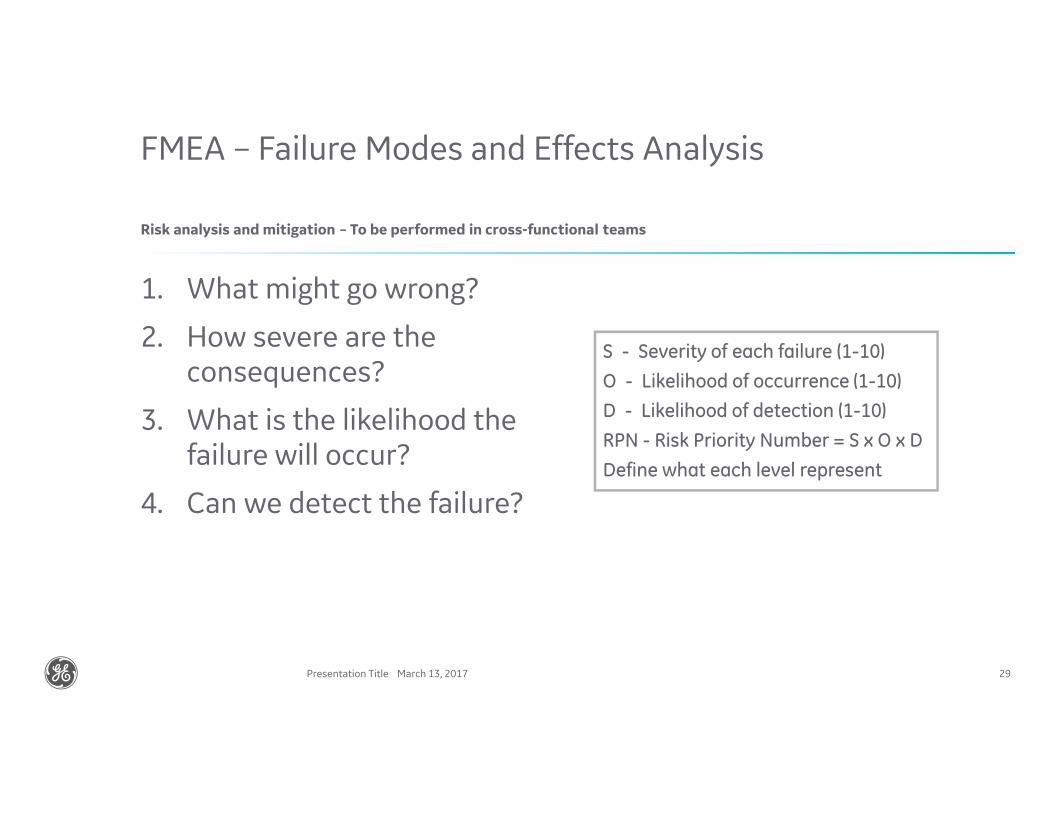
FMEA – Failure Modes and Effects Analysis
March 13, 2017Presentation Title 29
Risk analysis and mitigation – To be performed in cross-functional teams
1. What might go wrong?
2. How severe are the consequences?
3. What is the likelihood the failure will occur?
4. Can we detect the failure?
S - Severity of each failure (1-10)
O - Likelihood of occurrence (1-10)
D - Likelihood of detection (1-10)
RPN - Risk Priority Number = S x O x D
Define what each level represent
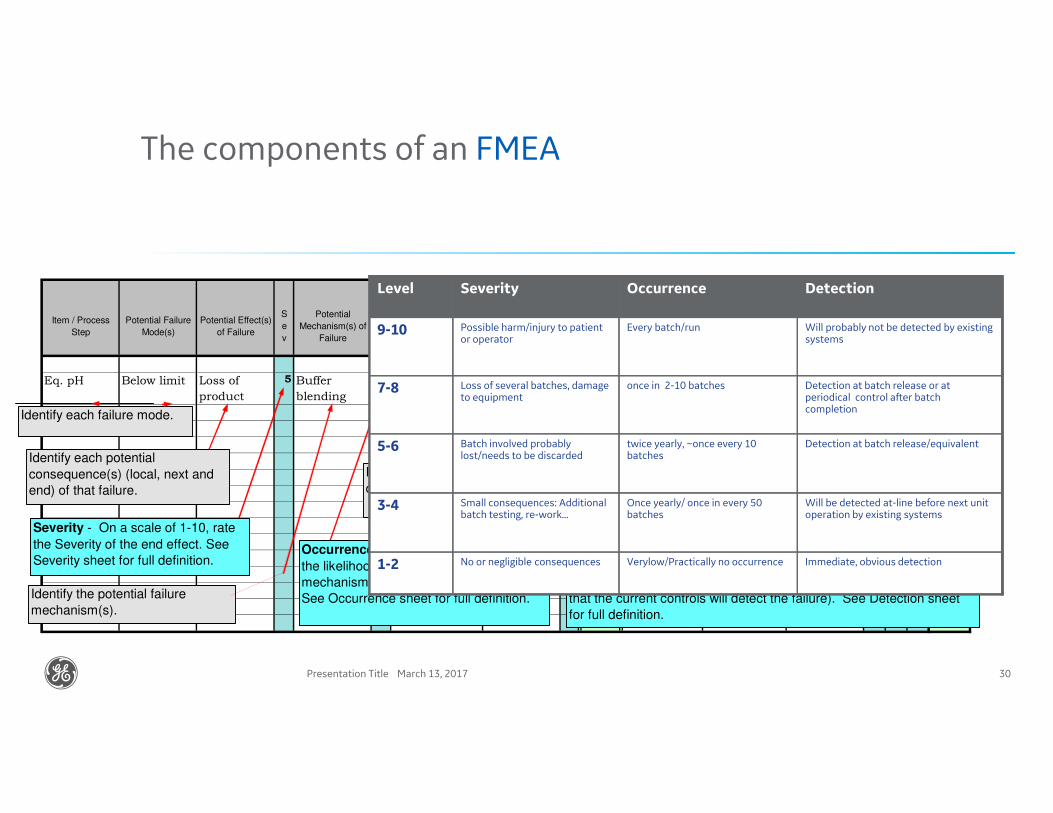
The components of an FMEA
March 13, 2017Presentation Title 30
Action Results
Item / Process
Step
Potential Failure
Mode(s)
Potential Effect(s)
of Failure
S
e
v
Potential
Mechanism(s) of
Failure
O
c
c
u
r
Potential Cause(s) of
Failure Mechanism
Current Process
Controls
D
e
t
R
P
N
Recommended
Action(s)
Responsibility &
Target Completion
Date
Actions Taken
New
Se
v
New
Occ
Ne
w D
et
New
RP
N
Eq. pH Below limit Loss of
product
5 Buffer
blending
3 Operator In-line
monitoring
2 30
Response Plans and Tracking. Beginning with
most critical RPN's and severities (CTQ's), define
recommended actions, responsibilities and target
dates. As a result of the completed actions taken, re-
rate severity, occurrence and detection based on any
changes to the end effect, likelihood of occurrrence,
and the likelihood of the actions taken + controls to
Risk Priority Number - The combined weighting of Severity,
Occurrence, and Detection. RPN = Sev X Occ X Det
Identify the potential failure
mechanism(s).
Severity - On a scale of 1-10, rate
the Severity of the end effect. See
Severity sheet for full definition.
Detection - On a scale of 1-10, rate the Detection. (The likelihood
that the current controls will detect the failure). See Detection sheet
for full definition.
Identify each failure mode.
Identify each potential
consequence(s) (local, next and
end) of that failure.
Occurrence - On a scale of 1-10, rate
the likelihood of Occurrence of the failure
mechanism and subsequent failure mode.
See Occurrence sheet for full definition.
Identify the potential cause(s)
of the failure mechanism(s).
Identify the current
process controls.
Immediate, obvious detectionVerylow/Practically no occurrenceNo or negligible consequences1-2
Will be detected at-line before next unit operation by existing systems
Once yearly/ once in every 50 batches
Small consequences: Additional batch testing, re-work...
3-4
Detection at batch release/equivalenttwice yearly, ~once every 10 batches
Batch involved probably lost/needs to be discarded
5-6
Detection at batch release or at periodical control after batch completion
once in 2-10 batchesLoss of several batches, damage to equipment
7-8
Will probably not be detected by existing systems
Every batch/runPossible harm/injury to patient or operator
9-10
DetectionOccurrenceSeverityLevel
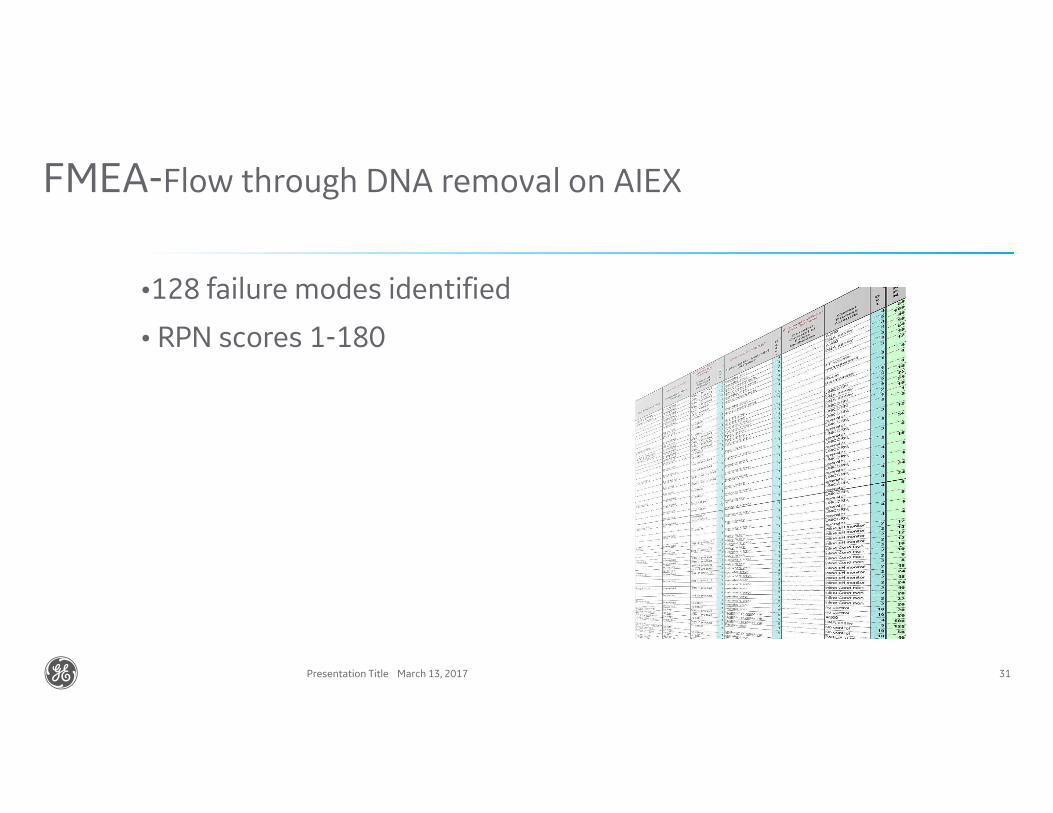
FMEA-Flow through DNA removal on AIEX
March 13, 2017Presentation Title 31
•128 failure modes identified
• RPN scores 1-180
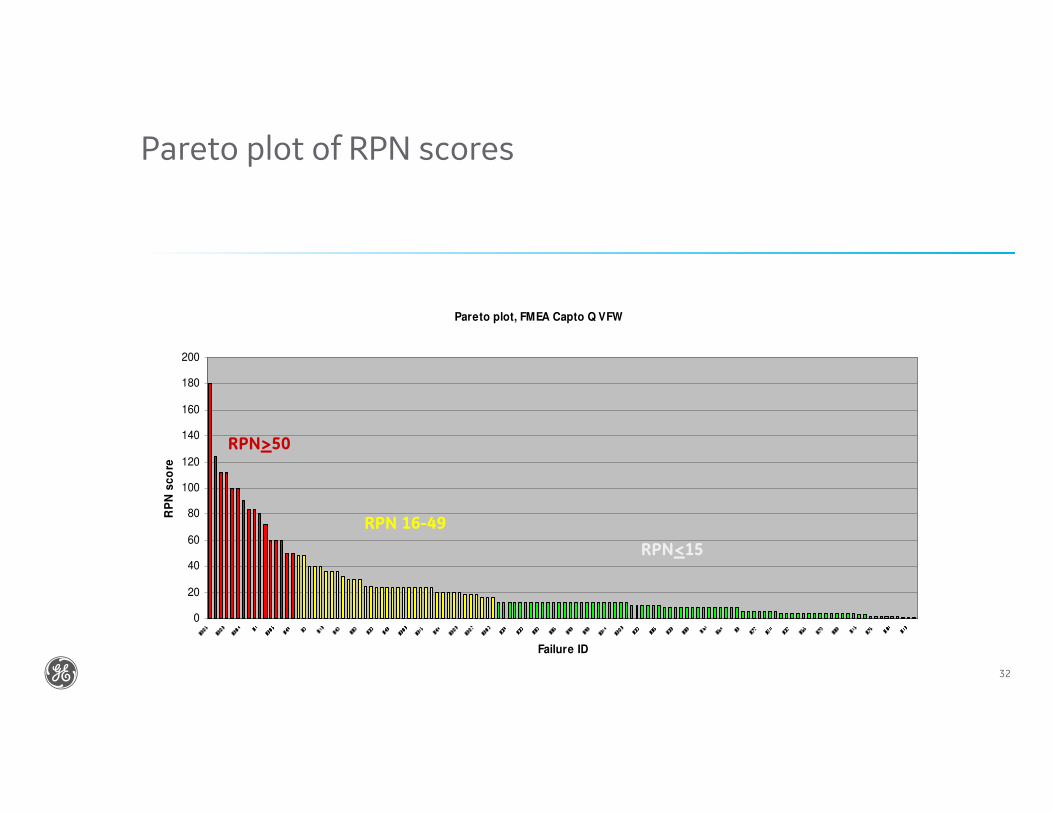
Pareto plot of RPN scores
March 13, 2017Presentation Title 32
Pareto plot, FMEA Capto Q VFW
0
20
40
60
80
100
120
140
160
180
200
Failure ID
RP
N s
co
re
RPN>50
RPN 16-49
RPN<15
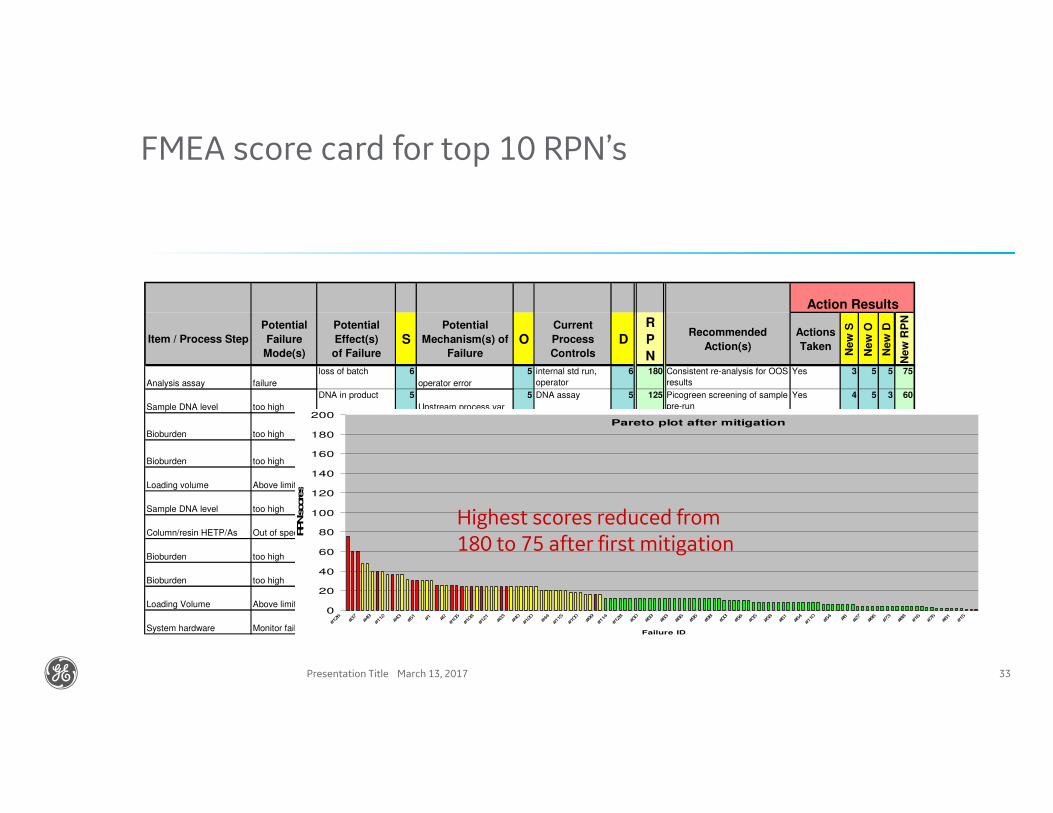
FMEA score card for top 10 RPN’s
March 13, 2017Presentation Title 33
Action Results
Item / Process Step
Potential
Failure
Mode(s)
Potential
Effect(s)
of Failure
SPotential
Mechanism(s) of
Failure
OCurrent
Process
Controls
D
R
P
N
Recommended
Action(s)
Actions
Taken
New
S
New
O
New
D
New
RP
N
Analysis assay failure
loss of batch 6
operator error
5 internal std run,
operator
6 180 Consistent re-analysis for OOS
results
Yes 3 5 5 75
Sample DNA level too high
DNA in product 5
Upstream process var
5 DNA assay 5 125 Picogreen screening of sample
pre-run
Yes 4 5 3 60
Bioburden too high
contamination
of systems
8
Improper CIP
2 Bioburden control 7 112 pH/cond/pattern to be checked
at each CIP
Yes 2 5 3 30
Bioburden too high
contamination
of systems
8
improper storage
2 Bioburden control 7 112 mandatory CIP cycle pre-run
after storage
Yes 4 2 3 24
Loading volume Above limit
DNA in product 5
operator error
4 DNA assay 5 100 Picogreen screening of sample
pre-run
Yes 4 5 3 60
Sample DNA level too high
DNA in product 5
Upstream process var
5 A260 4 100 Validate max loading level to
more than 2xmargin
Yes 5 1 5 25
Column/resin HETP/As Out of spec
DNA in product 6
Previous run (air, pressure…)
3 DNA assay 5 90 In-line HETP/As control at start
of each run
Yes 4 3 2 24
Bioburden too highloss of batch 6
improper CIP
2 Bioburden control 7 84 pH/cond/pattern to be checked
at each CIP
Yes 2 5 3 30
Bioburden too highloss of batch 6
improper storage
2 Bioburden control 7 84 mandatory CIP cycle pre-run
after storage
Yes 4 2 3 24
Loading Volume Above limit
DNA in product 5
operator error
4 A260 4 80 Validate max loading level to
more than 2xmargin
Yes 5 1 5 25
System hardware Monitor failureloss of batch 6
breakage
3 operator 4 72 In-line/Calibration of pH, Cond
before each run
Yes 4 3 3 36
Pareto plot after mitigation
0
20
40
60
80
100
120
140
160
180
200
#126 #3
7
#49
#112 #4
3
#51
#1 #2
#105
#108
#121 #2
3
#40
#120 #4
4
#115
#100 #9
9
#114
#128 #3
0
#69
#83
#86
#95
#98
#33
#56
#35
#58
#61
#64
#110 #5
4
#8 #27
#66
#73
#88
#16
#76
#81
#15
Failure ID
RPN score
s
Highest scores reduced from180 to 75 after first mitigation

Group exercise:Fishbone analysis and FMEA on buffer preparation
Practical exercise:Risk analysis for buffer preparations
March 13, 2017Presentation Title 35
Contamination
Wrong pH
Wrong conductivity
Wrong water quality
Other?
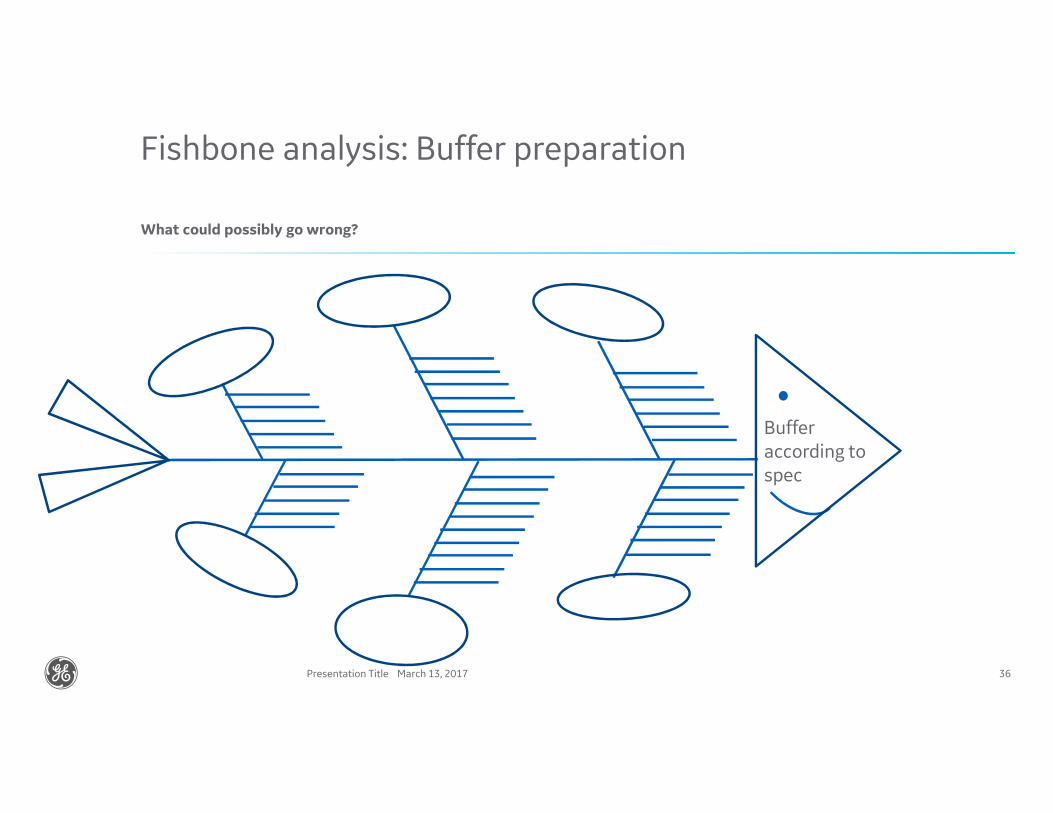
Fishbone analysis: Buffer preparation
March 13, 2017Presentation Title 36
What could possibly go wrong?
Buffer according to spec
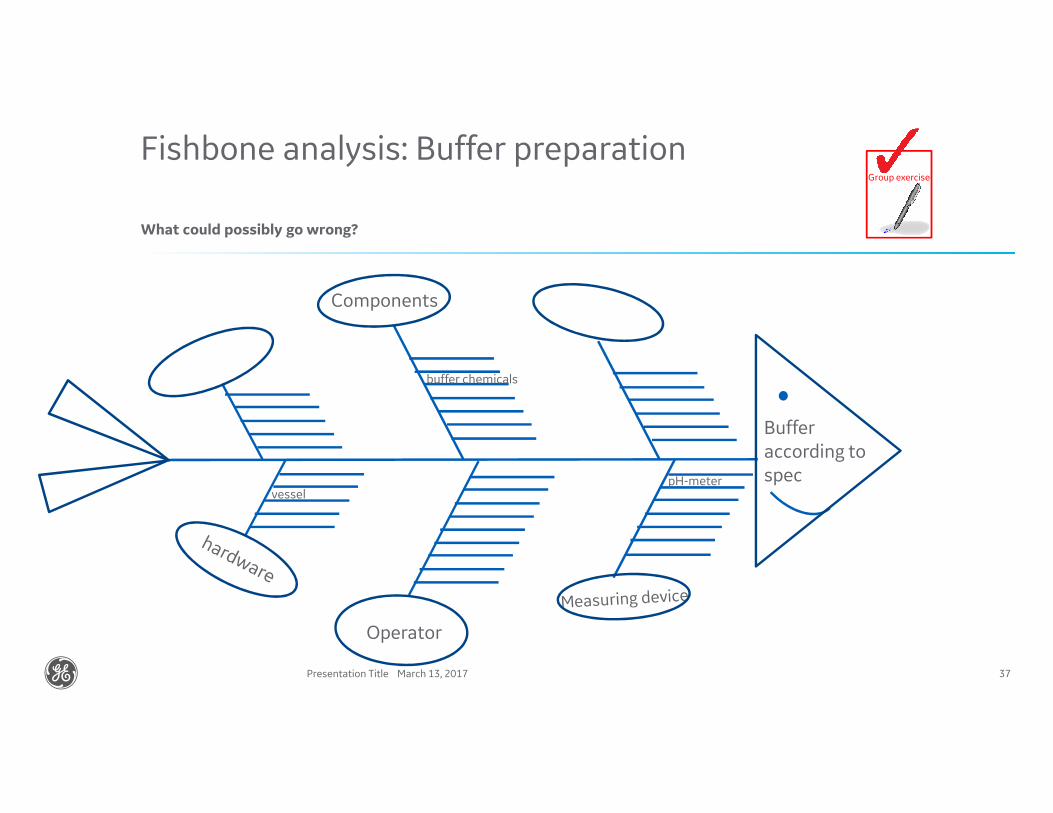
Fishbone analysis: Buffer preparation
March 13, 2017Presentation Title 37
What could possibly go wrong?
Components
Buffer according to spec
buffer chemicals
pH-meter
Operator
vessel
Group exercise
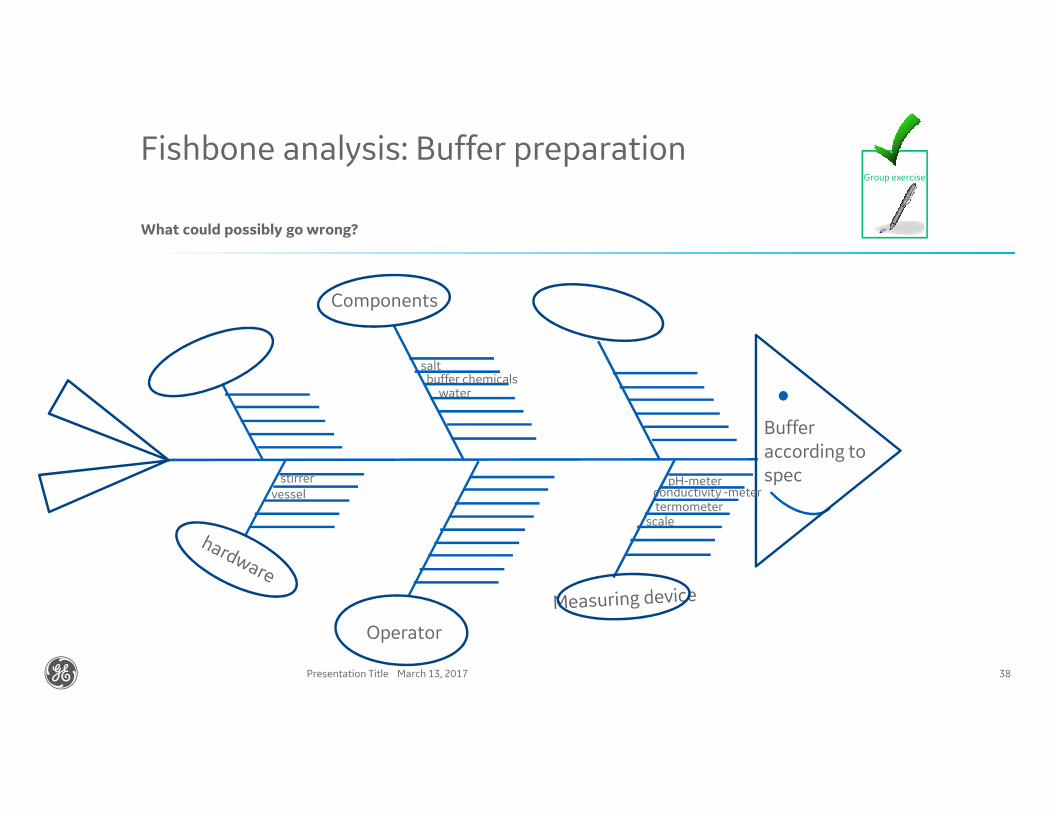
Fishbone analysis: Buffer preparation
March 13, 2017Presentation Title 38
What could possibly go wrong?
Components
Buffer according to spec
saltbuffer chemicals
pH-meterconductivity -meter
water
termometerscale
Operator
stirrer
vessel
Group exercise
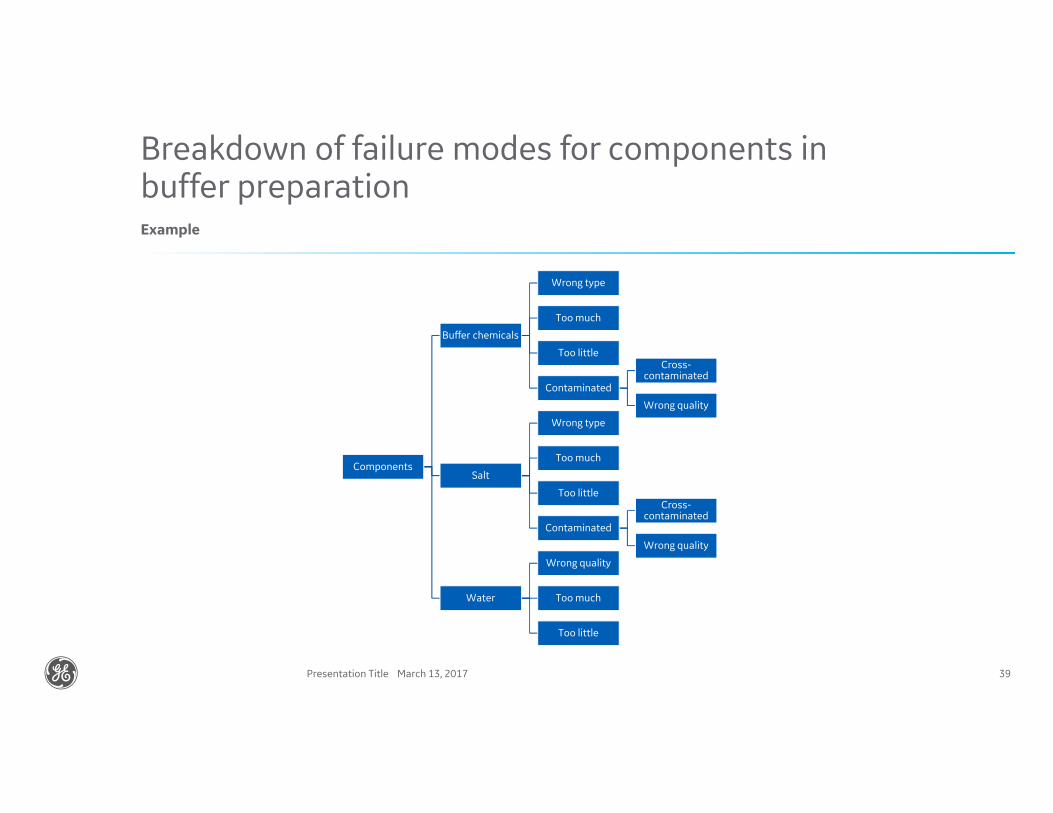
Breakdown of failure modes for components in buffer preparation
March 13, 2017Presentation Title 39
Example
Components
Buffer chemicals
Wrong type
Too much
Too little
Contaminated
Cross-contaminated
Wrong quality
Salt
Wrong type
Too much
Too little
Contaminated
Cross-contaminated
Wrong quality
Water
Wrong quality
Too much
Too little
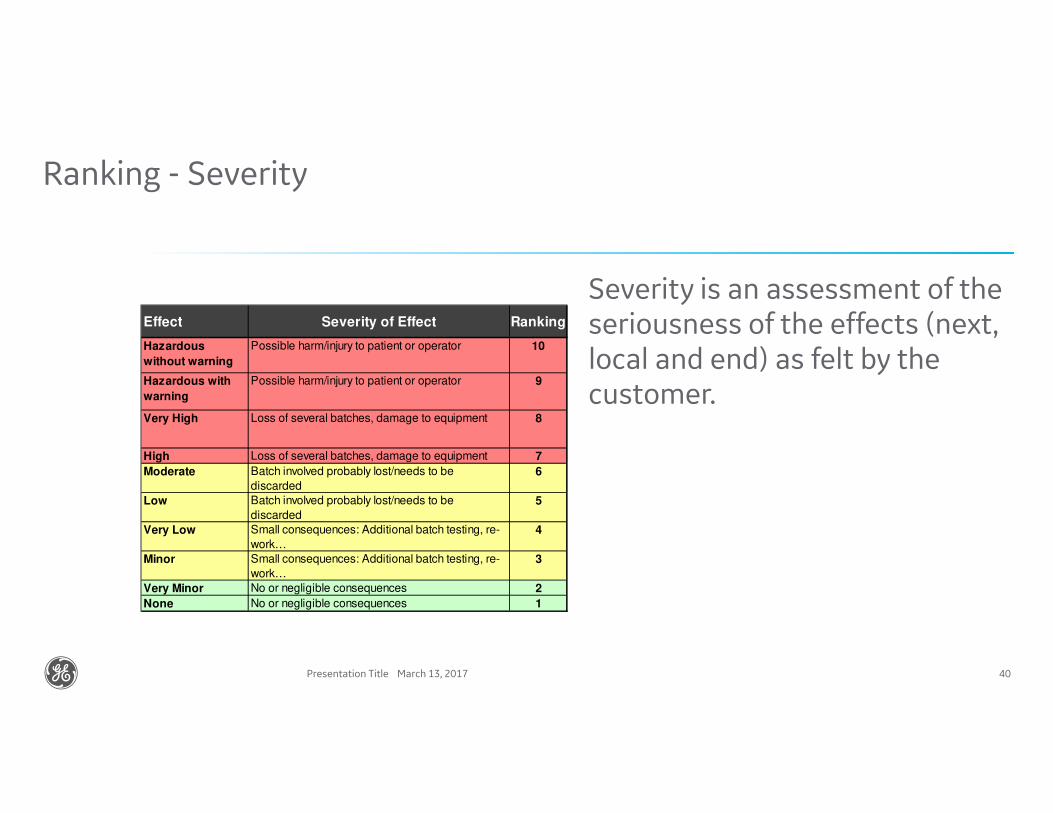
Ranking - Severity
March 13, 2017Presentation Title 40
Effect Severity of Effect Ranking
Hazardous
without warning
Possible harm/injury to patient or operator 10
Hazardous with
warning
Possible harm/injury to patient or operator 9
Very High Loss of several batches, damage to equipment 8
High Loss of several batches, damage to equipment 7
Moderate Batch involved probably lost/needs to be
discarded
6
Low Batch involved probably lost/needs to be
discarded
5
Very Low Small consequences: Additional batch testing, re-
work…
4
Minor Small consequences: Additional batch testing, re-
work…
3
Very Minor No or negligible consequences 2
None No or negligible consequences 1
Severity is an assessment of the seriousness of the effects (next, local and end) as felt by the customer.
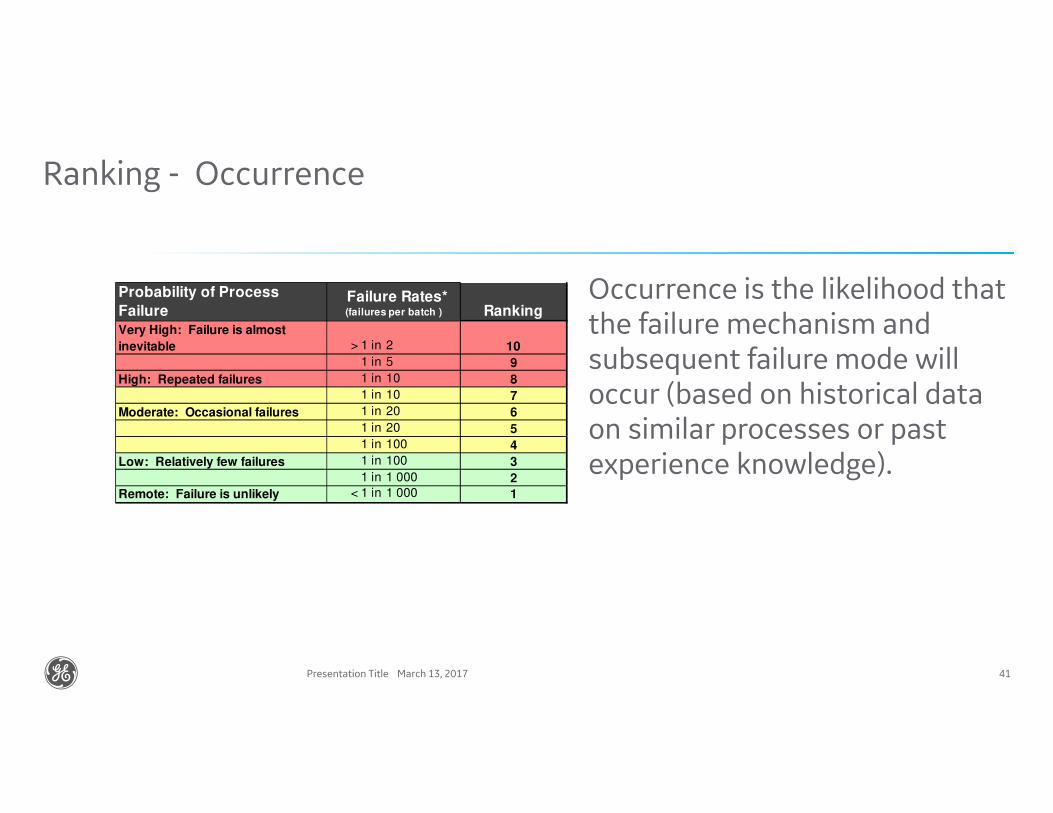
Ranking - Occurrence
March 13, 2017Presentation Title 41
Probability of Process
Failure Ranking
Very High: Failure is almost
inevitable > 1 in 2 10
1 in 5 9
High: Repeated failures 1 in 10 8
1 in 10 7
Moderate: Occasional failures 1 in 20 6
1 in 20 5
1 in 100 4
Low: Relatively few failures 1 in 100 3
1 in 1 000 2
Remote: Failure is unlikely < 1 in 1 000 1
Failure Rates* (failures per batch )
Occurrence is the likelihood that the failure mechanism and subsequent failure mode will occur (based on historical data on similar processes or past experience knowledge).
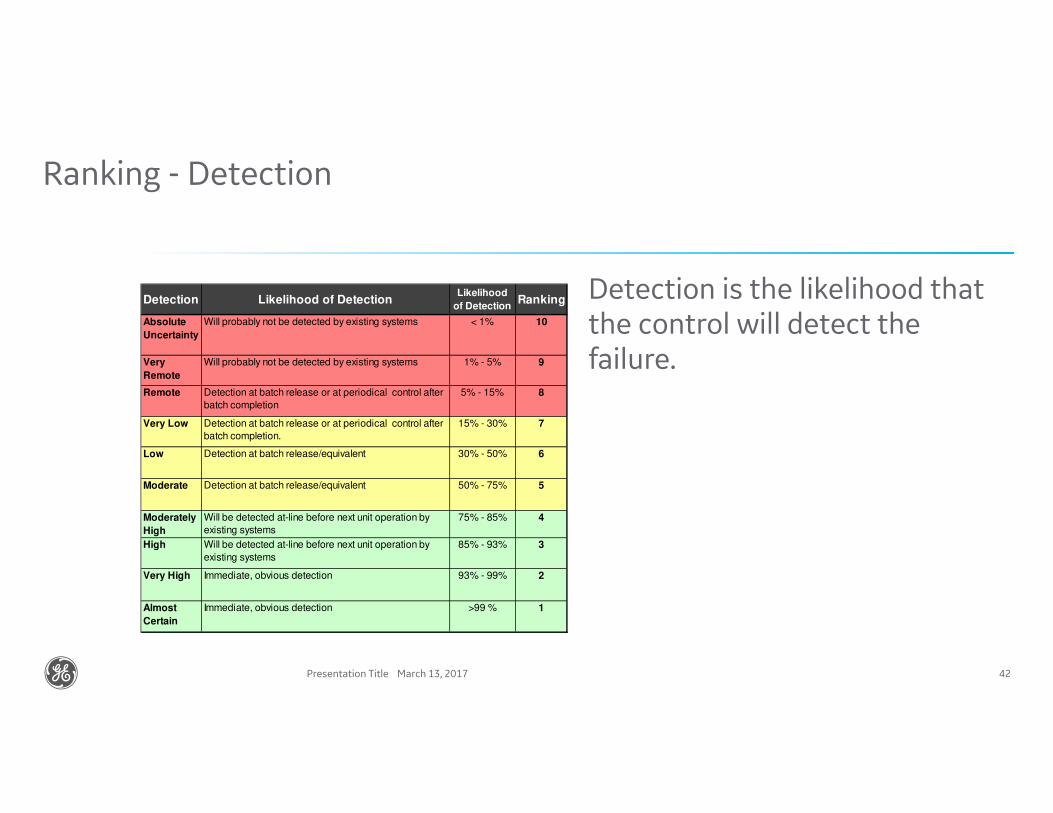
Ranking - Detection
March 13, 2017Presentation Title 42
Detection Likelihood of DetectionLikelihood
of DetectionRanking
Absolute
Uncertainty
Will probably not be detected by existing systems < 1% 10
Very
Remote
Will probably not be detected by existing systems 1% - 5% 9
Remote Detection at batch release or at periodical control after
batch completion
5% - 15% 8
Very Low Detection at batch release or at periodical control after
batch completion.
15% - 30% 7
Low Detection at batch release/equivalent 30% - 50% 6
Moderate Detection at batch release/equivalent 50% - 75% 5
Moderately
High
Will be detected at-line before next unit operation by
existing systems
75% - 85% 4
High Will be detected at-line before next unit operation by
existing systems
85% - 93% 3
Very High Immediate, obvious detection 93% - 99% 2
Almost
Certain
Immediate, obvious detection >99 % 1
Detection is the likelihood that the control will detect the failure.
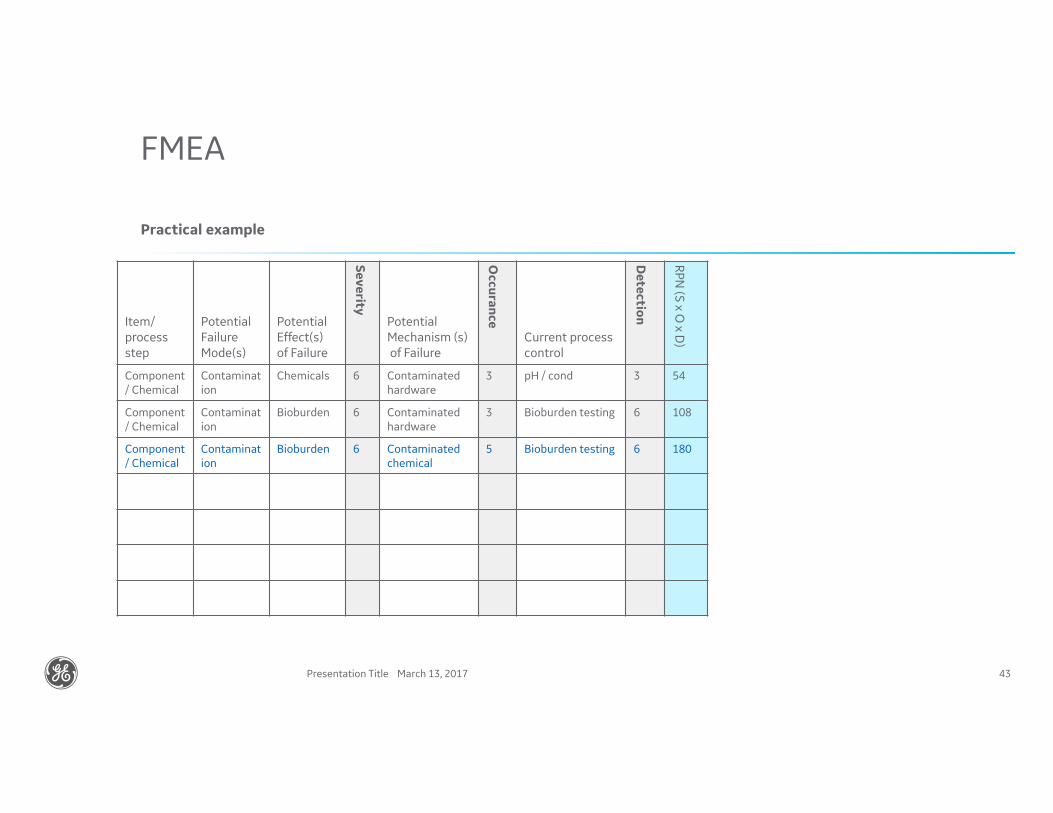
FMEA
March 13, 2017Presentation Title 43
Practical example
Item/ process step
Potential Failure Mode(s)
Potential Effect(s) of Failure
Severity
Potential Mechanism (s)of Failure
Occurance
Current process control
Detectio
n
RP
N (S
x O x D
)Component / Chemical
Contamination
Chemicals 6 Contaminated hardware
3 pH / cond 3 54
Component / Chemical
Contamination
Bioburden 6 Contaminated hardware
3 Bioburden testing 6 108
Component / Chemical
Contamination
Bioburden 6 Contaminated chemical
5 Bioburden testing 6 180
Practical exercise
March 13, 2017Presentation Title 44
Fill in the table in groups
Contamination
Wrong pH
Wrong conductivity
Wrong water quality
Other?
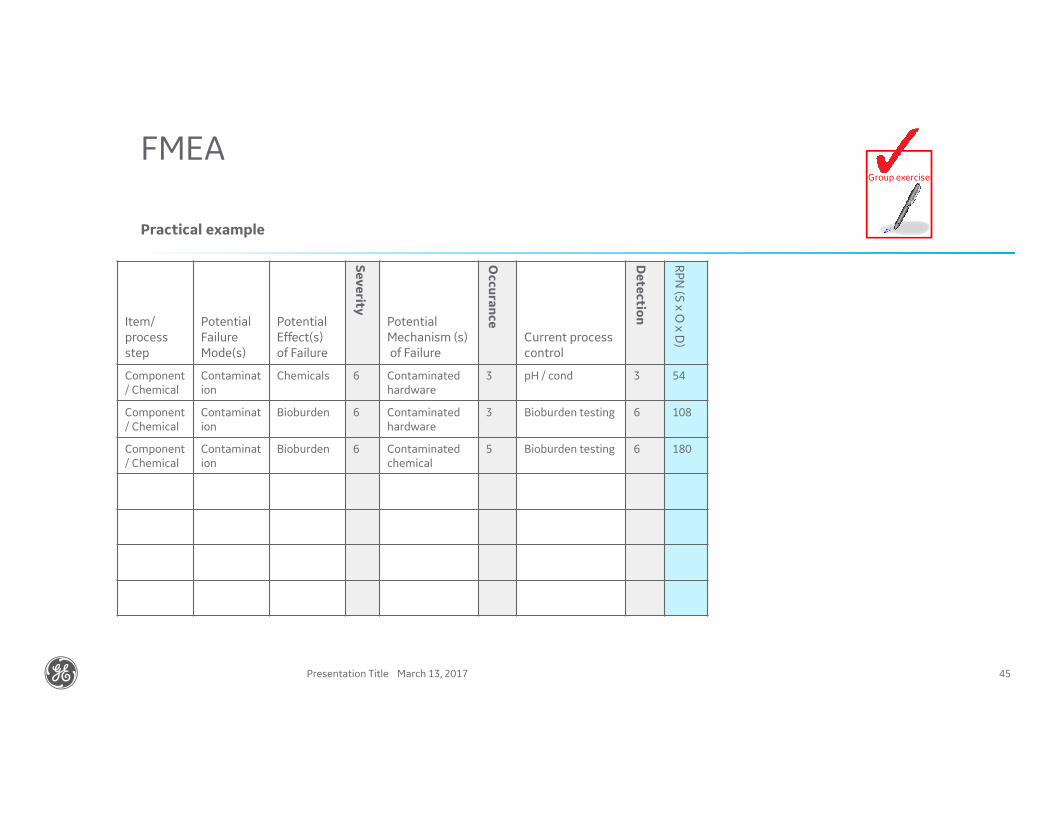
FMEA
March 13, 2017Presentation Title 45
Practical example
Item/ process step
Potential Failure Mode(s)
Potential Effect(s) of Failure
Severity
Potential Mechanism (s)of Failure
Occurance
Current process control
Detectio
n
RP
N (S
x O x D
)Component / Chemical
Contamination
Chemicals 6 Contaminated hardware
3 pH / cond 3 54
Component / Chemical
Contamination
Bioburden 6 Contaminated hardware
3 Bioburden testing 6 108
Component / Chemical
Contamination
Bioburden 6 Contaminated chemical
5 Bioburden testing 6 180
Group exercise
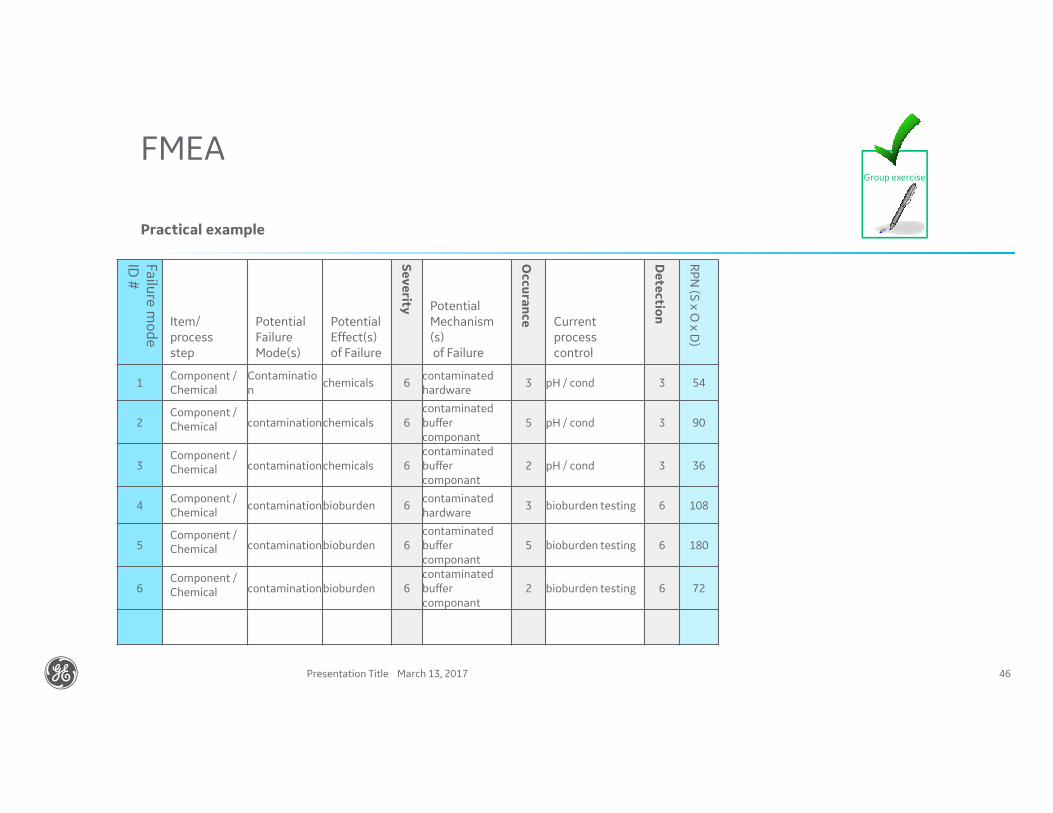
FMEA
March 13, 2017Presentation Title 46
Practical example
Failu
re m
od
e
ID #
Item/ process step
Potential Failure Mode(s)
Potential Effect(s) of Failure
Severity Potential
Mechanism (s)of Failure
Occurance Current
process control
Detectio
n
RP
N (S
x O x D
)
1Component / Chemical
Contamination
chemicals 6contaminated hardware
3 pH / cond 3 54
2Component / Chemical contaminationchemicals 6
contaminated buffer componant
5 pH / cond 3 90
3Component / Chemical contaminationchemicals 6
contaminated buffer componant
2 pH / cond 3 36
4Component / Chemical
contaminationbioburden 6contaminated hardware
3 bioburden testing 6 108
5Component / Chemical contaminationbioburden 6
contaminated buffer componant
5 bioburden testing 6 180
6Component / Chemical contaminationbioburden 6
contaminated buffer componant
2 bioburden testing 6 72
Group exercise
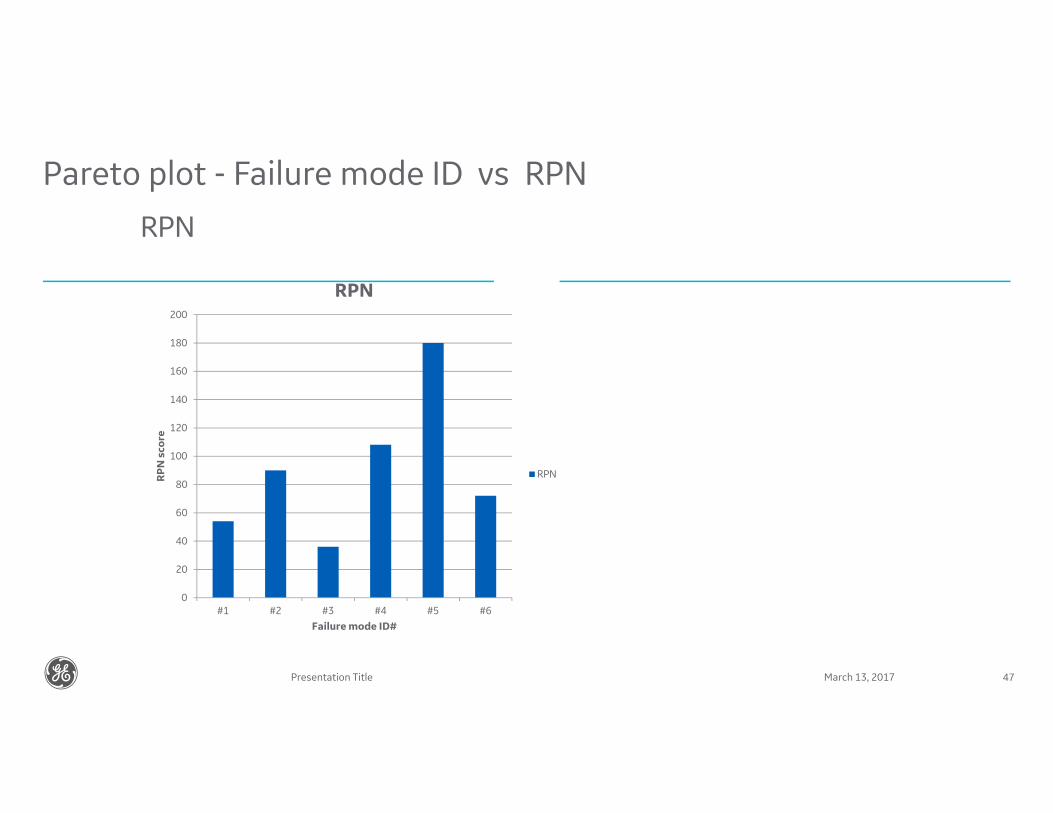
Pareto plot - Failure mode ID vs RPN
RPN
March 13, 2017Presentation Title 47
0
20
40
60
80
100
120
140
160
180
200
#1 #2 #3 #4 #5 #6
RPN score
Failure mode ID#
RPN
RPN
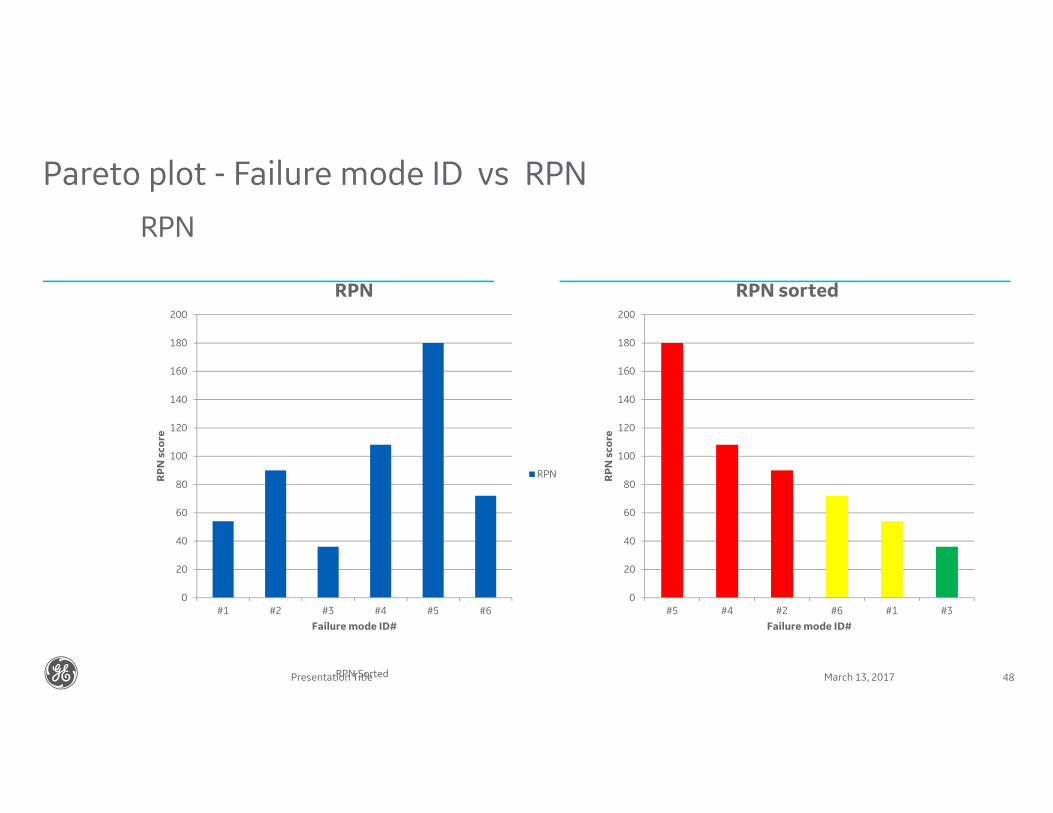
Pareto plot - Failure mode ID vs RPN
RPN
RPN Sorted March 13, 2017Presentation Title 48
0
20
40
60
80
100
120
140
160
180
200
#1 #2 #3 #4 #5 #6
RPN score
Failure mode ID#
RPN
RPN
0
20
40
60
80
100
120
140
160
180
200
#5 #4 #2 #6 #1 #3RPN score
Failure mode ID#
RPN sorted
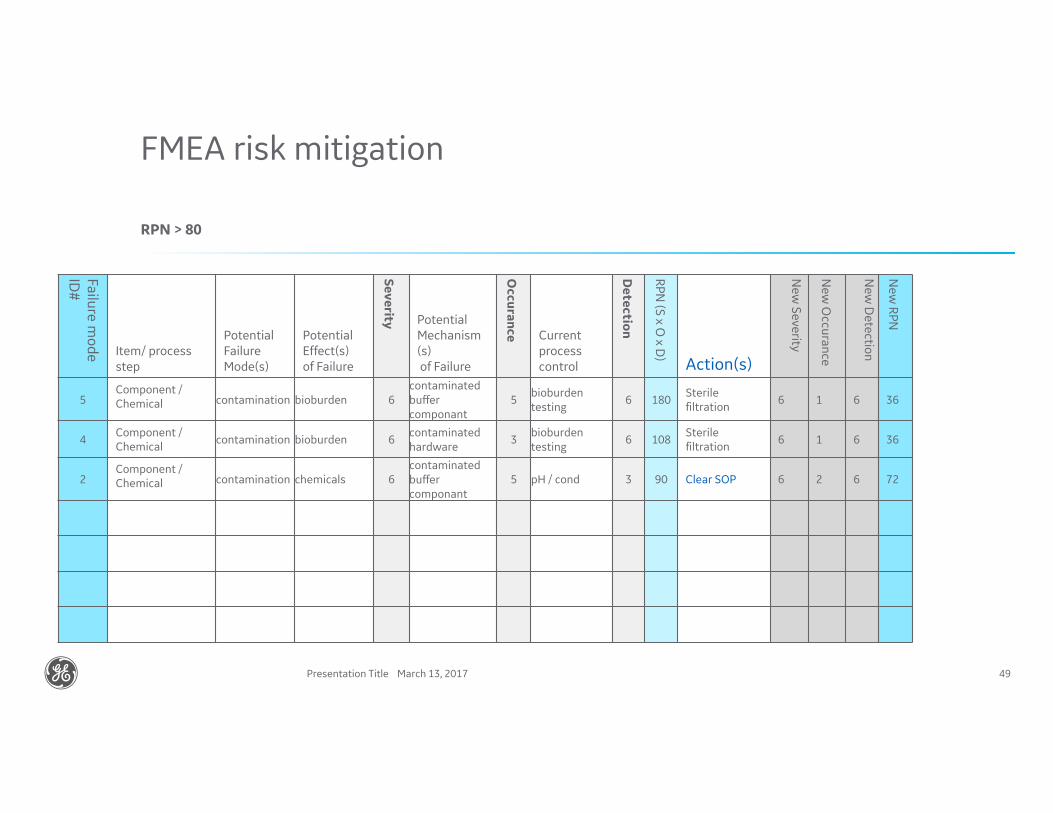
FMEA risk mitigation
March 13, 2017Presentation Title 49
RPN > 80
Failu
re m
od
e
ID#
Item/ process step
Potential Failure Mode(s)
Potential Effect(s) of Failure
Severity Potential
Mechanism (s)of Failure
Occurance Current
process control
Detectio
n
RP
N (S
x O x D
)
Action(s)
Ne
w S
eve
rity
Ne
w O
ccura
nce
Ne
w D
ete
ction
Ne
w R
PN
5Component / Chemical contamination bioburden 6
contaminated buffer componant
5bioburden testing
6 180Sterilefiltration
6 1 6 36
4Component / Chemical
contamination bioburden 6contaminated hardware
3bioburden testing
6 108Sterilefiltration
6 1 6 36
2Component / Chemical contamination chemicals 6
contaminated buffer componant
5 pH / cond 3 90 Clear SOP 6 2 6 72
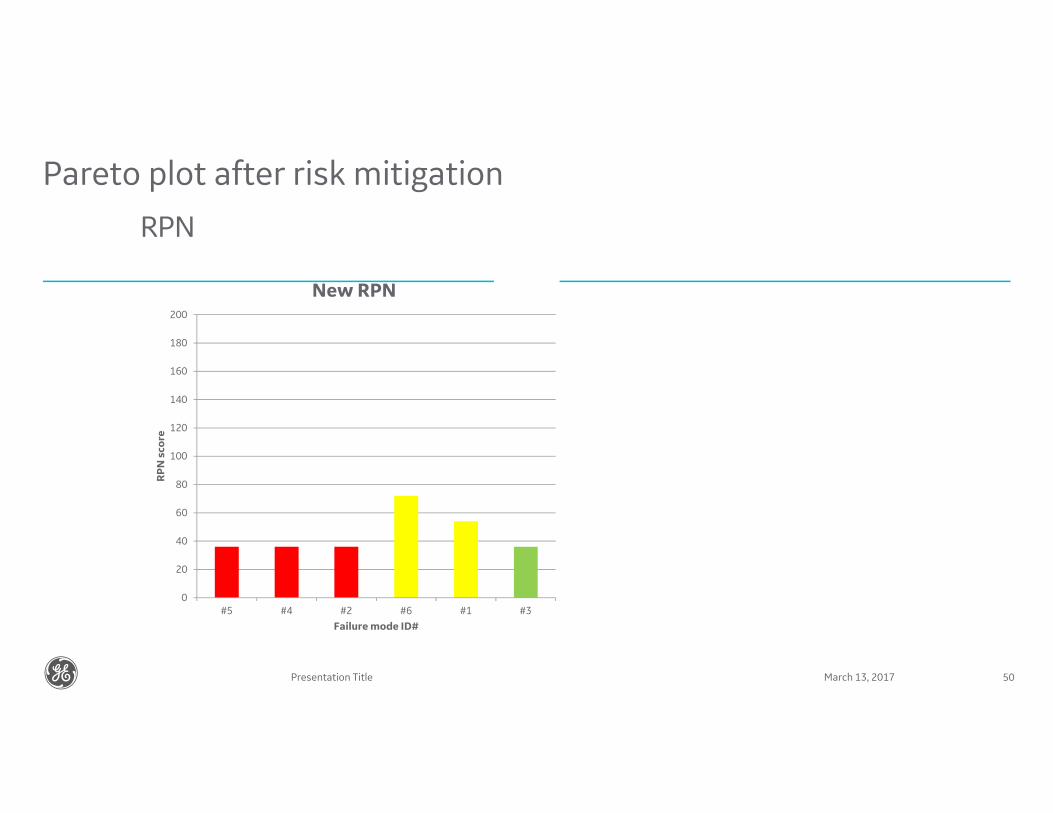
Pareto plot after risk mitigation
RPN
March 13, 2017Presentation Title 50
0
20
40
60
80
100
120
140
160
180
200
#5 #4 #2 #6 #1 #3
RPN score
Failure mode ID#
New RPN
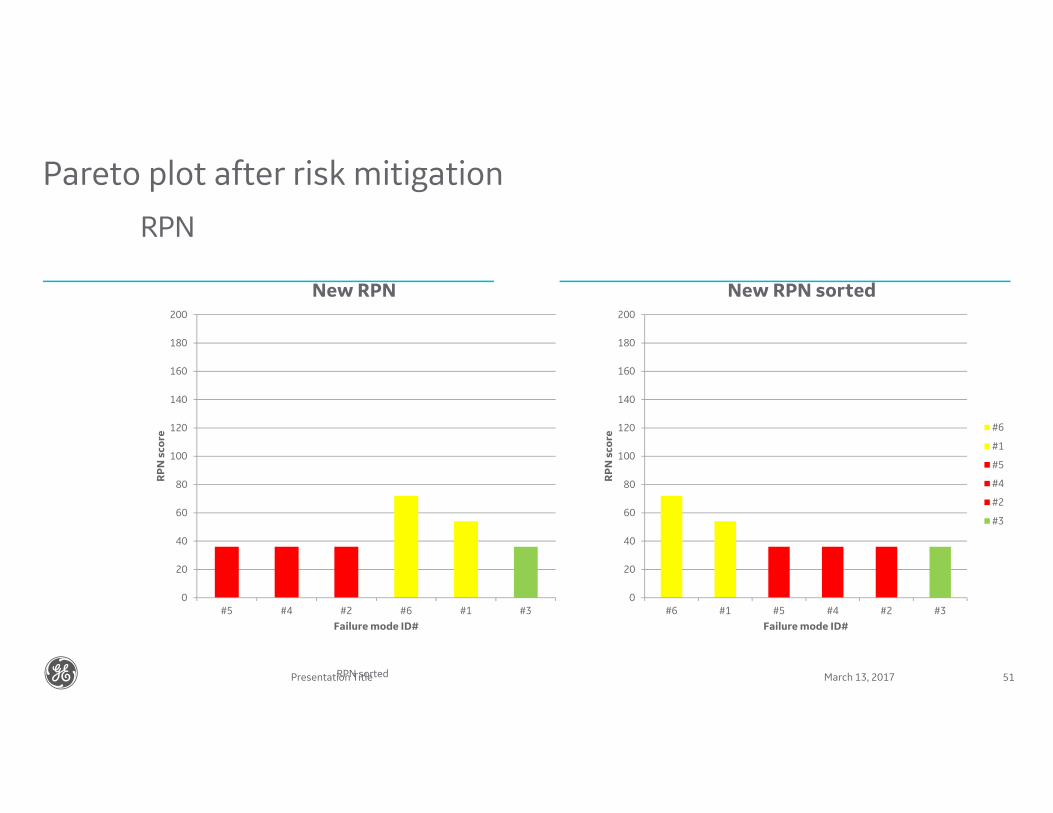
Pareto plot after risk mitigation
RPN
RPN sorted March 13, 2017Presentation Title 51
0
20
40
60
80
100
120
140
160
180
200
#5 #4 #2 #6 #1 #3
RPN score
Failure mode ID#
New RPN
0
20
40
60
80
100
120
140
160
180
200
#6 #1 #5 #4 #2 #3RPN score
Failure mode ID#
New RPN sorted
#6
#1
#5
#4
#2
#3
Investigation on highest risks after mitigation
Examples
March 13, 2017Presentation Title 52
Experimental work
Training
New equipment
Facility upgrade
Business management
DoE
53
gelifesciences.com
GE, the GE Monogram, Capto, and UNICORN are trademarks of General Electric Company.
© 2017 General Electric Company.
All goods and services are sold subject to the terms and conditions of sale of the company within GE Healthcare which supplies them. A copy of these terms and conditions is available on request. Contact your local GE Healthcare representative for the most current information.
For local office contact information, visit gelifesciences.com/contact
GE Healthcare Bio-Sciences ABBjörkgatan 30751 84 UppsalaSweden
29256325AA I Mar. 2017